The Power of Maps: Exploring the Frontiers of Geospatial Analysis to Address Health Equity Presented to: 2011 AHRQ Annual Conference: Leading Through Innovation & Collaboration Session 75E Monday September 19, 2011 Bethesda, MD Presented by: Lee Rivers Mobley, PhD Senior Fellow in Spatial Science and Health Economics RTI International P.O. Box 12194 · 3040 Cornwallis Road · Research Triangle Park, NC 27709 Phone: 919-541-7195 · Fax: 919-541-7384 · [email protected] · www.rti.org 1

The Power of Maps: Exploring the Frontiers of Geospatial Analysis to Address Health Equity Presented to: 2011 AHRQ Annual Conference: Leading Through Innovation.
Dec 16, 2015
Welcome message from author
This document is posted to help you gain knowledge. Please leave a comment to let me know what you think about it! Share it to your friends and learn new things together.
Transcript

The Power of Maps: Exploring the Frontiers of Geospatial Analysis to Address Health Equity
Presented to: 2011 AHRQ Annual Conference: Leading Through Innovation & Collaboration
Session 75EMonday September 19, 2011Bethesda, MD
Presented by: Lee Rivers Mobley, PhDSenior Fellow in Spatial Science and Health Economics RTI International
P.O. Box 12194 · 3040 Cornwallis Road · Research Triangle Park, NC 27709Phone: 919-541-7195 · Fax: 919-541-7384 · [email protected] · www.rti.org
RTI International is a trade name of Research Triangle Institute. 1
Early Capabilities and Transition to Modern Resources
Early spatial science research was limited by the mapping and analytic software available
– Atlas GIS with Claritas Data ESRI ArcView
– SpaceStat software in DOS GeoDA
GIS functions were limited to calculating distances between 2 points and manual repetition to fill distance data fields
Early work focused on using patient origins to define service markets based on patient flows
With the advent of SpaceStat and its successor, GeoDa, spatial analysis that accounts for omitted variables and spillover effects is now possible
Multilevel modeling is an alternate way to deal with spatial heterogeneity, and various methods have proliferated 2
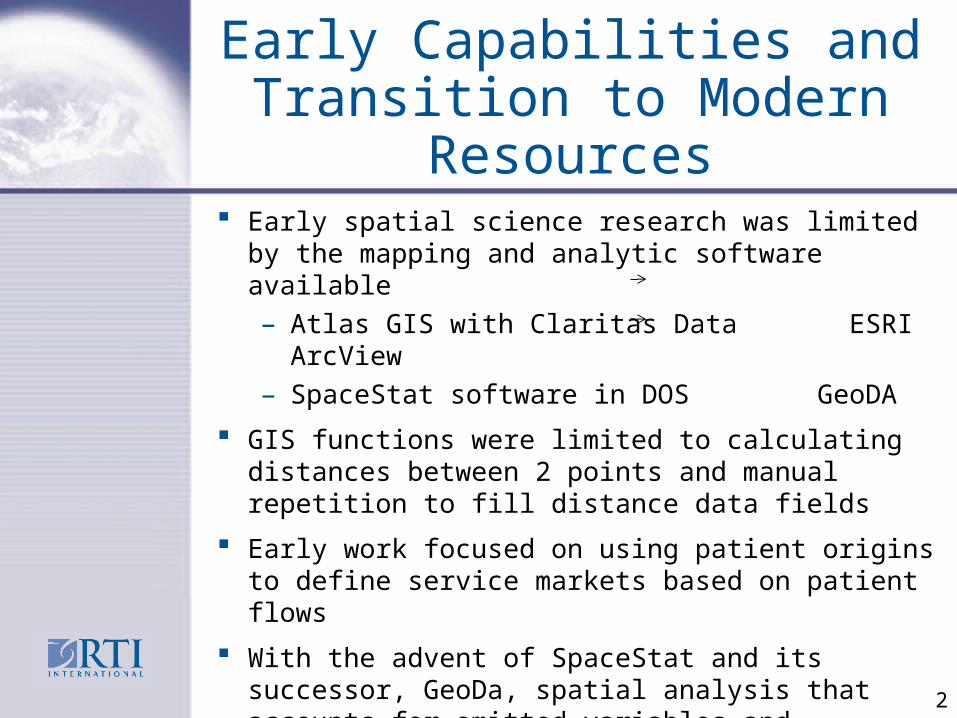
My Initial Forays into Spatial Science Research
My research interests have always been data-driven;
I have always sought ‘population’ data (no survey/sample data) for applied statistical analyses.
My early career expertise was in health markets: the hospital industry, health insurance industry, and antitrust/health market conditions analysis.
A dear departed colleague at Oakland University, Professor Robin Hough, urged me to explore GIS in 1992, donating software acquired on his NSF grant.
The first ‘Aha!’ moment came soon after…
3

Power of Mapping: Spatial Translation, 1998
California counties, by Medicaid contracting status, with location of troubled hospitals, closed public hospitals, and 14-county distance-study region.
Mobley, L. (1998). “Effects of Selective Contracting on Hospital Efficiency, Costs, and Accessibility.” Health Economics, Vol. 7, pp. 247-261.
4

What Are Spatial Data?https://rtispatialdata.rti.org
Spatial data describe the population in local areas.
Spatial data can derive from a sample, iff specifically designed to represent the local areas under study.
Examples:
– cancer registry populations; 100% FFS Medicare files;
– HCUP hospital discharge data;
– MSA, county, and tract-level census data.
NOT ~ Examples of spatial data:
– BRFSS at any geography other than the state level;
– Medicare 5%, 25%, or anything <100% SAF ‘random’ extracts (are not spatially random).
5

Why are Spatial Data needed for Population Health Research? A Counterfactual
Data from the 2007 and 2008 Behavioral Risk Factor Surveillance System were combined to estimate county-level diagnosed diabetes prevalence using ‘Small Area Estimation’ methods.
A ‘diabetes belt’ was defined as being comprised of 644 counties in 15 mostly southern states with an estimated prevalence of diagnosed diabetes of at least 11%.
6
Barker et al / Am J Prev Med 2011;40(4):434–439“Identifying a diabetes belt via counties allows policymakers to identify regions where need is greatest”
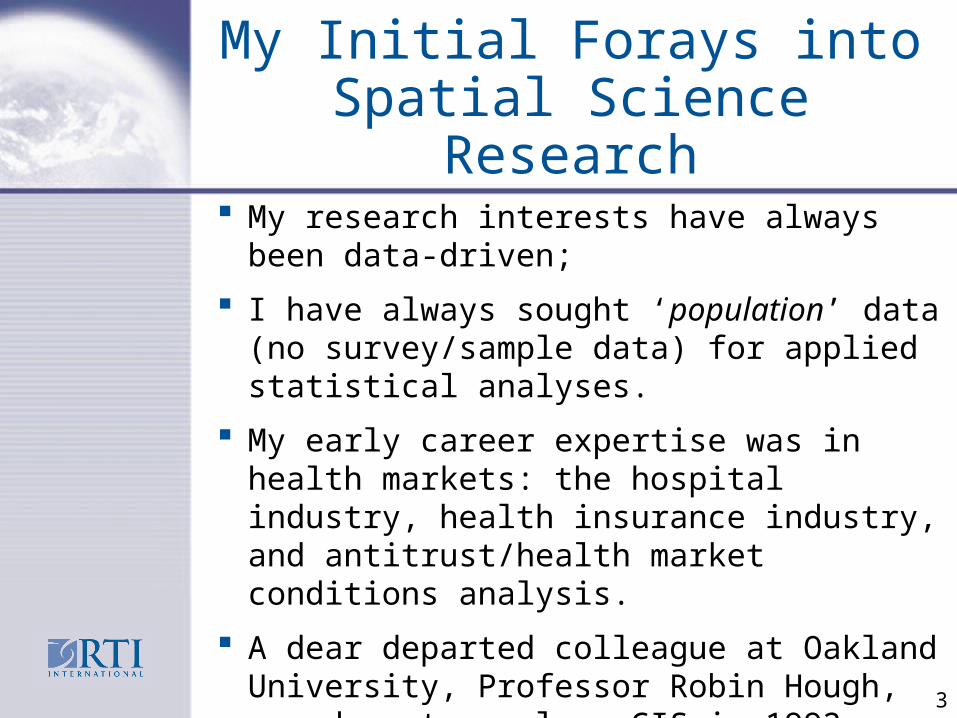
Startling Facts
Using the same data as Barker et al (2011), we found that:
– 54% of counties (1692/3117) had < 50 observations in the pooled sample, which is the minimum required by CDC for reporting county prevalence as a direct estimate.
– 26% of counties collected/reported no data at all!
Barker et al’s county estimates are smoothed versions of multi-county clusters, irrespective of whether adjacent counties were actually similar in their diabetes prevalence or indeed provided any information at all.
Geographic smoothing algorithms that “borrow information” from neighboring areas stabilize results from sparsely populated areas, reducing variability in the data, but increasing the bias in the estimates for each small area (Pickle and Su, 2002).
7

Critique of SAE Methods
The smoothing used in SAE methods produces a more pronounced pattern at the regional level (e.g. the ‘belt’).
This paper was widely acclaimed in Scientific American, March 8, 2011
The predicted proportions for any particular county should not be interpreted by the viewer (Pickle and Su, 2002), which brings starkly into question the practice of using the results from smoothing approaches to inform targeted resource allocation.
8
“The new information should help local officials have a better understanding of their areas' problems—and make a better case for additional resources for prevention and management programs."
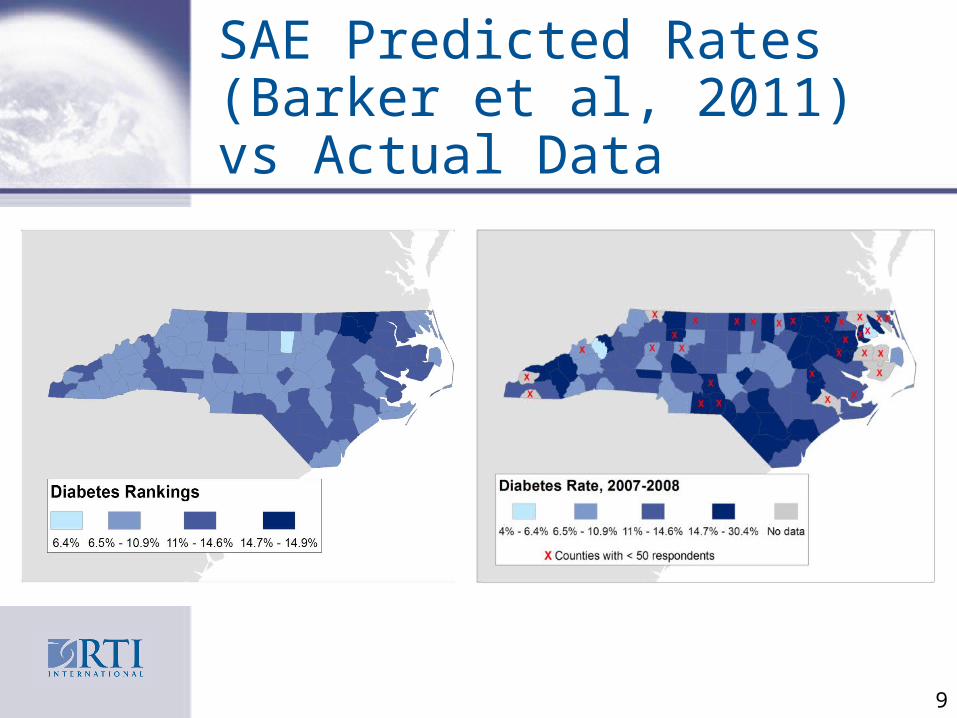
SAE Predicted Rates (Barker et al, 2011) vs Actual Data
9

Why do we Need ‘Critical Spatial Thinking’ in Population Health Research?
Studies such as Barker et al’s (2011) can be both misleading and of limited use for targeting scarce resource allocations.
For planning and intervention resource allocation, maps and statistical findings are needed that reflect population data and their local area heterogeneity, rather than mask it.
There is a critical need for maps and analyses which accurately represent and contextualize disease rates resonant with characteristics of local areas.
This sort of contextualized population-based information enables researchers and practitioners to effectively engage communities in participatory research, completing the translational loop “from bench to trench to wrench”.
10
Why are Spatial Data needed for Population Health Research?
There is a critical need for precise information identifying specific communities (where) with greatest need for chronic disease interventions.
There is a critical need for other information regarding the mechanisms and most likely drivers of the disease prevalence among people and their communities (how, what, why).
Thus there is a critical need for disparities research that characterizes the relative influence of various socio-ecological, contextual factors along the multilevel, temporal, and urban-rural spectra.
Multilevel modeling is the statistical approach used to meet these needs, using spatial data representing entire populations. Estimates are not provided for areas with no data.
11
Multilevel Modeling: Robust Area-level Predictions
The individual is the unit of analysis in our multilevel modeling, which we have used to assess the effects of area contextual and individual factors on cancer prevention and cancer outcomes.
We model various levels of influence on individuals:• Neighborhood• Community/health market• State
12

Multilevel Factors Impacting Probability of Cancer Screening
13
State-level Factors: State Comprehensive Cancer Control Coalitions and Their Activities; Social and Economic Policies, Institutions, and Regulations
Personal Health Behavior: Utilization of Cancer Screening
Socio-Demographic
•Social Integration and Support (Residential Segregation)
•Driver Courtesy (Commuter Intensity)
•Social or Cultural Cohesion (English Language Ability)
Individual
Enabling/Disabling•Personal Disability•Personal Resources (assistance with purchasing health coverage)•New Address•Distance to closest endoscopy provider
Predisposing•Age, Sex, Gender•Race or Ethnicity
Need•CRC or BC risk factors (not observed)
Health Care System •Proximity and Density of Endoscopy Facilities
•Proximity and Density of Physician Specialists (gastroenterologists, oncologists)
•Managed Care Plan Penetration
•Population in Poverty

Significance of This Research
Disparities have been a particular focus of comprehensive cancer control (CCC) efforts.
However, as of 2011, only 8 states planned to use GIS, spatial analysis, or spatial statistics in implementing their CCC plans (AK, IN, LA, MD, MS, MT, NJ, SC).
The results we describe here may be useful to state cancer planners, because our findings demonstrate differences in disparities across states that may be partially explained by state-specific efforts to reduce disparities.
These efforts have not yet been officially evaluated or compared across states.
14
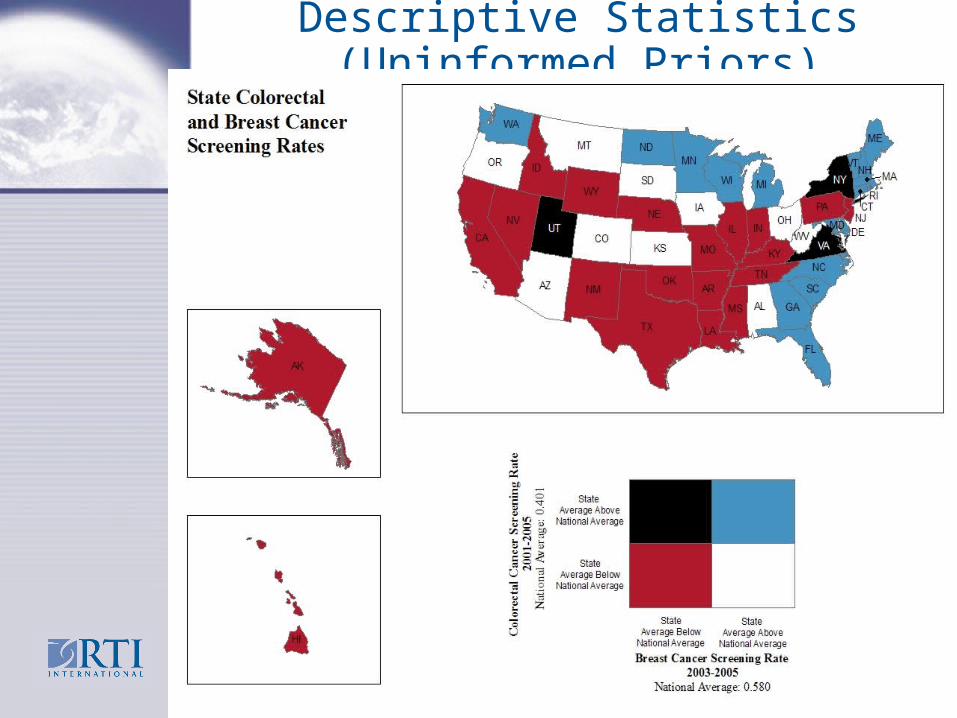
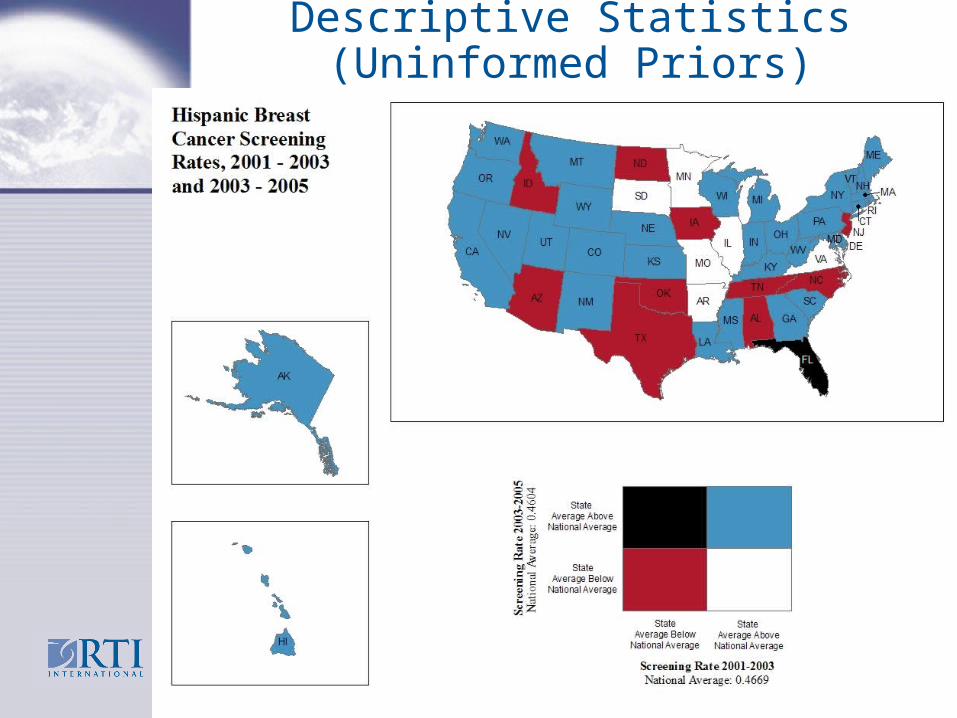
Descriptive Statistics (Uninformed Priors)
15
Descriptive Statistics (Uninformed Priors)
16

Spatial Translation of Multilevel Regression Findings
We estimate 50 multilevel regressions for BC and 50 for CRC screening, separately for each state (no state level in model).
We could present 100 tables with the two sets of multivariate regression results for each of the 50 states. Each table would contain ‘effect estimates’ for 12 person-level and 11 area-level covariates, predicting a type of cancer screening.
Instead, we focus one-by-one on specific effect estimates (i.e. person’s race or ethnicity, relative to whites) and summarize the findings across all states by mapping these effect estimates.
To make it more interesting, we use bivariate mapping to spatially translate the results from two separate regressions –BC screening (women only), and CRC screening (men and women). 17
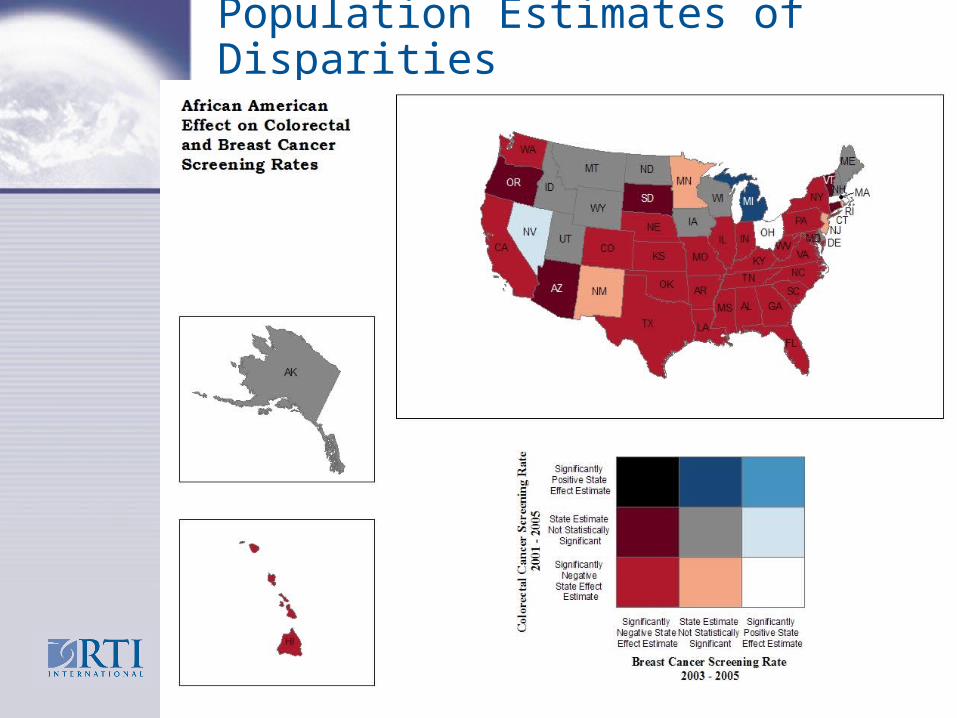
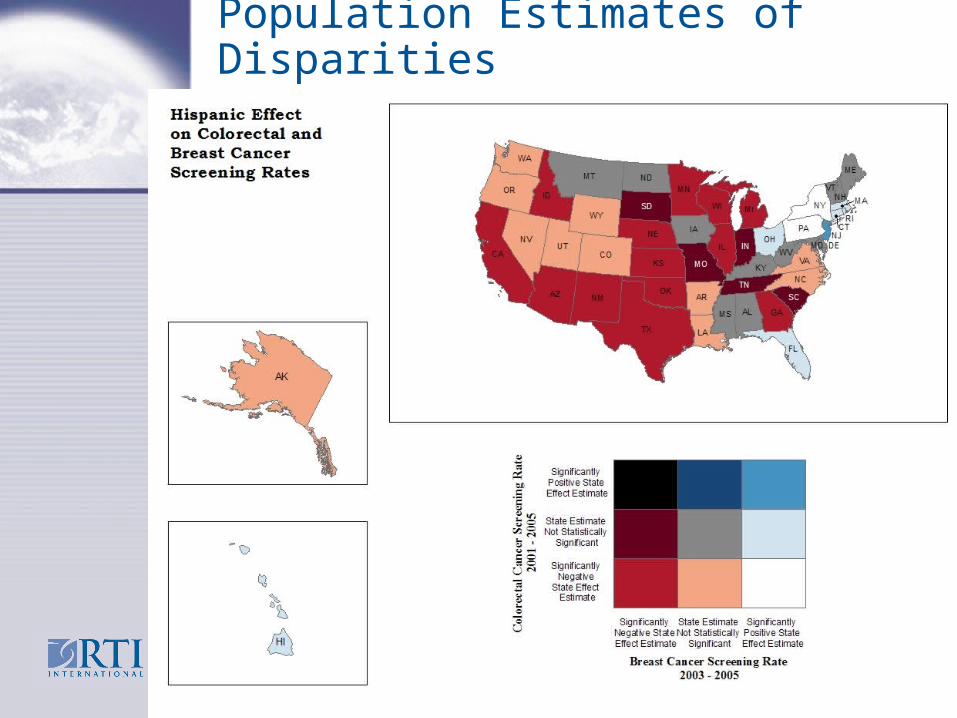
Population Estimates of Disparities
18
Population Estimates of Disparities
19

Findings
we find that African Americans in Michigan and Hispanics in New Jersey are significantly more likely to utilize endoscopic screening for CRC than whites.
However, national statistics suggest that these groups are significantly less likely to use endoscopy than whites.
Differences across states show that the notion of a ‘national average’ may be misguided. Reverse disparities contradict national averages that suggest disparities.
20

Michael Gibbons: “Populomics” Johns Hopkins Urban Health Institute
Modeling population level health problems is challenging, in part because of the complex interplay of socio-behavioral, community and biologic factors within the context of the current healthcare system.
Populomics, the science of integrating knowledge from the molecular sciences with the population sciences, has the potential to propel health and disease inquiry, treatments and interventions well beyond current limitations, to yield insights and advances not currently possible.
Multilevel modeling is a fundamental principle of Populomics research.
21
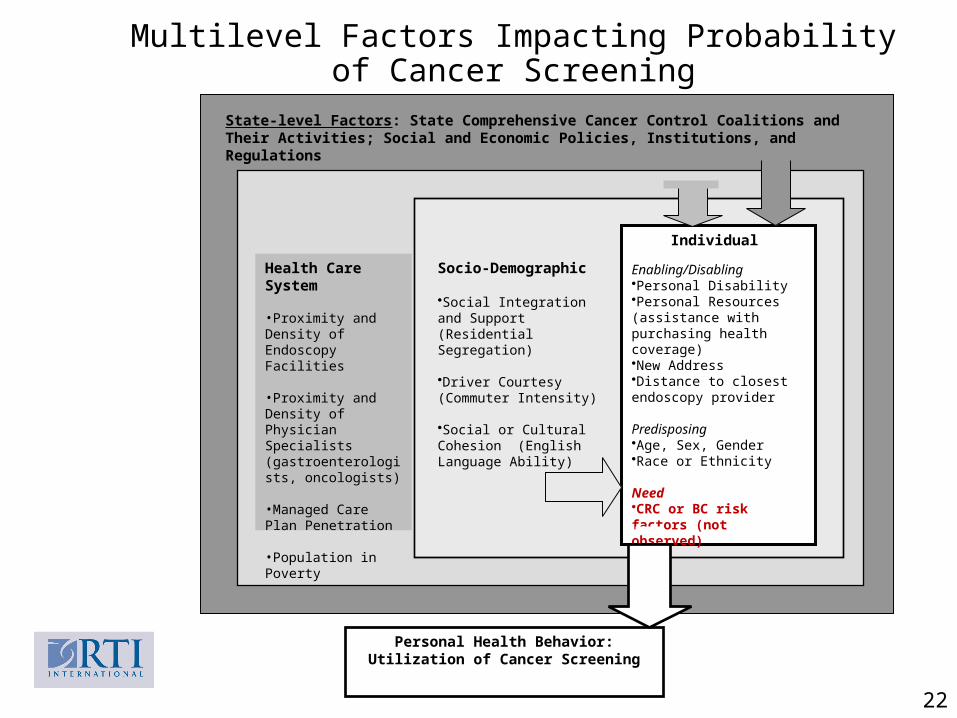
Multilevel Factors Impacting Probability of Cancer Screening
22
State-level Factors: State Comprehensive Cancer Control Coalitions and Their Activities; Social and Economic Policies, Institutions, and Regulations
Personal Health Behavior: Utilization of Cancer Screening
Socio-Demographic
•Social Integration and Support (Residential Segregation)
•Driver Courtesy (Commuter Intensity)
•Social or Cultural Cohesion (English Language Ability)
Individual
Enabling/Disabling•Personal Disability•Personal Resources (assistance with purchasing health coverage)•New Address•Distance to closest endoscopy provider
Predisposing•Age, Sex, Gender•Race or Ethnicity
Need•CRC or BC risk factors (not observed)
Health Care System •Proximity and Density of Endoscopy Facilities
•Proximity and Density of Physician Specialists (gastroenterologists, oncologists)
•Managed Care Plan Penetration
•Population in Poverty
Hurdles Facing Populomics and Spatial Science Research Lack of health security and the need for
HIPAA hobbles spatial scientists in the US in terms of meaningful analyses which might improve resource allocation and translation efforts.
Other countries with better health security (national health insurance programmes) are moving ahead of the US in using these new approaches and technologies to improve the human condition.
23
Looking to the Future
How will integrating knowledge from the molecular sciences with the population sciences improve health?
Consider autism, which is suspected to originate with some sort of imbalance in the micro biome in the gut.
Does food originating in different places have differential impacts on the micro biome? Is ‘eating local’ beneficial/harmful?
24
Looking to the Future
Collection of geocodes (place specific location information) along with molecular data (micro biome samples from humans and their local agricultural environments) may be required to understand the gene-environment interaction associated with autism.
Ongoing data collection of microbiotic samples is now including the geocode as part of the metadata associated with the sample data collected from subjects and natural sites.
25
Looking to the Future
In future, crowd-sourced data from GPS-linked phones may provide a new source of population data, and new challenges associated with statistical modeling of these data.
Computational resources and software tools now have plenty of capability to handle these sort of immense estimation problems.
26

Questions???
Related Documents