Discussion Paper No. 15-080 The Power of Individual-Level Drivers of Inventive Performance Thomas Zwick, Katharina Frosch, Karin Hoisl, and Dietmar Harhoff

Welcome message from author
This document is posted to help you gain knowledge. Please leave a comment to let me know what you think about it! Share it to your friends and learn new things together.
Transcript

Dis cus si on Paper No. 15-080
The Power of Individual-Level Drivers of Inventive Performance
Thomas Zwick, Katharina Frosch, Karin Hoisl, and Dietmar Harhoff

Dis cus si on Paper No. 15-080
The Power of Individual-Level Drivers of Inventive Performance
Thomas Zwick, Katharina Frosch, Karin Hoisl, and Dietmar Harhoff
Download this ZEW Discussion Paper from our ftp server:
http://ftp.zew.de/pub/zew-docs/dp/dp15080.pdf
Die Dis cus si on Pape rs die nen einer mög lichst schnel len Ver brei tung von neue ren For schungs arbei ten des ZEW. Die Bei trä ge lie gen in allei ni ger Ver ant wor tung
der Auto ren und stel len nicht not wen di ger wei se die Mei nung des ZEW dar.
Dis cus si on Papers are inten ded to make results of ZEW research prompt ly avai la ble to other eco no mists in order to encou ra ge dis cus si on and sug gesti ons for revi si ons. The aut hors are sole ly
respon si ble for the con tents which do not neces sa ri ly repre sent the opi ni on of the ZEW.

1
The Power of Individual-Level Drivers of Inventive Performance
Thomas Zwickab1, Katharina Froschc, Karin Hoisldef, Dietmar Harhoffdbg
aUniversity of Wuerzburg, DE
b Centre for European Economic Research (ZEW), Mannheim, DE
cBrandenburg University of Applied Sciences, DE
d Max Planck Institute for Innovation and Competition, Munich, DE
e University of Mannheim, Mannheim, DE
f Copenhagen Business School, Copenhagen, DK
g Centre for Economic Policy Research (CEPR), London, UK
(Version November 9th, 2015)
Abstract
Based on an established theoretical framework of the drivers of inventive performance, the so-called KSAO (Knowledge, Skills, Abilities, and Other) factors, this paper seeks to explain empirically the performance of inventors throughout their careers. We combine survey information spanning the inventors’ entire careers and psychometric test evidence, with patent history data for more than 1,000 inventors. We also control for variables that have traditionally been included in estimations of inventive performance such as inventor age and a broad list of applicant institution-, technology-, patent-, and period-related information. We show that educational level, skills acquired during the career, personality traits, career motivations, cognitive abilities, and cognitive problem-solving style are significantly related to inventive performance.
Key-words: Inventive performance; individual drivers; patent history; survey
JEL Codes: J24; M54; O31; O32
1 Corresponding author. University of Würzburg, Sanderring 2, 97070 Würzburg, E-Mail: thomas.zwick@uni-
wuerzburg.de. We would like to thank Lee Doris, Francesco Lissoni, Eduardo Melero, and Jana Oehmichen for good suggestions. We also thank the OECD for providing us with the classifications of clean technology patents. The authors acknowledge financial support from Deutsche Forschungsgemeinschaft (DFG) (Reference No.: ZW 172/2-1, Term: 2012-2014).

2
1. Introduction
There is a long history of attempts to understand sources of inventive performance, but this
relationship remains a major topic of innovation research (Ahuja and Katila, 2001; Laursen and Salter,
2006; Laursen and Foss, 2003). Existing studies have focused mainly on firm-level determinants of
inventive performance, in particular absorptive capacity or the capability to transfer tacit knowledge
(Fosfuri and Tribó, 2008; Tamer Cavusgil et al., 2003) and characteristics like openness (Laursen and
Salter, 2006). Since the seminal article by Grant (1996), it has been widely recognized that knowledge
embodied in individuals is one of the most important resources for innovation, and that knowledge is
stored and recombined in the heads of individuals. However, individual-level evidence on innovation
performance is still scarce. Literature on the drivers of individual capacity to bring forth technological
advances, in particular, to generate innovations, is limited to characteristics like experience,
education, age, and gender. The impact of specific abilities, types of knowledge, and personality
traits has so far escaped systematic analysis.
Theoretical psychological literature suggests a great wealth of potential individual drivers of
inventive performance, in particular knowledge and skills, cognitive and creative abilities, as well as
motivation (Woodman et al., 1993; Amabile et al., 1996). Thus far, if at all, such individual
characteristics have been included only in small-scale studies on inventive performance. Studies in
the field of psychology usually use subjective performance measures; however, the innovation
literature relies on patent histories to measure inventive performance, mostly with objective
measures of invention quantity and quality. However, patent data hardly include any information
about the characteristics of the individual inventors (Pilkington et al., 2009; Nakajima et al., 2010;
Melero and Palomeras, 2012). Even studies on the drivers of inventive performance that link patent
data with survey evidence include very few individual characteristics (Hoisl, 2007; Mariani and
Romanelli, 2007; Hoisl, 2009; Gambardella et al., 2012; Schettino et al., 2013). Therefore, leaving
aside a few small-scale studies, we know only little about the individual-level determinants of
inventive performance (Scott and Bruce, 1994; Garfield et al., 2001; Dewett, 2007; Mieg et al, 2010).
Our analysis shows that educational level, skills acquired during the career, personality traits such as
the Big 5 and risk tolerance, career motivations, cognitive abilities, and cognitive problem-solving
style, have high predictive power for inventive performance. Our paper adds to the existing literature
on innovative performance by analyzing the relationship between inventor characteristics from the
so-called KSAO (Knowledge, Abilities, Skills, and Other) model and innovative performance. We
control for characteristics such as knowledge, skills, and career motivations, as well as personality
traits, risk tolerance, cognitive thinking style, and divergent thinking ability derived from widely used
psychological tests. The biographical data and the psychometric information were derived in a large-

3
scale survey. We add this information to well-established individual determinants of inventive
performance such as age and educational level. Finally, we control for characteristics of the
employers, the patents, and the technology field of the patents.
The remainder of the paper is organized as follows. In the next section, we describe the available
literature on individual drivers of innovation performance. The third section explains our empirical
strategy. The fourth section introduces our large-scale linked inventor survey and patent history
data. The fifth section discusses our empirical strategy and results. The sixth section concludes.
2. Background Discussion
Individual Drivers of Inventor Performance
The psychological literature identifies several individual-level drivers of creativity and problem-
solving capacity: cognitive ability, personality traits, cognitive style, motivation, knowledge plus the
organizational environment (Dodds et al., 2002). These dimensions can be summed up in the so-
called KSAO concept. In other words, Knowledge, Skills, Abilities, and “Other Attributes” such as
personality traits, risk tolerance, and motivation, have been identified as independent dimensions
that have distinctive and highly predictive power for creativity and inventive performance (Roberts et
al., 2006).2
Knowledge and Skills3 are essential for inventive performance because innovations are often a
combination of two or more concepts that were previously viewed as unrelated. To combine
concepts for the recombination of technologies, an individual must have cognitive access to all
concepts or technologies used. Such access is contingent upon expertise and domain-relevant
knowledge (Koestler, 1967, pp. 213–215; Amabile, 1988; Hargadon, 1998; Fleming, 2001; Gruber et
al., 2013). Csikszentmihayli (1988) suggests that an individual who wants to make an innovative
contribution must not only work within a conceptual system, but must also reproduce that system in
his or her mind. Personal mastery and an accurate sense of domain are therefore necessary
antecedents of innovation. Consequently, the literature typically assumes a positive correlation
2 Another related taxonomy of individual-level drivers of labour market outcomes is proposed by Roberts et al.
(2006). They coin the taxonomy “personality psychology” and distinguish between traits, motives and values, abilities and narratives in their model of personality psychology. The KSAO model covers all of these dimensions besides narratives (i.e. open-ended questions on aspects of life stories). The widely cited article by Woodman et al. (1993, p. 309) lists the following individual drivers of creativity: cognitive style/abilities (divergent thinking), personality, knowledge, and intrinsic motivation – we include all these elements in our model. We do not include social and contextual influences, however, because we focus on individual inventive productivity rather than organizational creativity. 3 Knowledge is the theoretical or practical understanding of a subject, and skills are proficiencies developed
through training and experience.

4
between educational achievement, as an indicator of knowledge, and inventive performance. In
particular, scientific knowledge has been shown to be a key asset for patentable innovations (Cohen
and Levinthal, 1990). Moreover, skills obtained on-the-job throughout a career, such as breadth of
professional experience, working as specialist or generalist, or the share of working time devoted to
research and development, might have an influence on inventive performance.
Abilities4 are also critical tools for employees to operate within their jobs (Amabile et al., 1996).
Often, they are seen as complements to knowledge and skills because task-specific abilities might not
have a strong correlation to indicators of general knowledge or skills such as education or work
experience. Therefore, abilities can explain variance in labour market outcomes in addition to
knowledge and skills (Chubin et al., 1980; Sauermann and Cohen, 2010). An important ability
dimension for inventive performance is intelligence (Batey and Furnham, 2006; Hunter et al., 2012).
Many employers use the highest educational attainment as a signal of cognitive ability, and more
productive institutions might hire more able (i.e. higher educated) inventors (Spence, 1973). Many
contributions indeed adopt the argument proposed by Griliches (1970) that education is not only an
important contributor of knowledge but also the best measure and indicator of ability (in
comparison, for example, with parents’ education, individual IQ, or achievement tests). These studies
include education as the only indicator of ability (as well as knowledge).
Scott and Bruce (1994), however, mention two additional dimensions of abilities, apart from IQ and
education that are especially relevant for knowledge workers.5 The first ability dimension is the so-
called problem-solving style with two independent modes of thinking: bisociative and associative.6
The other ability dimension is the way of doing things within a continuum ranging from adapters to
innovators. The first group has the ability to incrementally do things “better”. The second group
excels at doing things “differently” by redefining or restructuring the problem rather than accepting
the current situation as a starting point (Kirton, 1976). The basic assumption underlying the two
distinct problem-solving styles is that there are two systems for solving cognitive problems
(Kahneman and Frederick, 2002): “System 1” cognitive processes solve a problem spontaneously and
are “unaffected by intellect, alertness […] or difficulty of the […] problem” (Frederick, 2005, p. 26).
Often, this style of thinking is referred to as “bisociative” or “intuitive”. “System 2” cognitive
processes are mental operations requiring effort, motivation, concentration, and the execution of
4 Abilities are the qualities of being able to do something. 5 Intelligence seems not to be too strongly correlated with thinking style (Furnham and Nederstrom, 2010) - or,
put more generally, creativity is not the same as intelligence, even though it requires general mental abilities (Carroll, 1993). 6 Dane et al. (2011) note, however, that the literature is ambiguous with respect to the question of which of the
two problem-solving styles is more conducive to inventive performance and whether inventive performance is correlated with problem-solving style at all.

5
learned rules. Often, this thinking style is referred to as “associative” or “systematic”. Kirton (1976),
Scott and Bruce (1994), and Clegg et al. (2002) argue that the former problem-solving style might be
related to inventive behaviour because it explains how information from different paradigms is
processed simultaneously. They argue that systematic problem-solvers work within established
methods or procedures and, therefore, are likely to generate conventional solutions to problems.
They propose a positive relationship between an intuitive problem-solving style and inventive
behaviour. Furthermore, they propose a negative relationship between a systematic problem-solving
style and inventive behaviour.
Distinct from the cognitive style of thinking is cognitive ability (Runco, 2004). Divergent thinking -
that is “thinking out of the box” - seems to be more predictive of inventive performance than general
cognitive ability (Runco, 1991; Hunter et al., 2012). Indeed, divergence in idea generation is central to
most modern theories of creativity (Kirton, 1976; Amabile, 1988; Woodman et al, 1993). There is,
however, increasing evidence that creative ideas may range from incremental to radical, and that not
all creative ideas diverge significantly from an existing paradigm (Kuhn, 1970; Houtz et al., 2003;
Audia and Goncalo, 2007). Hence, inventors with incremental ideas may even have higher
(quantitative) performance than those responsible for radical inventions because (incremental)
exploitation of existing ideas is less risky than (radical) exploration of new ideas (March, 1993; Audia
and Goncalo, 2007).
A search of studies relating personality traits to inventive performance reveals three dimensions
assigned to the “Other” category of the KSAO model: personality, willingness to take risks, and
motivation. The so-called Big 5 model of personality has become an almost universal template to
understand the structure of personality. The Big 5 dimensions are openness to experience (ideas,
aesthetics), agreeableness (compliance, straightforwardness), conscientiousness (order, dutifulness,
competence), extraversion (warmth, gregarious, activity), and neuroticism (anxiety, depression)
(Almlund et al., 2011). Openness to experience enhances an individual’s intrinsic motivation towards
novelty, and therefore works in a multiplicative way to produce innovations (King et al., 1996).
Openness to experience might also entail a stronger cognitive flexibility that leads to a broader
spectrum of solution possibilities and combinations and therefore inventive performance (Feist,
1998). Openness to experience might also permit individuals to see problems from different
perspectives (Sung and Choi, 2009). Feist (1998) argues that introversion might be positively
associated with innovation because communication with a sceptical environment might be a barrier
to the pursuit of an uncertain creative idea. Isolation and withdrawal might be necessary conditions
for generating new ideas. Sung and Choi (2009) argue in contrast that extrovert individuals are
proactive, try new things with their dynamic and enthusiastic ways, are willing to leave routines and

6
do not shy away from conflicts. They therefore hypothesize that extraversion is positively related
with inventive performance. Feist (1998) suggests a curvilinear association between neuroticism and
inventive performance (where too much or too little anxiety is detrimental to inventions), and that
moderate levels of anxiety, for example, can enhance the inventive potential. However, Sung and
Choi (2009) argue that a tranquil and sober state leads to a more efficient processing of information
and therefore to higher creativity. Individuals scoring high on conscientiousness, on the contrary, are
more resistant to changes at work, and are more likely to comply with current organizational norms
and are likely to be less spontaneous (Barron and Harrington 1981). Therefore, conscientiousness
might be negatively related to inventive performance. Eysenck (1994) and Feist (1998) propose that
being more disagreeable might be positively linked to inventions. Inventors might specifically need
high social rule independence to be able to think “outside the box” of conventions.
Engaging in complex thinking is necessary for inventions, but requires effort; it is not automatic
(Schmeichel et al., 2003). Hence, motivation to exert effort is related to inventive performance
because inventions need attention and self-regulation. The Big 5 model is largely silent about
motivation (Roberts et al., 2006; Almlund et al., 2011, p. 51). A complete model of inventive
performance should control for motivation in addition to personality traits captured by the Big 5.
Dewett (2007), and Nagaoka and Walsh (2007) note that creativity and inventive performance might
be driven by intrinsic (task) rather than extrinsic (pecuniary) motivation.
Willingness to take risks is a third personality characteristic often related to inventive performance
(Dewett, 2007; Madjar et al., 2011). Inventive activities are risky because their outcomes are highly
uncertain, and the action-outcome link can be tortuous and spread out over time.
Empirical Studies on Inventive Performance
The literature on individual drivers of inventive performance mainly uses patent data or patent data
merged with survey data. Patent history data usually include only individual-level information that
can be derived from the names and identities of inventors listed in the patent document. Few
papers, so far, combine patent history data with evidence from surveys. This link however allows for
inclusion of a broader set of individual characteristics.7 Notable examples are papers based on
matched survey-patent datasets such as PatVal 1 and 28 or related surveys (Gittelman and Kogut,
2003; Hoisl, 2007; Giuri et al., 2007; Mariani and Romanelli, 2007; Nagaoka and Walsh, 2007; Ejermo
7 An early example of an analysis of the personal history of employees on their patenting success is Smith et al.
(1961). 8 See Giuri et al. (2007) for an overview of PatVal.

7
and Jung, 20119; Toivanen and Väänänen, 2012; Gambardella et al., 2012; Schettino et al., 2013).
Linked patent and survey data typically offer information such as age, gender, education, and
experience, or a subset of these characteristics (Mariani and Romanelli, 2007; Hoisl, 2007; Hoisl,
2009; Kim et al., 2009; Gambardella et al., 2012, Schettino et al., 2013; Gruber et al., 2013). Papers
based on these data usually find that employer, time period, and technology field characteristics are
more important drivers of inventive performance than indicators of individual characteristics.
The most commonly used measures of inventive performance in papers that use patent histories are
the number and the quality of patents, the latter usually measured as the number of forward
citations (Mariani and Romanelli, 2007). Some papers also use subjective assessment of the value of
a patent (Gruber et al., 2013). Please note that the mainly psychological literature cited in the
previous section does not distinguish between qualitative and quantitative performance. Some
contributors also control for career length by dividing the number of patents by potential experience
(Hoisl, 2007). Mariani and Romanelli (2007) stress that individual characteristics have a higher
explanatory power for the number of patents than for their quality. Ejermo and Jung (2011, p. 21)
state that “the quality of patents is mainly explained by patent characteristics themselves”. In their
analysis, individual characteristics have again an impact only on the number of patents, not on the
quality of patents.
Almost all empirical papers show a positive relationship between level of education (particularly
having a PhD) and the number and quality of patents (Hoisl, 2007; Mariani and Romanelli, 2007;
Lissoni et al., 2008; Gambardella et al., 2012).
Scott and Bruce (1994) use data on 172 engineers, scientists, and technicians in the R&D facility of a
large US corporation and find a negative correlation between a self-assessed systematic problem-
solving style of these individuals and superiors’ assessment of their inventive performance. Based on
data derived from an experiment, Garfield et al. (2001) find that an intuitive cognitive thinking style
positively correlates with generation of paradigm-modifying rather than merely novel ideas.
The so-called Big 5 personality dimensions have been consistently shown to be good predictors of
inventive performance (Furnham et al., 2013). Among these personality dimensions, “openness to
experience” plays a crucial predictive role (McCrae, 1987; Sung and Choi, 2009; Hsieh et al., 2011).10
9 Ejermo and Jung (2011) match patenting data with register data (rather than survey data) of about 80% of the
population of Swedish inventors in the years 2004 and 2005. 10
Previous evidence also points to a negative correlation between creative behavior and conscientiousness as well as agreeableness, and mostly positive correlations for extraversion and neuroticism (Feist, 1998). Based on survey data from 69 inventors, Mieg et al. (2010) even find a negative correlation between “openness to experience” and patenting success.

8
Although conscientiousness usually is positively related to labour market success (Judge et al., 1999;
Almlund et al., 2011), most studies do not find a positive relationship between conscientiousness and
inventive performance (Feist, 1998; Runco, 2004; Sung and Choi, 2009; Furnham and Nederstrom,
2010). Extraversion exhibits a slight positive correlation with inventive performance (King et al.,
1996; Sung and Choi, 2009; Furnham and Nederstrom, 2010; Furnham et al., 2013). The other Big 5
dimensions neuroticism and agreeableness seem to be unrelated to inventive performance (Furnham
et al., 2013).
Gambardella et al. (2012) use linked survey-patent history data and estimate the effect of self-
reported motivation on inventive performance.11 They find a positive but weak effect of the
motivation measure on the value of the patent family derived from an invention. Their motivation
measure combines intrinsic and extrinsic motivation. Sauermann and Cohen (2010) use data of more
than 1,700 full-time employees drawn from the Survey of Doctorate Recipients. They relate extrinsic
and intrinsic job motivations to the self-reported number of US patent applications and the number
of patents granted during the last five years. They find that both intrinsic and extrinsic job
motivations have a positive impact on performance. Intrinsic job motivations are, however, more
important for inventive performance than extrinsic job motivations.
Dewett (2007) studies the impact of self-assessed risk-taking on the inventive productivity of 165
employees in the R&D department of a large corporation. Inventive productivity is assessed by
subjective (supervisor ratings) and objective (patents and awards) indicators. He finds that a higher
willingness to take risks is positively correlated with subjective indicators. This correlation is,
however, not found for objective indicators. Madjar et al. (2011) stress that the willingness to take
risks correlates more strongly with radical than with incremental creativity. This is in line with the
notion of Levinthal and March (1993) that individuals are differentially sensitive to the risks inherent
to creativity, and that those individuals who are less sensitive are particularly inclined to accept risks
which are inherent in divergent ideas (Audia and Goncalo, 2007).
There is a broad literature on the relationship between age, cohort and period, and inventive
performance. This literature shows mainly that heterogeneity between inventors is persistent over
the life-cycle, and that performance may decline with higher age and is lower for older cohorts
(Turner and Mairesse, 2005; Hoisl, 2007; Mariani and Romanelli, 2007; Lissoni et al. 2008).12 Nagaoka
and Walsh (2007), however, find a positive relation between the share of self-assessed top-value
11 Here the sum of scores between 1 and 5 is taken for four self-assessed motivation levels (money, career,
prestige/reputation, and satisfaction with solving the problem). Hoisl (2007) uses three dummies that indicate a high incentive created by an increase in salary, advancement, and improvement of working conditions. 12 For a literature review, see Frosch (2011).

9
inventions and inventor age. They attribute this finding to a selection process – that is only successful
inventors remain in research and development. When estimating the age-patent performance
relationship, it has to be taken into account that the total number of patents and publications
published changes from year to year and that the initial conditions decisive for performance such as
the share of inventions that get patented or technology fields job entrants choose also change from
cohort to cohort. Our study looks at the inventors’ aggregate career performance. Therefore, we
cannot disentangle age effects in addition to birth year and patent application year (Turner and
Mairesse, 2005; Göbel and Zwick, 2013) and include only cohort and period controls.
Summing up, the literature on individual drivers of inventive performance, as measured by individual
patent histories, includes very little individual information (mainly education achievement, gender,
and age), and it does not find a strong impact of these individual characteristics on inventive
performance. The impact of individual characteristics tends to be stronger on the number of patents
than on the quality of patents. However, many drivers of inventive performance identified in the
psychological literature - such as those from the KSAO model - are not included in large-scale
assessments of performance based on patent histories. Thus, the evidence supporting the KSAO
model must be taken with a grain of salt at this point.
3. Data
The data for this study on inventive performance were collected from a self-administered survey of
German inventors mainly active in clean technology (CT) and mechanical elements (ME).13 The survey
was conducted in 2014. Clean technology patents filed at the European Patent Office (EPO) were
extracted from the PATSTAT database as of April 2012. Additionally, we received a list of clean
technology patents from the OECD based on the taxonomy developed by the Environment
Directorate of the OECD (ENV-TECH). The ISI-OST-INPI classification was used to identify patents in
mechanical elements (Schmoch 2008).
Based on a list of all EPO-filed patent applications in the respective fields with priority dates between
2004 and 2008, we identified all patent applications assigned to the two fields that listed at least one
inventor with a home address in Germany. This gave us 8,313 inventors for our basic sample (see
Table 1 for the distribution across technological areas) with at least one European patent. We
13 Our basic motivation for selecting inventors active in one of only two technology fields between 2004 and
2008 was to have a relatively homogeneous sample. We found, however, that most inventors applied for patents in more than one of the technology fields over their career, and, therefore, the patents of the inventors selected cover most technology fields relevant for patenting. A detailed description of our data construction method can be found in Frosch et al. (2014).

10
received 1,700 responses, yielding a corrected14 response rate of 29.5 percent. Table 1 presents
detailed numbers for sample sizes and response rates.
[Table 1 about here]
An important reason for the dearth of linked patent and survey data is that name and address
information from patent documents must be matched to real persons (Hoisl, 2007). The process of
matching is complicated by inventors with common names who are not easy to tell apart, and by
inventors with older patents who moved frequently between employers. To identify inventive
performance over time, we searched for all patent applications of the responding inventors between
the years 1978 and 2012 using the PATSTAT database as of April 2012, and corrected the matches
manually. As the data from the most recent years are truncated, we based our empirical analysis on
EPO applications filed between 1978 and 2010. The data were supplemented with bibliographic and
procedural information on the respective patent, obtained from the PATSTAT database as of April
2012 and the European Patents Administration System (EPASYS) database as of 2012. Only 1.4
percent (or 21) of the inventors in our sample are female. This small share is in line with previous
evidence from Germany (Ejermo and Jung, 2011). Therefore, we decided not to control for gender.
4. Empirical Strategy
Dependent Variables
Our dataset contains patent applications of our inventors for a period of 33 years (1978–2010).
Hence, for most inventors, we can assess inventive performance for their entire career. Only 13
percent of the inventors started work before 1978 and only seven percent of the inventors worked in
research and development before 1978.15 A career perspective on inventive productivity is useful
because it reduces potential measurement errors given that inventors do not invent with a constant
intensity over time.
Our main measure of inventive performance indicates to how many patents of above-average quality
an inventor contributes throughout his career per work-year. We followed the literature and used
forward citations as a measure of patent quality (Trajtenberg, 1990). The binary variable jbinC ,
14 Inventors who could not be reached because we had incorrect addresses (2.395) or these were unknown
(626), as well as 23 inventors who had died, were excluded from the original sample. 15
When we include a dummy variable for those inventors whose career started before 1978, this variable is always insignificant. Only in models without the education variable, is the dummy significantly negative, presumably because the older cohorts of inventors have clearly lower education levels on average. We conclude that missing a small part of total career output from a small share of inventors does not affect our results. Therefore, we regard our dependent variable as measure of innovation performance over the entire career.

11
indicates whether patent application J receives at least as many ( 1,, jfractbinC ) or fewer (
0,, jfractbinC ) fractional citations (i.e. citations corrected for the number of co-inventors) as the
average patent application in the same priority year t and technology field k:
fracttk
j
j
fracttk
j
j
jfractbin
jj
jj
Cn
Cif
Cn
Cif
C
,
,
,,
0
1
(1)
This measure, therefore, accounts for differences in patent activities over time and between
technology fields. This is of particular importance, as citation patterns might change over time and
differ between technology fields.
Inventive performance of inventor i equals average above-average citation counts, that is the sum of
the binary indicators for all patent applications J of inventor i, divided by the number of work years,
respectively experience EXPi:
i
J
j
jfractbin
EXP
C
Ciav
1
,,
,
(2)
The advantage of our indicator is that it is an aggregate measure of career inventive performance
and allows comparison of the performance of innovators of different ages, tenures, and
technological specializations because all types of innovators a-priori have the same chance of
obtaining a high measure of Cav,i. Moreover, our measure combines aspects of quantity and quality.
In a robustness test (see models 2 below), we contrast this variable with a pure quantity and a pure
quality variable.
Explanatory Variables
For the explanatory variables, we aggregated time-changing characteristics to measures that capture
the entire careers of the inventors during the period 1965–2010. Abilities and personality
characteristics were obtained from the survey.
Inventor Characteristics
An overview of all dimensions from the KSAO model used in this study is presented in Figure 1.
[Figure 1 about here]
Information on career characteristics such as the share of periods in which an inventor worked
intensively in R&D or employer characteristics throughout a career, was gathered from a calendar

12
filled in by the inventors. In this calendar, all questions had to be answered for 5-year spells since
1965. Hence, we have aggregate biographical information for the entire career for most inventors
(less than 1% of inventors started their career earlier than 1965).
Inventor age was measured by six dummy variables taking the value of one if the inventor was born
before 1970, between 1966 and 1970, 1961 and 1965, 1956 and 1960, 1951 and 1955, and 1946 and
1950, and zero otherwise. This implies that the oldest cohort was older than 60 years of age at the
time of our survey.
The inventor’s highest formal educational level was measured by three dummy variables taking the
value of one in cases in which the inventor obtained a vocational education, conducted academic
studies, or received a PhD, and zero otherwise.
Skills development during the career was captured by working as a generalist across technology field
boundaries and a high share of research and development (R&D) tasks in the working time. We
measured inventors’ breadth of work experience based on the time-share they worked mainly as a
generalist rather than a specialist during their professional career. Analogously, we also captured the
shares of periods in which the inventor spent more than half of the working time with R&D tasks
during his career. We constructed dummy variables based on these shares. An inventor was treated
as a generalist if he worked his entire career as generalist. An inventor was treated as having a high
share of intensive R&D work spells if the share of these spells amounted to more than 35%.
A systematic and an intuitive thinking style (cognitive problem-solving skills) can be assessed based
on the Cognitive Reflection Test (CRT) proposed by Frederick (2005). The three-item short scale
provides a simple measure for a person’s cognitive style. The respondents were presented three
puzzles that are special in the sense that an intuitive answer springs quickly to mind, but the correct
answer is obtained only if respondents reflect more systematically on the puzzle. The more answers
are correct, the more systematically the respondent reflects on problems. We treat systematic and
intuitive problem-solving styles as independent (Jabri, 1991; Scott and Bruce, 1994; Epstein et al.,
1996; Epstein, 2002). To capture systematic thinking, we created a variable that took the value of
one if all three CRT items were answered correctly and zero if at least one answer was wrong. To
capture intuitive thinking, we created a variable that took the value of one if at least one of the three
CRT items was answered with the intuitive (but wrong) answer.
Divergent thinking abilities were assessed based on the Alternative Uses Task method suggested by
Guilford (Guilford, 1967), the most widely used test to assess an individual’s capacity for creativity.
The validity of this test has been confirmed in a large number of studies (Sternberg, 1999; Kim, 2006).
Many studies, however, do not find a correlation between the test result and real-life creative
accomplishments (Mansfield and Busse, 1981). Divergent thinking captures an essential aspect of

13
many research-oriented and knowledge-intense professions: accumulating and recombining existing
bits of knowledge in novel ways (Burt, 2004; Simonton, 2004). It measures the ability to “think out of
the box” (Runco, 1991), does not require previous knowledge, and is easy to understand. The
inventors were asked to list as many original and creative uses as possible for a brick within 3
minutes– as proposed in the literature, we explicitly asked the inventors to be creative (Silvia et al.,
2008).16 Inventors named between zero and 38 ideas, with an average of eight ideas per respondent.
The originality and creativity of each idea was independently assessed by three reviewers17 based on
a scale ranging from 1 (“not very creative”) to 5 (“very creative”). The total score for each idea was
computed as the average of three individual scores. This procedure was proposed by Silvia et al.
(2008) arguing that more traditional assessment approaches, for example as proposed by Guilford
(1967),18 are problematic with respect to low discriminant validity. In particular, different
assessments come to different results (low convergent validity) and assessments are characterized
by low predictive validity of performance measures (Simonton, 2003). As an indicator of divergent
thinking, we used a dummy that took the value of one if the median score across all ideas named by
a respondent was larger than 2.8.
Risk attitude was measured based on a self-assessment item which has been used by the German
Socio-Economic Panel (GSOEP). The variable varies between 0 (“highly risk adverse”) and 10 (“highly
risk seeking”). The behavioural validity of this survey measure was demonstrated by Dohmen et al.
(2011). For a large sample, the authors compared this risk measure with the behaviour in paid real-
stakes lotteries. The question turned out to be the best predictor for actual risk taking in financial,
health, sports, or labour market environments. Our dummy variable took the value of one if risk
attitude amounted to seven or higher.19
Inventor personality traits were assessed based on a 15-item short version of the Big 5 personality
inventory, which is also used in the GSOEP (Schupp and Gerlitz 2008). The five personality
dimensions were aggregated by a principal components factor analysis with varimax rotation
(negatively defined items were rescaled) (see Table A1 in the appendix). According to our
expectations, we find that the established five factors that can be interpreted as extraversion,
conscientiousness, openness to new ideas, agreeableness, and neuroticism. The Kaiser-Meyer-Olkin
16 Our question was: “Please write down all the original, unusual and creative ways you can think of to use a
brick”. 17
Reviewers were instructed according to the procedure proposed by Silvia et al. (2008). 18
These are mainly the dimensions fluency (i.e. number of answers), flexibility (i.e. number of different categories mentioned), elaboration (how carefully are the ideas explained), and originality (the number of ideas that had been mentioned only by 1 or 5 percent of the other participants in the survey). 19
The dummies for being a generalist, having a high positive risk attitude, and a high score in divergent thinking took the value of one for inventors who were in the top quartile of the respective distribution of values, and zero otherwise.

14
criterion of sampling adequacy and Bartlett’s test of sphericity indicate that the correlation matrix is
suitable for a factor analysis.
The literature proposes three main areas of motivation – pecuniary (extrinsic), task (intrinsic), or
social (Amabile, 1993; Walsh and Tseng, 1998). Unfortunately, we cannot directly measure different
levels of motivation in an un-incentivized test. Instead, we asked the respondents to answer 16
questions about their career motivations, which were then aggregated to different types of
motivations based on a factor analysis. All questions were asked on a 5-point Likert-scale ranging
from 1 (“completely unimportant”) to 5 (“very important”). The factor analysis resulted in four
factors that can be interpreted as extrinsic motivation (job amenities and employer characteristics),
intrinsic motivation (task characteristics), value motivation (environmental, social, or political goals),
and leadership motivation (management tasks or being an entrepreneur) (see Table A2 in the
appendix). Again, the Kaiser-Meyer-Olkin criterion of sampling adequacy and Bartlett’s test of
sphericity indicate that the correlation matrix is suitable for a factor analysis.
Besides individual-level characteristics, the organizational environment has an important role in
creativity and inventive performance (Nelson, 1959; Schmookler, 1962; Amabile et al. 1996;, Oldham
and Cummings, 1996; Sauermann and Cohen, 2010). Individuals might be the source of problem
solutions, their performance might, however, be strongly affected by the organizational context (i.e.
their employers) or the technical field in which they are working (Pilkington et al., 2009; Hunter et al.,
2012). In line with the literature on individual inventive performance, we therefore controlled for
applicant characteristics – that is the characteristics of the inventors’ employers (Mariani and
Romanelli, 2007). More specifically, we aggregated applicant characteristics over the entire career of
inventors and computed applicant type shares si,atype. These are defined as the number of patent
applications Pi,atype produced by inventor i while he has been associated with an applicant institution
of type atype (atype= research institution or university, private company, independent inventor),
divided by the total number of patent applications Pi filed by inventor i: iatypeiatypei PPs /,, .20
Research organizations or universities often prefer publishing research results over patenting (Van
Looy et al. 2006). In addition, citation patterns differ between patents protecting applied versus basic
research. Basic research, for instance, often receives more citations, which occur at a later stage
20 To give an example: Take inventor i who is named on 10 different patents between 1978 and 2010. Two of
the patents were filed by a research institution, which corresponds to 20 percent of his overall patent portfolio ( 2.0, resis ). Throughout his career, the majority of patents he is named on (7 patents or 70 percent of his
patent portfolio) were filed by private companies ( 7.0, privis ). Finally, he filed one patent as an individual
inventor, without being affiliated with a research institution or a private company ( 1.0, indis ).

15
(Fabrizio, 2007; Martin and Irvine, 1983; Gittelman and Kogut, 2003). These differences could affect
our citation-based dependent variable.
Similarly, the size of the employers throughout inventors’ careers was computed based on the size of
the patent portfolio of the applicant institutions between 1978 and 2010. The data were obtained
from the PATSTAT database. Applicant size shares si,asize at the inventor level are computed as the
number of patent applications Pi,asize produced while inventor i has been associated with applicant
institutions that filed a total of patents within the size category asize, divided by the total number of
patents Pi filed by inventor i: iasizeiasizei PPs /,, .21 As applicant size categories, we used 1 patent
application, 2–24 patent applications, 25–249 patent applications, 250–999 patent applications, and
1,000 patent applications or more. Following Mariani and Romanelli (2007), Hoisl (2007), and Kim et
al. (2009), we assumed that performance of inventors employed in larger firms is higher. The main
argument is that larger firms usually are early adopters of inventions, devote a higher share of
resources to research and development, and can attract better inventors.
Period shares capture the temporal distribution of an inventor’s activity and help us to differentiate
between time and cohort effects. The period shares account for differences in inventive performance
between age groups, for example, because of systematic increases in patenting activity over time
(the so-called “patent explosion”; Hall, 2004). The latter may lead to biased productivity estimates in
favour of younger inventors to the detriment of older inventors (Göbel and Zwick 2013). The period
share sik for inventor i in period t (t=1, …., 8) is computed as the number of patent applications Pit
filed by inventor i in period t, divided by the total number of patent applications Pi filed by inventor i:
iitit PPs / . These time periods refer to 5-year-episodes between 1978 and 2010.22
Following Hoisl (2007, 2009), we also controlled for the following patent status variables: pending,
refused, withdrawn, and granted. Patent applications are refused by the patent examiners in cases in
which the underlying inventions do not meet the requirements for patentability that is novelty,
21 We make the assumption that the inventors are employed with the applicant organization mentioned on the
patent document. Research based on the PatVal1 survey showed that this is true for 92 percent of the responding inventors (Hoisl 2007). If there are several applicant institutions – which are not necessarily mentioned in the same order on the patent document as the inventors – we cannot be sure that the inventor is associated to the first applicant institution. However, a detailed analysis of inventor institutions for a random subsample of 100 inventors revealed that on only 4 percent of patents was more than one applicant institution is mentioned. Out of these, many constitute the same applicant (i.e. a subsidiary), research institutes, or single inventors. In these cases, we can assume that the first applicant (which is, in most cases, a private company), has the strongest influence on the invention process, for example in terms of funding or R&D infrastructure. In the end, only 2.6 percent of the patents of our test subsample mention several private companies as applicant institutions. In these cases, we can indeed not be sure that the association of our inventors with the first applicant institution is correct. The small share of patents with this situation is, however, within a negligible range. 22
Note that the first period (1978–1979) and the last period (2010) are shorter than 5 years.

16
inventive step, and commercial applicability. Applications may be withdrawn by the applicants
themselves during the examination process when the applicant anticipates that the patent
application may not receive a grant. The status variables are an additional control to avoid biased
results of our dependent variables. In particular, granted patents may be more likely to be cited (i.e.
mentioned in the search reports of patent examiners) or organizations may file a large number of
patents (inflating our patent counts) to test the waters in the respective technological field. These
“test-patents” are later withdrawn when their intention is revealed during the examination process.
Analogously, we included the share of inventor i’s patent applications that were either granted, still
pending, refused by the examiner, or withdrawn by the applicant between 1978 and 2010.
Moreover, we included technology shares to account for the distribution of inventors’ activity across
technology areas throughout their careers. The technology share sik for inventor i in technology area
k (k=1, …, K) was computed as the number of patent applications Pik assigned to technological area k,
divided by the total number of patent applications Pi per inventor i: iikik PPs / . To calculate the
shares, we drew on the 34 technological areas suggested by Schmoch (2008), but aggregated them
to 11 distinct technological areas according to the patenting activity of the inventors in our sample.23
The inventors applied patents in all of the 11 technological areas (Table 2), therefore it made sense
not to restrict our analysis to certain areas.
Estimation Strategy
We started with the following multivariate regression model to determine inventive performance of
the inventors in our sample:
ln( 1)i r r u u v v w w i
r u v w
I ks a o context
where Ii was our inventive performance measure of inventor i described above.
The variable vectors comprise a set of r knowledge and skills indicators (ks: educational level, share
of work periods with intensive R&D tasks, and generalist work tasks), u different ability indicators (a:
divergent thinking skills, systematic and intuitive problem-solving), v “other” indicators, that is
personality traits, risk attitude, and motivations (o: Big 5, risk attitude, and career motivations), and
w additional control variables for the applicant firm and time as well as patent characteristics
23 The eleven technology areas are: 1) Electrical machinery, apparatus, energy, 2) Electrical engineering, 3)
Semiconductors, 4) Instruments, 5) Chemistry, “organic“ (comprises the “organic” subsections of chemistry such as Organic Chemistry, Biotechnology, Pharmaceuticals, Polymers, Food Chemistry), 6) Chemistry, “technological” (comprises the “engineering” subsections of chemistry such as material chemistry, materials/metallurgy, surface technology, chemical engineering and environmental technology), 7) Engines/Pumps/Turbines, 8) Mechanical engineering, 9) Mechanical Elements, 10) Transportation, 11) Other fields.

17
(context: periods of patent application, patent status, applicant type, applicant size, sector). The
context variables were all calculated as shares over the entire career to give an aggregate measure
for the career of all inventors. Vectors contained the parameters that measure the effect of the
respective variables on inventive performance, and ε is an ordinary error term.
We first ran a parsimonious productivity model with the traditional individual explanatory variables
education and age. Then we added successively further control variables. All independent variables
we focussed on were derived from survey data and therefore from a data source other than
inventive performance. Thereby, we avoided the danger of a common method bias - that is the use
of similar scales for the dependent and the independent variables (Scott and Bruce, 1994;
Sauermann and Cohen, 2010; Gruber et al., 2013). We are also confident that our results do not
suffer from social desirability bias because, for example, the individuals’ reports on their career
motivations have not been linked to questions on their inventive performance (Sauermann and
Cohen, 2010).
Inventive performance was measured for the entire career of the inventors that is from the year they
started to invent until 2010. We measured drivers of inventive performance such as cognitive ability,
motivation, personality traits, risk aversion, and other probable time-changing individual
characteristics in 2014. We, therefore, have to be cautious with establishing a causal relationship
between these characteristics and inventive performance. For example, it is possible that early
patenting success changes the subjective personality self-conception (Mischel and Shoda, 2008). It is
also possible that inventors who previously obtained high financial rewards from their successful
patents now regard financial rewards as important career motivations (Sauermann and Cohen,
2010). There is much debate about the malleability of personality traits and motivations during the
career that remains open-ended. Some scholars assume that motivation, ability, and personality are
traits and can be seen as fixed effects in longitudinal studies (Levin and Stephan, 1991, Amabile et al.,
1994). Other scholars point to measureable changes in motivation and personality after large
interventions (Heckman et al., 2010). Besides the malleability of personality traits and motivations,
answers on these personality dimensions may be biased. Several papers provide evidence of self-
reporting biases in job application processes. Biases were particularly strong in high-stakes
environments and when job applicants knew which kinds of traits were preferred by personnel
officers (Morgeson et al., 2007; Tett and Christiansen, 2007; Ones et al., 2007). Our survey does not
represent a high-stakes environment and the respondents were not aware of the research question
at the time of answering the questionnaire. We, therefore, assume that answers were given
truthfully. In addition, we asked about motivation at the start of the career – that is before possible
successes or failures during the career – and not the topical main motivation of inventors.

18
Nevertheless, we treat with caution the associations between personality traits as well as career
motivations and inventive performance, and do not interpret these results causally.
The situation is different for ability measured using cognitive tests and for risk perception (Kirton,
1976). Achievements in cognitive ability tests are more difficult to bias than personality tests. A low
motivation that might reduce the test results of able inventors might be captured by our career
motivation questions (Segal, 2012). In addition, the risk perception seems to be a time-invariant
personality trait. Finally, education and age are certainly not endogeneous explanatory variables of
innovation performance during a career as an inventor.
Furthermore, we argue that explanation of past inventive performance with contemporary individual
characteristics that might be influenced by labour market experiences is still informative because its
predictive value on future inventive performance is sufficient to make efficient personnel assignment
decisions (Hogan and Roberts, 2001; Hogan and Hogan, 2007; Tett and Christiansen, 2007; Almlund
et al., 2011, p. 34). Our paper shares the drawback of a dependent variable covering a period prior to
surveying some explanatory variables, with most papers analyzing performance based on survey
data.24 In addition, subjective performance ratings by supervisors or the inventors themselves are
usually retrospect and therefore similar to the timing structure of our data - compare, for example,
Scott and Bruce (1994), Oldham and Cummings (1996), Morgeson et al. (2005), Dewett (2007), Walsh
and Nagaoka (2009).
5. Results
Table 2 reports the mean, median, and standard deviation of all relevant variables and gives a short
description of the construction of the variables. The inventors in our sample are about 48 years old
and less than 10 percent have no academic career (30 percent hold a PhD). Most inventors work in
large private firms that applied for more than 1000 patents over the time period studied here.
Extrinsic and intrinsic career motivations clearly dominate value-driven and leadership career
motivations. Most inventors have a high share of research and development jobs in their work, and
work as generalists rather than specialists.
[Table 2 about here]
24 Sauermann and Cohen (2010), for example, relate motivations captured in 2001 to the number of US patent
applications during the period 1999–2003. Although Ejermo and Jung (2011) in principle could use the patent histories of inventors from 1978 to 2009 and link them with register data on their labour market history, they use cross-sectional data from 2004/2005 because the data would have been too selective otherwise. Hoisl (2007) and Schettino et al. (2013) also use a life-time measure of inventor productivity (number of patent applications corrected for age) and relate it to survey information on, for example, incentives and sources of information captured at the end of the productivity period. Gambardella et al. (2012) relate motivation measured in a survey of inventors with past patenting performance.

19
Table A3 in the appendix summarizes the correlations between the most important variables.
Inventive performance is positively correlated with divergent thinking, the Big 5 trait “openness to
new experiences”, and a value-related career motivation. In the bivariate correlations, we find a
significantly negative sign for age and the Big 5 trait conscientiousness. There are also a couple of
interesting correlations between individual characteristics. In line with the existing literature
(Dohmen et al., 2011), we find that the self-assessed willingness to take risks is strongly related to all
Big 5 dimensions. More specifically, a positive risk orientation is negatively correlated with
neuroticism and positively correlated with all other Big 5 dimensions, especially with openness to
new experiences. Interestingly, for the inventors, a positive risk orientation is also positively
correlated with all career motivation dimensions, except for extrinsic motivation. In contrast with the
literature, we did not find a significant correlation between willingness to take risks and divergent
thinking ability as well as cognitive thinking style (Audia and Goncalo, 2007; Dohmen et al., 2011).
Also the Big 5 dimensions are positively correlated with most motivation dimensions (Segal, 2012).
We found, for example, that conscientiousness is positively correlated with all career motivation
dimensions besides value-oriented motivation. Openness to new experiences is positively correlated
with all career motivation dimensions besides extrinsic motivation, and agreeableness is correlated
with all motivation dimensions. The cognitive test results are not significantly correlated with
openness to experience and extrinsic career motivation, but positively and significantly correlated
with intrinsic career motivation, value-oriented career motivation, and leadership motivation.
Divergent thinking ability and a systematic cognitive thinking style are positively and significantly
correlated with having a PhD, and are negatively and significantly correlated with age. For an
intuitive cognitive thinking style, the correlation signs are exactly the opposite. The strong
correlations between important KSAO dimensions call for a joint control of all dimensions to avoid
biased results based on unobserved heterogeneity.
[Table 3 about here]
Table 3 summarizes the regression results.25 When we only take the organizational background
variables into account (five applicant sizes, three applicant types, four patent types, eleven
technological areas and seven time periods), 9 percent of the variation in inventive performance is
explained (not shown in the table). This share increases to 11 percent when the six inventor birth
cohort categories are added (not shown in the table). Model 1a adds the education variables. The
resulting model explains 13 percent of the variance in inventive performance. Model 1b adds the two
25 Certainly the changes in R
2 when we add additional variables depend on the variables already included in the
estimation model. We included conventional variables used in early papers on inventive performance based on patents in the most parsimonious model and incrementally added novel variables from the KSAO model.

20
variables that account for the skill environment of the inventors. Adding the share of intensive R&D
work spells and the share of generalist work spells as further indicators of knowledge and skills, the
R2 hardly increases and amounts to 0.134. Model 1c also accounts for ability-related variables. This
increases the R2 to 0.141. The remaining variables capturing personal traits, risk attitude, and career
motivations are added in Model 1d. Including these variables results in an R2 amounting to 0.171.
Analogously to the changes in R2, the Akaike Information Criterion (AIC) decreases when we go from
Model 1a to Model 1d. The lowest AIC value is reached at Model 1d, which includes all KSAO
dimensions. We therefore prefer this model and in the following, if not stated otherwise, we report
the results of Model 1d. Overall, adding inventor characteristics almost doubles the share of variance
explained by the model (increase from 9 percent to 17 percent). Adding the KSAO factors to a model
containing all other regressors increases the R2 from 13 percent to 17 percent, which equals an
increase of 24 percent.
The inventive performance of inventors born between 1956 and 1965 is about 3.5 percent lower
than our reference group of inventors born after 1970. The performance of inventors born between
1946 and 1955 is about 5.5 percent lower. The differences are significant at the 10 percent level or
lower. The negative effects get stronger with cohorts with the exception of the highest age group. A
reason for the slightly higher productivity of younger inventors in comparison with the 55–59 year
olds might be that beyond the age of 60, early retirement is possible and relatively widespread in
Germany (Göbel and Zwick, 2013). Less productive inventors might, therefore, decide to leave the
workforce early, with more productive inventors staying in the workforce until the legal retirement
age of 65. The negative cohort-inventive performance profile also was found by Hoisl (2007), Mariani
and Romanelli (2007), and Lissoni et al. (2008).
Analogously to the literature (Hoisl, 2007; Mariani and Romanelli, 2007; Lissoni et al., 2008;
Gambardella et al., 2012), we found that higher knowledge and ability signalled by higher education
levels was associated with significantly higher individual inventive performance. The performance of
inventors with a PhD is almost 40 percent higher and the performance of inventors with an academic
degree almost 15 percent higher than the performance of inventors with a vocational degree.
Interestingly, in contrast with the literature on earnings determinants (Bowles and Gintis, 2002), the
inclusion of skills and direct ability measures hardly affects the coefficient of education in our
inventive performance equations (Model 1a vs. Models 1b-d). The education and age coefficients
remain stable when we add covariates, or, in other words, personality traits, abilities, and education
are orthogonal and explain different sources of inventive performance (Roberts et al., 2007;
Borghans et al., 2008; Gill and Prowse, 2015).

21
Having a high share of R&D-intensive spells during the career is associated with a significant positive
impact on inventive performance (about 12 percent higher). However, it does not seem to make a
difference whether an inventor had worked as generalist or as a specialist throughout his career.
Furthermore, we found that inventors with highly divergent thinking capabilities exhibited a 20
percent higher inventive performance than inventors with lesser divergent thinking capabilities.
Hence, producing many innovations does not necessarily lead to many citations. It is mainly the
innovators who think out of the box, who are responsible for the high-quality inventions (March,
1993; Audia and Goncalo, 2007). Both a systematic cognitive thinking style and an intuitive thinking
style are positively and highly significantly correlated with inventive productivity. Inventors with
either systematic or intuitive thinking style show 20 percent higher inventive performance than the
other inventors, who neither named the intuitive (but wrong) nor named the correct answer for the
thinking style puzzles. Adding the three ability variables does not change the effect of any of the
other explanatory variables (Model 1b vs. Models 1c, d). In other words, the ability coefficients are
extremely robust to the exclusion of the other explanatory variables – even in a model without other
explanatory variables, the ability coefficients are comparable with those of the full model. Hence, the
ability measures are orthogonal to the other determinants of inventive performance.
For the Big 5 personality traits, we found that openness to new experiences had a positive impact on
inventive performance, which is highly significant. Conscientiousness and extraversion have a
significantly negative impact. Conscientiousness might be negatively correlated with inventive
performance because inventions require breaking rules (of thought) and changes in the workplace
routine (Eysenck, 1994). Extraversion might be negatively correlated with inventive performance
because it is not necessary to be a communicative, outgoing, and gregarious person (Feist, 1998).
These results are in clear contrast with the finding that conscientiousness usually has the highest and
neuroticism the second highest impact on labour market outcomes such as wages, promotions, etc.,
for employees (Judge et al., 1999; Ones et al., 2007; Borghans et al., 2008; Almlund et al., 2011).
The career motivation variables included are not significantly related with inventive performance in
our regression. .26 According to previous findings (Amabile, 1993), intrinsic motivation is a stronger
career motivator than all other motivation dimensions (see Table 2). One of the reasons for the lack
of significance of intrinsic motivation may be the small variation of the variable. A large share of
inventors marked the questions on intrinsic career motivation with the highest grades. According to
26 Intrinsic career motivations only exhibit a significantly positive, and extrinsic career motivations a
significantly negative correlation, with inventive performance if we leave out the Big 5 personality traits (not shown in the table). In contrast with Segal (2012), the addition of motivation controls does not change the coefficients of the big5 personality traits on inventive performance.

22
the literature, we find a significantly positive association of a positive attitude towards risk. Inventors
with a high affinity to risk exhibit inventive performance that is 13 percent higher than those with a
low affinity to risk. It is interesting to note that the effect of education on inventive performance
declines if we add personality traits and career motivation, the effect of age remains largely
unchanged.
Table 4 presents the results of several robustness tests. Most papers, so far, only find correlations
between individual characteristics and patent numbers, not patent quality (Gambardella et al., 2012;
Mariani and Romanelli, 2007). We, therefore, also show a regression (Model 2b in Table 4) that uses
a purely quantitative indicator, the average number of patent applications per work year as a
dependent variable. The results are very similar to the results of Model 1d (full model displayed in
Table 3). Also the results for a simple patent quality index (the logarithm of the average number of
citations per work year) as a dependent variable leads to similar results (see Model 2a in Table 4).
There are only a few differences between Models 2a and 2b, we would like to mention. Age has a
stronger impact on the number of patents than on citations. Divergent thinking only has an impact
on the quality of patents but not on the quantity. The Big 5 indicator “conscientiousness” also is only
significant in the quality of patents regressions.
[Table 4 about here]
6. Conclusions
Although it seems obvious that individual characteristics beyond basic information such as age and
schooling qualification are an important driver of inventive performance, only few papers, so far,
include individual-level drivers in empirical models of individual inventive performance. This paper is
the first to investigate the predictive power of individual characteristics from all dimensions of the
KSAO taxonomy on patent history data from the entire career of more than 1,000 German inventors.
Our main dependent variable, inventive performance, measures the quality of the patenting activity.
It is operationalized as the number of patents cited more than the average patent in the technology
class in a particular filing year per working year during the entire career. This measure allows us to
compare inventive performance for inventors who differ with respect to their career stage.
Besides indicators of knowledge and skills derived from biographical information, we use survey
information on career motivations, personality traits, and risk attitudes. In addition, we include
ability indicators from psychological tests on cognitive thinking style and divergent thinking ability.
Finally, we control for the context in which innovations are created by including sector, size, and type
information of the applicant firm, technology field, period, and status information of the patents.

23
We find that all KSAO dimensions have a high predictive value for inventive performance. Adding the
KSAO dimensions increases the share of explained variance of the performance model by 24 percent
(relative to a model including all other regressors). The addition of new individual characteristics
does not render insignificant other dimensions such as the more traditional variables education and
age. More specifically, high educational attainment, a high share of R&D-intensive work spells, a
systematic and an intuitive cognitive thinking style, divergent thinking abilities, openness to new
experiences, and a positive risk attitude turn out to be significant predictors of inventive
performance. Negative drivers of inventive performance are notably high values in conscientiousness
and extraversion as well as extrinsic career motivations.
Our findings imply that individual characteristics in personality, as well as abilities in particular, add
to the explanation of inventive performance. It is, therefore, important to include further inventor
characteristics in addition to controls that have been used traditionally such as education
achievement or age. In other words – ability, personality, and skills measure sources of inventive
performance different from those measured by education and age. We also find that the correlation
between personality traits and real-life outcomes may be task-specific. Most labour market research
shows that, for example, the personality trait conscientiousness is positively correlated with
important outcomes such as income, career, or unemployment risks. With inventive performance,
this trait is, however, significantly negatively correlated. Openness to new experiences in contrast,
usually has no impact on labour market success in general. It is, however, significantly positively
correlated with inventive performance. We get robust results when we replace our performance
measure that combines quantity and quality aspects of patents with simple average patent and
citation counts. This paper shows that the precision of hiring decisions of highly prolific inventors can
be improved if information is obtained besides basic information that can be retrieved from CVs, for
example personality information from tests or surveys.
Finally, we acknowledge some limitations of our study. First, although there are clear benefits of
using patent data for this study – in particular if combined with survey data – the disadvantages of
using patent data apply. In particular, not all inventions are patentable or patented (Griliches 1990).
Second, we measure personality in our cross-section survey and aggregate inventive performance to
a life-time measure. Looking at changes in research behaviour such as, for example, a shift from
exploration to exploitation during the career (Audia and Goncalo, 2007), is beyond the scope of our
data. In addition, we cannot establish causal relationships between some of our measures and
inventive performance because the measures might have been influenced by patenting success. We
share this problem with most of the literature on personnel selection and patenting productivity. In
addition, personnel officers usually have to assess future inventive performance by looking at past

24
life-time performance. We also use very basic ability tests that could be included in a low-stakes
survey context. We suggest that the inclusion of more elaborate ability tests on, for example,
cognitive thinking style and divergent thinking ability may improve the selection quality.

25
Literature
Ahuja, G. and R. Katila, (2001), Technological acquisitions and the innovation performance of acquiring firms: A longitudinal study, Strategic Management Journal 22 (3), 197-220.
Ahuja, G. and C. Lampert (2001), “Entrepreneurship in the Large Corporation: A Longitudinal Study of How Established Firms Create Breakthrough Inventions”, Strategic Management Journal 22, 521-543.
Almlund, M., Duckworth, A. Heckman, J. and T. Kautz (2011), “Personality Psychology and Economics”, NBER Working Paper 16822, Cambridge, MA.
Amabile, T., K. Hill, B. Hennessey and E. Tighe (1994), “The Work Preference Inventory – Assessing Intrinsic and Extrinsic Motivational Orientations”, Journal of Personality and Sociological Psychology 66 (5), 950-967.
Amabile, T., R. Conti, H. Coon, J. Lazenby, and M. Herron (1996), "Assessing the Work Environment for Creativity", Academy of Management Journal 39 (5), 1154–1184.
Amabile, T. (1993), “Motivational Synergy: Toward New Conceptualizations of Intrinsic and Extrinsic Motivation in the Workplace”, Human Resource Management Review 3 (3), 185-201.
Amabile, T. (1988), “A Model of Creativity and Innovation in Organizations” in B. Staw and L. Cummings (eds.), Research in Organizational Behavior, 10, Greenwich CT: JAI Press, 123-167.
Audia, P. and J. Goncalo (2007), “Past Success and Creativity over Time: A Study of Inventors in the Hard Disk Drive Industry”, Management Science 53 (1), 1-15.
Barron, F. and D. Harrington (1981), “Creativity, intelligence, and personality“, Annual Review of Psychology 32, 439–476.
Batey, M. and A. Furnham (2006), “Creativity, Intelligence, and Personality: A Critical Review of the Scattered Literature”, Genetic, Social, and General Psychology Monographs 132 (4), 355-429.
Borghans, L., A. Duckworth, J. Heckman and B. ter Weel (2008), “The Economics and Psychology of Personality Traits”, IZA Discussion Paper 3333, Bonn.
Bowles, S. and H. Gintis (2002), “Schooling in Capitalist America Revisited”, Sociology of Education 75(1), 1-18.
Burt, R. (2004), “Structural Holes and Good Ideas”, American Journal of Sociology 110 (2), 349-399.
Caroll, J. (1993), “Human Cognitive Abilities: A Survey of Factor-Analytical Studies”, Cambridge University Press: New York.
Chubin, D., A. Porter and M. Boeckmann (1980), “Career Patterns of Scientists: A Case for Complementary Data”.
Clegg, C., K. Unsworth, O. Epitropaki and G. Parker (2002), “Implicating trust in the innovation process”, Journal of Occupational and Organizational Psychology 75, 409–422.
Cohen, W., Levinthal, D. (1990), “Absorptive capacity: A new perspective on learning and innovation“, Administrative Science Quarterly 35(1), 128-152.
Csikszentmihalyi, M. (1999), “Implications of a Systems Perspective for the Study of Creativity” in R. Sternberg (ed.), “Handbook of Creativity”, Cambridge University Press, New York, 313-335.
Dane, E., M. Pratt, M. Baer and G. Oldham (2011), Rational Versus Intuitive Problem Solving: How Thinking “Off the Beaten Path” Can Stimulate Creativity, Psychology of Aesthetics, Creativity, and the Arts 5 (1), 3-12.
Dewett, T. (2007), “Linking Intrinsic Motivation, Risk Taking, and Employee Creativity in an R&D Environment”, R&D Management 37 (3), 197 – 208.

26
Dodds, R., S. Smith and T. Ward (2002), “The Use of Environmental Clues during Incubation”, Creativity Research Journal 14, 287-304.
Dohmen T., A. Falk, D. Huffman, U. Sunde, J. Schupp and G. Wagner (2011), “Individual Risk Attitudes: Measurement, Determinants, and Behavioural Consequences”, Journal of the European Economic Association 9(3), 522 – 550.
Ejermo, O. and T. Jung, (2011), Team experience of inventors and inventive performance, Paper submitted for the 6th Annual Conference of the EPIP Association.
Epstein, S. (2002), Cognitive-experiential self-theory of personality, in: T. Millon and M. Lerner (eds.), Comprehensive handbook of psychology (Vol. 5). Hoboken, NJ: Wiley, 159–184.
Epstein, S., R. Pacini, V. Denes-Raj and H. Heier, (1996), Individual differences in intuitive-experiential and analytical-rational thinking styles. Journal of Personality and Social Psychology 71, 390–405.
Eysenck, H. (1994), “The Measurement of Creativity”, in M. Boden (ed.), “Dimensions of Cretivity”, MIT Press, Cambridge, MA.
Fabrizio, K. (2007), „University Patenting and the Pace of Industrial Innovation, Industrial and Corporate Change 16(4), 505-534.
Feist, G. (1998), “A Meta-Analysis of Personality in Scientific and Artistic Creativity”, Personality and Social Psychology Review 2 (4), 290-309.
Fleming, L. (2001), “Recombinant Uncertainty in Technological Search”, Management Science 47 (1), 117-132.
Fosfuri, A. and J. A. Tribó, (2008), Exploring the antecedents of potential absorptive capacity and its impact on innovation performance, Omega 36 (2), 173-187.
Frederick, S. (2005), “Cognitive Reflection and Decision Making” Journal of Economic Perspectives 19 (4), 25-42.
Frosch, K. (2011), “Workforce age and innovation: a literature survey”, International Journal of Management Reviews, 13(4), 414-430.
Frosch, K., D. Harhoff, K. Hoisl, C. Steinle and T. Zwick, (2014), “Individual Determinants of Inventor Productivity: Evidence from Linked Human Capital and Patent Data”, mimeo.
Furnham, A., D. Hughes and E. Marshall (2013), “Creativity, OCD, narcissism and the big 5”, Thinking Skills and Creativity, 10(1), 91-98.
Furnham, A., M. Nederstrom (2010), “Ability, demographic and personality predictors of creativity”, Personality and Individual Differences 48(8), 957–961.
Gambardella, A., D. Harhoff and B. Verspagen (2012), “The Value of Patented Inventions at the Extensive and Intensive Margin”, mimeo.
Garfield, M., N. Taylor, A. Dennis and J. Satzinger, (2001), Research report: Modifying paradigms—Individual differences, creativity techniques, and exposure to ideas in group idea generation. Information Systems Research 12, 322–333.
Gill, D. and V. Prowse (2015), “Cognitive Ability, Character Skills, and Learning to Play Equilibrium: A Level-k Analysis”, mimeo, forthcoming Journal of Political Economy
Gittelman, M. and B. Kogut (2003). “Does Good Science Lead to Valuable Knowledge? Biotechnology Firms and the Evolutionary Logic of Citation Patterns,” Management Science 49 (4), 366-382.
Giuri P., M. Mariani, S. Brusoni, G. Crespi, D. Francoz, A. Gambardella, W. Garcia-Fontes, A. Geuna, R. Gonzales, D. Harhoff, K. Hoisl, C. Lebas, A. Luzzi, L. Magazzini, L. Nesta, O. Nomaler, N.

27
Palomeras, P. Patel, M. Romanelli and B. Verspagen (2007), “Inventors and Invention Processes in Europe: Results from the PatVal-EU Survey, Research Policy 36 (8), 1107-1127.
Göbel, C. and T. Zwick (2012), “Age and Productivity: Sector Differences, De Economist 160 (1), 35-57.
Grant, R. M. (1996), Toward a Knowledge‐Based Theory of the firm, Strategic Management Journal 17 (S2), 109-122.
Griliches, Z. (1970), “Notes on the role of education in production functions and growth accounting, in: Hansen, L. (Ed.), “Education, Income, and Human Capital“, NBER, Cambridge, 71– 115.
Griliches Z. (1990), Patent statistics as economic indicators: A survey. Journal of Economic Literature 28(4), 1661–1717.
Gruber, M., D. Harhoff and K. Hoisl (2013), “Knowledge Recombination across Technological Boundaries: Scientists versus Engineers”, Management Science 59 (4), 837-851.
Guilford, J. (1967), The Nature of Human Intelligence, New York: McGraw-Hill.
Hall, B. (2004), “Exploring the patent explosion“, The Journal of Technology Transfer 30(1-2), 35-48.
Hargadon, A. (1998), “Firms as Knowledge Brokers: Lessons in Pursuing Continuous Innovation”, California Management Review 40, 209-227.
Harhoff, D., F. Scherer and K. Vopel, (2003). “Citations, Family Size, Opposition and the Value of Patent Rights“. Research Policy 32, 1343-1363.
Heckman, J., S. Moon, R. Pinto, P. Savelyev and A. Yavitz (2010), "The Rate of Return to the Highscope Perry Preschool Program." Journal of Public Economics 94(1-2), 114-128.
Hogan, R. and J. Hogan (2007), Hogan Personality Inventory Manual, Tulsa, OK.
Hogan, R. and B. Roberts (2001), Personality Psychology in the Workplace, American Psychological Association.
Hoisl, K. (2007), „Tracing Mobile Inventors – The Causality between Inventor Mobility and Inventor Productivity“ Research Policy 36, 619-636.
Hoisl, K. (2009), “Does Mobility Increase the Productivity of Inventors?“ Journal of Technology Transfer 34, 212 – 225.
Houtz, J., E. Selby, G. Esquivel, R. Okoye, K. Peters and D. Treffinger (2003), “Creativity Styles and Personality Type”, Creativity Research Journal 15 (4), 321 – 330.
Hsieh, H., J. Hsieh and I. Wang (2011), “Linking Personality and Innovation: the Role of Knowledge Management”, World Transactions on Engineering and Technology Education 9 (1), 38-44.
Hunter, S., L. Cushenbery and T. Friedrich (2012), “Hiring an Innovative Workforce: A Necessary yet uniquely Challenging Endeavor” Human Resource Management Review 22, 303 – 322.
Jabri, M. (1991), “The development of Conceptually Independent Subscales in the Measurement of Modes of Problem Solving”, Educational and Psychological Measurement 51, 975-983.
Judge, T., C. Higgins, C. Thoresen and M. Barrick (1999), “The Big Five Personality Traits, General Mental Ability, and Career Success Across the Life Span”, Personnel Psychology 52 (3), 621-652.
Kahneman, D. and S. Frederick (2002), “Representativeness Revisited: Atribute Substitution in Intuitive Judgment“ in T. Gilovich, D. Griffin, D. Kahneman (eds.), “Heuristics and Biases: The Psychology of Intuitive Judgment”Cambridge University Press, N.Y., 49-81.
Kim, K. (2006), “Can we Trust Creativity Tests? A Review of the Torrance Tests of Creative Thinking”, Creativity Research Journal 18 (1), 3-14.
Kim, J., S. Lee and G. Marschke (2009), “Inventor Productivity and Firm Size: Evidence from Panel Data on Inventors”, Pacific Economic Review 14 (4), 516-531.

28
King, L., W. McKee and S. Broyles (1996), “Creativity and the five-factor model“, Journal of Research in Personality 30, 189- 203.
Kirton, M. (1976), “Adaptors and Innovators: A Description and Measure”, Journal of Applied Psychology 61, 622-629.
Koestler, (1967), “The Ghost in the Machine”, Pan Edition, London.
Kuhn, T. (1970), “The Structure of Scientific Revolutions, 2nd edition, University of Chicago Press, Chicago.
Laursen, K. and N. J. Foss, (2003), New human resource management practices, complementarities and the impact on innovation performance, Cambridge Journal of Economics 27 (2), 243-263.
Laursen, K. and A. Salter, (2006), Open for innovation: the role of openness in explaining innovation performance among UK manufacturing firms, Strategic Management Journal 27 (2), 131-150.
Levin, S. and P. Stephan (1991), “Research Productivity Over the Life Cycle: Evidence for Academic Scientists”, American Economic Review 81 (1), 114-132.
Levinthal, D. and J. March (1993), “The Mypopia of Learning”, Strategic Management Journal 14 (1), 95-112.
Lissoni, F. and F. Montobbio (2008), “Inventorship and Authorship as Attribution Rights: An Enquiry in the Economics of Scientific Credit” CESPROI Working Paper 224, Università Bocconi, Milan.
Looy, van B., Callaert J.and K. Debackere (2006), “Publication and Patent Behaviour of Academic Researchers: Conflicting, Reinforcing or merely Co-existing, Research Policy 35 (4), 596-608.
Madjar, N., E. Greenberg and Z. Chen (2011), “Factors for Radical Creativity, Incremental Creativity, and Routine, Noncreative Performance”, Journal of Applied Psychology 96 (4), 730 – 743.
Mansfield, R. and T. Busse (1981), “The Psychology of Creativity and Discovery – Scientists and Their Work”, Nelson-Hall, Chicago.
March, J. (1993), “Exploration and Exploitation in Organizational Learning”, Organization Science 2 (1), 71-87.
Mariani, M. and M. Romanelli (2007), ““Stacking“ and “Picking“ Inventions: The Patenting Behavior of European Inventors“, Research Policy 36, 1128-1142.
Martin, B. and J. Irvine (1983), “Assessing basic research: Some partial indicators of scientific progress in radio astronomy”, Research Policy 12(2), 61-90.
McCrae, R. (1987), “Creativity, Divergent Thinking, and Openness to Experience”, Journal of Personality and Social Psychology 62 (6), 1258-1265.
Melero, E., and N. Palomeras (2012), “The Renaissance of the Renaissance Man? Specialists vs Generalists in Teams of Inventors“ INDEM Working Paper 12-01, Universidad Carlos III, Madrid.
Mieg, H., Bedenk, S. Braun, S. and F. Neyer (2012), “How Emotional Stability and Openness to Experience Support Invention: A Study with German Independent Inventors”, Creativity Research Journal 23 (2-3), 200-207.
Mischel, W. and Y. Shoda (2008), "Toward a Unifying Theory of Personality: Integrating Dispositions and Processing Dynamics within the Cognitive-Affective Processing System." in Handbook of Personality Psychology. O. John, R. Robins and L. Pervin, eds., New York, Guilford Press, 209-241.
Morgeson, F., K. Delaney-Klinger and M. Hemingway (2005), “The Importance of Job Autonomy, Cognitive Ability, and Job-Related Skill for Predicting Role Breadth and Job Performance“, Journal of Applied Psychology 90 (2), 399-406.

29
Morgeson, F., Campion, M, Dipboye, R., Hollenbeck, J, Murphy, K. and N. Schmitt (2007), “Reconsidering the Use of Personality Tests in Personnel Selection Contexts”, Personnel Psychology 60, 683-729.
Nagaoka, S., Walsh, J. (2009), “Who invents? Evidence from the Japan & US inventor survey“, RIETI
Discussion Papers, online available at http://www.rieti.go.jp/jp/publications/ dp/09e034.pdf?origin=publication_ detail, accessed on August 24, 2014.
Nakajima, R., R. Tamura and N. Hanaki (2010), “The Effect of Collaboration Network on Inventors´Jo Match, Productivity and Tenure, Labour Economics 17 (4), 723-734.”
Nelson, R. (1959), “The economics of invention: A survey of the literature“, Journal of Business 32(2) 101–127.
Oldham, G. and A. Cummings (1996), “Employee Creativity: Personal and Contextual Factors at Work”, Academy of Management Journal 39(3), 607-634.
Ones, D., S. Dilchert, C. Viswesvaran and T. Judge (2007), “In Support of Personality Assessment in Organizational Settings”, Personnel Psychology 60, 995-1027.
Pilkington, A., L. Lee, C. Chan and S. Ramakrishna (2009), “Defining Key Inventors: A Comparison of Fuel Cell and Nanotechnology Industries”, Technological Forecasting and Social Change 76, 118-127.
Roberts, B., P. Harms, J. Smith, D. Wood and M. Webb (2006), “Using Multiple Methods in Personality Psychology”, in M. Eid and E. Diener (eds.) Handbook of Multimethod Measurement in Psychology, American Psychological Association, Washington DC, 321-335.
Roberts, B., N. Kuncel, R. Shiner, A. Caspi and L. Goldberg (2007), “The Power of Personality: The Comparative Validity of Personality Traits, Socioeconomic Status, and Cognitive Ability for Predicting Important Life Outcomes”, Perspectives on Psychological Science 2(4), 313-345.
Runco, M. (1991), “Divergent Thinking”, Ablex Publishing, Norwood, NJ.
Runco, M. (2004), “Creativity“, Annual Review of Psychology 55, 657-687.
Sauerman, H. and W. Cohen (2010), “What Makes Them Tick? Employee Motives and Firm Innovation”, Management Science 56 (12), 2134-2153.
Schettino, F., A. Sterlacchini and F. Venturini (2013), “Inventive Productivity and Patent Quality: Evidence from Italian Inventors”, Journal of Policy Modelling 35 (6), 1043-1056.
Schmeichel, B., K. Vohs and R. Baumeister (2003), “Intellectual Performance and Ego Depletion: Role of the Self in Logical Reasoning and Other Information Processing”, Journal of Personality and Social Psychology 85 (1), 33-46.
Schmoch, U. (2008), Concept of a technology classification for country comparisons: Final report to the World Intellectual Property Organisation (WIPO). Fraunhofer Institute for Systems and Innovation Research, online available at http://www.wipo.int/export/sites/www/ipstats/en/ statistics/patents/pdf/wipo_ipc_technology.pdf, accessed on August 23, 2014.
Schmookler, J. (1962), “Economic Sources of Inventive Activity”, Journal of Economic History 22(1), 1–20.
Schupp, J., and J.-Y. Gerlitz (2008), “Informationen zum Big Five Inventory-SOEP“, in: Glöckner-Rist, A. (eds.), Zusammenstellung sozialwissenschaftlicher Items und Skalen, Bonn, online available at http://www.jschupp.privat.t-online.de/papers/Schupp_Gerlitz_2008.pdf, accessed on July 7, 2012.
Scott, S., and R. Bruce (1994), “Determinants of Innovative Behavior: A Path Model of Individual Innovation in the Workplace”, Academy of Management Journal 37 (3), 580-607.

30
Segal, C. (2012), “Working When No One is Watching: Motivation, Test Scores, and Economic Success”, Management Science 58 (8), 1438-1457.
Silvia, P., B. Winterstein, J. Willse, C. Barona, J. Cram, K. Hess, J. Martinez and C. Richard (2008), “Assessing Creativity with Divergent Thinking Tasks: Exploring the Reliability and Validity of new Subjective Scoring Methods”, Psychology of Aesthetics, Creativity and the Arts 2, 68 – 85.
Simonton, D. (2003), “Expertise, Competence, and Creative Ability: The Perplexing Complexities, in: R. Sternberg, E. Grigorenko (eds): “The Psychology of Abilities, Competencies, and Expertise, Cambridge University Press, N. Y., 216 – 239.
Simonton, D. (2004), “Creativity in Science: Chance, Logic, Genius and Zeitgeist”, Cambridge University Press, N.Y..
Smith, W., L. Albright, J. Glennon and W. Owens (1961), “The Prediction of Research Competence and Creativity from Personal History”, Journal of Applied Psychology 45 (1), 59-62.
Spence, M. (1973), “Job Market Signalling”, Quarterly Journal of Economics 87(3), 355-374.
Sternberg, R. (1999), “A Propulsion Model of Types of Creative Contributions”, Review of General Psychology 3 (2), 83-100.
Sung, S. and J. Choi (2009), „Do big five personality factors affect individual creativity? The moderating role of extrinsic motivation, Social Behavior and Personality 37(7), 941-956.
Tamer Cavusgil, S., R. J. Calantone, and Y. Zhao, (2003), Tacit knowledge transfer and firm innovation capability, Journal of Business & Industrial Marketing 18 (1), 6-21.
Tett, R. and N. Christiansen (2007), “Personality Tests at the Crossroads: A Response to Morgeson, Campion, Dipboye, Hollenbeck, Murphy, and Schmitt”, Personnel Psychology 60 (4), 967-993.
Toivanen, O. and L. Väänänen (2012). “Returns to Inventors,” Review of Economics and Statistics, 94 (4), 1173-1190.
Trajtenberg, M. (1990), “A Penny for Your Quotes: Patent Citations and the Value of Innovations”, Rand Journal of Economics 21(1), 172-187.
Turner, L. and J. Mairesse (2005), “Productivity Differences across individuals in Public Research: An Econometric Study of French Physicists´ Publications and Citations (1980-1997)” mimeo.
Walsh, J. and S. Nagaoka (2009), “Who Invents?: Evidence from the Japan-U.S. Inventor Survey, RIETI Discussion Paper Series 09-E-034, Tokyo.
Woodman, R., J. Sawyer and R. Griffin (1993), “Toward a Theory of Organizational Creativity”, Academy of Management Review 18 (2), 293-321.

31
Tables
Table 1: Sample sizes and number of responses, by technology field
Technology field Sample size (# inventors)
Responses (N)
Response rate
[percent]
Corrected response
rate [percent]
Clean technology (CT) 5,911 (all) 1,174 19.9
Mechanical elements (ME) 2,402 (random
sample A)) 526 21.9
Total 8,313 1,700 20.4 29.5
Note: A) Random sample drawn from a total of 6,856 ME inventors.
Table 2: Variable descriptions and descriptive results (N = 1,034)
VARIABLES Mean Median S.D. Description
Number of patent applications (inventor-level), whole counts
8.30 5.00 10.92 Total number of patents per inventor (1978–2010)
Number of patent applications (inventor-level), fractional counts
3.49 1.73 5.11 Total number of patents per inventor divided by number of co-inventors
Number of citations (inventor-level), whole counts
8.02 3.00 15.26 Total number of citations per inventor (1978-2010)
Number of citations (inventor-level), fractional counts
2.97 1.00 5.77 Total number of citations per inventor divided by number of co-inventors
ln(inventive performance+1) 0.06 0.03 0.09 ln of sum of dummy variables taking the value = 1 if a patent receives more (fractional) citations than average of all patents in same technology field and year, divided by number of working years plus one, ln
ln (inventor age in 2010) 3.85 3.85 0.19 ln of inventor age in 2010
Birth year after 1970 0.17 Dummy = 1 if inventor was born after 1970 (reference category)
Birth year 1966–1970 0.22 Dummy = 1 if inventor was born between 1966 and 1970
Birth year 1961–1965 0.23 Dummy = 1 if inventor was born between 1961 and 1965
Birth year 1956–1960 0.14 Dummy = 1 if inventor was born between 1956 and 1960
Birth year 1951–1955 0.11 Dummy = 1 if inventor was born between 1951 and 1955
Birth year 1946–1950 0.13 Dummy = 1 if inventor was born between 1946 and 1950
Vocational education 0,09 Dummy = 1 if highest level of education is vocational education in 2010 (reference category)
Academic education 0.61 Dummy = 1 if highest level of education is academic education
PhD 0.30 Dummy = 1 if highest level of education is PhD

32
Table 2: Variable descriptions and descriptive results (N = 1,034) (continued) VARIABLES Mean Median S.D. Description
Share of R&D-intensive work 0.64 Dummy = 1 if share of R&D work for more than half of the working time is larger than 0.35 on average (1965–2010)
Generalist work experience 0.40 Dummy = 1 if share of generalist work experience during career is 100% (1965–2010)
Neither systematic nor divergent problem-solving
0.07 Dummy = 1 if not all answers in CRT test are solved correctly and at least one answer is solved intuitively (reference), 2014
Intuitive problem-solving 0.35 Dummy = 1 if at least one answer in CRT test is solved intuitively, 2014
Systematic problem-solving 0.58 Dummy = 1 if all answers in CRT test are solved correctly, 2014
Divergent thinking 0.10 0 0.30 Dummy = 1 if median value of assessed creativity of answers in unusual uses task is 2.7 or higher, 2014
Positive risk attitude 0.40 Dummy = 1 if self-assessed risk attitude 7 or larger on scale between 0 and 10, 2014
Career motivation: extrinsic motivation
19.02 19.81 4.54 Factor from factor analysis on 16 questions on career motivation, 2014
Career motivation: intrinsic motivation
19.52 20.06 3.77 Factor from factor analysis on 16 questions on career motivation
Career motivation: value-related motivation
12.17 12.49 3.08 Factor from factor analysis on 16 questions on career motivation
Career motivation: leadership motivation
6.76 6.91 2.48 Factor from factor analysis on 16 questions on career motivation
Big 5: extraversion 49.97 49.71 15.59 Factor from factor analysis on 15 questions on personality traits, 2014
Big 5: neuroticism 49.96 49.56 11.03 Factor from factor analysis on 15 questions on personality traits
Big 5: openness 50.04 50.73 18.13 Factor from factor analysis on 15 questions on personality traits
Big 5: agreeableness 50.48 50.01 12.29 Factor from factor analysis on 15 questions on personality traits
Big 5: conscientiousness 50.27 50.69 11.99 Factor from factor analysis on 15 questions on personality traits
Applicant size: 1 patent 0.03 Share of applicant firms with 1 patent (1978–2010)
Applicant size: 2–24 patents 0.16 Share of applicant firms with 2–24 patents
Applicant size: 25–249 patents 0.21 Share of applicant firms with 25–249 patents
Applicant size: 250–999 patents 0.13 Share of applicant firms with 250–999 patents
Applicant size: 1000–9999 patents
0.47 Share of applicant firms with more than 1,000 patents
Applicant type: private company 0.94 Share of applicant private companies
Applicant type: university/research institute
0.04 Share of applicant university/research institutes
Applicant type: individual 0.02 Share of individual applicants
Patent application pending 0.38 Share of pending patents
Patent application withdrawn 0.15 Share of withdrawn patents
Patent application refused 0.01 Share of refused patents
Patent application granted 0.47 Share of granted patents

33
Table 2: Variable descriptions and descriptive results (N = 1,034) (continued)
VARIABLES Mean Median S.D. Description
Electrical machinery, apparatus, energy 0.13
Area share of patents at inventor level in the respective technological field
Electrical engineering 0.02
Semiconductors 0.04
Instruments 0.05
Chemistry 0.03
Materials/surface technology/chemical engineering/environmental technology 0.12
Mechanical engineering 0.10
Engines, pumps, turbines 0.15
Mechanical elements 0.21
Transport 0.10
Other fields 0.05

34
Table 3: Regression results, models with different individual-level determinants
(Model 1a) (Model 1b) (Model 1c) (Model 1d)
VARIABLES ln(inventive
performance + 1) ln(inventive
performance+ 1) ln(inventive
performance + 1) ln(inventive
performance + 1)
academic education 0.177** 0.176** 0.173** 0.146* [0.077] [0.076] [0.076] [0.077] PhD degree 0.439*** 0.430*** 0.419*** 0.390*** [0.130] [0.127] [0.127] [0.131] Birth year 1966–1970 -0.017* -0.017 -0.017 -0.015 [0.010] [0.010] [0.011] [0.011] Birth year 1961–1965 -0.034*** -0.032*** -0.032*** -0.033*** [0.007] [0.008] [0.010] [0.010] Birth year 1956–1960 -0.034*** -0.026*** -0.025*** -0.036*** [0.011] [0.009] [0.009] [0.010] Birth year 1951–1955 -0.054*** -0.047*** -0.047*** -0.056*** [0.010] [0.009] [0.009] [0.009] Birth year 1946–1950 -0.048*** -0.041*** -0.041*** -0.054*** [0.011] [0.010] [0.011] [0.011] Intensive R&D work 0.121** 0.123** 0.121** [0.059] [0.058] [0.061] Generalist work experience -0.010 -0.002 0.020 [0.057] [0.056] [0.057]
Systematic problem-solving 0.198** 0.223*** [0.078] [0.080] Intuitive problem-solving 0.211** 0.238*** [0.094] [0.091] Divergent thinking 0.216** 0.208** [0.096] [0.094]
Risk attitude 0.126** [0.059] Big 5: extraversion -0.007** [0.003] Big 5: neuroticism 0.000 [0.003] Big 5: openness 0.008*** [0.002] Big 5: agreeableness 0.002 [0.003] Big 5: conscientiousness -0.006*** [0.002] Career motivation: extrinsic motivation -0.012 [0.010] Career motivation: intrinsic motivation 0.003 [0.016] Career motivation: value-related 0.023 Motivation [0.015] Career motivation: leadership -0.017 Motivation [0.018]
Constant 0.192** 0.088** 0.064* 0.077 [0.095] [0.036] [0.038] [0.047]
Akaike Information Criterion -2030.963 -2029.830 -2033.118 -2049.624
Observations 1034 1034 1034 1034 R
2 0.131 0.134 0.141 0.171
Notes: All time-varying explanatory variables are calculated for the time period between job entry and the year 2010. All explanatory variables are divided by 10, besides dummies. Reference categories: vocational education, birth year later than 1970, neither intuitive nor systematic problem-solving. AAdditional controls included but not reported in the table: technical areas (shares), periods (shares), applicant size and
type (shares), and patent status (shares). Robust standard errors based on modal applicant identificator in brackets. Significance levels: *** p < 0.01, ** p < 0.05, * p < 0.1.

35
Table 4: Regression results, robustness checks with patent citation numbers and patent numbers.
(Model 2a)
Citation Numbers (Model 2b)
Patent Numbers
VARIABLES ln(average number of citations
per work year + 1) ln(average number of patents
per work year)
Academic education 0.315** 0.326** [0.153] [0.139] PhD degree 0.658** 0.810*** [0.263] [0.215] Birth year 1966–1970 -0.027 -0.540*** [0.021] [0.119] Birth year 1961–1965 -0.049*** -0.758*** [0.017] [0.128] Birth year 1956–1960 -0.044** -0.938*** [0.020] [0.169] Birth year 1951–1955 -0.095*** -1.255*** [0.022] [0.128] Birth year 1946–1950 -0.087*** -1.400*** [0.021] [0.170] Share of intensive R&D work 0.245* 0.290** [0.128] [0.116] Share of generalist work experience 0.072 0.070 [0.124] [0.125]
Systematic problem-solving 0.448** 0.414** [0.195] [0.182] Intuitive problem-solving 0.509** 0.325* [0.211] [0.187] Divergent thinking 0.375** 0.163 [0.187] [0.179]
Risk attitude 0.262* 0.194* [0.145] [0.116] Big 5: extraversion -0.018*** -0.017*** [0.006] [0.006] Big 5: neuroticism 0.003 -0.002 [0.005] [0.005] Big 5: openness 0.014*** 0.019*** [0.004] [0.005] Big 5: agreeableness 0.004 -0.003 [0.007] [0.006] Big 5: conscientiousness -0.013*** -0.006 [0.005] [0.004] Career motivation: extrinsic -0.034 -0.044** [0.021] [0.021] Career motivation: intrinsic 0.002 0.036 [0.032] [0.032] Career motivation: values 0.057* 0.031 [0.033] [0.030] Career motivation: leadership -0.012 -0.024 [0.042] [0.035]
Constant 0.174** 2.000** [0.087] [0.788]
Observations 1034 1034 R-squared 0.211 0.293
Notes: All explanatory variables are calculated for the time period between job entry and the year 2010. AAdditional controls included but not reported in the table: technical areas (shares), periods (shares), applicant size and
type (shares), and patent status (shares). Robust standard errors based on modal applicant identificator in brackets. Significance levels: *** p < 0.01, ** p < 0.05, * p < 0.1.

36
Figure
Figure 1: Model of individual-level drivers of inventive performance

37
Appendix
Table A1: Factor analysis Big 5
Variables: I am someone who ...
Factor 1 Extraversion
Factor 2 Neuroticis
m
Factor 3 Open to
new ideas
Factor 4 Agreeablen
ess
Factor 5 Conscienti
ousness
works thoroughly -0.0788 0.0951 0.0333 0.1146 0.8024 is communicative and talkative 0.8052 -0.0328 0.1760 0.1103 0.1590 sometimes is a little rough, harsh to others 0.1257 0.2552 0.1814 -0.7195 0.0258 is original and brings new ideas 0.1902 -0.0083 0.7630 -0.0702 0.1155 worries often -0.0792 0.7583 0.1228 -0.0948 0.1246 can forgive 0.2636 0.0803 0.0606 0.5831 0.0306 is rather lazy -0.1022 0.1097 0.2384 -0.0839 -0.6801 is outgoing and social 0.7926 -0.0506 0.1947 0.0911 -0.0327 appreciates artistic experience 0.1322 0.0081 0.5325 0.2202 -0.1461 easily gets nervous -0.0901 0.7846 0.0486 -0.0148 -0.0736 performs tasks effectively and efficiently 0.0875 0.1415 0.2337 -0.0268 0.6739 is reserved 0.7111 0.1829 -0.0232 0.3229 0.1305 interacts friendly and considerately with others 0.0204 0.0386 0.1377 0.8126 0.1494 has a vivid imagination 0.1309 0.0022 0.8014 0.0475 -0.0318 is relaxed and is good at dealing with stress 0.0660 0.7105 0.2641 0.1090 01346
Notes: The exact question was: “Our everyday actions are influenced by our core beliefs. In science, however, there is still very little knowledge about this. Therefore, the following section contains questions on various characteristics a person can have. Some questions will pertain more or less to you, and for some question you may be undecided.” The Kaiser-Mayer-Olkin measure of sampling adequacy gives values above 0.6 for each variable and an overall value of 0.68. Bartlett’s test of sphericity is significant at the 1% level with a chi-square value of 4739.
Table A2: Factor analysis career motivation
Variables
Factor 1 Extrinsic
motivation
Factor 2 Intrinsic
motivation
Factor 3 Values
Factor 4 Management
Secure job 0.8490 0.0785 0.0930 -0.0603 Good career opportunities 0.7596 0.0762 0.0531 0.3885 Attractive employer 0.7642 0.1777 0.1486 0.1009 Commitment to environmental issues 0.0769 0.1385 0.8486 -0.004 Involvement in social and political issues 0.1180 0.0872 0.8543 0.1039 Interdisciplinary work 0.0541 0.4468 0.4454 0.2273 Job as an expert 0.1942 0.6989 0.0143 -0.1977 Self-determined work 0.3052 0.6936 0.0823 0.1173 Regular working hours 0.6339 0.1903 0.1363 -0.4096 Development of new expertise 0.1920 0.6204 0.2070 0.1553 Promising technology field 0.2675 0.6211 0.2607 0.1839 Above average salary 0.6448 0.3687 -0.0852 0.2654 Desire to help develop breakthrough technologies -0.0270 0.6186 0.3127 0.2047 Starting own business -0.1506 0.1791 0.1546 0.6164 Assumption of management tasks 0.2665 0.0877 0.0913 0.7897 Work-life balance 0.4964 0.2520 0.2062 -0.1031
Notes: The exact question was: “How important were the following reasons for your decision-making process when entering into your working career in choosing one job over another?” The Kaiser-Mayer-Olkin measure of sampling adequacy gives values above 0.6 for each variable and an overall value of 0.85. Bartlett’s test of sphericity is significant at the 1% level with a chi-square value (degrees of freedom) of 8212 (120).
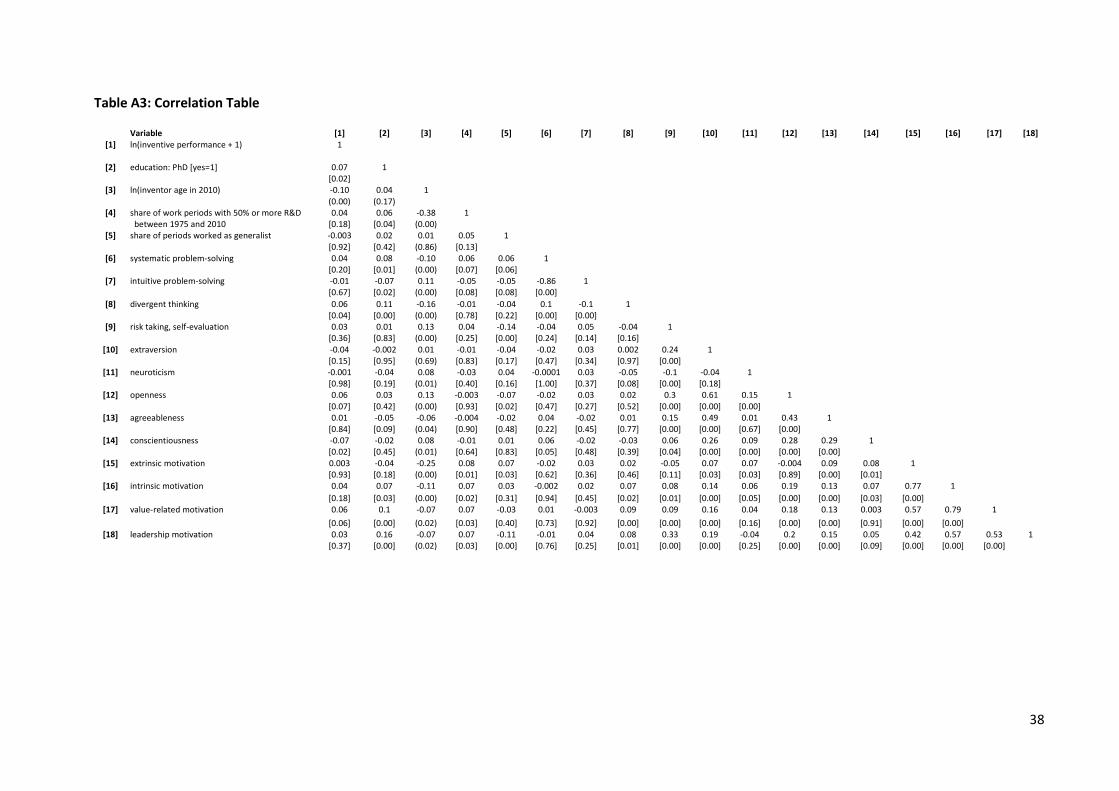
38
Table A3: Correlation Table
Variable [1] [2] [3] [4] [5] [6] [7] [8] [9] [10] [11] [12] [13] [14] [15] [16] [17] [18]
[1] ln(inventive performance + 1) 1
[2] education: PhD [yes=1] 0.07 1
[0.02]
[3] ln(inventor age in 2010) -0.10 0.04 1
(0.00) (0.17)
[4] share of work periods with 50% or more R&D 0.04 0.06 -0.38 1
between 1975 and 2010 [0.18] [0.04] (0.00)
[5] share of periods worked as generalist -0.003 0.02 0.01 0.05 1
[0.92] [0.42] (0.86) [0.13]
[6] systematic problem-solving 0.04 0.08 -0.10 0.06 0.06 1
[0.20] [0.01] (0.00) [0.07] [0.06]
[7] intuitive problem-solving -0.01 -0.07 0.11 -0.05 -0.05 -0.86 1
[0.67] [0.02] (0.00) [0.08] [0.08] [0.00]
[8] divergent thinking 0.06 0.11 -0.16 -0.01 -0.04 0.1 -0.1 1
[0.04] [0.00] (0.00) [0.78] [0.22] [0.00] [0.00]
[9] risk taking, self-evaluation 0.03 0.01 0.13 0.04 -0.14 -0.04 0.05 -0.04 1
[0.36] [0.83] (0.00) [0.25] [0.00] [0.24] [0.14] [0.16]
[10] extraversion -0.04 -0.002 0.01 -0.01 -0.04 -0.02 0.03 0.002 0.24 1
[0.15] [0.95] (0.69) [0.83] [0.17] [0.47] [0.34] [0.97] [0.00]
[11] neuroticism -0.001 -0.04 0.08 -0.03 0.04 -0.0001 0.03 -0.05 -0.1 -0.04 1
[0.98] [0.19] (0.01) [0.40] [0.16] [1.00] [0.37] [0.08] [0.00] [0.18]
[12] openness 0.06 0.03 0.13 -0.003 -0.07 -0.02 0.03 0.02 0.3 0.61 0.15 1
[0.07] [0.42] (0.00) [0.93] [0.02] [0.47] [0.27] [0.52] [0.00] [0.00] [0.00]
[13] agreeableness 0.01 -0.05 -0.06 -0.004 -0.02 0.04 -0.02 0.01 0.15 0.49 0.01 0.43 1
[0.84] [0.09] (0.04) [0.90] [0.48] [0.22] [0.45] [0.77] [0.00] [0.00] [0.67] [0.00]
[14] conscientiousness -0.07 -0.02 0.08 -0.01 0.01 0.06 -0.02 -0.03 0.06 0.26 0.09 0.28 0.29 1
[0.02] [0.45] (0.01) [0.64] [0.83] [0.05] [0.48] [0.39] [0.04] [0.00] [0.00] [0.00] [0.00]
[15] extrinsic motivation 0.003 -0.04 -0.25 0.08 0.07 -0.02 0.03 0.02 -0.05 0.07 0.07 -0.004 0.09 0.08 1
[0.93] [0.18] (0.00) [0.01] [0.03] [0.62] [0.36] [0.46] [0.11] [0.03] [0.03] [0.89] [0.00] [0.01]
[16] intrinsic motivation 0.04 0.07 -0.11 0.07 0.03 -0.002 0.02 0.07 0.08 0.14 0.06 0.19 0.13 0.07 0.77 1
[0.18] [0.03] (0.00) [0.02] [0.31] [0.94] [0.45] [0.02] [0.01] [0.00] [0.05] [0.00] [0.00] [0.03] [0.00]
[17] value-related motivation 0.06 0.1 -0.07 0.07 -0.03 0.01 -0.003 0.09 0.09 0.16 0.04 0.18 0.13 0.003 0.57 0.79 1
[0.06] [0.00] (0.02) [0.03] [0.40] [0.73] [0.92] [0.00] [0.00] [0.00] [0.16] [0.00] [0.00] [0.91] [0.00] [0.00]
[18] leadership motivation 0.03 0.16 -0.07 0.07 -0.11 -0.01 0.04 0.08 0.33 0.19 -0.04 0.2 0.15 0.05 0.42 0.57 0.53 1
[0.37] [0.00] (0.02) [0.03] [0.00] [0.76] [0.25] [0.01] [0.00] [0.00] [0.25] [0.00] [0.00] [0.09] [0.00] [0.00] [0.00]
Related Documents


![Design Alternatives and TRIZ PLM World 06.ppt [Read-Only] · Altshuller identified 40 common Inventive Principles used in inventive solutions: The 40 Inventive Principles are used](https://static.cupdf.com/doc/110x72/5ea23a55b9004e19cc4221b7/design-alternatives-and-triz-plm-world-06ppt-read-only-altshuller-identified.jpg)