Journal of Air Transport Management 13 (2007) 53–60 The potential of rotorcraft for intercity passenger transport Vincenzo Correnti a , Salvatore Caprı` b , Matteo Ignaccolo b , Giuseppe Inturri b, a Dipartimento di Ingegneria Aeronautica e Trasporti, University of Palermo viale delle Scienze, Palermo, Italy b Dipartimento di Ingegneria Civile e Ambientale, University of Catania viale Andrea Doria 6, Catania, Italy Abstract There are many high-speed rail projects in Europe at different stages of development. They are supported on environmental grounds and as a means of reducing congestion on other modes, including aviation. High-speed rail, however requires major investment costs, takes a long time to come online, and involves considerable financial risks. A potential alternative that overcomes some of these problems makes use of rotorcrafts. This paper assesses the potentiality of civil rotorcrafts as part of the air transport system. Discrete mode choice models are used to forecast traveller choice behaviour when the rotorcraft is introduced and financial evaluations performed looking at the operating costs of the competing transport modes. r 2006 Elsevier Ltd. All rights reserved. Keywords: Rotorcraft; Mode choice modelling; Discrete choice analysis; Air passenger services 1. Introduction Air transport liberalization has generally led to the development of hub-and-spoke networks, often involving high-frequency services using relatively small aircraft. Increased congestion, however, has led to increased levels of congestion at many airports with passengers having extended waits for connecting flights. This has a knock-on effects on air traffic conrol (Cokasova, 2003). In accord with the guidelines set out in a European Union White Paper (Commission of the European Com- munities, 2001), available airport capacity in Europe will not be able handle predicted growth in air traffic under existing regimes. The potential for constructing additional airport infrastructures is limited and this leads to the seeking of more efficient use of existing airport capacity and consideration of alternatives to air travel such as high- speed rail (HSR). A significant move to the latter, however, would require considerable expansion of the network. 1 The purported benefits of HSR lie in its environmental features—notably, its use of electric propulsion and its high capacity that could relieve congestion at airports. From the traveller’s perspective, HSR may be a good mode for medium length journeys, as the advantages of flying diminish over distances up to about 400 km when there are land-side access and egress problems posed by congestioned ground links and congestion within airports. On the other hand, HSR projects involve large investment costs; have significant environmental impacts due to the huge civil works involved; entail long construction times; and can incur high financial risks. Rotorcraft may offer an alternative that circumvents the lack in airport capacity and the HSR drawbacks. 2 Modern rotorcrafts can generally be used in all weather conditions and can continue flying with one inoperative engine. Flight cruising speeds have increased with modern helicopters into a 240–300 km/h range. A tiltrotors offer even greater performance with cruising speeds of 500 km/h, which is comparable to fixed wing commercial airplanes ARTICLE IN PRESS www.elsevier.com/locate/jairtraman 0969-6997/$ - see front matter r 2006 Elsevier Ltd. All rights reserved. doi:10.1016/j.jairtraman.2006.11.009 Corresponding author. E-mail address: [email protected] (G. Inturri). 1 There are 3039 km of high-speed lines in operation in Europe, 2723 under construction and 1875 at the planning stage (International Union of Railways, 2005). 2 Rotorcrafts involve aircraft with one or more rotors supplying both aerodynamic suspension and propulsion. They are a form of vertical take- off and landing (VTOL) aircraft, a category to which the helicopter traditionally belongs and, more recently, the tiltrotor. This latter uses two blade rotors tilting around the transversal axis and can perform with the flexibility of a helicopter during approach, take-off and landing, while flying at the speed and with the operating costs of a fixed wing when cruising (Correnti et al., 2006).

Welcome message from author
This document is posted to help you gain knowledge. Please leave a comment to let me know what you think about it! Share it to your friends and learn new things together.
Transcript
ARTICLE IN PRESS
0969-6997/$ - se
doi:10.1016/j.ja
�CorrespondE-mail addr
1There are 3
under construct
Railways, 2005
Journal of Air Transport Management 13 (2007) 53–60
www.elsevier.com/locate/jairtraman
The potential of rotorcraft for intercity passenger transport
Vincenzo Correntia, Salvatore Caprı̀b, Matteo Ignaccolob, Giuseppe Inturrib,�
aDipartimento di Ingegneria Aeronautica e Trasporti, University of Palermo viale delle Scienze, Palermo, ItalybDipartimento di Ingegneria Civile e Ambientale, University of Catania viale Andrea Doria 6, Catania, Italy
Abstract
There are many high-speed rail projects in Europe at different stages of development. They are supported on environmental grounds
and as a means of reducing congestion on other modes, including aviation. High-speed rail, however requires major investment costs,
takes a long time to come online, and involves considerable financial risks. A potential alternative that overcomes some of these problems
makes use of rotorcrafts. This paper assesses the potentiality of civil rotorcrafts as part of the air transport system. Discrete mode choice
models are used to forecast traveller choice behaviour when the rotorcraft is introduced and financial evaluations performed looking at
the operating costs of the competing transport modes.
r 2006 Elsevier Ltd. All rights reserved.
Keywords: Rotorcraft; Mode choice modelling; Discrete choice analysis; Air passenger services
2Rotorcrafts involve aircraft with one or more rotors supplying both
1. Introduction
Air transport liberalization has generally led to thedevelopment of hub-and-spoke networks, often involvinghigh-frequency services using relatively small aircraft.Increased congestion, however, has led to increased levelsof congestion at many airports with passengers havingextended waits for connecting flights. This has a knock-oneffects on air traffic conrol (Cokasova, 2003).
In accord with the guidelines set out in a EuropeanUnion White Paper (Commission of the European Com-munities, 2001), available airport capacity in Europe willnot be able handle predicted growth in air traffic underexisting regimes. The potential for constructing additionalairport infrastructures is limited and this leads to theseeking of more efficient use of existing airport capacityand consideration of alternatives to air travel such as high-speed rail (HSR). A significant move to the latter, however,would require considerable expansion of the network.1
The purported benefits of HSR lie in its environmentalfeatures—notably, its use of electric propulsion and its high
e front matter r 2006 Elsevier Ltd. All rights reserved.
irtraman.2006.11.009
ing author.
ess: [email protected] (G. Inturri).
039 km of high-speed lines in operation in Europe, 2723
ion and 1875 at the planning stage (International Union of
).
capacity that could relieve congestion at airports. Fromthe traveller’s perspective, HSR may be a good mode formedium length journeys, as the advantages of flyingdiminish over distances up to about 400 km whenthere are land-side access and egress problems posed bycongestioned ground links and congestion within airports.On the other hand, HSR projects involve large investmentcosts; have significant environmental impacts due to thehuge civil works involved; entail long construction times;and can incur high financial risks. Rotorcraft may offer analternative that circumvents the lack in airport capacityand the HSR drawbacks.2
Modern rotorcrafts can generally be used in all weatherconditions and can continue flying with one inoperativeengine. Flight cruising speeds have increased with modernhelicopters into a 240–300 km/h range. A tiltrotors offereven greater performance with cruising speeds of 500 km/h,which is comparable to fixed wing commercial airplanes
aerodynamic suspension and propulsion. They are a form of vertical take-
off and landing (VTOL) aircraft, a category to which the helicopter
traditionally belongs and, more recently, the tiltrotor. This latter uses two
blade rotors tilting around the transversal axis and can perform with the
flexibility of a helicopter during approach, take-off and landing, while
flying at the speed and with the operating costs of a fixed wing when
cruising (Correnti et al., 2006).
ARTICLE IN PRESSV. Correnti et al. / Journal of Air Transport Management 13 (2007) 53–6054
(Zugschwert, 2001). Rotorcrafts play a part in a wide rangeof aviation activities, including law enforcement, firefighting, emergency medical services, traffic reporting andcorporate transportation.
This paper assesses the potentiality of the rotorcraft forimproving interurban passenger transportation networks.The main benefits of civil rotorcrafts may be seen as:
�
Reducing airport congestion and traffic delay, by usingon-airport vertiports to drain off short-haul travellersand so, releasing runway capacity for larger aircrafts.(Typically, at major hub airports, 25–30% of aircraftoperations are with regional aircraft seating up to 50passengers.) Rotorcraft vertical lift technology offers thepotentiality for separating a portion of these operationsfrom fixed-wing runways to VTOL sites and allowingmore of larger fixed-wing aircraft to use the runways(Stouffer et al., 2001; Roberts and Kostiuk, 1999;Correnti, 2006). � Reducing airport congestion and traffic delay, by usingoff-airport vertiports for city centre to city centreservices, shifting travellers from congested hub airportsand ground access roads.
� Increasing the economic life of an airport without largeinvestments.
� Increasing the effectiveness of the transport supply byproviding a door-to-door service with significant timesavings for travellers.
�3Ben Akiva and Lerman (1985) and Cascetta (1998) offer useful surveys
of mode choice analysis.
Providing access for smaller communities that lackairports or good surface transport infrastructure.
2. Previous analysis
The British Commission for Integrated Transport (2004)argues that the market for high-speed rail is strongestwhere distances between large cities are in the 300–600 kmrange. The European Commission (1996) COST 18 studypoints out that high-speed rail transport can successfullycompete with air mode when markets are large but that thelatter offers good development possibilities where thedemand is less. On a system wide basis, however, thereare zones where high-speed travel rail and air transport cancomplement each other, for example rail transport offeringaccess to airports. A US Congress Office of TechnologyAssessment (1991) found that magnetically levitatedvehicles (maglev) and tiltrotor aircraft are among thetechnologies that could improve US passenger mobilitywhere there are large terminals and in the most crowdedintercity corridors. Most approaches to modal choicesbetween air and other transportation modes, however haveinvolved looking at the impact high-speed train servicesmay have on the air transportation market in Europe(Eurocontrol, 2004).
A knowledge of factors affecting travellers’ modalchoices allows transport planners to design better infra-structure and traffic operations to match mobility demandsand allow transport companies to adopt the most effective
and efficient management strategy for attracting travellersto their businesses. Discrete choice models are widelyused to examine modal choices. They are based on therandom utility theory and allow the calculation of theprobability of individuals choosing a given option allowingfor their socioeconomic characteristics and of the relativeattractiveness of the options (Ortuzar and Willumsen,2004).3
The underlying assumption of discrete choice models isthat each decision-maker has a finite set of mutuallyexclusive alternatives that constitute the choice set and thatcan be explicitly listed and allowing the select of thealternative with the highest utility among those available.Utility is modeled as a function of observable independentvariables—attributes—and unknown parameters that areestimated from a sample of observed choices. Someattributes are generic to all alternatives and some arealternative-specific. Random utility models attempt tocapture the complexity of human behaviour: the decisionrule is assumed to be rational and deterministic (thedecision-maker always chooses the alternative with thehighest utility), but utility is represented as a randomvariable. In mathematical terms, this is done by separatingthe utility Ui
j that the decision maker i associates withmode j, into a deterministic component V i
j called systema-tic utility, and a random component ej,
Uij ¼ Vi
j þ �j. (1)
The random disturbance captures different sources ofuncertainty, such as unobserved attributes that influencethe decision, unobserved taste variations among differentcategories of individuals, or measurement errors on thevalues of attributes.A random utility model cannot define which alternative
will be chosen, but rather the probability of eachalternative being chosen. The probability is a monotonedecreasing function with the associated utility. Theprobability of any alternative j being selected by person i
from a choice set Ii is
Piðj=I iÞ ¼ PðUij4Ui
kÞ 8 kaj; k 2 I i or Piðj=I iÞ
¼ PðV ij � V i
k4�k � �jÞ 8 kaj; k 2 I i. ð2Þ
If the random terms of the utility functions areindependently distributed, identically distributed andGumbel distributed with parameter a, the probabilitymay be calculated by a multinomial logit model as
Pi jð Þ ¼eaVi
jPk2I i
eaVik
. (3)
ARTICLE IN PRESS
Table 1
Model attributes and relevant parameters
Attribute Estimated parameters
Model 1 Model 2 Model 4 Model 5
TIME �0.012 �0.012 �0.007 �0.008
FARE �0.004 �0.003
ln (PER) �0.586 �0.521
ASA �0.840 �0.660 �0.760 �0.631
General tests
R2 0.769 0.793 0.848 0.851
F-test 84.275 48.798 72.019 46.571
4Several studies that used aggregate fare measures failed to obtain the
expected signs for the fare variable (Windle and Dresner, 1995).5The impact of distance to airport terminals from cities may be
becoming more important as low cost carriers elect to use peripheral
terminals to reduce their airport charges.
V. Correnti et al. / Journal of Air Transport Management 13 (2007) 53–60 55
3. Methodology
Estimations here are based on a sample of 25 Europeancity pairs used in Eurocontrol (2004) with significant air/rail competition. The variables considered are:
3.1. Travel time
This is generally the most important choice attribute forboth business and leisure travellers. The main advantage ofHST is the short station access time compared to manyairports that are often sited far away from the city. Theoverall travel time for all the modes between each city paircan be decomposed into access and exit time to reach andleave the terminal; terminal time for check in and check outoperations; and on-board time.
3.2. Fare
Price elasticities vary by the purpose of the travel, beingsubstantially higher for leisure travellers. But the maincomplexity in dealing with fares, especially by air, lies inhandling the large number of ticket categories that is partof the revenue management strategies adopted by airlines.
3.3. Service frequency
The number of train or flight departures for each citypair affects on modal shares because more services reducefrequency delay, the elapsed time between an individualtraveller’s preferred time and the time of a scheduleddeparture (Viton, 1986). This can be defined as
PER ¼ ð60� 19Þ=N (4)
with N being the number of daily flights or train departuresbetween a selected city pair and 19 is the virtual number ofdaily service hours, taking into consideration the lack ofHSR service for part of the night. The model uses ln (PER)to reflect the fact that travellers exhibit higher demandelasticities when frequency is high.
3.4. Alternative specific attributes
The alternative specific attribute (ASA) or modalpreference reflects the influence of all the characteristicsof alternatives, such as comfort and reliability that are notimmediately observed or that are difficult to quantify. Itexpresses the preference for one transport mode when allother attributes are identical for alternatives.
The results from four model specifications are seen inTable 1; the general systematic utility function for thegeneric transport mode being:
VMODE ¼ bTIME TIMEMODE þ bFARE FAREMODE
þ bPER lnðPERMODEÞ þ bMODE MODE. ð5Þ
With regard to the relative importance of attributes, usersappear more responsive to travel time than to fare; a common
output in the mode choice process, especially for businesstravellers. Models 1 and 4 do not consider fare as a choicevariable while Models 2 and 5 exhibit a low fare coefficientprobably for two reasons. The first is the dominance ofbusiness trips for the selected city pairs, where fares aremainly oriented towards travellers who do not pay for theirtickets. The second is that fares are not well defined becauseof the fare discriminations practiced by the airlines.4
4. Case study
The issue here is whether HSR services may divert trafficfrom air transport on short haul routes because savings interminal access and exit times could compensate forits slower speed.5 Such a shift could bring benefits byalleviating problems caused by the lack of capacity atairports. Equally, similar benefits may be obtained usingrotorcrafts that take-off and land in small vertiports citedin the centre of cities without interfering with traditionalair traffic, with rapid access/exit to/from the terminals.Mode choice Models 4 and 5 are used to analyse
different scenarios and to assess to what extent civilrotorcrafts are capable of competing for market share overdifferent distances. An equilibrium iterative procedure isapplied with number of travellers choosing one transportmode among those available, which is affected by theservice frequency as set by the transport company as afunction of the traffic to be served. The iterative procedureinitially involves calculating the overall number of passen-gers, using a starting value for service frequency withfrequency continually recalculated as a function of thetraffic carried by each mode to produce a new modal share.Iterations continue until convergence. The market share ofmode j is dj and is calculated as
dj ¼ Pj � d (6)
with d being the demand between the origin and thedestination, and Pj the probability that mode j will be
ARTICLE IN PRESS
Table 2
Vehicle performances
Transport mode High-speed train Rotorcraft Airplane
Helicopter Tiltrotor
Vehicle type ETR 500 AB 139 BA 609 Boeing 737-300
Passenger capacity 450 15 9 128
Cruising speed (km/h) 300 310 510 800
Maximum range (with no reserve) (km) — 1000 1400 2500
Hourly productivity (Pax km/h) 94 4185 4130 92160
Door-to-door Travel Time
0
50
100
150
200
250
300
350
400
450
500
0 200 400 600 800 1000 1200 1400
distance (km)
min
ute
s
HST
B737 - 300
TILT BA609
HELI AB139
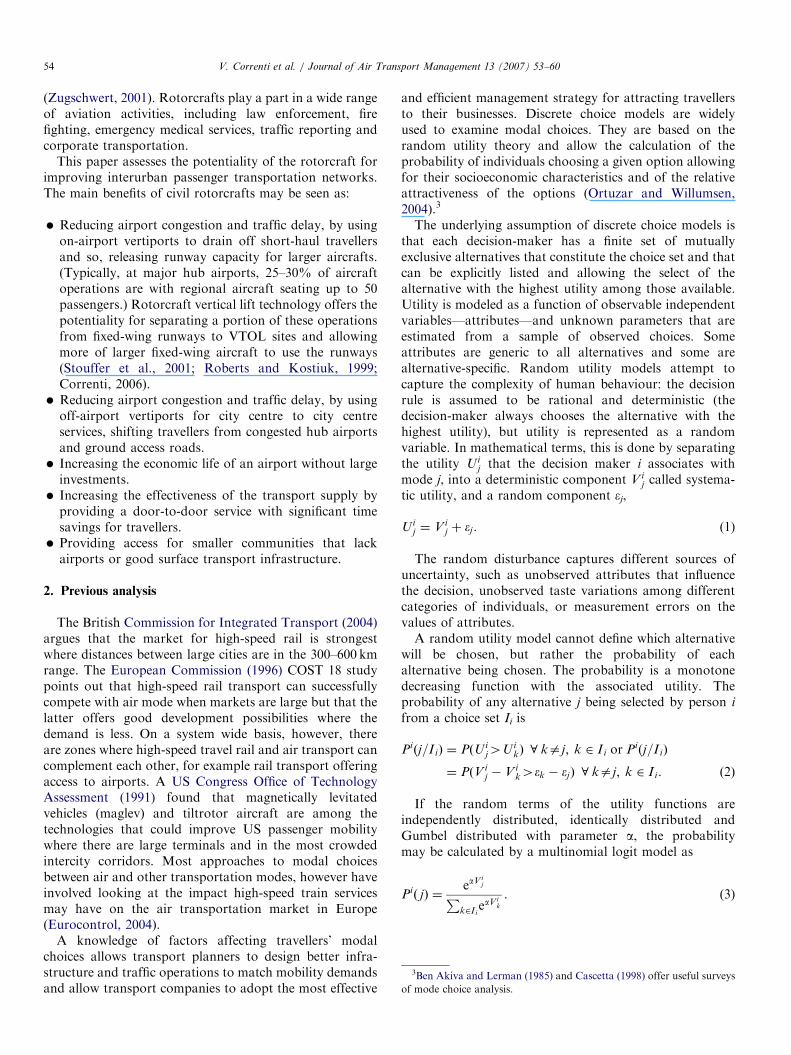
Fig. 1. Door to door travel time.
Table 3
Terminal related journey times
HS train (min) Airplane (min) Rotorcraft (min)
Access 20 50 20
Exit 20 50 20
Check-in 15 45 15
Check-out 5 20 5
V. Correnti et al. / Journal of Air Transport Management 13 (2007) 53–6056
chosen which is dependent on the utility associated withmode j that is influenced by the service frequency (the PER
attribute). The transport operator selects the servicefrequency as a function of the traffic demand to be served,
dj ¼ Pj V jðPERðdjÞÞ� �
� d. (7)
The fare variable affects this equilibrium procedurebecause it is calculated as the unit direct operating cost perpassenger km that is itself influenced by the market share.The technical specifications and performances of thevarious vehicles are seen in Table 2.
The AB139 is a medium twin-turbine helicopter devel-oped by Bell Agusta Aerospace and Agusta Westland andis taken as the helicopter mode with the tiltrotor being theBA609 developed by Bell Agusta Aerospace and AgustaWestland. (It has two composite three-bladed prop rotorson swivelling nacelles.) With its nacelles in the verticalposition, the tiltrotor is able to take-off, land and hoverlike a traditional helicopter while with nacelles in thehorizontal position, it is able to fly with the high-speed andrange of a turboprop fixed wing aeroplane. The Boeing737–300 is the fixed wing steriotype being the mostcommon narrow-bodied aircraft used on short haul flights.For the rail, the Italian ETR500 high-speed train is used; ithas two edge traction units, each equipped with asynchro-nous three-phase electric engines, supplied by a 3000V DCelectric line.
In terms of door-to-door travel time, for journeys of lessthan 400 km, the HST with a 3-h door-to-door journeytime is competitive with the airplane (Fig. 1). It also allowsa passenger to make a return trip and still have aproductive day without incurring overnight hotel costs.So the extension of the HST network may be justified bythe traffic generated on short segments than on end-to-endjourneys. If the journey time by HST is more than 5 h, theaeroplane is very competitive, while for between 3 and 5 hjourney by rail, choice is affected by qualitative issues otherthan time, such as mode network connectivity, servicefrequency, fare, and ground access.
If passenger transport by rotorcraft were introduced, thetiltrotor would always be the fastest alternative. The HSTand helicopter enable quicker journeys over short- andmedium-distances than fixed wing aircraft. The helicopteralso offers advantages over medium–high distances, while
the conventional aircraft is the best alternative for verylong journeys.The presence of the helicopter for journeys under 450 km
eliminates the ability of the HST to compete with theairplane in terms of door-to-door travelling time. Whenjourneys are more than 800 km, the fixed wing aircraft isfaster and they are outside the technical range of thehelicopter while rail markets become more niche-focused(night services, car transport service, etc.). The exact rangeof journeys over which each mode is competitive in termsof journey time, varies dependent on the assumptionsabout time required for terminal access, check-in, etc.(Table 3).Fig. 2 shows the performances of the different modes in
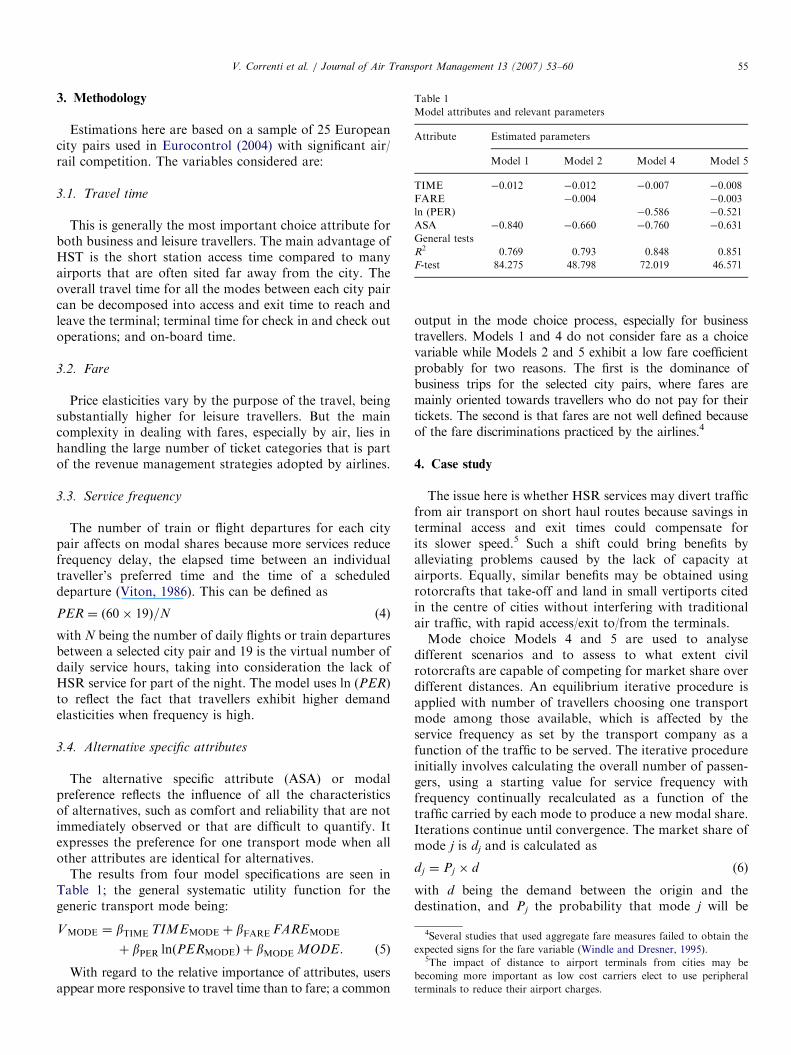
terms of overall speed, including check-in and out times,but excluding access and exit times. For all modes, overallspeed increases with distance, but the rate of increase is
ARTICLE IN PRESS
Overall speed
0
50
100
150
200
250
300
350
400
450
500
0 200 400 600 800 1000 1200 1400
distance (km)
km
/h
HST
B737 - 300
TILT BA609
HELI AB139
Fig. 2. Overall speed of airplane, train and rotorcraft.
Market share
0%
10%
20%
30%
40%
50%
60%
70%
80%
90%
100%
0 200 400 600 800 1000 1200 1400
distance (km)
HST
B737 - 300
HELI AB139
TILT BA609
Fig. 3. Market share with helicopter (Model 4).
Market share
0%
10%
20%
30%
40%
50%
60%
70%
80%
90%
100%
0 200 400 600 800 1000 1200 1400
distance (km)
HST
B737 - 300
HELI AB139
TILT BA609
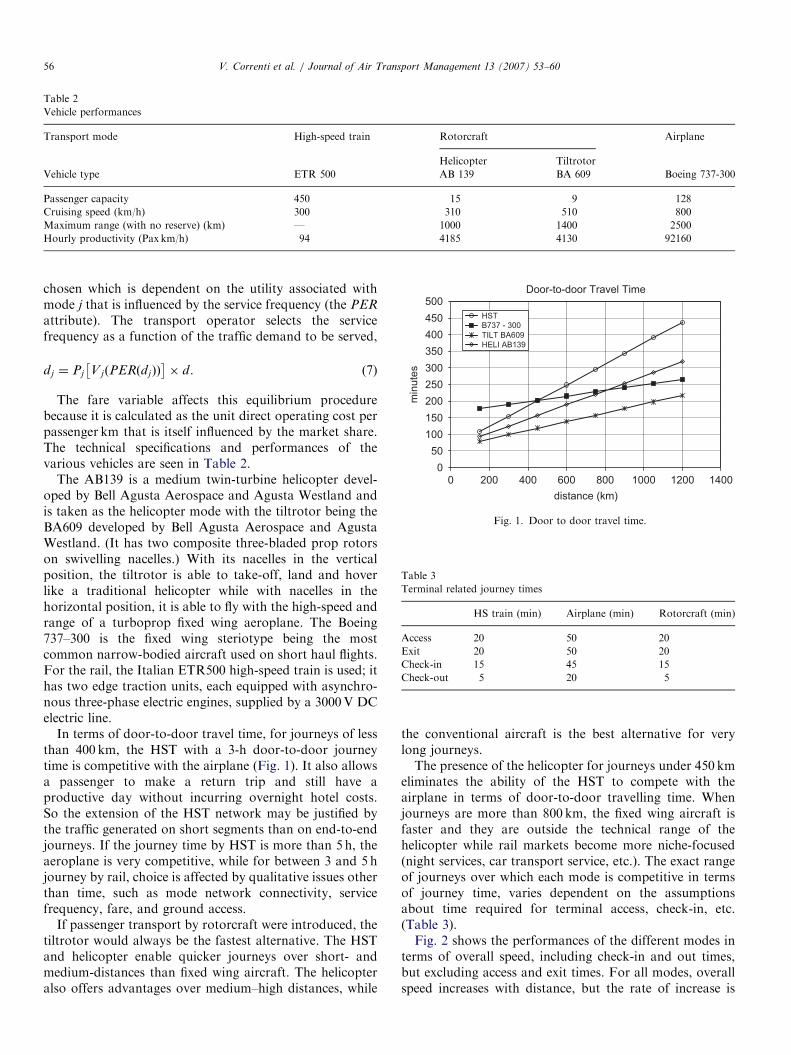
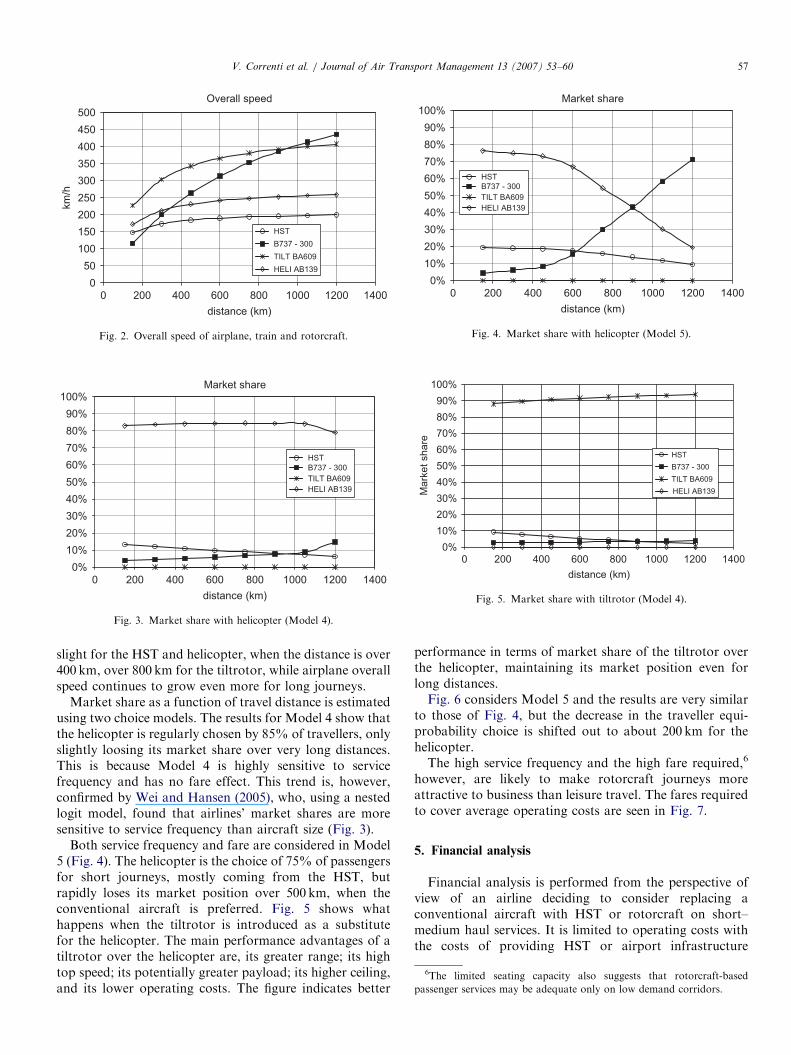
Fig. 4. Market share with helicopter (Model 5).
Mark
et
share
0%
10%
20%
30%
40%
50%
60%
70%
80%
90%
100%
0 200 400 600 800 1000 1200 1400
distance (km)
HELI AB139
HST
B737 - 300
TILT BA609
Fig. 5. Market share with tiltrotor (Model 4).
6The limited seating capacity also suggests that rotorcraft-based
passenger services may be adequate only on low demand corridors.
V. Correnti et al. / Journal of Air Transport Management 13 (2007) 53–60 57
slight for the HST and helicopter, when the distance is over400 km, over 800 km for the tiltrotor, while airplane overallspeed continues to grow even more for long journeys.
Market share as a function of travel distance is estimatedusing two choice models. The results for Model 4 show thatthe helicopter is regularly chosen by 85% of travellers, onlyslightly loosing its market share over very long distances.This is because Model 4 is highly sensitive to servicefrequency and has no fare effect. This trend is, however,confirmed by Wei and Hansen (2005), who, using a nestedlogit model, found that airlines’ market shares are moresensitive to service frequency than aircraft size (Fig. 3).
Both service frequency and fare are considered in Model5 (Fig. 4). The helicopter is the choice of 75% of passengersfor short journeys, mostly coming from the HST, butrapidly loses its market position over 500 km, when theconventional aircraft is preferred. Fig. 5 shows whathappens when the tiltrotor is introduced as a substitutefor the helicopter. The main performance advantages of atiltrotor over the helicopter are, its greater range; its hightop speed; its potentially greater payload; its higher ceiling,and its lower operating costs. The figure indicates better
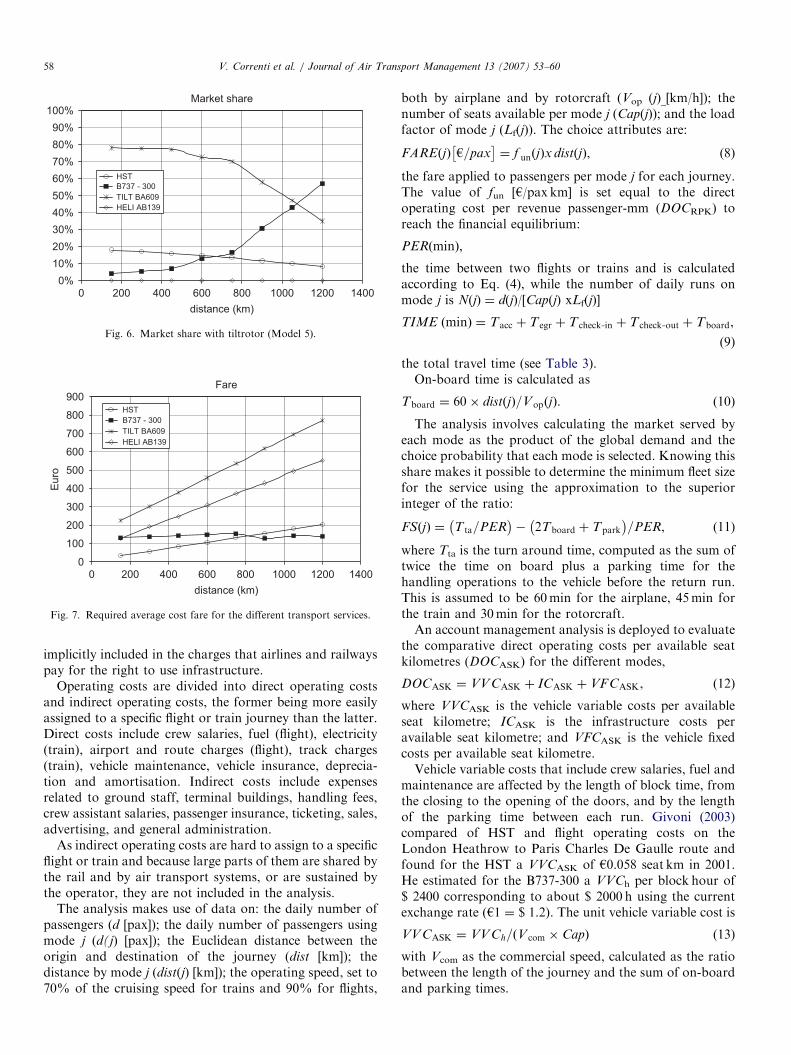
performance in terms of market share of the tiltrotor overthe helicopter, maintaining its market position even forlong distances.Fig. 6 considers Model 5 and the results are very similar
to those of Fig. 4, but the decrease in the traveller equi-probability choice is shifted out to about 200 km for thehelicopter.The high service frequency and the high fare required,6
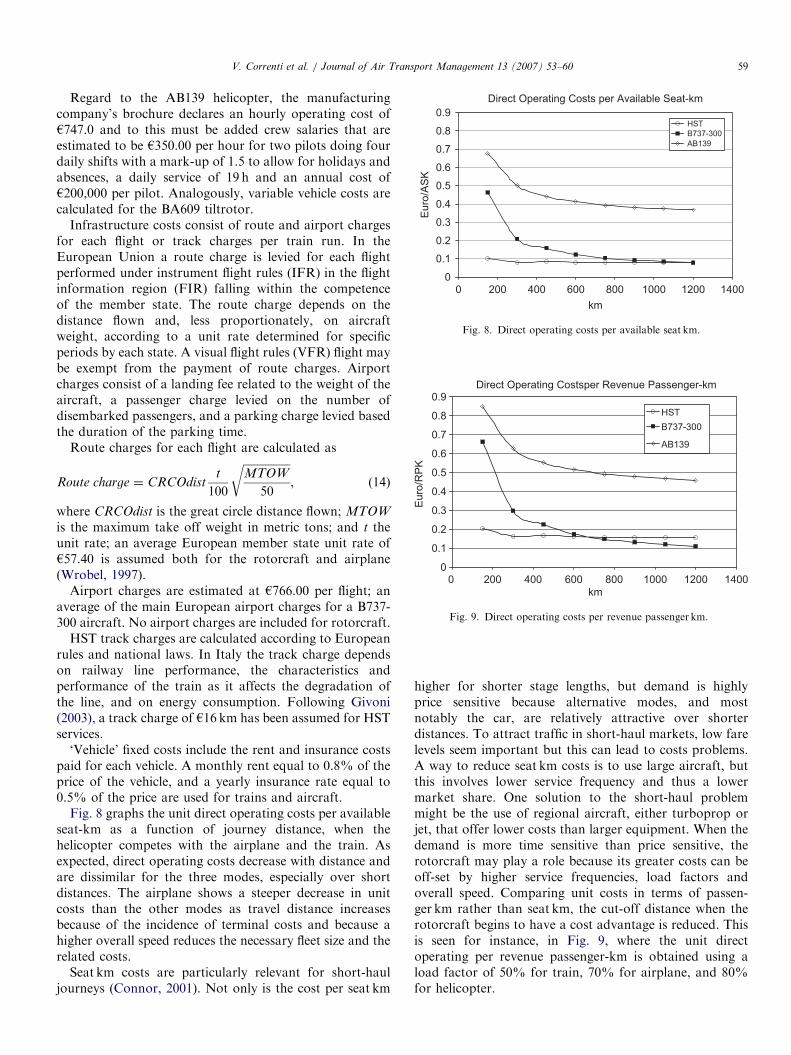
however, are likely to make rotorcraft journeys moreattractive to business than leisure travel. The fares requiredto cover average operating costs are seen in Fig. 7.
5. Financial analysis
Financial analysis is performed from the perspective ofview of an airline deciding to consider replacing aconventional aircraft with HST or rotorcraft on short–medium haul services. It is limited to operating costs withthe costs of providing HST or airport infrastructure
ARTICLE IN PRESS
Market share
0%
10%
20%
30%
40%
50%
60%
70%
80%
90%
100%
0 200 400 600 800 1000 1200 1400
distance (km)
HST
B737 - 300
TILT BA609
HELI AB139
Fig. 6. Market share with tiltrotor (Model 5).
Fare
0
100
200
300
400
500
600
700
800
900
0 200 400 600 800 1000 1200 1400
distance (km)
Euro
HST
B737 - 300
TILT BA609
HELI AB139
Fig. 7. Required average cost fare for the different transport services.
V. Correnti et al. / Journal of Air Transport Management 13 (2007) 53–6058
implicitly included in the charges that airlines and railwayspay for the right to use infrastructure.
Operating costs are divided into direct operating costsand indirect operating costs, the former being more easilyassigned to a specific flight or train journey than the latter.Direct costs include crew salaries, fuel (flight), electricity(train), airport and route charges (flight), track charges(train), vehicle maintenance, vehicle insurance, deprecia-tion and amortisation. Indirect costs include expensesrelated to ground staff, terminal buildings, handling fees,crew assistant salaries, passenger insurance, ticketing, sales,advertising, and general administration.
As indirect operating costs are hard to assign to a specificflight or train and because large parts of them are shared bythe rail and by air transport systems, or are sustained bythe operator, they are not included in the analysis.
The analysis makes use of data on: the daily number ofpassengers (d [pax]); the daily number of passengers usingmode j (d(j) [pax]); the Euclidean distance between theorigin and destination of the journey (dist [km]); thedistance by mode j (dist(j) [km]); the operating speed, set to70% of the cruising speed for trains and 90% for flights,
both by airplane and by rotorcraft (Vop (j)_[km/h]); thenumber of seats available per mode j (Cap(j)); and the loadfactor of mode j (Lf(j)). The choice attributes are:
FAREðjÞ h=pax� �
¼ f unðjÞx distðjÞ, (8)
the fare applied to passengers per mode j for each journey.The value of fun [h/pax km] is set equal to the directoperating cost per revenue passenger-mm (DOCRPK) toreach the financial equilibrium:
PERðminÞ;
the time between two flights or trains and is calculatedaccording to Eq. (4), while the number of daily runs onmode j is N(j) ¼ d(j)/[Cap(j) xLf(j)]
TIME ðminÞ ¼ Tacc þ T egr þ T check�in þ Tcheck�out þ Tboard,
(9)
the total travel time (see Table 3).On-board time is calculated as
Tboard ¼ 60� distðjÞ=VopðjÞ. (10)
The analysis involves calculating the market served byeach mode as the product of the global demand and thechoice probability that each mode is selected. Knowing thisshare makes it possible to determine the minimum fleet sizefor the service using the approximation to the superiorinteger of the ratio:
FSðjÞ ¼ T ta=PER� �
� 2Tboard þ Tpark
� �=PER, (11)
where Tta is the turn around time, computed as the sum oftwice the time on board plus a parking time for thehandling operations to the vehicle before the return run.This is assumed to be 60min for the airplane, 45min forthe train and 30min for the rotorcraft.An account management analysis is deployed to evaluate
the comparative direct operating costs per available seatkilometres (DOCASK) for the different modes,
DOCASK ¼ VVCASK þ ICASK þ VFCASK, (12)
where VVCASK is the vehicle variable costs per availableseat kilometre; ICASK is the infrastructure costs peravailable seat kilometre; and VFCASK is the vehicle fixedcosts per available seat kilometre.Vehicle variable costs that include crew salaries, fuel and
maintenance are affected by the length of block time, fromthe closing to the opening of the doors, and by the lengthof the parking time between each run. Givoni (2003)compared of HST and flight operating costs on theLondon Heathrow to Paris Charles De Gaulle route andfound for the HST a VVCASK of h0.058 seat km in 2001.He estimated for the B737-300 a VVCh per block hour of$ 2400 corresponding to about $ 2000 h using the currentexchange rate (h1 ¼ $ 1.2). The unit vehicle variable cost is
VVCASK ¼ VVCh=ðV com � CapÞ (13)
with Vcom as the commercial speed, calculated as the ratiobetween the length of the journey and the sum of on-boardand parking times.
ARTICLE IN PRESS
Direct Operating Costs per Available Seat-km
0
0.1
0.2
0.3
0.4
0.5
0.6
0.7
0.8
0.9
0 200 400 600 800 1000 1200 1400
km
Euro
/AS
K
HST
B737-300
AB139
Fig. 8. Direct operating costs per available seat km.
Direct Operating Costsper Revenue Passenger-km
0
0.1
0.2
0.3
0.4
0.5
0.6
0.7
0.8
0.9
0 200 400 600 800 1000 1200 1400
km
Euro
/RP
KHST
B737-300
AB139
Fig. 9. Direct operating costs per revenue passenger km.
V. Correnti et al. / Journal of Air Transport Management 13 (2007) 53–60 59
Regard to the AB139 helicopter, the manufacturingcompany’s brochure declares an hourly operating cost ofh747.0 and to this must be added crew salaries that areestimated to be h350.00 per hour for two pilots doing fourdaily shifts with a mark-up of 1.5 to allow for holidays andabsences, a daily service of 19 h and an annual cost ofh200,000 per pilot. Analogously, variable vehicle costs arecalculated for the BA609 tiltrotor.
Infrastructure costs consist of route and airport chargesfor each flight or track charges per train run. In theEuropean Union a route charge is levied for each flightperformed under instrument flight rules (IFR) in the flightinformation region (FIR) falling within the competenceof the member state. The route charge depends on thedistance flown and, less proportionately, on aircraftweight, according to a unit rate determined for specificperiods by each state. A visual flight rules (VFR) flight maybe exempt from the payment of route charges. Airportcharges consist of a landing fee related to the weight of theaircraft, a passenger charge levied on the number ofdisembarked passengers, and a parking charge levied basedthe duration of the parking time.
Route charges for each flight are calculated as
Route charge ¼ CRCOdistt
100
ffiffiffiffiffiffiffiffiffiffiffiffiffiffiffiffiffiMTOW
50
r, (14)
where CRCOdist is the great circle distance flown; MTOW
is the maximum take off weight in metric tons; and t theunit rate; an average European member state unit rate ofh57.40 is assumed both for the rotorcraft and airplane(Wrobel, 1997).
Airport charges are estimated at h766.00 per flight; anaverage of the main European airport charges for a B737-300 aircraft. No airport charges are included for rotorcraft.
HST track charges are calculated according to Europeanrules and national laws. In Italy the track charge dependson railway line performance, the characteristics andperformance of the train as it affects the degradation ofthe line, and on energy consumption. Following Givoni(2003), a track charge of h16 km has been assumed for HSTservices.
‘Vehicle’ fixed costs include the rent and insurance costspaid for each vehicle. A monthly rent equal to 0.8% of theprice of the vehicle, and a yearly insurance rate equal to0.5% of the price are used for trains and aircraft.
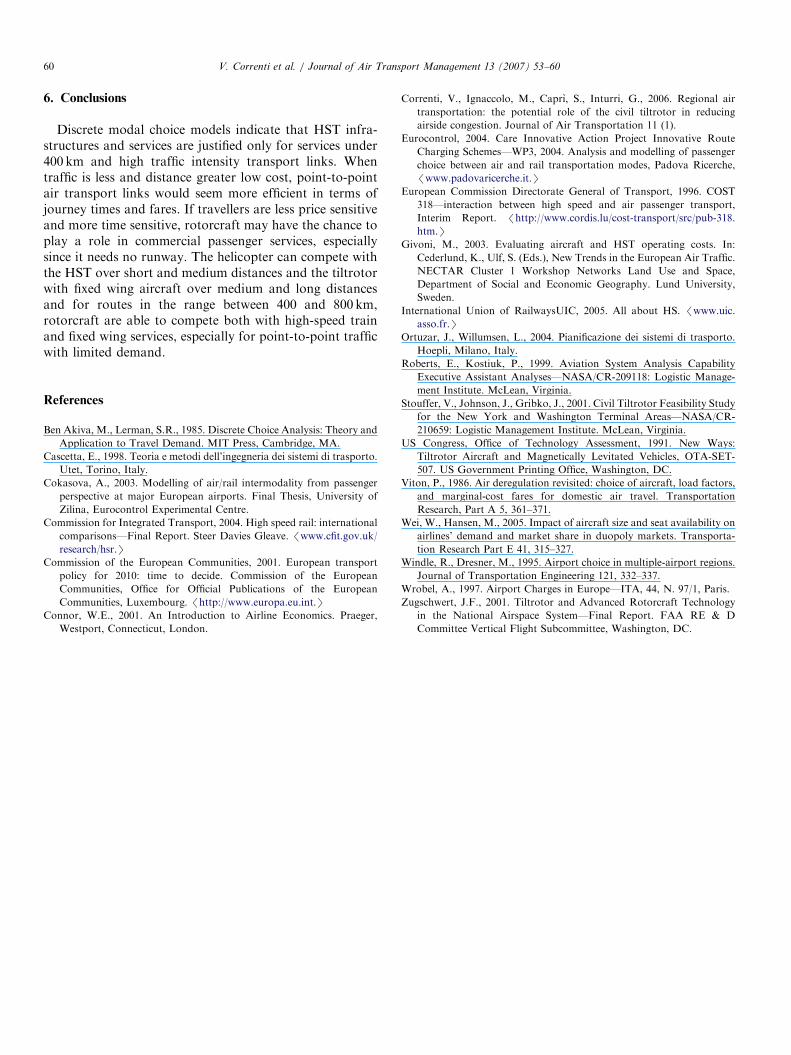
Fig. 8 graphs the unit direct operating costs per availableseat-km as a function of journey distance, when thehelicopter competes with the airplane and the train. Asexpected, direct operating costs decrease with distance andare dissimilar for the three modes, especially over shortdistances. The airplane shows a steeper decrease in unitcosts than the other modes as travel distance increasesbecause of the incidence of terminal costs and because ahigher overall speed reduces the necessary fleet size and therelated costs.
Seat km costs are particularly relevant for short-hauljourneys (Connor, 2001). Not only is the cost per seat km
higher for shorter stage lengths, but demand is highlyprice sensitive because alternative modes, and mostnotably the car, are relatively attractive over shorterdistances. To attract traffic in short-haul markets, low farelevels seem important but this can lead to costs problems.A way to reduce seat km costs is to use large aircraft, butthis involves lower service frequency and thus a lowermarket share. One solution to the short-haul problemmight be the use of regional aircraft, either turboprop orjet, that offer lower costs than larger equipment. When thedemand is more time sensitive than price sensitive, therotorcraft may play a role because its greater costs can beoff-set by higher service frequencies, load factors andoverall speed. Comparing unit costs in terms of passen-ger km rather than seat km, the cut-off distance when therotorcraft begins to have a cost advantage is reduced. Thisis seen for instance, in Fig. 9, where the unit directoperating per revenue passenger-km is obtained using aload factor of 50% for train, 70% for airplane, and 80%for helicopter.
ARTICLE IN PRESSV. Correnti et al. / Journal of Air Transport Management 13 (2007) 53–6060
6. Conclusions
Discrete modal choice models indicate that HST infra-structures and services are justified only for services under400 km and high traffic intensity transport links. Whentraffic is less and distance greater low cost, point-to-pointair transport links would seem more efficient in terms ofjourney times and fares. If travellers are less price sensitiveand more time sensitive, rotorcraft may have the chance toplay a role in commercial passenger services, especiallysince it needs no runway. The helicopter can compete withthe HST over short and medium distances and the tiltrotorwith fixed wing aircraft over medium and long distancesand for routes in the range between 400 and 800 km,rotorcraft are able to compete both with high-speed trainand fixed wing services, especially for point-to-point trafficwith limited demand.
References
Ben Akiva, M., Lerman, S.R., 1985. Discrete Choice Analysis: Theory and
Application to Travel Demand. MIT Press, Cambridge, MA.
Cascetta, E., 1998. Teoria e metodi dell’ingegneria dei sistemi di trasporto.
Utet, Torino, Italy.
Cokasova, A., 2003. Modelling of air/rail intermodality from passenger
perspective at major European airports. Final Thesis, University of
Zilina, Eurocontrol Experimental Centre.
Commission for Integrated Transport, 2004. High speed rail: international
comparisons—Final Report. Steer Davies Gleave. /www.cfit.gov.uk/
research/hsr.SCommission of the European Communities, 2001. European transport
policy for 2010: time to decide. Commission of the European
Communities, Office for Official Publications of the European
Communities, Luxembourg. /http://www.europa.eu.int.SConnor, W.E., 2001. An Introduction to Airline Economics. Praeger,
Westport, Connecticut, London.
Correnti, V., Ignaccolo, M., Caprı̀, S., Inturri, G., 2006. Regional air
transportation: the potential role of the civil tiltrotor in reducing
airside congestion. Journal of Air Transportation 11 (1).
Eurocontrol, 2004. Care Innovative Action Project Innovative Route
Charging Schemes—WP3, 2004. Analysis and modelling of passenger
choice between air and rail transportation modes, Padova Ricerche,
/www.padovaricerche.it.SEuropean Commission Directorate General of Transport, 1996. COST
318—interaction between high speed and air passenger transport,
Interim Report. /http://www.cordis.lu/cost-transport/src/pub-318.
htm.SGivoni, M., 2003. Evaluating aircraft and HST operating costs. In:
Cederlund, K., Ulf, S. (Eds.), New Trends in the European Air Traffic.
NECTAR Cluster 1 Workshop Networks Land Use and Space,
Department of Social and Economic Geography. Lund University,
Sweden.
International Union of RailwaysUIC, 2005. All about HS. /www.uic.
asso.fr.SOrtuzar, J., Willumsen, L., 2004. Pianificazione dei sistemi di trasporto.
Hoepli, Milano, Italy.
Roberts, E., Kostiuk, P., 1999. Aviation System Analysis Capability
Executive Assistant Analyses—NASA/CR-209118: Logistic Manage-
ment Institute. McLean, Virginia.
Stouffer, V., Johnson, J., Gribko, J., 2001. Civil Tiltrotor Feasibility Study
for the New York and Washington Terminal Areas—NASA/CR-
210659: Logistic Management Institute. McLean, Virginia.
US Congress, Office of Technology Assessment, 1991. New Ways:
Tiltrotor Aircraft and Magnetically Levitated Vehicles, OTA-SET-
507. US Government Printing Office, Washington, DC.
Viton, P., 1986. Air deregulation revisited: choice of aircraft, load factors,
and marginal-cost fares for domestic air travel. Transportation
Research, Part A 5, 361–371.
Wei, W., Hansen, M., 2005. Impact of aircraft size and seat availability on
airlines’ demand and market share in duopoly markets. Transporta-
tion Research Part E 41, 315–327.
Windle, R., Dresner, M., 1995. Airport choice in multiple-airport regions.
Journal of Transportation Engineering 121, 332–337.
Wrobel, A., 1997. Airport Charges in Europe—ITA, 44, N. 97/1, Paris.
Zugschwert, J.F., 2001. Tiltrotor and Advanced Rotorcraft Technology
in the National Airspace System—Final Report. FAA RE & D
Committee Vertical Flight Subcommittee, Washington, DC.
Related Documents