The potential of horizontal collaboration in airport ground freight services Steven Ankersmit a, 1 , Jafar Rezaei b, * , Lori Tavasszy b, 2 a Department of Transport & Planning, Faculty of Civil Engineering and Geosciences, Delft University of Technology, 2600 GA Delft, The Netherlands b Transport and Logistics Group, Faculty of Technology, Policy and Management, Delft University of Technology, 2628 BX Delft, The Netherlands article info Article history: Available online 30 July 2014 Keywords: Horizontal collaboration Airport logistics Freight forwarders Air cargo handling Transport performance Simulation abstract Since the global economic crisis of 2007e2011, the increasingly dynamic and challenging air cargo market in Europe has forced freight forwarders to improve their performance. In addition to improving their internal transport efficiency, they have also started to look at previously unexplored opportunities for horizontal collaboration in landside airport transport. The aim of this study is to reveal the potential of air cargo transport collaboration on a horizontal level, i.e. between multiple freight forwarders within a single airport. Reviewing existing literature on horizontal collaboration, with a focus on the air cargo industry, we propose a conceptual framework for transport collaboration in the air cargo industry. Based on a comprehensive study on air cargo transport movements within Schiphol, using a simulation model based on company data of 10,747 shipments (6977 tons of cargo) for a period of 30 days, we find several interesting results. Our main finding is that horizontal collaboration can improve the transport perfor- mance, by maintaining a high frequency of transport movements and maintaining an acceptable throughput time for air cargo shipments, and at the same time reduce transport costs by up to 40%. For smaller freight forwarders, the frequency of transport deliveries can even increase, while still allowing them to improve the average load factor of transport movements. © 2014 Elsevier Ltd. All rights reserved. 1. Introduction Traditionally, large global shippers of goods have developed and supported their transport needs internally (Sahay, 2003). In the last 30 years, however, many have started to collaborate with other companies within their own supply chain with regard to transport organization-related activities (Mason et al., 2007). This type of vertical supply chain collaboration has matured in recent decades, especially in well-developed regions like Europe and/or North America. Vertical collaboration involves two or more companies that do not operate on the same level of the value chain. This practice is already well established in highly competitive in- dustries, even to an extent that achieving a competitive advantage by applying only vertical collaboration is often no longer a sufficient strategy. In many industries today, legal and/or operational constraints make it more effective to organize transport individually, delaying a shift in focus toward transport collaboration in general. In addition, different products require a different approach to fit customer re- quirements (Jüttner et al., 2007). Vertical transport collaboration may be justified when both the volume and frequency of shipments between companies are high. Also, when the value and nature of the products requires more of a restricted control of transport, vertical collaboration is a demanding proposition. Finally, the ex- change of information is often affected by complexities and risks. Even within companies, the cost of sharing information is still often an obstacle, companies or internal departments are often reluctant to share information (Barratt, 2004), for fear that could result in revenue losses, from the information itself, from the costs of sharing information (GCI, 2009) or because of legal and techno- logical constraints. In industries where customer preferences and transport re- quirements have become more challenging in recent years (Capgemini, 2010; Pyza and Golda, 2011), production flows be- tween major manufactures and consumer markets around the world have become smaller and more dynamic (Maskell, 2001). As a consequence, the organization of individual supply chains and their transport has come under more pressure. Increased energy costs, stricter government transport regulations and a broader focus on sustainability have also challenged the effective * Corresponding author. Tel.: þ31 15 27 81716; fax: þ31 15 27 82719. E-mail addresses: [email protected] (S. Ankersmit), [email protected] (J. Rezaei), [email protected] (L. Tavasszy). 1 Tel.: þ31 628529217. 2 Tel.: þ31 15 27 86343; fax: þ31 15 27 82719. Contents lists available at ScienceDirect Journal of Air Transport Management journal homepage: www.elsevier.com/locate/jairtraman http://dx.doi.org/10.1016/j.jairtraman.2014.07.005 0969-6997/© 2014 Elsevier Ltd. All rights reserved. Journal of Air Transport Management 40 (2014) 169e181

Welcome message from author
This document is posted to help you gain knowledge. Please leave a comment to let me know what you think about it! Share it to your friends and learn new things together.
Transcript

lable at ScienceDirect
Journal of Air Transport Management 40 (2014) 169e181
Contents lists avai
Journal of Air Transport Management
journal homepage: www.elsevier .com/locate/ ja ir t raman
The potential of horizontal collaboration in airport groundfreight services
Steven Ankersmit a, 1, Jafar Rezaei b, *, Lori Tavasszy b, 2
a Department of Transport & Planning, Faculty of Civil Engineering and Geosciences, Delft University of Technology, 2600 GA Delft, The Netherlandsb Transport and Logistics Group, Faculty of Technology, Policy and Management, Delft University of Technology, 2628 BX Delft, The Netherlands
a r t i c l e i n f o
Article history:Available online 30 July 2014
Keywords:Horizontal collaborationAirport logisticsFreight forwardersAir cargo handlingTransport performanceSimulation
* Corresponding author. Tel.: þ31 15 27 81716; fax:E-mail addresses: [email protected] (S. An
(J. Rezaei), [email protected] (L. Tavasszy).1 Tel.: þ31 628529217.2 Tel.: þ31 15 27 86343; fax: þ31 15 27 82719.
http://dx.doi.org/10.1016/j.jairtraman.2014.07.0050969-6997/© 2014 Elsevier Ltd. All rights reserved.
a b s t r a c t
Since the global economic crisis of 2007e2011, the increasingly dynamic and challenging air cargomarket in Europe has forced freight forwarders to improve their performance. In addition to improvingtheir internal transport efficiency, they have also started to look at previously unexplored opportunitiesfor horizontal collaboration in landside airport transport. The aim of this study is to reveal the potentialof air cargo transport collaboration on a horizontal level, i.e. between multiple freight forwarders withina single airport. Reviewing existing literature on horizontal collaboration, with a focus on the air cargoindustry, we propose a conceptual framework for transport collaboration in the air cargo industry. Basedon a comprehensive study on air cargo transport movements within Schiphol, using a simulation modelbased on company data of 10,747 shipments (6977 tons of cargo) for a period of 30 days, we find severalinteresting results. Our main finding is that horizontal collaboration can improve the transport perfor-mance, by maintaining a high frequency of transport movements and maintaining an acceptablethroughput time for air cargo shipments, and at the same time reduce transport costs by up to 40%. Forsmaller freight forwarders, the frequency of transport deliveries can even increase, while still allowingthem to improve the average load factor of transport movements.
© 2014 Elsevier Ltd. All rights reserved.
1. Introduction
Traditionally, large global shippers of goods have developed andsupported their transport needs internally (Sahay, 2003). In the last30 years, however, many have started to collaborate with othercompanies within their own supply chain with regard to transportorganization-related activities (Mason et al., 2007). This type ofvertical supply chain collaboration has matured in recent decades,especially in well-developed regions like Europe and/or NorthAmerica. Vertical collaboration involves two or more companiesthat do not operate on the same level of the value chain. Thispractice is already well established in highly competitive in-dustries, even to an extent that achieving a competitive advantageby applying only vertical collaboration is often no longer a sufficientstrategy.
In many industries today, legal and/or operational constraintsmake it more effective to organize transport individually, delaying a
þ31 15 27 82719.kersmit), [email protected]
shift in focus toward transport collaboration in general. In addition,different products require a different approach to fit customer re-quirements (Jüttner et al., 2007). Vertical transport collaborationmay be justifiedwhen both the volume and frequency of shipmentsbetween companies are high. Also, when the value and nature ofthe products requires more of a restricted control of transport,vertical collaboration is a demanding proposition. Finally, the ex-change of information is often affected by complexities and risks.Evenwithin companies, the cost of sharing information is still oftenan obstacle, companies or internal departments are often reluctantto share information (Barratt, 2004), for fear that could result inrevenue losses, from the information itself, from the costs ofsharing information (GCI, 2009) or because of legal and techno-logical constraints.
In industries where customer preferences and transport re-quirements have become more challenging in recent years(Capgemini, 2010; Pyza and Golda, 2011), production flows be-tween major manufactures and consumer markets around theworld have become smaller and more dynamic (Maskell, 2001). Asa consequence, the organization of individual supply chains andtheir transport has come under more pressure. Increased energycosts, stricter government transport regulations and a broaderfocus on sustainability have also challenged the effective

S. Ankersmit et al. / Journal of Air Transport Management 40 (2014) 169e181170
management of supply chain by applying only vertical supply chaincollaboration with a supply chain.
Horizontal collaboration involves companies that operate at thesame level of the value chain, but usually in different chains. Theycollaborate by sharing capacity, planning, handling services andpossibly even booking services. This kind of collaboration takesplace among shippers who produce goods and freight forwardersor carriers who arrange the transport of goods for shippers. Inseveral of the largest good production industries, including the fastmoving consumer goods sector (FMCG), major manufactures havestarted to collaborate with (direct) competitors on transport, toreduce transport cost, increase the delivery frequency andmeet thehigher sustainability requirements. Recent horizontal transportcollaboration projects in Europe have shown that transport costscan be reduced by more than 20% through horizontal collaboration(Vanovermeire et al., 2014), while at the same time improving otherimportant transport performance aspects, such as; reliability,transport management, the resources needed to process goods andthe environmental impact.
Following the lead of the manufacturing industry, two impor-tant developments have motivated the air cargo transport servicesindustry to start looking at possibilities for horizontal collabora-tion. Firstly, in the decades prior to the economic crisis, higheconomic growth rates and healthy operations margins hadlimited the need and support for transport collaboration in the aircargo transport system. Freight forwarding companies in the airindustry were able to: (1) optimize their supply chain in a cost-effective way by using their own resources, (2) realize efficiencythrough vertical transport collaboration or (3) justify inefficiencybased on relatively high operational margins. The increasedcompetitiveness within the air cargo industry, with other trans-port systems and declining operating margins of air freight (IATA,2012), have made it more difficult for freight forwarders tomaintain an acceptable level of transport performance, measuredin transport costs per kilo cargo. Secondly, the emergence of theintegrators, or integrative logistic service providers (includingfreight forwarding companies within the air cargo system), hasput substantial pressure on the competitiveness of specializedservice providers (Capgemini, 2010). Couriers, postal companies,integrators, airlines and forwarders increasingly compete onseveral markets based on size, volume and services, offeringshippers a much wider choice of services for transport by air,making the air cargo market much more dynamic and complex.This is expected to continue in key international markets, addingto complex interaction and co-competition between integrators,the largest providers of express capacity and traditional air cargoairlines.
A major limitation of existing studies on horizontal transportcollaboration is that they focus mainly on long distance transportcollaboration. In addition, collaboration in other transport systemshas focused on goods that are not subject to the dynamics of de-mand and supply that characterize the air cargo system at a givenairport. Thus far, existing studies are unable to provide a singleexample of horizontal collaboration within an airport air cargotransport system, despite successful applications in other transportsystems. The distances of inner-airport cargo transport are rela-tively short, which could also provide new insights into short-distance horizontal transport collaboration.
The main contribution of this paper is to show the key effects ofapplying horizontal collaboration to inner-airport transport aircargo shipments, based on a comparative case study analysis of theperformance of single and combined transport within an airportsystem. As such, this study can further support the understandingof combined transport in dynamic short-distance transportsystems.
The rest of this paper is organized as follows. In the next section,relevant literature on supply chain collaboration is analyzed. Sec-tion 3 points out the most important current and future de-velopments of the air cargo industry in relation to collaboration interms of inner-airport transport, resulting in a conceptual model forthis type of transport collaboration. The case study involvingcollaboration at Schiphol is presented in Section 4. Finally, in Sec-tion 5, our conclusions, the managerial implications and sugges-tions for further research are presented.
2. Review of literature
Although previous studies acknowledge the importance ofcollaboration in transport in general (Stephens, 2006; Mason et al.,2007), only a few focus on horizontal transport collaboration, whilemost focus on vertical supply chain collaboration (Holweg et al.,2005; Visser, 2009; Sahay, 2003). There has been little attentionto horizontal transport collaboration in relation to real-worldproblems (Cruijssen and Salomon, 2004; Audy and D'Amours,2008; Vanovermeire et al., 2014), nor is there often a focus onextensive and complex transport collaboration, which can in partbe explained by the traditional focus of supply chain managementon reducing transport costs rather than on the potential addedvalue of transport within a supply chain, as has been pointed out byMason et al. (2007).
Generally speaking, when the focus is on cost reduction, re-lationships between companies tend to be short-term and purelyoperational in nature. Often, these types of relationships are notdefined as a true form of collaboration but rather as arm's lengthrelationships. At the moment, there are many challenges that havelimited the actual intended impact of vertical and horizontalcollaboration (Barratt, 2004). Recent research that looked atimportant variables that are related to supporting and managingsupply chain collaboration suggests segmenting the suppliersbased on their ‘capabilities’ and ‘willingness to collaborate’, in orderto formulate particular relationship strategies for different seg-ments of suppliers. The segmentation helps the companies tobetter manage their relationship with their key partners (Rezaeiand Ortt, 2012, 2013). When applying and managing transportwith two or more companies operating at the same level of thevalue chain, this often requires longer term relationships, to justifyand support this type of transport, given the notion that it can bemore complex to establish and maintain such long-term relation-ships (Stephens, 2006). This can be further explained by theresearch by Lambert (2008), which defines different levels of re-lationships between companies, based on the extent and goal of thecollaboration in question, pointing out the most important aspectsthat determine to what extent a partnership is based on the facil-itators and drivers for a partnership. Key elements in the partner-ship model relate to organizational comparability, symmetry andtrust. Companies currently have more knowledge and experiencewith regard to vertical collaboration.
However, the benefits of applying horizontal transport collab-oration on other important organizational processes, in addition totransport-related aspects are also becoming better known, as hasbeen pointed out by Cruijssen et al. (2007), which can relate toaspects such as the use of company resource, production planningand environmental benefits. The potential of horizontal transportis, therefore, increasing, due to more dynamic markets conditionsand changing customer requirements (Leitner et al., 2011). Themotivation to support horizontal collaboration is increasing, espe-cially when vertical collaboration cannot achieve similar results oris even more difficult to realize.
The few studies that examine collaboration within the air cargoindustry have mainly focused on collaboration between airlines
S. Ankersmit et al. / Journal of Air Transport Management 40 (2014) 169e181 171
(Agarwal et al., 2009). After the worldwide liberation of a key aircargo market, several major airlines have started to collaboratewith airline partners to share capacity and improve profitability.Only limited collaboration has been established within the airportsystem based on vertical collaboration involving the coordinationof transport movements to a specific air cargo handler (Franz andStolletz, 2012). In the following section, a conceptual modelregarding transport collaboration is developed.
3. Conceptual model for air cargo transport collaboration
To develop a conceptual model, a clear definition of horizontaltransport collaboration is needed. Other studies have suggesteddifferent definitions but in this study, horizontal transport collab-oration (HTC) is defined as ‘All activities associated with a combinedpredefined and coordinated collection and delivery of air cargo ship-ments from multiple possible origins to several destinations involvingtwo or more companies which operate at the same level of the valuechain’.
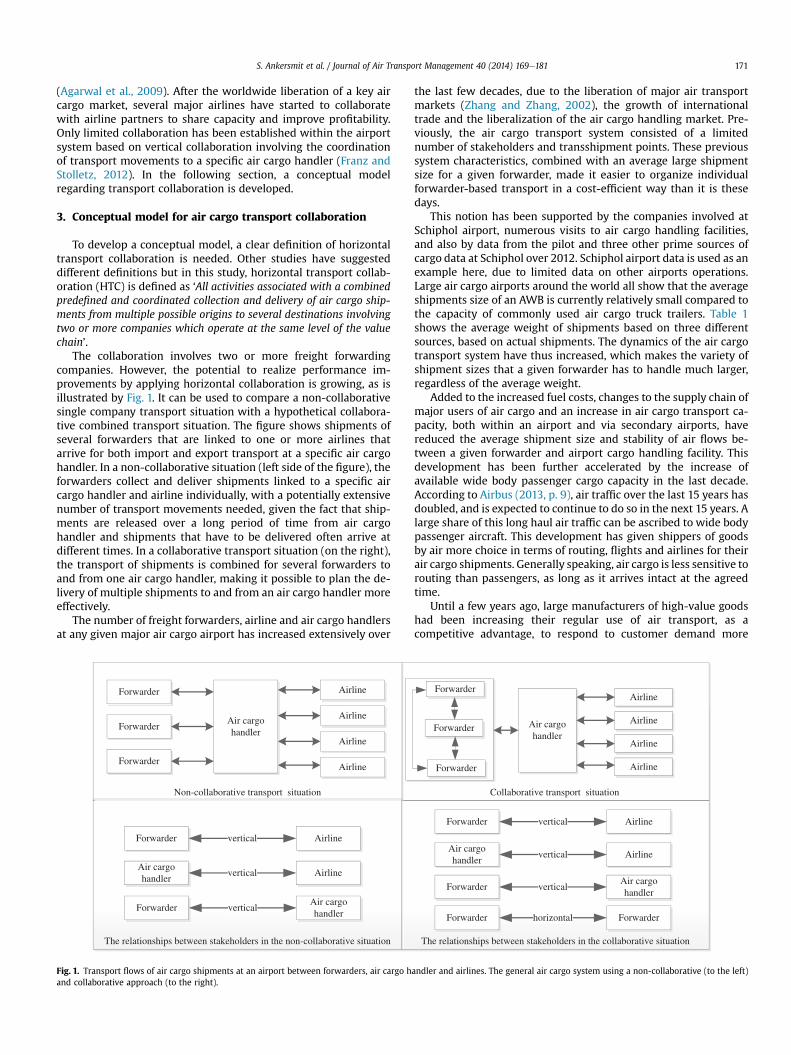
The collaboration involves two or more freight forwardingcompanies. However, the potential to realize performance im-provements by applying horizontal collaboration is growing, as isillustrated by Fig. 1. It can be used to compare a non-collaborativesingle company transport situation with a hypothetical collabora-tive combined transport situation. The figure shows shipments ofseveral forwarders that are linked to one or more airlines thatarrive for both import and export transport at a specific air cargohandler. In a non-collaborative situation (left side of the figure), theforwarders collect and deliver shipments linked to a specific aircargo handler and airline individually, with a potentially extensivenumber of transport movements needed, given the fact that ship-ments are released over a long period of time from air cargohandler and shipments that have to be delivered often arrive atdifferent times. In a collaborative transport situation (on the right),the transport of shipments is combined for several forwarders toand from one air cargo handler, making it possible to plan the de-livery of multiple shipments to and from an air cargo handler moreeffectively.
The number of freight forwarders, airline and air cargo handlersat any given major air cargo airport has increased extensively over
Non-collaborative transport situation
Forwarder
Air cargohandler
Airline
Forwarder
Forwarder
Airline
Airline
Airline
The relationships between stakeholders in the non-collaborative situation
Forwarder Airlinevertical
Air cargohandler
Airlinevertical
ForwarderAir cargohandler
vertical
Fig. 1. Transport flows of air cargo shipments at an airport between forwarders, air cargo hand collaborative approach (to the right).
the last few decades, due to the liberation of major air transportmarkets (Zhang and Zhang, 2002), the growth of internationaltrade and the liberalization of the air cargo handling market. Pre-viously, the air cargo transport system consisted of a limitednumber of stakeholders and transshipment points. These previoussystem characteristics, combined with an average large shipmentsize for a given forwarder, made it easier to organize individualforwarder-based transport in a cost-efficient way than it is thesedays.
This notion has been supported by the companies involved atSchiphol airport, numerous visits to air cargo handling facilities,and also by data from the pilot and three other prime sources ofcargo data at Schiphol over 2012. Schiphol airport data is used as anexample here, due to limited data on other airports operations.Large air cargo airports around the world all show that the averageshipments size of an AWB is currently relatively small compared tothe capacity of commonly used air cargo truck trailers. Table 1shows the average weight of shipments based on three differentsources, based on actual shipments. The dynamics of the air cargotransport system have thus increased, which makes the variety ofshipment sizes that a given forwarder has to handle much larger,regardless of the average weight.
Added to the increased fuel costs, changes to the supply chain ofmajor users of air cargo and an increase in air cargo transport ca-pacity, both within an airport and via secondary airports, havereduced the average shipment size and stability of air flows be-tween a given forwarder and airport cargo handling facility. Thisdevelopment has been further accelerated by the increase ofavailable wide body passenger cargo capacity in the last decade.According to Airbus (2013, p. 9), air traffic over the last 15 years hasdoubled, and is expected to continue to do so in the next 15 years. Alarge share of this long haul air traffic can be ascribed to wide bodypassenger aircraft. This development has given shippers of goodsby air more choice in terms of routing, flights and airlines for theirair cargo shipments. Generally speaking, air cargo is less sensitive torouting than passengers, as long as it arrives intact at the agreedtime.
Until a few years ago, large manufacturers of high-value goodshad been increasing their regular use of air transport, as acompetitive advantage, to respond to customer demand more
Collaborative transport situation
Forwarder
Air cargohandler
Airline
Forwarder
Forwarder
Airline
Airline
Airline
The relationships between stakeholders in the collaborative situation
Forwarder Airlinevertical
Air cargohandler
Airlinevertical
ForwarderAir cargohandler
vertical
Forwarder Forwarderhorizontal
andler and airlines. The general air cargo system using a non-collaborative (to the left)

Table 1Sample data shipment weight of air cargo shipments import/export at Schiphol(year 2012).
Data source
Cargonaut Source #1 Source #2
Total shipment weight 67,306,573 449,371,152 750,750,000Number of shipments
in data set (AWB's)52,733 408,991 470,019
S. Ankersmit et al. / Journal of Air Transport Management 40 (2014) 169e181172
efficiently. The slower growth rate of air transport in relation toglobal transport reveals that the use of air transport, as a preferredmeans of transport, has been reduced, even for high value goods.This can be explained by the use of alternative forms of transport,due to recent experiences with dependence on air transport withmajor disruptions (Graebel, 2012; TNO, 2012), the move of pro-duction faculties around the world (Appold and Kasarda, 2011) and,finally, an increased attractiveness of alternative forms of transportcompared to air transport, based on transport costs in relation toproduct value.
All the developments mentioned above have put further pres-sure on the average air freight rates and operational margins ofboth airlines and other stakeholders involved in air cargo transport(IATA, 2012). This has caused an increase in the average number oftransport movements between forwarders' facilities and air cargohandling facilities, with similar or lower numbers of shipments.When the transport movements of several forwarders are com-bined, between air cargo handlers and several forwarders, the totalnumber of transport movements at an airport can be reduced, thefrequency of transport can be maintained or even increased, withlower costs, which means there is a real potential for collaborationon the part of freight forwarders airport transport.
4. Case study: Schiphol airport
4.1. Case study introduction
Amsterdam airport Schiphol is positioned in the top five oflargest passenger and cargo airports within Europe (Schiphol,2012). In the past five years, the average growth rate at largecargo airports such as Schiphol has been negative, which hasincreased the focus of important stakeholders in the air cargosystem on system efficiency, to stay economically viable andattractive. Schiphol is a suitable airport for a case study on hori-zontal transport collaboration, given its size, the large number offorwarders, airlines and air cargo handling facilities at the airport.Also, taking into the current over-capacity, low operating marginsand declining average shipment size, it is clear that there is a realpotential for costs reductions. Since many other large air cargoairports in Europe have similar stakeholders and operations, thiscase study could be used to represent several large air cargo air-ports. Although Schiphol airport handles a high volume of perish-able cargo, it is also extensively used by forwarders that are focusedon general cargo. Based on the data of Cargonaut3 it can beconcluded that general cargo is the most widely handled cargo atthe airport. Only one of the top 10 forwarders at the airport in 2012focused especially on perishable traffic.
Fig. 2 shows the main changes that have occurred in the flowpatterns of air cargo handled at Schiphol airport between for-warders and air cargo handlers. Combined with the extensivegrowth of airlines operating from a major airport and the increased
3 Cargonaut is an ICT company that facilities information exchange betweenvarious stakeholders within the cargo system of Schiphol on shipment level.
number of air cargo handlers at the airport, the dynamics andcomplexity of cargo shipment flows between and within airportshave increased. The number [1] in Fig. 2 shows the focus of this casestudy which is the transport between freight forwarders and aircargo handlers within a given airport.
The study is based on a selective flow of air cargo transport ofthree forwarding companies (c1ec3) and one air cargo handlerwithin the airport. Actual data from 2012 was used, which wasprovided both by the companies and combined with the data offour other organizations, including Cargonaut and Schiphol Group.Only general cargo, consisting of durable goods that do not requirespecial treatment based on their value or product nature, wasincluded. The forwarders were considered suitable as they all havea large share of ‘general cargo’ (GC) shipments (80e95%) and rankamong the top 15 both import and export customers of the air cargohandler in question with regards to the total weight of collectedand delivered shipments over 2012 at the airport. GC shipments donot require any additional or special handling, they are durable andhave limited value, for instance low value electronics, textiles andspare parts. GC is often transported as loose cargo and does not loseits value easily due to changing conditions in the environment. Thismakes this type of cargo most suitable for collaboration, because itis easier to handle, the arrival time is less sensitive and the value ofthe products is lower than other types of cargo. Furthermore, GC isby far the common used type of air cargo transported by freightforwarders, which makes collaboration among large forwarders farmore likely.
4.1.1. General cargo shipmentsThe cargo handler in this case study ranks within the top three
largest air cargo handlers operating at the airport and servicesmany different airline customers. This is important with regard toamount of cargo being processed and the frequency of arrivingcargo shipments. Also, the forwarding companies are locatednearby and have a similar type customer base at Schiphol.
To analyze the complete potential of combined transport inrelation to single company transport, the air cargo handler trans-port of both loose and unit loading device (ULD) shipments wasincluded for both import and export. ULD shipments are trans-ported within an aircraft container or on aircraft pallets, and loosecargo shipments are transported without the use of an aircraftcontainer for truck transport part. For loose cargo shipments,general transport pallets are used. Single transport only involvesthe transport of shipments of one forwarding company' and com-bined transport relates to shipment transport that can belong totwo or more forwarding companies. Themain goal is to support theuse and suitability of transport collaboration in relation to singlecompany transport and so the most important differences ofcombined and single transport are quantified using the followingkey performance indicators gathered from a dozen forwardingcompanies at Schiphol:
� amount of transport movements� amount of cargo processed� transport costs per kilo� average throughput time of shipments
Given the large number of processes identified in the concep-tualization, a simplified overview is presented in Fig. 3.
The figure shows the different processes that an import orexport shipment will go through from creation (generation) untilfinal delivery. The generation of shipments for import shipmentswill take place at the handling facility, whereas export shipmentswill be generated at the export facility of a forwarder. Importshipments are delivered at an import facility of the forwarders,

Previous air cargo system large air cargo airport
Other airport systems
LegendLegend
Within Schiphol Airport
Outside Schiphol Airport
6 / 2
10 / 4
[1]
# of companies:[ now / past ]
Air cargohandler
Air cargoshipmenttransport
30 / 10
80 / 20
200 / 100
Forwarder
100 / 30
600 / 100
Airline
Fig. 2. Previous and current cargo flows and number of companies involved in the air cargo system at Schiphol.
S. Ankersmit et al. / Journal of Air Transport Management 40 (2014) 169e181 173
while export shipments are all delivered to the handling company'sexport facility. Transport is generated at one of the differenttransport bases, transport movements are planned by assessing thenumber of shipments that are ready for collection and by looking atthe amount of transport that has been allocated to a specific set ofshipments. The process [1] in Fig. 3 allocates shipments to com-bined or single transport based on a defined percentage of ship-ments to be allocated to the two different transport for thecompanies' c1ec3 and the set restrictions for transport, as shown inTable 4. When shipments are allocated to transport, they are put onhold before they can be allocated to a specific transport. This isbased on the transport capacity available for the next transport. Ifthere is sufficient capacity available, the shipments are allocated toa specific transport hold process [2] in Fig. 3. The transport systemthan assess shipment holding process of the different types oftransport demand, this is a process defined for both import andexport shipments. This process analyses the amount of shipmentswaiting for a specific transport process [4] in Fig. 3. Transport re-sources are only released and assigned to a specific transport, whenthe final shipments have been unloaded of the previous transport.Shipments therefore have to be ready to their next transport, inorder for transport to be generated for collection and delivery.Freed transport resource can already be allocated to new shipment
Fig. 3. Simplified processes of inner airport shipmen
transport before its return to its transport between delivery andholding location [6 and 7] in Fig. 3.
4.2. Data collection
Several different sources were used of a qualitative as well asquantitative nature. The quality criteria of transferability, truth-value and traceability are taken into account in the design anddata collection to support the validity, generalization and reliabilityof the case study research (Da Mota Pedrosa et al., 2012). The mainsources were:
� stakeholder interviews (18 different companies/institutions)� warehouse observations (7 different warehouses at Schiphol)� public cargo data sampling (Schiphol Group data)� freight forwarder company data inputs sampling (sample data offour freight forwarders)
� airline industry cargo data input sampling (sample data of threeprime sources)
Over an eight month period, intensive regular meetings wereheld with the various different stakeholders, in sessions of30e120min. The staff members that were interviewed held various
t transport system, from generation to delivery.

Table 3Allocation of cargo to type of shipment for case study for import and export ship-ments at company level.
Type of cargo flow Import Export
Type of shipment ULD Loose ULD Loose
c1 57% 43% 60% 40%c2 13% 87% 12% 111%c3 61% 39% 69% 31%
S. Ankersmit et al. / Journal of Air Transport Management 40 (2014) 169e181174
different positions, including general managers, operation man-agers, supervisors for import and export cargo and general trans-port consultants. The visits to warehouses were also spread overthe week, varied in length, and were undertaken by at least twodifferent researchers. Table 2 provides an overview of the stake-holders involved. Combining the different data sources fromdifferent stakeholders can help improve the data collection, as wellas supporting the three research criteria (Da Mota Pedrosa et al.,2012).
4.3. Simulation set-up
A simulation method was used to reveal the potential for hori-zontal transport collaboration. The possibility to simulate air cargohandling processes that are in line with the actual situation hasbeen proven by Nsakanda et al. (2004) and Esmemr et al. (2010).The main variables are discussed below.
4.3.1. Shipment arrivals and shipment weightData related to total shipment weight were provided for several
months over 2012 regarding all shipments for each forwarder(import/export). The average share/percentage of ULD and looseshipments was used to specify the total amount of ULD and loosecargo for each forwarder at the air cargo handling facility. Systemdata related to a forwarder's share of cargo at the different handlingfacilities were used to estimate the amount of cargo that wasassigned to the specific handler.
Shipment arrival was estimated using the average daily arrivaland departure of flights at Schiphol (Schiphol, 2012), using thehourly share of flights and the share of cargo that arrives or departsfor each forwarder at a certain point in time. The hourly arrival anddeparture of flights was further simplified by constructing threearrival periods for import and export shipments. The weight dis-tribution of loose cargo shipments (in kilos) was based on alognormal distribution, which has been used in several otherstudies regarding the simulation of air cargo shipments (Huang andChang, 2010; Boonekamp, 2013), as it makes it possible to haveshipments arrive across an extensive value range. For ULD ship-ments, a normal distribution was used, based on the assumptionthat all forwarders try tomaximize their ULD shipment weight. Thespread of the weight is therefore expected to be lower and closer tothe maximum possible weight. Table 4 shows the distributionsused for the generation of shipments. The generation of shipments,with the applied distributions, was adjusted until it came close tothe estimated values of total cargo being processed. These esti-mates were defined for each company individually, by looking atthe average total value for cargo shipments and the total of amountof cargo generated for import and export flows. The shares of ULDand loose cargo (see Table 3), were in line with the average share ofULD and loose cargo that had been provided by the threeforwarders.
Table 2Overview of companies contacted, visited and in attendance at meetings at ACN for the
Stakeholders
Freightforwarders
Air carghandler
Number of companies contacted 20 8Number of companies attending meetings at ACN 10 4Number of companies interviewed at facilities 6 5Number of facilities visited 6 7Number of visits 25 30
Generated shipment, based on the defined distributions, weredisposed of if their shipment weight was less than 50 kilos. Also,shipments larger than 10,000 kilos were removed, as transportresources were limited to carry up to 10,000 kilo of cargo for a giventransport.
Allocation to combined transport was based on simplified logic.Shipments were allocated to combined transport with the specifiedamount (percentage) of cargo that was defined to be allowed totransport within combined transport at the setup of simulation.Table 3 shows the percentage of cargo that was defined for thedifferent types of shipments and transport. Not all shipments thatwere offered for combined transport, however, were ultimatelyallocated to combined transport. Shipments that had to be deliv-ered within a short time frame were excluded from combinedtransport. Furthermore, the shipment weight is limited to theamount of fixed capacity a forwarder has been given or the amountof variable capacity within the defined simulation set-up. Thismeans that, when all three forwarders in the model have beengiven a fixed capacity of 2500 kilos, shipments for any givenforwarder cannot be larger than 5000 kilos, as the combined fixedand variable capacity for one forwarder cannot be greater than2500 (fixed) þ 2500 (variable). Table 5 shows the key differencesbetween the different types of transport available for each type ofshipment. The number of shipments or weight of shipments did notchange, based on the use of additional capacity of combinedtransport. Also, the capacity for both single and combined transportdid not change, based on the changes to the amount of cargoallocated to combined transport.
4.3.2. Cargo handling processObservations at the different warehouse facilities at Schiphol,
combined with information obtained in several interviews, wereused to define the handling times and processing of cargo ship-ments at the airport. Given the relatively high level of uncertaintyabout process times of loose cargo at a given handling facility, thesetimes were based on the exponential distribution. Franz andStolletz (2012) used an exponential distribution of the processtimes of trucks at an air cargo handling facility based on actualobserved data. The main values of exponential distributions werebased on actual observed timings for single company transport andon expected values for combined transport. The handling times ofULD cargo at the handling facility and at the forwarder for ULD and
collaboration project case study.
os
Airlines Trucktransportcompanies
Transportconsultants
Universityexperts
2 6 4 110 3 2 11 1 3 11 1 2 11 1 10 30

Table 4Arrival of shipments for ULD and Loose cargo and weight distributions (shipment weight values in kg).
Type of shipment ULD Loose ULD Loose ULD Loose
Company c1 c1 c2 c2 c3 c3
Weight distribution importDistribution used NORM (2300, 100) LOGNORM (350, 600) NORM (2300, 100) LOGNORM (150, 400) NORM (2300, 100) LOGNORM (310, 600)Shipments per arrival 2 6 1 7 1 6
Weight distribution exportDistribution used NORM (2300, 100) LOGNORM (390, 600) NORM (2300, 100) LOGNORM (180, 400) NORM (2300, 100) LOGNORM (330, 600)Shipments per arrival 1 4 1 7 1 2
S. Ankersmit et al. / Journal of Air Transport Management 40 (2014) 169e181 175
loose shipments were based on triangular distribution, as times forthese processes are much more stable and better known. The dif-ference between handling and processing time of combined andsingle transport is largely defined by the different times of loadingand unloading cargo at the defined facilities. The times for theseprocesses are shown in Table 6.
4.3.3. Transport logic and limitations of transport capacityTransport logic and transport capacity were based on expert
judgment and interview information. Given the use of fixed ca-pacity for transport of the forwarders involved and the lack of in-depth knowledge about the way transport is allocated to certainshipments, simplified transport logic was used. Transport prioritywas based on a defined chance to collect export shipments readyfor collection, before assessing import shipments, because exporttransport generally speaking has a higher priority than import.However, to make sure that import shipments were also collectedand transported within a reasonable time and frequency, all typesof transport were automatically allocated after more than twoconsecutive export transport movements have taken place. Trans-port generation was based on the requirement that one or moreshipments should be ready for collection, and it was only whenmore shipments were waiting than can be collected by one trans-porter that additional transport were generated if transport re-sources were available. Within this simulation, loose and ULD cargowere transported separately, to reduce the complexity of transportand decision-making logic. However, in reality, ULD cargo and loosecargo are sometimes combined, although this is not commonpractice.
4.3.4. Transport resources and operating timesSpecific transport units were defined for ULD and loose trans-
port, as the decision-making logic regarding the allocation to eitherULD or combined transport is unknown. In the model, operatingtimes and amount of transport were defined in line with the actualdata provided by the forwarding companies under examination.The operating times for both loose and ULD transport were definedin the same way.
4.4. Simulation implementation
4.4.1. Simulation setupThe average value key process at handling facilities during
different runs was compared and statistically analyzed. The final
Table 5Shipment and transport restrictions for combined and single company transport within
Simulation variable Shipment weight limitation (kg) S(
Simulation value limits Minimum Maximum M
ULD shipment 1800 2500 1Loose shipment 50 10,000
settings selected for the simulation were 10 runs of 30 days. Therecould have been a shorter simulation run period but a longer run-time was used to compare the simulation results with the dataprovided by the companies. Seasonality and different amounts ofshipments flows for a given forwarder at an air cargo handler can bepoints of concern, and could limit the application of the results tothe entire year. However, given the fact that this simulation relatesto general cargo shipments, the issue of seasonality plays less of arole than it would for perishable cargo.
Publicly available monthly cargo data for the Schiphol Groupfor 2012 and 2011 were used to make sure that the sample dataobtained for the simulation were in line with average of cargo atSchiphol for an ‘ordinary’ month. Cargostats December 2012/2011(Schiphol, 2012, 2013) shows that the average monthly cargo atSchiphol only varies more than 10% for one month a year, while forthe other months it is around five percent. The months with thebiggest difference compared to an ordinary month are oftenJanuary or February, depending on when Chinese New year iscelebrated. The variation of cargo flows at Schiphol for a givenmonth does affect the performance of combined transport. For-warders also adjust their single company transport when needed,which is why it was assumed that, if seasonality did have a majorimpact, the organization and allocation of combined transportwould also be adjusted. Added to this the data used for thesimulation months were not affected by the identified seasonalimpacts.
4.4.2. VerificationThemodel was verified using different verification methods. For
each forwarder, there are four different types of transport that canbe generated for import and export shipments.
� Combined transport ULD� Combined transport loose� Single transport ULD� Single transport loose
The different types of transport were verified by creating ship-ments for each flow, first individually and then by combining thedifferent types of transport. All processes and decision-makinglogic for the different types of transport, from shipment genera-tion to shipment processing at the final destination, were analyzedto assess whether or not the shipment and transport followed theright logic and sequence, and were ultimately disposed of or
the case study.
hipments weight totalper trailer/truck)
Number of shipments total(per trailer/truck)
inimum Maximum Minimum Maximum
800 10,000 1 450 10,000 1 200

Table 6Handling times of shipments for defined locations and type of shipment transport.
Handling times [min] of (un)loading shipments atdifferent locations
c1 c2 c3 H1
Single looseshipments
TRIA(5, 7, 20)
TRIA(5, 7, 20)
TRIA(5, 7, 20)
Exp(8) þ 10
Combined looseshipments
TRIA(3, 7, 15)
TRIA(3, 7, 15)
TRIA(3, 7, 15)
Exp(4) þ 5
ULD shipments(single &combined)
TRIA(2, 5, 7)
TRIA(2, 5, 7)
TRIA(2, 5, 7)
TRIA(4, 6, 10)
S. Ankersmit et al. / Journal of Air Transport Management 40 (2014) 169e181176
returned to their base position. The transported cargo volume andamount of transport generated at a given time were also verifiedusing several variables that showed the amount transport that wasactive and the amount of weight that was allocated to a specifictransport.
4.4.3. ValidationThe simulation outcomes could only be validated to a limited
extent based on actual data. Most of the simulation outcomes werevalidated based on the expert judgment of more than 10 differentfreight forwarders' staff in management and operational positionsand observed timings during the 30 or so visits to the air cargohandling facilities at Schiphol. In addition, industry experts, bothfrom university and consultancy, supported the outcomes of thesimulation.
The most important variables that were used to validate themodel were:
� average company transport load factor (LF)� average amount of transport movements per truck per shift� average amount of shipments for loose import and exporttransport
Table 7 shows that the LF within the system falls within theobserved average LF during visits at several facilities at Schipholand information obtained during interviews.
Tables 7 and 8 also show the amount of transport generated,cargo processed and shipments that were handled within thesimulation model. To validate the extreme value of several pro-cesses and that the throughput times of the systemwere also in linewith the actual observed situation, the minimum, average andmaximum value of several processes regarding certain shipmentflows of the companies involved were analyzed.
Table 7LF total transport movements for each company and number of visits to handlingcompany (import and export).
Import/exportshipmenttransport
c1 c2 c3 Systemtotal
Observed
Load factor 29% 21% 21% 25% 20e40%Transport
movements[30 days]
1483 463 821 2767 Within actual range
Cargo processed(ton) [30 days]
4301 985 1691 6977 Within actual range
Transportmovements[1 day]
49 15 27 92 Within actual range
Cargo processed(ton) [1 days]
143 33 56 233 Within actual range
4.5. Simulation results
To compare the performance of combined transport to that ofsingle transport, the simulation model was first constructed forsingle company transport movements. The process values arepresented in Table 9, which shows that all values observed after 10simulation runs of 30 days fall within the definedmaximumvalues.These defined maximumvalues were derived from interviews withindustry experts.
Table 8 shows that combined transport benefits are the result ofa reduction in unloading and loading times, based on the differentprocess times of combined and single company transport, asdefined in Table 5. The reduction in loading and unloading times asa result of combined transport depends not only on the defineddistributions. Table 9 shows that average unloading times forcombined transport are reduced by 50% and loading of shipmentsby 66%. These reductions are possible because priority is given toloading and unloading shipments of combined transport, whichresults in lower processing times.
Tables 9 and 10 show the performance of the single transportsystem for the total loose and ULD cargo transport of the for-warding companies. The values defined in these tables clearly showthe different amounts of transport capacity available at forwardingcompanies in relation to their total amount of cargo, resulting indifferent average throughput times with regard of the differenttypes of shipments. Table 10 shows the average throughput times ofthe simulation model, which are in line with the actual valuesprovided by the freight forwarders, which means it can be assumedthat these values are representative of the airport transport system.
Table 10 shows the total and average throughput times for singlecompany organized transport for ULD and loose cargo transport.Table 11 shows that there are two different values defined whenshipments arrive late, based on shipment deadlines andthroughput times. To compare the actual performance of combinedtransport in relation to its operation time and the process time ofshipments, the second deadline checks whether the delivery pro-cess takes longer than specified in Table 11 for four differentshipments transport flows, based on process times and operationstimes of combined transport. The first deadline was defined byallowing a maximum of 1% shipments to be late, and was not basedon actual data, as the companies (c1ec3) were unable to provideactual information. The defined deadlines in Table 11were based ondeadlines mentioned during stakeholder interviews and are oftenbased on legal requirements for the inner-airport transport andprocessing times of shipments.
4.5.1. Transport costs per kiloThe calculation of transport costs per kilo was based on several
values that were defined in relation to the weight being that weretransported over time. Table 12 shows the most important KPI's ofsingle company transport system.
Three scenarios were defined with different levels of collab-oration based on the transport costs that can be realized andother important transport performance indicators, the number oftransport movements, delay times and throughput times. Due tothe fact that certain shipments will always be sensitive totransport collaboration based on shipper requirements, not allshipments are allocated to combined transport. It is only whenmore than 50% of shipments is allocated to combined transportthat costs can be realized that are lower than the lowest singlecompany transport costs for all types of shipment transport.Allocating more than 90% of shipments to combined transport isnot assumed to be realistic, due to the reduced transport per-formance of combined transport, compared to single companytransport.
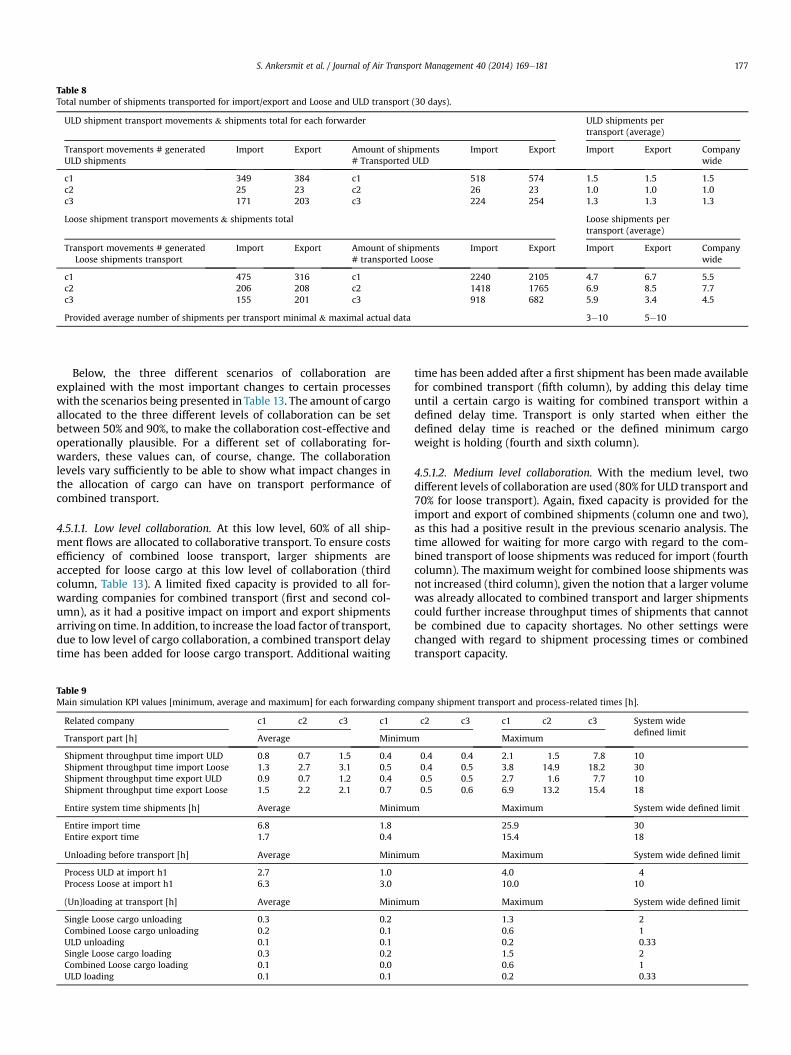
Table 8Total number of shipments transported for import/export and Loose and ULD transport (30 days).
ULD shipment transport movements & shipments total for each forwarder ULD shipments pertransport (average)
Transport movements # generatedULD shipments
Import Export Amount of shipments# Transported ULD
Import Export Import Export Companywide
c1 349 384 c1 518 574 1.5 1.5 1.5c2 25 23 c2 26 23 1.0 1.0 1.0c3 171 203 c3 224 254 1.3 1.3 1.3
Loose shipment transport movements & shipments total Loose shipments pertransport (average)
Transport movements # generatedLoose shipments transport
Import Export Amount of shipments# transported Loose
Import Export Import Export Companywide
c1 475 316 c1 2240 2105 4.7 6.7 5.5c2 206 208 c2 1418 1765 6.9 8.5 7.7c3 155 201 c3 918 682 5.9 3.4 4.5
Provided average number of shipments per transport minimal & maximal actual data 3e10 5e10
S. Ankersmit et al. / Journal of Air Transport Management 40 (2014) 169e181 177
Below, the three different scenarios of collaboration areexplained with the most important changes to certain processeswith the scenarios being presented in Table 13. The amount of cargoallocated to the three different levels of collaboration can be setbetween 50% and 90%, to make the collaboration cost-effective andoperationally plausible. For a different set of collaborating for-warders, these values can, of course, change. The collaborationlevels vary sufficiently to be able to show what impact changes inthe allocation of cargo can have on transport performance ofcombined transport.
4.5.1.1. Low level collaboration. At this low level, 60% of all ship-ment flows are allocated to collaborative transport. To ensure costsefficiency of combined loose transport, larger shipments areaccepted for loose cargo at this low level of collaboration (thirdcolumn, Table 13). A limited fixed capacity is provided to all for-warding companies for combined transport (first and second col-umn), as it had a positive impact on import and export shipmentsarriving on time. In addition, to increase the load factor of transport,due to low level of cargo collaboration, a combined transport delaytime has been added for loose cargo transport. Additional waiting
Table 9Main simulation KPI values [minimum, average and maximum] for each forwarding com
Related company c1 c2 c3 c1
Transport part [h] Average Minimu
Shipment throughput time import ULD 0.8 0.7 1.5 0.4Shipment throughput time import Loose 1.3 2.7 3.1 0.5Shipment throughput time export ULD 0.9 0.7 1.2 0.4Shipment throughput time export Loose 1.5 2.2 2.1 0.7
Entire system time shipments [h] Average Minimu
Entire import time 6.8 1.8Entire export time 1.7 0.4
Unloading before transport [h] Average Minimu
Process ULD at import h1 2.7 1.0Process Loose at import h1 6.3 3.0
(Un)loading at transport [h] Average Minimu
Single Loose cargo unloading 0.3 0.2Combined Loose cargo unloading 0.2 0.1ULD unloading 0.1 0.1Single Loose cargo loading 0.3 0.2Combined Loose cargo loading 0.1 0.0ULD loading 0.1 0.1
time has been added after a first shipment has been made availablefor combined transport (fifth column), by adding this delay timeuntil a certain cargo is waiting for combined transport within adefined delay time. Transport is only started when either thedefined delay time is reached or the defined minimum cargoweight is holding (fourth and sixth column).
4.5.1.2. Medium level collaboration. With the medium level, twodifferent levels of collaboration are used (80% for ULD transport and70% for loose transport). Again, fixed capacity is provided for theimport and export of combined shipments (column one and two),as this had a positive result in the previous scenario analysis. Thetime allowed for waiting for more cargo with regard to the com-bined transport of loose shipments was reduced for import (fourthcolumn). The maximumweight for combined loose shipments wasnot increased (third column), given the notion that a larger volumewas already allocated to combined transport and larger shipmentscould further increase throughput times of shipments that cannotbe combined due to capacity shortages. No other settings werechanged with regard to shipment processing times or combinedtransport capacity.
pany shipment transport and process-related times [h].
c2 c3 c1 c2 c3 System widedefined limit
m Maximum
0.4 0.4 2.1 1.5 7.8 100.4 0.5 3.8 14.9 18.2 300.5 0.5 2.7 1.6 7.7 100.5 0.6 6.9 13.2 15.4 18
m Maximum System wide defined limit
25.9 3015.4 18
m Maximum System wide defined limit
4.0 410.0 10
m Maximum System wide defined limit
1.3 20.6 10.2 0.331.5 20.6 10.2 0.33

Table 10Overview of average throughput times of single company transport shipments forULD and Loose transport (in h).
Average throughput times of singletransport shipments (h)
c1 c2 c3
Loose import 7.6 9.11 9.53Loose export 1.47 2.2 2.1ULD import 2.2 2.1 2.83ULD export 0.91 0.69 1.21
Table 12Overview of transport performance case study simulation of ULD and loose trans-port at system level (30 days) between forwarder and air cargo handler (singlecompany transport).
KPI transportindicators singletransport(system average)
KPI specifiedsimulationvariables
Systemwide loosetransport
Systemwide ULDtransport
Systemtotal
Transportmovements
Importmovements
837 541 1378
Exportmovements
726 609 1335
Cargo processedin [kilo]
Import cargo 1,615,300 1,762,942 3,378,242Export cargo 1,642,339 1,956,700 3,599,039
Load factor oftransport [kilos]
Load factor(kilo/truck)
2084 3234 2571
Number ofshipments late
# Importshipments late
281 0 281
# Exportshipments late
15 0 15
Number ofshipmentslater thandefined time
# Importshipments latedefined time
12 0 12
# Exportshipmentslate definedtime
4 0 4
Throughputtimetransport [h]
Throughputtime import
8.49 3.76 8.45
Throughputtime export
1.84 1.01 1.76T
Transportcosts perkilo
All cargo(import &export)
V 0.0383 V 0.0336 V 0.0358
S. Ankersmit et al. / Journal of Air Transport Management 40 (2014) 169e181178
4.5.1.3. High level collaboration on small shipments. At the highlevel, 90% of ULD and 90% of loose shipments are allocated tocollaboration transport. Unlike the previous scenarios, fixed ca-pacity is only added for the export of loose cargo, and shipments(second column) are only accepted for collaboration at a lowerweight maximum (third column). As before, the holding and delaytime for transport demand is maintained before transport isgenerated, but only for import (fourth column) and not for theexport of loose cargo (sixth column), as more export cargo de-mands more frequent transport movements, to limit the increase ofthroughput times and the amount of shipments that arrive late,which is less acceptable for export than it is for import.
4.5.2. Combined ULD transportTable 14 shows the performance of combined ULD transport for
the collaboration scenarios. It shows that the fixed capacity com-bined ULD transport can only support effective ULD transport up toa certain level, when a very limited amount of ULD cargo is allo-cated to combined transport. It does not perform as well as theaverage single ULD transport without any collaboration. This can beexplained by the marginal utility concept, adding ULD shipments tocombined transport does not improve the performance of thecombined transport with the given transport resource and timeavailable for transportation. The increase in throughput time forexport by ULD combined transport is almost double the averagetime of single company ULD transport in all scenarios, making thistype of transport collaboration less attractive, as ULD's for exportare often only completed just before the planned transport takesplace. Based on the performance of ULD transport and the relativelysmall increase in throughput time for combined import ULDtransport, ULD transport up to a level similar to the mediumcollaboration seems to provide an acceptable result, as costs in-crease after further allocation of ULD transport.
4.5.3. Combined loose cargo transportThe transport performance analysis is based on the three
simulated levels of collaboration for loose cargo, based on thevalues of Table 15, which shows that the combined transport sys-tem is able to transport even a high amount of loose cargowithout asignificant increase in average throughput times. However, thenumber of shipments that arrive late increases considerably. Whileit is technically possible to transport all loose cargo with thecombined transport system, it depends on which level forwardingcompanies will support combined loose transport. Given the time-sensitive nature of air cargo shipments, at some point the benefits
Table 11Throughput time deadlines for defined second deadline.
Deadline time for shipments (h) Import transport Export transport
ULD cargo shipment 12 2Loose cargo shipment 18 2
of increased truck load factors, with a lower amount transportmovements can start to conflict with the time pressure of ship-ments destined for onward transport. It can, therefore, be expectedthat not all import and export shipments will be allocated tocombined loose transport, given the operational constraints andpreferences, especially with regard to export shipments, wherecustoms and security-related checks could increase the urgency ofshipping the cargo.
The changes in performance of combined transport based on thelevel of collaboration are shown in Figs. 4 and 5. These show thatallocating more shipments to combined transport reduces theoverall transport costs. The reduction in costs is less at the highestlevel of collaboration for ULD transport, but much more for loosetransport with only a limited number of additional transportmovements. Although based on overall transport costs it can beassumed that it is more beneficial to support the highest level ofcombined transport, as not all aspects related to transport perfor-mance are affected positively by the highest level of collaboration,as average throughput times for combined transport shipmentsincrease and result in more shipments arriving late. It can beconcluded, based on a higher level of collaboration, that theamount of cargo being transported and the average load factor canstill increase with a higher level of collaboration, which results inlower transport costs and fewer overall transport movements.
Fig. 5 shows that the transport costs per kilo increase for ULDimport at a high level collaboration, which can be explained by thefact that combined ULD transport is shared between import andexport, with priority being given to export. With a high level ofcombined ULD transport, more export ULD transport is realized,which means that less import transport can be generated. This

Table 13Overview of key differences of transport collaboration variables for the defined collaboration scenarios (capacity, shipment weight in kilos and delay time in minutes).
Level ofcollaboration
Fixed cargocapacityimport
Fixed cargocapacityexport
Maximum weightshipment combinedtransport
Delay time importshipments combined
Delay time weightimport shipmentscombined
Delay time exportshipmentscombined
Delay time weightexport shipmentscombined
Low 1250 1250 2500 45 3750 30 2500Medium 1250 1250 2500 30 2500 30 2500High 0 1250 2000 30 2500 0 1250
Table 14Overview of combined ULD transport performance in relation to different ULD allocation scenario for combined transport (30 days).
Combined cargo transport ULD Collaboration extent Low Medium High
Total transport # movements combined # Import movements ULD cargo 316 358 365# Export movements ULD cargo 406 490 515
Total amount of ULD cargo processed bycombined transport [kilo]
Import cargo ULD 1,061,039 1,425,047 1,173,913Export cargo ULD 1,165,930 1,582,303 1,739,520
Average load factor of ULD cargo transport [kilo/truck] LF ULD transport collaboration 3087 3549 3311
Number of shipments late Import ULD shipments late 5 9 14Export ULD shipment late 17 25 26
Number of shipments later than defined time Import ULD shipments late defined time 4 10 17
Throughput time ULD cargo transport [h] Throughput time import ULD 4.43 4.63 5Throughput time export ULD 1.65 1.79 2
Transport costs [V/kilo cargo] Transport costs import ULD cargo V 0.023 V 0.017 V 0.021Transport costs export ULD cargo V 0.021 V 0.015 V 0.014
Amount of potential reduction of movements # Import movements ULD cargo 10 79 �5# Export movements ULD cargo �43 3 27% Of total movements ULD cargo 3% �7% �2%
S. Ankersmit et al. / Journal of Air Transport Management 40 (2014) 169e181 179
shows that combing ULD transport for both import and exportflows works better at a lower level of collaboration.
5. Conclusion and future research
5.1. Conclusion
This paper proposes a general framework that can be used toassess how air cargo transport collaboration can be applied. Thevalue of transport collaboration through a real-world case studyanalysis and simulation of horizontal collaboration involving air
Table 15Overview of combined loose transport performance in relation to different loose allocati
Combined cargo transport loose Collaboration extent
Total transport # movements combined # Import movements Lo# Export movements Loo
Total amount of Loose cargo processed bycombined transported [kilo]
Import cargo LooseExport cargo Loose
Average load factor of Loose cargo transport [kilo/truck] LF Loose cargo transport
Number of shipments late Import Loose shipmentsExport Loose shipments
Number of shipments later than defined time Import Loose shipmentsExport Loose cargo trans
Throughput time Loose cargo transport [h] Throughput time importThroughput time export
Transport costs [V/kilo cargo] Transport cost import LoTransport cost export Lo
Amount of potential reduction of movements #Import movements Loo#Export movements Loo% Of total movements Lo
cargo transport at Schiphol airport is shown. Both the qualitativeand quantitative results provide insight into the potential for hor-izontal transport collaboration within an air cargo airport system,which has not been found in existing literature on air transport. Itcan also further support transport collaboration for more dynamictransport systems on short distance transport. Finally, based onactual data of cargo shipment transport at a major airport, thisstudy argues that the current and future expected dynamics of aircargo transport will make it more challenging for single companytransport to be organized in an effective way for the foreseeablefuture. This is why there is a high potential for horizontal transport
on scenario for combined transport (30 days).
Low Medium High Base case
ose cargo 271 313 321 346se cargo 257 267 300 309
871,753 1,025,973 1,329,017 1,068,987881,576 1,008,500 1,241,788 1,014,436
collaboration 3323 3511 4139 3183
late 335 402 555 431late 135 165 197 153
late defined time 16 21 35 24port late defined time 85 91 112 89
Loose cargo 9.71 9.80 9.91 9.03Loose cargo 3.60 3.55 3.43 3.36
ose cargo V 0.028 V 0.024 V 0.018 V 0.023ose cargo V 0.028 V 0.024 V 0.020 V 0.024
se cargo 181 219 368 208se cargo 133 179 249 140ose cargo �20% �25% �39% �22%
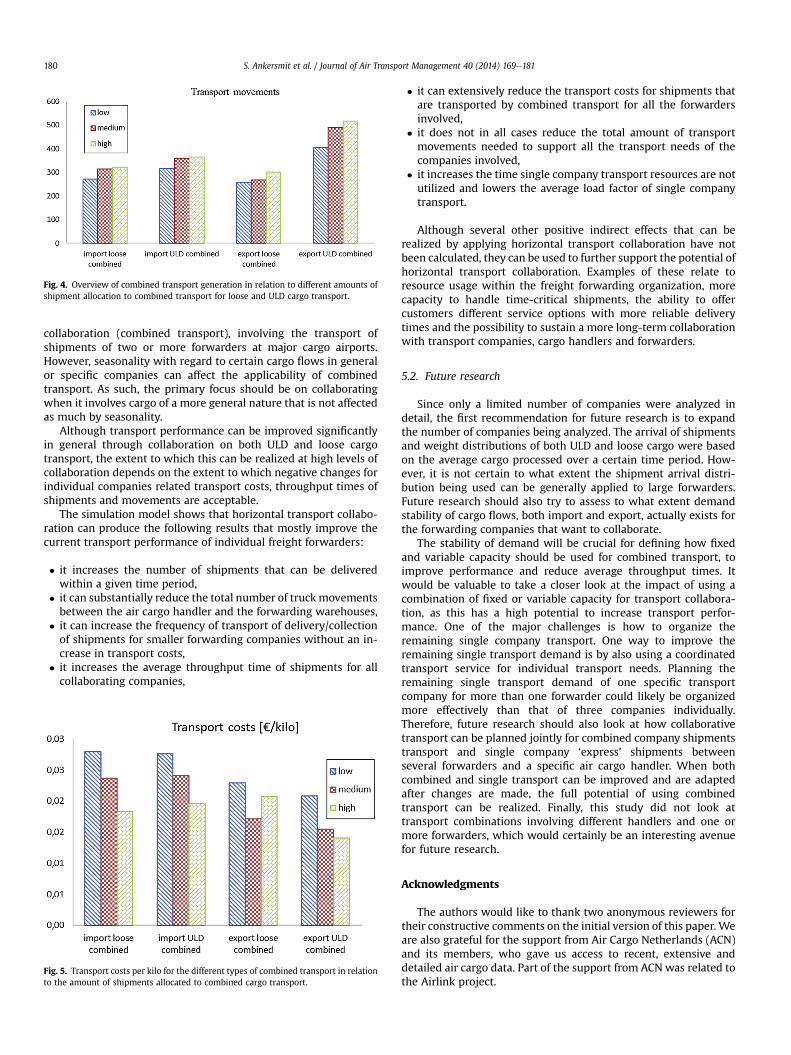
Fig. 4. Overview of combined transport generation in relation to different amounts ofshipment allocation to combined transport for loose and ULD cargo transport.
S. Ankersmit et al. / Journal of Air Transport Management 40 (2014) 169e181180
collaboration (combined transport), involving the transport ofshipments of two or more forwarders at major cargo airports.However, seasonality with regard to certain cargo flows in generalor specific companies can affect the applicability of combinedtransport. As such, the primary focus should be on collaboratingwhen it involves cargo of a more general nature that is not affectedas much by seasonality.
Although transport performance can be improved significantlyin general through collaboration on both ULD and loose cargotransport, the extent to which this can be realized at high levels ofcollaboration depends on the extent to which negative changes forindividual companies related transport costs, throughput times ofshipments and movements are acceptable.
The simulation model shows that horizontal transport collabo-ration can produce the following results that mostly improve thecurrent transport performance of individual freight forwarders:
� it increases the number of shipments that can be deliveredwithin a given time period,
� it can substantially reduce the total number of truckmovementsbetween the air cargo handler and the forwarding warehouses,
� it can increase the frequency of transport of delivery/collectionof shipments for smaller forwarding companies without an in-crease in transport costs,
� it increases the average throughput time of shipments for allcollaborating companies,
Fig. 5. Transport costs per kilo for the different types of combined transport in relationto the amount of shipments allocated to combined cargo transport.
� it can extensively reduce the transport costs for shipments thatare transported by combined transport for all the forwardersinvolved,
� it does not in all cases reduce the total amount of transportmovements needed to support all the transport needs of thecompanies involved,
� it increases the time single company transport resources are notutilized and lowers the average load factor of single companytransport.
Although several other positive indirect effects that can berealized by applying horizontal transport collaboration have notbeen calculated, they can be used to further support the potential ofhorizontal transport collaboration. Examples of these relate toresource usage within the freight forwarding organization, morecapacity to handle time-critical shipments, the ability to offercustomers different service options with more reliable deliverytimes and the possibility to sustain a more long-term collaborationwith transport companies, cargo handlers and forwarders.
5.2. Future research
Since only a limited number of companies were analyzed indetail, the first recommendation for future research is to expandthe number of companies being analyzed. The arrival of shipmentsand weight distributions of both ULD and loose cargo were basedon the average cargo processed over a certain time period. How-ever, it is not certain to what extent the shipment arrival distri-bution being used can be generally applied to large forwarders.Future research should also try to assess to what extent demandstability of cargo flows, both import and export, actually exists forthe forwarding companies that want to collaborate.
The stability of demand will be crucial for defining how fixedand variable capacity should be used for combined transport, toimprove performance and reduce average throughput times. Itwould be valuable to take a closer look at the impact of using acombination of fixed or variable capacity for transport collabora-tion, as this has a high potential to increase transport perfor-mance. One of the major challenges is how to organize theremaining single company transport. One way to improve theremaining single transport demand is by also using a coordinatedtransport service for individual transport needs. Planning theremaining single transport demand of one specific transportcompany for more than one forwarder could likely be organizedmore effectively than that of three companies individually.Therefore, future research should also look at how collaborativetransport can be planned jointly for combined company shipmentstransport and single company ‘express’ shipments betweenseveral forwarders and a specific air cargo handler. When bothcombined and single transport can be improved and are adaptedafter changes are made, the full potential of using combinedtransport can be realized. Finally, this study did not look attransport combinations involving different handlers and one ormore forwarders, which would certainly be an interesting avenuefor future research.
Acknowledgments
The authors would like to thank two anonymous reviewers fortheir constructive comments on the initial version of this paper. Weare also grateful for the support from Air Cargo Netherlands (ACN)and its members, who gave us access to recent, extensive anddetailed air cargo data. Part of the support from ACN was related tothe Airlink project.

S. Ankersmit et al. / Journal of Air Transport Management 40 (2014) 169e181 181
References
Agarwal, R., Ergun, €O., Houghtalen, L., Ozener, O.O., 2009. Collaboration in cargotransportation. In: Optimization and Logistics Challenges in the Enterprise.Springer US, pp. 373e409.
Airbus, 2013. Global market forecast e future journey's 2013e2032. Airbus.Toulouse.
Appold, S.J., Kasarda, J.D., 2011. The change in reign: as Hong Kong internationalbecomes the world's top air cargo airport, challenges lie ahead. Glob. AirportCities 5 (1), 24e26.
Audy, J.F., D'Amours, S., 2008. Impact of benefit sharing among companies in theimplantation of a collaborative transportation system e an application in thefurniture industry. In: Camarinha-Matos, L.M., Picard, W. (Eds.), PervasiveCollaborative Networks. Springer US, pp. 519e532.
Barratt, M., 2004. Understanding the meaning of collaboration in the supply chain.Supply Chain Manag. Int. J. 9 (1), 30e42.
Boonekamp, T., 2013. Air Cargo Revenue Management (Amsterdam).Capgemini, 2010. Fast-moving Consumer Goods Industry: 2010 Third-party Logis-
tics Study (Georgia).Cruijssen, F., Cools, M., Dullaert, W., 2007. Horizontal cooperation in logistics: op-
portunities and impediments. Transp. Res. Part E: Logist. Transp. Rev. 43 (2),129e142.
Cruijssen, F., Salomon, M., 2004. Empirical Study: Order Sharing between Trans-portation Companies May Result in Cost Reductions between 5 to 15 Percent(Tilburg, 0924-7815).
Da Mota Pedrosa, A., N€aslund, D., Jasmand, C., 2012. Logistics case study basedresearch: towards higher quality. Int. J. Phys. Distrib. Logist. Manag. 42 (3),275e295.
Esmemr, S., Ceti, I.B., Tuna, O., 2010. A simulation for optimum terminal trucknumber in a Turkish port based on lean and green concept. Asian J. Shipp.Logist. 26 (2), 277e296.
Franz, A., Stolletz, R., 2012. Performance analysis of slot-based appointmentscheduling for truck handling operations at an air cargo terminal. In: G.A.R.S.Junior Researchers' Workshop 2012. University of Mannheim, Bremen.
GCI, 2009. Global Commerce Initiative Information Sharing Report.Graebel, 2012. The Anticipated Growth of Air Cargo: What May be Ahead for Air
Cargo (Aurora).Holweg, M., Disney, S., Holmstr€om, J., Småros, J., 2005. Supply chain collaboration:
making sense of the strategy continuum. Eur. Manag. J. 23 (2), 170e181.Huang, K., Chang, K.-C., 2010. An approximate algorithm for the two-dimensional
air cargo revenue management problem. Transp. Res. E: Logist. Transp. Rev.46 (3), 426e435.
IATA, 2012. Cargo e-chartbook q4 2012 (Montreal).Jüttner, U., Christopher, M., Baker, S., 2007. Demand chain management e inte-
grating marketing and supply chain management. Ind. Market. Manag. 36 (3),377e392.
Lambert, D.M., 2008. Supply Chain Management: Process, Partnership, Perfor-mance, third ed. Supply Chain Management Institute, Sarasota, Florida.
Leitner, R., Meizer, F., Prochazka, M., Sihn, W., 2011. Structural concepts for hori-zontal cooperation to increase efficiency in logistics. CIRP J. Manuf. Sci. Technol.4 (3), 332e337.
Maskell, B., 2001. The age of agile manufacturing. Supply Chain Manag. Int. J. 6 (1),5e11.
Mason, R., Lalwani, C., Boughton, R., 2007. Combining vertical and horizontalcollaboration for transport optimisation. Supply Chain Manag. Int. J. 12 (3),187e199.
Nsakanda, A.L., Turcotte, M., Diaby, M., 2004. Air cargo operations evaluation andanalysis through simulation. In: Simulation Conference, 2004. Proceedings ofthe 2004 Winter, 1790e1798, vol. 2.
Pyza, D., Golda, P., 2011. Transport cargo handling shipments in air transport in theaspect of supply chains. In: Systems Engineering (ICSEng), 2011, 21st Interna-tional Conference on, pp. 442e445.
Rezaei, J., Ortt, R., 2012. A multi-variable approach to supplier segmentation. Int. J.Prod. Res. 50 (16), 4593e4611.
Rezaei, J., Ortt, R., 2013. Supplier segmentation using fuzzy logic. Ind. Market.Manag. 42 (4), 507e517.
Sahay, B.S., 2003. Supply chain collaboration: the key to value creation. Int. J. Prod.Perform. Manag. 52 (2), 76e83.
Schiphol, 2012. Traffic Review 2011 (Schiphol).Schiphol, 2013. Traffic Review 2012 (Schiphol).Stephens, C., 2006. Enablers and Inhibitors to Horizontal Collaboration between
Competitors: an Investigation in UK Retail Supply Chains (Cranfield).TNO, 2012. Verkennende studie naar de gevolgen van het stilgelegde vliegverkeer
door de aswolk e leren van de crisis (Delft).Vanovermeire, C., S€orensen, K., Breedam, A.V., Vannieuwenhuyse, B., Verstrepen, S.,
2014. Horizontal logistics collaboration: decreasing costs through flexibility andan adequate cost allocation strategy. Int. J. Logist. Res. Appl. Lead. J. SupplyChain Manag. 17 (4), 339e355.
Visser, L., 2009. Thresholds in Logistics Collaboration Decisions e a Study in theChemical Industry (Tilburg).
Zhang, A., Zhang, Y., 2002. Issues on liberalization of air cargo services in interna-tional aviation. J. Air Transp. Manag. 8 (5), 275e287.
Related Documents