RESEARCH ARTICLE The potential impacts of changes in ecological networks, land use and climate on the Eurasian crane population in Estonia Aivar Leito • Robert Gerald Henry Bunce • Mart Ku ¨ lvik • Ivar Ojaste • Janar Raet • Miguel Villoslada • Meelis Leivits • Anne Kull • Valdo Kuusemets • Tiiu Kull • Marc Joris Metzger • Kalev Sepp Received: 19 March 2014 / Accepted: 19 January 2015 Ó Springer Science+Business Media Dordrecht 2015 Abstract Context The Eurasian crane (Grus grus) is an iconic and sensitive species. It is therefore necessary to understand its landscape ecology in order to determine threats. Objectives (1) To map the distribution of cranes and then model their habitat requirements in Estonia, linked to the current level of protection. (2) To determine the environmental characteristics of, and the habitats present in, sites utilized by the birds, and their sensitivity to change. Methods (1) The distribution of cranes was recorded by observation and by tracking individuals. A model of potential breeding sites was compared with the occurrence of the bird in Estonia and then linked to protected sites. (2) The seasonal distribution of the bird was overlaid with a European environmental classification and the CORINE land cover map. A model of climate change was also utilized. Results (1) A new map of European migration routes, wintering and stopover sites is presented. (2) The bird requires a habitat network, with wetlands being essential for nesting and roosting. The compo- sition of habitats used for feeding varies according to geographical location. (3) In Estonia not all potential breeding sites are occupied and many existing sites are not protected. (4) Climate change could threaten populations in the south but could be beneficial in Estonia. Conclusions (1) The existing ecological network in Estonia is adequate to maintain a viable breeding population of the Eurasian crane. (2) Climate change could support the breeding of cranes but complicate their migration and wintering. Keywords Eurasian crane Á Flyways Á Wintering sites Á Breeding habitats Á Wetlands Á Cereal fields Á Protection Introduction The Eurasian crane (Grus grus) has an exceptionally wide distribution, extending from latitude 70°N to 40°N and from longitude 0°E to 130°E (Deinet et al. 2013; Species Assessments 2014). The European breeding population comprises over 120,000 breeding A. Leito (&) Á R. G. H. Bunce Á M. Ku ¨lvik Á I. Ojaste Á J. Raet Á M. Villoslada Á A. Kull Á V. Kuusemets Á T. Kull Á K. Sepp Estonian University of Life Sciences, Kreutzwaldi 5, 51014 Tartu, Estonia e-mail: [email protected] K. Sepp e-mail: [email protected] M. Leivits University of Tartu, Vanemuise 46, 51014 Tartu, Estonia M. J. Metzger The University of Edinburgh, Drummond Street, Edinburgh EH8 9XP, UK 123 Landscape Ecol DOI 10.1007/s10980-015-0161-0

Welcome message from author
This document is posted to help you gain knowledge. Please leave a comment to let me know what you think about it! Share it to your friends and learn new things together.
Transcript
RESEARCH ARTICLE
The potential impacts of changes in ecological networks,land use and climate on the Eurasian crane populationin Estonia
Aivar Leito • Robert Gerald Henry Bunce • Mart Kulvik • Ivar Ojaste •
Janar Raet • Miguel Villoslada • Meelis Leivits • Anne Kull • Valdo Kuusemets •
Tiiu Kull • Marc Joris Metzger • Kalev Sepp
Received: 19 March 2014 / Accepted: 19 January 2015
� Springer Science+Business Media Dordrecht 2015
Abstract
Context The Eurasian crane (Grus grus) is an iconic
and sensitive species. It is therefore necessary to
understand its landscape ecology in order to determine
threats.
Objectives (1) To map the distribution of cranes and
then model their habitat requirements in Estonia,
linked to the current level of protection. (2) To
determine the environmental characteristics of, and
the habitats present in, sites utilized by the birds, and
their sensitivity to change.
Methods (1) The distribution of cranes was recorded
by observation and by tracking individuals. A model
of potential breeding sites was compared with the
occurrence of the bird in Estonia and then linked to
protected sites. (2) The seasonal distribution of the
bird was overlaid with a European environmental
classification and the CORINE land cover map. A
model of climate change was also utilized.
Results (1) A new map of European migration
routes, wintering and stopover sites is presented. (2)
The bird requires a habitat network, with wetlands
being essential for nesting and roosting. The compo-
sition of habitats used for feeding varies according to
geographical location. (3) In Estonia not all potential
breeding sites are occupied and many existing sites are
not protected. (4) Climate change could threaten
populations in the south but could be beneficial in
Estonia.
Conclusions (1) The existing ecological network in
Estonia is adequate to maintain a viable breeding
population of the Eurasian crane. (2) Climate change
could support the breeding of cranes but complicate
their migration and wintering.
Keywords Eurasian crane � Flyways �Wintering
sites � Breeding habitats �Wetlands � Cereal fields �Protection
Introduction
The Eurasian crane (Grus grus) has an exceptionally
wide distribution, extending from latitude 70�N to
40�N and from longitude 0�E to 130�E (Deinet et al.
2013; Species Assessments 2014). The European
breeding population comprises over 120,000 breeding
A. Leito (&) � R. G. H. Bunce � M. Kulvik �I. Ojaste � J. Raet � M. Villoslada � A. Kull �V. Kuusemets � T. Kull � K. Sepp
Estonian University of Life Sciences, Kreutzwaldi 5,
51014 Tartu, Estonia
e-mail: [email protected]
K. Sepp
e-mail: [email protected]
M. Leivits
University of Tartu, Vanemuise 46, 51014 Tartu, Estonia
M. J. Metzger
The University of Edinburgh, Drummond Street,
Edinburgh EH8 9XP, UK
123
Landscape Ecol
DOI 10.1007/s10980-015-0161-0
pairs and 500,000 individuals, and the numbers are
expanding throughout the continent (Deinet et al.
2013; Species Assessments 2014). For example, in the
United Kingdom (UK), the population increased from
one pair in 1981 to 22 pairs in 2012 (Prowse 2013; The
Great Crane Project 2014), and the most recent figures
show a further increase. Unlike Estonia, the crane
became extinct in the UK in approximately in 1650
due to hunting and drainage projects, although the
major wetlands such as the Norfolk Broads, where it
now breeds, would have still been present at that time
(Great Crane Project 2014). In Estonia, there were 300
pairs in 1970, increasing to 7,500 pairs by 2012.
However, the rate of increase has slowed in recent
years (Leito et al. 2005; Leito 2012; Elts et al. 2013).
The expansion is probably due to the large number of
potential crane nesting sites in Estonia connected with
the high frequency of natural wetlands and new
wetlands that have emerged as a result of the
transformation of former gravel, sand and peat cutting
quarries into wetlands (Leito et al. 2003, 2005).
The adjacent presence of cereal fields and grass-
lands, as described by Leito et al. (2006) is also
important. Apart from a major increase in forest area
during the 1980s (Palang et al. 1998), the balance of
land use and associated land cover has remained
relatively constant in Estonia over the last 20 years.
The present pattern of land use is unlikely to change,
unless there is a major increase in cereal prices, which
may lead to some abandoned fields on poorer soils
being converted back into crops. However, the wet-
lands are unlikely to be drained because of the high
costs involved. The adjacent scrub is also unlikely to
be cleared, as it generally present on water saturated
soils. Other factors, such as hunting, have also
remained stable, and it is therefore difficult to attribute
the increase in crane numbers to a specific individual
factor.
The Eurasian crane is an iconic species and has
considerable support amongst ornithologists and the
public, to the extent that sites for observation
throughout Europe are available on the internet
(Kraniche 2014; The Great Crane Project 2014).
Substantial new important information on crane
distribution, breeding, and migration has recently
been made available in the proceedings of interna-
tional crane research meetings, e.g. Ilyashenko and
Winter (2011), Harris (2012) and Nowald et al. (2013).
Other sources of data are in a bird atlas (Saurola et al.
2013), and on the internet (European Crane Working
Group 2014; Kraniche 2014, Migration map 2014;
Satelliittikurjet 2014).
Approximately 90 % of the Estonian crane popu-
lation overwinter further south in Europe, and the
remainder in Africa (Species Assessments 2014). The
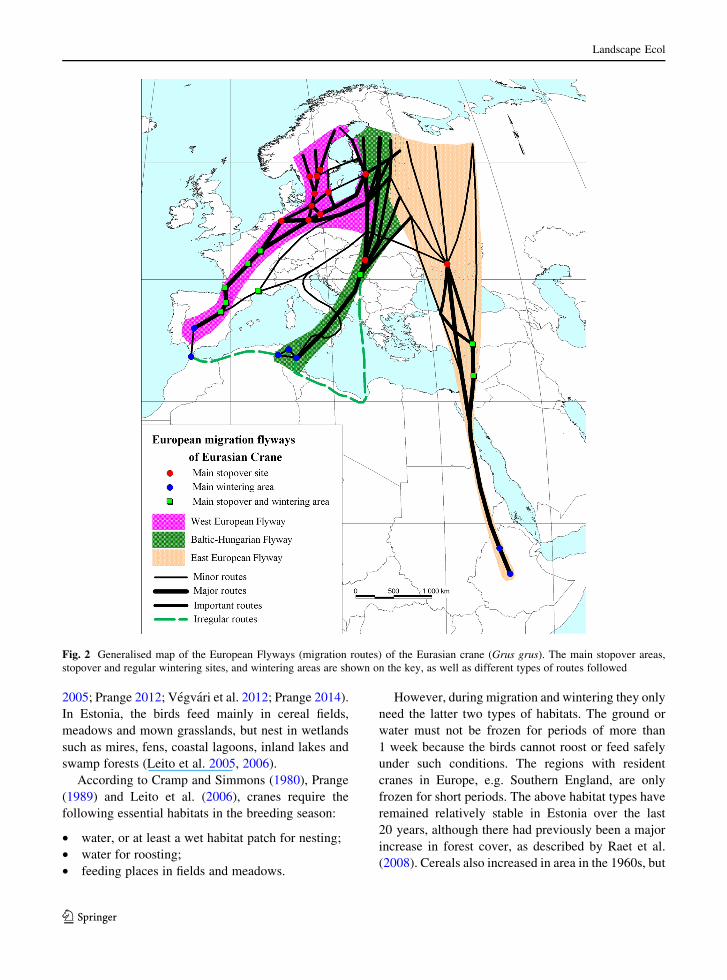
Eurasian crane has three main flyways (migration
routes) in Europe—the West European Flyway, Bal-
tic-Hungarian or Central European Flyway, and the
East European Flyway (Nowald 2010), as discussed in
detail below. The West European and Central Euro-
pean Flyways are approximately 3,500 km in length,
and the East European Flyway is approximately
6,000 km in length. The most northern regular win-
tering areas of cranes are situated in northern France
on the West European Flyway and in southern
Hungary on the Central European Flyway. However,
during the winter of 2012, up to 10,000 cranes also
wintered in northern Germany (Nowald et al. 2012,
2013). The distance between the southern border of the
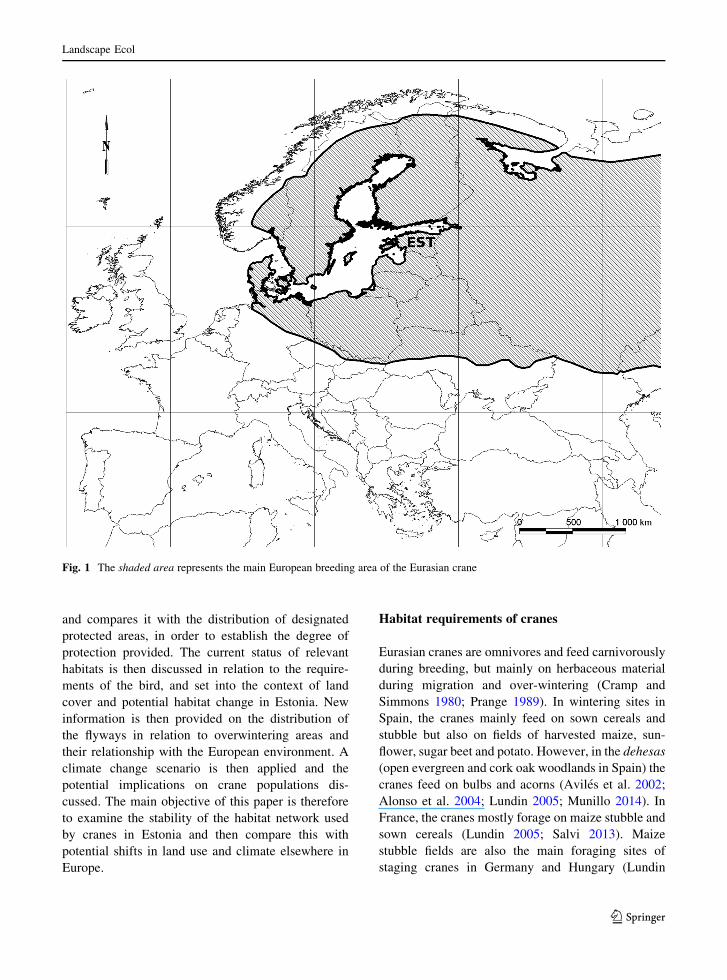
main breeding area of cranes, shown in Fig. 1, and the
nearest regular wintering area, is approximately
500 km on the West European and Central European
Flyways and 1,300 km on the East European Flyway,
as shown in Fig. 2 (Leito et al. 2011; Deinet et al.
2013; Nowald et al. 2013). Cranes breeding in eastern
Finland and eastern Estonia use all three main
European Flyways (Leito et al. 2011; Saurola et al.
2013; Suorsa and Hakkarainen 2013; Migration map
2014).
Leito et al. (2008) have discussed the increase in
numbers of Eurasian cranes in Estonia up to 2006
and emphasized the importance of cereal fields as
opposed to other crops. They concluded that
changes in the ecological networks at the stopover
areas could be more important than the conditions in
the breeding sites. At all sites, the cranes need a
combination of habitats such as wetlands and cereal
fields. Another factor affecting the distribution and
numbers of cranes is likely to be the impact of
climate change on temperature regimes and habitat
patterns. For example, according to climate change
scenarios for the late Twenty-First Century, Huntley
et al. (2007) have predicted that the distribution of
the Eurasian crane may change in many parts of
Europe. However, the future for this species appears
less vulnerable than other crane species (Hansbauer
et al. 2014). The present paper therefore models the
distribution of breeding habitats of cranes in Estonia
Landscape Ecol
123
and compares it with the distribution of designated
protected areas, in order to establish the degree of
protection provided. The current status of relevant
habitats is then discussed in relation to the require-
ments of the bird, and set into the context of land
cover and potential habitat change in Estonia. New
information is then provided on the distribution of
the flyways in relation to overwintering areas and
their relationship with the European environment. A
climate change scenario is then applied and the
potential implications on crane populations dis-
cussed. The main objective of this paper is therefore
to examine the stability of the habitat network used
by cranes in Estonia and then compare this with
potential shifts in land use and climate elsewhere in
Europe.
Habitat requirements of cranes
Eurasian cranes are omnivores and feed carnivorously
during breeding, but mainly on herbaceous material
during migration and over-wintering (Cramp and
Simmons 1980; Prange 1989). In wintering sites in
Spain, the cranes mainly feed on sown cereals and
stubble but also on fields of harvested maize, sun-
flower, sugar beet and potato. However, in the dehesas
(open evergreen and cork oak woodlands in Spain) the
cranes feed on bulbs and acorns (Aviles et al. 2002;
Alonso et al. 2004; Lundin 2005; Munillo 2014). In
France, the cranes mostly forage on maize stubble and
sown cereals (Lundin 2005; Salvi 2013). Maize
stubble fields are also the main foraging sites of
staging cranes in Germany and Hungary (Lundin
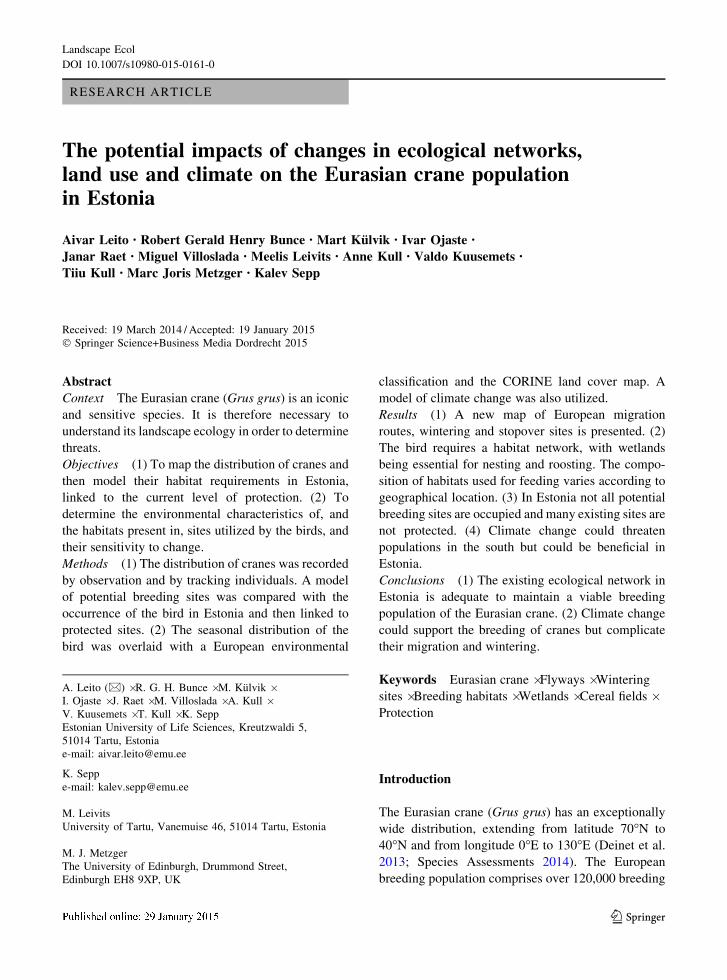
Fig. 1 The shaded area represents the main European breeding area of the Eurasian crane
Landscape Ecol
123
2005; Prange 2012; Vegvari et al. 2012; Prange 2014).
In Estonia, the birds feed mainly in cereal fields,
meadows and mown grasslands, but nest in wetlands
such as mires, fens, coastal lagoons, inland lakes and
swamp forests (Leito et al. 2005, 2006).
According to Cramp and Simmons (1980), Prange
(1989) and Leito et al. (2006), cranes require the
following essential habitats in the breeding season:
• water, or at least a wet habitat patch for nesting;
• water for roosting;
• feeding places in fields and meadows.
However, during migration and wintering they only
need the latter two types of habitats. The ground or
water must not be frozen for periods of more than
1 week because the birds cannot roost or feed safely
under such conditions. The regions with resident
cranes in Europe, e.g. Southern England, are only
frozen for short periods. The above habitat types have
remained relatively stable in Estonia over the last
20 years, although there had previously been a major
increase in forest cover, as described by Raet et al.
(2008). Cereals also increased in area in the 1960s, but
Fig. 2 Generalised map of the European Flyways (migration routes) of the Eurasian crane (Grus grus). The main stopover areas,
stopover and regular wintering sites, and wintering areas are shown on the key, as well as different types of routes followed
Landscape Ecol
123
have been relatively stable over the last 20 years.
Cereal fields are important for feeding, as shown by
Leito et al. (2006, 2008). Autumn sown cereals
comprise less than 20 % of all grain crops in Estonia
(Vasiliev et al. 2008), but may be important locally.
Cranes extensively utilize cereal fields in late August
and early September, eating both the sown grain and
young green shoots. They also forage on harvested
wheat, or preferably barley stubble or germinating
cereals. Crane families start to feed on ripe barley
stands but also continue to utilize barley fields after
harvesting (Leito et al. 2006, 2013). From late August
until departure in October, cereal stubble is the most
important type of feeding habitat in Estonia for local
birds, as well as those stopping over from Finland and
Russia. Estonian farmers suffer damage from local
and passing cranes mainly on ripe barley stands before
harvesting, and on autumn sown cereals from mid-
August to late-September. However, in general, crop
damage caused by cranes is not a serious concern in
Estonia (Leito et al. 2013), but is an increasing
problem in several important stopover and wintering
areas in Hungary (Vegvari et al. 2012), Germany
(Nowald et al. 2010b; Prange 2012) and France (Salvi
2013). A frequent problem for cranes in most stopover
and wintering sites, and in some nesting sites after the
young are fledged, is the lack of grain on the ground
after harvesting (Leito et al. 2006). Sepp (pers.
comm.) has reported that, currently, in Ethiopia
cranes still feed on grain that is shed when using
traditional harvesting methods, as well as on weed
seeds. But this important food may be lost in great
extent after mechanisation of harvesting in future. The
stubble on fields after harvesting is important for
cranes, who feed on both the herbaceous and animal
material present. The weed populations of cereal
fields, although widespread 40 years ago, have almost
disappeared in Northern Europe, because of herbicide
use (Dahl 2007), and are now insignificant.
However, there have been some changes in land-
scape patterns in Estonia, e.g. an increase in field size
(Kaasik et al. 2011), which may favour cranes.
Additionally, the wet meadows surrounding water
bodies, which were formerly mown, are now often
abandoned (Kukk et al. 2010). The resultant long grass
may provide shelter from predators for the young birds,
but may subsequently be colonized by scrub of species
such as Salix, which reduces its value to the cranes.
These changes are relatively minor compared with the
large increase in crane numbers. One important reason
for the increase in the European population of cranes
could be the persistence of natural and artificial
wetlands along the migratory routes and in the breeding
areas, following the major losses of the 1950s and
1960s. Many of the main wetlands used by cranes
outside Estonia e.g. in France and Spain are protected
and are not therefore threatened by drainage, but only
by climate change. Irrigation channels used for crops
may also be important. The role of crane conservation
measures is difficult to prove, but is likely to be pivotal,
as the major population increase started around the time
of the setting up of the RAMSAR Convention which
helped to conserve existing wetlands. In some cases,
this has even led to reintroductions, for example in the
South-West of England (The Great Crane Project
2014). There is also the possibility of population
dynamics being integrated with changes in the
environment.
In Estonia, not all locations that are suitable for
nesting are occupied, and some birds have even moved
into new habitats, such as exhausted sand and gravel
pits, sea islets and coastal lagoons. Full capacity has
not therefore been reached, and the existing habitat
network should therefore be sufficient for further crane
population increases. In addition, there is currently no
evidence that the present wetlands are likely to be
drained, because the costs would likely be too high,
bearing in mind the current financial situation in the
agriculture industry.
Methods
Potential breeding habitats map
The geographic distribution of nesting habitats of the
species was analysed using an approach termed
species distribution models (SDMs) which are a
collection of statistical models that describe how
environmental variables are associated with the geo-
graphical distribution of a given species (Guisan and
Zimmermann 2000).
Machine learning methods are able to address non-
linear relationships between response and predictor
variables and in the present project, maximum entropy
(Phillips et al. 2004, 2006; Phillips and Dudik 2008)
has been used as it requires only the presence of
species not numbers (Fourcade et al. 2013; Renner and
Landscape Ecol
123
Warton 2013). Thus, because only the presence of nest
sites and habitats was available for use within this
study, MAXimum ENTropy (MAXENT) was selected
as the most appropriate modelling method.
Various types of data were used to model the
potential distribution of crane nesting sites. Initially,
original Eurasian crane nest record cards (Leito et al.
2006) were used to provide data on the precise
locations of nests. In total, it was possible to obtain
usable data on 96 nests from the period 1984 to 2012.
However, the spatial coverage and representation of
these data does not cover the whole range of suitable
nest sites in Estonia, because the data focussed mainly
on the reed beds and fens typical of coastal areas and
the western part of Estonia (N = 75). The second
source of nest sites was recent data from the Estonian
Breeding Bird Atlas, which has relatively even spatial
coverage over the whole country and also represents
all the possible nesting habitats, including mires and
wet clear-cuts (N = 96). The third source was the
breeding bird survey program of mire birds in the
National Environmental Monitoring Programme (Lei-
vits 2013). In contrast to the first two sources, the
samples from the last data set, represents only the
niche covering the mire breeding population. The
latter samples do not always represent the exact nest
points, however, because when using the line transect
census method, identifying the calling territorial pairs
of cranes may not reveal the actual location of the
nests (N = 665). The sample sizes reflect the data
records that have coordinates and are therefore usable.
The raster layers used for the environmental
variables were (1) the classes of the Corine Land
Cover (CLC) map (details given below), (2) soil type
(Estonian Soil Map from the Estonian Land Board)
and (3) Landsat-7 Enhanced Thematic Mapper Plus
(ETM?) multispectral bands (data available from the
United States Geological Survey). Green (2), red (3)
and near-infrared (4, 5) channels were used. Different
spectral bands enable the identification of finer scale
patterns in the vegetation. For example, near-infrared
channels indicate the amount of water between the
plant cover whereas green channels indicate the
vegetation composition at a specific site. To eliminate
different habitats with similar reflectance values,
general environmental variables, i.e. maps of land
cover and soils, were used in the model. All used bands
were first calibrated to absolute radiance values (Barsi
et al. 2007). The mosaic of ETM? images was
compiled from five different scenes, dating from July
to August 2006. Each described band was used as a
separate variable in the MAXENT model.
The MAXENT program version 3.3.3k was utilised
in the R environment (Hijmans et al. 2013; R Core
Team 2013). Of the total sample, 20 % was used for
testing the model. By varying the sets of training
samples from the three different data sources
described above, several models were fitted. As
several data points fell outside the extent of the
variable rasters used, the sample size was therefore
reduced. From several models, two candidates were
selected for further investigation. The first model was
based on the first and second sources of samples (nest
cards combined with the breeding bird atlas, and
giving the precise location of nests). The second
model was based on the third source of samples (mire
breeding bird survey). The area under the receiver
operating characteristic (ROC) Curve of the test
samples was used to evaluate the models. The
predicted probability maps were reviewed by experts
to assess the maps from the species habitat selection
aspects. Models that are based on different samples
have both advantages and disadvantages, and empha-
size the different niches of potential nesting sites.
However, the second model strongly overemphasizes
raised bogs, but not fens and transitional mires, which
are important breeding habitats for cranes. Taking into
account the overall better predictive performance of
the first model and the more balanced representation of
different nesting sites, this was therefore selected for
further study. The variables with highest contribution
were: land cover (66 %), soil type (22 %), and ETM?
red band (11 %).
The habitat prediction or nest-site suitability map
(0/1 discrete raster) was calculated from the predicted
probability map (0 to 1 probability raster) using a
logistic threshold that represents the pixel values when
the test sample sensitivity (true positive rate) and test
sample specificity (true negative rate) are maximized.
For example this happens when the situation occurs
that the sum of correctly predicted presences and
absences in the test samples is at its maximum. The
respective logistic threshold value for the selected
model was 0.32 (32 %). All pixel values of the
probability map greater than the obtained threshold
value were then classified as suitable nesting areas.
The suitability map of the potential nesting sites of
cranes in Estonia was then calculated from the
Landscape Ecol
123
predicted probability map using the 32 % threshold
value. The land cover of the suitable nesting sites of
cranes (probability over 32 %) was analysed by
overlay analysis based on the CLC map. The land
use composition of nature protection areas was
calculated by overlay analysis separately for the
suitable nesting sites of cranes (probability over
32 %) and for the areas where nesting is unsuitable
(probability up to 32 %). The overlay analysis was
also used to calculate the share of land cover types,
conservation and protected ‘‘green’’ areas individually
for suitable nesting sites and unsuitable nesting sites.
The nature conservation layer was composed of areas
of four types of protected sites that have actual
conservation measures in place. These include GIS
layers according to the Nature Conservation Act as
follows: (1) protected areas; (2) limited conservation
areas; (3) single protected natural features; and 4)
species protection sites (data from Estonian Environ-
mental Registry, EELIS, February 2014). The network
of protected areas (termed the Green Mask) was
compiled using layers based on the thematic plans of
the counties in the Green Network of Estonia (see, e.g.
Raet et al. 2010).
Stopover and wintering sites land cover analysis
Each European crane Flyway (migration route)
consists of a network of stopover sites which are
needed for energy loading during the migration
period. Stopover and wintering sites for cranes have
two important components, an overnight location on
a wetland, e.g. marshes, lagoons and shallow lakes,
and a feeding area on adjacent agricultural land. To
select the most important stopover and wintering site
of cranes from the Estonian population along the
flyways, the database of recoveries of colour-ringed
cranes and data from satellite telemetry was used. In
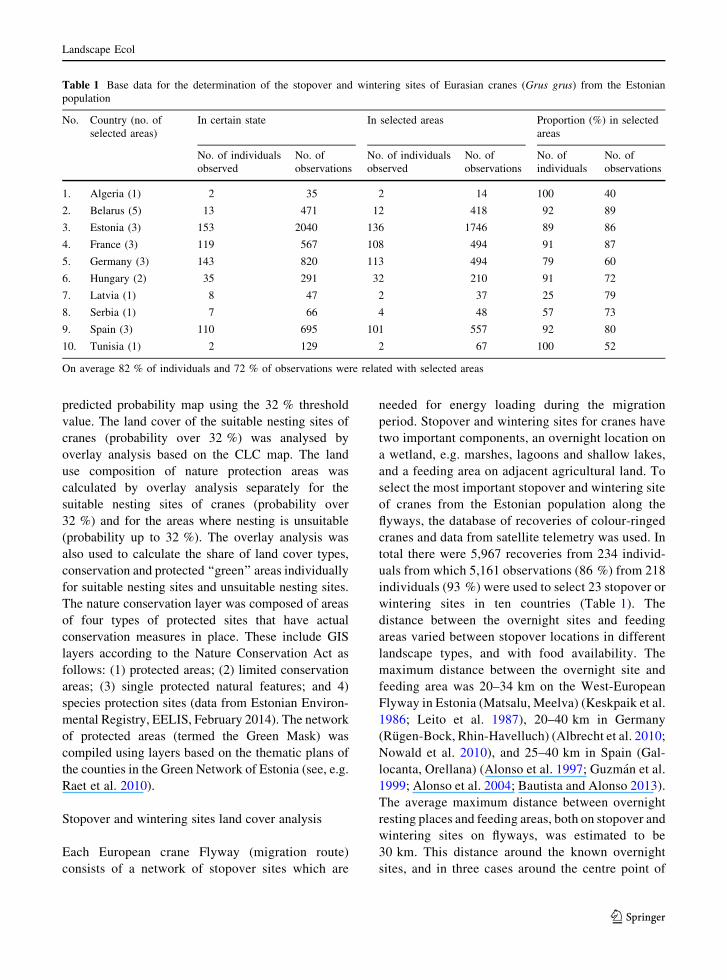
total there were 5,967 recoveries from 234 individ-
uals from which 5,161 observations (86 %) from 218
individuals (93 %) were used to select 23 stopover or
wintering sites in ten countries (Table 1). The
distance between the overnight sites and feeding
areas varied between stopover locations in different
landscape types, and with food availability. The
maximum distance between the overnight site and
feeding area was 20–34 km on the West-European
Flyway in Estonia (Matsalu, Meelva) (Keskpaik et al.
1986; Leito et al. 1987), 20–40 km in Germany
(Rugen-Bock, Rhin-Havelluch) (Albrecht et al. 2010;
Nowald et al. 2010), and 25–40 km in Spain (Gal-
locanta, Orellana) (Alonso et al. 1997; Guzman et al.
1999; Alonso et al. 2004; Bautista and Alonso 2013).
The average maximum distance between overnight
resting places and feeding areas, both on stopover and
wintering sites on flyways, was estimated to be
30 km. This distance around the known overnight
sites, and in three cases around the centre point of
Table 1 Base data for the determination of the stopover and wintering sites of Eurasian cranes (Grus grus) from the Estonian
population
No. Country (no. of
selected areas)
In certain state In selected areas Proportion (%) in selected
areas
No. of individuals
observed
No. of
observations
No. of individuals
observed
No. of
observations
No. of
individuals
No. of
observations
1. Algeria (1) 2 35 2 14 100 40
2. Belarus (5) 13 471 12 418 92 89
3. Estonia (3) 153 2040 136 1746 89 86
4. France (3) 119 567 108 494 91 87
5. Germany (3) 143 820 113 494 79 60
6. Hungary (2) 35 291 32 210 91 72
7. Latvia (1) 8 47 2 37 25 79
8. Serbia (1) 7 66 4 48 57 73
9. Spain (3) 110 695 101 557 92 80
10. Tunisia (1) 2 129 2 67 100 52
On average 82 % of individuals and 72 % of observations were related with selected areas
Landscape Ecol
123
feeding sites, was therefore used as the buffering
measure for overlaying the crane sites on the CLC
map.
The locations of the crane stopover sites were
overlaid on the Corine land cover (CLC) map (version
16; 2006) in order to determine their land cover
composition. CLC was created by visual interpretation
of remote sensed images and provides 44 classes
aggregated at three different levels (European Com-
mission 1994). Currently, CLC is the only carto-
graphic product that offers a consistent land cover
classification across the European migration and
wintering sites, although certain classes may not be
measured accurately because small patches may be
assigned to the wrong category because of the coarse
resolution of the map. In this study, not all the crane
wintering locations were included because CLC does
not include Algeria and Tunisia.
The land cover composition at the migration and
wintering sites was calculated as the proportion of
each CLC class within every buffer polygon (30 km
radius circles), through polygon clipping and area
measurement procedures performed in ArcMap v.
10.1. Not all the classes were included in the analysis,
because cranes do not use some land cover types, such
as coniferous forest. Only the following land cover
types used by cranes were included:
2:1:1 Non-irrigated arable land
2:1:2 Permanently irrigated land
2:4 Heterogeneous agricultural areas
3:2:1 Natural grassland
4:1 Inland wetlands
4:2 Coastal wetlands
5:1 Inland waters
5:2 Marine waters (excluding class 5.2.3, sea and
ocean)
In addition, in order to provide a comparison between
the sites occupied by cranes and wider landscapes,
CLC was analysed at control points 60 km south
from the initial location because other compass
points were either in the sea or impractical. These
sites acted as controls to show differences in land
cover between the nest sites and independent
locations.
In addition to the land cover analysis at each site,
comparisons were carried out between the Estonian
sites and all other migration and wintering sites in
Europe, in order to determine whether the composition
around the wetlands at these sites was similar to those
in Estonia. The average percentage of each land cover
class at the Estonian sites and all other locations was
calculated. Similarly, the average values for the
Estonian sites were compared with all other sites
aggregated by stopover sites only, by wintering and
stopover areas, or by wintering areas.
Environmental stratification and climate scenario
methodology
The methodology for the construction of the Euro-
pean environmental stratification (EnS) involved
screening climate parameters and extracting those
that expressed the most variation. Principal compo-
nents analysis followed by cluster analysis was used
to create 84 environmental strata (EnSs), which were
then joined hierarchically into 13 environmental
zones (EnZs). The methodology is described in detail
by Metzger et al. (2005), and the application of
climate change models by Metzger et al. (2008).
Descriptions of the individual Classes and Zones are
provided in Metzger et al. (2012). A post-processing
stage was required to re-assign scattered small
regions of only a few square kilometres into neigh-
bouring strata.
To assess how the main European environments
would shift under different climate change scenarios,
climate functions were fitted to the EnS (Metzger et al.
2008). The TYN SC1.0 has a resolution of 10 arcmin
longitude-latitude and contains 20,400 monthly grids
of observed climate, for the period 2001–2100
(Mitchell et al. 2004). It comprises five climatic
variables, namely: cloud cover, diurnal temperature
range, precipitation, temperature, and vapour pressure.
The original EnS map was resampled to match the 10
arcmin resolution of the climate dataset. Each grid cell
was then linked to the values of the climate variables
contained in the CRU TS1.2 and TYN SC1.0 datasets.
Fisher’s Discriminate Functions were calculated for
each EnS stratum and used in ArcGIS to determine the
future distribution of the 84 strata from the monthly
climate variables. Separate maps were created for the
three time slices (2020, 2050 and 2080). For simplic-
ity, only the most likely scenario was used in the
present study, namely the CGCM2 Circulation Model-
A2 emissions scenario.
The analysis of the EnZs shift at the crane migration
sites was carried out based on the projected climate
Landscape Ecol
123
change at the time steps 1990, 2050 and 2080, as
modelled in Metzger et al. 2008 using the scenario
described above. The assessment of the proportion of
the EnSs in mainland Europe was derived by overlay,
clip and area measurement operations in ArcMap 10.1.
The EnSs were then grouped into the EnZs, and the
average geographic coverage of each Zone obtained
for each migration site type: staging, migration, and
wintering. To assess shifts between EnZs, the process
was repeated for the three time steps, 1990, 2050 and
2080, under the aforementioned climate change
scenario.
Results
Description of the European flyways, wintering
sites and the potential impact of climate change
The Eurasian crane nests mainly in Northern Europe,
as shown in Fig. 1, and migrates south from there in
the autumn. The main exception to this pattern is
Southern England where the cranes both breed and
overwinter in the same location. The birds returned to
the Norfolk Broads in 1979 and the latest figures for
cranes in the UK, as reported in The Norfolk Crane
Story (2014), are 18 confirmed pairs, two probable,
two possible and seven non-breeding. The total
number of chicks fledged was 12. Figure 3 includes
the distribution of the sites where cranes have bred in
Britain. In 2013 a pair also bred in Scotland, but the
site is confidential and is not shown on the map. The
Great Cranes project has also attempted to re-
introduce the birds into Somerset, South-West Eng-
land, but there is still not a breeding population in this
region.
However, the majority of birds follow a general
network of flyways and routes across Europe that
connect the northern and southern parts of the
breeding range to the rest of the continent, as shown
in Fig. 2. The Figure depicts the most recent version of
the flyways and was derived from the data sources
described in the methods section. In addition, individ-
ual cranes may change their migration flyways and use
different migration routes and wintering areas in
different years (Leito et al. 2011; Saurola et al. 2013;
Suorsa and Hakkarainen 2013; Satelliittikurjet 2014).
Therefore, although the migration routes of the cranes
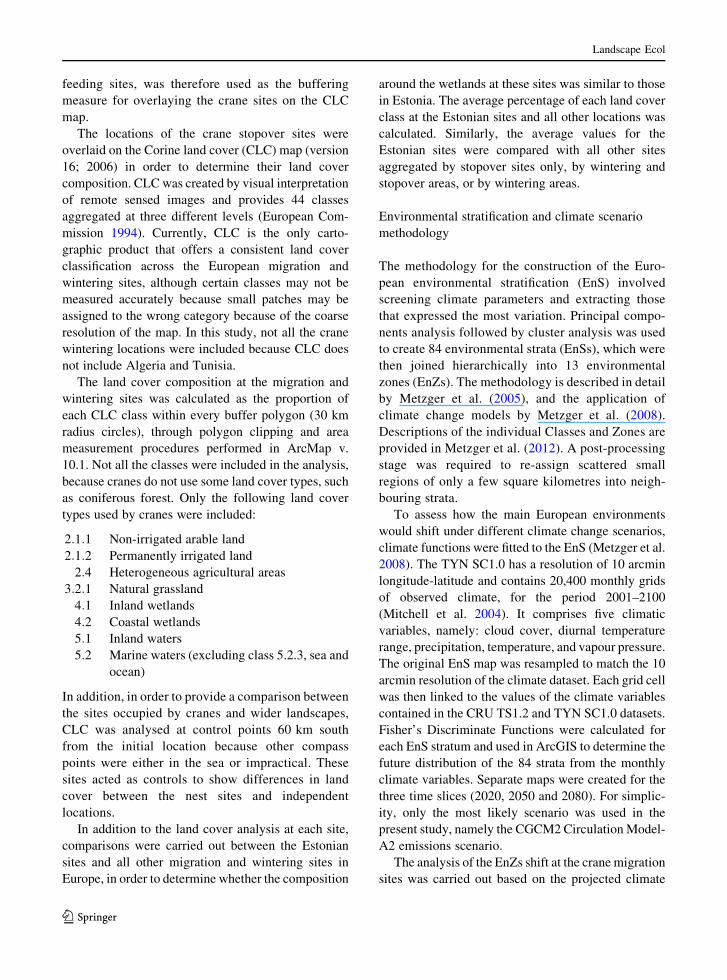
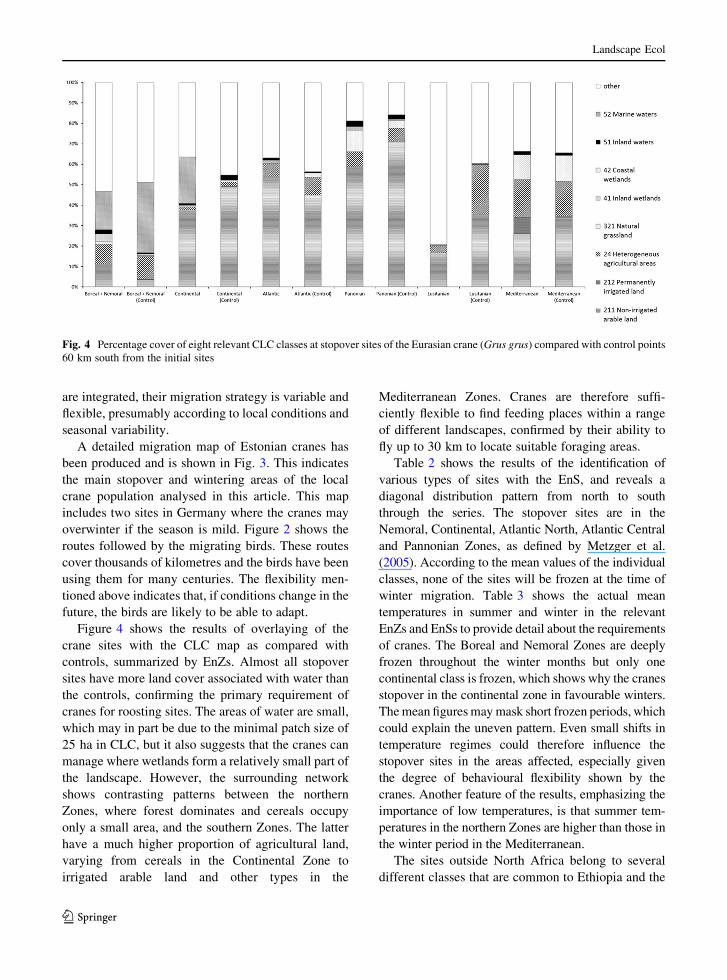
Fig. 3 Distribution of the stopover, stopover and irregular
wintering, stopover and regular wintering, and wintering sites of
the Estonian population of the Eurasian crane (Grus grus).
Legend for country codes (according to ISO 3166-1): BLR
Belarus, DEU Germany, DZA Algeria, ESP Spain, EST Estonia,
FRA France, HUN Hungary, LVA Latvia, SRB Serbia, TUN
Tunisia, UKR Ukraine
Landscape Ecol
123
are integrated, their migration strategy is variable and
flexible, presumably according to local conditions and
seasonal variability.
A detailed migration map of Estonian cranes has
been produced and is shown in Fig. 3. This indicates
the main stopover and wintering areas of the local
crane population analysed in this article. This map
includes two sites in Germany where the cranes may
overwinter if the season is mild. Figure 2 shows the
routes followed by the migrating birds. These routes
cover thousands of kilometres and the birds have been
using them for many centuries. The flexibility men-
tioned above indicates that, if conditions change in the
future, the birds are likely to be able to adapt.
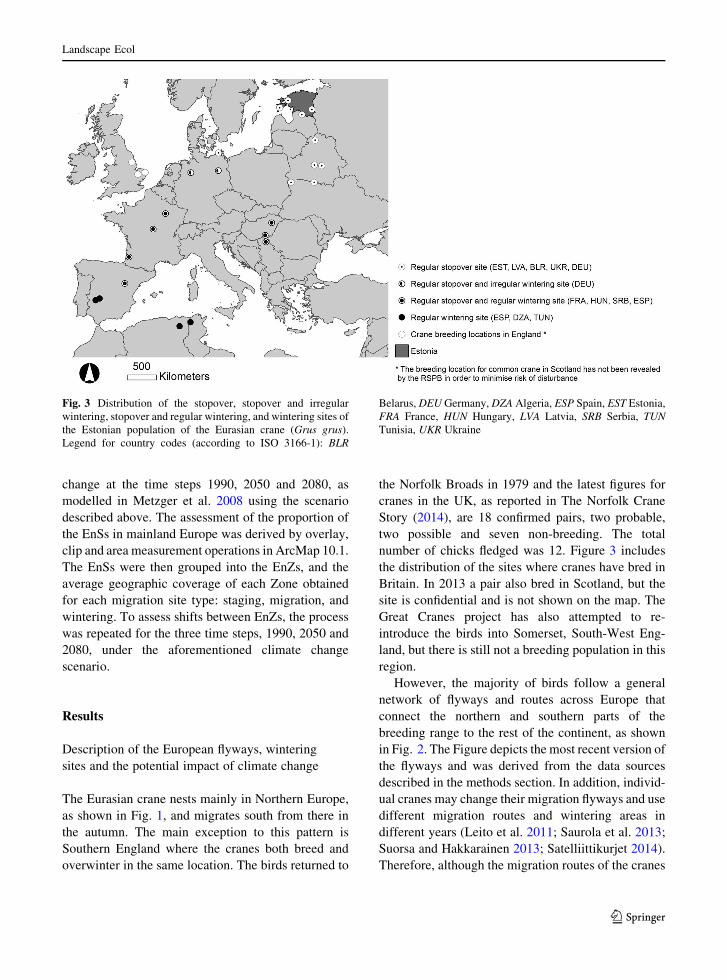
Figure 4 shows the results of overlaying of the
crane sites with the CLC map as compared with
controls, summarized by EnZs. Almost all stopover
sites have more land cover associated with water than
the controls, confirming the primary requirement of
cranes for roosting sites. The areas of water are small,
which may in part be due to the minimal patch size of
25 ha in CLC, but it also suggests that the cranes can
manage where wetlands form a relatively small part of
the landscape. However, the surrounding network
shows contrasting patterns between the northern
Zones, where forest dominates and cereals occupy
only a small area, and the southern Zones. The latter
have a much higher proportion of agricultural land,
varying from cereals in the Continental Zone to
irrigated arable land and other types in the
Mediterranean Zones. Cranes are therefore suffi-
ciently flexible to find feeding places within a range
of different landscapes, confirmed by their ability to
fly up to 30 km to locate suitable foraging areas.
Table 2 shows the results of the identification of
various types of sites with the EnS, and reveals a
diagonal distribution pattern from north to south
through the series. The stopover sites are in the
Nemoral, Continental, Atlantic North, Atlantic Central
and Pannonian Zones, as defined by Metzger et al.
(2005). According to the mean values of the individual
classes, none of the sites will be frozen at the time of
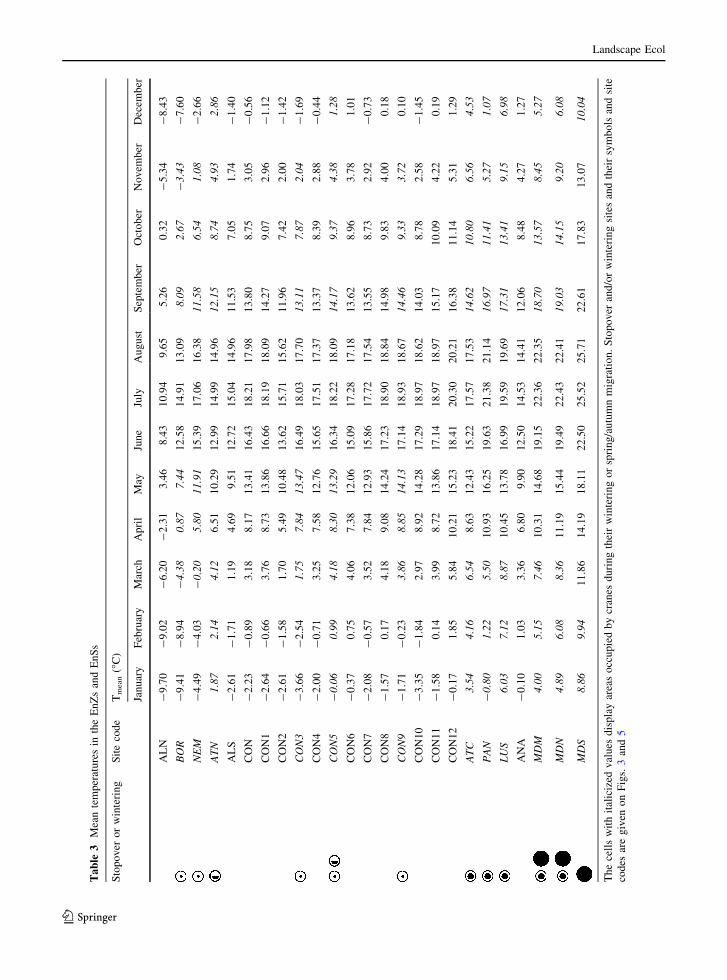
winter migration. Table 3 shows the actual mean
temperatures in summer and winter in the relevant
EnZs and EnSs to provide detail about the requirements
of cranes. The Boreal and Nemoral Zones are deeply
frozen throughout the winter months but only one
continental class is frozen, which shows why the cranes
stopover in the continental zone in favourable winters.
The mean figures may mask short frozen periods, which
could explain the uneven pattern. Even small shifts in
temperature regimes could therefore influence the
stopover sites in the areas affected, especially given
the degree of behavioural flexibility shown by the
cranes. Another feature of the results, emphasizing the
importance of low temperatures, is that summer tem-
peratures in the northern Zones are higher than those in
the winter period in the Mediterranean.
The sites outside North Africa belong to several
different classes that are common to Ethiopia and the
Fig. 4 Percentage cover of eight relevant CLC classes at stopover sites of the Eurasian crane (Grus grus) compared with control points
60 km south from the initial sites
Landscape Ecol
123
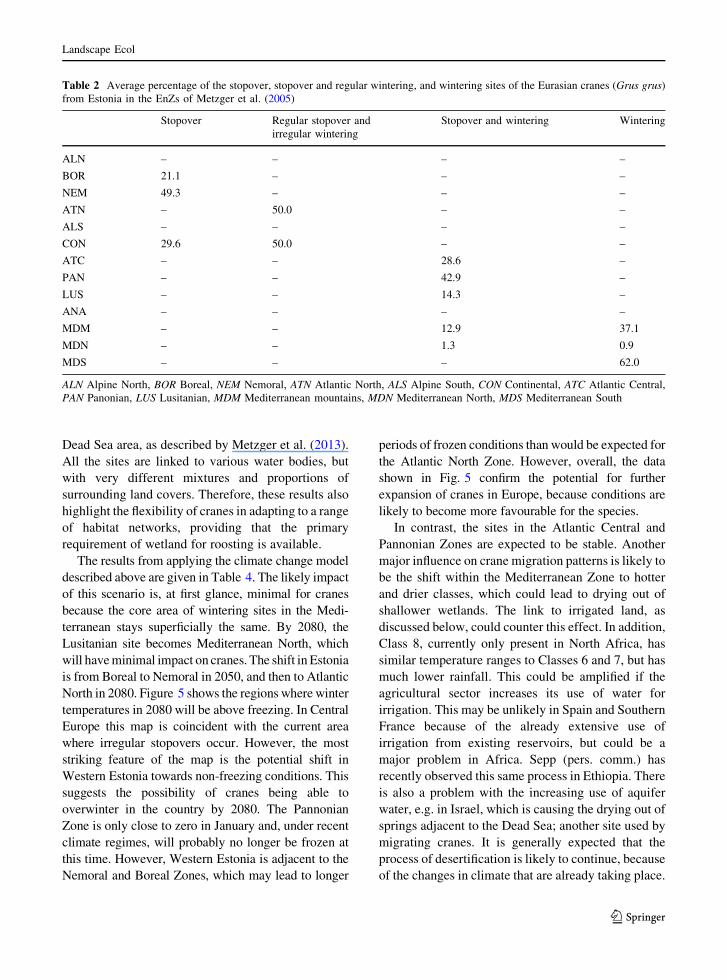
Dead Sea area, as described by Metzger et al. (2013).
All the sites are linked to various water bodies, but
with very different mixtures and proportions of
surrounding land covers. Therefore, these results also
highlight the flexibility of cranes in adapting to a range
of habitat networks, providing that the primary
requirement of wetland for roosting is available.
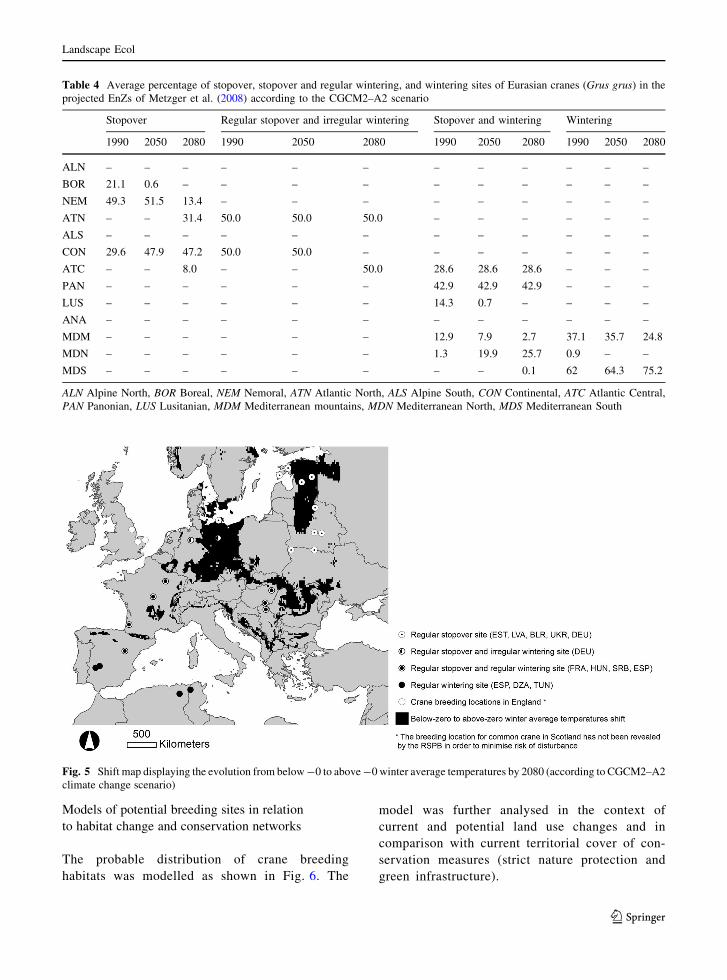
The results from applying the climate change model
described above are given in Table 4. The likely impact
of this scenario is, at first glance, minimal for cranes
because the core area of wintering sites in the Medi-
terranean stays superficially the same. By 2080, the
Lusitanian site becomes Mediterranean North, which
will have minimal impact on cranes. The shift in Estonia
is from Boreal to Nemoral in 2050, and then to Atlantic
North in 2080. Figure 5 shows the regions where winter
temperatures in 2080 will be above freezing. In Central
Europe this map is coincident with the current area
where irregular stopovers occur. However, the most
striking feature of the map is the potential shift in
Western Estonia towards non-freezing conditions. This
suggests the possibility of cranes being able to
overwinter in the country by 2080. The Pannonian
Zone is only close to zero in January and, under recent
climate regimes, will probably no longer be frozen at
this time. However, Western Estonia is adjacent to the
Nemoral and Boreal Zones, which may lead to longer
periods of frozen conditions than would be expected for
the Atlantic North Zone. However, overall, the data
shown in Fig. 5 confirm the potential for further
expansion of cranes in Europe, because conditions are
likely to become more favourable for the species.
In contrast, the sites in the Atlantic Central and
Pannonian Zones are expected to be stable. Another
major influence on crane migration patterns is likely to
be the shift within the Mediterranean Zone to hotter
and drier classes, which could lead to drying out of
shallower wetlands. The link to irrigated land, as
discussed below, could counter this effect. In addition,
Class 8, currently only present in North Africa, has
similar temperature ranges to Classes 6 and 7, but has
much lower rainfall. This could be amplified if the
agricultural sector increases its use of water for
irrigation. This may be unlikely in Spain and Southern
France because of the already extensive use of
irrigation from existing reservoirs, but could be a
major problem in Africa. Sepp (pers. comm.) has
recently observed this same process in Ethiopia. There
is also a problem with the increasing use of aquifer
water, e.g. in Israel, which is causing the drying out of
springs adjacent to the Dead Sea; another site used by
migrating cranes. It is generally expected that the
process of desertification is likely to continue, because
of the changes in climate that are already taking place.
Table 2 Average percentage of the stopover, stopover and regular wintering, and wintering sites of the Eurasian cranes (Grus grus)
from Estonia in the EnZs of Metzger et al. (2005)
Stopover Regular stopover and
irregular wintering
Stopover and wintering Wintering
ALN – – – –
BOR 21.1 – – –
NEM 49.3 – – –
ATN – 50.0 – –
ALS – – – –
CON 29.6 50.0 – –
ATC – – 28.6 –
PAN – – 42.9 –
LUS – – 14.3 –
ANA – – – –
MDM – – 12.9 37.1
MDN – – 1.3 0.9
MDS – – – 62.0
ALN Alpine North, BOR Boreal, NEM Nemoral, ATN Atlantic North, ALS Alpine South, CON Continental, ATC Atlantic Central,
PAN Panonian, LUS Lusitanian, MDM Mediterranean mountains, MDN Mediterranean North, MDS Mediterranean South
Landscape Ecol
123
Ta
ble
3M
ean
tem
per
atu
res
inth
eE
nZ
san
dE
nS
s
Sto
po
ver
or
win
teri
ng
Sit
eco
de
Tm
ean
(�C
)
Jan
uar
yF
ebru
ary
Mar
chA
pri
lM
ayJu
ne
July
Au
gu
stS
epte
mb
erO
cto
ber
No
vem
ber
Dec
emb
er
AL
N-
9.7
0-
9.0
2-
6.2
0-
2.3
13
.46
8.4
31
0.9
49
.65
5.2
60
.32
-5
.34
-8
.43
BO
R-
9.4
1-
8.9
4-
4.3
80
.87
7.4
41
2.5
81
4.9
11
3.0
98
.09
2.6
7-
3.4
3-
7.6
0
NE
M-
4.4
9-
4.0
3-
0.2
05
.80
11
.91
15
.39
17
.06
16
.38
11
.58
6.5
41
.08
-2
.66
AT
N1
.87
2.1
44
.12
6.5
11
0.2
91
2.9
91
4.9
91
4.9
61
2.1
58
.74
4.9
32
.86
AL
S-
2.6
1-
1.7
11
.19
4.6
99
.51
12
.72
15
.04
14
.96
11
.53
7.0
51
.74
-1
.40
CO
N-
2.2
3-
0.8
93
.18
8.1
71
3.4
11
6.4
31
8.2
11
7.9
81
3.8
08
.75
3.0
5-
0.5
6
CO
N1
-2
.64
-0
.66
3.7
68
.73
13
.86
16
.66
18
.19
18
.09
14
.27
9.0
72
.96
-1
.12
CO
N2
-2
.61
-1
.58
1.7
05
.49
10
.48
13
.62
15
.71
15
.62
11
.96
7.4
22
.00
-1
.42
CO
N3
-3
.66
-2
.54
1.7
57
.84
13
.47
16
.49
18
.03
17
.70
13
.11
7.8
72
.04
-1
.69
CO
N4
-2
.00
-0
.71
3.2
57
.58
12
.76
15
.65
17
.51
17
.37
13
.37
8.3
92
.88
-0
.44
CO
N5
-0
.06
0.9
94
.18
8.3
01
3.2
91
6.3
41
8.2
21
8.0
91
4.1
79
.37
4.3
81
.28
CO
N6
-0
.37
0.7
54
.06
7.3
81
2.0
61
5.0
91
7.2
81
7.1
81
3.6
28
.96
3.7
81
.01
CO
N7
-2
.08
-0
.57
3.5
27
.84
12
.93
15
.86
17
.72
17
.54
13
.55
8.7
32
.92
-0
.73
CO
N8
-1
.57
0.1
74
.18
9.0
81
4.2
41
7.2
31
8.9
01
8.8
41
4.9
89
.83
4.0
00
.18
CO
N9
-1
.71
-0
.23
3.8
68
.85
14
.13
17
.14
18
.93
18
.67
14
.46
9.3
33
.72
0.1
0
CO
N1
0-
3.3
5-
1.8
42
.97
8.9
21
4.2
81
7.2
91
8.9
71
8.6
21
4.0
38
.78
2.5
8-
1.4
5
CO
N1
1-
1.5
80
.14
3.9
98
.72
13
.86
17
.14
18
.97
18
.97
15
.17
10
.09
4.2
20
.19
CO
N1
2-
0.1
71
.85
5.8
41
0.2
11
5.2
31
8.4
12
0.3
02
0.2
11
6.3
81
1.1
45
.31
1.2
9
AT
C3
.54
4.1
66
.54
8.6
31
2.4
31
5.2
21
7.5
71
7.5
31
4.6
21
0.8
06
.56
4.5
3
PA
N-
0.8
01
.22
5.5
01
0.9
31
6.2
51
9.6
32
1.3
82
1.1
41
6.9
71
1.4
15
.27
1.0
7
LU
S6
.03
7.1
28
.87
10
.45
13
.78
16
.99
19
.59
19
.69
17
.31
13
.41
9.1
56
.98
AN
A-
0.1
01
.03
3.3
66
.80
9.9
01
2.5
01
4.5
31
4.4
11
2.0
68
.48
4.2
71
.27
MD
M4
.00
5.1
57
.46
10
.31
14
.68
19
.15
22
.36
22
.35
18
.70
13
.57
8.4
55
.27
MD
N4
.89
6.0
88
.36
11
.19
15
.44
19
.49
22
.43
22
.41
19
.03
14
.15
9.2
06
.08
MD
S8
.86
9.9
41
1.8
61
4.1
91
8.1
12
2.5
02
5.5
22
5.7
12
2.6
11
7.8
31
3.0
71
0.0
4
Th
ece
lls
wit
hit
alic
ized
val
ues
dis
pla
yar
eas
occ
up
ied
by
cran
esd
uri
ng
thei
rw
inte
rin
go
rsp
rin
g/a
utu
mn
mig
rati
on
.S
top
ov
eran
d/o
rw
inte
rin
gsi
tes
and
thei
rsy
mb
ols
and
site
cod
esar
eg
iven
on
Fig
s.3
and
5
Landscape Ecol
123
Models of potential breeding sites in relation
to habitat change and conservation networks
The probable distribution of crane breeding
habitats was modelled as shown in Fig. 6. The
model was further analysed in the context of
current and potential land use changes and in
comparison with current territorial cover of con-
servation measures (strict nature protection and
green infrastructure).
Table 4 Average percentage of stopover, stopover and regular wintering, and wintering sites of Eurasian cranes (Grus grus) in the
projected EnZs of Metzger et al. (2008) according to the CGCM2–A2 scenario
Stopover Regular stopover and irregular wintering Stopover and wintering Wintering
1990 2050 2080 1990 2050 2080 1990 2050 2080 1990 2050 2080
ALN – – – – – – – – – – – –
BOR 21.1 0.6 – – – – – – – – – –
NEM 49.3 51.5 13.4 – – – – – – – – –
ATN – – 31.4 50.0 50.0 50.0 – – – – – –
ALS – – – – – – – – – – – –
CON 29.6 47.9 47.2 50.0 50.0 – – – – – – –
ATC – – 8.0 – – 50.0 28.6 28.6 28.6 – – –
PAN – – – – – – 42.9 42.9 42.9 – – –
LUS – – – – – – 14.3 0.7 – – – –
ANA – – – – – – – – – – – –
MDM – – – – – – 12.9 7.9 2.7 37.1 35.7 24.8
MDN – – – – – – 1.3 19.9 25.7 0.9 – –
MDS – – – – – – – – 0.1 62 64.3 75.2
ALN Alpine North, BOR Boreal, NEM Nemoral, ATN Atlantic North, ALS Alpine South, CON Continental, ATC Atlantic Central,
PAN Panonian, LUS Lusitanian, MDM Mediterranean mountains, MDN Mediterranean North, MDS Mediterranean South
Fig. 5 Shift map displaying the evolution from below -0 to above -0 winter average temperatures by 2080 (according to CGCM2–A2
climate change scenario)
Landscape Ecol
123
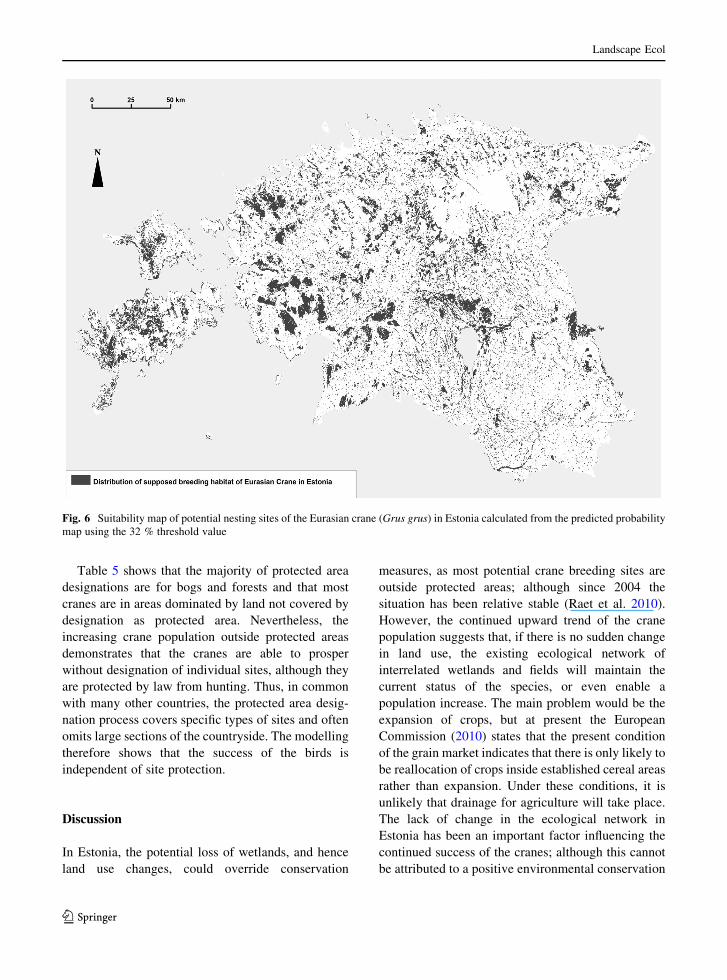
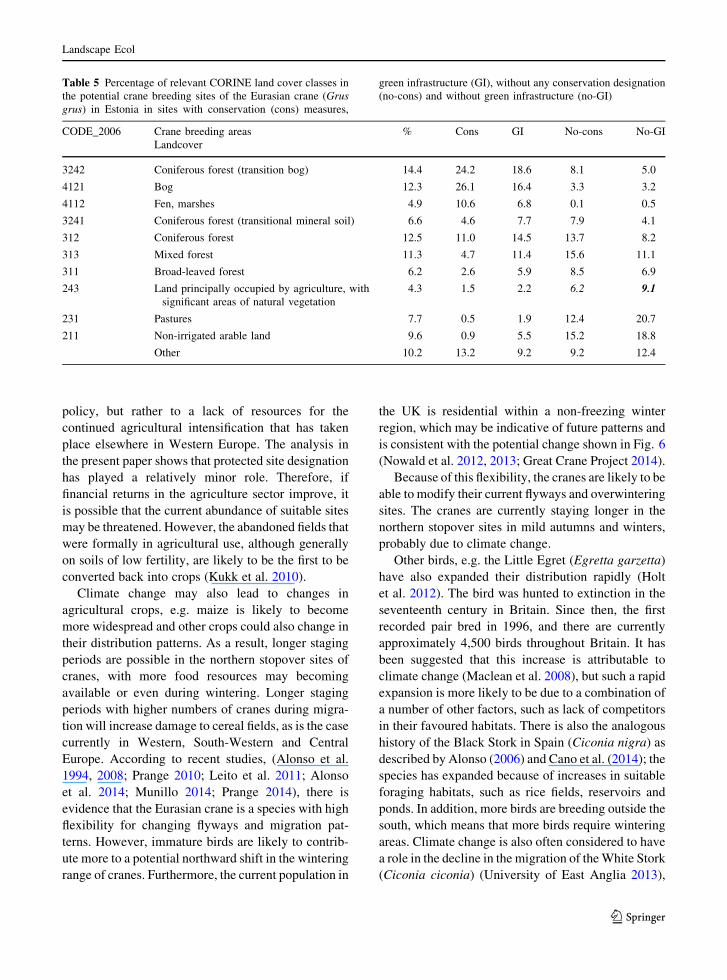
Table 5 shows that the majority of protected area
designations are for bogs and forests and that most
cranes are in areas dominated by land not covered by
designation as protected area. Nevertheless, the
increasing crane population outside protected areas
demonstrates that the cranes are able to prosper
without designation of individual sites, although they
are protected by law from hunting. Thus, in common
with many other countries, the protected area desig-
nation process covers specific types of sites and often
omits large sections of the countryside. The modelling
therefore shows that the success of the birds is
independent of site protection.
Discussion
In Estonia, the potential loss of wetlands, and hence
land use changes, could override conservation
measures, as most potential crane breeding sites are
outside protected areas; although since 2004 the
situation has been relative stable (Raet et al. 2010).
However, the continued upward trend of the crane
population suggests that, if there is no sudden change
in land use, the existing ecological network of
interrelated wetlands and fields will maintain the
current status of the species, or even enable a
population increase. The main problem would be the
expansion of crops, but at present the European
Commission (2010) states that the present condition
of the grain market indicates that there is only likely to
be reallocation of crops inside established cereal areas
rather than expansion. Under these conditions, it is
unlikely that drainage for agriculture will take place.
The lack of change in the ecological network in
Estonia has been an important factor influencing the
continued success of the cranes; although this cannot
be attributed to a positive environmental conservation
Fig. 6 Suitability map of potential nesting sites of the Eurasian crane (Grus grus) in Estonia calculated from the predicted probability
map using the 32 % threshold value
Landscape Ecol
123
policy, but rather to a lack of resources for the
continued agricultural intensification that has taken
place elsewhere in Western Europe. The analysis in
the present paper shows that protected site designation
has played a relatively minor role. Therefore, if
financial returns in the agriculture sector improve, it
is possible that the current abundance of suitable sites
may be threatened. However, the abandoned fields that
were formally in agricultural use, although generally
on soils of low fertility, are likely to be the first to be
converted back into crops (Kukk et al. 2010).
Climate change may also lead to changes in
agricultural crops, e.g. maize is likely to become
more widespread and other crops could also change in
their distribution patterns. As a result, longer staging
periods are possible in the northern stopover sites of
cranes, with more food resources may becoming
available or even during wintering. Longer staging
periods with higher numbers of cranes during migra-
tion will increase damage to cereal fields, as is the case
currently in Western, South-Western and Central
Europe. According to recent studies, (Alonso et al.
1994, 2008; Prange 2010; Leito et al. 2011; Alonso
et al. 2014; Munillo 2014; Prange 2014), there is
evidence that the Eurasian crane is a species with high
flexibility for changing flyways and migration pat-
terns. However, immature birds are likely to contrib-
ute more to a potential northward shift in the wintering
range of cranes. Furthermore, the current population in
the UK is residential within a non-freezing winter
region, which may be indicative of future patterns and
is consistent with the potential change shown in Fig. 6
(Nowald et al. 2012, 2013; Great Crane Project 2014).
Because of this flexibility, the cranes are likely to be
able to modify their current flyways and overwintering
sites. The cranes are currently staying longer in the
northern stopover sites in mild autumns and winters,
probably due to climate change.
Other birds, e.g. the Little Egret (Egretta garzetta)
have also expanded their distribution rapidly (Holt
et al. 2012). The bird was hunted to extinction in the
seventeenth century in Britain. Since then, the first
recorded pair bred in 1996, and there are currently
approximately 4,500 birds throughout Britain. It has
been suggested that this increase is attributable to
climate change (Maclean et al. 2008), but such a rapid
expansion is more likely to be due to a combination of
a number of other factors, such as lack of competitors
in their favoured habitats. There is also the analogous
history of the Black Stork in Spain (Ciconia nigra) as
described by Alonso (2006) and Cano et al. (2014); the
species has expanded because of increases in suitable
foraging habitats, such as rice fields, reservoirs and
ponds. In addition, more birds are breeding outside the
south, which means that more birds require wintering
areas. Climate change is also often considered to have
a role in the decline in the migration of the White Stork
(Ciconia ciconia) (University of East Anglia 2013),
Table 5 Percentage of relevant CORINE land cover classes in
the potential crane breeding sites of the Eurasian crane (Grus
grus) in Estonia in sites with conservation (cons) measures,
green infrastructure (GI), without any conservation designation
(no-cons) and without green infrastructure (no-GI)
CODE_2006 Crane breeding areas % Cons GI No-cons No-GI
Landcover
3242 Coniferous forest (transition bog) 14.4 24.2 18.6 8.1 5.0
4121 Bog 12.3 26.1 16.4 3.3 3.2
4112 Fen, marshes 4.9 10.6 6.8 0.1 0.5
3241 Coniferous forest (transitional mineral soil) 6.6 4.6 7.7 7.9 4.1
312 Coniferous forest 12.5 11.0 14.5 13.7 8.2
313 Mixed forest 11.3 4.7 11.4 15.6 11.1
311 Broad-leaved forest 6.2 2.6 5.9 8.5 6.9
243 Land principally occupied by agriculture, with
significant areas of natural vegetation
4.3 1.5 2.2 6.2 9.1
231 Pastures 7.7 0.5 1.9 12.4 20.7
211 Non-irrigated arable land 9.6 0.9 5.5 15.2 18.8
Other 10.2 13.2 9.2 9.2 12.4
Landscape Ecol
123
although other factors such as the availability of
rubbish tips are also considered to be important
(Tortosa et al. 2002).
The initial examination of the climate change
scenario suggested that Eurasian cranes are not under
threat and could be favoured in possible new climate
regimes; indeed the map of potential expansion shows
that a large new area could become available for
stopovers. However, in the south of Spain, the likely
shift to hotter and drier classes could pose a threat,
although cranes already overwinter in similar condi-
tions in North Africa. The climate baseline was 1990,
so further work is required not only to bring the
baseline up to date but also to examine the potential
impact of new scenarios.
Conclusion
The increase in crane numbers in Estonia is largely
independent of site protection, but requires a policy
initiative to protect the existing network of wetlands.
Relevant habitats have remained stable in Estonia, and
are not expected to change elsewhere under current
economic conditions. In the north, potential shifts in
climate could favour cranes, but in the south of Spain
the drying out of wetlands and desertification could
pose a threat to the current population.
Acknowledgments This work was supported by institutional
research funding IUT21-1 of the Estonian Ministry of Education
and Research. The authors are grateful to many colleagues and
birdwatchers for help in crane surveys in Estonia and elsewhere
in Europe and Africa. The authors would like to thank three
anonymous reviewers for valuable comments, which have
greatly improved the paper, and Freda Bunce for the final editing
of the English.
References
Albrecht J, Rauch M, Hinke E et al (2010) Rhin-Havelluch
region—common cranes Grus grus resting near Berlin.
Vogelwelt 131:135–139
Alonso L-SC (2006) An approach to wintering of Black
Stork Ciconia nigra in the Iberian Peninsula. Biota 7:7–13
Alonso AJ, Alonso CJ, Bautista LM (1994) Carrying capacity of
staging areas and facultative migration extension in com-
mon cranes. J Appl Ecol 31:212–222
Alonso CJ, Bautista ML, Alonso AJ (1997) Dominance and the
dynamics of phenotype-limited distribution in common
cranes. Behav Ecol Sociobiol 40:401–408
Alonso JC, Bautista LM, Alonso JA (2004) Family-based ter-
ritoriality vs flocking in wintering common cranes Grus
grus. J Avian Biol 35:434–444
Alonso AJ, Alonso CJ, Nowald G (2008) Migration and win-
tering patterns of a central European population of com-
mon crane Grus grus. Bird Study 55:1–7
Alonso JC, Alonso JA, Onrubia A, Cruz CM, Cangarato R
(2014) Wintering of common cranes in Spain, Portugal and
Morocco. A summary of results 1979–2014. In: Scientific
abstracts of oral and poster contributions of the VIIIth
European crane conference 2014. Gallocanta, 10 to 14
November 2014, Friends of Gallocanta Association, Gal-
locanta, Spain
Aviles JM, Sanchez JM, Parejo D (2002) Food selection of
wintering common cranes (Grus grus) in holm oak
(Quercus ilex) dehesas in south-west Spain in rainy season.
J Zool 256:71–79
Barsi JA, Hook SJ, Schott JR, Raqueno NG, Markham BL
(2007) Landsat-5 Thematic Mapper thermal band calibra-
tion update. IEEE Geosci Remote Sens Lett 4(4):552–555
Bautista ML, Alonso CJ (2013) Factors influencing daily food-
intake patterns in birds: a case study with wintering com-
mon cranes. The Condor 115:330–339
Cano L, Pacheco C, Refoyo P, Tellerıa JL (2014) Geographical
and environmental factors affecting the distribution of
wintering black storks Ciconia nigra in the Iberian Pen-
insula. J Avian Biol 45:514–521
Cramp S, Simmons KEL (eds) (1980) The birds of the western
palearctic, vol II. Oxford University Press, Oxford
Dahl E (2007) The phytogeography of Northern Europe British
Isles, Fennoscandia, and adjacent areas. Cambridge Uni-
versity Press, Cambridge
Deinet S, Ieronymidou C, McRae L, Burfield IJ, Foppen RP,
Collen B, Bohm M (2013) Wildlife comeback in Europe:
the recovery of selected mammal and bird species. Final
report to Rewilding Europe by ZSL. BirdLife International
and the European Bird Census Council, London UK: ZSL.
http://www.seo.org/wp-content/uploads/2013/09/Wildlife-
Comeback-Study-PDF. Accessed March 2014
Elts J, Leito A, Leivits A, Luigujoe L, Magi E, Nellis
Rein, Nellis Renno, Ots M, Pehlak H (2013) Status and
numbers of Estonian birds, 2008–2012. Hirundo 26(2):
80–112
European Commission (1994) CORINE land cover. Technical
guide. Office for Official Publications of European Com-
munities, Luxembourg
European Commission (2010) Situation and prospects for EU
agriculture and rural areas. European Commission Direc-
torate—General for Agriculture and Rural Development
European Crane Working Group (2014) http://champagne-
ardenne.lpo.fr/grus-grus/GreatCraneProject. Accessed
March 2014
Fourcade Y, Engler JO, Besnard AG, Rodder D, Secondi, J
(2013) Confronting expert-based and modelled distribu-
tions for species with uncertain conservation status: a case
study from the corncrake (Crex crex). Biol Conserv
167:161–171
Guisan A, Zimmermann NE (2000) Predictive habitat distri-
bution models in ecology. Ecol Model 135:147–186
Guzman SMJ, Garcia SA, Amado CC, del Viejoa AM (1999)
Influence of farming activities in the Iberian Peninsula on
Landscape Ecol
123
the winter habitat use of common crane (Grus grus) in
areas if its traditional migratory routes. Agric Ecosyst
Environ 72:207–214
Hansbauer V, Vegvari Z, Harris J (2014) Eurasian cranes and
climate change. Will short term gains be followed by long
term loss? International Crane Foundation, Baraboo,
Wisconsin, USA. https://www.savingcranes.org/images/
stories/pdf/conservation/eurasian_cranes_and_climate_
change.pdf
Harris J (2012) Cranes, agriculture, and climate change. In:
Proceedings of a workshop organized by the International
Crane Foundation and Muraviovka Park for Sustainable
Land Use. International Crane Foundation, Baraboo,
Wisconsin, USA
Hijmans RJ, Phillips S, Leathwick J, Elith J (2013) dismo: spe-
cies distribution modelling. R package version 0.9-3. http://
CRAN.R-project.org/package=dismo. Accessed March
2014
Holt C, Austin G, Calbrade N, Mellan H, Hearn R, Stroud D,
Wotton S, Musgrove A (2012) Waterbirds in the UK
2010/11: the Wetland Bird Survey. British Trust for
Ornithology, Royal Society for the Protection of Birds and
the Joint Nature Conservation Committee in association
with the Wetlands & Wildfowl Trust. http://www.bto.org/
sites/default/files/u18/downloads/publications/wituk1011_
section1.pdf. Accessed March 2014
Huntley B, Green RE, Collingham YC, Willis SG (2007) A
climatic atlas of European breeding birds. Durham Uni-
versity, the RSPB and Lynx Edicions, Barcelona
Ilyashenko E, Winter S (eds) (2011) Cranes of Eurasia (biology,
distribution, migrations, management). In: Proceedings of
the CWGE International Conference of ‘‘Cranes of Pale-
arctic: Biology and Conservation’’, Issue 4. A.N. Severtsov
Institute of Ecology and Evolution RAS, Moscow
Kaasik A, Sepp K, Raet J, Kuusemets V (2011) Transformation
of rural landscape in Hiiumaa since 1956: consequences to
open and half-open semi-natural habitats. Ekologia (Bra-
tislava) 30(2):257–268
Keskpaik J, Paakspuu V, Leito A, Lilleleht V, Leht R, Ka-
stepold T, Kuresoo A, Rattiste K (1986) Autumn concen-
trations of cranes Grus grus in Estonia. Var Fagelvarld
Suppl 11:81–84
Kraniche (2014) Kranichschutz Deutschland. http://www.
kraniche.de. Accessed December 2014
Kukk L, Astover A, Muiste P, Noormets M, Roostalu H, Sepp
K, Suuster E (2010) Assessment of abandoned agricultural
land resource for bio-energy production in Estonia. Acta
Agric Scand B 60(2):166–173
Leito A (2012) Sookure seire, aruanne 2012 (monitoring of
Eurasian Crane in Estonia, report 2012). Tartu. http://seire.
keskkonnainfo.ee/index.php?option=com_content&view=
article&id=2825:haned-luiged-ja-sookurg-2012&catid=
1296:eluslooduse-mitmekesisuse-ja-maastike-seire-2012-
&Itemid=5748. Accessed March 2014
Leito A, Lepisk A, Oun A (1987) Osennie skoplenija seryh
zuravlej v jugo-vostocnoj Estonii (autumnal concentration
of the common Crane in South-Eastern Estonia). In: Neu-
feldt IA, Keskpaik J (eds) Communications of the Baltic
Commission for the Study of Bird Migration 19, Tartu,
1987
Leito A, Truu J, Leivits A, Ojaste I (2003) Changes in distribution
and numbers of the breeding population of the Common
Crane Grus grus in Estonia. Ornis Fenn 80(42):159–171
Leito A, Ojaste I, Truu J, Palo A (2005) Nest site selection of the
Eurasian Crane Grus grus in Estonia: an analyse of nest
record cards. Ornis Fenn 82(2):44–54
Leito A, Keskpaik J, Ojaste I, Truu J (2006) The Eurasian Crane
in Estonia. Estonian University of Life Sciences, Tartu
Leito A, Truu J, Ounsaar M, Sepp K, Kaasik A, Ojaste I, Magi E
(2008) The impact of agriculture on autumn staging Eur-
asian Cranes (Grus grus) in Estonia. Agric Food Sci
17(1):53–62
Leito A, Ojaste I, Sellis U (2011) Eesti sookurgede Grus grus
randeteed (the migration routes of Eurasian Cranes
breeding in Estonia). Hirundo 24(2):42–53
Leito A, Ojaste I, Poder I (2013) Dependence of cranes on arable
lands and the crop damage problem in Estonia. In: Nowald
G, Weber A, Fanke J et al (eds) Proceedings of the VIIth
European Crane conference: breeding, resting, migration
and biology. Crane Conservation Germany, Gross
Mohrdorf
Leivits M (2013) Madalsoode ja rabade haudelinnustiku seire
2013 (monitoring of breeding birds of fens and bogs in
Estonia, Report 2013). Keskkonnaamet, Tallinn. http://
seire.keskkonnainfo.ee/attachments/article/3110/soolind
2013.pdf. Accessed March 2014
Lundin G (ed) (2005) Cranes—where, when and why? Var
Fagelvarld Supplement No 43. Swedish Ornithological
Society, Sweden
Maclean IMD, Austin GE, Rehfisch MM, Blew J, Crowe O,
Delany S, Devos K, Deceuninck B, Guønther K, Laursen
K, van Roomen M, Wahl JS (2008) Climate change causes
rapid changes in the distribution and site abundance of
birds in winter. Global Change Biol 14:2489–2500
Metzger MJ, Bunce RGH, Jongman RHG, Mucher CA, Watkins
JW (2005) A climatic stratification of the environment of
Europe. Global Ecol Biogeogr 14:549–563
Metzger MJ, Bunce RGH, Leemans R, Viner D (2008) Projected
environmental shifts under climate change: European
trends and regional impacts. Environ Conserv 35(1):64–75
Metzger MJ, Shkaruba AD, Jongman RHG, Bunce RGH (2012)
Descriptions of the European environmental zones and strata.
Alterra, Wageningen. https://envsci.ceu.hu/publications/
metzger/2012/32874. Accessed March 2014
Metzger MJ, Bunce RGH, Jongman RHG, Sayre R, Trabucco A,
Zomer R (2013) A high-resolution bioclimate map of the
world: a unifying framework for global biodiversity research
and monitoring. Global Ecol Biogeogr 22:630–638
Migration map (2014) http://birdmap.5dvision.ee/index.
php?lang=en. Accessed March 2014
Mitchell TD, Carter TR, Jones PD, Hulme M, New M (2004) A
comprehensive set of high-resolution grids of monthly
climate for Europe and the globe: the observed record
(1901–2000) and 16 scenarios (2001–2100). Tyndall
Centre Working Paper no. 55. Tyndall Centre for Climate
Change Research, University of East Anglia, Norwich, UK
Munillo P (2014) Gallocanta’s agri-environmental measures:
20 years managing the conflict between cranes and agri-
cultural production. In: Scientific Abstracts of Oral and
poster contributions of the VIIIth European Crane
Landscape Ecol
123
Conference 2014. Gallocanta, 10 to 14 November 2014,
Friends of Gallocanta Association, Gallocanta, Spain
Nowald G (2010) Colour marking and radio tracking of com-
mon cranes Grus grus in Germany and Europe—an over-
view. Vogelwelt 131:111–116
Nowald G, Donner N, Modrow M (2010) The development of
common crane Grus grus resting and the influence of
agriculture in the Rugen-Bock region in northeast Ger-
many. Vogelwelt 131:123–127 (in German with English
summary)
Nowald G, Weber A, Weinhardt E (2012) Das Kranichjahr
2011/2012. The year of the crane 2011/2012. AG Kra-
nichschutz DEuttscland. Kranich-Informationszentrum,
Gross Mohrdorf
Nowald G, Weber A, Fanke J, Weinhardt E, Donner N (eds)
(2013) Proceedings of the VIIth European Crane Confer-
ence: breeding, resting, migration and biology. Crane
Conservation Germany, Gross Mohrdorf
Palang H, Mander U, Luud A (1998) Landscape diversity
changes in Estonia. Landsc Urban Plan 41:163–169
Phillips S, Dudik M (2008) Modeling of species distributions
with Maxent: new extensions and comprehensive evalua-
tion. Ecography 31:161–175
Phillips S, Dudik M, Schapire R (2004) A maximum entropy
approach to species distribution modelling. In: Proceedings
of the twenty-first international conference on machine
learning
Phillips S, Anderson R, Schapire R (2006) Maximum entropy
modelling of species geographic distributions. Ecol Model
190(3–4):231–259
Prange H (ed) (1989) Der Graue Kranich. Die Neue Brehm-
Buherei, Bd. 229. A. Ziemsen, Wittenberg Lutherstadt
Prange H (2010) Zug und Rast des Kranichs Grus grus und die
Veranderung in vier Jahrzehnten. Die Vogelwelt
131:155–167
Prange H (2012) Reasons for changes in crane migration pat-
terns along the West-European flyway. In: Harris J (ed)
Cranes, agriculture and climate change. In: Proceedings of
a workshop organized by the International Crane Founda-
tion and Muraviovka Park for sustainable land use, May
28–June 3, 2010. International Crane Foundation, Baraboo,
Wisconsin
Prange H (2014) Changes of crane migration on the West
European route and their reasons. In: Scientific abstracts of
oral and poster contributions of the VIIIth European Crane
Conference 2014. Gallocanta, 10 to 14 November 2014,
Friends of Gallocanta Association, Gallocanta, Spain
Prowse SR (2013) Cranes in the UK: past, present and future. In:
Nowald G, Weber A, Fanke J et al (eds) Proceedings of the
VIIth European Crane Conference: Breeding, Resting,
Migration and Biology. Crane Conservation Germany,
Gross Mohrdorf
Raet J, Sepp K, Kaasik A (2008) Assessment of changes in
forest coverage based on historical maps. Forestry Studies
48:69–80
Raet J, Sepp K, Kaasik A, Kuusemets V, Kulvik M (2010)
Distribution of the Green Network of Estonia. Forestry
Studies 53:66–74
R Core Team (2013) R: a language and environment for sta-
tistical computing. R Foundation for Statistical Comput-
ing, Vienna. http://www.R-project.org. Accessed March
2014
Renner IW, Warton DI (2013) Equivalence of MAXENT and
Poisson point process models for species distribution
modelling in ecology. Biometrics 69(1):274–281
Salvi A (2013) Eurasian crane (Grus grus) and agriculture in
France. In: Nowald G, Weber A, Fanke J et al (eds) Pro-
ceedings of the VIIth European crane conference: breed-
ing, resting, migration and biology. Crane Conservation
Germany, Gross Mohrdorf
Satelliittikurjet (2014) Migration routes and most important
stopover sites and over-wintering grounds of the Finnish
population of the Eurasian crane (Grus grus). http://www.
satelliittikurjet.fi/index.html. Accessed March 2014
Saurola P, Valkama J, Velmala W (eds) (2013) The Finnish bird
ringing atlas, vol I. Finnish Museum of Natural History and
Ministry of Environment, Helsinki
Species Assessments: Eurasian Crane (Grus grus) Least Con-
cern. WI/IUCN SSC Crane Specialist Group—Crane
Conservation Plan 2014. International Crane Foundation,
Baraboo, Wisconsin (in press)
Suorsa P, Hakkarainen H (2013) Migration of the common crane
(Grus grus) in the light of the Finnish satellite telemetry
study. In: Saurola P, Valkama J, Velmala W (eds) The
Finnish bird ringing atlas, vol I. Finnish Museum of Nat-
ural History and Ministry of Environment, Helsinki
The Great Crane Project (2014) http://www.
thegreatcraneproject.org.uk. Accessed March 2014
The Norfolk crane story (2014) http://www.norfolkcranes.co.
uk/news.html. Accessed December 2014
Tortosa FS, Caballero JM, Reyes-Lopez J (2002) Effect of
rubbish dumps on breeding success in the white stork in
southern Spain. Waterbirds 25:39–43
University of East Anglia (2013) Why white storks have stopped
migrating? Science Daily. http://www.sciencedaily.com/
releases/2013/02/130227085845.htm. Accessed March
2014
Vasiliev N, Astover A, Motte M, Noormets M, Reintam E,
Roostalu H, Matveev E (2008) Efficiency of Estonian grain
farms in 2000–2004. Agr Food Sci 17:31–40
Vegvari Z, Hansbauer M, Schulte B (2012) The Hortobagy
National Park—one of the most important stop-over sites
for the Eurasian Cranes in Europe: Changes and threats. In:
Harris J (ed) Cranes, agriculture and climate change. Pro-
ceedings of a workshop organized by the International
Crane Foundation and Muraviovka Park for sustainable
land use, May 28–June 3, 2010. International Crane
Foundation, Baraboo, Wisconsin
Landscape Ecol
123
Related Documents