THE POTENTIAL FOR ENERGY CONSERVING CAPITAL EQUIPMENT IN U. K. INDUSTRY Steven D Fawkes Thesis submitted for the degree of PhD University of Stirling February 1985

Welcome message from author
This document is posted to help you gain knowledge. Please leave a comment to let me know what you think about it! Share it to your friends and learn new things together.
Transcript

THE POTENTIAL FOR ENERGY CONSERVING CAPITAL EQUIPMENT
IN U. K. INDUSTRY
Steven D Fawkes
Thesis submitted for the degree of PhD
University of Stirling
February 1985

THE POTENTIAL FOR ENERGY CONSERVING CAPITAL EQUIPMENT
IN U. K. INDUSTRY
SD ? AWxES
A9STRACT
Energy conservation, the improvement of energy efficiency, is recognised
as an important part of energy policy. This thesis examines the potential
for conservation investment and possible energy savings, in part of the UK
industrial sector. Assessments of the extent and type of energy conserv-
ation activity to date, both investments and energy management, within the
brewing, malting, distilling and dairy sectors are made. Achievements to
date affect future potentials.
In the light of a model of technical change related to energy conservation
several potentials are defined. 'she inter-related problems of estimating
or measuring these and measuring performance in energy management are discussed.
Some estimates of potentials, with e:: plicit assumptions, are made for the
four sectors studied. As any definition or measurement of potential is
arbitrary, processes of change are also examined. A soft systems model
of necessary activities in energy management is advanced and used to explore
managerial barriers to profitable conservation investments in companies
studied. Managerial factors for promoting successful energy management are
discussed. Economic barriers to change are explored by profitability
modelling for several energy conservation techniques used within the four
sectors, including heat pumps and combined heat and power.
The approach used throughout has been systematic and on several levels.
SD FAWKES
(i)

ACKNOWLEDGEMENTS
Writing a thesis is a relatively solitary activity but one which requires
the help and cooperation of many people. Sometimes help is openly
requested and given, sometimes both the request and the response are
deeply hidden to one or both parties. The following people have given
much help in many ways and I would like to thank them all. To list the
nature of their help would be lengthy and in some cases it is best left
unsaid. I trust they know why they are included here.
Dr Keith Jacques Mr Richard Shaw Miss Janet Crabb Mike Makower The teaching and office staff of the Management Science
Department, University of Stirling Alistair Sutherland Bill Earle The MSc TechEc course of 1981/82. Alasdair Dow The members of Flat 6 My parents Peter and Hazel Brian and Suzanne Ian and Mandie Mark and Tina Margaret Wall Karen Rigby Sarah Gwatkin Dolores Horan Melanie Sexton Julie Leff Tamsin Phipps Susan Dowling
Last but not least, the thesis would certainly have been impossible
without the assistance of all the people in industry who cannot be named here but who gave freely of that most precious resource, time. They
are out there doing what as yet I have only written about, and have my
great respect. No cases related in the thesis should be taken to imply
criticisms of the individuals involved.
(ii)

SOURCE OF FINANCE
The assistance of the Joint Committee of the Science and Engineering
and Social Science Research Councils in providing funding for this
research project is also gratefully acknowledged. The author would
also like to express his gratitude to the Joint Committee for funding
his visit to the Energex '84 Conference in Regina, Canada, in May 1984
and for providing an opportunity to present some results to the
Committee at a Workshop at the University of Warwick in June 1984.
(iii)

THE POTENTIAL FOR ENERGY CONSERVING CAPITAL EQUIPMENT
IN U. K. INDUSTRY
CONTENTS
THE STRUCTURE OF THE THESIS
Chapter One INTRODUCTION
1.1 The international energy problem
1.2 The UK consumers' energy problem
1.3 What is energy conservation?
1.4 Why is conservation important?
1.5 Future energy prices
1.6 Summary
Chapter Two RESEARCH OBJECTIVES AND DATA COLLECTION
Paqe
1
3
3
3
5
6
7
9
11
2.1 Introduction 11
2.2 A personal criticism of Leach 13
2.3 Research objectives and methodology 16.
2.4 Selecting the sectors fdr study 18.
2.5 Refined objectives 22
2.6 Data collection 23
2.7 Summary 25
SECTION ONE: ACHIEVEMENTS TO DATE 26
Introduction 26
Chapter Three /
(iv)

Page
Chanter Three ENERGY SAVINGS IN BREWERIES 28
3.1 Introduction 28
3.2 Small sites (o - 299000 hl/a) 28
3.2.1 Reported reductions in specific energy 29
3.2.2 Retro-fit versus investment in new plant 29
3.2.3 Innovation versus adaption of existing equipment 32
3.2.4 The energy conservation techniques used 32
3.3 Medium sites (300000 - 1000000 hl/a) 32 3.3.1 Reported reductions in specific energy 32
3.3.2 Retro-fit versus investment in new plant 32
3.3.3 Innovation versus adaption of existing equipment 37 3.3.4 The energy conservation techniques used 38
3.4 Larger sites ( 1000000 hl/a) 38 3.4.1 Reported reduction in specific energy 38
3.4.2 Retro-fit versus investment in new plant 38
3.4.3 Innovation versus adaption of existing equipment 38
3.4.4 The energy conservation techniques used 44
3.5 Discussion and summary 44 3.5.1 Reduction in specific energy achieved 44 3.5.2 Investment criteria 45 3.5.3 Retro-fit versus investment in new plant 45
3.5.4 Innovation versus adaption of existing equipment 46 3.5.5 The energy conservation techniques used 47
3.6 Observed characteristics of energy management in 56
breweries
3.7 The relationships between observed energy management 62
characteristics and reduction in specific energy in the brewing sector
3.7.1 Size and energy management grouping 62 3.7.2 Use of monitoring and reduction in specific energy 62
3.7.3 Use of targetting and reduction in specific energy 63 3.7.4 Use of cost centres and reduction in specific energy 63
3.7.5 Energy management grouping and achieving a higher 64
than median reduction in specific energy 64 3.7.6 Full-time energy Manager 64
3.8 Summary 64
Chapter Four ENERGY SAVING ACHIEVEMENTS IN THE DAIRY 66
SECTOR
4.1 Introduction 66
4.2 Reduction in specific energy 66
4.3 Investment criteria 67
4.4 The energy conservation techniques used or considered 67
4.5 Innovation versus adaption of existing techniques 69
4.6 observed characteristics of energy management in the 69 dairy sector
4.7 Summary 72
(v)

Page
Chapter Five ENERGY SAVINGS IN DISTILLERIES 73
5.1 Introduction 73
5.2 Reductions in specific energy 73
5.3 Investments made or considered in the distilling sector 74
5.4 Investment criteria 79
5.5 Observed characteristics of energy management in the 79 distilling sector
5.6 Summary
Chapter Six ENERGY SAVING IN THE MALTING SECTOR
80
81
6.1 Introduction 81
6.2 Reductions in specific energy achieved 81
6.3 Investments made in the malting sector 81
6.4 Observed characteristics of energy management in the 90
malting sector
6.5 Investment criteria 6.6 Discussion
6.7 Summary
Summary of Section one
References: Section One
SECTION TWO: THE POTENTIAL FOR FURTHER CHANGE
Introduction
Chapter Seven THE PROCESS OF TECHNICAL CHANGE
7.1 Introduction
7.2 The process of technical change 7.3 Adoption and adaptation 7.4 Intermediate summary 7.5 The situation facing a firm
7.6 Technical change and buying behaviour: a synthesis
7.7 /
91
91
92
93
95
99
99
100
100
100
103
107
109
112
(vi
Page
7.7 Defining potentials for energy conserving capital 113
equipment 7.8 Measuring potentials 118
7.9 Measuring success or performance in energy management 123
7.10 Specific energy for inter-site comparisons 123
7.11 Reduction in specific energy for inter-site comparisons 124
7.12 Reduction in specific energy for in-site comparisons 124
7.13 The Brewers' Society Index 127
7.14 Summary 128
Chapter Eight ESTIMATING INDUSTRY WIDE POTENTIALS 130
8.1 Introduction 130
8.2 Estimates of potential in the literature 130
8.3 Estimates of potentials in the four sectors 131
8.4 Discussion 132
8.5 Small breweries ( 299000 hl/a): potentials 134
8.6 Medium and large breweries ( 300000 hl/a): potentials 135
8.7 Summary 135
Chapter Nine A SOFT SYSTEMS MODEL OF ENERGY MANAGEMENT 137
9.1 Introduction 137
9.2 The hierarchy of systems 138
9.3 System objective 139
9.4 The activities in the model 140 9.4.1 Good housekeeping level 140 9.4.2 Investment levels - retro-fit and new plant 140
9.5 Summary 150
Summary of Section Two 151
References: Section Two 154
SECTION THREE /
,A
(vii)
Page
SECTION THREE BARRIERS TO FURTHER CHANGE 157
Introduction 157
Chapter Ten HEAT PUMPS FOR HEAT RECOVERY IN THE BREWING 159 AND DAIRY SECTORS
10.1 Introduction 159
10.2 Method 162
10.3 Computer program assumptions 163
10.4 The use of payback criterion and Internal Rate of 164 Return
10.5 Base case assumptions 165
10.6 General results 166
10.7 Sensitivity analysis 168 10.7.1 Capital cost factors 168 10.7.2 Utilisation factor 172 10.7.3 Price factors 174
10.8 Conclusions 176
Chapter Eleven COMBINED HEAT AND POWER IN THE FOUR SECTORS
11.1 Introduction
11.2 What is industrial CHP?
-11.3 Why examine industrial CHP?
11.4 Heat to power ratios and system sizing 11.5 CHP in the brewery sector 11.6 General results 11.7 Sensitivity analysis 11.. 8 Other barriers to CHP
11.9 Conclusions
179
179
179
180
182
184
185
188
189
191
Chapter Twelve PROFITABILITY MODELLING OF OTHER TECHNIQUES 192
12.1 Introduction 192
12.2 Sub-metering 192
12.3 Low-energy lighting 194
12.4 Energy management system for a building with an annual 196
energy cost of £25,000
(viii)

Pace
12.5 Condensate recovery 196
12.6 oxygen trim control systems 197
12.7 Economics of a keg washing line heat recovery system 198
12.8 Improvements to pasteuriser 199
12.9 Other techniques 200
12.10 Summary 200
Chapter Thirteen MANAGERIAL BARRIERS TO CHANGE
13.1 Introduction
13.2 Informational problems
13.3 Strategic problems
13.4 Discussion
13.5 Organisational and human problems 13.6 Summary
201
201
201
204
208
211
215
Chapter Fourteen MANAGERIAL FACTORS FOR PROMOTING ENERGY 217
MANAGEMENT
14.1 Introduction 217
14.2 The important factors 218
14.3 Existence of an energy management information and 219 control system, targetting and an appropriate organisational design
14.4 Organisational climate 221
14.5 Senior management support 221
14.6 Existence of a technological entrepreneur or product 222 champion character
14.7 Existence of a technological gatekeeper or hunter- 223 gatherer
14.8 Motivation, training and development at all levels 224
14.9 Summary 225
Summary /
(ix)

Page
Summary of Section Three
References: Section Three
Chapter Fifteen OVERALL SUMMARY AND CONCLUSIONS
226
228
231
15.1 Summary 231
15.2 Conclusions 232
References: Summary and conclusions 237
APPENDICES
Appendix 1 Analysis of investments reported in "Energy 238 Management" - October 1981 to October 1982
Appendix 2 Significance test for size and the use of monthly 239
or more frequent monitoring
Appendix 3 Significance test for size and the use of 240 targetting
Appendix 4 Significance test for use of monitoring at 241 monthly or more frequent intervals and achieving a reduction in specific energy
Appendix 5 Significance test for monitoring at monthly or 242 more frequent interbals and achieving a higher than median reduction in specific energy
Appendix 6 Significance test for monitoring at monthly or 243
more frequent intervals and differences of means
Appendix 7 Significance test for use of targetting and 246 achieving a reduction in specific energy
Appendix 8 Significance test for use of targetting and 247 achieving a larger than median reduction in specific energy
Appendix 9 Significance test for targetting and difference 248
of means
Appendix 10 Significance test for targetting and achieving a 250 reduction in specific energy
Appendix 11 Significance test for targetting only and 251 achieving a larger than median reduction in specific energy
Appendix 12 Significance test for targetting only and 252 difference of means
Appendix 13 Significance test for cost centres and achieving 254 a reduction in specific energy
(x)

Page
Appendix 14
Appendix 15
Appendix 16
Appendix 17
Appendix 18
Appendix 19
Appendix 20
Appendix 21
Appendix 22
Appendix 23
Appendix 24
Appendix 25
Appendix 26
Appendix 27
Appendix 28
Appendix 29
Appendix 3C
Significance test for cost centres and achieving 255 a larger than median reduction in specific energy
Significance test for use of cost centres and 256 difference of means
Significance test for energy management grouping and achieving a larger than median reduction in specific energy
259
Calculation of Brewers' Society Index 260
Summary of characteristics of proposed heat 261 pump installations
Technical performance of heat pumps at various 262 temperatyre differentials
Basic model for formulating LP algorithm for CHP 263
Cost-benefit analysis of sub-metering 265
Cost-benefit analysis of a low-energy lighting 269 scheme
Cost-benefit analysis of an energy management 271 system
Cost-benefit analysis of a condensate recovery 273 project
Cost-benefit analysis of a keg washing line 276 heat recovery system
Cost-benefit analysis of a pasteuriser improve- 279
ment project
List of organisations contacted during the 280 research
Questionnaire for brewing sites
Standard assumptions for DCF Calculations and example calculation
285
288
Notes to Statistical Appendices 290
Technical Appendix One: Heat pump technology 291
Technical Appendix Two: Combined heat and power systems 301
(xi)

LIST OF TABLES
Table 1.1
Table 1.2
Table 2.1
Table 2.2
Table 3.1
Table 3.2
Table 3.3
Table 3.4
Table 3.5
Table 3.6
Table 3.7
Table 3.8
Table 4.1
Table 4.2
Table 4.3
Table 5.1
Table 5.2
Table 6.1
Table 6.2
Table 6.3
Table 6.4
Table 6.5
Table 8.1 /
Paqe
Energy per unit of industrial output in the UK from 7 1960 to 1980
Summary of oil price projections 10
Total primary fuel equivalent energy consumption of the four sectors in 1976
Number of sites data collected for in each sector
19
24
Number of sites reporting savings in the small 31 brewery sub-sector according to size
Ranking of frequency of use of energy saving techniques in the brewing sector
Techniques used in the small brewery sub-sector
Techniques used in the medium brewery sub-sector
33
34
39
Techniques used in the large brewery sub-sector 41
Techniques used in the brewery industry - summary 52
Observed characteristics of energy management systems in the brewing sector
57
Classification of brewery sites according to 61
observed energy management characteristics
Reductions in specific energy achieved by sampled dairy sites
Investments made in the dairy sector
Classification of dairy sites according to energy management grouping
Summary of investments made by distilling companies
Investments in distilling sector sample
66
68
70
75
77
Data summary - malting company MOO1 81
Data summary - malting company M002 82
Data summary - malting company M003 83
Data summary - malting company M004 84
Investments in the malting sector 88
(xii)

Page
Table 8.1 Estimates of the technical potentials for energy 131 conservation in the brewing, malting and dairy sectors
Table 8.2 Estimates of the potentials in the four sectors 133
Table 10.1 Heat pump sensitivity analysis, capital cost 171 factor, electrically driven machine
Table 10.2 Heat pump sensitivity analysis, capital cost 171 factor, gas engine machine
Table 10.3 Heat pump sensitivity analysis, utilisation factor, 173 electrically driven machine
Table 10.4 Heat pump sensitivity analysis, utilisation factor, 173 gas engine machine
Table 10.5 Heat pump sensitivity analysis, fuel price factor, 175 electrically driven machine
Table 10.6 Heat pump sensitivity analysis, fuel price factor, 175 gas engine machine
Table 11.1 Characteristics of CHP systems 183
Table 11.2 Results summary 187
Table 11.3 Diesel installation sensitivity analysis, capital 190 cost factor
Table 11.4 Diesel installation sensitivity analysis, fuel 190 price factor
Table 11.5 Diesel installation sensitivity analysis, imported 190 electricity price factor
Table 11.6 Diesel installation sensitivity analysis, exported 190 electricity price factors
Table 11.7 Diesel installation sensitivity analysis, utilisation 190 factor
(xiii)

LIST OF FIGURES
Figure 1.1 Industrial energy prices in the UK compared to wholesale prices between 1970 and 1981
Figure 2.1 The generalised process of change
Figure 2.2 Pareto.. diagram showing the fuel purchases (in
primary energy terms) of the brewing industry
relative to other sectors outside iron and steel and heavy chemicals
Page
4
17
20
Figure 3.1 Distribution of reported reductions in specific 30
energy - small breweries
Figure 3.2 Distribution of reported reductions in specific - 36
energy - medium breweries
Figure 3.3 Distribution of reported reductions in specific 43 energy - large breweries
Figure 7.1 Factors influencing potential in any one site 120
Figure 7.2 Scheme of potentials 121
Figure 7.3 Categories for classifying energy conserving 122 techniques
Figure 7.4 A typical energy per output curve 125
Figure 7.5 Increase in specific energy due to reduced output 125 despite conservation measures
Figure 9.1 Soft systems model of energy management activities 144
Figure 9.2 Sub-system for good housekeeping level 145
Figure 9.3 Sub-system for identifying retrofit investment 146 opportunities
Figure 9.4 Sub-system for evaluation stage 147
Figure 9.5 Sub-system for new investments 148
Figure 9.6 Sub-system for actively developing new techniques 149
Figure 10.1 Heat exchange and heat pumping 160
Figure 10.2 Proposed gas engine heat pump installations - 169 payback periods
Figure 10.3 Proposed electrically driven heat pump installations - 170
payback periods
(xiv)

Page
Figure 11.1 Pattern of heat and power demands in a brewery 186
Technical Appendix One: Heat pump technology
Figure 1 Basic components of the vapour compression cycle
Figure 2 The vapour compression cycle on a pressure/ enthalpy diagram
Figure 3 The flow of energy in an electrically driven pump
Figure 4 The flow of energy in: a gas driven heat pump
Technical Appendix Two: Combined heat and power systems
289
290
29 3
294
Figure 1 Schematic of a steam turbine CHP system 299
Figure 2 Schematic of a gas turbine CHP system 300
Figure 3 Schematic of a diesel engine CHP system 303
Figure 4 Schematic of a fuel cell CEP system 305
(xv)

THE STRUCTURE OF THE THESIS

THE STRUCTURE OF THE THESIS
In any wide ranging, systems based study the structure of the final
document presents many problems. The written word is linear while the
real world is anything but linear, having many kinds of relationships
and feedbacks. This thesis has three sections, each dealing primarily
with one of the three major objectives. These objectives are:
i. To assess the extent of energy conservation activity in
the four industrial sectors studied and to determine
which techniques had been used.
2. To assess the potential for further energy conservation.
and 3. To examine barriers to further change.
Each section deals with one objective and is, as far as possible, internally
consistent and complete. There are however important interactions between
the three sections. For example, achievements to date partially determine
potentials for further change, as do the barriers described in Section 3.
These interactions are described in the text at appropriate places.
Each section is now described.
Section 1: Achievements to Date
This consists of summaries of the achievements to date within the four.
sectors studied in terms of (a) the reduction in specific energy (energy
per unit of output; (b) the techniques used to achieve these reductions,
and (c) the characteristics of energy management systems. It is mainly
descriptive with little discussion.
Section 2: The potential for further change
In order to assess the potential for further change it is necessary first
to define what we mean by potential. This requires modelling the process
of change, that is the process of technical change resulting in energy
conservation. From this model, really a model of general technical change,
it is possible to define potentials for further change. This model also
allows us to describe the activities necessary in energy management.

A "soft systems" methodology is used to develop a starting point for
structured debate rather than a "final development" of energy management
activities.
In this section it is also necessary to discuss the problems of measuring
success in energy management. It is argued that success in energy
conservation, i. e. a large reduction in specific energy, does not necess-
arily correlate with success in energy management. Using a simple
specific energy index, without taking into account several factors only
discernible by a close inspection of the company's situation, is too
simplistic an approach. Only after considering these factors can we
estimate the potential for further change in individual companies and
the four sectors as entities.
Section 3: Barriers to further change
The model of technical change described in Section 2 allows us to examine barriers to further change. These can be divided into techn-o-economic
and managerial. The absence of energy management in any form is a major
barrier to change, as is a lack of "quality" in energy management. What
constitutes quality of energy management is discussed and the levels of
quality found in the four sectors, described in Section 1, are drawn on in this discussion. Managerial barriers are explored using the soft-
systems model described in Section 2. Techno-economic barriers are
examined for two major techniques, heat pumps for heat recovery and combined
heat and power, and several other less spectacular techniques.
Section 1 is effectively a "snap-shot" of the current position within the
four sectors, while Sections 2 and 3 and concerned with "moving pictures"
of the processes of change.

Chapter 1
INTRODUCTION
1.1 The international energy problem
The "oil crises" of 1973 and 1979, combined with increasing
environmental awareness, have made energy one of the major world
concerns over the last decade. The energy problem is a complex
set of inter-related technological, economic and social problems
on many levels. Different regions, countries and sectors face
very different situations, all of which are aspects of the global
energy problem.
It is plain in retrospect that the oil crises were not caused by
physical depletion of resources. The events of the early 1970s
were a result of a shift of power over resource flows from
Western oil companies to the oil producing nations at a time of
high demand. The second oil crisis in 1979 was precipitated by
the political changes in Iran leading to loss of a major supply
of crude oil. For full accounts and various perspectives on
both the oil crises and ultimate fossil fuel resource availability
see Sampson (1980), Odum (1981), Ion (1980) and Yergin and
Hillenbrand (1982).
1.2 The UK consumers' energy problems
At the level of individual consumers, in all sectors of the UK
economy, the energy problem has, with a few exceptions, been one
of rising real energy prices rather than supply constraints.
This thesis is concerned with the UK industrial sector and Figure 1.1
shows industrial energy prices in the UK from 1970 to 1981 compared
to general wholesale prices.

4
Figure 1.1 INDUSTRIAL ENERGY PRICES IN THE UK COMPARED TO WHOLESALE PRICES, BETWEEN 1970 AND 1981
goo -ý
700-
6007
500
idex 400
ý
300-
200 - "ýb
19 70 19T2 1.97 4 1976 19 78 1990 Iv sf Current prices index 1970 to 1981
1970 = 100
Industrial energy prices
Wholesale prices, excluding crude oil and carbonised coal.
Source: Energy Efficiency Office, 1983

1.3 What is energy conservation?
Energy conservation is still widely, but incorrectly, associated
with sacrifice (for example see H&V News, February 1984).
Beijdorff (1979) identifies three ways of conserving energy:
1. By not doing things (e. g. not heating a factory or house).
2. By doing things but reducing the quality, e. g. reduce the
heating temperature.
3. By doing things as before (or better), but using less
energy, e. g. heating to the same temperature (or higher)
but using a system that uses less energy to achieve the
same result.
It should be noted that these are methods of conserving energy
within the consumer's sub-system which may not reduce total
system, e. g. national energy use. For example, a reduction in
factory heating temperature may lead to greater absenteeism, which
apart from possibly reducing output, could increase domestic energy
consumption.
Method 1 in Beijdorff's classification does not usually require
capital expenditure, though there could conceivably be decommissioning
costs. Method 2 may involve capital expenditure if product or process
redesign is necessary. It is more likely to involve a simple control
action such as turning down a thermostat. Both methods involve
sacrifice and tend to rely on voluntary austerity or compulsory
measures such as the legal maximum heating limits of 19°C in public
buildings, or the 55 mph speed limit in the USA. As Beijdorff
comments, neither voluntary austerity or compulsory measures are
likely to be acceptable over long periods, especially when disposable
incomes are rising. Method 3 has a lasting effect without sacrificing
quality but requires technical change and capital investment. This
approach is often called the "technical fix".

This thesis is concerned with the technical fix form of energy
conservation within the UK industrial sector. For ease of
reading the more familiar term of energy conservation has been
used but what is really under discussion is capital investment
to improve the productivity of energy use. It should be noted
that energy use per unit of economic output has been falling
throughout the industrial sector for many years (see Table 1.1),
and "energy conservation" means in fact more efficiency
improvements.
1.4 Why is conservation important?
Conservation is one part of the Western countries' strategy for
dealing with the energy problem which is based on a coal-nuclear-
conservation troika. It is seen as an important method of
reducing dependence on oil, which remains the most important
energy source. As we will see below, crude oil prices are
expected to continue rising in real terms despite current slackness
in the market. Other energy prices are expected to be tied to oil
prices.
1.5 Future energy prices
Consideration of future energy prices requires an international
perspective. Even the UK, temporarily self-sufficient in energy,
cannot expect to be insulated from world price.
Forecasting energy prices, even in the short-term, is difficult
and the only certainty in forecasting is that the forecast will be
wrong (Challis, 1982). In recent years there has been a shift
towards scenarios and away from econometric forecasts. Scenarios
allow the inclusion of qualitative information such as political
judgements and help to make assumptions explicit.
The early 1980s have seen a weakening of the oil price which is
attributed to two factors: non-OPEC (Organisation of Petroleum
Exploiting Countries) reserves coming on-stream and a slackening in
oil demand in the industrialised countries due to a combination of

7
Table 1.1 ENERGY PER UNIT OF INDUSTRIAL OUTPUT IN THE UK from 1960 to 1980
Year 1960 1973 1974 1975 1976 1977 1978 1979 1980
Energy per unit of industrial
output
1973 = 100
112 100 83 88 89 85 82 81 75
Source: International Institute for Applied Systems Analysis (1981)
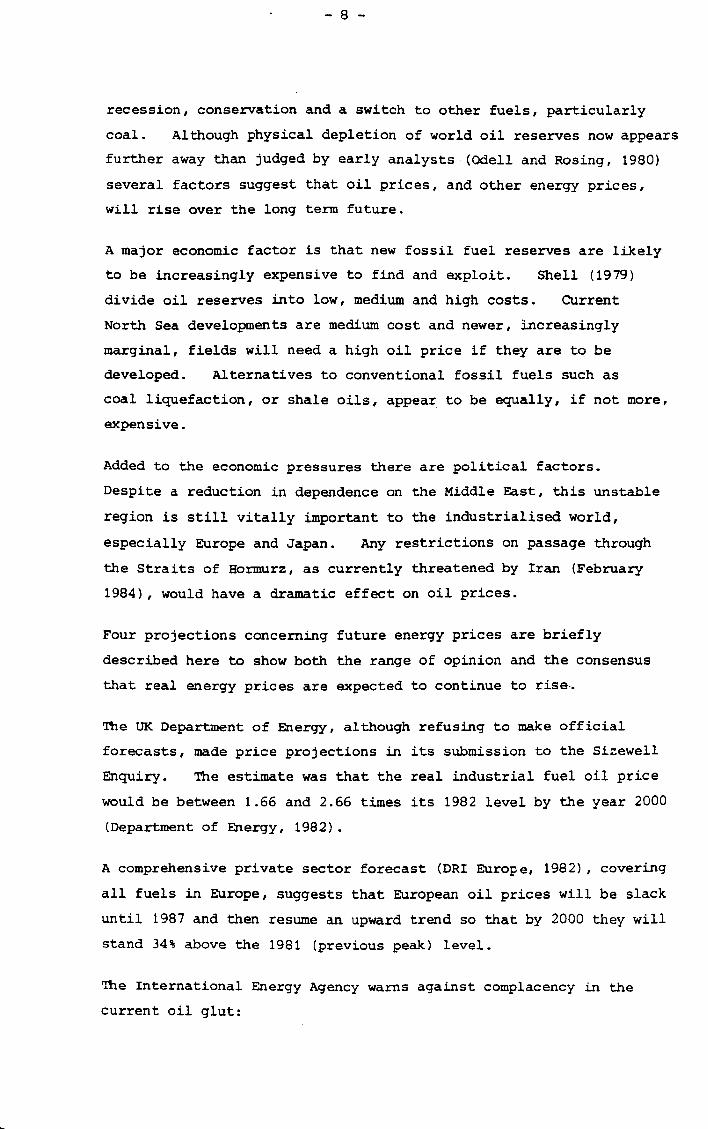
recession, conservation and a switch to other fuels, particularly
coal. Although physical depletion of world oil reserves now appears
further away than judged by early analysts (Odell and Rosing, 1980)
several factors suggest that oil prices, and other energy prices,
will rise over the long term future.
A major economic factor is that new fossil fuel reserves are likely
to be increasingly expensive to find and exploit. Shell (1979)
divide oil reserves into low, medium and high costs. Current
North Sea developments are medium cost and newer, increasingly
marginal, fields will need a high oil price if they are to be
developed. Alternatives to conventional fossil fuels such as
coal liquefaction, or shale oils, appear to be equally, if not more,
expensive.
Added to the economic pressures there are political factors.
Despite a reduction in dependence on the middle East, this unstable
region is still vitally important to the industrialised world,
especially Europe and Japan. Any restrictions on passage through
the Straits of Hormurz, as currently threatened by Iran (February
1984), would have a dramatic effect on oil prices.
Four projections concerning future energy prices are briefly
described here to show both the range of opinion and the consensus
that real energy prices are expected to continue to rise.
The UK Department of Energy, although refusing to make official
forecasts, made price projections in its submission to the Sizewell
Enquiry. The estimate was that the real industrial fuel oil price
would be between 1.66 and 2.66 times its 1982 level by the year 2000
(Department of Energy, 1982).
A comprehensive private sector forecast (DRI Europe, 1982), covering
all fuels in Europe, suggests that European oil prices will be slack
until 1987 and then resume an upward trend so that by 2000 they will
stand 34% above the 1981 (previous peak) level.
The International Energy Agency warns against complacency in the
current oil glut:

The current outlook for short-term stability in energy markets and the oil market in particular is deceptive because signals in today's surplus markets do not reflect the underlying medium and long-term trends. In fact, trends point to recurrent oil supply stringency later in the 1980s and thus the need for constant attention to energy policy as a means of avoiding severe economic constraint.
International Energy Agency (1982)
Stobaugh (1982) describes two judgemental scenarios for world energy
developments to the year 2000, with intermediate stops at 1985 and
1990. The. Upper Bound is based primarily on the projections and
analyses of the IEA and is optimistic over future energy supplies.
The Lower Bound assumes "things do not go very well" but excludes
contingencies such as a shutdown of all or a major part of the oil
output of the Middle East.
In the Upper Bound the key real oil price is assumed to rise at
2% per year while in the more tightly constrained Lower Bound it
rises at 4.5% per year. Starting at $30 a barrel in 1980, the
price of oil would thus rise in real terms (1980 dollars) to
$45 a barrel in the Upper Bound and $72 in the Lower Bound in 2000.
Stobaugh, and other analysts, expect the price trend to follow an
unstable pattern of "jagged peaks and sloping plateaus", rather
than a smooth upward trend.
The projections for oil prices for the four scenarios are summarised
in Table 1.2.
r 1.6 Summa
This chapter has described the three types of energy conservation,
two of which require voluntary austerity or compulsion. The third
requires technical change and investment. It is this method of
energy conservation that this thesis is concerned with.
We have also seen how the energy problem for consumers in all
sectors has been one of rising real prices. The industrial sector,
which is the subject of this thesis, has not been and will not be
exempt from this trend.

Table 1.2 SUMMARY OF OIL PRICE PROJECTIONS
FORECAST / SCENARIO
UK Dept. DRI Stobaugh Stobaugh
of Energy Europe Upper Bound Lower Bound (1) (2) (2) & (3) (2)
Price Index 166 - 266 134 150 240
Base year 1982 = 100 1981 = 100 1980 = 100 1980 = 100
Notes: (1) Industrial fuel oil (2) Crude oil (3) Similar to LEA's forecast

Chapter 2
RESEARCH OBJECTIVES AND DATA COLLECTION
2.1 Introduction
The general objective of the research has been to test the
feasibility of achieving low energy scenarios, particularly
Leach et al (1979). Leach et al, in "A Low Energy Strategy
for the United Kingdom", purport to show "how the UK could
have 50 years of prosperous material growth and yet use less
primary energy than it does today". It claims that the
introduction of known conservation techniques, that are "widely
judged to be 'economic"', at quite modest rates could counter-
balance all increases in energy use-that would otherwise come
about from growth in material standards.
The approach in Leach et al is "to start wherever possible with
the ultimate purpose for which energy is used - the useful
energy demand - and work upwards from there to primary energy
supplies, fuel by fuel, and sub-sector by sub-sector".
This "bottom-up" approach to energy modelling is based on
physical and engineering analyses and is in contrast to the
"top-down" methodology of official, econometric models. It is
claimed that the bottom-up approach allows the detection of
saturation effects and important energy feedback effects. It
also identifies where fuel substitution is possible.
Leach's model starts from a detailed breakdown of energy use in
the baseline year 1976. Using various studies of energy use
in different sectors energy demand in 1976 is broken down into
nearly 400 separate categories determined by end uses, fuels
and appliances.
in the industry model the central postulate is that the energy
intensity of industrial output can be reduced in all sectors at
a regular, and quantifiable, rate. "This reduction will be
achieved by refurbishing existing equipment and buildings, and

by installing more efficient processes when expansion or
replacement are required" (Leach et al, 1979).
The model relates the expansion of each industrial sector,
which is a function of the assumptions about the growth in GDP,
the share of GDP provided by Total Industrial Production (TIP),
and the changing proportion of TIP provided by each industrial
sector, to the postulated declining energy intensity of output.
A more recent model similar to Leach's is Olivier (1983). This
uses the same "bottom-up" methodology and in areas is more
detailed than Leach et al. The conclusions of this study are
used to advocate a greater use of solar energy in all sectors.
Not surprisingly, given the unconventional conclusions, there
have been several criticisms of Leach et al. These include
Littlechild and Vaidya (1982); Marshall (1980); Day et al
(1980); and ETSU (1982). Day and the ETSU Report conclude
that the rate of diffusion of energy saving techniques implicit
in Leach are optimistic.
Marshall, from an economic viewpoint, points out that a method-
ology used, in which a large number of uncertainties are
multiplied together, must lead to uncertain answers. Leach
however only gives single-figure estimates with no sensitivity
testing of the assumptions made. Government intervention is
an implicit assumption built into the Leach projections but
there is no indication of how much lower demand will be through
the interplay of market forecasts. Leach and his colleagues
"see their 'forecasts' as something that must be made to happen,
assuming that, with encouragement and sanctions, current best
practice in terms of energy saving technologies could be
universally adopted". (Marshall, 1980). No attempt is made
to estimate the costs, private or social, of the required
investments or government intervention. Marshall concludes
the report is optimistic.

Littlechild and Vaidya (1982) compare the High GDP growth case
in Leach with the Birmingham Energy Model (BEM) Base Case which
has similar GDP growth assumptions. Comparisons of energy
consumption projections between these two show wide divergence.
Total energy consumption in the Industrial Sector (excluding
Iron and Steel) in Leach rises at almost 1% per annum up to 2000,
but then levels off, presumably as conservation takes effect.
In the BEM Base Case total energy consumption in this Sector
grows at about 1.5% per annum throughout the period 1980 - 2025.
There are also large differences in fuel mix.
These differences also occur in the other sectors, leading to
large differences in total projected demands for the four major
fuels. By the end of the period, coal, oil, gas and electricity
consumption in Leach's model are respectively 56%, 72%, 44% and
31% of the consumption in the BEM Base Case.
Littlechild and Vaidya summarise the criticisms of Leach as
follows:
There is no discussion of how far individuals are expected to respond of their own accord and how far they are to be influenced by government policy.
There is no mention of the exact nature of the government measures considered necessary. The report claims the measures are cost-effective but no details or evidence are given. There is no discussion of how far market forces alone will yield the envisaged level of conservation.
It is arguable that energy is income-elastic.
It may be more difficult to eradicate energy using habits than the authors envisage.
2.2 A personal criticism of Leach
The reduction in energy per unit of output in the industrial sector hypothesised by Leach is 32% by 2000 (ETSU, 1982). This is similar to figures for technical potential, without regard to commercial
constraints, given in Beijdorff (1979) and the Energy Audits Series.

Leach, both in his book and in personal communication, comments
on the similarity of these results and implies this is supporting
evidence for his hypothesis. A look at Leach's references shows
that several of his experts are the authors of the Energy Audit
Series. The ETSU (1982) Report also concludes that Leach is
equivalent to the Energy Audits. This similarity implies that
Leach's scenario involves the measures outlined in the Energy
Audits becoming both economic and fully exploited.
A crucial point is Leach's use of the phrase "existing technology".
He appears to assume that because a technology exists in one
application it can easily be used in others. As Rosenberg (1976)
points out, technology is very specific and there are considerable
difficulties in transferring technologies between applications.
For most types of energy conservation equipment, economic viability is determined by site-specific factors, therefore economic viability in one site does not guarantee viability in another, even within the
same application.
From a "macro" point of view, such as that of Littlechild and Vaidya,
Leach contains "a great deal of detail". From a "micro" point of
view, however, there is insufficient detail and the report contains
several generalities that are misleading.
For example, much is made of the potential for-waste process heat
recovery, particularly for space heating. This is undoubtedly
possible and has been carried out in several applications, but there
are many site specific constraints. Firsty, there are problems of
geography, sources of process heat are often a long way from the
potential demand and the transmission of heat, usually as warm air,
requires expensive ducting and involves high losses (see Dryden, 1982,
for costs). Another constraint, of which there are two dimensions,
is time. Often the heat is not produced when it is needed or it
has variations in quantity and/or quality that make its use for
regular, reliable, space heating unacceptable. Capital costs are
also increased by the need to retain a standby heating system in
case of a production stoppage. Space heating demand is seasonal
which means in summer heat has to be dumped, involving extra
ducting, dampers and a control mechanism. Leach's assertion that

"with such an installation the need for other space heating can
often be eliminated completely" looks distinctly optimistic.
Leach also states in a tautology that "heat recovery systems can be used wherever there is usable waste heat and somewhere to use it". The implication being this is nearly everywhere. Technically this may be true and several studies have shown the
immense size of the waste heat resources (e. g. Laws, 1981).
Costs however are such that few schemes are viable. Addy (1983)
reports that his company examined and assessed 247 possible heat
recovery applications, all cases where either the user or his
consultants had considered that there was real potential for heat
recovery. In only 43 cases was a realistic solution possible,
and of these 43, only 11 would truly have a payback better than
the two years commonly demanded for retro-fit measures.
Missions (1981) and Brookes and Reay (1982) stress that industrial
heat recovery systems are very site specific, making Leach's
generalisation misleading.
Leach also mentions flat plate solar collectors and is obviously
in favour of increasing the use of solar energy. In his model
however he has made no quantification of the potential for solar
"because it is recognised that it is unlikely to be economic
until the turn of the century". He does claim that "the large
roof areas of factory buildings would provide suitable locations
for solar collectors". Here again several vital constraints are
ignored, namely space, direction and angle of roofs, existence of
large areas of skylights, and inability of roofs to take wind loads
on solar collectors. The impression given by Leach is that every
factory roof can be fitted with a solar collector. Devonold (1982)
in investigating the potential for solar energy in the textile
industry (considered by a Metra study for ETSU in 1977 to have most
potential), concludes that conservation measures are currently
likely to be ten times more cost effective than solar water heating
(SWH). Devonold also comments that SWH may only be feasible, if
at all, in new single storey buildings on new industrial sites in
which all aspects of energy supply, heat recovery, storage and
recycling could be integrated.

Leach correctly states that "investment in energy saving tends
to be low on the list of industrialists' priorities". He
continues, "the payback period for many measures such as fixing
steam leaks by maintenance staff, who are being paid in any
case, or fixing broken skylights, is virtually instantaneous".
This ignores the opportunity costs represented by what else the
maintenance staff could be doing. It also ignores the tight
constraints often acting on maintenance staff. It also fails
to recognise the very real physical difficulties of apparently
minor repairs, such as fixing steam leaks or skylights. Often
these occur in hard-to-get-at places and repairs involve more
time and effort, i. e. cost, than the savings are worth (Jacques,
1981). Often minor repairs cannot be carried out while
production is in operation which means they have to wait for
planned shutdowns or opportunistic maintenance. A tour of most
factories will reveal several minor faults that Leach no doubt
would say should be repaired immediately to save energy. For
many of these however, it is rational for management to leave
them indefinitely or at least until an opportunity for repair
presents itself.
2.3 Research Objectives and Methodology
The approach used in this research has been at the micro-level.
Few if any other studies have been made of the potential for
energy conservation at this level. It is also distinctive in
that it looks at both the potential for change and the processes
through which change comes about.
Early consideration of the title, "The potential for energy
conserving capital equipment in UK industries", suggested a hard
estimate of the potential was required. As the work progressed
it became obvious that potential, when used in anything other
than its physical science meaning, is a "soft" concept. This
problem over defining what is meant by potential, is crucial in
determining the feasibility of low energy scenarios yet is not
addressed in the literature. Leach et al make no attempt to
differentiate the different types of potential that will be
explored in a later section.

Consideration of any potential raises the question "how can that
potential be achieved? " This appears to be more important than
some arbitrarily defined potential which is continually being
altered by technical and economic developments. Understanding
the mechanisms by which potential is realised would seem to be
more useful to decision makers at both corporate and national
levels than arbitrary estimates of potential.
This thesis is concerned with both the potential and the
mechanisms of change by which that potential might be exploited.
As such it deals with technology, economics and management. The generalised process of change, to be described in more
detail in a later section, involves technological possibilities
becoming economic opportunities as prices and technology change.
These opportunities then have to be exploited. This process
is shown in Figure 2.1
Figure 2.1 THE GENERALISED PROCESS OF CHANGE
Technological and economic
changes 14
Action by
agents of change
This process is directly analogous to the situation with mineral
resources whereby technological and economic changes turn resources into reserves. Action by economic agents can exploit these reserves.
As Eden (198 ) comments, estimates of the resource and reserve base
of energy conservation vary as greatly as those for fossil fuels.
Leach's whole thesis stresses "existing" technologies, most of which
he claims are already "economic" at today's energy prices. This
thesis is concerned with testing this assertion. Technological and
economic disciplines have been used to assess the extent of economic
opportunities while management disciplines have been used to examine
the actions of agents of change. (This has included consideration
of those factors conducive to energy saving technological change).

2.4 Selecting the Sectors for Study
It soon became clear that only a few industrial sectors could be
studied within the constraints of a PhD timetable. The criteria
for choosing sectors were:
that a potential for energy conservation should be documented.
a variety of company size should exist so that any differences
in approach to the energy problem due to size differences could
be investigated
that there should have been reported energy conservation
activity in the sectors, promising a range of investment levels.
similarity of technology to allow the possibility of inter-
sector diffusion of energy saving techniques.
An analysis of energy conservation investments-reported in the
Department of Energy's newspaper "Energy Management" over the
year October 1981 to October 1982 (see Appendix 1) showed that
the Food, Drink and Tobacco industry accounted for 20 out of 100
investments. This was the most commonly occurring industry,
suggesting considerable energy conservation activity relative to
other industries. Five of the reported investments were in the
brewing sector.
Initial contacts in the brewing sector were productive and it was
decided to concentrate on this sector. The industry is known
for its openness and technical cooperation and in this respect
the industry, with a few exceptions, has lived up to its
reputation in its assistance with this project. Some closed doors,
however, were encountered. On further analysis it often turned out
that the most open companies were the most progressive, a conclusion
similar to that of Carter and Williams (1959) and Baker (1983) in
their innovation adoption research.
As the brewing sector appeared to have been particularly active in
energy conservation it was decided to investigate other sectors,
these were malting, dairies and distilling. Together the four
sectors form a major part of Standard Industrial Classification

Order III, Food, Drink and Tobacco. Three of the four, brewing,
distilling and dairies have similar underlying technologies.
They all involve low temperature (i. e. less than 150°C), heating,
cooling and batch operations. This offered the possibility of
observing inter-sector transfer of energy saving techniques.
All four sectors contain a variety of company size as well as
independent and group companies.
The technical possibilities for energy conservation in three of
the four sectors, brewing, malting and dairies, are well
documented in the Energy Audit Series (Harris, 1978,1979 and
1981). The brewing industry is also well documented through
the Brewers' Society energy surveys (see Gordon, 1981).
The malting industry is recognised as having made considerable
energy savings through heat recovery (Harris, 1981). Study of
the technical, economic and managerial reasons behind this rapid
diffusion of an energy saving technique could be expected to be
useful.
The four sectors studied are relatively small in terms of their
total primary fuel equivalent energy consumptions, which are
shown in Table 2.1.
Table 2.1 TOTAL PRIMARY FUEL EQUIVALENT ENERGY CONSUMPTION OF THE FOUR SECTORS IN 1976
SECTOR
Brewing Malting Distilling Dairies
Total primary fuel equivalent energy consumptions
MGJ 26.5 9.8 30 28
m. t. c. e. * 1 0.323 1.1 1.06
* million tonnes coal equivalent.
Sources: Harris, 1978,1979,1981; Malkin, 1982.

Figure 2.2 PARETO DIAGRAM SHOWING THE FUEL PURCHASES (IN PRIMARY ENERGY TERMS) OF THE BREWING INDUSTRY RELATIVE TO OTHER SECTORS (OUTSIDE IRON AND STEEL AND HEAVY CHEMICALS)
160 53%
140
0 ý .,.,
too
47°/
ý ý ý1
Q f
O 2 2
-90t º coo 40 f
20 t
s 2
ý .ý ý ýo
1
to 20 50 40 50 60 70 so go ico 110 120
Sectors arranged in decreasing order of energy consumption.
Source: Harris (1979)

Together the four sectors account for approximately one-third
of the total primary fuel equivalent energy used in the Food,
Drink and Tobacco industry in 1976. Although only about 1%
of total UK primary energy demand, the real importance of these
small sectors in energy terms is highlighted by Figure 1.2
47% of industrial energy uses outside iron and steel and heavy
chemicals is in industries similar in size to or smaller than
brewing. If a high level of savings is to be achieved overall
in industry, then a reasonable number of these sectors must
achieve savings of a high proportion of current use.
Two interesting footnotes illustrate that the study of the brewing
industry in connection with energy conservation has a long history.
Firstly, Joule's discovery of the fundamental law that energy is
always conserved was made after early experiments in his father's
brewery. For a description see Crowther, 1935. Secondly,
Sir Oliver Lyle's classic work "Efficient Use of Steam" (1946)
chose a brewery to demonstrate the calculation of heat balances.
Opening with the statement "The input of a brewery. is cold water.
The output is cold beer", he then proceeded to examine why it is
that a product which is as cold when it comes out of the brewery,
as the water of which it is largely composed was when it went in,
needs more energy than just the "necessary push to start things
off".
In 1976 66% of all energy used in industry was used for process
heat, a total of 1493 Petajoules. Therefore a major area for
conservation could be recovery and reuse of process heat, an
assumption backed up by an examination of the Energy Audits
series. In these, heat recovery is reported as technically
feasible in 11 out of the 16 industries surveyed. Heat recovery
has a particularly large technical potential in the four sectors,
brewing, malting, distilling, and dairies. Consequently it was
decided to concentrate on heat recovery technologies in the
modelling of profitability. This was extended to include
combined heat and power or co-generation.

In the firm approach, each firm's total effort was of interest and
any technology they had used, or considered, was of interest, not
only heat recovery or combined heat and power. Despite this
general restriction on the techniques under consideration, it was
decided in the section on energy saving within the individual
firms that such a restriction was inappropriate. Hence each
firm's total effort was examined.
2.5 Refined Objectives
The refined objectives of the research have been to:
1. Study the potential for energy conservation equipment
within the brewing, malting, distilling and dairy
sectors.
2. Investigate the extent of adoption of energy saving
technologies since 1976 and the results in energy
saving achieved in these sectors.
3. Investigate barriers, both managerial and techno-
economic, to adoption of energy saving technologies
within the four sectors; and
4. To use the information to comment on the viability of low
energy scenarios within these sectors.

2.6 Data Collection
Within the general strategy described above two approaches have
been used; modelling the profitability of possible investments
open to firms in the four sectors, and examining the extent of
adoption of technologies and the processes of change within
individual firms. The former is primarily technology focused
while the latter is focused on managerial issues.
The modelling of profitability for heat pumps and combined heat
and power is described fully in Section 3 (and in the
case of heat pumps in Fawkes and Jacques, 1984). Such modelling
is necessarily somewhat general but wherever possible real
examples and real prices have been used. Sensitivity analysis
has been carried out to identify the important factors in each
case. Data has been obtained from potential and actual
investors, suppliers of equipment and the energy conservation
trade press.
Data for the firm approach has been obtained by a combination of
techniques. Interviews were chosen as the primary technique as
they offered a suitable depth of information. A postal survey
was carried out within the brewing sector so as to increase the
sample size. Also in the brewing sector, two companies were
visited over an extended period, eighteen months in one case, to
monitor a changing situation and to construct case studies. In
one case the researcher was able to assist the company in project
selection. Thus data collection within the four sectors was at
three levels.
In all, data was collected from 1b0 sites run by 66 companies
within the four sectors. Additional to this, 44 suppliers of
equipment and services were contacted to find their perspective
and obtain details on existing equipment and services as well as

new developments. Three government bodies and five trade
associations were also contacted. Table 2.2 shows the numbers
contacted in each of the four sectors. A list of organisations
contacted is shown in Appendix 27.
Table 2.2 NUMBER OF SITES DATA COLLECTED FOR IN EACH SECTOR
SECTOR
Technique Brewing Malting Dairy Distilling Totals
Interview 14 7 12 32 65
Survey 35 - - - 35
TOTAL 49 7 12 32 100
Initial interviews were conducted in several sectors as well as
the four finally chosen to explore the issues involved in the
problem and to gauge the likely reaction to this type of data
collection.
After five initial interviews in the brewing sector, it was
decided to increase the sample size in this particular sector
through a postal survey. A pilot questionnaire
was constructed and sent to ten brewing sites. Three replies
were received from this source. A copy of the pilot was also
sent to the Brewers Society for comment and possible endorsement.
The Society took it upon itself to distribute copies of the pilot
to 56 members of its Energy Working Party which would have been a
good sample, covering as it does all types of sites. Only two
replies however were received from this source despite a written follow-up from the Society. Several members of the Energy
Working Party subsequently completed a final version. After
modification the final questionnaire (see Appendix 28) was
administered to 90 sites.
While the questionnaire was being administered, and after, the
programme of interviews was continued. In the light of earlier
interviews and returned questionnaires later interviews often
explored additional issues.
Data from the interviews and the more detailed cases fed directly
back into the profitability modelling of selected technologies.

2.7 Summary
The general objective of the research has been to test the feasibility
of low energy scenarios, particularly Leach et al (1979). The latter
has been briefly reviewed and several criticisms of it presented.
Consideration of the thesis title led to the conclusion that a hard
estimate of potentials for energy conservation-was not possible and
that an understanding of mechanisms of change was at least as important
as any arbitrary estimate of potentials. Therefore the thesis will
discuss both estimates of potential for change and the processes by
which potentials can be exploited. The two are inter-linked.
Two strategies were used in the research, one examining the energy
conservation activities of individual firms and one examining the
profitability of various energy conservation techniques. On practical
grounds it was decided to confine the study to a few industrial sectors
and four were chosen: brewing, malting, distilling and dairies. Most
attention has been paid to brewing. Originally it was decided to
concentrate on heat recovery techniques only but within the firm
approach it was essential to study the companies' total energy manage-
ment programme. Any restriction on the techniques would have been
arbitrary and ignored an important aspect of the problem, the varying
and sometimes non-existent response of companies to rising energy costs.
Data collection within firms was on three levels, postal surveys,
interviews and multiple visits over extended periods. Data from
interviews often fed back into the more general profitability modelling
of specific techniques. A wide ranging approach to data collection
was necessary to illuminate different areas of the problem and the
relationships between them.
The refined objectives of the research have been to:
1. Study the potential for energy conservation equipment within the
brewing, malting, distilling and dairy sectors.
2. Investigate the extent of adoption of energy saving technologies
since 1976 and the results in energy saving achieved in these
sectors.
3. Investigate barriers, both managerial and techno-economic, to
adoption of energy saving technologies within the four sectors;
and
4. To use the information to comment on the viability of low energy
scenarios within these sectors.

Section One
ACHIEVEMENTS TO DATE

SECTION ONE
ACHIEVEMENTS TO DATE IN THE FOUR SECTORS
Introduction
The following section examines the extent and type of energy
saving investments within the sampled companies in the four
sectors. It addresses the question "what energy conservation
activity has already occurred? " The results and discussions
are in three sections. Firstly, the reductions in specific
energy, i. e. energy per unit of output achieved over the last
two to five years, are reviewed. Reduction in specific energy
is the end result of energy conservation of most interest to
the low energy strategists. Leach's (1979) model is based on
a systematic, regular reduction in specific energy in all
sectors.
Leach's model is based on 1976 data but most companies sampled
did not have data on specific energy from that year, indeed many
companies did not even have it for the last five years. In
most cases only data referring to the last two years was available.
This difficulty reflects the problems in collecting specific energy
data (to be discussed further in Chapter 7), and that many
companies have only developed energy management activities within
the last five years.
Secondly, the energy saving techniques used are examined to
answer the question "what techniques have been used? " The
techniques are divided into retro-fit and new plant investment,
and innovations or adaptations of existing equipment. The latter
division is necessary to test Leach's assertion that the energy
savings he assumes can be brought about by the use of existing
techniques, presumably meaning already innovated techniques.
Thirdly, the observed characteristics of energy management systems
are reviewed. In the case of the brewing sector these results
are used to test hypotheses about the utility of energy manage-
ment techniques such as monitoring and targetting. Such
techniques are often advanced as being effective, but have rarely
if ever, been tested systematically.

Results for each sector are given in turn, followed by a
discussion of that sector. At the end comparisons between
the four sectors are made to highlight differences and
similarities.
Throughout the section, unadjusted reductions in specific energy figures are used as an indicator of performance. Chapter 7
discusses the shortcomings of this measure, both for on-site
and inter-site comparisons. Even in the light of these short-
comings, the absence of adjusted data in most companies has
made the use of unadjusted data necessary. In the three
sectors, brewing, malting and distilling, occupacity, a major
cause of variance in specific energy figures, has been low.
This suggests that the unadjusted reductions in specific energy
recorded may well be understating the true figure.

Chapter Three
ENERGY SAVING IN BREWERIES
3.1 Introduction
The recorded reductions in specific energy achieved, the
techniques used and the observed characteristics of energy manage-
ment systems in the brewing sector are now described. The
results are used to test hypotheses about the utility of energy
management techniques in bringing about a reduction in specific
energy.
These results are derived both from interviews and a postal
survey. The latter had several shortcomings as a means of data
collection. Firstly it did not refer to energy saving invest-
ments which were investigated for other purposes, i. e. investment
in new plant that produced energy savings but was not justified
on these savings alone. Secondly, replies were not always
complete. Thirdly, it ignored site specific factors. It was
impossible to tell whether a company was achieving its full
potential.
Breweries are split into three size ranges, 0- 299,000 hl/a
capacity; 300,000 - 1,000,000 hl/a capacity; and 1,000,000 +
hl/a capacity. This was to allow the testing of hypotheses
concerning company size and to illustrate any differences in
approach between companies in different capacity ranges.

3.2 Small Sites (0 - 299,000 hl/a)
3.2.1 Reported reductions in specific energy:
In a sample of 29 sites, six reported no investments in energy
conserving or cost reduction equipment and no reduction in
specific energy over the last five years. Of these, one was
evaluating Copper Vapour Heat Recovery at the time of the
survey. A further three sites had only invested in cost
saving measures, i. e. fuel switching or power factor correction.
Seven sites reported investments in energy conservation equip-
ment but did not report a figure for reduction in specific
energy, reporting "unknown" or nothing. Twelve sites reported
investments that had resulted in a reduction in specific energy
of between 2% and 25% over the last two years. Five sites
reported a reduction in specific energy of between 5% and 50%
over the last five years. The distribution of reported
reductions in specific energy is shown in Figure 2.1.
Table 3.1 shows the number of sites reporting savings for three
size ranges within the small brewery sub-sector.
A
3.2.2 Retro-fit versus investment in new plant:
of the nineteen sites making some investments, sixteen had made
retro-fit investments with no major investment in new plant
reported. Three sites, excluding the one with the new brewery,
had evaluated retro-fit possibilities and found them to be largely
uneconomic. The savings they had achieved, ranging from 10 - 25%
over two years, and up to 50% over five years, had come about through
incorporating energy saving features in new plant purchased for non-
energy reasons. Managerial aspects of this issue will be explored
fully in a later section.

Figure 3.1 DISTRIBUTION OF REPORTED REDUCTIONS IN SPECIFIC ENERGY - SMALL BREWERIES (0 - 299,000 hl/a)
No. of Sites
4J
3
7
6
5J
ý.
2ý
1411 . --. ý 9..... -.,
III-IºIºt U/º ºi 123456789 10... 21 22 23 24 25
Reported reduction in specific energy (%) over 2 years
ý

Table 3.1 NUMBER OF SITES REPORTING SAVINGS IN THE SMALL BREWERY SUB-SECTOR ACCORDING TO SIZE
No. with No. with No. with No. with no Size known savings unknown
cost saving savings, no Totals (000s hl/a) the last over measures
savings only investments
0- 99 8 6 2 4 20
100 - 199 1) 3 1 1 2` 7
200 - 299 1 - - - 1
Totals 12 7 3 6 28
NOTES: (1) This size range included a new brewery, not included here as savings figures are not relevant.
(2) Includes one site currently evaluating CVHR.

3.2.3 Innovation versus Adoption of existing equipment:
Only one site made an investment that could be regarded as an
innovation. It had worked in conjunction with an equipment
supplier to adapt a novel, indirect copper heating system.
This system had originally been developed for a pre-packaged
mine-brewery for use outsize the UK and had to be adapted to
fit the new application. All the other investments could be
regarded as straight-forward adaptations of existing, well-
tried methods; straight-forward that is except for the
necessary site-specific modifications.
3.2.4 The energy conservation techniques used:
Table 3.2 summarises the techniques used in this sub-sector.
Additional heat recovery from cooled wort, power factor
correction and high efficiency lighting were the most common'
investments.
3.3 Medium Breweries (300,000 to 1,000,000 hl/a)
3.3.1 Reported reductions in specific energy:
in a sample of eleven sites, ten reported a reduction in specific
energy over two years. All sites had invested in energy
conservation techniques and the reported reductions in specific
energy ranged from 2- 40% over two years and from 10 - 60% over five years. The distribution of reductions in specific energy
over the last two years is shown in Figure 3.2.
3.3.2 Retro-f it versus investment in new plant:
Most of the investments were in retro-fit measures rather than
in new process plant.

z H
w
(. ý
z
fs4 0
W 0
>4 U
z w ý o+ w x w ö ý z H Nd
N
M
a) -4 «1 H
ON C C "-i N
. 14 O CN
41 " ý
4J r-l N0 to U) 1J C) (13 0 --+1-1 --r a) U > Ö 4-) N C w b
-ý ) C 4 1-1 4J -+ 0 -4 r-l 41 11 0 "rI r. 4J UO "r( 1-I C) 11 N
ro 11 C) 4J 0 C> 0 to 4J i-º C) A 47 N N >( U 0 11 9 ro UO "-+ (a ro 1J N V. N rj U ý U r-1 U 1.1 r-i a) ro yJ 'd U) ON ON
4Jý O 0) ON 00C 3 1-1 a) -4 w 1-1 N O+ 1a roº+ U) ON U 1a "., U) UI l0 to ONNO C a) 4-J C) ý
ý r. )a ý °
CA -A r-4 3: C N 04 0M r. ý
4 ý; ' ö 0° ý' ö+ N( dä ý
d 101 U) Nw
14 G ýý ü
>ý ý ( ýWWNý p ý ý N > w W > ý ýN r-1
w Ö >w C3 9 " .+ ý
"rý - 4 U) tr r-l d U O -4 U) )-I
) O "r1
'd r1 6
0 C) S )ý U1 pp Q O Y-1
O O ý a) iJ
UI U1 a) C) x fl u 11 r-I C Uto
a 4 "1 a C + b ' I
Q UNAN ý x ý0 ý
ro o ý, .c .N a) a) 1 3 -4 "1 - a) ý ä U0 O 00 - +J o > )C 4 ) 3: C; 14 4J O+ > ý, ö 1 ö ýý l ö ä r . ýý öi ro
x 3 aaýaD vaa a j
rJO zazzw az O
N ý "ra 0 ;J -A r-1 O ,a 4-) 0w tyl U 0 Ö ýý
) C C1 01 14 S. 41 ý U 4-J N
1 ( a ) +J ÖÜ 0) 2 Ü 0 Id 14 ro U
'd g 0ý b
.ý C ) C N ý 41 A 0
ý G 3 äi u i i'1 O+ " rn
ýc i Cl)
En I "r, U 0 iJ >~ "rl ý' , 7r "rl id >~ 4) U L"
O)
, 'ýr +J a) r-i
U, "4 C) r-i -rl 0 r-I 1Y1+ C) 4J 14 (a 'Li : 11 ý1 ý w ro o C) O+ U)
l "rI W 3
41 N
w bý C) C) w >
a N w w 0 >C "r ý
N ýC
V) ý
W 4) )-1
U Ü 'dd' Ö 'ý I
O U C) )"1 a) ý S-1
O UO
ý ýýa Ö ý (t) ýý Uý ý d+ 3 x $4 M
0 0 14 0 3 a)
0 3 OD ÜW ga 4 W ýÖE
v) ý3
2D O
C tn 01 ri O U) r1 tn 4J ý 0
. a) c 0 4J 0 1 1 Q1 (3) U) B > O U 11 +J C . -1 0 ON Ö ý O
1.1 rä C iJ C) " 1 "1 0 ÖÜ N Uý
>4 In + Ö gtn ý
O In stn
UO r-I U w -, IJ 'd O+ C a) O a) :1 -"+ u- rn C) (a 11 0 "r-1 U U) Q1 )4 C U Ul ý Cl) I "ri a)
. 3("1 2 "rf .C C)n ro C sm O W- C rd C
A U .4 O {J U } (d ) "rl 4
j, ' r-1 ý
a1 "rl "rl 11 a) -r1 J J '
"r1 i1 -rl a) -rl S I + O -4 r-1 1U 1" r 1a o S-1 W1 4 -1 aI b r-1 a U) w C) A (1) (0 C) -r1 O a) a) ON +J cn (e (0 Cf O+ a
4-1 C > 41 .[3 O > $4 9C -rl U) 11 a) -r"I (d U) O, a) "rI 11
a) 0 U) U 1a a)
U in
0 r ) S4 O rr CC
a) ýJ r-l a) U) ý $4 14
C ra Cl a) U -4 +J - Uo "rI r-I b+ a rd a) 1 as a, ý ý a y rr C) O a 0
cný r"
v3 ý :1 a) 8r` icýx C) a) arI O
x , aý = z zz
co O+ U)
CD -4 1J +J ý U) 4-) 4 OD a) OD U ý
ý a )
Ü "ý Öt 0
41 ý ý
0 Ü wÖ w -1 ý (1 4J -C
O 0 'O O 8 r U C 4-1 'd ý %. 0 U C a) a) 14 0 v O+ >1 C) ro O+ C) U) 0UI. J U) U) C 0 a) 3ko C 11 co C(d aC "1+ I rI >, ýJ U UO >+ "rl ý1 -rl r-1 U) 0
A 1-1 14() "r, ý ra . ltr+J maU Cl) O a) ro w r+ a) A U O+ it r-{ O+ C) a) C Cl) 0 > 41 w 3C > (d () -rIOD C 11 r-I W "r1
U O a) U) -rI :1 0 ra , L' O U) "rl A U) r-1 U 11 r- I a) U ý A i-1 'd :1 td a) r-1 yJ a) a) .ý r"a r-I a) a) ýJ Ix N -l 0-r1 U
ý4 Q ý (D ý $4 a 11 '4 0 ý äý y i ý 3 a
- (D
wa4 a ä3 ý d1 1 i 0( a
zz az9a "" x a o
C rf N (+) C 111 1,0 I` O Ol O-( NM4 to 10 Iý O 01 O ra N
94 to lfl
9
m 1.4 r'+ -4 ^' "ý "ý "+ ^ý "- "-i N NN NNN NN

a ý U W ý I
ý ý
ca a W3 ý Wý aý aa az
ýä wý xo E., U
Z H
a]
La
Oi H
N
fö
ri a)
. -I
_a
sT2-401 ý ..
ý. " ., 0 0(V 000
600 > >>
190 > > >
EDI0
9Z I > >
6E0
OST
EVT
ZVT
800 > > >
66T > > >
LLO
EET
VIVO
T11
ZZO ý
60T
SOT >
951
60 T
SST
S DI0 > > >
W ý ý
a) 41 () f! ) Cr ö ý ý ö 0
N
ä '" ö v x ä z ü ö > w Q) W 4J -W r. 0 4 1+ ý
ý 1a ý till 0 Ü W
u C N x ý ý
ro Ö F H 4-3 . >r ý ý rd
to C tr+ ýt r0 0 Q) U A N trý N >4 (1) ! ý ýC
> ý ý
aý) ro b 4 ý F ý
w " 4"4 0 a N a) 3 8 d x ui
ý 9 - 0 .a ý
a) . 14 40 (a a) 1 ý r ti ý
a -r Q) 0 (13 o ro ýi rts o+ ý4 -4 +j a) W 4
a) " u (a t :3 0 t ,a sr . v ýý c a) ý m r
r u W
3 u )o . . a s i
(1) r + ro + a 1-+ d ý"ý tr a a 0 ý a ýýý Ný 4 . ý' Nä > u) ° (n ý - ö `4 m U) r-4
° ro m a i ý a i w ,Ä
ý H -4 044 -+ a) 04 u ý+ 0 ý4 -, a)v, b a a x rr u 'Cl b 3 a öv 'J ß'WÖ ýý o H >' ' a i F n
a ý uý u tý wm [
ö u wu ý ai ro ä
ý "° ý
x ý z ao w a

sa M
M
4) r-i A b H
sT2-4O1 r, o oý . -, . -4 0000
600
T90
£D0
9ZT
6E0
OST
£bT > >
ZbT >
800
66T > > >
LLO
££T
bfii0 > >.
TTT
ZZO
601
GOT
9ST
bO T
SST
SilO
q ýN
ý ýä sö H "-I b a) ý E-4 41 0 a) u
R f O .0 R! ý
x a) ý
v) ". 1 N 1H \ N ý
Q ý U 47 -1 O+ QI - Nc: N w o a) a a)b w9 oa a1 0 -+ () "r4 U H ý1 O ý4 -1 N.. "1 0 1-I
b x öý a ý ý ý ý ä äý ö 4 U) N U T7 +) 'ü 0 0+ 0ý z ý b ý C O Q) U"r1 U) w0 0 0 3
b (n Sa E 74 (o rz Q) 1-1 a -I-) N U N Q)
f-I a 0 0ý ßl '0 0 r. . -i N 0H b cn -+ w a +) 27 m a) >1 w 0 ý4 (1) -+ -4 N w 4 u10 a) Q) b+ Um 0 S. + 14 Q)
Z ý D ON N U ro N a) a, ý ý
a N ci, 3 0" "l+
Z H
Of H
Z " l
H 0
H rz
W 9 1-4 rl N a) N"ý N 6 [ a Z
r z7 ý EA ýF NAa i ((% ý a)
a w N a)
ý Q) ý4 O U
Q) W x0 ac 1-1 4-J U (1) ". 4 ý4 ". -1 0 U U ßr U -+ U "-j C: W 3k Q) 7-1 Jj 3 m 0ý4 6 3 3 (1)
aaa F ý c0ý 4 0ý 8 ýzä ý äý ü z zý

1 C1
., ý ý'1 U7
yý 14 O 7
fs. Z
I
P19 N ^ý
db
CD
Co ý
N
er
N
O M
Co N
1.
a
0
ýo N
qr N
N N
O N
m ý
. -ý
.ý
N .r
O r-1
f f
co
IV
y
ý
0
ý
ý
0)
0 ". 1 W ". 1
Ul
.ý
0 .ý U
'd Gl

3.3.3 Innovation versus adaption of existing techniques:
None of the investments could truly be labelled innovations in
the sense of first commercial application. One site, however,
was experimenting with a bio-gas producing effluent digestor.
To date this is producing gas successfully and after an
evaluation process the site is likely to invest in a full sized
plant. The bio-gas produced will either be used in boilers or
gas engines driving refrigeration compressors, currently driven
by electric motors. If the plant goes ahead this will be the
first application of this technique in the UK brewing industry.
An application in a dairy does exist (Plant and Works Engineering,
August 1984) and a similar system is being evaluated in a
distilling company (see Section 3). One site was evaluating a
relatively new technique, turbulators in boilers. This site had
multiple boilers and so experimentation in a single boiler was
possible. Another site was experimenting with a reduction in
boiling time, a process change rather than an investment. As
the product characteristics are dependent on many factors,
including possibly boiling time, this is a radical change that
many breweries have been reluctant to make. Many sites would
rule it out on quality grounds, whether or not scientific proof
of the effects of a change were available. For meaningful
comparison full scale production tests are necessary, and the
threat of possible lost production due to experimentation with
the process is a major disincentive. Brewing "recipes" have
some of the characteristics of paradigms.
One site invested in an integrated copper vapour heat recovery,
dearator, condensate return and economiser project. This
required the development of a sophisticated microprocessor-
based control system. The integration of disparate heat flows,
all with different qualities, quantities and timings, required
considerable development work. Even after commissioning, the
system required considerable tuning to make it run in the most
efficient manner.

3.3.4 The energy conservation techniques used:
Table 3.4 summarises the major techniques requiring capital
investment used by the sample of medium breweries. Low, or
zero cost operational changes are not shown.
3.4 Large Breweries (greater than 1,000,000 hl/a)
3.4.1 Reported reductions in specific energy:
In a sample of nine sites the reported reductions in specific
energy ranged from 2- 20% over the last two years, and from
6- 30% over the last five years (reported for six sites).
The distribution of reported reductions over two years is shown
in Figure 3.3.
3.4.2 Retro-fit versus investment in new plant:
The reported investments were predominantly from retro-fit
investments rather than investments in new plant. One site
had invested in a new brew-house which was fully integrated to
maximise heat recovery. This was not however justified on
energy grounds. The opportunity to include energy saving
features afforded by the decision to build a new brew-house was
not lost. Unfortunately such opportunities are not always
taken (see Section 3).
3.4.3 Innovation versus Adaption of existing equipment:
All the investments reported were adaptations of existing
techniques. One site seriously evaluated copper vapour heat
recovery (CVHR) using mechanical vapour recompression (MVR) but
rejected it on absolute capital cost grounds (see Section 3).
If this project had gone ahead it would have been a true
innovation.

b ýr ri 4) -1 A Eý
STL-401 d' t00 V' . '"r OInNcVN -"f O(N v -+0
090
ZL 0 ý' > > >
£00
690 ý > > > >
D190 > > >> > >
£60
001 > > >
610
910 > > >>
ti91 > > > >
0£0
8
ý &
1 A
H
Cr ý
Ü
>4
ý O m
a H x
4-1 w w dJ G) U
) ssý
0 a) Ü3 CO
41 Ü $1 ö AS 0ýN
aUi ý ro w
Ill ö ýýýý
0Nv -4 O> 4-) 10 äiävbW ý ýs+++ro °ý.
ý
ýv A. 144
"ý 41 Ö
oob ý Ný
3 Ei w
'""a O'-1 1, u Sý N"""1 12 Oto a) Sr rd 0 rd 4) O+ ý1 r-I Q) }J Cl 0U b+ 1~ ý9 -ý WOA Aý 10 In ONON Gº 9N N". 1
"rl 1.1 x"ý J"ý >, 1 ý G) 10ý 1.1 i. l \ 41 rd a)rd Uf :3 a) 4N0 -I O x", "+ Owwý "1 '"1 mba
ýs c`ý ý4 Ü..
41 04 4-4W
o°a w ýý
Cl)
«
m
w Ei
w F'
1 W a
ý
m°
8 Oý
äÄ 4-J gý bý N 1-i b'
Ü-"-'q . -a GI i4 41 b+ rd
r-4 b 4J "'"i On C: "a 93 rd O 0da Ný"ý A 4) +J
xýbeý r1 NrI
z mý xg äý

rr M
d)
S TV'4OS, N Ln cV N Oý co CDO .ý .+ .ý
ZSO
ZLO » » >' > > >>
£00
6S0 >> >> >
Ti90 > >'
£60 OOT
6T0
9T0
Ti9T
0£0
tr 4J aacn tr "ý Ok t~ baO
"'4 'C) 0) 4) E-4 4j 4) u0
W a) t: "'4 N ri \ a) x ý ý a ý ý N a ib a c iä, . - +tr a w W Oa) o WE O >. 0 r-+ U .4U H S"I OO º"t N "a O -- ý4
ä 4J co 1 öýö "' ý ý ýý ý ä -4 v) HN U W U'ty 4J 'O
) 0 tT
" l O rl OW ý
0 Z Ö E+
00a ý O a
r U H
En k0 0 U O
t
ý
W
1 Q 0 1 U) J '
'Ly a) ý
8 Ö Ä"'ý
N H Ný H ý
a) 0
o Q W a 01 a)
4 a) ti U T) v RS N a)
r a) tr f14 S"I
ý 0 UM
q
4 0 $4 -1 a) N 04 3 R
! 0 w M ' a HÖ ö ä ä nÄ q ý ä öäi w '" °'
m 0 aC
ö äm ro i "ý sý -4
ö Ü ý Äa
: a 0 O ä1 8> Eä E äý t°ýZZý E ME-1 rm c )
ý ý ý
ý ý E 0 CJ

rd 1ý M ai -4 A
STs-4O1 ý No ý 0 0. -+0oýr 0n')0 . -+
Z90 > > >4 ý
G00
S00
99T M ý > >
SET
TST
T£0 N
9E T
990 a
W 0 N
4J N
ý W b' Cl)
ý ýi
O3 > Ö u t
~ °t ö w sr a) ä 9 0 d) ro Ü
41 [ý 8
ý 4J 4-4 41 ö ro ý
E-4 E-4 ý 4ý b Oý Ü
im Q) tr a a) a) ý ý $4 +J 10 c a)
a 4 (v "ý [ý D 4 a
4 a) . a! b ý EH ý
ý 4
tr N W ý 0 äi ý+ýö a) s
1 ý+ 0 -94 -4 (1) o H ra . -a ö 0 (t) (1)
Ü ä, ý ts . w r-"I a) aJ r a) ý ýý ýý
O o tr a; ý > -- a) 0 +j A+) to N ,ý " i : 1 o "14 a
0 a
a) O +J ad-4 +J ý4
74 a) r~ N 4.1 a) S-I
N O
ý a a , r~ 0 a, aN
1 c
-4 "ý+ 4-) P \4. ) rd a) D M (n p a) ,9 4N O 0
0 O a .Q ý
v t ý 4-J ý ri b 0k "rl b a a) aU
-- k 1 ý . -1 r- w" a A a 0 H . o r a) ý ab a)
(ý N ,ý a + . ( a 0 0 . ` E-4 4 6Q V ý wro w t ) tý S zý w ý äý
.
I Z ý ý ä 0 U

A U, ý w
ý A Ero
Sj124 01 d'"'' t` "+ý' 00 01 OOO. "+O-
Z90
L00 > >>
S00 >>>
991 » >> >
SET
IST >>>
TEO
9E T >>
990 > >> >
4-J C9 tT "r"I N >"1
E 4J ° ý y W sý4 ö. 0 0 ý a)
gg aj
w a) 4 (! ý "r4 N ri ý N ä tr öä, a N w oa) a (D (a ý10 oa >, o + U ýU H )d O i4 r"1 N"r"I 0 -- l1
ý ý aýx ý ° ' m
ä öýö ýb ý N ýN U v Ü"ý Uý tn
ýÖ Ö Ö3
p Nw E+ Q
w9w 't3 -4 ýö p "ý " ýý
-4 z m "ä w ý
a) bN m>1 W 0 w 1 a) "-4 ra o W ý U R7 a) a) tT U co 0 )"1 r-4 a)
ý c7 D tT N U co N a) : id Y1 ý
R N p, 3 tr
i z Ot ý 1-1
" i0 H w r-a N a) r. 4 ýNA N r-1
N ) N
a) E3 tT O a) W "r H H r ý G
ý a' ý R
S U xo x roý ( J 'iýi4äö a ý o 0 W x a) ý4 ý S ., 0 4
Ö Ö > ý
H ýý NNN
E"+ m F mU w a aýOý ir aý U ZZm
a 0 ., 4
b ý N
0 U
)-I (1)
N ý
a) 8 a) 0
mW O
"ý N tr+ 0 sý a aLn
rn ý4 w b a) -4 ý b4J
0N 41 a V) H
. -ý N ý`'1 'ý'
N N ý 0 z

ý ý >4 N
a ý 0 >" cý a w ýi U F9
w UN W Cr
m z H
n aý
fli ., 4
14 En w
s+ o
.ýö wz
C+1 N . -i
r
O ý .r
CD ý
ý . -ý
. -ý
t! 1 .r
. -r
fr1 .r
r4 ý
ý .r
O ý
o+
co
ýr
ý
Ln
IT M
N
-4
dP
U) }4
4)
N
11 4)
O
ý tr+
4)
4)
U "r1 W -4 U 4)
a
. ý, 0 .ý u V 4)

3.4.4 The energy conservation techniques used:
The major techniques used are shown in Table 3.5. Low, or
zero cost operational changes are not shown.
3.5 Discussion and Summary
3.5.1 Reduction in specific energy achieved:
In each size category there was a wide range of reported
reductions in specific energy over both two and five years.
In the small brewery sub-sector 19 sites had made some energy
saving investments but only 12 reported a reduction in specific
energy over the last two years. This probably reflects the
absence of an energy management information system. The small
sites that were interviewed, 4 in all, did not produce specific
energy figures. In the larger brewery sub-sectors 19 out of
20 sites reported a reduction in specific energy, indicating
the existence of information systems incorporating specific
energy figures.
The wide range of reductions in specific energy achieved could,
as we will discuss in Section 2, be due to differences in
opportunities as well as differences in management effectiveness.
The ranges reported in the three sectors are broadly similar,
2- 25% in the small sub-sector; 2- 40% in the medium sub-
sector (2 - 28% excluding the 40% figure) and 2- 20% in the
large sub-sector (all over the last two years). The corres-
ponding figures for the reported reductions over the last five
years are 5- 50%, 10 - 60% and 6- 30%. No one sector
achieved noticeably higher results although as has already been
noted, more firms in the small sub-sector did not report a figure
or reported zero reduction.
Only 16 sites reported a reduction in specific energy over the
last five years. This probably reflects the absence of inform-
ation and the development of energy management over the period.

Most sites interviewed had made some energy saving investments
prior to 1979 but did not have energy management information
systems. Two large brewery groups had started their energy
"campaigns" in 1979, after the second oil crisis.
3.5.2 Investment criteria:
Of the 15 sites interviewed, 12 had broadly similar investment
criteria. In 11 cases the criteria for cost saving projects
was a two-year simple pre-tax payback. In one case a three-
year simple pre-tax payback was acceptable. One small site
had no explicit criteria and projects with very short paybacks
had been rejected while some projects with longer paybacks had
been accepted with no apparent reason. Two other small sites
did not have set criteria because they felt they could not
afford retro-fitted, cost saving measures. Any energy saving
in these cases would have to come about through investment in
new plant as part of the normal capital replacement cycle.
3.5.3 Retro-fitting versus Investment in new equipment:
As described above, most of the energy saving investments
encountered were retro-fitted to existing plant. Where invest-
ment in new plant, justified on non-energy grounds, was made and
energy saving features incorporated, the resulting reductions in
specific energy were significant. Incorporation of energy
saving features into new plant were observed in all three size
categories, as was failure to do so.
The design of the questionnaire will have missed investments in
new plant as it concentrated on techniques designed solely for
energy conservation rather than investments resulting in energy
savings. Differentiation of the savings resulting from retro- fit and new equipment would require an in-depth study of individual plants and has not been attempted here.

The'purchasing of major capital equipment such as new keg
washing lines is a slow, group decision making process. Such
decisions are relatively infrequent and have a lasting effect on
energy efficiency. The problems of integrating energy saving
features caused by organisational design and other factors will
be discussed in Chapter 13 using examples from interviewed
companies. A single shot interview can only capture one moment
in the decision process and the history of that process from one
viewpoint. Further research into this area may profitably use
the "snowballing "technique in which different actors in the
process are interviewed to form a composite view
The energy savings achieved by investment in new plant suggest
that in the long run, larger savings will result from new plant investments than through retro-fitting. This is particularly
true in the small brewery sub-sector where plant is often very old
and finances are not available for retro-fit measures. Three
small breweries reduced their specific energy by between 25 - 50%
over the last 5 years by incorporating energy saving features into
new plant. The fact that this potential exists does not
necessarily mean it will be exploited, as shown by the examples in
Section 3.
3.5.4 Innovation versus Adaption of existing equipment:
The majority of investments in all sub-sectors were adaptations
6f existing equipment rather than true innovations. This
supports the views of Johnson (1976) and Fores (1977) that most
technical change is incremental in nature. As will be discussed
in Chapter , most of the literature has been concerned with large
scale, technically spectacular innovations whereas there is
substantial evidence to suggest that incremental technical change
is economically more important.
Innovations have occurred, or been seriously considered but rejected
on economic grounds, in all three sub-sectors. No conclusions about
differing propensities to innovate between the sub-sectors can be
made. It can only be said that innovation in the small brewery sub-
sector shows that the capacity to innovate is not confined to large
firms.
1. See Moriaty and Bateson, 1982.

Several examples of firms experimenting by applying techniques
to a proportion of their capacity have been found. Examples
include keg washing line heat recovery, an 02 trim system
installed on one of three boilers, bio-gas effluent digestor,
and insulation spheres for one of four hot liquor tanks.
Rogers (1962) and Baker (1983) state that the extent to which
a new product can be tried out before making a full commitment
is a major factor influencing attitudes towards it. The
evidence of this survey supports these views. The examples
found, with the exception of the bio-gas effluent digestor,
and the keg washing line heat recovery had been applied in
other applications, but were both relatively new to the market
(introduced within the last five years) and novel to the company
making. the investment.
Experimentation reduces uncertainties over the actual savings
that can be achieved and hence contributes to the ultimate
adoption/rejection decision. It should be noted that in many
cases, experimentation is not possible as energy saving techniques
have to be applied to the whole of the production capacity.
3.5.5 The energy conservation techniques used:
Overall, the three most frequently used techniques were in order,
high efficiency lighting, wort cooling heat recovery, and power
factor correction (a cost saving rather than an energy saving
measure). These occurred 28,26 and 24 times respectively in
the sample of 49 sites, while the next most frequent technique,
keg line heat recovery, was only reported 12 times.
The overall three most frequently used techniques were also the
three most frequently used (in different orders) in both the
small and large brewery sub-sectors. High efficiency lighting
and power factor correction were in the top three in the medium
sub-sector while wort cooling heat recovery was equal fifth.
These similarities suggest these techniques may have character-
istics that make them more likely to be adopted than some other
techniques.

High efficiency lighting comes in many forms, each with
different applications. Most of the lighting investments
found in this research were replacements of fluorescent tubes
in high-bay factory areas by high pressure mercury or sodium
lamps. Such investments often give payback periods of two
years or less, and the financial justification for one
example is shown in Chapter 12.
Conversion to high efficiency lighting can be phased, an area
at a time, thus reducing absolute capital outlay. The actual
work can be carried out quickly with little or no disruption
to production and the site specific adaptation costs are low
compared to the overall cost. Another point in its favour is
that savings can easily and reliably be calculated. This is
in contrast to heat recovery projects where savings figures
often have a high degree of uncertainty, both before and after
the investment.
Additional wort cooling heat recovery consists in most cases of
simply adding additional plates to an already existing plate
heat exchanger. As the frames of these exchangers are designed
to take additional plates down time and adaptation costs are
minimal. The technique is simply an extension (literally) of
existing hardware. In one case discovered, it was not viable
because of insufficient space for extra tankage, needed to take
the extra volume of pre-heated liquor.
Power factor correction is a well proven technique that is easily
applied to existing hardware. The savings available are easily
proven and the overall capital cost is low, usually of the order
of £1,000 - £5,000. As electrical loads change, the power factor
varies and it should be checked after any addition or removal of
electricity consuming plant. Thus, power factor correction could
be a regular investment.
Less techniques were used in the small sub-sector than the larger
sub-sectors. This may reflect fewer opportunities or less
ability or willingness to use different techniques. No oxygen
trim systems had been used in the small sub-sector. This is

despite the fact that oxygen trim systems are applicable to most
sizes of industrial boiler. As these are a relatively new
technique it may reflect that small sites are slower to adopt
innovations. Space heating controls are also absent in the
smaller sub-sector. Small sites spend less on space heating
and controls may not be viable. On the other hand, there is
probably less knowledge about controls, a technology that is
rapidly advancing as microelectronics are replacing electro-
mechanical devices.
The absence of economisers in the small sub-sector can be
explained because they can only be viably applied to boilers
above a certain size. Furthermore, specific site constraints,
notably physical space, are often tighter in smaller sites.
Maximum demand controls may be less viable in smaller sites
because there are less loads than can be shed without affecting
production.
Eight sites had invested in some form of copper vapour heat
recovery (CVHR) since 1974, while two had installed systems
prior to 1974. One site had evaluated a novel CVHR system
using mechanical vapour recompression (MVR) that would have
been a true innovation. It was however, rejected because of
capital shortage. One of the most recent (1983) CVBR installations
was part of a Demonstration Project.
Although CVHR has been widely used in the industry it still suffers
from a number of technical problems, notably fouling of heat
exchangers by hop oils. Another factor inhibiting the further
use of CVHR is that, without the use of MVR, the product is hot
water and not steam. In sites with an established energy
conservation programme, demand for additional hot water is likely
to be limited. The site with the Demonstration Project CVHR
invested without knowing what the water would be used for.
The approach advocated by all heat recovery system designers
(Addy, 1983; Brookes and Reay, 1982; Missions, 1981) is to find
a use for the recovered heat first. If no use can be found the
investment will have been wasted.
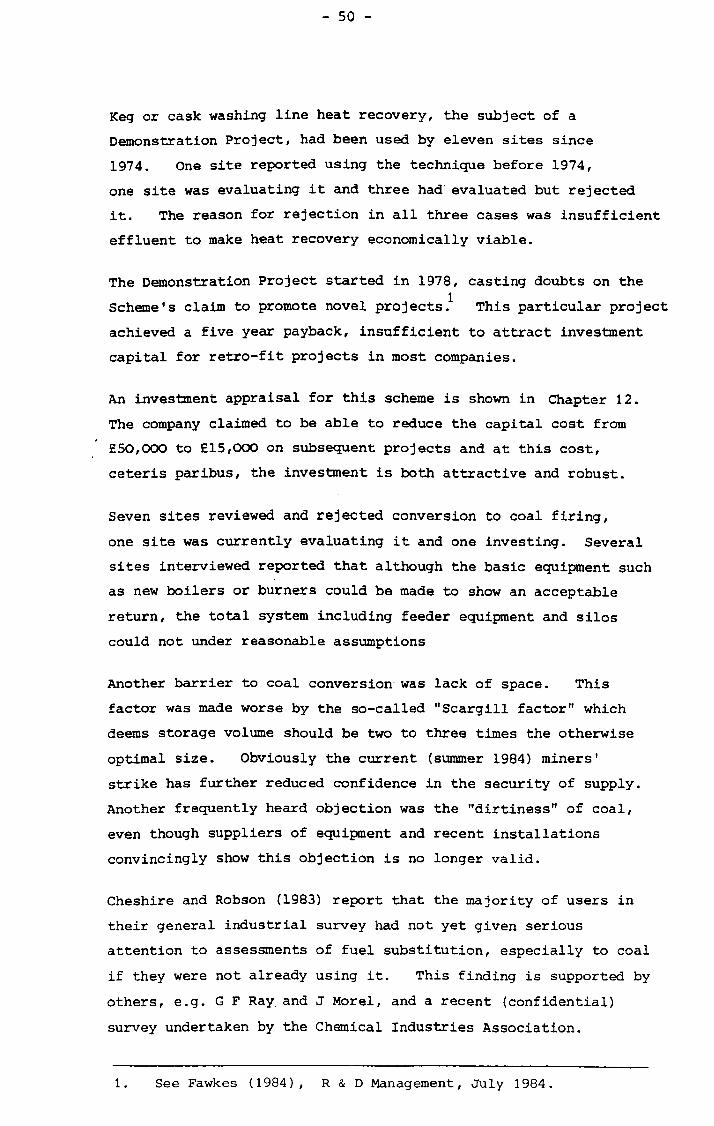
Keg or cask washing line heat recovery, the subject of a
Demonstration Project, had been used by eleven sites since
1974. One site reported using the technique before 1974,
one site was evaluating it and three had evaluated but rejected
it. The reason for rejection in all three cases was insufficient
effluent to make heat recovery economically viable.
The Demonstration Project started in 1978, casting doubts on the
Scheme's claim to promote novel projects. This particular project
achieved a five year payback, insufficient to attract investment
capital for retro-fit projects in most companies.
An investment appraisal for this scheme is shown in Chapter 12.
The company claimed to be able to reduce the capital cost from
£50,000 to £15,000 on subsequent projects and at this cost,
ceteris paribus, the investment is both attractive and robust.
Seven sites reviewed and rejected conversion to coal firing,
one site was currently evaluating it and one investing. Several
sites interviewed reported that although the basic equipment such
as new boilers or burners could be made to show an acceptable
return, the total system including feeder equipment and silos
could not under reasonable assumptions
Another barrier to coal conversion-was lack of space. This
factor was made worse by the so-called "Scargill factor" which
deems storage volume should be two to three times the otherwise
optimal size. Obviously the current (summer 1984) miners'
strike has further reduced confidence in the security of supply.
Another frequently heard objection was the "dirtiness" of coal,
even though suppliers of equipment and recent installations
convincingly show this objection is no longer valid.
Cheshire and Robson (1983) report that the majority of users in
their general industrial survey had not yet given serious
attention to assessments of fuel substitution, especially to coal
if they were not already using it. This finding is supported by
others, e. g. GF Ray-and J Morel, and a recent (confidential)
survey undertaken by the Chemical Industries Association.
1. See Fawkes (1984), R&D Management, July 1984.

The sample in this research supports these findings within the
brewing sector. Failure to seriously evaluate fuel
substitution probably reflects general failures of energy
management.
Three sites had invested in oxygen trim control systems for
boilers. This relatively new technique (at least for
ordinary industrial boilers) has wide application. The
technique is discussed in Section 3. The investment is both
attractive and robust. In time this technique can be expected
to diffuse widely.
One site was planning to invest in a combined heat and power (CHP)
plant. At two other sites where the possibility was raised, the
opinion was that CHP was too complex to consider. A full
financial analysis and discussion concerning CHP is to be found
in Chapter 11.
Three sites reported evaluating some form of effluent heat
recovery project. A major barrier at one site interviewed
was the lack of demand for additional hot water.
The techniques used are summarised in Table 3.6.

I
M M
aý
ro H
600 > > >>
190 > > >
£60 > > >
9ZT
6£0
OSI
£bT >
Z61 >
800 > > >
661 > > >
LL0
££T >
"0
ITT
ZZO
601
SOT
9S1 >
fii0 T
SST
S60 > > >
8 0 ý w ý4
Q) 4J > >, a (1) >
t3l vl >1 M a) ý > ý Öt > 4J 0 ý H O >a ý a 0 a) ro ý
w 4J r. 0 Ic f. 1 ro a) N rd
a) 0 " +
U W gq +) > H N 8
F x . 1J fa ro O ý4 ro it t7 (13 0 a) U A a) b+ a)
ý a) a a) ro ý ý W -W 'a a) w a C 4J
"a V. ++ a) w ro >, + F 8 ". ") tr ul W '"4 -4 Q A ul a) 3 O
8 ro a) sý >
ro b
4 " ý cl
A -ý >
O (v 1-4 ý ö ro
>. ý++ $4 (o a)
, "ý ý 9
i ý,
a) 4J a) 'a a) . w 41 '-"i 0) ro o 4 -
UU W urna )O v> -- a a) a ýn a) ý 0 ro 0 ul
4 a ý b ý-ý+ 3 O " -+
a +Jx"r+
> 0Wx
)-1 a) J aýý+
> O a
- s a "rl r.
v ý ro O 4 ' 1 o 0 1- ý ý $4 ýý o aJ > ro m av G . s~ a) o w m aý 41 F +
fl 0 44 -, A v Qa U
) ý4 J ro Cl ý4 r-+
"a a) b
N ro
b C
a 0
a H 3 x
U 0+ , -4 a)
(U "a 0 '0 v E'
u 3 u) ro ÜQ r 0
4 , 44 w 0
4 w O U 0 z 0 w
, äý a a ý. ) 8
I z ý a ý
0 U

>4
a ý
a cn
I
ý 4)
Ei
S T2'4O1 t0 N ý co . ti Oco N d' ýL NO f+'1 iO N N
Z90 > > >>
LOO V
S00
991 ^"' > >
SEI > >
IST >
TE0 > > `ý
9E T
990 > > >
zSO
ZLO > > > > > >
£00
6S0 > > > > >
D190 > > > > > >
£60 > >
001 > > >
61O '> >
910 > > >>
Dg T > > > >
0£0
ý $4 41 a) tr
0 Ö 6 >1 > t "1 `
° 0 ý+ ä 0 Nb 0 ~ ý
ý 7 ý ý y
}O4 ýb W ý
0 ÜO v m
ý ý C O ro 04 ý b '0 i
ý
a) a) d a) w w ý 4J R3 C: a) ä >, C4 ,C
U A (
11 > z a) a) It a s ý4 Ei b+ N
W +) -4 4 o U V. a1
m )3 - ý CO ro a) 1 I
ý m N 'i7
aCa 1 1 -1 " - - ro ý a) f 3 t , , W +
ý a) 4 J " a) w a)
r " ." U s j (a (d o + 1 r - - ' 44 tr
a va > s4 > -- a a) ý ý 1J A
a a) ý >cn ro ()
N " "1
a o '-+ q +. ) """+ O+ R 3 o + a) 1 "ýI (a o
C a ýl Ex o "-4 4. ) ý4 x 41 a) ý4 o G E a ov am r-I .+ ++ Oý, U+) ro a) > ro in O a) U4 C Q) r O w 1j a) .W F "-+ ý4 x v-ý+ aý ý ro +ý a) ý o a x tr a) "ý
y ro w ro ý, ro 0 -- 4-J °' w0 ý 0 o 0 u 0a % k°' N w
r-4
w u t ) w a) ý " oý'ä U rC c) m zc

>4
x ý
0 ý
I
U ý
c+')
a, . -1 A ý E-ý
600
T90
E D0
9ZI
6£0 ý- >
OST >
£Iii > >
ZDIT > > >
800
66T > > >
LLO
££T
DIV0
TIT
zzo > > 60T
Sol
9S T
fi0T >
SST
S60
trý+J ý ý C7 b+ @
ra a) 4-) ý ö° ' ° m a) Cl) a ý 8
ý 8 N
x 'z w "H U) r"1 °4 N
a ü i Q,
r 1 a b" Na
U) W O a) O! 0 ) w9 0 a >, 0 -4
,4 () H ý1 0
ý¢ N +)
". q +j
U) ""-I 1
O ý
^ W
N a)
w m it a ý w r-4 0-ý ., 0 0 4 4
-q (d I
ý 4. ) U) r+ U) U'O 4J 27 0 bý 0ý a W
UZ ) ý ý
9 v ° " ý ý ýN O °m a) a , 0 ý 08 8 (1, '0 0 a "rl N a , -i m ""'I w a +J a) 'O 4 a) w 0 ý4 v ", 1 -+
a) w a ý U'O v a) 0 w ý UU) 0 ý r-+ a) 0 " ý of Z 0+ a N
-1 c H ý S
N + ý a UI I m
U1 w 8 + 3
b -4
, . H H '
, 4 ý
ý ý "ý ý 0
b 1
44 O
Ü A N
O -4 4
N 4. )
EU"+ W
7ý 8 Qj k c0
aýi ý ý
w
U
al R
U 3
- 4 3
O M
m - 0 8 3 a )
H 0 :1
° v
F Ei m ý w äý ö> ý ä ää c ý z z ä
I z ý ý ý e 0 U

>1
a ý
ý I
llý rri
ý
&4
3T2401 r-Ln V Mqzp + . -+ CO -I NON. -r (14 N N
Z90 ý' > >
L00 > >> >
S00 > >'
99T >> > >' ý'
SET
IST
I £0
9E T
990
ZSO
ZLO ý » »' > > >
NO
650 >> >> >'
fii90 > >'
£60
OOT
6T0
910
D, 9I
OEO
41 ý . UI G"
N ý ''d O 0 ". "+ b 4)
E-i 4J C: a) U ý oö ý\
W C ) U) 1r a) ý ý =) U rý ßý -4 On ( U)
W 0 4) 01 N rtS i"1 ý O9 O ""-"+ U U H }4 0 >, 1 "H U) "ýq 0 -ý )4 a ý) Z >4 . -4 s4 a 4') 4j 4j » U) G) a roý o1-1o a4 ""i N ++ ý f! ) r""I N Uü U bý b 0 ro- O -1 C ). 1
rs7 qON U"4 fJ) 0 0 0 ý Ui ý+ Ei s4 So 9a H
rU a ++ ý U u) v ,ý cn a0 qw a 0 1J (1) b U) Q) >4 0 w a-4 0 ý4 U) C: Q) -4 -4 -i
ý w 94 U 43 (1) v tr Z U U) 0 ý4 H N 0 C9 Z
a Of
C+ Ul (, ýN a) i1 4
)ý ý1 NN
ý C U) ßý 3
"rý i
H A
H zz
C. r-1 ". -f 0 'O >
H IY. E -4
-4 r U)
,A Ir0 } R
)4 N a W
U) "i Cl) Q)
U) <v ý+
Z7/ Q ON W
ý x
4 H üü
d8 E Uý 0 H Ü ý -, I Q
Ný 3k ý3 v ) Oý
6 33 N
i m H Ü w
ro ä£ > o ý H äý Ü ZZ b E
sý C) ý ý z ý ý ft
8

3.6 Observed characteristics of energy management in breweries
The observed characteristics of energy management information
and control systems in the brewery sector are summarised in
Table 3.7. The breweries sampled can be divided into the
following six classifications according to their observed
characteristics:
Type Characteristics
I Monitoring at greater than monthly intervals;
no targetting.
II Monitoring at greater than monthly intervals;
targetting.
III Monitoring at monthly or more frequent intervals;
no targetting.
IV Monitoring at monthly or more frequent intervals;
targetting.
V Monitoring at monthly or more frequent intervals;
use of cost centres; no targetting.
VI Monitoring at monthly or more frequent intervals;
use of cost centres; targetting.
The numbers in each group are shown in Table 4.1.
Type I consists entirely of small sites (i. e. < 299,000 hl/a
capacity), as do Type II and Type III. Type IV consists of
two small sites, five medium (300,000 to 1,000,000 hl/a) and
four large sites (> 1,000,000 hl/a). Site 003 is medium in
size while Type VI consists of one small site, four medium sites
and six large sites.

uoTgeoT3TSSeTO H
H H H H H
H H ,^ j > > H H
szea c, aano ... Abaaua uT uoTgonpaz % ö
saeaÄ Z aaAO N Abaaua ut uotgonpaa % Ln N
M (V ý0
.ý 0 0 0 0 N
gabpng ageaedag
sgabaeg aaguao gsoo/eaaV ý. > >
sgabaeg TTezanp > > > >
saaguao gsoo
butzagaa: saav > > > >
zabuoT : butaogtuoW > >
ATgguoa: : butzogtuoW > > >
dTxaaM : butaogtuoW
dTiep : butaogtuoW
zabeuem Abaaua acaTg-TTn3
CýInjýI ýiuedmoo za N N
0 lD
8 l0 'd' n . -+ C
-: r M O -+ u1
. -r .. . -+ .ý o . -+ -4
id rn rn
al rn
r4 r, ý rn 0) 0) Cl) ý
W 0) 01
0) 01
I I i
01 01
01 01 1
01 rn +
(1) 0 NO 1 I 0 O 0 O O I I o I 0 O .aO t! ý 0 0
O -4
O -+
0 In O O
0 . -+ O in
ý

uotý2oT3TSS2TO H
ý H ý
H H
H H>
H
HH > H
s. z2a s . 1970 10 Ab. zaua uT uo-ponpa. l % 0 0 1D
00 M 0 w
Sara Z sa70 Ab. zaua uT uoT4onpa. z $
0 m in N oý oo ä co
s-4abpnq a-4e. zEdas
s-48b. z2'4 a. zWao 4soo/e9.1V
sýa6. z2ý TT2.1a7O > > > > >
sa. lquao 4soO > > >
5uTza-49>a gaaV > > >,
2815uoT : buTl04TuOw
ATxPuom : buTzOMuOW
ATNaaM : buT. lo-4TUOjgj >> >'
ATT2p : buT 1o'4TUOW
zab2uem Ab. laua am-r-4 TTn3 > >
a9gamH Au2dm0: ) M M
tý 1, -
in M
en V
N %, p M "o
in O o Ln
O O N . -, . -1
(DO
01 01 I
1
0 I
01 O1 i t 01
01 01
I 01 NO
'10 1 O
0 O 0
O 0
IO in
OI lff
O 0
I V) O O .ý0 Ln 0

IIOTýL'ýTJTSSVT3 H H H HH>
H H
H H H > >
H H H H ý H H
saved S IsvT atp aaeo
dbzaua UT uOTýonpag ,n
sava Z qsvT atjq zano dbzaua uT uoTýonpag ° o 000 ýn ýr ,n ý
-49bpnq aqezvdag
sqabzvq azquao 4soo/vazv
sqabz124 TTvzaeo ý. > > >
sazquao 4soo
buT2949m vazV > > >,
zabuoT : buTzo4TuoW
dTUluom : buTaoITuoW ý > > >
dTXeaM : buTzoITUOW
dTTVp : 5uT2o4TUOW
zabvuvm dbzaua amT4 Und
duvdm0 zaýý o °D M v ý
`O Ln d' ý°ý M co N . -ý 01
O ö ö ý ö ö
ro , ý4
rn Ol rn O1 ON rn rn
rn rn
rn rn
N 0) ON 0) ... ... ý ý
Q) 0 I I 01 a1 01 I 01 I 1 1
-. i O O O 1II
0 0 I 0
O 0 O
0 O 000 .ý O
ul v
U
+1 U
4 0 >4 a 0 4J
U) U)
v U1 N
to 0 4J
41
U ". 1 W 4-1 ., ý 'd
aý +. ) ro ý .,. i 4J U) W
. -1
W N ý 0 Z

tIOT'TPOTJTSS2T: ) H H H
> H
H H > H H H '
saEa 5 qsET au-4 aanO Abaaua UT uOT40npag O 0 0
saýa z ýsýT aqý aano Ab. zaua uT uoT-4onpag
co N Oý O N N co N co
sqabpnq aqvasdag
s'4ab. ZE4 924u90 '4SO3/t3aaV
s-49baln TTpaanO > > > >
saaquao 4soO > > >
buT. 19-48m sa. zV > > > >
aabuOT : buTao'4TUOW
ATt. Puora : buTao-4TuoW > > > > > >
ATXaaM : buTaogTUOW
ATTep : buT. zoqTuoW
aabEweta Abaaua atuTq TTn3
aaqtanH Aut'dtuoO rn ý ö u°`i en ö ö ý rý 0 0 0 0 0 0 0 0 0
rn 0) rn 0)
rn cn rn S., " f`"1 O1 m
U1 a) C)
I 41 01 I I I t 0 rn t 0 NO
-, I o 0 0
I I 0 0
O O
0 0
0 LO
I 0 Ln m M 0 0 u1 . -r rl . -4 0 . -+
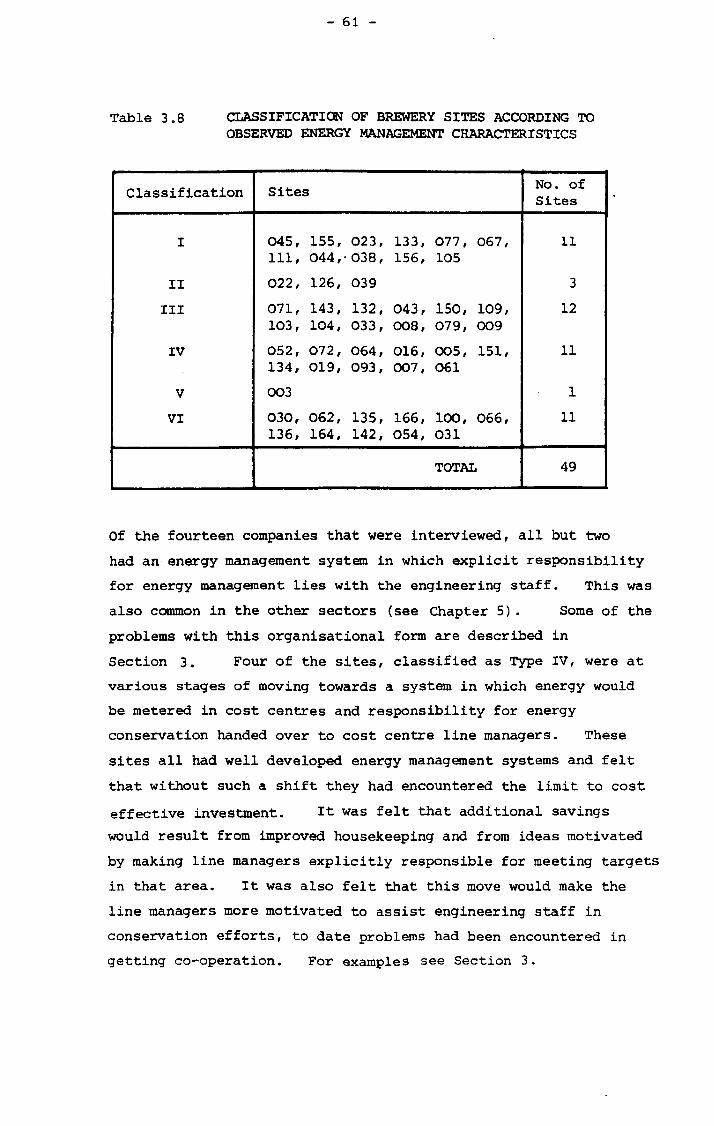
Table 3.8 CLASSIFICATION OF BREWERY SITES ACCORDING TO OBSERVED ENERGY MANAGEMENT CHARACTERISTICS
Classification Sites No. of Sites
I 045, 155, 023, 133, 077, 067, 11 111, 044, " 038, 156, 105
II 022, 126, 039 3
III 071, 143, 132, 043, 150, 109, 12 103, 104, 033, 008, 079, 009
Iv 052, 072, 064, 016, 005, 151, 11 134, 019, 093, 007, 061
V 003 1
VI 030, 062, 135, 166, 100, 066, 11 136, 164, 142, 054, 031
TOTAL 49
Of the fourteen companies that were interviewed, all but two
had an energy management system in which explicit responsibility
for energy management lies with the engineering staff. This was
also common in the other sectors (see Chapter 5). Some of the
problems with this organisational form are described in
Section 3. Four of the sites, classified as Type IV, were at
various stages of moving towards a system in which energy would
be metered in cost centres and responsibility for energy
conservation handed over to cost centre line managers. These
sites all had well developed energy management systems and felt
that without such a shift they had encountered the limit to cost
effective investment. It was felt that additional savings
would result from improved housekeeping and from ideas motivated
by making line managers explicitly responsible for meeting targets
in that area. It was also felt that this move would make the
line managers more motivated to assist engineering staff in
conservation efforts, to date problems had been encountered in
getting co-operation. For examples see Section 3.
'3.7
3.7.1
The Relationships between observed energy management characteristics and reduction in specific energy in the brewing sector
Non-parametric statistical tests have been used to explore the
relationships between observed energy management characteristics
and reduction in specific energy in the brewing sector. The
results of the tests are shown in Appendices 2 to 16 and discussed
below.
Size and energy management grouping
It is not possible to test whether site size is significant in
explaining energy management grouping because of the low numbers
in each group. It is, however, possible to test whether size is
significant in explaining the use of targetting and the use of
monitoring at monthly, or less, intervals. The tests in
Appendices 2 and*3 show that size is significant in explaining
the use of both targetting and monthly monitoring. It should
not be inferred from these results that monitoring and. targetting
are not possible in small sites, the presence of one small site
in Type VI shows what can be done; only that to date these
techniques have not been widely used in this sub-sector.
3.7.2 Use of monitoring and reduction in specific energy
The tests shown in Appendices 4 and 5 show that the use of monitor-
ing at monthly or more frequent intervals is significant in
explaining both whether a site achieves any reduction in specific
energy and whether it achieves a larger than median reduction.
Appendix 6 shows that the use of monitoring at monthly or more
frequent intervals is significant in explaining a difference in
means between the two samples.

3.7.3 Use of targetting and reduction in specific energy
The tests shown in Appendices 7 and 8 show that the use of
targetting is significant in explaining both whether a site
achieves any reduction in specific energy and whether it
achieves a greater than median reduction in specific energy.
Appendix 9 shows that there is a significant difference
between the mean reductions in specific energy achieved by
sites with targetting and those without.
As there is considerable overlap between those sites with
monitoring and those with targetting it is useful to test the
effect of targetting alone. Appendix 10 shows that targetting
alone is not significant in explaining a reduction in specific
energy. Appendix 11 shows that the use of targetting alone is
not significant in explaining a higher than median' reduction in
specific energy. Appendix 12 shows that the use of targetting
alone is not significant in explaining the difference in means
between the two samples.
Thus the evidence for the use of targetting alone is contra-
dictory. It is significant in explaining a higher than median
reduction in specific energy but not in achieving any reduction
or in explaining the difference of means of the two samples.
Targetting alone may not be a significant activity compared to
monitoring. Success, as measured here, may be due to other,
untested variables, or a combination of those tested.
3.7.4 Use of cost centres and reduction in specific energy
The tests shown in Appendices 13 and 14 show that the use of
cost centres is significant in explaining whether a site achieves
any reduction in specific energy but not significant in explain- ing a higher than median reduction in specific energy. Appendix 15 shows that there is a significant difference between
the mean reductions in specific energy achieved by sites with
cost centres and those without.

3.7.5 Energy management grouping and achieving a higher than median reduction in specific energy
Appendix 16 shows that the energy management grouping is
significant in explaining a higher than median reduction in
specific energy.
3.7.6 Full-time Energy Manager
Only two sites had a full-time energy manager. One achieved
a reduction in specific energy over two years of 20% and the
other 4%. A full-time energy manager is not significant in
explaining achieving a reduction in specific energy or
achieving a higher than median reduction.
3.8 Summary
This Chapter has examined the reductions in specific energy
achieved in the brewing sector, the techniques used and the
observed characteristics of energy management systems. We
have seen that a wide range of reductions in specific energy were
recorded over both the last two years and the last five years.
In this Chapter reduction in specific energy has been used as an
indicator of success but it will be shown in Section 3 that it
should not in a simple form be used as a measure of management
effectiveness. Thirteen out of 49 sites reported no investments
in energy conservation or no reduction in specific energy.
A range of energy conservation techniques were used in this sector.
The overall three most common techniques were frequently used in
all three sub-sectors. They have characteristics that make them
easy to adapt to different sites. This question of adaptability
will be explored in Chapter 7. The majority of the techniques
reported were retro-fit measures and adaptations of existing equip-
ment rather than innovations. Innovators, or potential innovators,
were found in all three sub-sectors.

Sites were categorised into groups according to observed
characteristics of their energy management systems, namely
frequency of monitoring, the use of targets and the use of
cost centres. Monitoring at monthly or more frequent
intervals was found to be significant in explaining both
achieving any reduction in specific energy over the last two
years and achieving a larger than median reduction. There
is considerable overlap between those sites that monitor and
those that target. Targetting alone is not significant in
explaining a reduction in specific energy but is in explaining
a larger than median reduction. Cost centres were found to
be significant in explaining a reduction in specific energy
but not a higher than median reduction. There is, however, a
significant difference between the mean reductions of sites
with and without cost centres.
Because of the inter-relatedness of the characteristics it is
difficult to disentangle the effects of any single factor.
The reductions in specific energy may be due to groups of
factors, or other unmeasured factors.

Chapter Four
ENERGY SAVING ACHIEVEMENTS IN THE DAIRY SECTOR
4.1 Introduction
This Chapter examines the reductions in specific energy, the
techniques used and the observed characteristics of energy
management systems in the dairy sector. The sample of eight
companies, covering twelve sites, were all interviewed.
4.2 Reduction in specific energy
in this sector it was difficult to obtain figures for the
reduction in specific energy over any consistent period. The
reported figures varied widely. One site reported a reduction
in electricity usage of 35% and a reduction in oil usage of 25%
over one year for broadly similar output and product mix.
Another, similar sized site, reported savings of "only" 10%
over five years. The reported reductions in specific energy
are shown in Table 4.1 for each site.
Table 4.1 REDUCTIONS IN SPECIFIC ENERGY ACHIEVED BY SAMPLED DAIRY SITES
Site Reduction in Specific energy
Time period Reduction
achieved over Notes
DOO1A DOO1B ) 10% 5 years Estimated DOO1C DOO2A 5% DOO2B 15% ) 2 years Estimated DOO2C 20% D003 0% 5 years No investments D004 15% 5 years - D005 20% 5 years - D006 0% 5 years No investments D007 5% 5 years Estimated D008 35% electricity 1 year -
25% fuel
NOTES: "Estimated" means estimated by company employees in the absence of detailed information.

4.3 Investment Criteria
The investment criteria of the sites that had made investments
in energy conservation were broadly similar with a two or three
year simple payback being required. One company (DO01)
required an eighteen month payback period. The two sites that
had made no investments said they could not afford cost saving
retro-fit measures and so had not set criteria.
4.4 The energy conservation techniques used or considered
Table 4.2 lists the techniques used or considered in the twelve
sites interviewed. Condensate recovery, pipe insulation,
oxygen trim control, back end dampers, low energy lighting and
power-factor correction were all used in two sites. All other
techniques had only been used in one site to date. If current
plans in the three sites of D002 go ahead, additional oxygen
trim systems,, metering and boiler instrumentation will soon be
installed.
Economisers had been considered or were under consideration in
four sites. In one of these, economisers had not been
economically viable because of a shortage of space in the boiler
houses. Obviously it would have been technically possible to
rebuild the boiler house but the cost would have been prohibitive.
In the other site an economiser was not viable because of a lack
of demand for additional hot water.
Improving condensate recovery and pipe insulation are undramatic
but useful technical changes that could probably be more widely
practiced. The same applies to back end dampers for boilers.
The only investment in fuel switching was from oil to gas. This
was made after a switch to coal was considered but rejected as
being uneconomic. Another site evaluated a switch to coal firing
and found it to offer an acceptable rate of return. If, however,
the cost of lost production during the conversion was included,
the project was not viable. This company thought they would opt
for coal firing in a greenfield site but a retro-fit installation
would not be possible.

Table 4.22 INVESTMENTS MADE IN THE DAIRY SECTOR
SITES
Techniques
4 1-4
M -4
U -4
4 C-4
M Cý4
U 04 . Ni
Condensate recovery � � 2 Economiser x x x x Pipe insulation � � 2 3lutttng down evaporator � 1 Oxygen trim control x x x � � 2 Metering x x x � 1 Boiler instrumentation x x x Absorption refrigeration x Evaporator modifications x Mechanical vapour recomp. x Back end dampers � � 2 Low energy lighting � x � 2
Heat recovery in new office � 1 Load shedding x Motor speed controllers x � 1 Boiler blow down with h. r. x x � 1 Insulation of oil tanks � 1 Power factor correction � � 2 Reuse of effluent from evap. � 1 Fuel switching x x � 1 Heat recovery from x
pasteuriser Heat pump for process h. r. x � 1 Controls for c. i. p. system � 1
Smaller compressors � i Ambient air cooling � 1 New effluent plant x Refrigeration controls x Feed tank insulation x x Recuperation on spray x x
driers
NOTES: �= invested in
x= considered/under consideration
h. r. = heat recovery
c. i. p. = cleaning in places

Most of the other investments were small improvements with the
exception of two, heat recovery from a spray drier, and use of
a heat pump for heat and water recovery. The latter represents
a true innovation, one that has only been copied once to date (trade sources). One other site had reviewed several low
temperature process heat recovery options including a heat pump but found the paybacks unacceptably long, eight years for the
heat pump system. The installed heat pump system has had
numerous technical problems and had to be modified after installation. On current performance it will have a payback
period of five to six years including water savings (D Boss,
personal communication). Heat pump economics are explored further in Section
4.5
The heat recovery from a spray drier project is an integrated
system which uses recovered heat from both the spray drier and the air heater flue, to preheat ambient air prior to passage
through the air heater. A four year payback was considered
acceptable on this project, as opposed to the two year criterion
normally required, because of the very large savings to be gained.
Innovation versus Adaption of existing equipment
All the investments, except the heat pump heat recovery system, were
adaptations of existing equipment and not innovations. The heat
pump system was installed under the aegis of the Energy Conserv-
ation Demonstration Projects Scheme.
4.6 Observed characteristics of energy management in the dairy sector
The dairies sampled can be divided into three categories, the
characteristics of which are as follows:
I No energy monitoring.
II Monitoring on a plant-wide basis.
III Monitoring on a cost-centre basis.
The numbers found in each group are summarised in Table 4.3.

Table 4.3 CLASSIFICATION OF DAIRY SITES ACCORDING TO ENERGY MANAGEMENT GROUPING
Type Sites Number
I D003, D006 2
II DOO1A, DO013, DOO1C, DOO2A, 8 DOO2B, DOO2C, DOO5(1), DO07(2)
III D004, D008 2
TOTAL 12
NOTES: (1) In transition towards Type III. (2) No action taken on meter readings.
Group I is made up of smaller sites. Little or no conservation
investment has occurred in this sub-sector. The remaining sites
cover a range of sizes, with total energy bills between £238,000
and £2,110,000 per annum at current prices. These sites exhibit
a range of investments made. One of the two small sites
(Group I) expressed an interest in starting an energy management
programme. Advice on monitoring and the use of consultants was
given in an attempt to influence their action. It is too early,
however, to assess the results.
A characteristic of Group II sites, in common with much of the
brewing sector, is that engineers are responsible for energy
conservation and departmental managers often lack motivation to
assist in conservation measures. This phenomenon is related to
the lack of sub-metering in these sites. One site, whose fuel
bill alone is £800,000 p. a. has minimal sub-metering. This
contrasts with one site in Group III which has 20 fully metered
cost-centres for a total fuel bill of only £200,000 p. a. In
the latter site the departmental managers have full responsibility
for energy cost control in their areas.
In one site (D007), monitoring is carried out at four-weekly
intervals, but management explicitly stated that no action is
taken based on the information gained.

One large store group with three dairies (DO02) has a well-
developed information system with reporting on a four-weekly
basis. The group energy manager, who acts as an internal
consultant and "product champion", regards monitoring as the
single most effective measure. To date, progress in this
company has been mainly through small projects initiated at
plant level while the group energy manager's attention has
been focused on the stores. Over the last five years an over-
all reduction in energy per floor area of 40% has been achieved
in the stores. Reduction in specific energy in the dairies
varies from 5- 20% over the last two years. Currently the
group energy manager is conducting surveys to identify invest-
ment opportunities. Once this is done, all viable opportunities
are likely to be exploited. Part of the investment programme
will include more extensive sub-metering.
one site in Group II (DO05), part of a large dairy group, is
gradually investing in sub-metering and shifting towards a
Type III system. The group Board however, refused to sanction
expenditure on a complete sub-metering system and so meters are being installed gradually. At the same time, the Board is now
moving towards a more complete costing system that will involve
extensive metering of utilities and materials. As part of
this exercise the group commissioned statisticians to correlate
energy and material usages to production and other relevant
factors. This recognises the effects of several variables on
specific energy (to be discussed in Chapter 7) and is a sensible
approach.
Group III sites combine extensive sub-metering with line manager
responsibility for energy conservation. One site (DO08) uses
weekly specific energy figures (which are adjusted for production
and other variances) as a guide to good housekeeping action.
The second site (DO04) uses a cost based information system.
In Site D008, part of a large group, central energy staff act as
consultants, reviewing progress and providing engineering
expertise on large projects.

The store group with three dairies (DO02) was one of the few
companies in any sector that had an explicit policy on
innovation. The group energy manager decided that the
company would not risk being an innovator. Novel projects,
such as mechanical vapour recompression (MVR), would not be
undertaken until other companies had proved the concept in
practice.
4.7 Summary
This Chapter has reported on the energy savings achieved, the
techniques used, and the observed characteristics of energy
management systems in a sample of companies in the dairy sector.
A wide range of reductions in specific energy were reported and
most techniques used had only been installed in one site.
Observed characteristics of the energy management systems were
used to categorise companies into three energy management groups.
Two sites with no energy monitoring had achieved no reduction
in specific energy. One site in Group III, having monitoring
on a cost-centre basis, had achieved a larger reduction in
specific energy in one year than any other site had in five
years. The other site in Group III achieved the third largest
reduction in specific energy over five years while the second
largest reduction was achieved by a site in Group II.
Only one example of an innovation was found. All the other
investments were adaptations of existing equipment.

Chapter Five
ENERGY SAVINGS IN DISTILLERIES
5.1 Introduction
This Chapter reviews the reductions in specific energy achieved,
the techniques used and the observed characteristics of energy
management systems in the sample of distilling sites. The
information covers seven companies owning a total of 31 sites.
With the exception of S004 the energy staff of these companies
were interviewed and visits were made to a selection of sites.
5.2 Reductions in specific energy
The industry has been running at a very low occupacity over the
last few years, typically 50%, and this, simultaneously increased
the need for cost-cutting but reduced the availability of capital.
Despite these constraints, the larger distilleries, owned by
groups, have invested in energy conservation projects where
viable. The resulting reductions in specific energy have been
between 10 and 25% over the last five years on an uncorrected basis.
Larger sites have now encountered difficulties in finding viable
projects given existing prices, techniques and capital availab-
ility. In the face of these limitations two companies are
being innovative. One is experimenting with anaerobic digestion
of effluent to produce methane for combustion. Successful
utilisation of this technique would also reduce effluent disposal
costs. The second company is investing in a gas turbine
combined heat and power scheme that will be the first in the UK
to export power under the provisions in the 1983 Energy Act.

5.3 Investments made or considered in the distilling sector
The investments made in the distilling sector sample are listed
and summarised in Table 5.1. Experience in this sector again
shows the site specific nature of mahy energy conservation
techniques. One company found waste heat boilers recovering
heat from the still combustion gases to be viable on one of its
sites but not on another. Viability on the first site was
possible because the boilers could be sited close to both the
source of waste heat and the demand for steam. In the second
site, this proximity was not possible and the cost of ductwork
and pipework, coupled with the resultant heat losses, *made the
project non-viable.
Another company invested in a horticulture project as a way of
utilising waste heat and this, along with aquaculture, has been
suggested as a possibility with large potential in other sites.
There were however several site and company specific factors
that made it viable. These are described by the company itself
as:
Private company with history of diversification.
Decision to keep direct heating on quality grounds.
Distillery could only use 60% of recoverable heat.
More cooling capacity was required because of an increase in production capacity.
Disappearance of "Scotch" tomatoes because of escalating fuel costs.
Availability of suitable land nearby.
Large market close to hand.
Heat recovered was at a high enough temperature.
Distillery operates 24 hours per day, four days a week except for mid-summer shutdown.
(Source: Cockburn, 1981)

ýi aý .a
Ei
ý x ä co a i 0 3 ý 3
ow ,. a . If ý N& ö öý b+ 44 0 -14 04
J 1 ýý
U) ýa
W N
. 4J 9: ý Ja 4 O
U) N
il . - 1 - + i Fa (a ý
ý x ý4 N
4J lý a > U dP 0 co 0 g 3 E+
Ü y en s. l
0) U
la ý ý ý a i ro a,
r. u W 4J 'd "° 0m V (d d) "I 1 "ý .. 0 0ý
- >ý ä x ý , x >ý A p 0 Ö
0 U 1-I R O 0 Uw". I G) '-I . -I "H U ý ä N dÖ W'
0 a >, >r N ü W N O ) ) a)
ýp -H a . a ý4 WW Nb :1 g a) ý ý ý
Ü d 0º a)
ul -4 41 a ý
ro ro ý p 0Ný 0 X . 3 Um
1.1 0
W U)
I, + W
U) '0 O) W
0 ý1 v > A L9 U) 0 W 0) 0ý N
Öý ý
ý ý >
U l
4 ý4 ia -'ýi
ß W I mö ö OR 'd , a
'-1 0 ". 1 .i (D i"I W a) U) a) ro' O) ". I ". I W3 >N U) > +. 1 0. I-1 U) 0) 003 0 0) 0 C UT A U) 1"1 UUk U 1-I U O) () at 00U a) 3 CD b -+
0 U) W 0 .l x '" 'ý Ö ä C 1 ý 0 Ö
1 1
ý ý U)
.I O0 . -I U0 ro
0) 4. NO WUN
+
ro U 1
W
it ""1 0
U
U) u? ". 1 0 ro ro'd N 0) 0 () U 'ti N a ) W -'4 (1) 0 ý ý W ýro° ý Üx Ö W MN". IýW N»(aW 0 a) 0) W
U) ro ro W 7j '
'a O . -1 ". I 0) a) 4-1 , L; 11 0 1ý1 U
ro 33m t7 I~ 3W3 ý s~ ra W N ., ~ a NHQ Ü 110
ä z Z 3 ý z 3 4
W Oý 0) 01 . -4 . -r N 01
.;. ) 0 ". I zm
>4 ro N M IT u1 ý
ý U) ý ý U)
I-
ö 0 ý

ý un 'C7 W 41
ýo R1 U E4
ý
) + ý U
n 0 4-) Co
ý Oý ° ä ý O b w ro 04 ý9 cn Q. N a ä4) w 4) W Q) " " ä ý ýä ý ý A i
) ý H 0 ! ý
ý >i 4.; 4-) dP i )
6N ! ± Ü U) 'b 11 ý r1
N
0 Ü Ü N Z
W >r
N 4J nN ° ý
. C a) 41 Ö ý4 (d N
41 ý 3 a) b+ r-I
Tj r. a) 0b +1
0 :s
Ü Ü +J ý m Ö C
Co ". "+ R7 ' Äý 0 1-4 4)
$4 41 HN 0 0 ý
CO W Ö 41
() ý U fx
a sý a, 0 m O a) U +ý 41 0 4. ) 41
4J m ý U) " 4 '" d ß/ b
ä b+ r"1 1 d ý
1 b ° lý(d > ý ö
ý1 ýý
0 a m ý I d ý. ö ý
O +) a) 4-J +) a) a) 4. ) a 5 ä Nä
m3 u) N ä
1 ý ýc: ro
R7 1
a "n o a) a) N ý4 + U Q w 4) `"'
W "ý a) U b+ "'"I 'd a) w O >
m > ý p' ý m ' w ý wý a)
a) r-I -4
g . L' """I c ýr
,C 't7 3-1 v a) (1) +-j 1
f"1 'O 4
g "-" > «S Ný ü' ü º-I U = a) O U "a -
a 8 +"+b u 4J a) > a aa) a, roa) Oco ". q m mU m Id > m ý O m w
' +J ý
) m al
"'4 ý tr+ A 0 g dw Id " + ý m U) b+ )-I Oý U O 'C 'g a) a) v 3 m, q >r ý Ö ýÜ ýý >, ý ýi Ü ý ý bä c ýN
3ý + . S
ý %o w ° 4 )
N a) q -4 ! 'm 1 a) > +J ý X ý
ýQ -4 -4 >O 1 . " -4 C
b ý a) "
a) ac a) aAli
a) E aai ro Ö+J a) () U) . a) b+
c) cý' Sq ý' a ý ý a cý z z
w O ý N n
y) 0 "'"I z U)
ý a ý ö 0 ö Ci Cl) U)

Table 5.2 INVESTMENTS IN DISTILLING SECTOR SAMPLE
Site
Technique .r 00 In
N
0 Cl)
rn
00 In
Cr 0 In
t11
0 In
l0
00 In
N
00 In
Waste heat boilers ,/
Insulation on stills ,/ Condensate recovery � �
Power factor correction �
Replacement of over-sized � � motors
Coal fired conversion x
Load shedding x
Heat recovery from stills x using h/a
Waste heat recovery using � x thermo-compressor
Waste heat recovery using � horticulture
Waste heat recovery using x aquaculture
Anaerobic digestion of effluent x
Mechanical Vapour Recompression x
CHP at warehouse x
CHP at distillery (gas turbine) �-
Various operations changes � � �
Variable speed drive
Changed 4 effect evaporator to � 6 effect
Use of exhaust air for drying �
Numerous small improvements ,/ Variable speed drives. �
NOTES: �= invested
x= under consideration/considered
CHP = Combined Heat & Power

In the five large distilleries waste heat recovery had been
exploited wherever economically viable. A major barrier to
further use of waste heat recovery in these sites is lack of
additional demand for hot water, the product of all relevant
heat recovery techniques except waste heat boilers.
With the exception of the horticulture scheme, the combined
heat and power schemes and the experimental anaerobic digestor,
the other investments were unspectacular but largely effective.
One company investigated combined heat and power (CHP) for a
warehouse but found it to be uneconomic because of the low
utilisation of heat. The distilling site where CHP was viable,
and is being installed, offered a high utilisation of heat.
Management at this site expressed surprise that CHP was viable,
indicating perhaps an untapped potential in other sites. CHP
economics are explored in detail in a later chapter, and indicate
this technique may be more attractive than is generally
recognised.
One company (SOO1) considered converting from oil firing to coal
at one of its sites. The simple payback period would have been
approximately four years at full production levels and the capital
cost £700,000. The main Board recalculated the payback period on
the assumption of current production levels (about 50% occupacity)
and rejected the proposal. This illustrates the sensitivity of
energy conservation investments to occupacity levels.
company SOOT also rejected further heat recovery from stills
because they had no further use for additional hot water. They
also rejected load shedding as a means of controlling Maximum
Demand charges because there were no large loads that could be
shed during production.
Company S005 is experimenting with an anaerobic digestor bio-gas
system that if put into practice will both produce methane for
combustion, and reduce effluent charges. This is similar to the
system being tried in the brewery sector. If a fill scale
system goes ahead it will be an innovation in the distilling
sector.

The same company rejected Mechanical Vapour Recompression (MVR)
for being too risky and likely to have high maintenance costs.
Company S006 is currently trying to justify the building of a
new distillery on energy grounds alone. This interesting
possibility is currently being designed (Summer 1984) in order
to produce a financial case.
5.4 Investment criteria
All companies except the two small sites (S002 and S003)
reported a simple payback investment criteria between 18 months
and three years.
5.5 Observed characteristics of energy management in the distilling sector
The five larger companies, excluding S002 and S003, monitor
energy consumption on a weekly basis. All five companies have
computerised systems to calculate specific energy and in two
cases, costs per litre of spirit. In two companies this inform-
ation is integrated with the overall management information
systems.
Only two companies have explicit targets for reduction in specific
energy. Of these, only one currently takes explicit account of
production variances and start-up and shut-down effects in
comparing actual specific energy usage and the target figure.
The computerised system in question is programmed to correct for
these effects.
In the second company with explicit targets, the group energy
manager recognises the need to correct for these effects and is
planning to implement a system that can do this. One constraint
to date has been lack of storage space on the company's central
computer, but the advent of powerful microcomputers should allow
an independent energy management system to be established.

5.6 Summary
In the distilling sector there has been a wide range of
reductions in specific energy and a variety of techniques used.
Those five companies that have made investments in energy
conservation have energy monitoring on a weekly basis. Only
two of these companies have explicit targets for reducing
specific energy but a third company is moving towards targetting.
In those companies that have invested in energy conservation
techniques, further opportunities for viable investments are
limited. Heat recovery techniques in particular are limited
by the lack of demand for additional hot water. In the face
of these constraints two companies are being innovative.
One is experimenting with a bio-gas generator and the other is
investing in a gas turbine driven combined heat and power (CHP)
system.

Chapter Six
ENERGY SAVING IN THE MALTING INDUSTRY
6.1 Introduction
This Chapter reviews the reductions in specific energy achieved,
the energy conservation techniques used and the observed character-
istics of energy management systems in the malting sector. Most
attention is paid to heat recovery from malting kilns because this
technique can have a far larger effect on malting energy costs than any other single technique, and because it has diffused
throughout the industry extremely quickly. Factors affecting
this rapid diffusion are discussed.
6.2 Reductions in specific energy achieved
Measured reductions in specific energy have been hard to obtain in this sector, but available unadjusted figures range from 25 to
40% over the last five years. The sites achieving these figures
had invested in heat recovery. One site with a high initial
specific energy use reported a reduction of 20% through simple
recirculation alone.
6.3 Investments made in the malting sector
The investments made in the malting sector sample are listed in
Tables 6.1 to 6.4 and summarised in Table 6.5.
In addition to the companies interviewed, two small companies
were contacted. One had made no investments in energy conservation
and had no plans to do so. The second had invested in heat recovery
on five kilns since 1981.

Table 6.1 DATA SUMMARY - MALTING COMPANY M001
Company:
No. of sites:
Annual production:
Annual energy bill:
Monitoring:
Payback criteria:
Investments made:
Investments under consideration:
Notes:
M001
1
45,000 tonnes
£400,000
Monthly
3 years simple payback
1960 switched from coal to gas oil
1973 switched from gas oil to gas
Looked at heat recovery from 1979, invested 1981
Installed low NOX burners
Capital cost of heat recovery project: £100,000
Payback period: 18 months
Motor speed controls on fans
Heat recovery reduced energy from 53% of total overheads to 50% despite a 25% rise in fuel prices.
Investment on heat recovery made easier because of (a) large room above kilns; (b) floor with sufficient
load bearing capacity; (c) proximity of two stacks.
N. B. NOx = oxides of nitrogen

Table 6.2 DATA SUMMARY - MALTING COMPANY M002
Company:
No. of sites:
Annual production:
Annual energy bill:
Monitoring:
Payback criteria:
Investments made:
M002
4 (3 box sites, 1 Clova site)
After every batch
2 year simple payback
Recycling air post-break on one site
Heat recovery on 2 sites - run around coil systems
Computer process control
Recycling on "Clovers" (1)
Investments under Variable speed motor controls consideration: Variable pitch fans
Conveyor controls
Fluidised bed coal combustion (2)
Notes: Heat recovery on 1 site made possible by common ducting. On third site heat recovery is not viable because each box has its own ducting. No heat recovery system is viable on "Clovas" because the whole process from germination to kilning is carried out in one container, hence kilning only occurs 3 days out of 7.
(1) Circular, continuous process, malting kilns contrasting with the traditional rectangular boxes.
(2) Not considered viable without a market led switch to indirectly fired malt.

Table 6.3 DATA SUMMARY - MALTING COMPANY M003
Company:
No. Of Sites:
Production:
Annual energy bill:
Monitoring:
Payback criteria:
Investments made:
M003
1
40,000 tonnes/annum
£400,000
Monthly
2 year simple payback, 30% dcf hurdle rate
Recirculation 1976/77
Heat recovery 1981
Capital cost of heat recovery project: £160,000
Payback: 20 months
Microprocessor system for monitoring
Investments under Microprocessor system for control consideration: Conversion from oil firing to gas - rejected
as cost of laying main -2 miles (payable by the company) was prohibitive.
Notes: Recirculation reduced consumption from 50 therms/tonne to 40 therms/tonne. (20%) Heat recovery added further 20%.
6

Table 6.4 DATA SUMMARY - MALTING COMPANY M004
Company:
No. Of sites:
Production:
Annual energy bill:
Payback criteria:
Monitoring:
Investments made:
Investments under consideration:
M004
3
3 year simple payback, 30% IRR hurdle rate
5 run around coil heat recovery systems
3 air to air heat recovery systems
1 gas engine driven heat pump recovery system
Microprocessor control systems
Fuel switching to coal (1 site)
Combustion of straw - rejected as being impractical and not cost effective.
Notes: Heat pump has reduced consumption from 23% to 17 therms/ tonne. Justification was possible because of market led demand for indirectly fired malt. An indirect system would have cost £100,000 and increased consumption to 24 therms/tonne. Heat pump cost £300,000 and was justified on marginal basis, including Demonstration Project Scheme grant of 25% of capital cost. Heat pump also justified on "experience" grounds as major competitor installed one.

The various heat recirculation and recovery options available
for the malting process are explained in Harris (1981),
Chapman and Walker (1979), Dangerfield (1978) and Neidermayer
(1977).
Company M001 with one site, had switched from coal firing to
gas oil firing around 1960. It was decided that despite the
higher cost of gas oil per litre compared to heavy fuel oil
(HFO), the additional costs of maintenance and electricity for
trace line and tank heating made gas oil cheaper overall. This
systematic approach to appraising energy costs is to be noted
and is in contrast to other examples explored in Section 3.
In 1973 a switch was made to an interruptible natural gas supply
(only interruptable contracts were available at thät time) and
gas oil became a stand-by fuel. Later, negotiations led to a
firm supply of gas at advantageous delivered price per therm.
The company's General Manager started investigating heat recovery
in 1979, three years after the first installation in the UK
industry. At the start of 1979 there was the first "scare"
about the level of nitrosamines (believed carginogens) in the
product and this led to "sulphuring", the addition of sulphur
to the combustion process. The resultant oxides of sulphur inhibit oxides of nitrogen, and hence nitrosamines, forming.
Sulphuring also caused corrosion in several of the early heat
recovery projects.
The company's General Manager was concerned about corrosion and
spent much time visiting installations and investigating alter-
natives. During this information gathering phase, considerable
assistance was received from other companies in the industry,
noted for its "friendly competition". Before heat recovery was
attempted low NOx burners became available and these were installed
on the company's kilns. (Sulphuring is still required by the USA,
a major export market). Now the USA will not accept directly fired
malt. Interestingly, indirect firing does not remove the problem
entirely as nitrosamine levels are increased by pollution.

After investigating all available systems, the company dropped
its "Buy British" policy in order to install a system based on
a German stainless steel tube air-to-air heat exchanger.
Investment cost was £100,000 for two kilns and an 18 month pay- back period was envisaged. The system achieved a 15 month
payback.
Stainless steel tube heat exchangers are very resistant to
corrosion (with a five year anti-corrosion warranty) and self-
cleaning, two major advantages. Installation of the system was
made easier because of the existence of a large room, with a floor of sufficient load bearing capacity, directly over the two
kilns, and the fact that the two exchaust stacks are adjacent.
On two other kilns of the company the existing arrangement was
not so favourable, making a retro-fit project non-viable.
Therefore, the company waited for the opportunity afforded by
capacity enlargement and renovation of these two kilns, to
incorporate heat recovery.
Company M002 owns four sites, two with 10 conventional boxes
one with 5, and one with 2 circular "Clovas". The company
first invested in simple recycling of post-break air wherever
possible. Subsequently two run around coil heat recovery
systems were installed. On two sites heat recovery was
"easy" because the boxes utilise common ducts. At the third
conventional site each box has individual ducts and in order to
install heat recovery the duct system would have had to been
rebuilt. The cost of this made heat recovery non-viable.
The two "Clovas" have post-break recycling. All alternative
heat recovery systems, including heat pumps integrated with
combined heat and power have been considered here but none are
economic because each container is used for both germination
and kilning. Consequently kilning occurs only three days out
of 7 or 8 in each unit, and there is insufficient utilisation
to justify heat recovery.
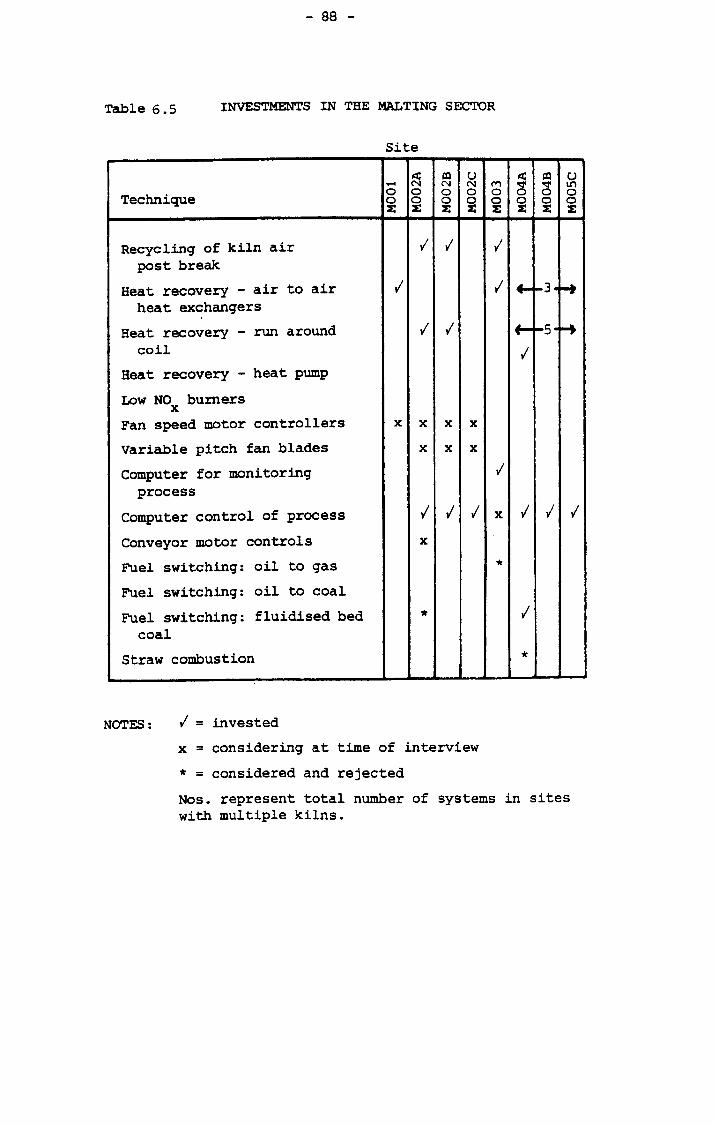
Table 6.5 INVESTMENTS IN THE MALTING SECTOR
Site
Technique E N
E E C'4
x r1
E g
E OV E
LO O z
Recycling of kiln air � � �
post break
i t i � � 3 oa r r Heat recovery -a heat exchangers
Heat recovery - run around � � 5
coil �
Heat recovery - heat pump
Low NO burners x
Fan speed motor controllers x x x x
Variable pitch fan blades x x x
Computer for monitoring �
process Computer control of process � � � x � � �
Conveyor motor controls x
Fuel switching: oil to gas
Fuel switching: oil to coal
Fuel switching: fluidised bed * �
coal
Straw combustion *I LI
NOTES: �= invested
x= considering at time of interview
*= considered and rejected
Nos. represent total number of systems in sites with multiple kilns.

The company has also invested in computer process control and is considering variable speed controls on the fan motors, variable
pitch fans and conveyor motor controls. Fluidised bed coal
combustion has been rejected on economic and "convenience" grounds.
Conversion to coal firing would be considered again if the market demanded a switch to indirect fired malt. (Use of an indirect
system would increase energy use).
Company M003 operates one site with three kilns. Simple
recirculation systems were added to all kilns in 1976. A heat
recovery system, using the same stainless steel tube heat exchanger
as in M001, was installed in 1981 on two kilns. The investment
cost was £160,000 and the expected payback period two years. As
in Company M001, management were concerned about corrosion.
Visits were made to German installations 8 to 12 years old, which
showed no signs of corrosion despite use of sulphur. The largest
barrier to installing the heat recovery system was senior manage-
ment. It took four years of effort from the operational staff to
convince senior management that investment in heat recovery was
necessary and viable.
Company M004 has three separate sites, each with multiple kilns.
Over the last five years the company has invested in five run-around
coil heat recovery systems, three air-to-air heat recovery systems,
and one gas engine driven heat pump heat recovery system. In
addition to these, it has invested in computer process control
systems, being the first to develop them in the UK malting industry;
and fuel switching to coal at one site. This company was the first
in the UK to invest in run-around coil and glass tube air-to-air
heat exchangers. One early heat recovery system failed through
corrosion after sulphuring was started to reduce nitrosamine levels
in the product. The early heat recovery systems had to be forced
onto conservative equipment suppliers who, in the eyes of the
company, did not consider them viable.

At the site where a coal fired system was installed an indirect
steam heating system had been used from new. For various
technical reasons the heat recovery alternatives were not viable
at this site and so coal firing was the only option for reducing
kilning costs. Conversion was made easier because the site had
a lot of empty space.
The heat pump system was justified because of an Energy Conserv-
ation Demonstration Project Scheme grant (ECDPS) and because a
switch in market demand to zero nitrosamines content necessitated
an indirect heating system. An indirect system would have cost
£100,000 and increased energy consumption from 22 to 24 therms/tonne.
It was estimated a heat pump system would cost £300,000 and reduce
consumption to 16 therms/tonne. Using these figures and the 25%
ECDPS grant a three year payback was calculated. In practice it
is likely to be longer because of equipment failures and failure
of the system to operate at the design performance level. The
management, however, justified the system on the basis that their
major competitor had one and that they should gain early
experience in case heat pumps became standard. In effect the
financial appraisal was "cooked" to ensure the project went ahead
and the project was experimental.
6.4 Observed characteristics of energy management in the malting sector
Two companies read meters monthly and produced specific energy and
cost information. The other two read meters and produced specific
energy information for every kilning. Their specific energy
figures were corrected for ambient conditions, the biggest cause
of variance in malting specific energy consumption (batch size
being constant).
Metering is usually comprehensive in maltings because of the very
large quantities of both fuel and electricity consumed.

6.5 Investment criteria!
As shown in Tables 6.1 to 6.4 the investment criteria used were
either a two or three year simple payback period.
6.6 Discussion
Harris (1981) reports that one-fifth of productive capacity in
1980 already had heat recovery equipment installed (whereas
none had in 1975), and that plans then existed for adding heat
recovery to 80% of productive capacity within three years.
This sample suggests these plans have been implemented.
The rapid diffusion of heat recovery techniques in the malting
industry demands further attention. Several powerful forces,
unique to the industry, were at work in causing this rapid take-up
of a new technique (new at least in the UK).
Firstly, energy typically represents 50% or more of total costs
in a malting operation. The cost of barley and labour, the
two inputs, are relatively fixed. This high proportion of total
costs has made energy a very relevant problem in the industry.
Heat recirculation and recovery in its various forms offered a
way of reducing costs that could not be matched by any other
single technique. In fact, there are only a small number of
energy saving techniques that are relevant to the industry, and
these are only worth considering after heat recovery.
Secondly, the industry is competitive. Even maltings associated
with breweries are not usually immune from competition. Despite
their competitive nature, there is generally a free exchange of
technical information.
The use of heat recovery in Europe, in some cases for more than a
decade, meant that it was possible for potential investors to see
actual installations and reduce their uncertainty over corrosion.
The high capital cost of the systems made wide ranging information
gathering worthwhile.

The early adopters in the malting industry consisted of the two
largest companies in the industry. The nature of the malting
process meant it was possible for them to easily install early
versions of heat recovery on a proportion of their output.
In the early days the pressure to innovate came from the malting
companies themselves and UK manufacturers were reticent to
supply the requipment. This represents a failure of marketing
by the suppliers.
Unlike in the brewing industry, the malting industry's trade
association has not been particularly active in energy
conservation. Most of the information exchange seems to have
been through personal contacts backed up by the trade press and
the Energy Technology Support Unit.
6.7 Summary
We have seen the range of reductions of specific energy achieved
in the malting company sample. The sector exhibits more
uniformity in its investments than the other three sectors.
Heat recovery has diffused widely over the last 5 to 6 years.
Circumstances peculiar to the industry have been operating to
promote this remarkably rapid diffusion.
The early adopters in the industry of both heat recovery and
process control systems were the dominant companies in the
sector.

Summary of Section One
This section has described the energy conservation achievements to date in
the sampled companies within the four sectors. The information forms a
background to discussing the process of technical change resulting in energy
conservation and the management challenges of that process. It also forms
a basis for estimating future potentials for energy conserving capital
equipment.
All four sectors show a wide range of reductions in specific energy, a . wide
range of techniques used and a range of energy management approaches.
Malting is exceptional in that one technique has been far more important
than all others. Techniques vary from sector to sector with the exception
of a few common ones such as oxygen trim systems, improved condensate
recovery, power factor correction, and high efficiency lighting. These
techniques are not industry-specific as they are at least technically
feasible wherever steam systems, electricity or artificial lighting are
used. They may not, however, be economically viable.
In all four sectors, there is evidence concerning the site specific nature
of energy conservation investments. Economic viability in one site does
not automatically mean economic viability in all similar sites, even
assuming similar definitions of economic viability.
Investment criteria for cost saving measures, i. e. definitions of economic
viability, are broadly similar, both within and between sectors.
Most of the energy saving investments to date have been retro-fitted to
existing plant and adaptations of existing equipment rather than innovations.
Those sites that have incorporated energy saving features into new plant
have achieved significant reductions in specific energy. Sites that have
innovated, or are considering innovation, have been found in all size ranges
in the brewing sector. Innovators and early adopters in the malting sector
have been the dominant companies in the industry. In the distilling sector
innovating companies have been both large and small.

The variety of energy management approaches in all four sectors can be
classified into three broad categories; those that do not regularly
monitor energy use; those that monitor energy use on a plant-wide basis;
and those that monitor energy use on a cost-centre basis.
There is evidence from the brewing sector that the use of monitoring at
monthly or more frequent intervals is associated with a larger than median
reduction in specific energy. The statistical links between the use of
either targetting or cost centres and a larger than median reduction in
specific energy are less strong.

REFERENCES for Section One
ADDY, M (1983) Sense and nonsense in heat recovery Energy Manager, April 1983, vol. 6, no. 4
BAKER, MJ (1983) Market development Penguin, Barmondsworth, Middlesex
BEIJDORFF, AF (1979) Energy efficiency Group Planning, Shell International Petroleum Company, London
BROOKES, G and REAY, D (1982) Comparative merits of heat recovery equipment Jnl. of Heat Recovery Systems vol. 2, no. 1,1982
CARTER, CF and WILLIAMS, BR (1959) The characteristics of technically progressive firms.
Jnl. of Industrial Economics, March 1959
CHALLIS, A (19 82) The credibility of forecasting Chemistry and Industry, September 1982
CHAPMAN, J and WALKER, R (1979) Fuel economy in malt kilning Brewers' Guardian, November 1979
CHESHIRE, J and ROBSON, M (1983) UK industrial energy demand: economic and technical change in the steam boiler stock Science Policy Research Unit Occasional Paper Series No. 19, University of Sussex.
COCKBURN, H (1981) Utilisation of waste heat in a malt distillery in Energy for Rural and Island Communities, ed. J Twiddel, Pergamon Press, oxford.
CROWTHER, JG (1935) British scientists of the nineteenth century Routledge and Kegan Paul Ltd, London
DANGERFIELD, RJ (1978) Economic heat recovery from malt kiln exhaust Brewing and Distilling International, Vol, 8, No. 4,1978
DAY, GV et al (1980) An analysis of the low energy strategy for the UK as proposed by the International Institute for Environment and Development United Kingdom Atomic Energy Authority, Discussion Paper No. 1, May 1980
DEPARTMENT OF ENERGY (1982) Proof of evidence for the Sizewell 'B' Public Enquiry
Department of Energy, London, October 1982

DRI Europe (1982) A report summarised in: Demand, supply and prices to the year 2000; in Energy World, March 1983, No. 101.
DRYDEN, ICG (ed) (1982) The efficient use of energy. 2nd edition Butterworths, Sevenoaks, Kent
EDEN, R (1980) Energy conservation: opportunities, limitations and policies in World energy, issues and policies. Proc. of the first Oxford energy seminar Mabro, R (ed) Oxford University Press.
ENERGY EFFICIENCY OFFICE (1983) Better results with energy. A practical guide to efficient energy management. Department of Energy, London
ETSU (1982) Low energy futures
ETSU Report R. 11
FAWKES, SD and JACQUES, JK (1984) The market for heat pumps for industrial heat recovery in the UK: myths and realities Paper presented at Energex 84 Conference, Regina, Saskatchewan,
Canada, 14 - 19 May 1984
BORES, M (1977) Technical change and innovation in industrial efficiency and the role of government, ed. C Bowe, im-SO
GORDON, RW (1981) Energy utilisation in breweries
EBC Congress, 1981
HARRIS, PS (1978) Energy Audit Series No. 3. The Dairy industry.
Issued jointly by the Department of Energy and the Department of
Industry.
HARRIS, PS (1979) Energy Audit Series No. 8 The Brewing industry.
Issued jointly by the Department of Energy and the Department of Industry.
HARRIS, PS (1981) Energy Audit Series No. 15. The malting industry. Issued jointly by the Department of Energy and the Department of Industry.
ION, DC (1980) Availability of world energy resources Graham and Trotman Ltd
INTERNATIONAL ENERGY AGENCY (1982) World energy outlook OECD, Paris
JACQUES, JK (1981) Investment decisions and energy conservation within the organisation TERU Discussion Paper No. 28, University of Stirling
JOHNSON, PS (1976) Firm size and technological innovation Moorgate and Wall Street, 1976

LAWS, WR (1981) Waste Heat as an energy source. Energy World, November 1981
LEACH, G et al (1979) A low energy strategy for the United Kingdom International Institute for the Environment and Development. Science Reviews, London.
LIZTLECHILD, SC and VAIDYA, KG (1982) Energy strategies for the UK George Allen and Unwin, London
LYLE, 0 (1946) The efficient use of steam HMSO, London
MALKIN, L (1982) Six schemes for saving energy in distilling Brewing and Distilling International, August 1982
MARSHALL, E (1980)
perspective Low energy strategies for the UK - an economic
Energy Policy, December 1980
MISSIONS, D (1981)
contractor Heat recovery: the role of the specialist
Jnl. of Heat Recovery Systems, Vol. 1, no. 1,1981
MORIATY, RT and BATESON, JEG (1982) Exploring complex decision
making unities: a new approach Jnl. of Market Research, Vol. XIX, May 1982
NEIDERMAYER, J (1977) The heat pump in kilning Cerevisia, 3,1977
ODELL, P and ROSING, KE (1980) Future of oil: a simulation study of world supply and demand 1980 - 2080
Kogan Page
ODUM, HT (1981) Energy, basis for man and nature McGraw Hill
OLIVIER, D et al (1983) Energy efficient futures: opening the solar option Earth Resources Research Ltd, London
RAY, GF and MOREL, J (1982) Energy conservation in the UK Energy Economics, Vol. 4, No. 2, April 1982
ROGERS, EM (1962) Diffusion of innovations Free Press, New York

SAMPSON, A (1980) The seven sisters (3rd impression, updated) Hodder & Stoughton, Sevenoaks Kent
SHELL (1979) Energy and the investment challenge Shell Briefing Service, September 1979
STOBAUGH, R (1982) World energy to the year 2000 in Global Insecurity D Yergin &M Hillenbrand, eds. (1982), Penguin, Harmondsworth
YEOMANS, KA (1968) Statistics for the social scientist: 2
Applied Statistics Penguin, Harmondsworth, Middlesex
YERGIN, D and HILLENBRAND, M (eds), (1982) Global Insecurity
Penguin, Harmondsworth, Middlesex

Section Two
THE POTENTIAL FOR FURTHER CHANGE

SECTION TWO
THE POTENTIAL FOR FURTHER CHANGE
INTRODUCTION
This Section describes the process of technical change that
results in energy conservation. Langrish's (1979) model of
technical change is integrated with Baker's (1983) model of buying behaviour in order to (a) define potentials for energy
conserving capital equipment; and (b) form a basis for
exploring the problems of managing energy conservation activity.
Qly by understanding the process of change itself can we
adequately define the potentials and understand the barriers to
exploitation of these potentials.
Having defined the potentials for energy conserving capital
equipment the problems of measuring these potentials are
discussed. These problems are related to the important area of defining success in energy management, which is also discussed.
Estimates for industry wide potentials are shown to be arbitrary
and the number of companies achieving their potential is advanced
as a more useful value.
From the model of technical change a soft systems model of the
activities necessary in energy management is developed. This
is used in Section 3 to explore some of the barriers to
effective energy management.

Chapter Seven
THE PROCESS OF TECHNICAL CHANGE
7.1 Introduction
Most of the technical change literature has been concerned with
the economic causes and effects of such changes rather than the
process itself. Here we are more concerned with the process
itself, with the workings "inside the black box" of Rosenberg
(1982a).
Fores (1977) states that most analysts of general economic
performance, and of industrial performance in particular, have
stressed the importance of general technical change. Yet most
of the specialist literature has been concerned with innovation,
which is only a special case of technical change, being a
discrete step in the development of product or process. As we have seen in Section One, most of the investments in energy
conserving capital equipment have been in modest, incremental
technical changes using previously innovated techniques.
7.2 The process of technical change
Langrish (1979) in one of the few works to consider the process
of technical change itself, advances a new conceptualisation in
order to clarify what he sees as paradoxes in the literature,
paradoxes similar to those identified by Fores. Langrish
suggests that there are three necessary conditions that have
to be met before a technical change will occur. These are:
(1) a TECHNICAL CONCEPT must exist, capable of being developed
to the stage of achieving
(2) an ADVANTAGE over alternative technical concepts; and (3) the CAPABILITY of developing (1) to the stage of (2)
must exist.

All three conditions have to occur simultaneously and in the same
place. An important modification would be that it is more the
perception of advantage and capability rather than any absolute
values that motivate a coupling agent to bring all three together
and force a technical change. The coupling agent fulfills an
entrepreneurial role even though in most cases of technical change
he is unlikely to be the classic independent entrepreneur, but
rather an employee of an established organisation.
The technical concept may be a brand new idea, a new combination
of ideas (old and/or new) or an old idea not previously developed
because of lack of advantage or capability.
The ease with which the concept can be turned into a commercially
viable installation depends on the extent to which components of
the concept are already embodied in available hardware. If the
central concept is already embodied in commercially available
hardware only adaptation to fit the specific site will be
necessary. (The difficulties of adaptation as we will see are
frequently overlooked in the literature). If hardware has to be
developed, as in the case of an entirely new concept, or invention,
more research and development work is necessary. Thus, there are
different levels of research, desj. gn and development. Depending
on the state of the concept it may involve R&D in the traditional
sense, "experimental design" or more mundane "routine engineering
design", as defined by Freeman (1983).
The advantage is usually, in the case of industry, an economic
advantage. It may be an advantage over alternative concepts or
over the status quo. Other non-economic advantages, or at least
non-quantifiable advantages such as improved quality control or
working environment may be associated with the technical change
but economic advantages will be the usual driving force for
change in industry. An exception would be technical changes that
are required by law.

Capability to develop the technical concept to the stage of
achieving the required advantage over alternative concepts or the
status quo may exist in either the potential host or a supplying
organisation. In many energy conservation investments the basic
hardware will already exist and the necessary capability will be
the capability of adapting the basic hardware to meet the potential
host's technical and financial needs. The greater the level of
research, design and development necessary to bring the concept
to the hardware stage, the more important, and more difficult, it
is to assess the capability of vendor companies. Several examples
of vendors promising the capability to develop innovative techniques,
and then failing to deliver, were encountered in the sampled
companies. This adds an extra uncertainty to the investment
decision. Interestingly this "new conceptualisation" of Langrish's
is similar to Asimow's (1962) description of the engineering design
process in which the starting point is an abstract archtype or concept.
This is refined through an iterative process into a less abstract
detailed design and finally embodied in hardware.

7.3 Adoption and Adaptation
In diffusion studies (for example Mansfield, 1968) and Davies
(1979), and in texts on buying behaviour (for example Bellizzi,
1981, and Wind, Robertson and Fraser, 1982) the purchase of
technology is often presented as a simple adoption process.
In many of the examples discussed by these authors, and the
energy conservation investments made in the sampled companies
in the four sectors, the process is more one of adaptation.
Even when the concept is well proven and the basic hardware exists
some adaptation work is necessary for all but the simplest techniques, to make a viable system in the particular site in
question. This requires original, though not dramatic,
engineering design work.
The basic hardware may well be standard and simple but the system
must be engineered to meet the technical conditions and the
required economic return at each specific site. The difficulties
this can present, and the effect of site specific technical factors
on economic viability, have been neglected in the adoption
literature.
There is a great variety of energy conservation hardware available,
ranging from low energy lamps to sophisticated process heat recovery
and electronic energy management systems. Each technique has a degree of adaptability, the inverse of which can be labelled
specificity. At one end of the scale, with a high adaptability,
would be low energy minature fluorescent lamps which can plug
straight into existing fittings. In more complex relighting
situations, such as a warehouse where high pressure sodium lamps
are to replace fluorescent tubes, considerable adaptation of the
existing lighting circuits may be necessary. For descriptions
of the various techniques available see Payne (1984).
A technique with a lower adaptability than low energy lighting
would be heat recovery from boiler stacks using economisers.

Ostensibly this mature technology (first patented in 1845) looks
very adaptable as it can, in principle, i. e. technically, be
applied to any gas fired boiler, or dual fuel boiler if a by-
pass is used during oil firing. For descriptions of the
technique see Gray et al (1981) and Payne (1984).
Numerous site specific factors affect the financial viability of
proposals for boiler economisers, including:
physical space for the hardware
load bearing supports
quantity and quality of demand for hot water
flue gas temperature and-composition
boiler utilisation
boiler load pattern
time spent burning gas on dual fuel boilers.
Total system cost, as in other heat recovery projects, is often
three times the cost of the economiser or heat exchanger
(Missions, 1982; Cooper, 1983; personal communication).
At two brewery and one dairy sites visited during the research,
economisers were not financially viable because of lack of space
in the boilerhouse. Obviously it would have been technically
feasible to extend the boiler house but the cost would have been
prohibitive. Consequently, the technical potential for energy
saving through the use of economisers at these sites is unlikely
to be exploited at current prices until a new boiler installation
is necessary for other reasons. Applications of commercially
available hardware are rarely prevented by purely technical
problems but by failure to meet economic criteria.
At the top end of the specifity scale, i. e. the least adaptable,
would be a process heat recovery system such as malting kiln heat
recovery or a brewery effluent heat recovery system. The number
of technical factors affecting financial viability will be
substantially higher than a boiler economiser. For discussion
of these factors for process heat recovery systems see Missions,
1981; Brookes and Reay, 1982; Turner, 1982; and Addy, 1983.

The determinants of the adaptability are the sensitivities of
capital costs and savings to variations in specific technical
factors inherent in the technique and the site.
The technique of heat recovery from malting kilns using air-to-
air heat exchangers has a high adaptability because the technical
factors that affect capital cost and savings, notably physical
dimensions, air flow rates, temperatures, tend to be similar.
There are only a few basic designs of malting kilns.
On the other hand brewery effluent heat recovery systems have a
low adaptability into other brewery sites because their viability
is very sensitive to site specific factors such as plant layout
and quantities and qualities of effluent (determined by the type
and operating conditions of existing plant).
The importance of specificity is supported by several writers on
innovation.
Rosenberg (1982a) stresses the importance of adaptation and the
role of "unspectacular design and engineering activities". He
also notes that in the literature there is frequent preoccupation
with what is technically spectacular rather than what is economically
significant. Rosenberg also emphasises the importance of studies at
the level of the individual firm.
Rogers (1962) in discussing the adoption of innovations divides the
"antecedents" to the innovation decision into two categories:
(1) perceived attributes of the innovation, and
(2) characteristics of the adopters.
Five attributes can be summarised for the first category:
1. Relative advantage
2. Compatability
3. Complexity
4. Trialability
5. Observability
Compatability, "the degree of fit of the innovation with existing
norms and needs of potential users", (Rogers, 1962), subsumes
adaptability as well as other factors.

The importance of adaptability, or its inverse specificity (in
connection with innovations) is also supported by Boylan (1977),
who states:
"The number of firms in an industry which are potential
adopters of an innovation, and the proportion of their
output to which it might be applied, depends on the
functional specificity of the innovation at
successive stages of development as well as the range
of relevant processes and products in individual plants.
Hence, adoption rates cannot properly be compared with
the total number of firms in, or the total output of,
their common "industry" classification. Rather the
progressively changing characteristics of the
innovation in its various forms must be accompanied
by changing measures of the array of economically
feasible applications. "
Gold (1977) notes that it cannot be assumed that the expected
benefits of an innovation are so clear that all potential adopters
would assess them similarly or even that all potential adopters
give serious consideration to the same innovations in any given
period. In addition, it has been shown in Section One that
economic viability in one site does not automatically confer
economic viability in a similar site because the costs of adopting
the basic hardware into a system can make it not viable. This is
true even assuming similar definitions of economic viability.
Gold continues to suggest that "the criteria applied to the
evaluation of available innovations may differ widely among firms,
reflecting differences in their internal urgencies, resource
availabilities and specialised expertise rather than deriving
solely from the demonstrable benefits of the innovation itself. "
Gold also states "Instead of assuming ignorance, sloth, bias or
stupidity as the causes of (such) restrained rates of diffusion,
it would be more helpful to make field studies of the actual
considerations and evaluations responsible for the decisions
made. "

Bradbury (1978) observed that. technology "is not something that
can be bought off the shelf or stored in a bank vault".
Components of systems may be bought off the shelf but an input
or knowledge is necessary to design financially viable systems,
even where the concept has been used elsewhere.
Baker (1983) in discussing the adoption of innovations states
that "adoption decisions are very much situation related".
7.4 Intermediate Summary
Langrish's model of technical change has been advanced as
useful for understanding the actual process of technical change,
rather than the economic causes and effects. This understanding
is necessary to understand the process of investment in energy
conservation and to define potentials for energy conservation.
Three conditions must occur simultaneously and in the same place
before a technical change can occur, a technical concept must
exist, it must offer an advantage and the capability of developing
the concept into reality must exist. It is perceptions of
advantage and capability, rather than any absolute values, that
motivate a coupling agent to bring all three conditions together
and force a technical change. This conceptualisation of technical
change, which is similar to earlier writers' views of the design
process, shows innovation as being a special case of general
technical change.
Depending on the extent to which the concept is already embodied
in available hardware, different levels of research, design and development will be necessary to bring the concept into reality.
Much of the research, design and development activity is at the
routine engineering design level not usually thought of as "R & D".
The advantage in industry is an economic advantage. In order to begin the development process the concept must be perceived as
promising to meet the required investment criteria at the
particular site.
Capability to undertake the development work must be perceived to
exist in either the host organisation or in the vending company.
Even where the concept only entails the use of existing commercially
available hardware the difficulties of adapting the concept to fit
the specific site have been overlooked in the technical change
literature. Straightforward replication, with no site specific
adaptation, is very rare for all but the simplest techniques.
Different techniques have different adaptabilities, a characteristic
determined by the sensitivities of capital costs and benefits to
specific technical variables. This means that a technique that
is financially viable in one site is not necessarily viable in
another similar site, even assuming the same definition of
viability.
The importance of adaptability, or its inverse specificity, is
supported by other authors on technical change. This view of
technical change as a very site specific activity has important
consequences for the general innovation diffusion literature, the
definition of potentials for energy conserving capital equipment
and agents of change promoting energy conservation. Further
research into the role of adaptability, or site specificity in
the adoption decision is advocated.

7.5 The situation facing a firm
Let us examine the situation facing a firm considering investment
in energy conservation equipment. It faces an array of technical
concepts, the application of any of which would result in reduction
of energy use. These concepts are, to varying degrees, embodied
in available hardware. i Some, for example boiler economisers,
involve mature hardware and are well proven, others for example
microprocessor controlled oxygen trim control systems, are "state
of the art". Others, for example microprocessor control of malting
kilns, would (prior to 1982) involve a higher level of research,
design and development to implement as they are beyond the current
state of the art. New concepts may also be invented in response
to specific needs.
Most concepts are technically suitable for both retrofit and new
installations. Not all of the array of technical concepts are
likely to be known by one person, even. in a limited field or
industrial sector.
From the array of perceived concepts some will be adopted to be
considered in more detail. The objective at this stage is to
work up the concept into a feasible project. As mentioned
before, this process is essentially one of research, design and
development (R, D& D), but much of the activity is not on the
level reported as "R & D" in the literature. Depending on the
state of the concept it may involve R&D in the traditional
sense, "experimental design" or more mundane "routine engineering
design" as defined by Freeman (1983).
1. Some concepts embodied as hardware border on the fraudulent which adds another dimension of uncertainty.

Most of the investments made by the sampled companies used well
proven concepts utilising commercially available hardware. The
RD&D necessary was at the adaptation level-. involving routine
engineering design. Most companies take a passive role, accepting
concepts and hardware already developed. One company in the malting
sector had taken an active role in pushing vendors into developing
heat exchangers suitable for malting kiln heat recovery. One large
brewery company used its central engineering staff to develop a new,
low cost, space heating control unit. Other large companies could
take an active role in developing new techniques and hardware in
collaboration with vendors.
Most potential investor companies cb not have the resources or the
expertise to develop novel concepts not yet embodied in commercially
available hardware.
The differences between a decision to adopt or develop a new
technique, i. e. to innovate or to be an early adopter, and a decision
to adapt a proven existing technique, have perhaps been overstressed
in the literature. Both involve change and uncertainty for the host
company. Investing in an already innovated technique still involves
the uncertainty over whether the technique will work, and work
profitably (as defined by the company) in the particular site.
The decision to adopt a technique first involves the extra uncertainty
over whether the technique can be made to work at all, or perhaps more
realistically, can be made to work within acceptable performance i. e.
cost and benefit, limits.
The process of working up a concept has several iterative stages.
Technical evaluation, or the "technology design" described by
Schmidt-Tiedmanns (1983) in discussing innovation, is concerned with
assessing whether the technique(s) will operate in the designed
manner in the particular application in question. For most energy
conservation techniques, for which commercially available hardware
already exists, this is routine engineering design or engineering
judgement, and will be done by the potential investor, often in
conjunction with one or more vendors. It is partly a process of
establishing confidence in the equipment and the supplier, and partly
a process of overall system design. The larger the potential

investment, the greater the time and money likely to be spent
on this stage. For example, when considering malting heat
recovery systems costing about £100,000 potential investors
spent much time evaluating alternatives and visiting existing
installations in Europe.
The (array of) technically feasible project(s) is then subject
to commercial evaluation using the potential investors criteria.
This is usually done by soliciting quotations, or where systems
are to be installed by internal staff, preparing estimates of
costs and savings. Some techniques require considerable
specific design work to prepare quotations and judgement is
often exercised over which concepts should be pursued.
Investment is only likely to occur if the potential investor's
criteria are met and so it will be argued that use of any other
criteria in defining potentials is irrelevant. Investment
criteria are more complex than simple payback period or
discounted cash flow rate of return. Absolute capital
constraints are also important as shown by the brewery site
which rejected copper vapour heat recovery using mechanical
vapour recompression. The payback period was within the
company's normal criteria but the project was rejected on
absolute capital cost grounds. Failure to meet financial
criteria may lead to outright rejection and abandonment of the
project, or redesign of the concept or system.
A third aspect of evaluation is often ignored, both in diffusion
studies and by management. It can be labelled contextual
evaluation. The viability of proposed projects must be
examined in the context of other energy conservation investments,
new plant investments, corporate strategy, market changes and
personnel skills. Failures to consider the interactions
between projects and these factors at the design stage can lead
to expensive failures. Some examples of such failures are
described in a later section.

Having evaluated the array of concepts there remains an array
of technically feasible, financially viable, appropriate projects.
It will be argued in the next section that these form the true
potential for energy conserving capital equipment.
7.6
Any static description of such a dynamic process cannot do justice
to its complexity. Firstly, as noted, different concepts are at
different levels of development. Then energy conservation projects
interact with each other, with other capital projects and with
strategy. Prices of energy and capital change and future prices
must always remain uncertain. New concepts, both as ideas and
hardware, are entering the market. Improvements are being made
to existing hardware, particularly in such fields as microelectronics.
The manager of technical change must cope with this complexity and
uncertainty.
Technical change and buying behaviour: a synthesis
Two similarities are apparent here, and a synthesis is useful.
Firstly the process above is essentially the design process
described by Asimow (1962) and Simon (19 75) . The second
similarity is between this process and the composite model
of buying behaviour advanced by Baker (1983).
This may be expressed notionally as follows
P=f [SP, (PC, EC, TA -TD) S(EA_ED) , BR) ]
where
P= probability of purchase
f=a function (unspecified) of
SP = selective perception
PC = precipitating circumstances
EC = enabling conditions TA = technological advantages
TD = technological disadvantages
EA = Economic advantages
ED = Economic disadvantages
BR = Behavioural response

Baker points out that this is a sequential process model: PC is equivalent to interest, (TA - TD) and (EA - ED) represents
evaluation, and BR dictates the action taken.
The precise nature of the function is not specific because it
is not known and it is unlikely that any single functional form
could capture the interactions between the other variables in
the model.
Placing SP or selective perception at the beginning as a factor
mediating the other variables it is possible to show this is a
process model. Selective perception will determine whether or
not one will become aware of a purchase opportunity besides
conditioning the information selected for evaluation and the
interpretation placed upon it.
This model, which Baker uses in relation to identifying early
adopters of new product developments, is equally applicable to
general technical change. Selective perception partly
determines which concepts are worked up into feasible projects,
affects evaluations of technical and economic advantages, as
as well as capability.
As Baker states, "The adoption decision is based on perceived
advantage rather than absolute economic advantage". To this
it could be added that the decision is also based on perceived
technical advantages and perceived capability of implementing
the concept.
7.7 Defining potentials for energy conserving capital equipment
The model of technical change allows us to define conceptually
two potentials for energy conserving capital equipment, each
with three sub-sets representing different levels of change.
Firstly, in any one site there is a potential for reducing
specific energy using known concepts, not necessarily existing
as hardware. This is potential achievable through the use of
esisting inventions, i. e. the savings that would result if all
relevant existing inventions were developed and built as hardware.

The available concepts can be divided into concepts designed
solely for energy conservation and retrofitting onto existing
plant, concepts for new production techniques using the same
basic processes, and concepts for new processes; the application
of any of which would result in energy conservation.
The potential using retrofit concepts can be defined as those
savings that would result if all relevant retrofit energy
conservation concepts were developed and installed on the
existing plant. It takes no account of whether the technique
is already embodied into hardware or of economics.
The potential using new techniques but the same basic processes
can be defined as those savings that would result if all relevant
new concepts were developed and installed, replacing the existing
plant, without regard to economics or hardware availability.
The potential using new production processes can be defined as
those savings that would result if any new process concepts were developed and installed, replacing existing plant, without regard
to economics or hardware availability.
All savings are relative to the existing plant.
The second potential is a sub-set of the first, it is that
achievable through the use of existing innovations i. e. hardware
that is available commercially and has been utilised elsewhere.
This again can be sub-divided into potentials using techniques
designed purely for retrofitting, new production techniques
using the same basic process, and new processes. These potentials
are easier to visualise than those using concepts.
The potential using innovated retrofit hardware can be defined as
those savings that would result if all available retrofit
techniques were installed onto the existing plant, with no
regard to economics.
The potential using innovated production techniques using the same
basic process can be defined as those savings that would result if
all available production techniques were installed in the existing
plant, with no regard to economics.
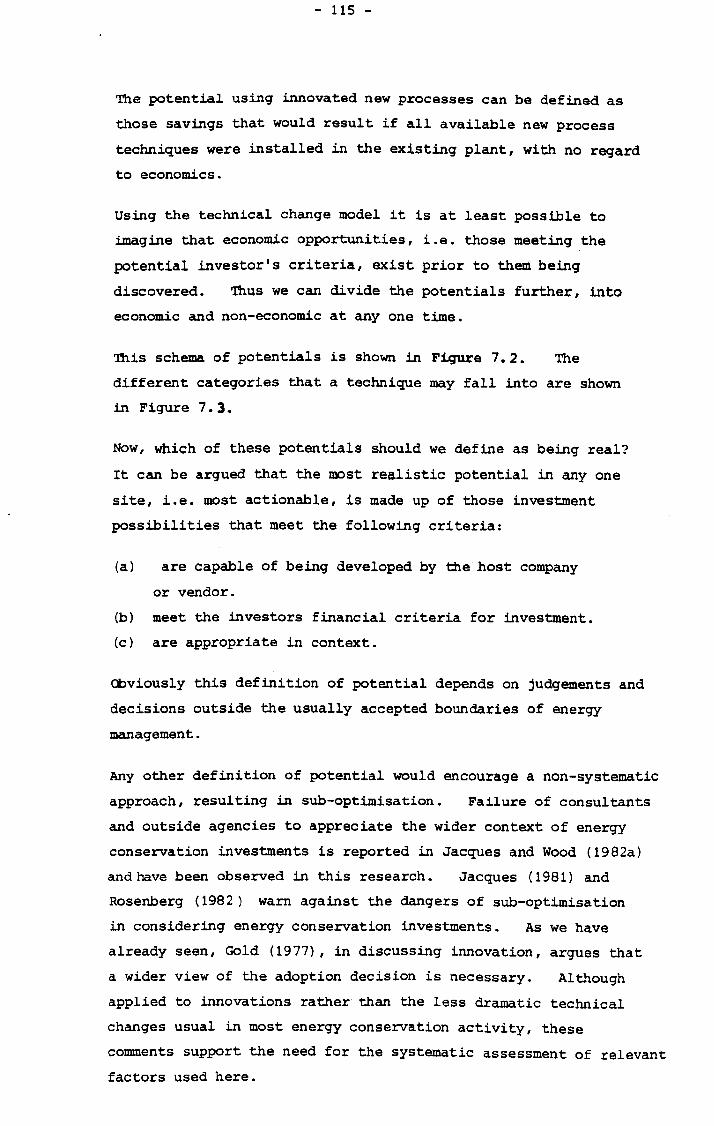
The potential using innovated new processes can be defined as those savings that would result if all available new process
techniques were installed in the existing plant, with no regard
to economics.
Using the technical change model it is at least possible to
imagine that economic opportunities, i. e. those meeting the
potential investor's criteria, exist prior to them being
discovered. Thus we can divide the potentials further, into
economic and non-economic at any one time.
This schema of potentials is shown in Figure 7.2. The
different categories that a technique may fall into are shown
in Figure 7.3.
Now, which of these potentials should we define as being real?
It can be argued that the most realistic potential in any one
site, i. e. most actionable, is made up of those investment
possibilities that meet the following criteria:
(a) are capable of being developed by the host company
or vendor.
(b) meet the investors financial criteria for investment.
(c) are appropriate in context.
obviously this definition of potential depends on judgements and decisions outside the usually accepted boundaries of energy
management.
Any other definition of potential would encourage a non-systematic
approach, resulting in sub-optimisation. Failure of consultants
and outside agencies to appreciate the wider context of energy
conservation investments is reported in Jacques and Wood (1982a)
and have been observed in this research. Jacques (1981) and Rosenberg (1982) warn against the dangers of sub-optimisation in considering energy conservation investments. As we have
already seen, Gold (1977), in discussing innovation, argues that
a wider view of the adoption decision is necessary. Although
applied to innovations rather than the less dramatic technical
changes usual in most energy conservation activity, these
comments support the need for the systematic assessment of relevant factors used here.

It can be seen that a site by site approach to defining potentials
is necessary. A certain technique may fall into different
categories of potential at different sites and hence the realistic
potential as defined above'may differ between sites for one or more
of the following reasons:
1. There may be differences in the existing technical conditions
between sites that limit the scope for profitable (as defined
by the investor) use of the technique in question. Existing
technical conditions arise from historical decisions over
plant design. For example, site specific constraints at one
site may make a boiler economiser not financially viable
whereas at a similar site with the same investment criteria
an economiser may be viable.
2. Differences in financial criteria may exist, i. e. sites may
have different acceptable payback criteria. These will
arise from differences in capital availability and differences
in allocation of funds between offensive and defensive spending.
The latter is one aspect of the context of the investment.
3. There may be differences in other aspects of context.
Differences in production technology strategy, e. g. a decision
to switch to nitrogen pushing in brewing (see example in
Section Three) affects the viability of certain other energy
(and other resource) saving techniques. Differences in
market demand for the final product also affect the array of
viable investment opportunities. For example the reduction
in acceptable nitrosamine levels in malt (see Section One)
forced some companies to switch to indirect heating methods.
The increased kilning costs associated with this switch made
heat recovery more attractive economically.
Differences in corporate strategy, e. g. a decision to close a
site within two years would greatly reduce the incentive to
invest in energy conservation at that site.

4. Differences in historical. performance in exploiting energy
conservation opportunities will exist. A site where
profitable conservation opportunities have always been
recognised and exploited is less likely to have potential for further profitable change than a site where no energy
conservation investments have ever been made. Although
past decisions may affect the viability of specific
techniques (as in 1), failure to-invest in energy conserv-
ation in the past will have left more opportunities open
when energy conservation is examined.
5. Differences in the level of innovation that will be attempted,
both within the framework of existing process technology and
beyond it. A site that is willing to risk innovating a new
technique opens up the range of achievable potentials.
Given these reasons why real potentials may differ between sites,
it would hardly be surprising if there is a difference in perform-
ance between ostensibly similar sites as measured by reduction in
specific energy. Added to these factors that can account for
differences in potentials there are of course differences in
managerial performance in identifying or creating, and exploiting
opportunities.
The factors that influence the realistic potential in any one site
at any one time are shown in Figure 7.1.
Differences in perceptions may come from two sources, differences
in the quality of internal and external information flows, and
differences in the selective perception of information by actors
in the process. For example, in one site the possibility of
condensate recovery may not be perceived at all because of a lack
of knowledge about the efficient use of steam. At another site
it is recognised but not considered realistic because the Chief
Engineer once worked in a site where severe problems had been
experienced with this technique. Such "Biases", or in some
cases, paradigms, are important in determining what is considered
achievable and appropriate by management. They reflect a failure
to recognise the system and available techniques as they exist now,
an undue discounting of newer techniques, and lack of "scientific
inquisitiveness" about the system. Paradigms are discussed further in Section Three.

7.8 Measuring potentials
In order to measure the potentials as defined above at any one
site it would be necessary to conduct a full technical survey to
identify possible techniques, and then conduct cost benefit
studies on each. Then the company's economic and other criteria
would have to be applied to the resulting array of possible
projects to determine which potential each technique fell into
at that particular time. The resulting energy saving from each
technique could be summed to give a total energy saving for each
type of potential.
This is the sort of exercise that companies conduct before
investing except the high cost and time extensiveness of gathering
information at the required level of detail means that only projects
that are judged likely to be viable are worked up into proposals.
Several other problems obscure the measurement of potentials.
Firstly, managerial decisions outside the usually accepted boundaries
of energy management are a necessary part of measuring potentials
as defined here. Although it is conceptually possible to imagine
an objective observer making notional rather than actual, i. e.
actionable, decisions in order to measure potentials, there would
seem to be little point if different decisions were taken to those
that the company's management would take- Asking management to
make these decisions is obviously possible. This would be a
useful exercise from the point of view of the analyst and, if it
forced management to consider important but previously ignored
issues, from the point of view of the company. Other suitable
agents of change or mechanisms such as short courses may stimulate
this action.
Secondly, it is hard to reliably estimate costs and benefits of
techniques that have not yet been innovated.
Thirdly, there are two kinds of mutual exclusivity between both
possible energy conserving techniques and other possible investments.

There is "true" mutual exclusivity, e. g. investing in a new,
more efficient keg line that does not produce hot effluent
removes the option of retrofitting a keg washing line heat
recovery system on to the existing line. Then there is
"designed in" mutual exclusivity, e. g. building a boiler house
without sufficient space for the addition of an economiser
increases the capital cost of retrofitting an economiser in
future, thus making it uneconomic.
Finally, as prices and available techniques change, the
potentials change. Thus any measurement of potential is
likely to remain fuzzy. Attempting to objectively measure
the potentials is probably not a worthwhile exercise for a
company because of the high cost of information at the necessary
level, and the ephemeral nature of the information gained, but
viewiig technßques. as falling into different potentials is useful
in planning investment portfolios. (See section on soft systems
model).

Figure 7.1 FACTORS THAT INFLUENCE THE REALISTIC POTENTIAL IN ANY ONE SITE AT ANY ONE TIME
Context, e. g. interaction with strategy etc ýýý
Perception, motivation and training d
Nature, extent and quali external
tyof
and internal monitoring
(A,
j
Underlying technical conditions
--ý' = Influences
Perceived profitable opportunities now
Offensive/defensive spending decision
Site specific technical factors

Figure 7.2 SCHEME OF POTENTIALS
1. Potential achievable through invented techniques.
2. Potential achievable through innovated techniques.
Invention of new concepts increases 1.
Innovation of a technique increases 2.

Figure 7.3 CATEGORIES FOR CLASSIFYING ENERGY CONSERVING TECHNIQUES
Economic Not Economic
Invented but not innovated
Innovated
Retrofit
New plant
New processes

7.9 Measuring success or performance in energy management
We have seen the problems in objectively measuring potentials
for energy conserving capital equipment. These problems are directly related to those in another important area, defining
and measuring success in energy management. This topic has
not been discussed in the literature and simplistic measures
are frequently accepted without comment. The question of what
consistutes successful energy management is an"important offshoot
of understanding the process of technical change resulting in
energy conservation.
7.10 Specific energy for inter-site comparisons
As energy management, or conservation activity, results in a reduction of specific energy, i. e. energy per unit of output (ceteris paribus), specific energy or its reduction over time
may be thought of as suitable measures of success or performance. Remarks such as those recently made by Ministers) suggest this
may be accepted as a Government guideline.
As a measure for inter-site comparison single specific energy figures can only show a technical efficiency. No conclusions
about managerial effectiveness can be drawn from simple
comparisons of single specific energy because of the widely differing circumstances between sites and companies, even within the same industry. For example an old site with old plant in a bad lay-out (from an energy conservation point of view) will have
a higher specific energy than an up-to-date plant with more
1. See for example statement by Lord Avon reported in Energy Management, 1984

efficient plant. An example of this is given by two liquid
milk processing plants within the same group. One is five
years old and has a specific fuel consumption only one-fifth
that of a site, similar in output and product mix, which is
twenty years old. Smaller breweries have a higher average
specific energy consumption than larger breweries (Gordon,
1981). Thus no conclusions about managerial effectiveness can
be drawn from single specific energy figures.
7.11 Reduction in specific energy for inter-site comparisons
The reduction in specific energy achieved over time is often used
as an indicator of success in energy management. "Savings"
figures quoted in the press usually relate to unadjusted
reductions in specific energy. (The adjustments necessary to
make these figures valid are discussed later).
We have, however, seen that there are several valid reasons why
the realistic potential for energy conserving equipment and hence
conservation may vary from site to site. Thus the realistically
achievable reduction in specific energy will also vary from site
to site and using reduction in specific energy for making inter-
site comparisons is invalid.
7.12 Reduction in specific energy for in-site comparisons
Even as in-site measures of conservation activity specific energy
or its reduction over time suffer from several problems. Firstly
due to the existence of a base load (a fixed energy use represent-
ing a fixed cost specific energy varies with production level
or occupacity. A typical energy per output versus output curve
is shown in Figure 7.4. As Boland (1982) points out, this may
result in an increase in specific energy despite the implementation
of effective conservation measures.

Figure 7.4, TYPICAL ENERGY PER OUTPUT VERSUS OUTPUT CURVE
Energy per unit of Output (E/C)
r
Output (o) ý
This situation is shown in Figure 7,5, in which conservation
activities displace the energy per output curve from E1E1 to
E2E2. A reduction in output, however, from 01 to 02, increases
the recorded specific energy in the period being monitored from
(E/o) 1 to (E/o) 2.
Figure 7.5 EFFECT OF CONSERVATION ACTIVITY AT TIMES OF .r REDUCED OUTPUT
Energy per unit of output (k/o) -I- C
()2
cýa, `2
a1
L" I
E2
A
Output 02 01

Secondly, in a multi-product situation, specific energy varies
with product mix. Thirdly, where energy is used for space
heating, or as in malting where ambient air is used in combustion,
specific energy varies with season and climate due to variations in ambient air temperature. Fourthly, there are start-up and shut-down effects caused for example by the need to bring process
equipment up to a certain temperature before production can begin.
Finally, there can, in some processes, be yield effects. In the
distilling process, for example, an increase in the quantity of
water in. the incoming-grain increases the minimum energy necessary
to produce a litre of spirit. An effective energy management
system needs to correct for all these variances if management
efforts, and attempts at national reporting such as the Brewers'
Society surveys, are not to be misleading.
In the brewing sector only two sites out of fourteen corrected
specific energy for any of the variances mentioned above. of the
other twelve sites, nine used an uncorrected specific energy index
and three did not monitor specific energy. In the nine sites it was acknowledged that these variances occurred and factors such
as cold weather were considered before taking action when high
specific energy values occurred.
In the dairy sector two companies corrected for major variances
while four companies, covering nine sites, did not. Two other
companies did not use specific energy as an index.
In the distilling sector two companies, covering ten sites,
corrected for the variances using a computer based system.
Two other companies, covering sixteen sites, did not although one
was considering a computer based system. A major barrier was
seen as being the difficulty of deriving data from historical
records of energy use and production.
In the malting sector two companies, covering sites took account
of variances caused by ambient conditions in comparing specific
energy with targets.

A problem with specific energy for external analysts is that
not all sites calculate values for this parameter. The basic
data exists in the company records but the two sets of figures,
energy use and production, are not used to produce a ratio in all
companies. In one dairy this is because specific energy is not
regarded as a useful index, a cost based system is used instead,
In the brewery sites that did not report specific energy figures,
however, this reflects the poor quality of management information
systems. These sites were all small in production capacity.
Reduction in specific energy over time, usually in an uncorrected
form, is frequently used as a basis for reported "savings" and
by implication, performance. For comparisons in one site over
time it is a valid measure, subject to the corrections described
above, but as a means of comparing sites it is of limited use.
As we have seen there are several reasons why the achievable
potential for energy conservation equipment, and hence the
achievable reduction in specific energy, may vary between sites.
Simple comparisons of reduction in specific energy cannot take
these into account.
7.13 The Brewers' Society Index
In devising a targetting system for its industry, the Brewers'
Society recognised that specific energy is an inadequate measure
of individual brewery performance due to differing circumstances
between breweries. A means of taking account of some of these
differences was devised and is shown in Appendix 17.
An allowance, expressed in MJ/hl, is allocated to the particular
process used as shown and this sets a target figure for each
process. The total target figure for all brewing and packaging
is divided by the actual consumption to give the "usage efficiency".
The efficiency of fuel and electricity usage can be determined
separately. (A usage efficiency greater than 100% indicates a
performance better than the established target).

Although the Brewers' Society does take into account the use of different processes, it cannot consider the effects of different
vintages, different types of plants for the same basic process, different plant layouts, different profitability criteria or
other factors that affect the limits of viable conservation
activity. It also does not correct for variances caused by
occupacity, product mix, season or climate.
Gordon (1981) reports that the main variables affecting
consumption in a given plant are space heating and occupacity.
Other factors, such as the type of beer brewed or the range of
beer brewed, are "unlikely to be significant until the specific
energy fall below 2.0 MJ/hl or the usage efficiency exceeds
100%". (Gordon, 1981).
Gordon also shows how a simple linear regression exercise can be
used to correct for space heating and occupacity variances. As
we have seen however, such corrections are rarely made in practice.
7.14 Summary
The factors that affect the realistically achievable energy
conservation potentia, and hence the achievable reduction in
specific energy, mean that the use of reduction in specific
energy over time as a measure of inter-site comparison is invalid.
The fact that one site has achieved a reduction in specific energy
of 20% over the last five years does not necessarily mean that it
has better energy management than a site that has achieved a
reduction in specific energy of 10% over the last five years.
The realistically achievable potentials may have been different
in the two cases and, in fact, the second site may have exploited
a greater proportion of its achievable reduction than the first
site. Thus, it could be said to have better energy management.
In order to make valid judgements about the effectiveness of
energy management it is necessary to go beyond figures and
examine the company in-depth in a systematic way.

A company that is successful at energy management can be defined as one that has identified and exploited, or is in the
process of exploiting, its achievable energy conservation
potential.
Indicators of successful companies include: knowledge of
available energy saving techniques; evidence that these have
been evaluated in a "scientific" manner; well defined and
known investment criteria; evidence of systematic thinking;
a stock of evaluated but not viable projects; well developed
information and control systems; evidence of staff training
and a positive attitude towards energy conservation.

Chapter 'Eight
ESTIMATING INDUSTRY WIDE POTENTIALS
8.1 Introduction
After defining potentials for energy conserving capital equip-
ment on a site basis and describing the problems in measuring
them, it is necessary to raise the question of estimating industry wide potentials. It has been argued above that
potentials have to be defined on a site by site basis to
allow for site and company specific factors. This thesis,
however, set out to examine the potential for energy conserving
capital equipment in UK industries, implying industry wide
estimates are required. By defining potentials on a site
basis any estimate of industry wide potential becomes arbitrary.
This section examines some estimates of industry wide potentials,
compares them to the framework of potentials developed earlier,
and advances some estimates based on the surveys of the four
sectors.
8.2 Estimates of potential in the literature
The Energy Audit Series estimated technical potentials, with no
regard to commercial constraints, for total primary energy
conservation in inter-alia, the brewing, malting and dairy
sectors. The potentials reported are summarised in Table 8.1.
No similar estimate for the distilling sector is available.
The Energy Audit Series reports, according to their common
introduction, are "based on a detailed examination of the
processes involved and of manufacturing practice. " As no regard
is paid to commercial constraints, and the Series includes in some
cases techniques that at the time of writing had been invented but
not innovated, this potential is most akin to that available though
invented but not innovated techniques. It does not, however,
include all possible energy saving concepts but concentrates on
those that are under development.

Table 8-1 ESTIMATES OF THE TECHICAL POTENTIALS FOR ENERGY CONSERVATION IN THE BREWING, MALTING AND DAIRY SECTORS MADE IN THE ENERGY AUDIT SERIES
Total primary Primary energy energy used Saving Saving
Sector in base year Base Year
Potential potential (MGJ) (MGJ) as a%
Brewing 26.5 1976 8.76 33
Malting 9.8 1980 7.84 80
Dairy 28 1974/75 A 6.4 23
Sources: Harris, 1978,1979,1981.
Roberts (1983b) reports: "experience suggests that, starting from a
1983 base, the scope for saving probably stands at around the 30%
mark, divided almost equally between the three categories -
measures involving no capital cost, low cost and high costs".
Despite basing this claim on experience, the twenty cases cited by
Roberts, covering a range of industrial and commercial activities,
saved "only" between 5 and 22%, averaging 14%. No indication of
the time scales over which these savings were achieved is reported.
From these cases it appears that only some of the medium cost and
none of the high cost measures are being exploited, possibly because
they fail to meet economic criteria. The figure of 30% is arbitrary.
8.3 Estimates of potentials in the four. sectors
Using the data reported in Section One it is possible to make
informed estimates of the realistic potential for each sector.
The method is to examine the savings achieved by sites which have
had a well developed energy management programme for the last
five years. The average saving achieved over the period is
assumed to have been generally achievable over the period, i. e. form a realistic potential for the industry. In each sector some
sites are moving towards exploiting that potential while others have
yet to begin.

The potentials form a short term (say five years) potential
achievable using technically feasible and economically viable
techniques, mainly retrofits to existng plant. Each site of
course will have a different array of viable techniques because
of the site and company specific factors. A longer term
potential is derived from those sites that have invested in new
plant or greenfield sites.
The estimates for each potential, as well as the actual industry
achievement over the last five years where known, are summarised
in Table 8.2. The difference between the short term potential
and the industry achievement over the last five years gives some
indication of the slackness in the sector, or the take-up of
viable opportunities. The averages derived from the sampled
companies in dairy, distilling and malting sectors, are probably
higher than the actual industry averages because the sample of
interviewed companies was biased towards companies known to have
active energy management programmes.
These estimates are made ceteris paribus whereas in the time
scales envisaged both prices and the available techniques will
change, thus changing the potentials. These estimates may be
useful in providing targets for sites with no previous energy
management activities although they should not be lifted
wholesale. Target setting requires knowledge of the individual
plant and company characteristics as well as industry "norms".
8.4 Discussion
It has been argued that estimates of industry wide potential are
arbitrary. The estimates made here are also arbitrary but have
explicit assumptions. Concentrating on the realistic short term
potential, i. e. that achievable using existing hardware that is
at least economic in some sites, reduces the uncertainties inherent
in such estimates.

Table 8.2 ESTIMATES OF THE POTENTIALS IN THE FOUR SECTORS
Industry Sector Short term Long term achievement
potential potential over the (%) ($) last 5 years
Brewing 20 25 - 50 16.5 (1)
Dairy 20 25 - 50 14 (2)
Distilling 20 25 - 50 17 (2)
Malting 40 40 - 80 32 (2)
Notes:
All potentials are relative to 1978/79.
(1) An industry wide figure derived from the Brewers'
Society surveys.
Source: Energy Management, February 1984.
(2) Average figure for sampled companies.
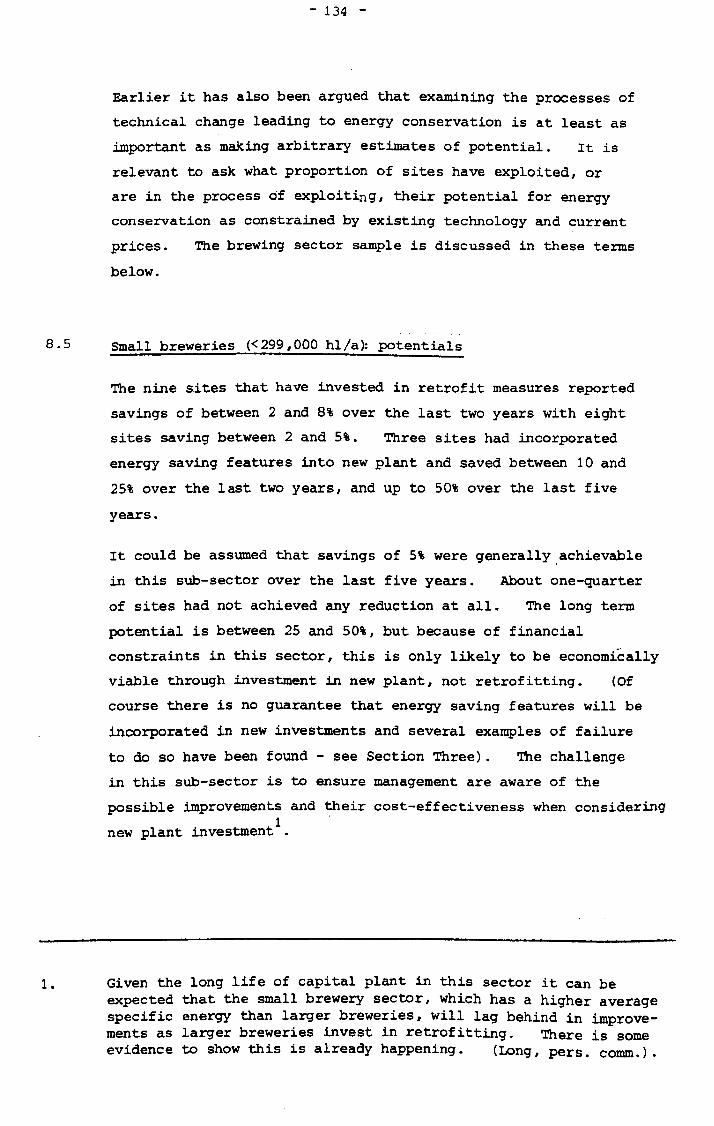
Earlier it has also been argued that examining the processes of
technical change leading to energy conservation is at least as
important as making arbitrary estimates of potential. It is
relevant to ask what proportion of sites have exploited, or
are in the process of exploiting, their potential for energy
conservation as constrained by existing technology and current
prices. The brewing sector sample is discussed in these terms
below.
8.5 Small breweries (<299,000 hl/a): potentials
The nine sites that have invested in retrofit measures reported
savings of between 2 and 8% over the last two years with eight
sites saving between 2 and 5%. Three sites had incorporated
energy saving features into new plant and saved between 10 and
25% over the last two years, and up to 50% over the last five
years.
new plant investmentl.
It could be assumed that savings of 5% were generally achievable
in this sub-sector over the last five years. About one-quarter
of sites had not achieved any reduction at all. The long term
potential is between 25 and 50%, but because of financial
constraints in this sector, this is only likely to be economically
viable through investment in new plant, not retrofitting. (Of
course there is no guarantee that energy saving features will be
incorporated in new investments and several examples of failure
to do so have been found - see Section Three). The challenge
in this sub-sector is to ensure management are aware of the
possible improvements and their cost-effectiveness when considering
1. Given the long life of capital plant in this sector it can be expected that the small brewery sector, which has a higher average specific energy than larger breweries, will lag behind in improve- ments as larger breweries invest in retrofitting. There is some evidence to show this is already happening. (Long, pers. comm. ).

8.6 Medium and Large Breweries (<300,000 h1/a}=potentials
About one-third of sites in these sub-sectors have had energy
management programmes over the last five years. Most of these
sites are at or near the limit of energy efficiency set by
available techniques, current prices and investment criteria.
They report difficulties finding projects that meet their
investment criteria. (This does not imply that they are at
an absolute limit. Creative thinking, willingness to innovate,
or simply questioning old assumptions can usually yield new
savings even in these sites). These sites have achieved
reductions in specific energy of between 10 and 60% over the
last five years with most saving 20 to 30%.
The remaining two-thirds of companies in these sub-sectors have
some form of energy management programme, which often has not
been established for five years. Many of these sites could, in
time, be expected to achieve their potential for energy conserv-
ation, ceteris paribus.
Overall in the brewing sector sample, about one-quarter of firms
could be said to have exploited their potential for energy
conservation over the last five years. About half of the firms
have some form of energy management and are likely to exploit it
in time. The remaining quarter, mainly small firms, are
making little or no progress towards achieving their potential.
The constraints in the small sub-sector may mean that the potential
can only be exploited through incorporating energy saving features
in new plant.
8.7 Summary
From the definitions of potentials it follows that any estimate of
industry wide potential will be arbitrary. The estimates of
potential presented for the four sectors are arbitrary but based
on the data reported in Section One. Estimtes of the
proportion of sites in the brewing sector that have exploited,
or are exploiting their potential, were also given. Objective

measurement of industry wide potentials is not possible; this
is an important result of this research. Any industry wide
estimates of potential must be viewed with caution.

Chapter Nine
A SOFT SYSTEMS MODEL OF ENERGY MANAGEMENT
9.1 Introduction
This section describes a soft systems model of management
activities necessary for exploiting profitable energy conserv-
ation opportunities in industrial firms. A soft systems
methodology, developed by Checkland (1976,1981), has been
used. This approach forces a structured debate rather than
producing a "hard" solution. The general model outlined
here is not to be taken as a "final development", nor as a
description of the real world, only as a starting point for
debate in specific companies. In describing the model real
world examples have only been used where necessary to illustrate
the need for certain activities.
Following the Checkland approach the model was developed after
extended observation of the real problem situation in several
companies, examination of the literature, and participation in
the energy management process in two companies. As stressed
in Checkland (1981), the model is a purely conceptual, logical
device and not meant to be a model of the real world. Insights
come from comparing the model with the outside world. The model
is shown in Figure 9.1 and deeper levels are shown in Figures
9.2 to 9.6.
In the thesis the model has two roles. Firstly it is an attempt
at presenting a logical, systematic model of the activities
necessary in an energy management programme. Secondly it is
used in Section Three to give a finer resolution in examining
real problems in energy management that reduce both energy
savings achieved and return on capital employed.

In industry energy management has become a recognised activity
but the nature and quality of this activity differs widely.
Much that has been written on "energy management" is concerned
with energy engineering rather than management. The model
described here represents an attempt to define the activities of
energy management. It is believed that the basic model is
applicable to the management of other resources, such as water,
which are likely to become increasingly expensive.
Three levels within energy management can be distinguished:
1. Good housekeeping which is concerned with running
existing plant in the most efficient manner.
2. Retrofitting which is concerned with the addition
of hardware designed primarily to save energy
onto existing plant; and
3. New equipment purchase which is concerned with
ensuring energy conservation is a factor in new
plant design and purchase decisions.
All three levels interact and are constrained by external (i. e.
external to energy management) factors. These interactions
will be described below.
9.11 The hierarchy of systems
It should be noted that the system modelled here fits into a
hierarchy of corporate systems and interacts with them at
various levels. In this model, for example, it is assumed
that the allocation of resources between offensive spending,
e. g. new product development, marketing campaigns, and
defensive spending, cost cutting on existing products and
processes, is a given factor. Success in energy conservation
may lead to a change of this allocation in the absence of other,
more attractive projects. Alternatively of course, a reduction
in available resources will affect the amounts available for
defensive spending such as energy conservation.

9.3 System objective
In soft systems the objective is not clearly defined. The
soft. systems methodology starts from a Root Definition of the
problem, based on rich observation of the problem situation.
The following Root Definition was selected:
to design a management system for an industrial
company that encourages staff and other agents
of change to create, identify and exploit energy
conservation investment opportunities that are
profitable to the firm, subject to constraints.
Checkland (1981) uses the mnemonic CATWOE to check for well
formed Root Definitions. The five elements in this example
are:
Customers; the company
Actors; the staff Of the company and other agents of change,
for example consultants and government agents.
Transformations; information and other resources are
transformed into action that exploits profitable energy
conservation investments.
Ownership of the problem; the company
Environmental constraints; although not made explicit in
the definition their existence is recognised. Possible
constraints include investment finance, expertise and
the risk levels the company is willing to accept.
Added to the five elements above, but not explicit in the Root
Definition is a Weltanschauung, "an outlook, framework or image
which makes a particular Root Definition meaningful" (Checkland,
1981). in this case the outlook is that exploiting profitable
energy conservation opportunities is a desirable activity.

9.4 The activities in the model
We now consider the activities in the systems model shown in
Figure 9.1. Each level of energy management activities will be considered in turn.
9. $. 4 Good housekeeping level
An internal monitoring system is necessary to gather data on
energy usage and costs. The data has to be processed into
information that is useful to decision makers and delivered to
them in time for them to take effective action. To be a guide for action energy usages and costs have to be broken down to
answer the question, where is the cost being incurred? As
Drucker (1964) says, "it is impossible to manage an aggregate. "
The breakdown of energy costs into cost centres is advocated by
Hewgill et al (1979), Murphy and McKay (1982) and Roberts (1983).
This requires more extensive metering than is common at present,
a topic discussed in a later section.
In order to be meaningful current energy consumptions must be
compared with targets or budget figures. This is stressed in
Jacques (1981), Roberts (1983) and Finer (1984). For effective
good housekeeping variances must be identified quickly by the
decision maker with control over the cost centre. Then, the
cause of the variance can be identified and appropriate action
taken (which may in fact be no action if the costs of action are
judged greater than the benefits).
9.4.2 Investment levels (retro-f it and new plant)
The information system described above is also necessary at the
level of retrofit investments. Clear targets are acceptable
proxies for economic "optima" that are unknowable and constantly
shifting as prices and technology change. Well chosen targets
also act as a clear policy guide and a stimulus to action, i. e.
tney motivate. The selection of overall and cost-centre targets,

given the effects of climatic, seasonal, production and product mix variances faced by most companies is a difficult task rarely addressed as was shown earlier in Section 2.
To identify or create investment possibilities requires information
about energy costs coupled with a knowledge of "relevant" technical
concepts. Creativity may redefine what is relevant, and the use
of creativity techniques may be helpful at this stage. A
creative synthesis of internal and external information is
necessary.
The process of technical change as already described suggests
that an explicit decision on the appropriate level of innovation
is necessary. For a firm willing and able to innovate in the
energy conservation field the appropriate stage may be pre-
prototype. For other, more common companies with less resources,
the appropriate level may be simple adaptation of already
innovated techniques.
Once potential opportunities are identified they must be
appraised technically, economically and contextually. These
appraisals interact in an iterative process (see section on
technical change) which may itself lead to new ideas. The
contextual evaluation is often neglected (see Section Three
for example). There is often an excessive concentration on
hardware to the detriment of managerial, organisational and
training "software".
Both hardware and software must fit on all relevant levels.
Engineers who design, specify or install the hardware need to
understand it; maintenance staff need to be able to maintain
it; and operators need to be able to operate it. Although
these points seem obvious they appear to be often forgotten
in project appraisal. Any training or use of an outside resource
that is necessary is an additional cost that should be considered
at the investment appraisal stage. Social costs, either internal
or external to the company, may also need to be considered, e. g.

noise, vibration or emissions. Other dimensions of contextual
evaluations include deciding whether a project fits with
corporate strategyl marketing strategy, and personnel policies.
Interactions between technical, contextual and economic eval- uations suggest that the overall "adoption" decision is more
complex than simple linear models imply. Even Baker (1983),
dealing as he does with a single adoption decision, does not do justice to the complexity of the process.
Energy conservation investments can interact with each other and
with process plant or operational changes. Such interactions,
which can be synergistic or negatively synergistic, need to be
anticipated in the evaluation/design stage to ensure investment
returns, and energy savings, are maximised. Examples of inter-
actions are discussed in Section Three.
Interactions between projects and the scarcity of capital in most
firms suggests that assembling a portfolio of possible projects
would be a useful activity. If insufficient resources are
available for both of two synergistic projects in one period
they could be phased with full benefits coming after the second
project. Assembly of a portfolio would also make checking for
negative or positive synergy explicit and allow marginal projects to be easily reassessed as conditions change.
Any investment in energy conserving- plant will affect energy
consumptions and costs and possibly necessitate retargetting for
the cost centre involved. Any corporate plan should be
assessed for energy implications. Constraints such as fuel
use limits (common for industrial gas users in the early 1980s)
or boiler capacity may exist. The provision of new boiler
capacity, which requires substantial planning time and capital,
may affect the viability of a corporate plan.
Alternatively, plans to reduce capacity could lessen the
attractiveness of energy conservation investments. There
would be little point investing heavily in energy conservation in a plant that was due for closure within a short period. These interactions suggest a need for a corporate energy plan or policy.

Choice of basic process technologies affect the range of
viable conservation investment opportunities. There is a
need for a technology policy as advocated by Pappas (1984).
The status and relevance of developing technologies, both in
production and ancillary activities (e. g. heating and
ventilating) and both in retrofit and new equipment, need to
be reviewed regularly so that they can be considered as
investment opportunities at an appropriate stage of their
development.

- 144 -
., ý
aý ý ý tr .1 w

Figure 9.2 SUB-SYSTEM FOR GOOD HOUSEKEEPING LEVEL
Establish monitoring system
ý Compare usage against targets
Find causes of variances
Generate solutions
Assess costs and benefits
Decide on action

Figure 9.3 SUB-SYSTEM FOR IDENTIFYING RETROFIT INVESTMENT OPPORTUNITIES
Evaluate technology,
economics and context

Figure 9.4 SUB-SYSTEM FOR EVALUATION STAGE
Modify proposals
Decide go/nogo Nogo
Identify possible investment opportunities
Search for interactions (a) technological (b) economic (c) contextual

Figure 9.5 SUB-SYSTEM FOR NEW INVESTMENTS
Identify ways of incorporating energy conservation into
new plant
ý Evaluate technology
economics, and context

Figure 9.6 SUB-SYSTEM FOR ACTIVELY DEVELOPING NEW TECHNIQUES
Search for. or create relevant ideas or developing techniques
ý Evaluate technology,
I economics and context
Compare proposals to criteria
p
Nogo Decide go/nogo
Go
Develop and implement
Decide on appropriate level of R, D&D
Establish investment criteria

9.5 Summary
A soft systems model of the management activities necessary
for exploiting a company's energy conservation potential has
been presented. It is necessary to examine the nature of
energy management as its presence is the major mechanism of
change resulting in energy conservation. Without some form
of energy management conservation, opportunities will not be
exploited however profitable they are.
The soft systems methodology develops models that should be
taken as starting points for discussion rather than final
solutions. This model is no exception.
The activities within the model are on three levels: good
housekeeping, retro-fit projects onto existing plant, and new
plant investment. All three interact. Monitoring of energy
costs and consumptions is vital to all three levels. The
basic process is to monitor, establish targets and identify or
create possible conservation measures. These are then
subjected to technical, economic and contextual evaluation and
developed from concepts through final design to implementation.
The process has many feedbacks and interactions.
This soft systems model, although developed for energy manage-
ment, could profitably be adapted to the management of general
technical change.

SUMMARY OF SECTION TWO
Section Two has necessarily been wide ranging. It started with a model
of the process of technical change which results in energy conservation.
Most works on technical change have concentrated on large scale innovations whereas most energy conservation, and indeed probably most
technical change, is in the form of incremental improvements. Similarities
between the technical change model and Baker's (1983) model of buying
behaviour and Asimow's (1962) model of the design process were highlighted.
The process of technical change is essentially a design process.
The importance of adaptability in the adoption of techniques was stressed.
Site specific factors ensure that economic viability in one site does not
ensure viability in another, ostensibly similar, site. This has important
consequences for defining potentials for energy conserving equipment as
well as casting doubts on the usefulness of diffusion studies. At each
site, even for techniques using standard hardware, site specific factors
must be considered in order to engineer a system that will meet the
required profitability criteria.
The model of technical change was used in order to define potentials for
energy conserving equipment on a site by site basis. One potential
involves techniques that have been invented, techniques which can be for
retrofitting, new production techniques using the same basic. -process, or for new processes. A sub-set of this potential is the potential utilising techniques that have been innovated, i. e. commercially installed. This
can also be divided into the potentials due to retrofit, new plant and new
process techniques. Both these potentials can be conceived as being
either economic, or non-economic, as defined by the particular company.
It was argued that only the economic, as defined by the company, potential
can be regarded as "real". Any other definition would encourage sub-
optimisation.
Reasons why real potentials may differ between sites were advanced.
Apart from the site specificness of economic viability the reasons are:

1. Differences in financial criteria
2. Differences in context, e. g. strategy
3. Differences in historical performance in exploiting energy
conservation opportunities.
4. Differences in the level of innovation that will be attempted.
Given these reasons why potentials may differ between sites, it is
hardly surprising there may be differences in performance as measured
by reported reductions in specific energy.
The problems of measuring potentials for energy conserving equipment
were discussed. It was argued that to measure them would require an
extensive engineering exercise with cost benefit analysis of all
possible techniques. This would be an extended version of the energy
audits, sometimes! undertaken".! as part of an energy management programme.
The cost in money and time of gathering information at the level needed
to measure potentials mean that it is unlikely to be undertaken by
companies. Considering which potentials different techniques fall into
at particular sites, however, could be a useful activity for management
and other agents of change.
The issues involved in measuring potentials are related to those
involved in measuring success in energy management. Commonly quoted
measures used to imply success, including the reduction in specific energy
utilisation used in Section One, were shown to be simplistic. Single
measures or ratios cannot be used to imply managerial success without
consideration of many relevant factors such as
site characteristics
site history
financial investment criteria
context
appropriate level of innovation.
Each site considered in simple comparisons may be at different stages of
the development of energy management structures and techniques.

Given the definitions of potentials on a site basis any attempt at
estimating industry wide potentials can be seen to be arbitrary.
Estimates from the literature were reviewed. Using the data from the
sampled companies in the four sectors, estimates of industry wide
potentials were made. These are recognised as being arbitrary but are
at least based on explicit assumptions. The arbitrary nature of
industry wide estimates is an important conclusion of this research.
Finally, a soft systems model of the activities necessary to exploit
profitable energy conservation opportunities was presented. This is
based on both the model of technical change and extended observation
of the real world problem situation. This model was advanced for two
reasons; it is a prescriptive guide for management designing energy
management systems, and it serves as a diagnostic tool for examining
problems within energy management which are discussed in Section
Three.

REFERENCES: Section Two
ADDY, M (1983) Sense and nonsense in heat recovery Energy Manager, April 1983
ASIMOW, M (1962) Introduction to design
Prentice-Hall Inc, Englewood Cliffs, N. J.
BAKER, MJ (1983) Market development Penguin, Harmondsworth, Middlesex
BEIJDORFF, AF (1979) Energy efficiency Group Planning, Shell International Petroleum Company, London
BELLIZZI, JA (1981) Organisational size and buying influences Industrial Marketing Management, vol. 10, no. 1, February 1981
BOLAND, D (1982) Monitoring and planning of energy conservation Paper presented at the Institution of Chemical Engineers Continuing Education Course, "Energy Management in the Process Industries", held at the University of Sheffield, 20-23 April 1982
BOYLAN, MG (1977) Reported economic effects of technological change in Research, technological change, and economic analysis, ed. B Gold, Lexington Books, Lexington Mass.
BRADBURY, FR (1978) The Leverhulme Project at Stirling in technology transfer: implications for the Scottish Economy TERU Discussion Paper No. 14, Proceedings of Conference held at the University of Stirling, 17 and 18 October 1978.
CHDCKLAND, PB (1976) Towards a systems-based methodology for real- world problem solving. in Systems Behaviour, eds. Beishon, J and Peters, G. Open University Press
CHECK LAND, PB (1981) Systems thinking, systems practice. John Wiley & Sons, Chichester.
DAVIES, S (1979) The diffusion of process innovations. Cambridge University Press.
GORDON, RW (1981) Energy utilisation in breweries Paper presented at European Brewing Congress, 1981
GRAY, K et al (1981) Economisers for modern boilers. Jnl. of Institute of Energy, vol. , no. , September 1981
HEWGILL, J, JACQUES, J K, LAM, SS and SWENSON, FR (1979) A study of the feasibility of energy costing and energy accounting models for management TERU Discussion Paper No. 15, University of Stirling.
JACQUES, JK (1981) Investment decisions and energy conservation within the firm TERU Discussion Paper No. 28, University of Stirling
JACQUES, JK and WOOD, J (1982a) Energy consultants: an appreciation TERU Discussion Paper No. 32, University of Stirling
JOHNSON, WJ and BONOMA, TV (1981) Purchase process for capital equipment and services Industrial Marketing Management, vol. 10, no. 4, October 1981
LANGRISH, J (1979) The effects of technological change in Industrial Innovation: technology, policy and diffusion ed. M Baker, Macmillan, London
MANSFIELD, E (1968) The economics of technical change Norton
MISSIONS, D (1982) Heat recovery: the role of the specialist contractor Jnl. of Heat Recovery Systems, vol. 2, No. 1.
MURPHY, WR and McKAY, G (1981) Energy management Butterworths, Sevenoaks, Kent
PAPPAS, C (1984) Strategic management of technology Jnl. of Product Innovation Management, Vol. 1,1984
PAYNE, GA (1984) Managing energy in commerce and industry Butterworths, London
ROBERTS, MC (1983a) The key principles of energy management Presented to the Institution of Chemical Engineers Continuing Education Course, "Energy Management in the Process Industries", University of Sheffield, 19 - 22 April 1983
ROBERTS, MC (1983b) Energetic ways to cut costs Management Today, May 1983
ROGERS, EM (1962) Diffusion of innovations Free Press, New York
ROSENBERG, N (1982) Inside the black box: technology and economics Cambridge University Press
SCHMIDT-TIEDMANNS, KJ (1983) A new model of the innovation process Research Manage, emt, March 1982, Vol. XXV, No. 2.
SIMON, HA (1975) A student's introduction to engineering design. Pergamon, oxford.

TURNER, JF (1982) Waste heat recovery sustems NIFES, Glasgow. A lecture given to Stirling Energy Managers Group.
WIND, Y ROBERTSON, TS and FRASER, C (1982) Industrial project diffusion by market segmentation. Industrial Marketing Management, Vol. 11, No. 1, February 1982.
9

Section Three
BARRIERS TO FURTHER CHANGE

SECTION THREE
BARRIERS TO ENERGY CONSERVATION INVESTMENT
INTRODUCTION
The barriers to energy conservation investment can be divided into
two categories:
(a) techno-economic
(b) managerial
The term techno-economic is used as there are rarely purely
technical barriers to applying existing equipment, the problems
come when technical factors cause failure to meet the required
economic return, hence preventing investment. Managerial
barriers include all aspects of management that prevent invest-
ment in profitable opportunities.
Profitability modelling is used to explore economic barriers for
a number of techniques. Heat pumps and combined heat and power
(CHP) are two techniques that have received much attention in
the literature and in industry. Although CHP has long been
established recent changes in technology and legislation concern-
ing private generation of electricity merit renewed interest.
Heat pumps are an old concept but are a fairly recent innovation.
As far as the four sectors studied are concerned they have not yet
been widely adopted. The other techniques for which profitability
modelling is conducted have all been applied in the sampled
companies in the four sectors.
It was stressed in both the previous sections that the profitability
of energy conservation techniques is sensitive to site specific factors. The profitability modelling of heat pumps and CHP is
based on specific sites while for the other techniques it is more
general, although still based on practical examples.

The majority of this section is concerned with managerial barriers
because of the site specificness of profitability. Without some
form of energy management activity the profitability of techniques
will not even be evaluated and so it is considered that managerial
barriers are more important than economic barriers. The soft
systems model of management activities necessary in energy manage-
ment advanced in Section Two is used to explore examples of different
categories of management problems discovered in the sampled companies
and in the literature.
TECHTO-ECONOMIC BARRIERS
The profitability of two major techniques, heat pumps and combined
heat and power are modelled for specific applications in the next
two chapters. The purpose of this modelling is to explore which
potential the techniques fall into. As yet these techniques have
not been widely adopted in the four sectors studied. Although
concentrating on the profitability issue, these chapters also
address other problems likely to impede the adoption of these
particular techniques. Brief technical descriptions of the
techniques are contained in two technical appendices. A third
chapter examines the profitability of other, more widely adopted
techniques.

Chapter Ten
HEAT PUMPS FOR HEAT RECOVERY IN THE BREWING AND DAIRY SECTOR
10.1 Introduction
The heat pump, the invention of one form of which is generally
attributed to Lord Kelvin, is thermodynamically identical to the
household refrigerator. The principle difference between the
heat pump and the refrigerator is in the role they play as far as
the user is concerned. On the one hand refrigerators (and air
conditioners which work on the same principle), provide useful
cooling, whereas the heat pump provides useful heat
Heat pumps should be contrasted with conventional heat exhange
or recovery. The second Law of Thermodynamics requires that
heat flows down a temperature gradient. It can only be made
to flow up a temperature gradient by the input of work and it
is this principle that the heat pump is based on.
Figure 10.1 shows the two cases. In 1. a, normal heat exchange,
heat (Q) flows down the temperature gradient from a hot source
at temperature T1, to a cool sink (temperature T2). In 1. b
heat, Q, is pumped from a cool source (at temperature T2) to a
hot sink at temperature T1, through the input of work (W).
Conventional heat recovery utilises normal heat exchange while
heat pumps reverse the normal flow of heat.

- 160 -
Figure 10.1 HEAT EXCHANGE AND HEAT PUMPING
l. a Heat Exchange
l. b Heat pumping
6000 SOURCE T1
Heat flow, Q
. 00 e INY. ý" 4
0S .S INY. /" I.
.W
T2
Work, W
T1 > T2

Early practical machines were built in the 1930s but widespread
interest in heat pumps had to await the oil price rises of the
1970s. Technical descriptions are given in Technical Appendix 1
and a full history of the development of heat pumps, as well as
expositions on the technical principles can be found in the
literature, particularly Reay and Macmichael (1979) and von Cube
and Stienle (1981).
This Chapter explores the profitability of using heat pumps for
industrial heat recovery, particularly in the brewing and dairy
sectors. Market forcasts for industrial heat pumps are reviewed
and compared to the current state of the market. The profitability
of eighteen proposed installations in the brewing and dairy sectors
is modelled. Sensitivity, analysis is used to explore the
conditions under which these installations would become viable
investments under criteria commonly used in the two sectors.
Heat pumps are mentioned in several contexts in Leach (1979) and
appear to be a favoured technology of the low energy strategists
because of the savings in primary energy they can, in the right
circumstances, produce. Heat pumps for commercial building
space conditioning are rapidly spreading and for new buildings
where both heating and cooling are required, they are now a very
attractive option (Electricity Council). Their use is also viable in renovations of existing buildings (Energy Manager, Feb. 1984).
This particular market segment need concern us no further as it is
not an industrial market. The same applies to domestic heat
pumps, a market which is static at present (H &V News, 7 Jan. 1984).
Market forecasts for industrial heat pumps show large potential
markets. Masters, Pearson and Read (1980) estimate that heat
pumps could supply 20% of total industrial heat demand. Currie
(1982) estimates that industrial heat pumps could save 600,000 tonnes
of coal equivalent per annum. Making an assumption that these
machines had an average Performance Effectiveness Ratio (PER, see
Technical Appendix 1 for definition) of 2.0, Currie's estimate is one-fifth of that made by Masters et al, or about 4% of total
industrial heat demand.

To date (August 1984) there have been three installations in
the malting sector, two in the dairy sector, none in brewing,
one in textiles (Linnell, 1983), a grand total of six
installations for heat recovery excluding drying. The market
forecasts lack segmentation and are suspect for that reason
alone. A supplier of heat pump systems indicated that the
brewery and dairy sectors were considered major markets and have
been the focus of unsuccessful heavy selling attention. As
these were two of the four sectors under investigation it was
decided to research this apparent mismatch between market
expectations and current market realities. The objects have
been threefold: to investigate the profitability of heat pumps
in these sectors in order to explain this gap between expectations
and realities; to give advice to potential adopters in this sector;
amd to see if there is a real market for heat pumps in these
sectors.
10.2 Method
As the market forecasts had not considered the profitability of
heat pumps from the investor's viewpoint and profitability is a
major factor in adoption decisions, it was decided to model the
economics of a range of individual proposed installations.
Technical data concerning eighteen proposed installations in the
brewing and dairy sectors was obtained from a supplier of heat
pump systems. This data was gained from actual site measurements
and the descriptions and characteristics are summarised in
Appendix 18. Figures for the technical performance ratios
(discussed in Technical Appendix 1) at various temperature
differentials were obtained from the literature and are shown in
Appendix 19. The temperature differentials between load source
in Appendix 18 were used with the data in Appendix 19 to derive
a Performance Effectiveness Ratio (PER). This, when combined
with capital cost data (given by the supplier) and energy prices,
can be used to calculate the profitability of an installation.

It can be shown that the annual financial savings due to energy
saving alone resulting from a heat pump installation by the
equation:
Savings = Utilisation x Output x Cost of heat
_ Cost of
(p/yr) (hrs/yr) (kW) replaced energy used PER
(p/kWh)
Source: Masters et al, 1980
10.3
This, it should be noted, is simply the savings due to energy savings.
Any water savings, which are possible in some installations which are
discussed below, will be additional savings. Any other running costs,
notably maintenance, are also not included in the above equation.
From the annual savings and capital cost the profitability, either in
terms of simple payback or Internal Rate of Return (IRR), can easily
be calculated. This was done for all eighteen proposed installations
using a computer program which allowed rapid sensitivity analysis.
For each installation both gas-engine and electrically driven heat
pumps were analysed. A full factor sensitivity analysis for one
proposed installation, for both gas engine and electrically driven
machines, was carried out.
The computer program was validated against the two actual dairy
installations and three quotations for heat pump systems received
by breweries in the sample of companies in this sector. A good
agreement between the program results and the actual cases was
reached.
Computer program assumptions
The following assumptions were made in the computer program:
1. Financial savings are due to energy savings alone.
2. Cost of maintenance for a gas engine heat pump =
0.2p/kWh shaft energy generated.
3. Cost of maintenance for electric heat pump = 0.004 x heat pump cost per annum.

4. Efficiency of boiler and existing heat distribution = 80%.
5. Efficiency of electrical . use in an electric heat pump
motor = 100%.
6. Total system cost = 1.5 times heat pump cost.
The figures in assumptions 2 and 3 are taken from Masters et al
(1980). They are projections from experience with experimental
systems. Boiler systems typically run at 80 to 85% efficiency
at full load (Payne, 1984) and a figure of 80% allows for
distribution losses. Any reduction in this figure would increase
the cost of the heat to be replaced and hence increase the
attractiveness of a heat pump system. The efficiency of electric
motors approaches 100% at full load but diminishes at part-load.
Any reduction in this figure to allow for part-load running will
increase the cost of heat delivered by the heat pump system.
Kew (1982) states that system cost is typically 1.5 times the
heat pump cost. Other estimates are up to three times the heat
pump cost, a figure in line with that for conventional heat
recovery where system cost is typically three times the heat
exchanger cost (Cooper, personal communication 1983; Addy, 1983).
10.4_ The use of the payback criterion and Internal Rate of Return
The payback periods given in the general results are simple pre-
tax paybacks. Although payback is less than ideal as a means of
project appraisal, it is still widely used in practice. It is
adequate as a rough filter prior to the use of discounted cash
flow (DCF) techniques such as Internal Rate of Return (IRR) and
Net Present Value (NPV). Most UK companies visited during
research and consultancy (about 200 in all between 1981 and 1984)
use a simple payback criterion of two years for cost saving
measures (relating to retrofitted equipment). This finding is
in line with those of the Advisory Committee on Energy Conserv-
ation (Department of Energy, 1976) and Jacques and Wood (1982).
(See Section one discussing investment criteria in the four
sectors).

For cases where the payback period is less than ten years and
in the sensitivity analysis on one installation, the Internal
Rate of Return has been calculated using the following standard
assumptions: ten-year lifetime; 75% first year capital
allowance; 50% tax rate; one year tax lag; no balancing
charges; and a company with sufficient profit to benefit from
allowances. The capital allowances are those outlined in the
1984 Budget for financial year 1984/85.
A ten year life has been used as a standard throughout the
thesis but it should be noted that when retrofitting to existing
plant, five years may be more appropriate. Use of a five year
life severely reduces Internal Rate of Return when compared to a
ten year lifetime.
10.5 Base Case Assumptions
Payback periods for all eighteen proposed installations were
calculated using the following base case assumptions:
Gas price (p/therm) 30
Electricity price (p/kWh) 3.5
Fuel replaced price (p/therm) 30 to 48
Utilisation (hours/year) 2,500
Capital cost (£/kW):
Gas engine machines 120 electrically driven machines 60
The gas and electricity prices given were the average gross prices
in the UK in July 1983 (Energy Manager). A fuel replaced price of
30p/therm is equivalent to gas and 48p/therm is equivalent to the
average UK price of 3,500 second oil, a common industrial fuel.
A utilisation base case of 4,500 hours was originally used but
discussions with potential adopters suggested this was too high.
It corresponds to 12 hours continuous operation 365 days a year
while 2,500 hours corresponds to 6.8 hours of continuous operation
365 days a year. Most of the processes involved are batch oper-
ations and will not be operating continuously.

The capital costs used, £120/kW for gas engine machines, and
£60/kW for electrically driven machines, are the mid-points of
the ranges given by the supplier, £80 to £200/kW for gas engine
machines and £40 to £80/kW for electrically driven machines.
Capital costs for heat pump systems are very dependent on a
number of site specific features and thus the profitability
modelling is somewhat general. Actual capital costs can only
be determined after quotations, based on extensive engineering
analyses, are obtained for specific applications. The modelling
does, however, show the conditions that need to be achieved for
viability and indicates the questions potential adopters should
ask in their investment appraisals.
10.6 General results
The payback periods of the eighteen proposed installations, under
the base case prices and at both 2,500 and 4,500 hours utilisation
are shown in Figures 10.2 and 10.3.
For a fuel replaced price of 30p/therm, neither a gas engine machine
using gas at 30p/therm nor an electric machine using electricity at
3.5p/kWh can produce better than a ten year payback period in any
site, at either utilisation. Thus the proposed installations are
not viable if the replaced fuel is gas at 30p/therm.
At a replaced fuel price of 48p/therm, a gas price of 30p/therm
and a utilisation of 2,500 hours, the paybacks of the gas engine
options fall between 6 and 8 years, giving IRRs of between 3 and
13%. For the same price conditions at a utilisation of 4,500 hours
the payback periods fall between 3 and 5 years, giving IRRs of
between 14 and 21%. Under these conditions, which correspond to
replacing heavy fuel oil, and as we have seen a utilisation
considered high, the proposed installations begin to look marginal.
If water saving can be obtained at little or no extra capital cost,
they may become viable under the two year payback rule.

For the electrically powered options, an electricity price of
3.5p/kWh, a fuel replaced price of 48p/therm and a utilisation
of 2,500 hours, the paybacks fall between four and ten + years.
Corresponding IRRs are <1% to 16%. Under the same price
conditions at a utilisation of 4,500 hours the paybacks are
2 to 10+ years, giving IRRs between <1% and 34%. Twelve of
the proposals have a payback period under five years with these
conditions, while at the lower utilisation only three met this
criteria.
From these results it can be seen that the proposed installations
only become, at best marginal, for replacing fuel at 48p/therm.
At the fuel prices current at the time of the analysis (July
1983) this corresponds to the price of heavy fuel oil (HFO,
3,500 second viscosity). At fuel replaced prices above this,
more of the proposed installations will become viable. For the
gas engine options the question of fuel switching must be raised.
If gas is available for use in a heat pump why can't it be used
to supply heat to the process in question, either directly or
indirectly. There may be constraints or gas availability but
if there are not, then fuel switching is likely to be an easier,
less risky investment than a heat pump. with a higher return.
The electrically driven options that look marginal suggest that
they would become viable for replacing oil at more than 48p/therm.
Again, the question of fuel switching must be raised. If gas is
not available, or only available at a high capital cost (as in
the case when the Gas Board requires a contribution to laying a
new main), then an electric heat pump may be viable for replacing
oil fired heat if a high utilisation can be achieved.

10.7 Sensitivity analysis'
One of the eighteen proposed installations was subjected to
sensitivity analysis. The installation chosen had a payback
of 6.2 years in the base case. Its characteristics are as
follows:
Output 160 kW
GT/load-source 30°C
PERS :
Electric machine 3.1 Gas engine
driven machine 1.5
10.7.1 Capital cost factor: V
For the gas engine driven option the specific capital cost per kW
was varied from £80 to £200, the range of costs given by the
supplier. As shown in Table 10.1, at a gas price and a fuel
replaced price of 30p/therm, the payback period throughout the
range of specific capital costs was greater than twelve years.
At a gas price of 30p/therm and a fuel replaced price of 48p/
therm, the payback periods varied from 4.2 to 10.4 years,
equivalent to IRRs between <1 and 16%. This result confirms
the general result that investments using gas engine driven
machines are only likely to be viable at a gas price of 30p/therm
if the fuel replaced price is 48p/therm. At these prices and a
capital cost of £80/kW, the lowest end of the range given by the
supplier, the installation has a payback of 4.2 years which is
marginal but not viable. If water recovery were possible it may
make the installation viable.
For the electrically driven option the specific capital cost was
varied between £40 and £80/kW, again the range given by the
supplier. Table 10.. 2 shows that at an electricity price of 3.5p/
kWh and a fuel replaced price of 30p/therm the paybacks are all
greater than 30 years. At an electricity price of 48p/therm the
paybacks vary from 2.9 to 5.8 years, equivalent to IRRs between
9 and 27%. Thus, the base case cost assumption of £60/kW and below make the investment marginal under these prices.

Figure 10.2 PROPOSED GAS ENGINE HEAT PUMP INSTALLATIONS - PAYBACK PERIODS
Gas price = 30p/therm Gas price = 30p/therm Fuel Replaced price = 30p/therm Fuel replaced price = 48p/therm Utilisation = 2,500 hours Utilisation = 2,500 hours
18 17 16 15
N14 ö13 ý12 0
1 411 b10 g Vl
ý
W 0
8ý 7 6 5 4 3 2 1 0
ö z
r--,
0- 1- 2- 3- 4- 5- 6- 7- 8- 9- 10+ C? 9 1-0 25 39 49 5.9 6.9 7.9 89 99
Payback Period (yrs)
18, 17. 16: 15:
N 14
813 ý 12 :4 11 ý10 J. ) g N C8 ". 4
w 0
O Z
7 6 5 4 3 2 1 C
r---,
ý
urIIr 0- 1- 2- 3- 4- 5- 6- 7- 8- 9- 10+ 09 LU 29 3.9 4.9 59 6.9 79 89 99
Payback period (yrs)
Gas price = 30p/therm Gas price = 30p/therm Fuel replaced price = 30p/ther, Fuel replaced price = 48p/therm Utilisation = 4,500 hours Utilisation = 4,500 hours
18 17. 16. 15.
y14 0013. "412
, bl 1 ý10
9 8
7 0 6. ý5 z4
3 2 1
0 ý
ýý 18 17 16 is- 14.
013 12
,ail ý10
9 ý c8 ..., w
6. ý ö5 Z4
3 2 1 0
"--_"
I-III(
0- 1- 2- 3- 4- 5- 6- 7- 8- 9- 10+ 0- 1- 2- 3- 4- 5- 6- 7- 8- 9- 10+ 091.92939495969798999 0.9192939495969798999
Payback period (yrs) Payback period (yrs)

Figure 10.3 "
PROPOSED ELECTRICALLY DRIVEN HEAT PUMP INSTALLATION - PAYBACK PERIODS
Electricity Price = 3.5p/kWh Fuel replaced price = 30p/therm Utilisation = 2,500 hours
18 17 16 15
N14 13 12
. ro11
10 g
C8 ý
w7 06 ö5 Z4
3 2 i.
ýý
09 LU 29 39 49 59 6.9 79 8.9 99 Payback period (yrs)
Electricity Price = 3.5p/kWh Fuel replaced price = 30p/therm Utilisation = 4,500 hours
lE 17 16 15 14
G13
. °12
ý10 ý9 UI ö ý
.., 7a w6 0
5
z4 3 2 1
1--l
09 1.9 29 39 4.9 -5.9 6.9 7.9 39 99 Payback period (yrs)
Electricity Price = 3.5p/kWh Fuel replaced price = 48p/therm Utilisation = 2,500 hours
18 17 16 15.
N14 013
41 12
, 011
SO g 8
4
W7 o 6.
5. z4
3 2 1 0
ýý
. _.. r---,
ý- --- 9- 10 019 19 29 39 49 59 69 79 89 99
Payback period (yrs)
Electricity Price = 3.5p/kWh Fuel replaced price = 48p/therm Utilisation
18 17 16 15
y14 013. y12
, ý11
,j 10 I
.ý8 w7 06
öS z4
3 2 ,ý
r--ý
r--,
. -ý
4 I 500 hours
- 9-110+ C9 19 29 39 49 59 69 79 89 92
Payback period (yrs)

Heat pump installation sensitivity analysis
Variable factor: capital cost per kW of output (£/kw)
Table 10.1 GAS ENGINE MACHINE
Gas price (p/therm) Fuel replaced price (p/therm)
30 30
30 48
Cost (E/kW) System Cost (E) Payback IRR Payback IRR
(yrs) (%) (yrs) ($)
80 19,200 12.4 - 4.2 16
120 28,800 18.6 - 6.2 8
160 38,400 24.8 - 8.3 3
200 48,000 31.0 - 10.4 <1
Table 10.2 ELECTRICALLY DRIVEN MACHINE
Electricity price (p/kWh) Fuel replaced price (p/therm)
3.5 30
3.5 48
Cost (F-/kW) System Cost (E) Payback IRR Payback IRR
(yrs) (%) (yrs) (%)
40 9,600 37.4 - 2.9 27
60 14,400 59.1 - 4.3 16
80 19,200 83.1 - 5.8 9

10.7.2 Utilisation factor
The utilisation was varied from 1,000 to 8,000 hours per year for
both gas engine and electrically driven options. Table 10.3
shows the payback periods and IRRs for the gas engine option at
two different prices of replaced fuel. For a gas and fuel
replaced price of 30p/therm, and utilisation at 1,000 hours, the
payback is 46.5 years. With the same prices and a utilisation of
8,000 hours a payback of 5.8 years is achieved.
With gas at 30p/therm, a fuel replaced price of 48p/therm and a
utilisation of 1,000 hours, the payback is 15.6 years (an IRR of
<1%). Under these prices and a utilisation of 8,000 hours the
payback is reduced to 1.9 years (an IRR of 43%).
Table 10.4 shows the payback periods and IRRs for the electrically
driven option at a range of utilisations and two prices of
replaced fuel. For a utilisation of 1,000 hours, a replaced fuel
price of 30p/therm and an electricity price of 3.5p/kWh, the pay-
back period is 193 years. At a utilisation of 8,000 hours under
these prices the payback is reduced to 16.7 years.
For a fuel replaced price of 48p/therm, an electricity price of
3.5p/kWh and a utilisation of 1,000 hours, the payback period is
11.1 years, corresponding to an IRR of <1%. Under these prices
the payback at a utilisation of 8,000 hours is 1.3 years,
corresponding to an IRR of 64%.
Thus, for the gas engine option, at a gas and price of fuel
replaced price of 30p/therm, no increase in utilisation is
sufficient to make the investment marginal. At a fuel replaced
price of 48p/therm the investment looks interesting at 4,000 hours
per year and becomes viable at 7,000 hours per year. As was
mentioned above (see section 10.5), a utilisation of 4,000 hours
would be considered high in most of the processes considered here.

Heat pump installation sensitivity analysis
Variable factor: utilisation in hours per year (h/y)
Table 10.3 GAS ENGINE MACHINE
Gas price (p/therm Fuel replaced price (p/therm
30 30
30 48
Utilisation (h/y) Payback IRR Payback IRR
(yrs) ($) (yrs) ($)
1000 46.5 - 15.6 - 2000 23.2 - 7.8 3
3000 15.5 - 5.2 11
4000 11.6 - 3.9 18
5000 9.3 1 3.1 25
6000 7.7 4 2.6 31
7000 6.6 7 2.2 37
8000 5.8 9 1.9 43
Table 10.4 ELECTRICALLY DRIVEN MACHINE
Electricity price (p/kWh) Fuel replaced price (p/therm)
3.5 30
3.5 48
Utilisation (h/y) Payback IRR Payback IRR
(yrs) ($) (yrs) (%)
1000 193.4 0 11.1 - 2000 76.9 _ 5.5 10 3000 48.0 - 3.6 21 4000 34.9
- 2.7 29 5000 27.4
- 2.2 36
6000 22.5 - 1.8 45 7000 19.2 - 1.5 55 8000 16.7 - 1.3 64

For electrically driven machines, an electricity price of 3.5p/
kWh, a fuel replaced price of 48p/therm and a utilisation of
more than 2,000 hours is needed to make the project interesting,
and 5,000 hours to make it viable. Thus, if additional savings
such as from water recovery could be effected for no additional
capital cost, the project may be viable at reasonable utilisations.
Note again, however, this is at a fuel replaced cost of 48p/therm.
10.73 Price factors
Tables 10.5 and 10.6 show the effect of varying the gas price and
the fuel replaced price on the payback periods and IRRs of the gas
engine driven option. At a gas and fuel replaced price of 30p/
therm the payback period is 18.2 years (IRR <1%), while at a gas
price of 30p/therm and a fuel replaced price of 66p/therm the
payback is reduced to 3.7 years (IRR = 20%). Table 1u. 6 shows
that a gas price and a fuel replaced price of 48p/therm the payback
period is 9.7 years, corresponding to an IRR of <1%. At a gas
price of 48p/therm and a fuel replaced price of 66p/therm the
payback is 4.8 years, an IRR of 13%.
Tables 10.7 and ]0.8 show equivalent information for the electrically
driven option. At an electricity price of 3.5p/kWh and a fuel
replaced price of 30p/therm the payback is 59.1 years while at a
fuel replaced price of 66p/therm it is 2.3 years, an IRR of 35%.
With an electricity price of 7p/kWh, only a fuel replaced price
of 66p/therm produces a positive payback, in this case 9.3 years
(IRR < 1%).
Thus, for a gas engine driven machine a gas price of 30p/therm
and a fuel replaced price of 66p/therm is necessary to make the
project marginal. This raises the question that if a gas supply
is available to run the heat pump why can't it be used in the
boiler instead of the fuel at 66p/therm? Any firm with fuel
available at 30p/therm whole using fuel at 66p/therm would almost
certainly find fuel switching an attractive option with a much
lower capital outlay than a heat pump.

Heat pump installation sensitivity analysis
Variable factor: price of gas (p/therm) or price of electricity (p/kWh) price of fuel replaced (p/therm)
Table 10.5a GAS ENGINE MACHINE
Gas price (p/therm) 30 30 30 Fuel replaced price (p/therm) 30 48 66
Payback period (years) 18.6 6.2 3.7
IRR (%) savings - 8 20
Table 10.5b
Gas price (p/therm) 48 48 48 Fuel replaced price (p/therm) 30 48 60
Payback period (years) » 10 9.7 4.8
IRR (%) savings - <1 13
Table 10.6a ELECTRICALLY DRIVEN MACHINE
Electricity price (p/kWh) 3.5 3.5 3.5 Fuel replaced price (p/therm) 30 48 66
Payback period (years) > 10 4.5 2.3
IRR (%) savings "- 16 35
Table 10.6b
Electricity price (p/kWh) 7 7 7 Fuel replaced price (p/therm) 30 48 66
Payback period (years) > 10 > 10 9.3
IRR (%) savings - - <1

Possible conditions where fuel switching may not be possible
include gas supply restrictions. These could be due either
to the Gas Board applying restrictions on industrial customers,
as it did in 1980/81 (now relaxed), or due to limited avail-
ability of gas from another source e. g. mines gas, or bio-gas.
As the absolute prices of fuels (both gas and replaced fuel)
rises, the payback for any given differential between gas and
replaced fuel prices falls. At 30p/therm for gas and 48p/therm
for replaced fuel, a differential of 18p/therm, the payback is
6.2 years while at a gas price of 48p/therm and a fuel replaced
price of 66p/therm, the payback is 4.8 years. Thus, if a
constant price differential is maintained as absolute fuel prices
fall, gas engine machines will become more attractive. The
point about the availability of a cheaper fuel, however, still
holds true.
For an electrically driven machine, an electricity price of 3.5p/
kWh and a price of replaced fuel of 48p/therm is necessary before
the project becomes marginal. At a price of replaced fuel of
66p/therm the project becomes viable. Once again the option of
fuel switching should be examined if the replaced fuel price is
66p/therm. Heavier grades of oil are almost certainly available
with a lower price per therm. It appears that the electrically
driven option may be attractive in a situation where gas is not
available as a fuel, and oil is currently used.
10.8 Conclusions
Even under an optimistic assumption about utilisation, the proposed
installations in the brewing and dairy sectors look at best marginal
when replacing oil derived heat. Considering that the majority of
sites interviewed in these sectors used gas as the prime fuel, the
number of sites in which heat pumps are likely to be even marginal,
must be small.

The result of the modelling exercise were supported by three
quotations for heat pump systems obtained by two breweries.
None of the systems could produce a payback period better than
eight years. One of the actual dairy installations, on
current performance, will produce a payback period of over five
years even after including water savings.
Opinions of heat pumps in the sampled companies in the brewing
and dairy industry are generally negative. Even the most
technically progressive companies regard them as complex and
hard to maintain.
Another factor inhibiting the adoption of heat pumps is the
degree of innovation necessary. Any application in a brewery
would be a major innovation. Even within the brewery or dairy
sectors, however, each application is very different and has to
be designed for the specific site -a high degree of innovative
activity is necessary. Any company contemplating adoption of
a heat pump system must recognise that they are taking the risks inherent in innovation. The low returns available in all but
the most favourable situations mean that this particular
innovation is unattractive.
Given the poor rates of return from these applications, the poor
opinion of heat pumps within the industries, and the high risk
and difficulties of adaption, it is hardly surprising that there
has been hardly any adoption of heat pump systems.
Why should the market forecasts and market expectations of the
suppliers be so much at variance with reality, at least in these
two sectors? Firstly, as mentioned above, the general forecasts
make no attempt at market segmentation. They do not recognise
the very real differences in needs between sectors and even
applications. Masters et al (1980) appear to simply have taken
the percentage of total industrial heat at temperatures that could be supplied by heat pumps and ignored economic factors. Currie
(1982) does not indicate a methodology.

Leach (1979) does not appear to recognise the differences
between different applications. He apparently assumes that
because a heat pump is viable in a simple space conditioning
application it will be viable in process applications.
Suppliers of heat pump systems seem to have been product
oriented rather than market oriented. One supplier indicated
that no market research had been undertaken before deciding on
entering the heat pump market. If heat pumps are to be viable
it is as part of a heat recovery system. As Addy, Missions, and
Reay & Brookes stress, it is important in heat recovery system
design not to prejudge the means of heat transfer, be it simple
heat exchangers of any type or heat pumps. What is necessary is
a heat recovery systems company that will use heat pumps if
appropriate, not a company supplying heat pumps.
The following guidelines for heat pump viability are given by
Currie (1982).
1. Very high utilisation.
2. Small temperature difference between load and source.
3. Heat requirements must be at relatively low temperature.
4. There must be no high grade heat available in the plant.
If a high grade source is available then conventional
heat recovery will always be cheaper than heat pumps.
5. Combined heating and cooling of adjacent process streams
is required.
Added to these could be:
6. A different energy price regime than is currently
operating in the UK.
The restrictions imposed by these conditions appear to be more
severe in the brewing and dairy sectors than currently believed
by suppliers of heat pumps. This, plus fears over the reliabil-
ity of the technology, would seem to limit the market severely
in these sectors.

Chapter Eleven
COMBINED HEAT AND POWER IN THE FOUR SECTORS
11.1 Introduction
The title Combined Beat and Power (CHP) refers to the simultaneous
generation of electrical or mechanical power and useful heat.
This chapter examines the profitability of this technique for a
particular brewery and reviews evidence about its viability in
the other three sectors. It addresses the questions:
(a) is CAP economically viable in these sectors?
(b) which is the favoured technique?
(c) what conditions would affect the answers to (a) and (b)?
11.2 What is industrial CHP?
Most attention on CHP has been focussed on large scale central-
ised schemes for providing District Heating (DH). These schemes
are not under consideration here because they are not credible
investments for private companies whose main business is not
power generation. Industrial CHP is on a smaller scale and is
concerned with the provision of process heat, usually used on-
site, and the generation of electrical power, some of which may be
sold to the national grid.
The CHP techniques that are commercially available today are:
back pressure steam turbine (Rankine cycle) systems; gas turbine
(Brayton cycle) systems; internal combustion engine (Diesel
cycle) systems; and reciprocating steam engine systems. The
principles of these techniques are explained in Technical
Appendix 2 as are fuel cells systems. Fuel cell CHP systems
have been included as they are to be commercially available in the
UK by the end of the 1980s (Ryan and Cameron, 1984).

These systems are known as topping cycles because the energy
for electrical power generation is extracted at the higher
temperatures associated with fuel combustion, and process heat
requirements are met with the lower temperature exhaust flow
from the prime mover.
Bottoming cycles, which are becoming available for power
generation, produce electricity in connection with a flow of
heat at between 100 and 250°C. They are primarily a heat
recovery technique and compete with conventional heat recovery
systems.
Organic Rankine Cycle (ORC) bottoming cycles have been limited
to chemical industry processes in Japan and the USA (Boland,
Hill and Townsend, 1981). In the four sectors studied no
applications for bottoming cycles have been proposed. Currently
available ORCs on the UK market are designed to order and only
available in sizes from 1OMW up (trade sources) far too large for
the typical site in the four sectors. For these reasons
bottoming cycles have not been discussed further.
Micro-CHP systems, based on automotive engines converted to run
on gas have recently become available in the UK. These are
finding rapidly growing markets in swimming pools, hotels and
sheltered housing applications (Linnell, personal communication).
As they are designed primarily for space heating uses, and produce
low pressure hot water rather than steam, they have not been
considered in the analysis. Brewery companies owning large
hotels however should certainly consider micro-CHP as a way of
reducing energy costs in these premises.
11.3 Why examine industrial CHP?
An investment in industrial CHP does not significantly alter the
energy consumption, either heat or power, of the investors site.
Why then is it included in a thesis concerned with energy conserv-
ation investments? Firstly, it can in the right conditions
reduce energy costs and therefore is an investment capable of
producing an economic return. Secondly it does save energy at
the national level.

National energy savings result because the power generated in a
CHP scheme, which typically has an overall efficiency of 80%,
replaces power generated in centralised power stations with an
overall efficiency of about 35%, and an overall generation and
transmission efficiency of about 30%.
These potential savings have made CHP, both centralised and
decentralised, attractive to writers of low-energy scenarios.
Industrial CRP is a technique with a long history. Before the
advent of the national grid it was widely used. The convenience
of the grid, and falling real electricity prices and difficulties
in selling surplus power have made private generation less
attractive. From 1957/58 to 1981/82 the proportion of power
privately generated in the UK fell from 15.6% to 7.5% (excluding
internal power generated in nuclear power stations). The actual
energy privately generated rose over this period from 12,657 GWh
to a 1973/74 peak of 18,656 GWh and fell to 15,799 GWh by 1981/82
(Source Energy Statistics, 1983).
Rising real energy prices, and recent changes in critical factors
affecting the viability of industrial CIS systems, mean that the
technique merits reappraisal. The first factor that has recently
changed is that the 1983 Energy Act mandated area electricity
boards to purchase privately generated power, publish tariffs for
the purchase of privately generated power and generally assist
potential or existing private generators. It also allowed
companies to generate power as their main business.
The second factor that has changed is the British Gas Corporation's
(BGC) policy towards using gas in power generating systems.
Supply restrictions and a policy of reserving this "premium fuel"
for other uses had meant that gas used for power generation was
priced above the normal industrial tariff. Now supplies are
more plentiful the BGC has dropped the power generation premium
and is actively assisting potential private generators. This
change opened up the possibility of using gas engines and gas
turbines for economical private generation.

ý a)
r-I
G
.ý 0 0 r a 0
I M O Lf1 N N 11 O Ö 0
O M M
41 rl 3
.ý CD 4) v 0 p" 0 0
. 14 $4 Lf1 0 co In M r
A -4 . -ý I I
41 N
I O 0
07 .{ .1 N 0 0 to w O ry) C9 tC
ý . -.
M 0 ý. i-.
a Ln ,I .. 0 ... ý.
Ln Ln M OO
M . -r OO W " I M lý
N 0 I1 N 0 OO
In
a) _
A .. O > I O O
M 41 O I s v O
.. + O N " 1 0 y O O r+ ý In
UI 0)
O . rq Al 41 s to w 0 41 >. ý N 0)
3: a) 41 ýÜ 0) M ý O + 0 0 ý U
0 (1) 4-) "1 sý 6 Id U 0)
. r, 0) "r1 0) W 11 3 0 44 ý ý 3 '" ý rx v ia e ft iw
N
a1 ý O z
0l 3 x
0 0 O Ln
1 O 0 0 ý N
aI " º4 O to v
il to U) 0 4J Q4 ili
Ä>A b
.N i1 En ýM
W a-1 41
It v) -, 4 %D 0 a)ro9 0" r-I 4. ) u, ,ý". ý ý" ýcho "rl . 1. ) CT S-I N
ýSpI LI LI
>ý º] W faa
. -ý NMd tf1 t. p
ý N rn . -I
En F. ro .H ý . '.,
ý rn -4
rn r rn
N '-i ý a)
W
'd r. (ö
'Jr ro ý ý
ý ý rn ý
ro >1
N v U ý ý 0 (I)

fixed throughout the year. Many industrial sites, particularly
those in the four sectors studied, have more complex heat to
power ratio patterns.
11.5 CEO in the brewing sector
CHP has long been used in some large breweries. None of the
sampled sites had invested in CHP recently and only one was known
to operate a scheine. Perceptions of CHP in other sampled sites
were generally that it would not be viable. In the light of
these opinions it was decided to examine the viability of a CHP
scheme in one particular medium-sized brewery and select and
size the most viable system.
Sizing CHP systems, as pointed out above, has been a problem.
A linear programming (LP) approach has been used here to select
and size a system as LP can combine all the basic variables such
as electricity and heat demands, conversion efficiencies and
economic parameters such as fuel and electricity prices, capital
costs and non-fuel running costs. The principle is similar to
that used for plant operations planning in the chemical industry
and sign conventions follow those used by Allen (1971).
The approach used here follows the original use of LP for CHP
system design by Bleay and Fells (1979) with some important
modifications. The basic model used for formulating the LP
algorithm is shown in Appendix 20. It was decided to optimise
the model on the basis of running costs alone to allow use of
payback and discounted cash flow (DCF)analysis rather than to
optimise total costs as in Bleay and Fells (1979). Maintenance
and other costs were excluded for simplicity but could easily be
included in a more extensive analysis. An LP computer package,
MPOS, was used to run the model. Five CHP techniques were
considered: diesel engines; gas turbines (fixed ratio); gas
turbines with variable after-burners; steam turbines; and fuel
cells. The characteristics of each CHP technique are shown in
Table 11.1. Base case analyses were carried out for each technique
and sensitivity analysis was conducted on the diesel driven system.

Electricity prices, both sale and purchase, were obtained from
the local area board. Fuel prices used were those currently
(mid-1984) operating.
Data on the heat and power demands on a "typical" day for the
brewery were obtained from recent past records. The pattern
is shown in Figure 11.1. These heat and power demands were used
to optimise the running cost for each technique over a range of
sites on an hourly basis. Summing the hourly running costs
produces a running cost curve for the day, from which the
optimum size of system can be derived. Multiplying the daily
running cost by a figure for days per year operation results in
an annual running cost.
As the heat to power demand pattern varies even from day to day
questions can be raised about the typicality of the days used.
This can however be corrected for approximately by reducing the
days run per year figure.
The annual running cost was compared to that without a CHP system
to give annual savings due to energy savings. These, when
combined with the capital cost data in Table 11.2 give payback
periods and IRRs.
11.6 General results
The results are summarised in Table 11.2. The Internal Rate of
Return quoted were calculated on the assumption of a ten year lifetime and using current (1984/85) capital allowances and tax
rates (75% first year allowance and 50% tax rate).
All options except the fuel cell offer payback periods under
2.5 years under the highest capital cost assumption. Although
this analysis has only considered energy running costs it suggests
that industrial CHP with sale of surplus power may be an
attractive option for this particular brewery, and by implication,
other similar sites.

The third factor to change has been available technology.
Diesel systems with waste heat boilers are a recent entry to
the market along with smaller, packaged gas turbine systems.
The available techniques are described in Technical Appendix 2.
11.4 Heat to power ratios and system sizing
Critical characteristics in a CAP installation are the heat to
power ratios of the various systems and the heat to power ratios
demanded at the site. Heat to power ratios for each system are
relatively fixed and are shown in Table 11.1.
The high heat to power ratio of a simple steam turbine system
limits its application. Savings result from replacing grid
electricity and sizing the system to meet a reasonable proportion
of electrical load. This will, in most sites, lead to more heat
than can be used on-site. Sizing the system to meet heat demand
results in such small electricity output that the scheme becomes
uneconomic in many sites.
The heat to power ratio of a fixed gas turbine system is more in
line with many industrial sites. Their use however has been
restricted by the need to use gas or distillate oil. Until
recently gas used for CHP schemes was priced at a premium as this
was not considered a suitable use for a high quality fuel, and gas
was in short supply. The British Gas Corporation has recently
changed this policy and is now actively supporting potential
investors in CBp schemes.
Gas turbines with after-burners in the waste heat boilers offer
useful flexibility. Another approach would be to use a variable
recuperated gas turbine. This system is reported by Lowder
(1979) as being under development for CHP schemes but no
commercial applications have been built to date.
Choice and sizing of CHP systems has to date been a simple affair
with little attempt at optimising. This lack of sizing techniques,
and lack of flexibility in the heat to power ratios has been an
impediment to further use of CHP. To date its use has mainly been
in process industries where heat and power loads are relatively

GJ 0 0 DO
L
pOO pCO
ýý
ý
d3 do
s d-.
II
Ö4O
ppo 00 ý1a Oo ,ýo "-º .. ý
g cý
ý
1IIIIIf1IIII l
ý. _ .J
I
ý r0-a
00 -�-I
'-4
.ý ý
v ºý Z trý .,. i
C d
JJ d oý
V
i
i1 10
t i-
ý L. _. i
ý s a-,
L .0
X
T^ 1ý
ý~
.. a dn
JýE
Lýo V-4
ý
N L j 0
s
IJ
- a-
I- ft
-r
r- w
ý ý"' ý
i i r r
C,,
Ld3
Cdý ýý
ý-d'
h- t+)
!-N

N
. --ý ý
a, ý A ý H
H H 0 4) 0 N U O t1f
O .ý l0 O ,.. I
O I I tf1
W r` M
N
",. I
y. l ý Ö Lr)
In
O rý .r I. fl
8 tn I R1 0 ºn 41 ý
4-) f! )
., {
ý4 0 Lfl
O O
N N ' )-I A an I I (" )
0 .r t 4J
Y4 0 m
N N J-) R! W C9 t0
c) ý
0 Lfl ý ý O
N M iý
IIl I
O I
ý CO O ý N C)
C9
O Ln
N r- N O I I Ln
N 0 O rt iIl 0 lD
f"l
N t~
b 3
ý +4-)
0 (D 4J -4 LO N UI Y"1 Ul
". I 0 N to to u ß+
b -1 .xW - _ ý ji 3 cc rcl
-1 54 r. ýý ä
a ýClt ý LL N H O
v N 4J ý ý 'A ýN ?d 4H C3' (D O
N3 ". ý 0 4-)
04 En U 41 0 vOa
4. J 41
4-J 4)
ox r-i 0
.aN +ý ýý Ic: 4-) ý4 1-i U0 01ý4
14 (1) 4j
0 4-)
-4 sý ý .. U +) N U) Q) NGý
-4 N a) 3 (L) [ to m
N AC 4-3 .ýNN
O 4"1 AU 0 d-) 0 "rl k
rI u1 ,AN (D +) N ro
O44 r-4 U) ý Oý
GD ý
U1 e ri td
(A N rl iIýýý
,ý UI N
44 4-) N0 .ý
u1 ýA r-I >r
0) (d " rl 115 0) 0 a "ý
En r5 ý ýQW 4-) "r1
U) ä+°ý°0 OGÖZi U)
° rd (I) N
W. 4.!
(A b 44 ý3ý
nýý U
3ý 4) ý
rv-I N
ý0 X: u1
Öýý s]
"rl CO +3 6 u)
ýýö°'ýro ý4 rcj 44 4J a)
w0ý, ý-. wiý
0 4J (o a) Cl) C) mýýo1.0
N fff Aýýý a)
. t;
ýý ý
4-) U >1
+ý ro ýu ,C r-I +3 -rj v1
ý ro 41 v C; , c: "14 am
+-) 4-l 4-) UI U- Fl U UI "rl rl Ul
ý 4-1 NýU 4-) 0 1j
+J a) U 1J Q) U ýN
rNi iýd vy 0
-4 N
u1 a) +) 0 z

Nash (1984) reports payback periods of less than four years for
standard matched diesel engine and boost fired systems. If
part of the capital cost is offset by the need to replace
conventional boilers or if dealing with a greenfield site, the
payback period on the incremental cost can be reduced to about
two years. This suggests that either the analysis here is
optimistic in its assumptions or that the case in question is
particularly suitable for CHP.
11.7
A major distilling company is currently investing in a gas turbine
CHP scheme with export of power to the grid. It reported some
surprise that a two year payback period was achievable under
reasonable assumptions, but this is in keeping with our own
findings in the brewery example.
Sensitivity analysis
A full sensitivity analysis was conducted on the diesel engine
example and the results are, presented in Tables 11.3 to 11.7. The
base case has the following characteristics:
Capital cost (£/kW) 400
Utilisation (% of year) 82 (days/year) 300
Fuel price-(p/kWh) 1.05
Imported electricity price (p/kWh) 4
Exported electricity price (p/kWh) 2
Savings are energy costs alone. Heat and power loads as given are typical.
Even at the highest capital cost, £600/kW, which is above the range
given by trade sources, the payback period of the installation is
2.2 years, giving an IRR of 37%. As the price of fuel rises
relative to that of electricity the payback period of the invest-
ment is increased; at a price of fuel of 2. lp/kWh, twice the
current level, the payback period is increased to 7.3 years and
the IRR falls to 5%.

If the price of imported electricity falls relative to all other
prices the payback period increases. If the price gained for
exported electricity falls to half its current average value the
payback period increases from 1.5 to 1.9 years (IRR falls from
57 to 44%), still an attractive investment. The investment is
sensitive to changes in utilisation but even at 27% utilisation
(equivalent to 100 days a year operation), the payback period is
only 4.4 years (IRR = 15%).
Thus, the investment is most sensitive to a rise in fuel prices
relative to all other prices or a fall in the price of imported
electricity relative to all other prices. If electricity prices
become decoupled from fuel prices, for example through the
increasing use of nuclear energy private generation of power in
industrial CHP systems will be less attractive.
11.8 Other barriers to CHP
A major barrier to increased investment in industrial CHP may be
capital availability. Although acceptable paybacks may be
attainable CHP systems do cost more than conventional boilers and
power supplies. In times of constrained capital this may be the
deciding factor. Other barriers may be lack of management
expertise in running CHP systems and fears over their complexity.
Both these constraints could be eased by the emergence of third
party financing and management companies. This phenomena, more
advanced in the USA than the UK, is beginning to occur for non-
CHP boiler plant and other energy conservation investments. if,
as seems likely, it spreads, this will pave the way for third
party financing and management of CHP systems.
Third party companies with expertise will also be able to assist
in negotiations with the electricity supply industry. Although
the industry is mandated to assist potential private generators
by the 1983 Energy Act industrial contacts suggest that the response
to enquiries has been mixed. Improvements are undoubtedly needed
in some areas if CHP is to be encouraged.

Table 11.3 DIESEL INSTALLATION SENSITIVITY ANALYSIS
Variable factor: capital cost
Capital cost (E/kW) 300 400 500 600
Payback period (yrs) 1.1 1.5 1.8 2.2
IRR (%) 76 57 45 37
Table 11.4 DIESEL INSTALLATIM SENSITIVITY ANALYSIS
Variable factor: fuel price
Fuel price (p/kWh) 0.5 1.05 2.1
Payback period (yrs) 1.4 1.5 7.3
IRR (%) 60 57 5
Table 11.5 DIESEL INSTALLATION SENSITIVITY ANALYSIS
Variable factor: imported electricity price
Imported electricity price (p/kWh)
3 4 8
Payback period (yrs) 4.4 1.5 1.0
IRR (%) 15 57 85
Table 11.6 DIESEL INSTALLATION SENSITIVITY ANALYSIS
Variable factor: exported electricity price
Exported electricity price (p/kWh )
1 2
Payback period (yrs) 1.9 1.5
IRR (%) 44 57
Note: It is not conceivable that the average price of exported electricity, i. e. the price the grid pays for electricity, would exceed the average price of imported electricity, i. e. the price the grid sells electricity for. Therefore this case has not been explored.
Table 11.7 DIESEL INSTALLATION SENSITIVITY ANALYSIS
Variable factor: utilisation
Utilisation (% of year) 4ays/year)
27 100
55 200
82 300
96 350
Payback period (yrs) 4.4 2.2 1.5 1.3
IRR (%) 15 36 57 66

191
To date industrial gas turbines have mainly been derivatives of
aero engines. The minimum size currently available of 500 kW
is a limiting factor. Despite an increase in cost per kW and
a decrease in thermal efficiency with decreasing size there may
well be an untapped market for small, packaged gas turbine CHP
systems designed to sell excess power to the grid.
Another possibility with potential may be smaller closed cycle
systems or fluidised bed gasifiers connected to gas turbines as
reported in Williams (1978). The viability of these systems
would depend on the prices of coal and other fuels. From a
national point of view they have the advantage of encouraging
use of solid fuels rather than premium gas and distillate oils,
if this is seen as an advantage.
11.9 Conclusions
Industrial CHP appears to be an attractive investment for the
particular brewery used in the example. To the extent that it
is typical of medium sized breweries there could be a large, as
yet untapped, profitable opportunity for CHP in the brewery
sector.
The size of the investment required means that CHP systems are
only likely to be purchased as an alternative to replacing
conventional boilers, rather than as a retrofit investment.
Given the changed circumstances, the evidence from the example
and from the distilling company investing in CHP, medium to
large breweries and distilleries should certainly examine CEP as
an option when considering replacing boilers, if not as a retro-
fit measure.
Further research into the viability of industrial CHP, using
simulation techniques and concentrating on the sensitivity of
financial returns to factors such as peak loads, tariff
structures and changing demand patterns is advocated. Due
to the importance of site specific factors this work should
model a range of real sites. The size of investment necessary
for CHP, coupled with the advent of cheap microcomputer based
investment analysis packages suggest that a full risk analysis
would be appropriate.

Chapter Twelve
PROFITABILITY MODELLING OF OTHER TECHNIQUES
12.1 Introduction
Having examined the profitability of two major techniques in-depth
this chapter looks briefly at the profitability of seven other
techniques. The term "major techniques" is used in the sense that
much of the energy conservation literature, and indeed activity in
some organisations, is concerned with fashionable techniques such
as heat pumps or combined heat and power. In reality many
neglected, technically unspectacular techniques are probably more important both in terms of energy conservation and economic
returns. These techniques are too numerous, and often too site-
specific, to usefully model their profitability here other than in
a general sense. Each technique is briefly described and an
example cost-benefit analysis, taken either from the literature
or the sampled companies, is presented with basic sensitivity
analyses. Non-economic factors found to have affected the
adoption decision in sampled companies are also discussed.
The techniques chosen, with the exceptions of keg washing line
heat recovery and pasteuriser improvements, have applications in all four of the sampled sectors.
12.2 Sub-metering
We have stressed the importance of monitoring for effective
energy management. Monitoring is dependent on the measurement
of energy flows through metering and as we have seen, in the four sectors, sub-metering of energy flows is not widely practiced
and this is a barrier to improved energy management.

In the companies sampled a recurring complaint was that meters,
especially steam meters, are expensive, unreliable, inaccurate
and hard to maintain. In several companies these were held to be valid reasons for not investing in more extensive sub-metering. Another reason often advanced for not investing is that meters are hard to justify financially because there are no directly attribut-
able savings.
Savings from metering come about in two ways. Direct savings result from tighter controls over energy use, and indirect savings result from improvements in the quality of information used in future investment decisions. It should be remembered that meters on their own do not save energy. It is only the management actions based on the information gained from metering and monitoring that can save energy.
Evidence from consultants (e. g. Roberts, 1983), suppliers and the
companies that have invested in sub-metering shows that the invest-
ment does have a direct return through improved good housekeeping.
Typical savings are 5% of total energy usage. Consequently there is no need to regard meters solely as a form of "R & D" for
improving the quality of future investment decisions.
There will be a cut-off point in site size below which sub-
metering is uneconomic (given normal investment criteria for
retrofit projects). The use of extensive sub-metering in one
small brewery (see Section one) suggests that the cut-off point
is well below the size of most breweries. One dairy in the
sample utilises twenty fully metered cost-centres for a total
energy bill of £200,000 p. a. while a site with an energy bill of
£800,000 p. a. has no cost centres and only 50% of steam use is
metered. There must be cost-effective potential for additional
metering in the second site.
A rough calculation, assuming 5% reduction in energy use and a two-year payback period suggests it would be worth the second site spending £80,000 on metering. This would probably be sufficient to extensively sub-meter the site.

Criticisms of the failings of steam and other fluid flow meters
are not entirely without foundation. Metering techniques and
some of the problems are discussed in Brian and Scott (1982) and
Gervase-Williams (1984). Despite the problems a properly designed
and installed metering system can be very cost-effective. Much
of the bad opinion against meters appears to be based on experiences
with older metering techniques and does not recognise recent improve-
ments in this important field.
The cost and benefits of a metering installation will be dependent
on a number of site specific factors, such as pipe diameter, flow-
rate, turn-down ratio, pipe lay-out, and cost of steam. Cost
benefit analysis for three meter installations are shown in
Appendix . 21. Sensitivity analysis suggests that the
investments, based on actual cases, are robust. In one case cited
a 22% saving in steam was recorded, solely due to improved good
housekeeping.
12.3 Low Energy Lighting
The term low-energy lighting covers many different techniques and
types of hardware including "slim" fluorescent tubes, miniature
fluorescents, mercury halide lamps and low and high pressure sodium
lamps. Savings result from replacing old and often inappropriate
lighting systems, often installed on minimum capital cost grounds,
with modern and more appropriate systems. In many installations
lighting quality is increased dramatically at the same time as
energy costs are reduced.
As energy costs typically account for 70% of total costs in
industrial high bay lighting schemes (Philips Lighting Advisory
Group: Energy Effective Lighting Manual), a reduction in energy
costs has a major effect on total costs. The various lighting
techniques are described in Payne (1984) and elsewhere.

In Section one it was shown that 28 out of the 49 breweries
sampled had invested in low energy lighting of some form.
Many of these installations were partial schemes which illustrates
one factor that makes low energy lighting easy to adopt (increases
its adaptability), the investment can be phased. Its wide use in
the brewery sector suggests that it is economic in most sites
where it is evaluated.
In the dairy sector low energy lighting was only installed in two
out of eight sites. Given the similarities between many of the
buildings in the brewing and dairy sectors it would appear that
low energy lighting is under-utilised in the dairy sector.
Maltings and distilleries had not invested in low energy lighting
to any great extent. As lighting represents a much smaller prop-
ortion of costs in these sectors investment in relighting will
rationally be low on the priority list.
The most common type of relighting scheme encountered in the brewing
sector was the replacement of fluorescent tubes with high pressure
sodium lamps in high bay areas such as bottling halls or keg stores.
Appendix 22 shows a cost-benefit analysis for a relighting scheme
in a brewery keg store.
The cost-benefit analysis and the large number of installations in
the brewing sector show that low energy lighting schemes are
attractive, robust investments. They should be evaluated in all
breweries and dairies. Further use is also probably cost effective
in many dairies and also in bottling halls and stores of distilleries.

12.4 Energy Management system for a building with an annual energy
cost of E25,000 p. a. for heating and lighting
Electronic energy management systems have rapidly developed in the
last five years. The technology is still evolving and the price
of systems falling as computing power falls in price. Descriptions
of systems are found in Fielden and Ede (1982) and Johnson (1982)
and recent editions of Energy Manager (1983/84).
No applications of energy management systems for the control of
heating, ventilating and lighting, have been found in the four
sectors. It was decided however to investigate the costs and
benefits of a system designed for a building with a heating and
lighting bill of £25,000 p. a. The data is taken from a real
application in another industry. Large brewery companies own
many buildings other than the actual brewery sites, notably for
storage. Many of these will have heating and lighting bills of
about £25,000 p. a.
A simple cost-benefit calculation and sensitivity analysis are
shown in Appendix 23. The Appendix shows the cash flows when
the system is leased. Leasing is offered as an option by
several energy management bureaux which use their central
computers to control clients' out-stations.
Even under a pessimistic savings assumption of 10% the project
offers a 2.8 year payback. The figure of 20% is based on perform-
ance in similar installations.
12.5 Condensate recovery
Condensate recovery is an essential element in the efficient use
of steam. In many applications where steam is used directly,
condensate recovery is not possible because the returned liquid
becomes too contaminated for utilisation in boilers. From the
survey it appears that many breweries and dairies, however, could
improve their recovery of condensate. In addition to the energy
savings resulting, there will be water cost and water treatment
cost savings.

Four brewing sites, two dairies and two distilleries have invested
in improving their condensate recovery systems. The cost benefit
analysis suggests that cost effective improvements could be made in
other sites. Payback periods quoted are for energy saving alone,
ignoring water and water treatment cost savings which can be
significant. A cost-benefit analysis for an improvement scheme for a condensate recovery system is shown in Appendix 24.
12.6 Oxygen trim control systems
The use of oxygen trim control systems, both to ensure maximum
combustion efficiency and to provide continuous efficiency monitor-
ing, has long been practiced on very large boilers such as those
in power stations. Recent advances in the technology, especially
the use of microprocessors, have allowed its economic use in smaller,
industrial boilers. The principle is described in Payne (1984).
Over the last five years the technique has had a chequered history
with many organisations experiencing very poor returns on significant
capital investments. Recent technical advances, notably the use of
self-adaptive microprocessor control systems, have improved the
reliability and attractiveness of this technique.
The savings gained depend mainly on the efficiency currently being
achieved in the boiler. Paybacks of under two years however have
been demonstrated in a wide range of situations, on package boilers
as small as 7,000 lb/h steam or 7m Btu/h hot water. It is not
worthwhile providing a cost benefit analysis for this technique as
such an analysis would be very general. The evidence in the liter-
ature and from the sample suggests that oxygen trim systems are
worth evaluating and in most cases will be found to be cost effective.

As well as offering high returns, oxygen trim systems are easily
installed onto boilers and other combustion equipment. In sites
with multiple boilers they can easily be installed on one boiler
for experimentation (typical installed cost is £3,500). These
factors suggest they have a high adaptability and will find wide
application in the four sectors.
12.7 Economics of a keg washing line heat recovery system
The system is described in ETSU (1981). The first system, built
under an Energy Conservation Demonstration Project Scheme, cost
£51,000 and resulted in a 5.5 year payback period. Subsequent
systems were installed for a capital cost of £15,000. At this
cost the projects offer a two year payback even at low occupacity.
Keg washing and sterilising lines are frequently one of the largest
users of steam in a brewery after wort boiling (Harris, 1979).
The keg cleaning cycle involves multiple rinses, steam purges,
detergent washes and steam and air pressurisations. The precise
details of the cycles vary widely and are usually controlled on
time intervals rather than temperature or volume. Thus the hot
water effluent varies greatly in quantity, quality and timing.
This affects the economic viability of heat recovery schemes as
well as the design of systems. Essentially there are two types
of keg washing lines; old ones with no heat recovery, and newer
ones with first stage heat recovery. The installation described
here was applied to the latter type, suggesting that large savings
could be achieved by retrofitting heat recovery systems onto the
older lines. In one case found in the research this was not
possible because of space constraints. It also raises the
question whether the older lines should not be replaced. Modern
lines incorporate full heat recovery and thus produce similar
savings to retrofit systems. They are, however, only likely to
be purchased as part of the normal capital replacement cycle and
not on energy cost saving grounds.
As many older lines are in small breweries with limited resources
exploitation of this potential is likely to be through new lines
rather than retrofitting.

Design of retrofitted keg washing line heat recovery systems poses
many engineering problems because of the intermitten flow of
effluent. One site in the survey had installed a system prior to
the Demonstration Project. During the research the author
discovered that for most of the cycle the heat exchanger was
transferring heat from the hot liquor (water) tank to the effluent,
the reverse of the design conditions. Removal of the system
saved about £20,000 for an expenditure of about £2,000. This
example also illustrates the need to always question assumptions
about how plant operates. It does not always operate in the way
it was designed to do. The design problems are a major impediment
to further use of this technique as are low effluent flow rates in
many cases. A cost-benefit analysis for this technique is shown in
Appendix 25.
12.8 Improvements to Pasteuriser
Manufacturers of pasteurisers offer an upgrading option in which
additional heat and water recovery systems are retrofitted onto
existing pasteurisers. The example used in the cost-benefit
analysis in Appendix 26. -was a can pasteuriser in a brewery.
Even at the lowest utilisation figure of 2,000 h/y the improve-
ments package offers a payback period of about 1.5 years (IRR = 67%) .
Although offering an acceptable return the capital cost of this
technique is high (about £125,000 in the example used). An
important question that must be raised in considering this invest-
ment concerns the projected life of the pasteuriser. If
replacement is thought likely in the near future the value of the
retrofit improvements will be reduced. None of the breweries in
the sample had invested in this technique. In some cases it is
likely to be viable.

12.9 Other techniques
The techniques that have been cost-effectively used in at least
one site must be worth examining in others even though viability
is not assured. A major task of energy management must be to
maximise the evaluation of possible investments. Given that
techniques already used in at least one site have been found to
be viable, often under similar investment criteria, they must be
worth considering.
A technique which is currently experimental in one brewery and
one distillery in the sampled sites is biological digestion of
effluent to produce bio-gas. This appears to have great promise
and has already been installed in conjunction with a CHP scheme in
a dairy (Plant and Works Engineering, September 1984). it
would be worth larger breweries, dairies and distilleries considering
this technique.
12.10 Summa
The profitability of adoption of several energy conservation
techniques has been discussed along with non-economic factors.
In Section Two the site-specificness of all energy conservation
investments was stressed and because of this any profitability
modelling must be rather general. It can only really serve to
show what might be possible in a particular site and to indicate
the sensitivity of any adoption decision to variables such as
utilisation.
Numerous unspectacular techniques are likely to be more cost-
effective than some of the more fashionable concepts such as heat
pumps. They have in most cases been proven over a long period.
In any energy management programme it is important that these
techniques are not neglected in the pursuit of more glamorous
projects.

Chapter Thirteen
MANAGERIAL BARRIERS TO CHANGE
13.1 Introduction
The following sections explore managerial barriers to energy
conservation. Many reports on the barriers to energy conservation
cite management problems but do not explore them in detail. Here
the soft systems model of the activities necessary in energy manage-
ment developed in Section Two is used to examine barriers to energy
conservation. The examples used are drawn mainly from the
interviewed companies with some from the literature. Three types
of managerial barriers can be distinguished: informational,
strategic, and organisational and human. Each is now discussed
in turn and the interactions between the three types described.
13.2 Informational Problems
Probably the biggest barrier to energy conservation is lack of
information, or poor information management of one kind or another.
As shown in Section One, 26 companies out of 49 sampled in the
brewing sector monitor energy consumption at greater than monthly
intervals or not at all. Without regular management information,
effective action is unlikely to occur as shown by the evidence of
these companies, eleven of which reported no reduction in specific
energy use over the last two or five years.
In the dairy sector sample, two out of twelve sites did not monitor
energy use at all while in the malting and distilling sectors samples
monitoring is nearly universal.
The incidence of monitoring in the four sectors was higher than
that reported by Hoare (1983) in ageographically localised but
general in industry sector, survey in which only 50% of respondent
companies practiced some form of energy monitoring.

We have seen that most sites in the brewery and dairy sectors do
not adjust their monitoring figures for variances such as
production, production mix, season and climate. Corrections are
more often made in the distilling and malting sectors. Only
twelve out of 49 sites in the brewing sector divide energy use
into cost centres and allocate responsibility for energy to line
managers, while only two out of eight dairy sites do. In the
other sites engineers are responsible for energy conservation.
In two distilling companies production managers are responsible
for energy and all other resource uses, energy specialists provide
a service to the production managers. In the other distilling
companies and in malting sites, the energy manager, usually an
engineer, is responsible for energy conservation.
This allocation of responsibility is necessitated by a lack of
information on energy use within the plant. Provision of this
information requires sub-metering which generally does not exist.
Giving responsibility for energy conservation to engineers can
create organisational barriers to change which are discussed in
more detail below.
Another informational problem, possibly caused by organisational
and human problems, occurs when information is either not passed on
to the relevant people or when people do not understand the
significance of information. In one of the large breweries inter-
viewed it was admitted that prior to a recent management "shake-up"
information concerning energy use was collected but not distributed
to any managers. Roberts (1983b) cites a similar case in a
brewery in which after the information was circulated it quickly
led to action that saved one-third-of the energy used in bottling.
In one distillery interviewed the chemistry laboratories were
responsible for carrying out boiler blow-down water and stack gas
analyses. When the readings were outside set limits (indicating
low efficiency that can easily be corrected), the chemist often did not communicate the message to the chief engineer as he had
neither been trained to understand their significance, nor to
realise his own role in the communication chain of management.

Another major problem which is information related, is the
existence and prevalence of paradigms. All too often decisions
appear to be based on paradigms and views that may have been
relevant in the past but have become out of date. One of the
quickest and cheapest ways to save energy is simply to question
all practices and assumptions. Roberts (1983b) cites the case
of a brewery where the same product was being stored in three
separate vessels at three different temperatures, 30°F, 38°F,
and 44°F respectively. In each case, the product was bottled
and delivered under the same name and tested against a common
quality standard. A detailed investigation led to a more rational
and lower overall consumption of energy, and revealed spare
refrigeration capacity in each case.
In one brewery the author discovered that a heat exchanger was
working in reverse most of the time, heating up effluent instead
of recovering heat from it before dumping it to drain. Similar
examples abound in companies with extensive energy management
programmes.
An interesting example of a paradigm concerns pumps, again in a
brewery. The type of pump used was inefficient because of its
impellor design but preferred by the brewers as it was "easier to
clean" than the alternative, more efficient pump. Only after
extensive tests and persuasive efforts did the brewers admit that it
was just as easy to clean the more efficient impellor. Admittedly
the threat of biological contamination in a brewery is serious but
the brewers exhibited an almost fanatical unwillingness to even
consider change. Belief in paradigms, and failure to question
assumptions represents a failure to see the problem and available
techniques as they exist now. Several viable techniques are
prevented in some cases because engineers distrust a technique they
experienced ten or twenty years before, ignoring any advances in
knowledge and ability made in the intervening period.

13.3 Strategic Problems
These can be divided into two types: lack of strategic thinking
in integrating energy conservation investments and other invest-
ments; and lack of strategy within the energy conservation
investment sub-set of company activities. The need to integrate
energy conservation investment plans both with non-energy invest-
ments and with other energy investments was stressed in the soft
systems model.
Examples of failures of the first type are now illustrated:
a. A small brewery invested over £2,000 on replacing a burner system
for heating a copper. Savings were estimated before the invest-
ment at £1,000 p. a. and these were being achieved. Within a year
however, the copper was replaced as part of the normal capital
investment cycle. This illustrates a failure to think
strategically about the effect of planned or anticipated changes
to process equipment (or possibly process itself in some cases)
on energy conservation investments. The company did learn from
its mistake and ensured that energy saving features, including a
novel heating system, were incorporated into the new copper.
These reduced the gas bill by 20% relative to the performance with
the improved burner system.
b. A medium sized brewery installed a CO2 recovery unit on the under-
standing that the alternative method of beer pushing, using
nitrogen, would not be installed. The engineering department had
previously lobbied for a nitrogen system because of the energy
saving potential. This occurs because with a nitrogen system,
nitrogen blanketing can be used to de-aerate the water used for
diluting high strength brews rather than using steam heating
followed by refrigeration (de-aerated water is used as the presence
of air in the water imparts an undesirable metallic flavour to the
product). The brewers, however, had flatly refused to consider
nitrogen pushing. Less than a year after the CO2 recovery system
was installed the brewers changed their mind and announced a switch
to nitrogen pushing. The capital and time invested in the CO2
recovery was largely wasted by this change in policy.

Although some CO2 recovery will still be practiced after nitrogen
pushing is installed, the system is now unlikely to achieve a
satisfactory rate of return.
c. A brewery decided to open a "brew pub", a public house which
brews beer on the premises.
ing department was instructed
certain date. The engineers
design, build and install the
ations would be twice as long
completed on time but without
Under marketing pressure the engineer- to convert the existing building by a
estimated that a reasonable time to
brewing system and building modific-
as the time allowed. It was "luxuries" such as energy conserv-
ation features. The time constraint left insufficient time to
design in several possible energy saving features. The sole
objective was to build a working brew-pub by the date set.
Constraints in the building, notably space, meant that advance
planning for later addition of energy conservation features was
also not possible.
d. A brewery that was investing £1.2 million in a new brew-house had
the option of including copper vapour heat recovery (CVHR) using
mechanical vapour recompression (MVR). This novel scheme would
have added £O. 5 million to the capital cost (before a government
grant of 25%) and had a 2.5 year payback period which was within
the company's normal criteria for retrofit investments. The MVR
system would have reduced brew-house running costs by 80%. The
option was rejected by senior management on grounds of shortage
of capital. Leasing the MVR system, a possible way round the
capital constraint, was not considered by the company. A
secondary reason, which if it goes ahead within a medium time-
scale would make this an example of systematic thinking, was a
Board decision to reduce boil-off from 10% to 5% within ten years.
This would reduce the cost-effectiveness of the MVR system.
In this example the engineer was being systematic in trying to
incorporate a ,.
major energy saving technique into a new brew-house
necessitated by the normal capital investment cycle. If the
reduced boil-off decision is implemented it may well show strategic
decision making by the Board. It appears however that the inter-

actions between the projects, for example the effects of reduced
boil-off on MVR system size and return, were not considered.
e. A large dairy was built for a group and reputed to be the most
modern in Europe in terms of automation at that time, but had a
very low energy efficiency. Even at 1979/80 energy prices,
numerous viable energy saving projects were feasible. These
would have been relatively easy to include during the design stage
but "no attention" was paid to energy. The dairy was over-
rapidly designed and built with no attention paid to reducing
running costs.
Staff at the dairy are now attempting to rectify some of the
failures to incorporate energy conservation projects. Some
retrofit opportunities have been made difficult or non-viable
because of constraints built into the dairy. Consequently the
dairy is locked into a higher energy consumption and higher
running costs than could have been achieved even with techniques
economic at 1979 prices.
Examples of proper strategic total system thinking in which the
synergy between general investment decisions and energy conserv-
ation investments was considered include the following:
1. A medium sized brewery, when building a cask-conditioned beer line,
included drainage sumps that would enable an effluent heat recovery
scheme to be added later, even though this project was not past the
idea stage. Without the drainage sumps, easily incorporated at the
construction stage, the costs of adapting the plant for effluent heat recovery at a later stage would have been prohibitive.
2. Two small breweries, neither of which could allocate capital to
retrofit measures, ensured that all new plant was designed to be
energy efficient. In one company the Head Brewer even included
meters in new capital plant expenditure, "hiding" them from the
cost-conscious Board.

This latter example could represent one of two possible cases.
Either top management were being systematic and conserving capital
for other, higher return projects, e. g. marketing, and the
production manager (Head Brewer) was wasting capital on meters;
or he was being systematic in using the opportunity afforded by
new plant purchase and doing what he could against higher
opposition. The important point is that this issue was not made
explicit-.
Discussions with management suggested that sufficient capital was
available for metering and that top management had failed to
appreciate the importance of metering in reducing energy costs.
This lack of appreciation indicates an important communication
failure between energy managers, meter suppliers, government
agencies and senior management.
Examples of the more narrowly drawn sub-system approach within
energy conservation investment are now given:
A company operating high temperature kilns (not in the food,
drink and tobacco sector) decided to install a secondary recuperator
on one kiln. During the system design it was also decided to
install a microprocessor temperature control system which would save
energy by keeping the kiln temperature within tighter limits. The
secondary recuperator was installed followed by the control system.
The tighter temperature control reduced the exhaust temperature
such that the temperature in the secondary recuperator fell below
the dew point, consequently acid condensed out of the exhaust and
rapidly corroded the recuperator. Better strategic design would
have delayed the recuperator until the control system was in place
and working. Then the design of the recuperator could have taken
the lower temperature into account.
A company installed insulation behind a false ceiling without real-
ising that uninsulated heating ducts passed through the void space.
Consequently the heating bills increased because of greater heat losses
from the ducts and they had to be insulated. Total capital costs
would have been much lower if both the ceiling and ducts had been
insulated at the same time.

An example of the problem of deciding when to invest in new
techniques is the case of a large brewery which invested
£50,000 in a computerised data logging system for energy monit-
oring in 1981. When the system was installed the company had
an energy management system in which the engineering department
was totally responsible for energy conservation. Within two
years the data logging system was found to be inflexible and
have insufficient monitoring points even for the existing organ-
isational form. it was decided to switch to a system in which
line managers were responsible for energy conservation. The
data logging system had to be replaced by a more flexible and
extended system.
This example shows the relationship between informational systems
and organisational form (to be explored below) as well as the
problem of when to buy new technology.
Although it failed to recoup the investment the original system
did help to sell the value of metering and monitoring to senior
management. As Rosenberg (1982) and Jacques (1981) have shown,
there can be rational reasons for not investing in new technology
now and waiting for a more advanced, possibly more proven, and
possibly cheaper form of the technology. This decision, however,
must be made explicit. Costs and capabilities of electronic
energy management systems in particular, in common with other
electronic equipment, have rapidly changed during recent years.
, 13.4 Discussion
We have seen that examples of non-strategic thinking leading to
wasteful investment occurred in a variety of companies, of all
sizes. Some of the companies were noted for successes in energy
conservation. Examples of both good and bad strategic thinking
sometimes occurred in the same company. In all cases returns from
investments were reduced, if not obviated.

Several problems appear to be due to a lack of appreciation of
technological problems by top management. Although working
under pressure does have advantages the example of the brew-pub is
extreme. Essentially the project had to be "crashed". If the
extra costs, capital, running and human costs, were considered
explicitly and judged to be less than the benefits the decision
would be defensible. If, as seems likely, they were not, it was
a poor decision. In either case the impression gained is a lack
of appreciation of technical problems. The example of the new
dairy is similar and possibly reflects poor production facility
planning at a higher level.
The example of nitrogen pushing and the CO2 recovery unit suggests
a lack of any consistent, explicit technology policy. The Head
Brewer's initial. rejection of nitrogen pushing was reversed within
a year, suggesting that either the original decisio*, was ill-
considered, or the degree of uncertainty in this "decision" was
not correctly communicated to engineering staff and others. The
policy was understood to be "no N2 pushing" whereas it seemed in
retrospect to be "wait and see". If this had been explicitly
recognised by all parties the CO2 recovery system could have been
delayed.
Several brewery engineers complain that top management, which is
often dominated by marketing and accounting specialists, do not
understand technology. It would be easy to dismiss this view but
some of the examples do support it. Top-. management decisions with
technological implications often appear to be made without recog-
nition of these implications and without strategic technological
planning. The need for such planning and general acknowledgement
that senior management lack technological know-how is found in
Pappas (1984) and Steele (1983).
Other examples also suggest that top management do not understand
technology. One brewery engineer was asked whether he could use
mild steel trunking instead of stainless steel on a boiler econom-
iser to reduce capital costs. This would have been possible but
the estimated lifetime of the ducting would be less than two years.
The project had a payback period, with stainless steel trunking, of
about two years. The engineer resisted and won the case.

The need for systematic planning at all levels is again illustrated
by this case. If senior management had alternative higher return
projects in which to invest they were correct to try to reduce
capital costs. Their lack of technological know-how led them,
however, to do this in the wrong way. Delaying the economiser
rather than trying to impose false economies would have been a
better strategy. This attempt implicitly shows a lack of faith
in the engineer's ability to design or specify an appropriate
system. If senior management did not have alternative projects
they did not have a valid reason to reduce capital costs. The
important point again is failure to make this issue explicit.
Many brewery managements have problems understanding technology.
In the words of one brewery engineer, "this place has gone through
a technological revolution and no one has adjusted yet". The
revolution appears to have been more accidental than managed.
The brewing industry in particular remains saddled with an
unwarranted craft romanticism whereas the reality is a high
technology, chemical engineering operation.
The. nature of energy conservation activities, and technology in
general, suggests that an explicit technology policy, if not an
energy policy, is necessary. Only one example of an explicit
energy policy was found within the four sectors examined. This
contrasts with experience in the chemical industry (S R Graham,
D Boland, personal communications).
Some examples of non-strategic thinking are a result of day-to-day
pressures taking precedence. One brewery engineer said that the
only time he had to work on projects was in the evenings and at
weekends. Although such application is laudable it is a comment
on the organisation in which such "moonlighting" is necessary.
The day-to-day pressures seem to have three possible causes: poor
management; pressure caused by projects being given priority by
top management; and organisational designs and climates in which
engineering staff are interrupted throughout the day on minor
administrative matters (a case of confusing the urgent with the
important). These causes reflect hierarchical structure problems
of the firms' management which have effects other than in energy
management activities. These are specific examples of the general
disease of bad management.

13.5 Organisational and Human problems
In most of the sites in the four sectors large enough to merit
separate engineering departments responsibility for energy
conservation was primarily with the engineering function.
Engineers have technical expertise in energy related matters,
(though not usually energy conservation per se) but only energy
generation in boiler houses, and possibly energy distribution is
under their direct control. Energy use, or mis-use, is under
the control of the users and not the producers. This important
principle is often ignored.
Any attempt to make energy management at the good housekeeping
level the responsibility of engineering staff is likely to lead
to several problems. Firstly the engineer-energy manager is
unlikely to have time to keep a close check on all energy users
in all departments. Secondly, any attempt to change working habits
in another manager's department is likely to compromise that
manager's authority. Thirdly, without explicit responsibility the
department manager is unlikely to have sufficient motivation to
ensure good housekeeping is practiced.
One remedial approach encountered is to appoint energy wardens who
are made responsible for ensuring good housekeeping in their
particular areas. This may be good for spotting problems such as
steam leaks but is unlikely to result in operational changes where
appropriate because the energy wardens lack authority.
In some brewing sites where the engineers are responsible for energy
conservation a common attitude amongst line managers is that "energy
is something the engineers look after". These managers have no
explicit responsibility for controlling energy costs and express
their objectives as producing beer, not producing beer at a profit.
In two sites where this occurs there are suggestion-schemes and
energy committees but 80% of the input comes from the engineering
departments.

It may be that line managers have insufficient expertise in energy
conservation. Most managers, however, do have an in-depth
knowledge of their own production equipment and operations that
should be a good basis for energy conservation activity. it
seems more likely that the lack of action is caused by a lack of
motivation. Unless departments or areas are sub-metered and line
managers given full explicit responsibility for reducing energy
costs, in co-operation with engineers, there is no motivation.
The effect that this problem can have is illustrated by the
example of a production manager who had always scheduled steam
cleaning of plant at weekends. This resulted in the boiler having
to be fired up at weekends at an estimated cost of £600 per
occasion. On one weekend when essential maintenance work
necessitated a complete electrical and therefore steam shut-down,
(the boilers cannot be run without electrical power), the cleaning
operations were rescheduled to occur during the week.
When the plant energy manager suggested that this could be done
every week, saving about £30,000 per annum, the production manager
refused. The energy manager subsequently arranged several notional
electrical shut-downs at weekends to illustrate that rearranging the
cleaning was possible and resulted in -little, if any, extra cost.
After several "shut-downs" and persistent persuasion by the energy
manager, the practice was made permanent.
The production managers stated reason for refusing to reschedule
cleaning operations extra cost. was not justified. If the costs
had been real the energy manager would have been wrong to persist
and this would have reflected unsystematic thinking on his part.
In this case however, he did consider all other costs and decided
upon action which was subsequently proved correct. The production
manager did not regard energy conservation as part of his role.
Presumably, he felt no motivation to do so because energy use in
his area was not metered and he was not explicitly made responsible
for energy use within the area.

The importance of allocating responsibility to line managers is
supported by Roberts (1983b) and Boatfield (1982). The latter
stresses that line managers must be totally responsible for all
functions including engineering. In order to be responsible
for a technical function, the non-specialist must make the
engineering management accountable to him for the engineering
function. The same applies to other specialist functions such
as Health and Safety. This approach has had spectacular results,
both in energy conservation and environmental pollution control
{Boatfield, 1982; see also Financial Times, 29 August 1980).
One distillery company illustrates the difficulties in switching
to a system in which line managers are given full responsibility.
The group energy manager realised the problems inherent in having
chief engineers responsible for controlling energy consumption.
Despite having one supporter on the main board it took two years
to change the system. Eventually, in 1981, the Assistant Manager
at each site was appointed as an Energy Co-ordinator. Each had
complete responsibility for energy conservation and engineering
staff as a resource. Energy savings since 1981 have been
about 25%. The central energy manager, a chemical engineer by
training, believes that technical people are needed for energy work
but they do not need to be energy engineers: "there is no problem
in a technically aware-person acquiring the principles of energy
conservation".
Organisational problems can also occur at the level of new equip-
ment purchase. In a large brewery where the manager responsible
for energy use in public houses, an engineer, was establishing
specifications for new buildings and renovations, encompassing
lighting, heating and ventilating, cooking and dishwashing equip-
ment. The purchasing department had traditionally been respons-
ible for purchasing new equipment and its objective had often been
to minimise capital outlay. The energy manager was trying to
minimise running costs within a definition of profitable investment
(i. e. the payback period criterion). There are, however, no formal
links between purchasing and the energy management function. The
energy manager is having to forge these links but is encountering
resistance from the purchasing department, who see a takeover of
some of their functions.

Another "human" problem, possibly exacerbated by organisational
designs in which engineers are given responsibility for energy
conservation, is excessive concentration on hardware and high
cost solutions. Roberts (1983b) cites a case where high cost
measures were instigated first and saved £250,000 a year on a
site having an annual fuel bill of £4 million. The capital cost
of the projects amounted to £250,000 and management were pleased
with achieving a one year payback. Later, when the site was
examined for no-cost and low-cost improvements, a further £250,000
per annum of energy was saved for a capital cost of only £25,000.
All too often engineers concentrate on hardware instead of inform-
ation and organisational software.
An organisation in which functions are rigidly separated can
present barriers to effective energy management. In many companies
interviewed, engineers produced proposals on a payback basis which
were then handed to accountants for DCF analysis. If any
sensitivity analysis is conducted it is done without access to
engineering information necessary to assess technical risks.
This rigid separation of functions lowers the usefulness of
sensitivity analysis. In one case found the project had been
rejected because of a low IRR but a check by an engineer trained
in DCF techniques proved the analysis was incorrect. In one of
the larger breweries engineers had recently acquired microcomputers
and started to do their own DCF calculations and spreadsheet modelling.
Only one company in the brewing sector sample had a separate energy
conservation capital budget, expenditure being requested from a
general capital budget. This means that projects can be accepted
and rejected on a piecemeal basis, making integrated planning of
projects more difficult. It also has two important consequences
for companies supplying energy saving equipment. Firstly, as in
all marketing, it is important to find out at an early stage in the
contact who actually makes the decision. In most cases the engineer
or energy manager decides what equipment or service he requires, but
the finance department has the final say over what is bought through
control over the capital budget as well as financial appraisal.

In such cases it is important that the potential supplier finds
out (a) what the capital expenditure criteria are; and (b) what
the preferred methods of proposal presentation (i. e. IRR, NPv,
with/without tax etc) are, so that it can either help the engineer
prepare, or itself prepare, a proposal with a high probability of
acceptance. These basic actions seem to be overlooked by many
supplying companies.
The second and possibly more serious consequence is that engineers
prepare proposals on the basis of quotes. Proposals are then
passed on to finance departments. If they are accepted they are
then put into the following year's capital budget. This can
result in long delays between acceptance and implementation with
obvious consequences for suppliers' cash flows.
The establishment of a separate energy conservation capital budget
aids the integration of projects through formation of a portfolio
and can reduce the time lag between project acceptance and
implementation.
13.6 Summary
Managerial barriers to energy conservation investment have been
categorised into three related types: informational, strategic
and organisational and human.
The most important informational barrier, and probably the most
important barrier of all, is failure to monitor energy use and
costs. Monitoring is linked to organisational barriers.
Organisations in which energy managers are responsible for
controlling energy costs often encounter problems of lack of
coordination and lack of motivation for line managers. Giving
full responsibility to line managers, and a coordinating and
support role to energy "managers", induces this motivation.
To do this, however, requires a well developed monitoring system
which breaks down energy costs and usages into cost centres and
delivers relevant and timely information in a usable form to line
managers.

Another informational problem is the existence and prevalence
of paradigms both about existing production equipment and
energy conservation techniques. These reflect a failure to
understand available techniques as they exist now and
unwillingness to experiment in a scientific manner.
These managerial barriers congpire to prevent investment in
energy conservation techniques, even where such investment
would if properly evaluated, meet the company's investment
criteria.
9

Chapter Fourteen
MANAGERIAL FACTORS FOR PROMOTING ENERGY MANAGEMENT
14.1 Introduction
Investment in energy conservation embodies technical change.
Wide differences in energy conservation performance, as measured
by reduction in specific energy, have been reported in all four
sectors. It has been argued however, that success in energy
management is not necessarily associated with the magnitude of
the reduction in specific energy. Indeed, in some circumstances
not investing in energy conserving techniques may constitute
successful energy management. Success in energy management is
associated with making the issues and decisions explicit and
viewing energy conservation as a means of reaching overall
corporate objectives. Many companies that have done this have
achieved significant reductions in specific energy and hence costs.
Soft systems modelling has been used to explore the activities
necessary for successful energy management. Here we are concerned
with the managerial, in the broadest sense, factors that promote
these activities.
It was originally intended to use data gathered from the postal survey
of the brewing sector to test hypotheses about the characteristics of
successful firms and this was done in Section One. As described in
Section Two however the measure of success used in designing the
survey, namely reduction in specific energy, is no longer considered
wholly appropriate. Indeed, it is now thought that the level and
depth of information required to identify successful companies
precludes the use of a simple questionnaire. A method akin to
the snowballing technique in buying behaviour (see for example
Moriaty and Bateson, 1982) may be more appropriate.

Consequently the factors for success described below are derived
from both the statistical evidence resulting from the survey, and
examination of companies that appear successful by the criteria
described in Section Two. This has been combined with a wide
ranging review of the literatures on innovation, buying behaviour,
organisational design, management information systems, energy
management and general management. The factors largely concern
intangible and often objectively immeasurable matters.
14.2 The important factors
The factors likely to promote successful energy management that
are discussed below are as follows:
Existence of an energy management information and control system
Establishment of targets for energy consumption
An appropriate organisational design
Organisational climate
Support by senior management
Existence of a technological entrepreneur or product champion character
Existence of a technological gatekeeper or hunter-gatherer character
Motivation at all levels
Training and development at all levels
These factors could exist in many companies in many forms but it
is their quality and synergism that promote successful energy
management. Absence of one or more factor inhibits the effect- iveness of energy management and hence inhibits energy
conservation.

14.3 Existence of an energy management information and control system, targetting and appropriate organisational design
Information systems, targetting and organisational design are
inextricably linked and will be discussed together.
The need for an energy management information system, incorporating
frequent monitoring and comparison with targets, is recognised in
the energy management literature. Jacques (1981), Roberts (1983a,
1983b), Murphy and McKay (1982), Payne (1984) and Finer (1984) all
stress the importance of monitoring. Despite reservations about
the validity of reduction in specific energy as a measure of
success, the statistical tests on the brewing sector data reported
in Section One strongly support a correlation between monitoring at
monthly or more frequent intervals and achieving any reduction in
specific energy and a larger than median reduction. Several
companies interviewed in the sample reported monitoring was the
single most effective measure.
It is recognised that adjustment of specific energy figures and the
setting of suitable targets are not easy tasks. Targets, for energy
use reduction as for other activities, are hard to set and easy to
manipulate. The evidence however appears to strongly support the
view that the rewards are worth the effort.
Information systems should be designed to adjust for variances
caused by production level, product mix, climate and season where
appropriate. It is recognised however that this can be difficult,
especially in multi-product plants such as breweries and dairies.
In the early stages of an energy management programme the adjust-
ments may not be necessary but as easy options are exploited more
complete information on energy use patterns is required as a guide
to action.
organisational design is not usually discussed in connection with
energy management and we have seen how total responsibility for
energy conservation is often given to an engineer or engineering
manager. Some of the problems this simplistic approach can cause have already been described.

Organisational designs in which line managers are responsible
for all resource use in their departments, and engineers are a
service function, can create motivation in line managers often
lacking in a system where engineers are responsible for energy
conservation.
Such an organisational design carries with it the need for
information on a cost centre basis, information that can only
be supplied by sub-metering. A method of creating motivation
is also needed, namely targetting for each cost centre.
Boatfield (1982) and Roberts (1983b) both support the view of
allocating responsibility to line managers as well as the need
for targetting.
. Much emphasis has been put on information systems, especially
computerised systems, both in general and in energy management,
without paying attention to organisational issues. As Tricker
(1976) notes:
"There is as much need for new organisation structures as computer assisted systems, to meet contemporary issues and opportunities. "
This comment certainly applies to energy management.
Allocation cf responsibility to line managers is essential for effective
good housekeeping on all but the smallest sites but could conceivably lead to sub-optimisation at the investment level because of
interactions between projects as described in Section Two. Thus
there is a need for a coordinating activity (shown on the soft
systems model as assembling a portfolio). This would be one
role for an energy manager or energy specialist. It is essent-
ially a systems-managing, coordinating role.
Successful organisations appear to create dual motivation whereby
line managers and energy specialists (engineers) are both motivated
to actively search out conservation opportunities and implement
them. Some companies in the survey and in the literature (BMDF
Conference, London, 1983) use a project team approach at the
energy conservation investment level. Such an approach overcomes
the artificial separation of departments that often occurs, for
example between the engineer setting design standards and the
purchasing department, an example of which was described earlier.

In conclusion, an information system that provides frequent
suitably processed information on a cost centre basis is required.
This should be coupled with an organisational design in which
line managers are responsible for energy use in their department
and assessed on whether or not they achieve targets (probably
set in conjunction with energy specialists). At the investment
level a team approach, calling on the various functional depart-
ments such as production, engineering, purchasing, and finance,
is useful with a coordinating role played by an energy specialist
or in some cases possibly a consultant.
14.4 Organisational climate
Organisational climate is hard to define but its importance
cannot be overlooked. Several examples of the value of
questionning assumptions and practices were described earlier
and successful companies create a questionning climate. No
recipes for achieving it can ever be given but it is an important
factor. Its achievement is likely to be helped by the proper design of information and assessment systems.
14.5 Senior management support
Top management support is often quoted as a condition for success- ful energy management as it is for successful innovation. Few
specific guidelines for either top management, or for lower
management seeking support, exist.
The important roles for senior management must be in establishing information systems, redesigning organisations where necessary,
setting overall targets and allocating resources. Motivation is
again relevant. Communicating the importance of energy conserv-
ation to all staff, backing up the efforts of operational staff, is an important role senior management can play. For examples of this see Edwardes (1980) and the Allied-Lyons Annual Report, 1983,
Chairman's Statements.

Cases of senior management appointing an energy manager but not
allocating any resources have been found. Without resources
the effectiveness of an energy manager is severely limited.
One strategy for the energy manager in this situation, advocated
by Boatfield (1982) and Roberts (1983b) is to concentrate on
no-cost or low-cost measures first. Evidence about the savings
from these can be used in bidding for resources.
14.6 Existence of a technological entrepreneur or product champion character
In the model of technical change presented in Section Two the
role of the coupling agent was stressed. The role of this
actor in the energy conservation field parallels a similar
role described in the innovation literature, the linking of
technological possibility and market opportunity. The import-
ance of this coupling role is also stressed in the description
of the design process by Freeman (1983).
Two streams of literature stress the importance of the individual
in the coupling role. Schon (1963) describes one man emerging
as "a man willing to put himself on the line for success". He
continues:
"No ordinary involvement with a new idea provides the energy required to cope with the indifference and resistance that major technological change provokes. It is characteristic of champions of new developments that they identify with the idea as their own, and with its promotion as a cause, to a degree that goes far beyond the requirements of their job. In fact, many display persistence and courage of heroic quality. "
In new product development the concept of a product champion is
described by Chakrabati (1974).
Energy managers from those companies which have had very success-
ful energy management programmes often exhibit the characteristics
of a product champion described by Schon (1963). They drive their
organisations towards greater efficiency, often against considerable
opposition, through strength of personality.

Admirable though such people are, the need for them implies an
organisation in which technical change has not been institution-
alised. As people with the characteristics of product champions
are, almost by definition, a short resource, relying on their
presence is a risky strategy. One possible consequence of
relying on extraordinary people of the product champion type can
be that when they leave the organisation enthusiasm for energy
conservation leaves with them. An example of this is a major
dairy company in which all interest in energy conservation died
after the departure of one man from the central engineering
department.
The need for extraordinary people is reduced by the establishment
of an energy management and information control system which
blends information, organisational design and recources to produce
effective action. In successful companies the energy information
and control system is often part of the general information and
control system as energy is just one of many resources. The
establishment of an appropriate energy information and control
system may in itself require a product champion character, as
shown by the example of a distillery group energy manager fighting
for two years to establish a system with line manager responsibility.
14.7 Existence of a technological gatekeeper or a hunter-gatherer
The innovation literature stresses the importance of information
flows in the innovation process. The concept of a technological
gatekeeper has been advanced to describe an important role in
the innovation process, that of admitting new ideas to the
organisation. The word gatekeeper implies a rather passive
role which. seems inappropriate. A technological hunter-
gatherer would seem to be a more appropriate description,
implying as it does an active, sorting role.

In the energy conservation context the individual must be plugged
into an internal energy management information system as well as
other relevant internal information e. g. about financial conditions
and general investment plans. The hunter-gatherer must also be
plugged into external information about the availability,
applicability, performance and costs of a range of techniques.
This information must be sought out. Having said that many
engineering and energy managers complain about receiving too much
information about products and services in the form of unsolicited
advertising material. Managing this flow of information in order
that it can be exploited at an appropriate time is an important
part of the technological hunter-gatherer's role. Often the
collection and storage of external information is not formalised
but left to the individual.
In many cases the technological entrepreneur and the hunter-
gatherer roles will be played by the same person. If they
are not, close communication between the two actors would be
necessary. In one large company in the engineering sector a
consultant is retained partly in order to act as a technological
hunter-gatherer, bringing in new ideas. In smaller companies
lacking expertise, the use of a good consultant in this role
could be vital but in the sampled companies in the four sectors
the use of consultants has not been widespread.
14.8 Motivation, training and development at all levels
Motivation has been stressed throughout this section. It cannot
be separated from the other factors, some of which are designed
to motivate people into taking effective action. Training and
development of staff at all levels is another neglected area.
Few of the companies in the four sectors had any formal training
programmes for energy management or other staff. Training forms
another important aspect of software that has been neglected.

As mentioned above, an important method for motivating line
managers and others is setting targets and assessing whether these
are achieved. Explicit responsibility and clear targets are
good motivators.
The existence of a separate energy conservation budget also has a
motivating effect on management. It shows that senior management
take energy conservation seriously.
The importance of motivation and training at all levels is supported by a Grafton Consultants report, "Employee participation in energy
programmes"1, and various reports in the literature, including one
concerning Lyons Bakery at Wakefield. 2
14.9 Summary
Nine factors for promoting successful energy management have been
presented and discussed. They are:
Existence of an energy management information and control system
Establishment of targets for energy consumption
An appropriate organisational design
Organisational climate
Support by senior management
Existence of a technological entrepreneur or product champion leader
Motivation at all levels
Training and development at all levels.
1.
2.
These factors have been derived from both the statistical evidence
described in Section One and from observations of companies deemed
to be successful by the criteria described in Section Two. The
factors can exist in many forms but it is their quality and
synergism that promote successful energy management.
Published by Grafton Consultants Ltd, 1982, reported in Energy Management, April 1982.
Reported in Energy Management, January 1982.

SUMMARY OF SECTION THREE
Section Three examined barriers to energy conservation investment.
These can be classified into techno-economic, i. e. failure to meet economic
criteria, and managerial. The former were explored using profitability
modelling while the latter were analysed in the light of the soft systems
model developed in Section Two. Examples from sampled companies in the
four sectors were used to illustrate managerial barriers.
Two techniques in particular were selected for in-depth profitability
modelling, heat pumps and combined heat and power. These are both
reported in the literature as having large potential. Heat pumps for
industrial heat recovery in the brewing and dairy sectors do not appear to
be attractive investments under reasonable assumptions. This particular
"potential" has been over-stated. Industrial combined heat and power (CHP)
on the other hand appears to be a viable investment that has not yet been
evaluated by many companies. The 1983 Energy Act has improved the
viability of this technique. Its potential is only likely to be exploited
as and when conventional steam plant have to be replaced because of the high
capital cost involved. Other barriers, notably the complexity of running a
cHp station, may also be significant.
Example economic evaluations for other techniques were also presented. As
stressed in Section Two it is difficult to draw general conclusions about
the viability of a technique. It can only be said that if it is viable in
one site it is probably worth evaluating everywhere but only in a fraction of
sites will it be profitable (assuming the same definition of profitable).
Other techniques, not used elsewhere, may also be viable. Low energy
lighting, additional metering and oxygen trim control systems seem to be
viable in a wide range of sites.
Managerial barriers were divided into informational, strategic and organisational
and human. All three categories interact. A major informational barrier is
lack of any monitoring of energy use. Even where monitoring is practiced it
is often infrequent, on a site wide basis only and unadjusted for unavoidable
variances. All three failures reduce its effectiveness as a management tool.

Failure to anticipate the interactions of energy conservation projects and
other investments, both energy and non-energy, is another problem within
energy management. This failure often reflects the lack of a conservation
strategy. Another major barrier to effective energy conservation invest-
ment is the prevalence of paradigms and misperceptions about different
techniques. This is a direct result of lack of training in energy matters.
Organisational and informational problems conspire to prevent motivation
reaching all staff at all levels. All too often the only people motivated
to reduce energy use are the engineers who can only really control energy
generation and distribution, not its use or abuse. The training and
expertise of the engineers often leads to an over-emphasis on energy saving
hardware rather than informational and organisational software.
The factors that promote effective energy management were discussed. These
are related to the factors that promote general technical change and
innovation. They are:
Existence of an energy management information and control system
Establishment of targets for energy consumption
An appropriate organisational design
Organisational climate
Support by senior management
Existence of a technological entrepreneur or product champion character
Existence of a technological gatekeeper or hunter- gatherer character
Motivation at all levels
Training and development at all levels.

REFERENCES for Section Three
ADDY, M (1983) Sense and nonsense in heat recovery Energy Manager, vol. 6, No. 4, April 1983
ADVISORY COMMITTEE ON ENERGY CONSERVATION (1976) 1975 - 1976 HMSO, London
Industry Group Report
ALLEN. DH (1971) Linear programming models for plant operations planning British Chemical Engineering, August 1971, Vol. 16, No. 8.
ANON (1968) Proceedings of the Special Committee on Science Policy of the Senate of Canada, No. 21, January 1969
BOATFIELD, DW (1982) Energy environmental equation Paper available from DW Boatfield, Manager, Energy Environmental & Services Engineering, 3M United Kingdom plc, BRACKNELL, Berkshire
BLEAY, JA and FELLS, I (1979) Optimisation of the design of combined heat and power schemes: a linear programming approach Jnl. of the Institute of Energy, Vol. , No. , September 1979
BOLAND, D, HILL, JC and TOWNSEND, DW (1981) An assessment of the future applicability of heat engines and heat pumps in the process industries Presented at the Symposium on heat pump energy savers for the process industries, Salford;. Lniversoty, 7-8 April 1981
BRAIN, TJS and SCOTT, RWW (1982) Survey of pipeline flowmeters Journal of Phys. E. Sci. Instrum. Vol. 15,1982
CHAKRABATI, AV (1974) in Califbrnia Management Review Winter 1974
von CUBE, HL and STIENLE, F (1981) Heat pump technology
Butterworths, London
CURRIE, W (1982) Heat pumps in industry Energy Technology Support Unit, Harwell.
DRYDEN, IGC (ed) (1975) The efficient use of Energy.
Butterworths, Sevenoaks, UK
EDWARDES, M (1980) Energy Management: A New Challenge
BL Cars Ltd.
ETSU (1981) Heat Recovery on a keg racking line Demonstration Project at Scottish and Newcastle Beer Production Ltd, Holyrood Brewery, Edinburgh ETSU, December 1981

FIELDEN, CJ and EDE, TJ (1982) Computer based energy management in buildings. Pitman, London
FREEMAN, C (1983) Design and British Economic Performance. Paper presented at Royal College of Art, Department of Design Research, 23 March 1983
GERVASE-WILLIAMS, K (1984) Choosing steam meters Industry, may 1984
HARRIS, PS (1979) The Brewing Industry
Energy Audit Series No. 8; issued jointly by the Department of Energy and Department of Industry.
HOARE, AD (1983) Energy management on Tyneside: a survey. Paper. presented at Tyneside Energy Day Conference, 12 January 1983.
JACQUES, JK and WOOD, J (1982b) A sample survey of the current position of energy measurement, reporting and evaluative activities in industry
and commerce Technological Economics Research Unit Discussion Paper No. 34, University of Stirling 1982.
JOHNSON, CD (1982) Process control instrumentation technology Wiley, Chichester
KEW, PA (1982) Heat pumps for industrial waste heat recovery -a summary of required technical and economic criteria Jnl. of Heat Recovery Systems, Vol. 2, No. 3,1982
LEACH, G et al (1979) A low energy strategy for the UK International Institute for the Environment and Development Science Reviews, London. '
LINNELL, C (1983) Developments in gas fired heat pumps Paper presented at the National Energy Management Conference, Birmingham, November 1983
LOWDER, JRA (1979) Aspects of meeting complex industrial energy demand patterns using recuperated gas turbines in Energy for Industry; Ed. O'Callaghan, PW (1979), Pergamon, Oxford.
LOVINS, A (1977) Soft energy paths Penguin, Harmondsworth, Middlesex
MASTERS, J, PEARSON, J and READ, MA (1980) Opportunities for gas engine driven heat pumps in the industrial and commercial markets Paper presented at the 46th Autumn Meeting of the Institution of Gas Engineers, London, November 1980; Midlands Research Station Communication 1129.

MORIATY, RT and BATESON, JEG (1982) Exploring complex decision making unities: a new approach Jnl. of Market Research Vol. XIX, may 1982
MURPHY, WR and McKAY, G (1981) Energy management Butterworths, Sevenoaks, Kent.
NASH, F (1984) Waste heat and chp NEI; APE Ltd Product Information, Issue 1, April 1984
PAYNE, GA (1984) Managing energy in commerce and industry Butterworths, London
REAY, DA and MACMICHAEL, DBA (1979) Heat pumps - design and application Pergamon Press, Oxford
ROBERTS, EB (19 68) Entrepreneurship and technology in Factors in the transfer of technology; Eds. GRUBER, WM and MARQUIS, DG
ROBERTS, MC (1983b) Energetic ways to cut costs Management Today, May 1983
SCHON, DA (1963) Technology and Change.
TRICKER, RI (1976) Management information and control systems Wiley, 1976
WILLIAMS, RH (1978) Industrial cogeneration Annual Review of Energy 1978

Chapter Fifteen
OVERALL SUMMARY AND CONCLUSIONS
15.1 Summary
Section one reported a great variety in the reductions in specific
energy, techniq»es iised and energy management approaches in companies
in the four sectors. The malting sector was an exception in that most
of the investment was in one technique.
The brewing sector sample was used to show a strong relation between a
large reduction in specific energy and monitoring at monthly or more
frequent intervals. A weaker relation existed between a large reduction
in specific energy and the use of targets and cost centres.
Most investments in all four sectors utilised previously used techniques
rather than innovations. Most of the investments were retro-fitted
onto existing plant. Investment criteria for retrofit measures were
broadly similar in all four sectors. In all four sectors the financial
viability of conservation techniques was shown to be very dependent on
site and company specific factors. Energy management in the four
sectors can be broadly divided into three categories; firstly there
are sites with no monitoring, secondly sites with plant wide monitoring,
and thirdly sites with monitoring on a cost centre basis.
In Section Two a model of technical change relevant to energy conserv-
ation was presented and used to define potentials for energy conservation
equipment. A distinction was made between a potential that is achiev-
able through invented techniques or concepts and a potential achievable
through already innovated techniques. The site-specificness of the
viability of energy conservation techniques means that potentials can
only be defined on a site by site basis. To measure these potentials
at any site would require extensive engineering and cost-benefit
analyses. The high cost of acquiring information at the required level
of detail makes actual measurement of these potentials unlikely.
Consideration of these potentials may however be a useful activity for
example in planning an investment portfolio. Given these definitions
of potentials it is clear that any estimate of industry wide potentials
must be arbitrary. Estimates for each of the four sectors were given
and assumptions behind the estimates were made explicit.

A soft systems based model of activities necessary in energy manage-
ment was presented. This serves as a descriptive model for manage-
ment and also as a prescriptive tool for identifying problems within
energy management.
section Three described barriers to investment in energy conservation
equipment, c3. viding them into techno-economic and managerial. The economics
of two techniques, often presented as being important in the literature,
heat pumps and combined heat and power, were explored. Heat pumps for
industrial heat recovery were shown to be uneconomic for retrofitting
under reasonable assumptions. Combined heat and power was shown to
be viable in many circumstances. Economic analyses for seven other
techniques were also presented.
Managerial barriers were divided into informational, strategic and
oragnisational. Each type was illustrated by examples from sampled
companies within the four sectors.
15.2 Conclusions
In the introduction the refined objectives of the thesis were listed as:
1. To study the potential for energy conservation equipment
within the brewing, malting, distilling and dairy sectors.
2. To investigate the extent of adoption of energy saving
technologies since 1976 and the results in energy saving
achieved in these sectors.
3. To investigate the barriers, both managerial and techno-
economic, to adoption of energy saving technologies within
the four sectors; and
4. To use the information to comment on the viability of low
energy scenarios within these sectors.

The realistic potential for energy conserving capital equipment was
defined as those investment opportunities that are technically feasible
for the organisation, viable according to the investor's investment
criteria and appropriate. Thus the size of the potential is subject
to decisions and judgements, some of which are outside the commonly
agreed boundaries of energy management. A systematic approach to
energy management, and its position within the firm, is necessary to
avoid sub-optimising the use of resources. It follows from this
definition of potential that an objective measurement of site potentials,
or industry wide potentials, is not possible. Any estimates of industry
wide potentials are arbitrary.
Many companies within the four sectors have identified and exploited,
or are exploiting, much of their realistic potential for energy conserv-
ation. Improvements however are undoubtedly possible even in the most
successful companies. Small companies in all four sectors have not been
as effective in general as larger companies in evaluating and exploiting
their energy conservation potential.
The energy saving techniques used vary greatly between individual
companies even within the same sector. Malting is exceptional in that
most of the energy conservation investment has been in one technique.
There is evidence to suggest that the most adaptable techniques are the
most frequently adopted. Investments to date have largely been in
retrofitted equipment and in commercially available hardware. Companies
that have adopted new techniques range from small independent companies to
large companies dominant in their market.
A lack of data prevented assessing the reductions in specific energy
achieved since 1976. In many cases data was only available over the
last two years. This data problem is compounded by the fact that most
companies in the four sectors do not correct their specific energy figures
for variances caused by changes in occupacity, product mix and climate.
Thus specific energy figures can be misleading.

A wide range of reductions in specific energy were reported in all
four sectors. The largest savings, up to 60%, are remarkable and
should serve as an indicator to what can be achieved. They should not
however be assumed to be generally achievable because of the many site
and company specific factors that affect the realistic potential.
The barriers to investment in energy conservation equipment can be
broadly divided into techno-economic and managerial. If a technique
does not at least appear to meet the required investment criteria it
will not be adopted, whatever other merits it might have (assuming it
is not legally required). Therefore the economics, or relative
advantage of techniques, are important in explaining adoption or non-
adoption.
Profitability modelling for a number of proposed heat pump heat recovery
installations in the brewing and dairy sectors suggest this particular
technique has been oversold. Its economics are poor and this explains
the lack of adoption of this technique. Industrial combined heat and
power looks an attractive investment but the high absolute capital costs
may hinder its wider adoption. The attractiveness of this technique
has been changed by the 1983 Energy Act and many companies have yet to
realise this and evaluate the technique.
The viability of energy saving techniques is very dependent on site and
company specific factors and it is difficult to draw general conclusions.
Techniques that are viable in many sites include low energy lighting,
oxygen trim control systems and additional steam metering. More research
into the site specific factors affecting viability is advocated. A
rich source of data would be quotations, both those accepted and those
rejected.
As the economics of energy conservation techniques vary from site to site
one object of energy management must be to evaluate all possible techniques.
one managerial barrier to investment in energy conservation is unwarranted
rejection of a technique before proper evaluation of its costs and benefits.

Managerial barriers to investment in energy conservation can be divided
into informational, strategic and organisational and human. All three
types interact. In many companies energy management information and
control systems are poorly developed, in smaller companies they often
do not exist at all. Lack of adequate monitoring may be the biggest
single barrier to energy conservation investments.
Even in some companies noted for success in energy conservation there
is a failure to think strategically about energy-conservation invest-
ments. Planning to anticipate the interactions between energy
conservation investments, both with other energy investments and with
non-energy investments, is often neglected. The interaction between
information systems and organisational designs is also not often
considered. Too much emphasis is placed on energy saving hardware and
not enough on the information, organisation and motivation software.
Scenarios such as that of Leach et al (1979) and Olivier (1983) are
arbitrary in their estimation of potentials. Leach stresses the use
of existing technology, much of which he claims is economic at today's
prices. He does not define what he means by economic other than by
references to the short paybacks that suppliers of conservation equip-
ment can demonstrate. We have noted that authors on general technical
change often fail to distinguish between different levels of technology.
between concepts and hardware. Leach is no exception. Several of the
techniques he mentions exist only at the development stage and their
viability will remain very uncertain until they are commercially adopted.
There are more barriers to implementation for a concept or a develop-
mental prototype than there are for well proven, commercially available
hardware.
Leach also takes generic technologies and assumes they are viable
anywhere. For example, because heat pumps are viable for some space
heating applications (usually commercial buildings with a demand for air
conditioning in summer), he assumes they are viable in other space heating
applications (e. g. factories with no need for air conditioning) and in
process heat recovery. We have seen that viability in one application
does not guarantee viability in similar sites with the same application,
let alone viability in other applications. Leach underestimates the
specific nature of technology and the problems of adapting even well
proven techniques.

Leach also assumes that companies can. be expected to optimise processes
on an energy basis. It has been argued here and by Jacques (1981) and
Rosenberg (1982b) that this is unreasonable as it will lead to sub-
optimisation of the company's resource allocation. Companies operating
in a market economy should optimise on financial grounds in a planned
systematic manner.
Despite these criticisms of Leach, the range of reductions in specific
energy already achieved in the four sectors suggests that, given the
time scale involved and! i. that further energy price rises are expected,
savings equivalent to these postulated by Leach may be achieved in
these sectors. To the extent that these sectors are representative
of industry a low energy scenario may be achievable through the operation
of the market place, including Government incentives. This important
conclusion is supported by Cheshire and Robson (1983) and the econometric
work of Common (1983).
The largest potential for savings appears to be through the incorporation
of energy saving features into new plant design. This potential, :
however, is only likely to be exploited through the normal capital invest-
ment cycle. A large cost-effective potential, equivalent to the savings
postulated in Leach, also exists for retro-fit equipment. At present
only some of this potential is being exploited, the largest barriers to
further exploitation being managerial in nature. The challenge for
management, and other agents of change, is to maximise the creation, identification and exploitation of profitable energy conservation invest-
ment opportunities, both at the retrofit and new plant levels.. As yet
this challenge has only partially been taken up.
Some avenues for further research have been referred to in the text.
These include further work on the importance of site specificness in the
process of technical change which has important implications for the
study and management of this activity, beyond simply energy conservation.
Further work investigating the role of managerial factors in promoting
energy conservation is also advocated. Further modelling of industrial
CHP investments, using simulation and including full risk analyses, would
also be appropriate.

REFERENCES for Summary and Conclusions
CHESHIRE, J and ROBSON, M (1983) UK industrial energy demand:
economic and technical change in the steam boiler stock Science Policy Research Unit Occasional Paper Series No. 19.
COMMON, m (1983) Energy economics Paper presented at the Conference on the Economics of Energy,
Economics Association/University of Stirling, 24 September 1983
JACQUES, JK (1981) Investment decisions and energy conservation within the firm TERU Discussion Paper No. 28, University of Stirling
LEACH, G et al (1979) A low energy strategy for the United Kingdom International Institute for the Environment and Development Science Reviews, London
OLIVIER, D et al (1983) Energy efficient futures: opening the solar option Earth Resources Research Ltd, London
ROSENBERG, N (1982) Inside the black box: technology and economics Cambridge University Press

APPENDICES

N CD 01 -4
0 ý ý CD rn r,
. --1
., -4 k
b a ý a a ý
jEaO, j, ll1 d' d' Men c, 4 01 N II1 Ln. ý in m r1 . "+ N .r
uoTgETnsuT aoEUan, 3 -"
sEb sauTM 3o asn -ý
saaTToaguoo puEaaap " xEW ..
saauanq MaN N (n
ÄaaAOOaa g28g 4M u1 m ff) . -.
buTgEauaad aETog .4 -4
sXuEg TTO buTgETnsuI r+ -ý buTTpuEu aTV .,
daumTtqo butuTZ -y
guaazgEaag 284v(4
aaMOd Q gEag pauTgmoo -r -ý -+ dmnd gEaH N .r N N . -+ .ý .+
butaT3 TEOO og TTO N N
*SIIIa *OUT STOagüOD N Cn cV .r .r cV .. cV .r .r ..
5uT1Eat4 guamaOETdag -ý ý -y
sToaguoo buTggbTZ -y N N
buTgqbTT A3u9TOT339 ubTH -" . -ý
SaOTnaas 3o uoTgEabagul -" -. 4 -~
uoTgETnsuT -; OOH -" N
sanTgTPPp Tan3 .,
uoTgEaauTouT agsEM N
uoTgoEagxa gsnQ -ý snot. zEA
Uý ýý 4J >i
" ý U) ý w ý ä ý
U v U) on v w a o ýw w ý ý ýA ý ý 4' 4. ) r4 " v ) u d)
UI O tT +ý U U) 1-1 i4 b
bN K O G U -I U) -H >r NO N 4.1 W 4j f fýý
1. a d ý j p 44 U)
ý O U)
ý W ý 1ý 1
UO qý A U ". " ". 4 ". { 5 ý U)
() 0 i"1 U) O-"1 N 0 0 0 4-) . "-1 O O r. . -1 (d 'b ý4 +) N O U. -1 ýd U ". "1 )"+ O ". i U) r-1 < Oä ". i cd 6q 0 ý 3 "14 (a U )"a 04 (1) )a O U) O ). 1 . -1 41 fd a. ) d0 Q )-1 8 "14 ý Q)
"., 4-) b 1-1 U . -I 4. ) a) "r1 "-I W u ° x ö ýý aý SNrdJ
aýi ö"ý aýiý ° ) ü vä N ö i a Cl) o
a> 3 Üý aaýý
rýý ä ý waýa w
ý x ocaý za w ý
+ ä äH c
aý
ý aý ý G H

Appendix 2 SIGNIFICANCE TEST FOR SIZE AND THE USE OF MONTHLY OR MORE FREQUENT MONITORING
I& Ti III, IV V& VI
Small 14 15 29 (8.3) (20.7)
Medium & Large 0 20 20 (5.7) (14.3)
TOTALS 14 35 49
Expected values are in brackets. Ho: that size makes no difference whether a company has
monthly monitoring. Test: chit test, 4 cell contingency table.
(O-E) 2
E
X2 (0.001,1)
3.914 2.569 5.700 2 . L7L
13-455 ° x2 (calc )
10.8ýa
We can reject Ho at 99.9% confidence level

Appendix 3 SIGNIFICANCE TEST FOR SIZE AND THE USE OF TARGETTING
Without Targets I, III &V
With Targets II, IV & VI
Small 23 6 29 (14.2) (i4.8)
Medium 1 9 10 (4.9) (5.1)
Large 0 10 10 (4.9) (5.1)
TOTALS 24 25 49
Expected values are in brackets.
Ho: size makes no difference to whether a company has targets.
Test: - chit test, 6 cell contingency table
(O-E)2 E
5.453 5.232 3.104 2.982 4.900 4.707
26.378 2
ý (C. 001,2) - 13.815
. '. we can reject Ho at 99.9% confidence level
Note: Strictly this test should not be used when the expected value in any cell is less than 5. However, in practice, it is often used when the expected values are close to 5. Combining the "Medium" and "Large" cells would be possible but would defeat the object of the test. As with all the
statistical tests the results should be viewed with caution.

Appendix 4 SIGNIFICANCE TEST FOR USE OF MONITORING AT MONTHLY OR MORE FREQUENT INTERVALS AND ACHIEVING A REDUCTION IN SPECIFIC ENERGY
Monitoring at monthly intervals
Monitoring at < monthly intervals
Reduction in 30 5 35
specific energy (25) (10)
No reduction in 5 9 14
specific energy (10) (4)
TOTALS 35 14 49
Expected values are in brackets.
HO: Monitoring at monthly or more frequent intervals makes no difference in achieving a reduction in specific energy.
Test: chit test, 4 cell contingency table.
(O-E) E
1.000 2.500 2.500 6.250
12.25
2 X (0.005,2) - 10.597
we can reject Ho at 99.5% confidence level.
Note: NB expected value less than 5, see note in Appendix 3.

Appendix 5 SIGNIFICANCE TEST FOR MONITORING AT MONTHLY OR MORE FREQUENT INTERVALS AND ACHIEVING A HIGHER THAN MEDIAN REDUCTION IN SPECIFIC ENERGY
With monthly
monitoring
Without monthly
monitoring
Above median 21 2 23 (16.4) (6.6)
Below or equal 14 12 26 to median (18.6) (7.4)
TOTALS 35 14 49
Expected values are in brackets.
H: 0
that monitoring at monthly or more frequent intervals makes no difference to achieving a higher than median reduction in specific energy.
Test: chi2,4 cell contingency table.
(0-E) 2
E
1.290 3.206 1.137 2.859
8.492
a 6.635
:. we can reject Ho at 99% confidence level.
Note: NB expected value less than 5, see note in Appendix 3.

Appendix 6 SIGNIFICANCE TEST FOR MONITORING AT MONTHLY OR MORE FREQUENT INTERVALS AND DIFFERENCE OF MEANS
With monitoring at monthly
or more intervals without monitoring at monthly or more intervals
- 2
x (X - X) x (X - X)
2 32.49 5 12.74
2 32.49 0 2.05
0 59.29 0 2.05
20 151.21 0 2.05
0 59.29 3 2.46
5 7.29 0 2.05
0 59.29 0 2.05
0 59.29 0 2.05
5 7.29 0 2.05
4 13.69 0 2.05
25 299.29 0 2.05
10 5.29 8 43.16
2 32.49 2 0.32
8 0.09 2 0.32
15 53.29
2 32.49
20 151.21
2 32.49
0 59.29
7 0.49
18 106.09
8 0.09
5 7.29
2 32.49
8 0.09
9 1.69
(continued)

Appendix 6 (continued)
With monitoring at monthly Without monitoring at or more intervals monthly or more intervals
x (x - X) 2
x (x - X) 2
5 7.29
4 13.69
40 1043.29
3 22.09
2 32.49
16 68.89
10 7.29
8 0.09
5 7.29
272 2498.88 20 75.4
Ho: No difference between the means of the two samples
Test: t-test for difference of means
Mean: _ X
Subscript 1 refers to "with monitoring"
Subscript 2 refers to "without monitoring"
nl = 35 n2 = 14
xi 272
= 7.77 x2 = 14
= 1.43
S2 = ý(X-X)2
R-1
2 (2498.88) S1 - 34
S 2_ '75.4)
2 19
S12 = 73.49 S22 = 3.97

variance of differences = S12 + S22
ni n2
_ 73.49 3.97
35 + 20
= 2.30
observed difference of means test statistic, t- standard deviation of differences
7.77 - 1.43 t= -2.3-0
t=4.179
degrees of freedom =
t(0.0005,45) = 3.5203
n1 + n2 -2= 47
we can reject H0 at greater than 99.9% confidence level.

Appendix 7 SIGNIFICANCE TEST FOR USE OF TARGETTING AND ACHIEVING A REDUCTION IN SPECIFIC ENERGY
Use of Targets No use of Targets
Reduction in 23 12 35 specific energy (17.1) (17.9)
No reduction in 1 13 14 specific energy (6.9) (7.1)
TOTALS 24 25 49
Expected values are in brackets.
Ho: Targets make no difference in achieving a reduction in specific energy.
Test: chit test, 4 cell contingency table.
ý (0-E)
E
2.036 1.945 5.045 4.903
13.929
2 % (0.001,1) = 10.828
. '. we can reject Ho at 99.9% confidence level.

Appendix 8 SIGNIFICANCE TEST FOR USE OF TARGETTING AND ACHIEVING A LARGER THAN MEDIAN REDUCTION IN SPECIFIC ENERGY
With targets Without targets
Above median 16 7 23 (11.7) (11.3)
Below or equal 9 17 26 to median (13.3) (12.7)
TOTALS 25 24 49
Expected values are in brackets.
Ho: Targetting makes no difference in achieving a higher than median reduction in specific energy.
Test: chi', 4 cell contingency table.
(0-E) 2
E
2.78 1.64 1.39 1.46
7.27
X'(0.02,1) = 5.412
. '. we can reject Ho at 98% confidence level.

Appendix 9 SIGNIFICANCE TEST FOR TARGETTING AND DIFFERENCES OF MEANS
With targetting Without targetting
x (X - X) 2
x (X - X)
8 0.13 5 2.37
2 40.45 0 11.97
2 40.45 0 11.97
2 40.45 0 11.97
8 0.13 3 0.21
15 44.09 0 11.97
2 40.45 0 11.97
20 135.49 0 11.97
2 40.49 0 11.97
0 69.89 0 11.97
7 1.85 0 11.97
18 92.93 2 2.13
8 0.13 2 2.13
5 11.29 0 11.97
8 0.13 20 273.57
9 0.41 0 11.97
5 11.29 5 2.37
4 19.01 0 11.97
40 1001.09 0 11.97
3 28.73 5 2.37
2 40.45 4 0.29
16 58.37 25 463.97
10 2.39 10 42.77
8 0.13 2 2.13
5 11.29
209 1732.01 83 949.92

H= no difference between the means. 0
Test: t-test for difference of means.
nl = 25 n2 = 24
qn4 - 81 xl r25 = 8.36 x2 = 24 = 3.46
t-test for difference of means
s=L (X-X) 2
n-1
s12 = 72.17 s22= 41.30 22
SI S7
variance of differences =+- nl n2
72.17 +
41.30 = 4.61 25 24
t= observed difference of means standard deviation of differences
8.36 - 3.46
4-. 6-1
= 2.28
degrees of freedom = n1 + n2 -2= 47
t(0.025,45) - 2.0141
we can reject Ho at 97.5% confidence level.

Appendix 10 SIGNIFICANCE TEST FOR TARGETTING ONLY AND ACHIEVING A REDUCTION IN SPECIFIC ENERGY
III IV
Saving 8 10 18 (9.4) (8.6i
No saving. 4 1 5 (2.6) (2.4)
TOTALS 12 11 23
Expected values are in brackets.
HO: that targetting only makes no difference in achieving a reduction in specific energy.
Test: chit test, 4 cell contingency table.
(0-E)2 E
0.208 0.228 0.754 0.817
2.007
X2 (0.25,1) = 1.323
2 x (0.111) = 2.706
. '. we can only reject Ho at 75% confidence level.
Note: NB expected values less than 5, see note in Appendix 3.

Appendix 11 SIGNIFICANCE TEST FOR TARGETTING ONLY AND ACHIEVING A HIGHER THAN MEDIAN REDUCTION IN SPECIFIC ENERGY
With targets
Without targets
Above median 3 58 (4.6) (3.4)
Below or equal 9 4 13 to median (7.4) (5.6)
TOTALS 12 9 21
Expected values are in brackets.
H: 0
That targetting only makes no difference in achieving a higher than median reduction in specific energy.
Test: chit test, 4 cell contingency table.
Median value: 5
X2 = 1.323
(0-E)2 E
0.556 0.753 0.346 0.457
2.112
we can only reject Ho at 75% confidence level.
Note: NB expected values less than 5, see note in Appendix 3.

Appendix 12 SIGNIFICANCE TEST FOR TARGETTING ONLY AND DIFFERENCE OF MEANS
With targets Without targets
X (x - X)2 x (x - X)2
2 16.81 15 42.25
2 16.81 2 42.25
0 37.21 20 132.25
0 37.21 2 42.25
5 1.21 0 72.25
0 37.21 5 12.25
0 37.21 7 2.25
5 1.21 18 90.25
4 4.41 8 0.25
25 357.21
10 15.21
20 193.21
73 754.92 77 436.25
H no differences between the means 0
Test: t-test for difference of means
Y1 = 73
= 6.1 x2 = 77
= 8.5
t-test for difference of means
S2 (X-Xý2
n-1
2= 754.92 = 68.63 s2=
436.25 _ 1 11 28 54.56

S2S ?
variance of differences =1+ nl n2
68.63 +
54.56 12 9
= 5.72 + 6.06 = 11.78
_ observed difference of means t standard deviation of differences
8.05 - 6.1
/il . 78
0.7
degrees of freedom = nl + n2 -2=
t(0.25,19) - 0.6876
12 +9-2= 19
we can only reject Ho at 75% confidence level.

Appendix 13 SIGNIFICANCE TEST FOR COST CENTRES AND ACHIEVING A REDUCTION IN SPECIFIC ENERGY
With cost centres Without cost centres
Reduction in 13 23 36
specific energy (9.5) (26.5)
No reduction in 0 13 13
specific energy (3.5) (9.5)
TOTALS 13 36 49
Expected values are in brackets.
H: cost centres make no difference in achieving a reduction in 0
specific energy.
Test: chit test, 4 cell contingency table.
(0-E)2 E
1.289 0.462 3.500 1.289
6.540
2 =5.024 X (0.025,1)
. '. we can reject HO at 97.5% confidence level.

Appendix 14 SIGNIFICANCE TEST FOR COST CENTRES AND ACHIEVING A GREATER THAN MEDIAN REDUCTION IN SPECIFIC ENERGY
With cost centres Without Cost centres
Greater than median 8 15 23 (6.1) (16.9)
Less than or equal 5 21 26 to median (6.9) (19.1)
TOTALS 13' 36 49
Expected values are in brackets
ä0 Cost centres make no difference in achieving a greater than median reduction in specific energy
Test: chit test, 4 cell contingency table.
(O-E) 2
E
0.59 0.52 0.52 0.19
1.82
2 (0.25,1) = 1.323
we can only reject Ho at 75% confidence level.

Appendix 15 SIGNIFICANCE TEST FOR USE OF COST CENTRES AND DIFFERENCE OF MEANS
With cost centres Without cost centres
2 2 x (X - X) x (X - X)
2 53.73 5 0.02
8 1.69 0 23.14
9 0.11 0 23.14
5 18.75 0 23.14
4 28.41 0 23.14
40 940.65 0 23.14
3 40.07 0 23.14
2 53.73 0 23.14
16 44.49 0 23.14
10 0.45 0 23.14
8 1.69 0 23.14
5 18.75 0 23.14
0 23.14
0 23.14
3 3.28
8 10.18
2 7.89
2 7.89
2 7.89
20 230.74
5 0.036
5 0.036
4 0.66
25 407.64
10 26.94
2 7.89
8 10.18
15 103.84
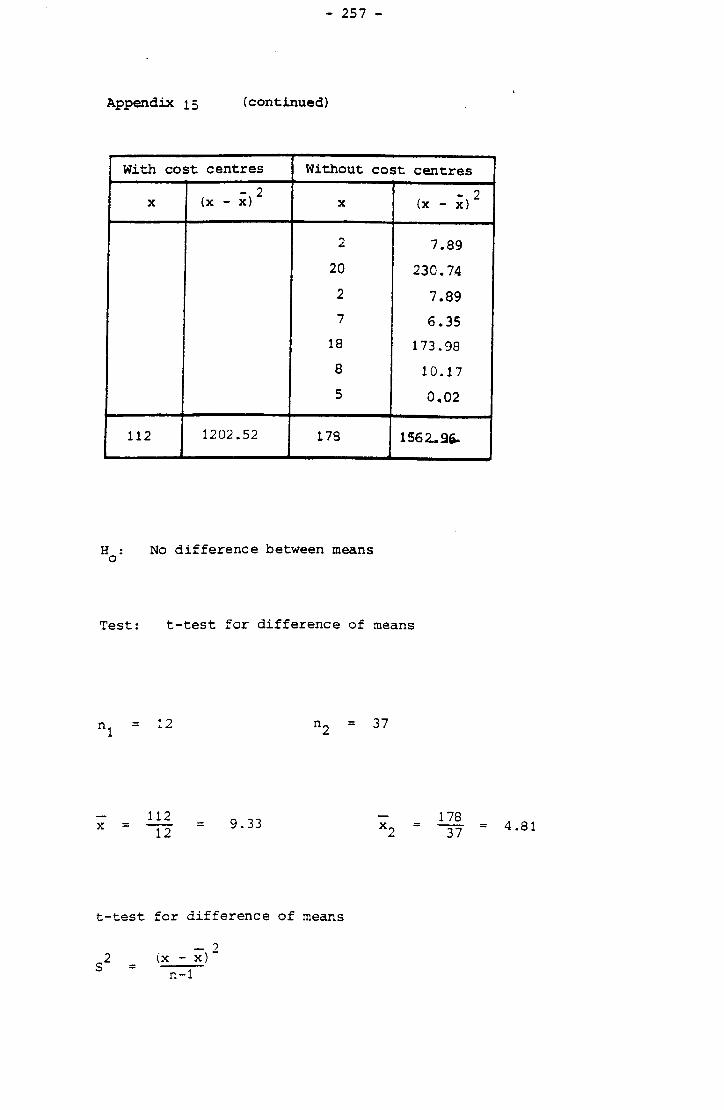
Appendix 15 (continued)
With cost centres Without cost centres
X (X - X) 2
X (X - X) 2
2 7.89
20 230.74
2 7.89 7 6.35
18 173.98
8 10.17
5 0.02
112 1202.52 178 1562.96.
H: No difference between means 0
Test: t-test for difference of means
nl = 12 n2 = 37
X= 112
= 9.33 x2 137
= 4.81
t-test for difference of means
S2 = ix - x)`
n-1

s12 = 108.98 s22 = 45.97
variance of differences 108.98
+ 45.97
= 10.33 12 37
t_ observed difference of means standard deviation of difference
9.33 - 4.81 t=
10.33
t=1.41
degrees of freedom = n1 + n2 -2= 47
t(0.1,45) - 1.3006
we can reject Ho at 90% confidence level.

Appendix 16 SIGNIFICANCE TEST FOR ENERGY MANAGEMENT GROUPING AND ACHIEVING A HIGHER THAN MEDIAN REDUCTION IN SPECIFIC ENERGY
Greater than Monthly Monthly, monthly or more targets and monitoring frequent cost centres
monitoring I& II III & IV V& VI
Greater than 2 12 7 21 median (6) (4.4) (5.6)
Less than or 12 10 6 28 equal to median (8) (12.6) (7.4)
TOTALS 14 22 13 49
FScpected values are in brackets
Ho Energy management grouping makes no difference in achieving a higher than median reduction in specific energy.
2 Test: chi test, 6 cell contingency table.
(O-E) E
2.66 13.13
0.35 2.00 0.54 0.26
18.94
2 (2,0.01) = 9.210
we can reject Ho at 99% confidence level.

- 260 -
Appendix 17 CALCULATION OF BREWERS' SOCIETY INDEX
Target Figures:
PROCESS VOLUME ELECTRICITY FUEL (V) Total
6 Total 6 (hl) (MJ/hl) (MJ x 10 ) (MJ/hl) (MJ x 10
Brewed and 228,561 5 1.14 100 22.86 Fermented
Chilled and 361,494 16 5.18 0- Conditioned
Bottled 60,309 44 2.65 258 15.56
Canned - 22 - 97 -
Kegged 301,185 11 3.31 59 17.77
Casked 76,069 2 0.15 48 3.65
ELECTRICITY FUEL
TOTALS (MJ x 106) A 13.03 B 59.84
TARGET TOTAL (MJ x 106) (A + B)
ACTUAL USAGE (MJ x 106)
C 72.87
D 90.57
USAGE EFFICIENCY 80.5% (C+Dx 100)
Source: Gordon (1981)

Appendix 18
Type of Site
SUMMARY OF CHARACTERISTICS OF PROPOSED HEAT PUMP INSTALLATIONS
Process Demand ý TL-s
(oýý
Cheese site
Cheese site
Cheese site
Cheese site
Butter site
Butter site
Butter site
Sterilising
site
Sterilising site
Pasteurising site
Pasteurising site
Brewery
Brewery
Brewery
Brewery
Brewery
Brewery
Brewery
Notes:
General hot water
Pasteurisation
Pasteurisation
Pasteurisation
Air preheat
Milk preheat
General hot water
Milk preheat
Boiler make-up
Pasteuriser
Pasteuriser
Space heating
Space heating
Bottle washing
Bottle washing
Boiler make-up
Boiler make-up
Flash pasteuriser
Waste Heat Source Output (kW)
Pasteuriser cooling 173 water
Evaporator cooling 1,790 water
Whey unit cooling 1,311 water
Pasteuriser cooling 590 water
Evaporator cooling 4,289 water
Evaporator cooling 512 water
Evaporator cooling 160 water
Steriliser overflow 428
Steriliser overflow 300
Refrigeration condenser 140
Effluent 140
Refrigeration condenser 2,671
Bottle and can 171 pasteuriser
Refrigeration condenser 172
Bottle and can 172 pasteuriser Refrigeration condenser 855
Bottle and can 134 pasteuriser
Refrigeration condenser 415
Q TL_S Temperature difference between load and source.
34
56
73
56
54
54
34
54
60
56
73
63
70
61
68
33
40
58
Source: Trade sources

Appendix 19 TECHNICAL PERFORMANCE RATIOS OF HEAT PUMPS AT VARIOUS TEMPERATURE DIFFERENTIALS
1. Electric motor driven heat pumps
Temperature PERFORMANCE RATIOS: differential - Excluding ancillary Including ancillary load to source drive drive
0 TL-s C COPh PER CFU PER CFU
80 1.95 1.76 0.53 1.68 0.50
70 2.20 1.98 0.59 1.87 0.56
60 2.55 2.30 0.69 2.13 0.64
50 2.95 2.66 0.80 2'. 42 0.73
40 3.40 3.00 0.92 2.73 0.82
30 3.95 3.56 1.07 3.10 0.93
20 4.80 4.32 1.30 3.63 1.09
2. Gas engine driven machines
Temperature PERFORMANCE RATIOS:
differential - Excluding ancillary Including ancillary load to source drive drive
0 TL-s C COPh PER CFU PER CFU
80 2.20 1.12 1.07 1.09 1.03
70 2.50 1.20 1.14 1.16 1.10
60 2.90 1.30 1.24 1.24 1.18
50 3.30 1.41 1.34 1.32 1.25
40 3.80 1.54 1.46 1.42 1.36
30 4.40 1.69 1.61 1.53 1.45
20 5.35 1.94 1.84 1.69 1.61
Notes: COPh
PER
CFU
coefficient of performance
performance effectiveness ratio
coefficient of fuel utilisation
See Technical Appendix 1 for definitions
Source: Masters et al, 1980

Appendix 20 BASIC MODEL FOR FORMULATING LP ALGORITHM FOR CHP
electricity export
electric, = import
x5
fuel to X1
CHP unit CHP unit
x3
X7
X12 fuel to boiler _1
BOILER x8
x4 x6
X10
electricity demand, Ed
I
1
steam export
steam demand, Sd
VARIABLES
x1 Fuel to CHP unit
x2 Electricity imported
x3 Electricity generated by CEP
x4 Electricity generated by CHP and imported electricity
x5 Exported electricity
x6 Electricity demand
x7 Steam produced by CHP
x8 Steam produced by boiler
x9 Steam produced by CHP and steam from boiler
x10 Steam demand, Sd
x11 Steam exported
x12 Fuel to boiler
All variables are in kW.
Constraints /

Constraints
CHP capacity in kW =Q
for a1 hour timespan, x3 <Q
Steam and electricity demands must be met
x10 = Sd
x6 = Ed
-x3 -x2 +x4 =0
-x4 -x5 +x6 =0
-x7-x8 +x9 =0
-x9+x11 +x10=0
fxl = x3
xý=Rx3
where f= fraction of fuel converted to electricity
where R= ratio of heat to power
Costs and realisations
Stream Price Cost (-) / Realisation (+)
CHP fuel x1 P1
Electricity import. x2 p2
Boiler fuel x12 p12
Electricity export x5 p5
Steam export x11 p11
+
+
Objective function
MINIMISE: [-xIPI - x12p12 - x2p2 + x5p5 + x11p11] t
where t= time period in hours.

Appendix 21 COST-BENEFIT ANALYSIS OF SUB-METERING
1. Assume:
Steam at 150 p. s. i. g. Line size
Cost of steam = £12.00 per ton
Maximum flow = 40,000 lbs/h
Load factor = 50%
Operating for 50 hours per week
8 11
40,000 x 50 Total steam flow per week =2x2,240 446 tons
Value of steam = . £5,350.00 per week
Tbtal installed cost of metering system for this duty, giving flow rate, total flow and flow recording, is approximately £3,200.00
Assume savings due to improved monitoring = 5%
Total cost savings = 0.05 x 5,350 = £367.50 per week
Payback period = 3,200 267.50 12 weeks
Internal Rate of Return = 380%
Sources: K Gervase-Williams, 1984 Gervase Instruments Ltd, technical literature

2. Assume:
6 inch line carrying 20,000 lb/h saturated steam at 200 p. s. i. g. System cost = £3,181.00
Assume average flow of 50%
Steam usage = 20,000
2= 10,000 lbs/h, 5 tonnes/h
Assume steam costs £12.00 / tonne or £S. 00 / tonne
Sensitivity Analysis
Variable factor: cost of steam
Steam cost = £12.00/t Steam cost = £8.00/t
% saving Payback Payback Payback Payback of steam period- period- IRR period- period- IRR
working years ($) working years ($) hours hours
1 5302 2.65 30 7953 3.9 18
5 1060 0.53 160 1590 0.79 110
10 530 0.26 350 795 0.39 225.
15 353 0.18 500 529 0.26 350
20 265 0.13. 720 397 0.19 490
Notes:
1. Assume one working year = 200 hours, i. e. 40 hour week, 50 weeks/year
2. One actual installation resulted in a saving of 22% of steam use.

Variable factor: capital cost.
Assume: capital cost = £6,000
average flow = 50%
steam usage =5 tonnes/hour
steam cost = £12.00/tonne as in base case
% saving in steam
Payback period in working hrs
Payback period in years (1) IRR ($)
1 10,000 5 13
5 2,000 1 83
10 1,000 0.5 170
15 667 0.3 300
20 500 0.25 365
Notes; 1. Assume 2,000h/year operation.
Variable factor: average flow
Assume an average flow of 20%
20,000 Steam usage =5= £12.00/tonne or £8.00/tonne
Steam cost = £12.00/t Steam cost = £8.00/t
% saving Payback Payback Payback Payback of steam period- period- IRR period- period- IRR
working years ($) working years ($) hours (1) (1)
1 13,254 6.7 7 19,881 9.9 <1 5 2,651 1.3 62 3,976 1.9 43
10 1,325 0.7 120 1,987 1.0 83
15 884 0.4 220 1,326 0.7 120
20 663 0.3 300 994 0.5 175
Notes: 1. Assume 2,000h/year operation.

3. Assume: 3" line, system cost = £2,300
A 3" line at 100 p. s. i. g. passes 6,000 lbs/h of steam
Assume the following utilisations; 20% and 50%
Utilisation Flow rate 20% 50%
lbs/hr 1,200 3,000 tonnes/h 0.6 1.5
Assume steam costs £15.00 or £10.00/tonne
Sensitivity analysis - Utilisation = 20%
Steam cost = £15.00/t Steam cost = £10. '00/t
% saving payback Payback Payback Payback of steam period- period- IRR period- period- IRR
working years ($) working years ($) hours (1) hours (1)
1 25,555 12.8 <1 38,333 19 <1 5 5,111 2.5 32 7,667 3.8 19
10 2,555 1.3 66 3,833 1.9 43 15 1,704 0.8 105 2,556 1.3 66
1 20 1,277 0.6 140 1,917 0.9 90
Notes: 1. Assume 2,000h/year operation.
Sensitivity analysis - Utilisation = 50%
Steam cost = £15.00/t Steam cost = £10.00/t
% saving Payback Payback Payback Payback of steam period- period- IRR period- period- IRR
working years (%) working years (%) years (1) years (1)
1 10,222 5.1 12 15,333 7.7 3 5 2,044 1.0 83 3,067 1.5 55
10 1,022 0.5 170 1,533 0.7 120 15 681 0.3 300 1,022 0.5 170
1 20 511 0.25 380 167 0.08 1200
Notes: 1. Assume 2,000h/year operation.

- 269 -
Appendix 22 COST-BENEFIT ANALYSIS OF A LOW-ENERGY LIGHTING SCHEME
The building is a brewery keg store, constructed in six portal sections,
each 60m x 22m.
Previous Lighting scheme: 320 trough reflector luminaires each incorporating two 125W, 8 ft. fluorescent lamps. Total illumination = 300 lux. Total installed load = 102.12 kW
Replacement system: 250 W 50 N lamps in Hermes 2 luminaires, 185 units installed using every other fluorescent point to reduce installation costs. Total illumination = 350 lux. Total installed load = 51.8 kW.
V
Increase in illumination = 50 lux.
Reduction in load = 50.32 kW
Assume electricity costs = 4p/kWh (June 1983)
Annual savings = (reduction in load)(hours run)(price per kWh).
Annual savings in £
Price per kWh (p)
Hrs run 3 4 8 per year
2,000 3,019 4,026 8,051 4,000 6,038 8,052 16,102 6,000 - 9,057 12,078 24,153 8,000 12,076 16,104 32,204
Capital cost of actual installation was £25,000 and a two-year payback period was achieved, giving an IRR of 41%.
Assume: price of electricity = 4p/kWh hours run = 6,000 hours/year (2 shifts, 16 hours/day, 360 days/year)
Savings = £12,078.

Capital cost (E)
Payback period (years)
IRR ($)
25,000 2.1 39 30,000 2.5 32 35,000 2.9 27 40,000 3.3 23 45,000 3.7 19 50,000 4.1 17
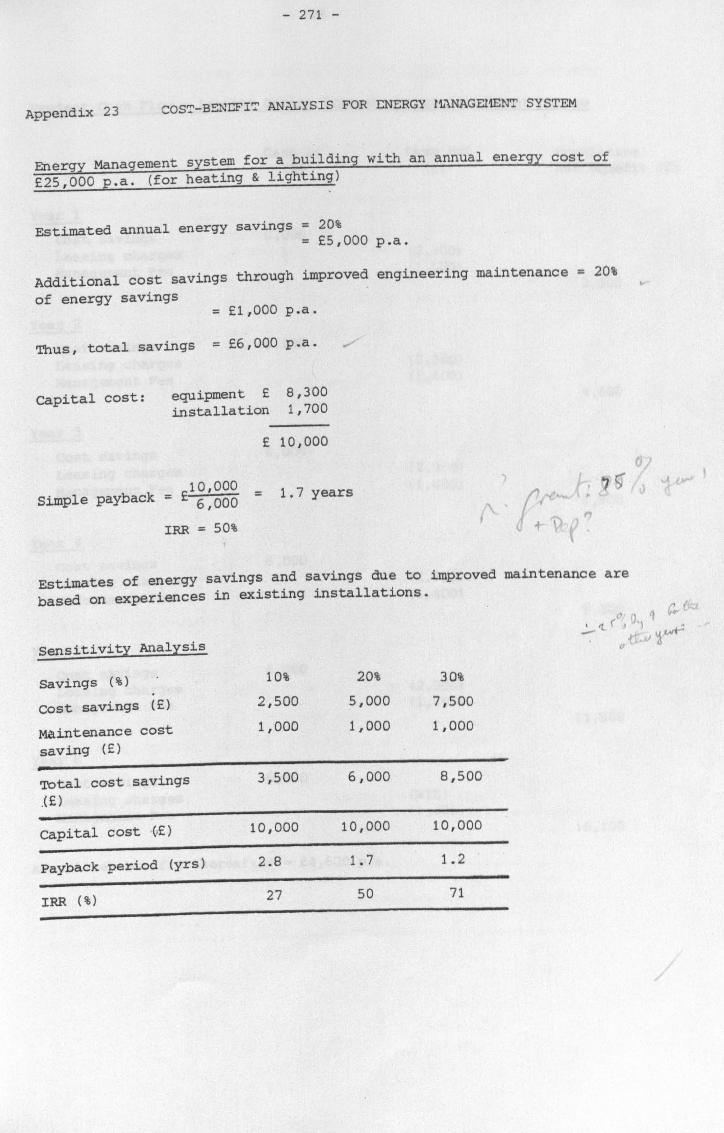
Appendix 23 COST-BENEFIT ANALYSIS FOR ENERGY tLINAGEIHEN' SYSTEM
Energy Management system for a building with an annual energy cost of £25,000 p. a. (for heating & lighting)
Estimated annual energy savings = 20% = £5,000 p. a.
Additional cost savings through improved engineering maintenance = 20% of energy savings
= E1,000 p. a.
Thus, total savings = £6,000 p. a.
Capital cost: equipment £ 8,300 installation 1,700
£ 10,000
Simple payback =£ 10,000 6,000 = 1.7 years
IRR = 50% a
ýý
Estimates of energy savings and savings due to improved maintenance are based on experiences in existing installations.
Sensitivity Analysis
Savings (%) 10% 20% 30%
Cost savings (£) 2,500 5,000 7,500
Maintenance cost 1,000 1,000 1,000 saving (E)
Total cost savings 3,500 6,000 8,500
. (£)
Capital cost (, £) 10,000 10,000 10,000
Payback period (yrs) 2.8 1.7 1.2
`iý. ý [�ý. ý
ý ýý
IRR (%) 27 50 71

Project Cash Flow - Leasing Option from an energy management bureau
Year 1
Cost savings Leasing charges Management Fee
Cash in (E)
6,000
Cash out (E)
(2,300) (1,400)
Cumulative Net Benefit (E)
2,300
Year 2
Cost savings 6,000 Leasing charges (2,300) Management Fee (1,400)
4,600
Year 3
Cost savings 6,000 Leasing charges (2,300) Management Fee (1,400)
6,900
Year 4
Cost savings 6,000 Leasing charges (2,300) Management Fee (1,400)
9,200
Year 5
Cost savings 6,000 Leasing charges (2,300) Management Fee (1,400)
11,500
Year 6
Cost savings 6,000 Leasing charges (NIL)
Management Fee (1,400)
16,100
Annual net benefit thereafter = £4,600 p. a.

Appendix 24 COST-BENEFIT ANALYSIS OF CONDENSATE RECOVERY PROJECT
Condensate recovery
It is proposed to recover 1,500. kg of condensate an hour, which is at present beign discharged to waste.
The amount of heat recoverable and the temperature of the condensate reaching the feed tank will depend upon such site conditions as the length of travel, the presence and correct use of flash steam, efficiency of lagging and ambient temperature.
Assume condensate reaches the feed tank at 90°C, where mains water previously used at 10°C. So by returning
1,500 x (90-10) x 4.187 = 500,000 kJ/h,
kg °C kJ/kg
a heat content of 330 kJ/kg is recovered.
it replaces the the condensate:
Sources: Fuel Efficiency Booklet 5, Steam cost and fuel savings, Department of Energy; Trade literature.
Base Cases
Condensate recovered = 1,500 kg/hour
Assume 4,000 hours/year
Condensate recovered = (1,500)(4,000)
Seat recovered = (6 x 10⁶)(330)
Assume boiler efficiency = 80%
6x 10⁶ kg/y
1.98 x 10⁹ kJ/y
Heat saved = (1.98 x 10⁹)(1/0.8) = 2.475 x 10⁹ kJ/y
= 2.3265 x 10⁴ therms/year
Assume price of fuel (gross) = 44p/therm (3,500s oil)
Cost saving = £10,237.
Capital cost £10,000 £20,000 £30,000 £40,000
Payback period (y) @ 4,000 h/year 0.98 1.95 2.93
@ 2,000 h/year 1.95 2.93 3.91
3.91
7.82
@ 8,000 h/year 0.49 0.98 1.95 2.93

Sensitivity analysis - temperature differential = 70°C
Assume 4,000 hours/year
Condensate recovered = (1,500) (4,000) _
Heat recovered
6x 10⁶ kg/y
1,758 x 109 kJ/y (6 x 10⁶) (293)
Assume boiler efficiency = 80%
Heat saved = (1.758 x 10⁹)(1/0.. 8) = 2.198
2.0657 x 10⁴ therms/y
Assume price of fuel (gross) = 44p/therm
Cost saving = £9,089
Capital cost
Payback period (y) @4,000 h/y
x 109 kJ/y
(3,500s oil)
£10,000 £20,000 £30,000 £40,000
1.1 2.2
@ 2,000 h/y 2.2 4.4 0
@ 8,000 h/y 0.55 1.1
Sensitivity analysis - boiler efficiency
Assume 4,000 h/y
Condensate recovered = (1,500) (4,000)
Heat recovered = (6 x 10⁶) (330) =
3.3
6.6
4.4
8.8
1.65 2.2
5x 10⁶ kg/y
1.98 x 10⁹ kJ/y
Assume boiler efficiency 70% - case (1)
Heat saved 2.829 x 10⁹
2.6593 x 10⁴
Assume price of fuel (gross) = 44p/therm
cost saving £11,700 (1)
85% - case (2)
2.329 x 10⁹ kJ/y
2.1893 x 10⁴ therms/y (3,500s oil)
£9,632 (2)
Case 1
Capital cost £10,000 £20,000 £30,000 £40,000
Payback period (y) @ 4,000 h/y 0.85 1.7
@ 2,000 h/y 1.7 3.4
@ 8,000 h/y 0.42 0.85
2.6 3.4
5.2 6.8
1.3 1.7
Case 2

Case 2
Capital cost £10,000 £20,000 £30,000 £40,000
Payback period (y) @ 4,000 h/y 1.04 2.1
@ 2,000 h/y 1.08 4.2
3.1 4.1
6.2 8.2
@ 8,000 h/y 0.52 1.15 1.55 2.05
Sensitivity analysis - fuel price
Assume 4,000 h/y
Condensate recovered = (1,500) (4,000) _
Beat recovered = (6 x 10⁶)(330) _
Assume boiler efficiency = 80%
6x 10⁶ kg/y
1.98 x 10⁹ kJ/y
Heat saved = (1.98 x 10⁹)(1/0.8) = 2.475 x 10⁹ kJ/y
= 2.3265 x 10⁴ therms/y
Assume price of fuel (gross) = (p) 20 40 60 80
Cost saving (E) £4,650 £9,310 £13,960 £18,610
Paybacks (y) Fuel cost (p/gross therm)
20 40 60 80 Capital cost (£)
10,000 2.1 1.1 0.7 0.54 20,000 4.2 2.2 1.4 1.1 30,000 6.3 3.3 2.1 1.6 40,000 8.4 4.4 2.8 2.1

Appendix 25 COST-BENEFIT ANALYSIS OF A KEG WASHING LINE HEAT RECOVERY SYSTEM
Installed cost = £51,000 (all in 1981 prices) Marginal cost on other lines = £15,000 (reported)
Occupacity 33%
Savings Heat
Steam
Steam cost
Water
Water cost
Effluent disposal cost
Total
Payback period (yrs) Capital 15,000 Capital 50,000
therms x 10
lbs x 106
£x 103
gals. x 106
£x 103
£x 103
£x 10
66% 100%
14.1 28.2 42.3
1.5 3.0 4.5 4.5 9.0 13.5
1.5 3.0 4.5
1.0 2.0 3.0
0.7 1.4 2.1
6.2 12.4 18.6
2.4 1.2 0.8 8.2 4.1 2.1
IRR i$) Capital 15,000 33 68 105 Capital 50,000 3 17 29
Design occupacity = 100%
Actual occupacity in first two years was 50%, giving a payback period of 5.5 years (an IRR of 12%) on capital cost of £51,000.
Source: Heat Recovery on a Keg Washing Line Demonstration Project at Scottish and Newcastle Beer Production Ltd, Holyrood House, Edinburgh. ETSU, December 1981.

Sensitivity Analysis - 50% reduction in heat and water recovered
Occupacity 33% 66% 100%
Savings Heat therms x 103 7 14 21 Steam lbs x 106 0.75 1.5 2.2 Steam cost £x 103 2.25 4.5 6.6
Water gals x 106 0.75 1.5 2.25
Water cost £x 103 0.5 0.75 1.5
Effluent £x 103 0.35 0.7 1.1 disposal cost
Total £x 103 3.1 5.93 9.2
Payback period (yrs) Capital £50,000 16.45 8.6 5.5 Capital £15,000 4.8 1.5 1.6
IRR i$) Capital £50,000 <1 3 11 Capital £15,000 13 32 50
Sensitivity Analysis - Capital Cost
Occupacity
Savings Heat
Steam
Steam cost
Water
Water cost
Effluent disposal cost
therms x 10
lbs x 106
£x 103
galz x 106
£x 103
£x 10
33% 66% 100%
14.1 28.2 42.3
1.5 3.0 4.5
4.5 9.0 13.5 1.5 3.0 4.5
1.0 2.0 3.0
0.7 1.4 2.1
Total £x 103 6.2
Payback period at Capital cost £15 x 103 years
12.4 18.6
2.4 1.2 0.8
IRR ($) 33 68 105
Payback period at 3 Capital cost £30 x 10 IRR (%)
Payback period at 3 Capital cost £75 x 10 IRR (%)
years
years
4.8 2.4
13 33
12.1 6.0
<1 9
1.6
51
4,0
18
Payback period at Capital cost £100 x 103 years 16.1 8.1 5.4 IRR (%) <1 3 11
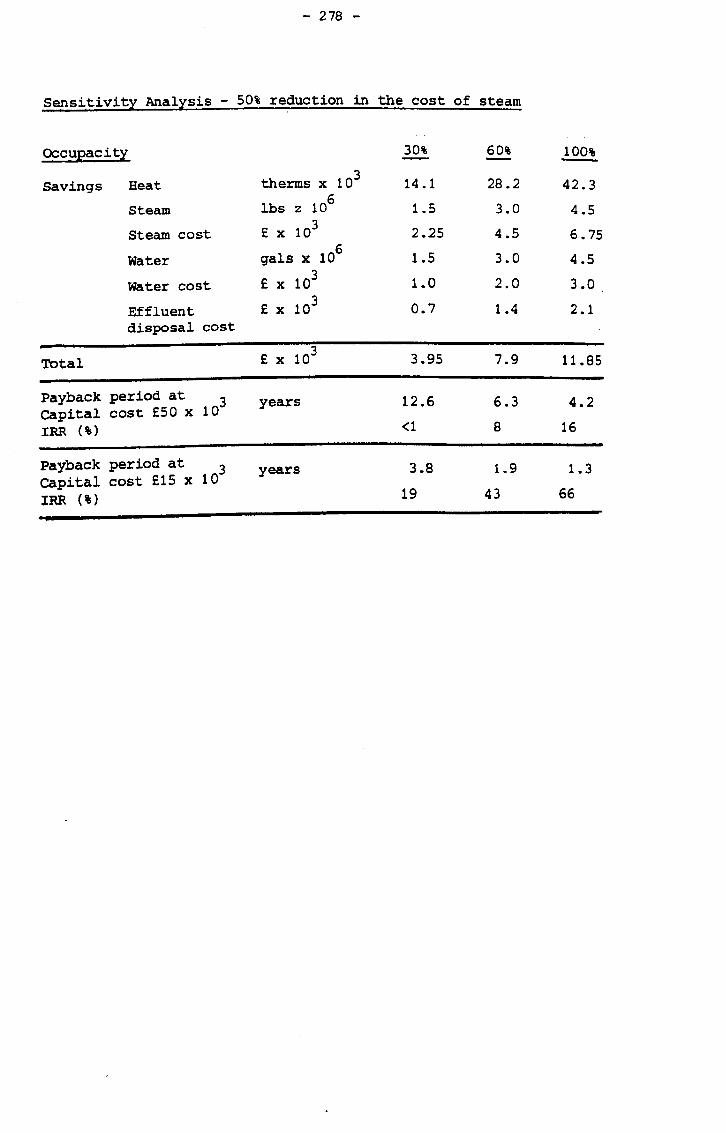
Sensitivity Analysis - 50% reduction in the cost of steam
Occupacity 30%
Savings Heat
Steam
Steam cost
Water
Water cost
Effluent disposal cost
therms x 10
lbs z 106
£x 103
gals x 106
£x 103
£x 103
60% 100%
14.1 28.2 42.3
1.5 3.0 4.5 2.25 4.5 6.75 1.5 3.0 4.5
1.0 2.0 3.0
0.7 1.4 2.1
Total £x 103 3.95 7.9 11.85
Payback period at Capital cost £50 x 103 years 12.6 6.3 4.2 IRR (%) <1 8 16
Payback period at Capital cost £15 x 103 years 3.8 1.9 1.3
IRR M 19 43 66

Appendix 26 COST-BENEFIT ANALYSIS OF A PASTEURISER IMPROVEMENT PROJECT
Re-engineering a pasteuriser to include extra heat recovery will save about £100,000 p. a. and provide a twelve month payback period.
Capital cost is about £125,000. Re-engineering takes two weeks.
Before After
Total Btu's utilised (Btu/h)
Total raw liquor
requirement (gallons/h)
Total effluent discharge (gallons/h)
Costs per unit
Savings (units)
Savings (£/h)
Total saving (£/h) @ 2,000 h/year @ 4,000 h/year @ 8,000 h/year
17 x 106
15 x 103
23 x 103
Saving
9x 10⁶ 8x 10⁶ 80 thexms
2.5 x 10³ 22.5 x 10³
2.5 x 10³ 20.5 x 10³
Heat Water Effluent 50p/therm 0.7p/1000 gals. 0.7p/1000 gals.
80 therms 22.5 x 10³ 10.5 x 10³ gallons gallons
40 0.1575
£40.1/h IRR (%) £ 80,200 67 £160,400/year 140 £320,800/year 290
0.1435
Utilisation Capital cost = £125,000
Capital cost = £200,000
Payback period IRR Payback period IRR (yrs) (%) (yrs) (%)
@ 2000 h/y 1.6 51 2.5 32 @ 4000 h/y 0.8 105 1.25 66 @ 8000 h/y 0.4 110 0.62 138
Sources: Barry Wehmiller Ltd, technical literature.

280 -
Appendix 27 LIST OF ORGANISATIONS CONTACTED DURING THE RESEARCH
Breweries
Alexander Brewery Ltd
Ballards Brewery Ltd Bass Brewing (Alton) Ltd Bass Brewing (Runcorn) Ltd Bass Mitchells and Butlers Bass North Ltd Bellhavens Brewery Co Ltd Boddingtons Breweries Ltd Border Breweries Ltd Bourne Valley Brewery Ltd
Carsberg Brewery Ltd Charles Wells Ltd Courage (Central) Ltd Courage (Western) Ltd
Devenish Weymouth Brewery Ltd Drybrough & Co Ltd
Everards Tiger Brewery Ltd
Friary Mieux Ltd
G. Ruddle & Co Ltd Gale & Co Ltd Gibbs Mew & Co Ltd Greenall Whitley plc Greene, King & Sons plc Guinness Park Royal Ltd
Hardys and Hansons plc Harp Lager (Northern) Ltd Home Brewery plc
Ind Coope Alloa Brewery Ltd Ind Coope Burton Brewery Ltd Ind Coope Romford Brewery Ltd
JW Lees & Co (Brewers) Ltd James Shipstone & Sons Ltd Joshua Tetley & Sons Ltd
Lorimers Brewery Ltd
Maclay & Co Ltd McMullen & Sons Ltd
Mitchells of Lancaster (Brewers) Ltd Morland & Co plc New Forest Brewery Ltd
Ringwood Brewery Ltd
Samuel Webster & Sons Ltd Scottish & Newcastle plc

TP Buck & Sons Ltd TD Ridley & Sons Ltd T&R Theakston Ltd Tetley Walker Ltd Tennent Caledonian Breweries Ltd The Heantree Brewery plc Tollemach & Cobbold Breweries Ltd The Tusbury Brewery Co Ltd Traquir House Brewery Ltd Trumans Ltd
Vaux Breweries Ltd
WM Darley Ltd Watneys London Ltd Welsh Breweries West Ltd Whitbread & Co plc (East Penines) Wrexham Lager Beer Co Ltd
Dairies
Aberdeen MMB Ltd Associated Dairies Ltd
Calorval Ltd Carnation Ltd Cliffords Dairy Products Ltd Cuthbertsons Ltd
Express Dairy Foods Ltd
Guilianotti Bros (Holborn) Ltd
Northern Foods plc
Unigate Dairies (Midlands) Ltd Unigate Dairies (Western) Ltd
Distillers
Amalgamated Distillery Production Ltd Arthur Bell & Sons Ltd
Benmore Distilleries Ltd Burnbrae (Blenders) Ltd
Chivas Brothers Ltd
Hiram Walker Ltd
J&A Mitchell Co Ltd J&J Grant Ltd John Dewar & Sons Ltd
Low, Robertson & Co Ltd
MacDonald & Muir Distillers Ltd
Stanley P Morrison Ltd Scottish Glen Distillers Ltd
The Atholl Distilleries Ltd The Invergordon Distillers Ltd Tullibardine Distillery Ltd
William Sanderson & Son Ltd Wm. Teachers & Sons Ltd
Maltings
Bermaline Ltd
Eric Fawcett Ltd
JP Simpson & Co (Alnwick)
Moray Firth Maltings Ltd
Pauls &Sanders Ltd
Robert Kilgour & Co Ltd
Brewery Equipment Suppliers
Ltd
Allied Breweries Engineering Services Ltd APV International plc
Burnett & Rolfs Ltd
Central Bottling & Brewing Services Ltd
Davenports Brewery (Holdings) Ltd
Flow Measurement & Automation (FMA) Ltd
RG Abercrombie Ltd
Malting Equipment Suppliers
Food and Beverage Developments Ltd
Dairy Equipment Suppliers
Alfa Laval Co Ltd
Star Refrigeration Ltd

Trade Associations
The Brewers' Society
Pentlands Scotch Whisky Ltd
The Maltsters Association of Great Britain The Dairy Trade Federation
Miscellaneous
RHM Research Ltd
The Heat Pump and Air Conditioning Bureau The Open University Energy Research Group The University of Newcastle upon Tyne
Science Policy Research Unit, University of Sussex
International Institute for Environment and Development
Prutec Ltd
AG Barn plc
Duncans Soft Drinks Ltd
The Coca Cola Export Corporation
3M United Kingdom Ltd
The Energy Technology Support Unit
Suppliers of Energy Conservation Equipment and Services
Absolute Energy Systems-and Engineering Products Ltd Air Aqua HRS Ltd
Babcock Power Ltd Barry Wehmiller Ltd Brammer Dynamics Ltd Bran & Luebba Ltd
Corning Ltd
DJ Neal Ltd
EASAMS Ltd Endless Energy Ltd Energy Conscious Design Ltd Energy Conservation Systems Ltd English Industrial Estates Ltd Environco Environmental Engineering Ltd ETC Ltd
Fiat Auto UK Ltd Ford Motor Co Ltd
GEC Gas Turbines Ltd
Haden Carrier-Ross Ltd

Imperial Chemical Industries plc (Mond Division) ITT Jabsco Ltd
James H Heal & Co Ltd John Thurley Ltd Johnson Matthey Research Ltd
Measurex International Systems Ltd Mecatherm Engineering Ltd
National Industrial Fuel Efficiency Service Ltd
PA Management Consultants Ltd
Roufor Associates Ltd Ruston Gas Turbines Ltd
Senior Economisers Ltd Sirycon Ltd Spooner Industries Ltd Stordy Combustion Engineering Ltd
Trace Heat Pumps Ltd
Utilico Ltd Utility Management Company Ltd
Vickers2Dawson Ltd
Watt, Joule & Therm (Stratford) Ltd Welsmere Ltd Westinghouse Electric Ltd

Appendix 28 QUESTIONNAIRE FOR BREWING SITES
This questionnaire concerns energy management procedures and energy conservation investments in breweries. Any information received will be treated in strict confidence and not used in a manner in which individual companies can be identified. It is to be completed by the
person most responsible for energy management.
1. Which of the following size ranges includes your site? (Please �)
Production level 0- 99 (000s hl/annum) 100 - 199
200 - 299
300 - 399
400 - 499
500 - 999
1,000 - 1,499
1,500 +
............
............
............
............
............
............
............
............
2. Which of the following energy conservation or cost saving measures have you installed?
Measure Year installed
a. High efficiency lighting
b. Replacement of over-sized electric motors
c. Power factor correction
d. Additional heat recovery from cooling of boiled wort
e. Copper vapour heat recovery
f. Heat recovery from keg
4"
washing line effluent
Heat recovery from other effluent sources
h. Fuel switching (please specify fuels switched to/from)
i. Others (please specify)
Other comments
...................
...................
...................
...................
...................
...................
...................
...................
...................
3. /

3. If you have not invested in fuel switching, have you made an economic appraisal of fuel switching proposals? YES NO (delete)
4. Is energy consumption sub-metered for individual cost centres?
5. Are targets set for the reduction of energy consumption for
a. the whole plant YES NO (delete) b. cost centres YES NO
YES NO (delete)
6. How often is energy use monitored and compared to production output? (Please �)
Daily
Weekly
Monthly
Quarterly
Yearly
Other (please specify)
......................................
7. What reduction (in percentage terms) have you achieved in specific
energy use (i. e. energy per production output unit) in:
a. The last two years %
b. The last five years %
8. What level in the organisation do you, as manager responsible for energy conservation, report to? (Please �)
Plant engineer level
Plant manager level
Company general manager level
9. Are you responsible for a separate energy conservation budget?
YES NO (delete)
10. /

10. What is your background discipline/experience?
Engineering
Brewing
Finance
Other (please specify )
.........................
(Please �)
11. Roughly what proportion of your time is spent on energy conservation projects/matters ý
12. What other major commitments/remits do you have within the firm?
13. Which of the following journals do you read regularly?
Energy Management
Energy Manager
Plant Engineering & Maintenance
Energy World
Energy in Buildings
Journal of the Institute of Energy
The Chartered Engineer
CIBS
The Brewer
IEE News
Journals and publications of the Accountancy professi on
Management Today
(Please �)
Please specify any other professional/trade journals you read regularly:
Please return completed questionnaire to: Steven D Fawkes Technological Economics Research Unit University of Stirling STIRLING FK9 4LA Scotland

Appendix 29 STANDARD ASSUMPTIONS FOR DCF CALCULATIONS AND EXAMPLE CALCULATION
The following standard assumptions were used in calculating all
the Internal Rates of Return figures quoted in the thesis.
Project lifetime = 10 years
75% First year Capital Allowance
25% Allowance in Year 2
50% Corporation Tax
One year tax lag
No balancing charges
Company is making sufficient profit to benefit from capital
allowances.
No scrap value.
The capital allowances used are those outlined in the 1984
Budget for financial year 1984/85.
A ten year life has been used as a standard throughout the
thesis but it should be noted that when retrofitting to existing
plant, five years may be more appropriate. Use of a five year
life severely reduces Internal Rate of Return when compared to
a ten year lifetime.

- 289 -
I
ý 0 0 0 w ý .. 1 ý ia
w
. -1
N ýD OO
Co
Lo O M ýp v M OO
OO
ýlo Co N
ýp ýp M lp M M OO
OO
oý r- ('n . -a
O M tD v M O "-+ OO
O le tf1 !ý
r- lD lD ý. 0 v M O -+ OO
Co cP
w ý. 0 M Dv M ON
OO
N ýD M Q1
10 10 v M .rM
OO
V' 1.0 lD v l0 v m . - u1 { .
ll OO
Ln Co ý N Ql ul
r1) M NN
.ý
üý un r- r, d N N Mý
ýý ON
-. in tf1 tý �D O
-4 0 ýD ýD �D O r . -+ O . ý... O
O O . -+ O
aa O Ln
m cV
O N ý
u1 G ., Ö
O .C U ul ýu (Ti W
r ý -d r U) . y AI '-1 n b Cý Z: w rp Z. 3Ox 0 +-+ GX ý4 U 4J Ö;
s. ý4 ý >,
y. l > .. O
> -1 Z U) U
CM aCß ^ ý4 - z C Q ca Z) 0 n in
. »I
U
CD 0 o cop 0 ö in
u tl
N cn
H N
C) 4-) GV
Ol S-I ` :3U
I 1J cU Q)
oaß w o .ý
u aý +J id
(1! +0 ul C
U U)
wC .ý oý "J ý
,"J : /ý "

Appendix 30 NOTES TO STATISTICAL APPENDICES
In all chit tests X2 = chit
The numbers in the tables for chit tests refer to the number of sites with the appropriate characteristic.
In all t-tests x= the declared reduction in specific energy over the last two years.
0= observed value of x
E= expected value of x
Ho = null hypothesis
All tabulated values are taken from "Mathematical Statistical
and Financial Tables for the Social Sciences", Kmietowicz and Yarnoulis (1976), Longman.
All test methods are taken from "Statistics for the Social Scientist: 2: Applied Statistics", Yeomans (1968), Penguin.
Notes concerning the applicability of chi 2
tests when expected
values fall below 5 are to be found in Appendix 3. Although
not strictly applicable in these cases the test is still commonly
used. The results should be viewed with even more caution than
usually appropriate for statistical tests in this sort of
context. In all those tests the declared reduction in specific energy over the last two years has been used as a proxy for success in energy management. As was discussed in Section 2, the use of reduction in specific energy as a measure of success is very
simplistic.

TECHNICAL APPENDICES

Technical Appendix 1' HEAT PUMP TECHNOLOGY
1.1 Technical Principles
There are two main types of heat pumps, vapour compression and
absorption. The former is more developed and is the basis of
most heat pumps currently available in the UK market. Most
commercially available heat pumps operate on the Rankine cycle
which is described below.
A fluid passes round a closed circuit and absorbs heat from a
source and discharges it to a load; the fluid is selected so
that it will condense and evaporate at temperatures appropriate
to the load and source if suitable pressures exist within the
condenser and evaporator. The temperature lifts between the
evaporator and the condenser is achieved by compression of the
fluid, which enables the necessary temperature rise to be
obtained for the minimum input of energy. Figure 1 shows the
basic components of the vapour compression cycle.
Figure 2 illustrates the closed cycle with reference points on
a pressure/enthalpy diagram. Starting at point 1, the working
fluid enters the evaporator heat exchanger and absorbs heat from
the source. The liquid evaporates at constant pressure until
dry superheated vapour is formed at point 2. The vapour is
drawn into the compressor where its pressure, and consequently
temperature, are raised to point 3. At this point the fluid is
still a superheated vapour, but now at a higher pressure and
temperature. This vapour enters the condenser where, by virtue
of its higher temperature, heat is transferred to the load.
Whilst giving up latent heat, the vapour condenses at constant
pressure until only liquid remains (point 4). The pressure of
the liquid is then reduced, usually across a throttle valve,
causing a fall in temperature before entry to the evaporator.

Technical Appendix 1
Figure 1 BASIC COMPONENTS OF THE VAPOUR COMPRESSION HEAT PUMP
QO%l1 ý.
Q IN
tW
Lom d aft s¢r
Com Pre-SSo(
I
Q; hQ..: c ýCýOzs
w= woýý
&X r--s c o^
vex. lvn. -
Source: Masters et al (1980)
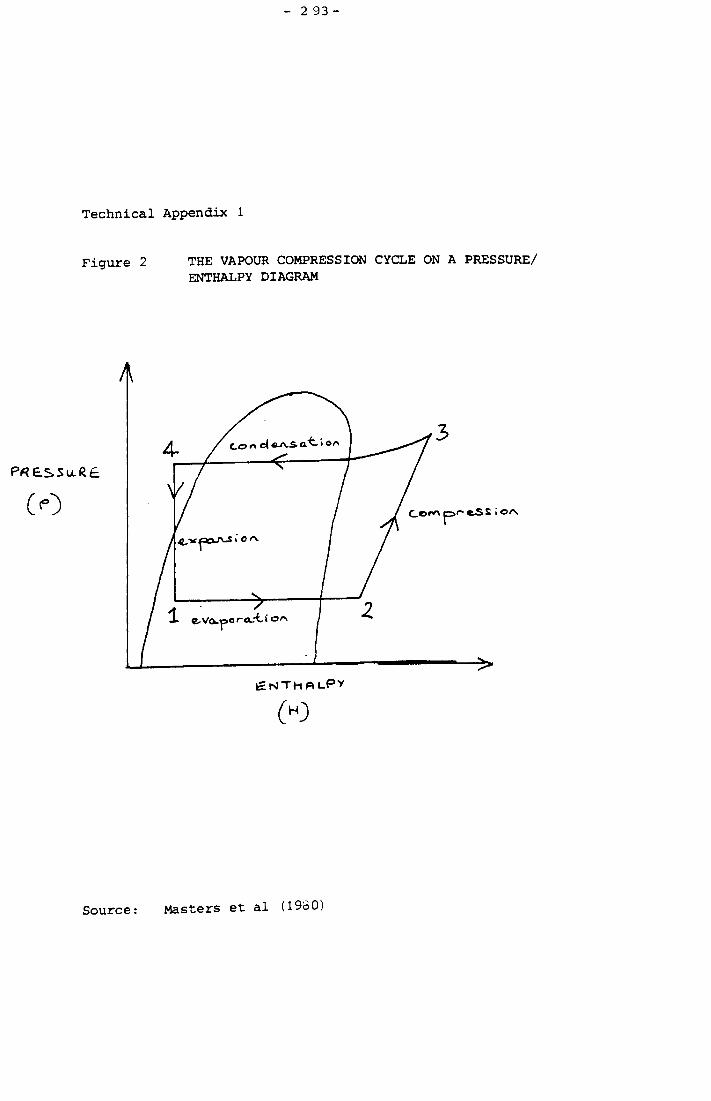
Technical Appendix 1
Figure 2 THE VAPOUR COMPRESSION CYCLE ON A PRESSURE/ ENTHALPY DIAGRAM
ý
PftESSu. Rt
(P)
ENTHALPY
(H)
Source: Masters et al (1960)

The shaft power to the compressor can be supplied by any form of
motive power but the more usual forms are electric motors and
gas fuelled internal combustion engines. Most heat pumps (for
all purposes) currently in operation utilise electric motor
drives although gas and diesel engine drives are currently in
use in the UK, Japan and the USA. Gas and steam turbines may
be viable in larger systems, particularly those proposed for
district heating (Masters et al, 1980).. A steam turbine driving an
industrial heat pump is to be demonstrated in the UK in the near
future (1983/84) under the auspice of the Energy Conservation
Demonstration Project Scheme.
Alternative power cycles being developed for heat pump use
include Stirling, closed cycle Brayton, Ericson and organic
Rankine cycles (Masters et al, 1980).
1.2 Performance comparisons for heat pumps
Useful definitions of performance for any system depend upon the
purpose for which they are required. The user wishes to know
how much energy delivered by the heat pump costs compared to
alternative sources of supply. At the national level it is the
use of primary energy that is of concern. For these reasons
three terms are used to discuss heat pump performance, and these
are explained below.
1.2.1 Coefficient of Performance; COP:
This refers only to the heat pump cycle and is the ratio:
heat discharged from the condenser COPh =
work done in driving the compressor
and is, in theory, equal to:
T1
T2 - T1
where T1 = source temperature
T2 = load temperature
both in degrees Absolute (K)

This ratio represents a theoretical maximum and the practical
value of COPh is unlikely to exceed 50% of the theoretical
value. The thermodynamically imperfect nature of all real
machines means that the ratio of real to theoretical COPh is
unlikely to be significantly improved (Reay. and Macmichael, 1979).
1.2.2 Performance Effectiveness Ratio; PER:
This refers to the complete installation, including engine heat
recovery if used. It should include the power used by ancillaries
such as fan or pump drives but this component is often omitted.
The ratio allows the potential adopter to calculate directly the
cost of energy delivered by the heat pump from the cost of gas
or electricity supplied to the installation. It is defined as:
PER - useful heat output from the complete installation total energy input to the installation
1.2.3 Coefficient of Fuel Utilisation; CFU:
This is the ratio of the useful heat output of the system to the
quantity of primary fossil fuel used. It therefore takes into
account the efficiency of generation and transmission of energy
and enables broad comparisons to be made of the efficiency of
primary fuel usage. It is defined as:
CFU _ useful heat output from the complete installation primary energy used to supply energy to the installation
CFU is of more interest at national level rather than at the level
of individual companies making investment decisions. Primary
energy use is irrelevant to the potential adopter if he is using
financial criteria.
1.3 Comparison of Performance Ratios
Figures 3 and 4 show the flow of energy to the point of use for
electric and gas engine driven heat pumps respectively. The data
is appropriate for a source at O0C and heat being delivered at 650C.
Typical values for the three performance ratios are given.

Technical Appendix 1
Figure 3 THE FLOW OF ENERGY IN AN ELECTRICALLY DRIVEN HEAT PUMP
100 COPh 43
PER
= 2.35
100 = 1.98
51
100 CFU = 170 = 0.59
Source: Masters et al, 1980

Technical Appendix 1
Figure 4 THE FLOW OF ENERGY IN A GAS DRIVEN HEAT PUMP
ý 15 5i; zw Losses
ý/ 4(c kW ýL. _,.. _.. / "ýb rp. tAver&j-
88 W 83 W (3b f roM eLs e(1fji. rt¢.
V 20 ký W tc, dr ý ve G. ortýsso r
2 Ix W to dr: ra.. at, c f%n
COPh
/ nn
3+ kw {'fGM SOV. rGQ
54
PER
CFU
20
100 83
i nn
= 2.70
= 1.20
A88 = 1.14
15 kW non - reoverable,
54- kW 100 hW h"ýt outPLA,
Source: Masters et al, 1980

It can be seen in Figure 3 that for every 100kW of heat required
by the user, 119kW are lost as waste heat from the generation of
electricity and its transmission. This corresponds to a gener-
ation and transmission efficiency of the electricity supply system
of 30%. The electric motor driving the heat pump may attain an
overall efficiency of 90% and thus the overall efficiency of
primary energy use to drive the compressor is 27%. It has been
assumed in the analysis that the source is ambient air and that a
power requirement equivalent to 5% of the evaporator heat transfer
duty, is needed to drive the fan. The heat pump under these
conditions will have a COPh of 2.35. For every 1OOkW of heat
delivered to the customer, 51kW of electricity are consumed
locally and 170kW of fossil fuel are burned nationally (assuming
the electricity is supplied by fossil fuel power stations). The
PER therefore is 100/51 = 1.98. This ratio divided into the
price of the electricity used enables the unit cost of heat from
the heat pump to be calculated directly. Similarly the CFU is
100/170 = 0.59 and this term indicates the efficiency of primary
energy use. This is a tremendous improvement in performance if
hitherto the customer used electricity for low temperature heating
at an overall efficiency of 30%.
Figure 4 shows the equivalent information for the gas engine driven
heat pump. In this case for each unit of heat supplied from the
gas terminal, only 5% of the energy is used in the transmission
system, and the customer receives gas with a 95% overall efficiency.
The generation of shaft power by the gas engine is 26% efficient
and so the overall efficiency of energy use to drive the compressor
is 25%. A similar assumption has been made for calculating the
power requirement of the evaporator air fan as for the electrically
driven machine. Under these conditions the heat pump will have a
COPh of 2.7. The PER will be 1.20 and thus for each 100kW of
heat required by the consumer, 83kW of gas will be consumed. The
CFU of 1: 14, is higher than the electric counterpart due to the
local generation of shaft power providing heat which can be gain-
fully used.
The data in Appendix 19 gives the performance ratios for
electrically driven and gas engine machines at a range of
temperature differentials. An important point is that heat
pump performance drops as the temperature difference between
load and source increases. This is a major barrier to wider
economic use of heat pumps.
As mentioned above, shaft power efficiencies of the gas engine
and electric motor have been assumed to be 26% and 90%
respectively. Both figures are conservative for full load
operation. Where part load is common, as is likely to be the
case for space heating, shaft power efficiencies may well be
lower than stated. Defrosting, which is necessary periodically,
will also detract from the performance. The gas engine heat
pump has the advantage that the engine heat output is still
available during the defrost period.
1.4 Use of Performance Ratios
As has been shown each of the three performance ratios describe
different systems and have different uses. The COPh which is
the most commonly quoted measure of performance only applies to
the condenser-compressor subsystem and really has little practical
purpose other than in designing the machine.
The PER covers the complete installation and is therefore most
useful to the end-user. As mentioned above it allows the easy
calculation of the price of heat delivered by the machine.
The CFU is primarily of interest at the national level. The
effect of an installation on the national primary energy use is
of little or no interest to the individual company making invest-
ment decisions.

It can be seen that from the point of view of the end-user the
most useful measure of performance is in fact the PER. Most if
not all technical literature, however, stresses COP h*
Obviously COPh has a higher value than the corresponding PER and
so its use in the marketing of heat pumps is understandable from
the suppliers point of view. Prospective purchasers of heat
pump-systems should however be aware of the difference between
COP and PER.
1.5 Technical Limitations
There are two main technical limitations on heat pump development,
namely COPh and output temperature. The theoretical COPh is
determined by the temperature differential between load and source
and as such is fixed by thermodynamics. In practice the COPh
achieved will be much less than typically about half this
theoretical value. This ratio of theoretical COP to actual COP
is unlikely to be improved upon as it is a result of the thermo-
dynamically imperfect nature of all real machines (Reay and
Macmichael, 1979).
The maximum output temperature commonly achieved at present is
about 70 to 80°C. Beyond this there are serious problems
concerning refrigerant stability and materials. A prototype
steam generating heat pump has been made which produces low
pressure steam at 110 0C (Reay, personal communication). Work
is proceeding both in the UK and elsewhere on increasing this
temperature. Westinghouse in the USA are reported to be develop-
ing an electric heat pump producing steam at 150°C (Trade sources).
These improvements in output temperature will almost certainly
incur additional capital cost per unit of output due to added
complexity and higher materials costs. Applications for high
temperature heat pumps are also likely to be limited by the need
for a source at 70 to 80°C. Depending on the needs of the site
it may be more attractive to recover heat from a source stream at
this temperature by conventional heat recovery. Improved process
integration may remove source streams at these relatively high
temperatures.

Technical Appendix 2 COMBINED HEAT AND POWER SYSTEMS
2.1 Each of the main combined heat and power (CHP) techniques currently
available are described. Fuel cells are also described as they
are likely to be available on the UK market as a CHP technique at the end of the 1980s (trade sources).
2.2 Steam turbine systems
Steam turbines have long been used in industry to generate power.
Conventional steam turbine technology is employed in the majority
of present industrial CHP installations. Components of steam
systems (boilers, turbines, generators) have reached high levels
of reliability and well known performance characteristics. A
schematic of a steam turbine CHP system is shown in Figure 1.
Conventional dual purpose steam systems employ turbines which
extract a portion of the energy present in the steam by partially
reducing the pressure of the inlet steam and then releasing the
steam at a lower pressure for subsequent process use.
2.3 Gas turbine systems
Starting with their heavy use by the aircraft industry in the
1950s, gas turbines have been developed into highly efficient and
reliable prime movers. Since about 1960 they have been used in
industrial power systems. A schematic of a gas turbine CHP
system is shown in Figure 2.
The gas turbine is a Brayton cycle engine and attains maximum
efficiency at high operating temperatures. Consequently the typical
turbine operates above 815°C (15000F) and exhausts combustion products
at 427 to 538°C (800 - 1000 F). Passing these gases through a heat
recovery boiler produces steam and recovers much of the thermal energy
that would otherwise be lost. Though there are a few industrial
applications where the hot exhaust gases from a gas turbine can be
used directly for process heat, the discussions will be confined to
steam generating systems.

Technical Appendix 2
Figure 1 COMBINED HEAT AND POWER CYCLE USING A STEAM TURBINE
HIGH PRESSLkRr STEAM

Technical Appendix 2
Figure 2 COMBINED HEAT AND POWER CYCLE USING A GAS TURBINE
G. pg -ruRraºNE
AIR
ý- Fu.. L
u
ý
/I &FNERATOR
ý ELEC'rRiCtr
, y,. ýR6CESS t1E. g7-( OPTIoWAL-)
F--: ý*
WasTli'- HFRT BOILER
HE, Mi'r
EXGHaNGER COM B11STl ON
AtR PC2tHGpT
PßoGESS STE, RM
A serious limitation of commercially available gas turbines is
their requirement for "clean" fuels. Gas and distillate oils
are the principal alternatives. Treated residual oils have been
used successfully in some turbines, but it becomes necessary to
shut down the turbine for cleaning at frequent intervals.
Certain types of turbines can be installed in a "closed" cycle
whereby almost any type of fuel is burnt in a suitable furnace,
and circulating air (or other gas) glowing through heat exchanger
tubes in the furnace, is heated to the. temperature and pressure
needed to drive the turbine. Closed systems however operate at
10 to 20% lower thermal efficiency than open systems. Currently
closed systems are only available in larger sizes, above 20 MW.
As this is considerably larger than the size required at sites in
the four sectors closed systems will not be considered in the
economic analysis.
When a gas turbine (Brayton cycle) is coupled to a heat recovery
boiler and the steam is used to operate a steam turbine (Rankine
cycle) the system is termed a "combined cycle" operation.
Gas turbine. CHP systems are particularly attractive in their
ability to satisfy a wide range of operating conditions. Industrial
rated gas turbine-generator sets are ccmmercially available in sizes
from approximately 500 kW (100 kW in the USA) up to more than
50,000 kW.
Gas turbines can be quickly started up or shut down, to follow
changing steam and electricity loads. In a combined cycle type
of operation a significant (e. g. threefold) range of variation in
the ratio of electricity to steam can be achieved while still
keeping a high overall thermal efficiency.
A vital factor in the viability of CHIP schemes using gas turbines is
that heat can be raised in the waste heat boiler by burning fuel in the
exhaust which contains 18% wt. of oxygen. This. increases the load
to power ratio by a factor of 6.

2.4 Diesel engine systems
It should be noted that although we distinguish this class of
prime movers by the name "diesel", it is entirely feasible to
use recriprocating piston engines fueled with natural gas, bio-
gas, gasoline, or even residual oil.
Diesel engines for the continuous duty, CHP type of services are
commercially available in sizes from 4 up to 30,000 W. It is
common practice in diesel power systems to use multiple engines.
Heat is removed from the diesel engine in two principal streams.
One is the combustion product exhaust which contains 50 to 60% of
the heat leaving the engine. The other is the engine coolant
fluid which removes about 30% of the heat. The exhaust gases
reach a maximum temperature of 454°C (850°F) and can be passed
through a heat recovery boiler to generate steam. Only about
two-thirds of the heat in the exhaust can normally be recovered
because the gases contain potentially corrosive components and
must exit from the boiler at a temperature above the dew point.
For most diesel engines the cooling fluid has a maximum temperature
of 87°C (150°F). Industrial uses for this heat flow are very
limited, and often no attempt is made to use the cooling fluid
heat. A schematic of a diesel CHP system is shown in Figure 3.
Most so called 'gas' engines require the injection of oil to
facilitate combustion, typically 8% (Ryan, personal communication
1983) of the fuel input is liquid fuel. As the price of oil
dermatives is higher than that of gas, this increases the average
price of fuel used by the prime mover. Recently (1983/84) a
chemical company has installed the first large spark ignition
(i. e. not a diesel strictly) gas engine in the UK (trade sources).
Use of such engines overcomes this disadvantage of gas fuelled
internal combustion engines.

Technical Appendix 2
Figure 3 COMBINED HEAT AND POWER CYCLE USING A DIESEL ENGINE
FUEL AIR
Ge NERq'To2
DIESEL ENGINE ELELzR 1 C1 'C y
WASTE
Hrq-r p2oc. £SS
BOIL I lip
. STE AM

2.5 Fuel cell systems
A fuel cell consists of two electrodes separated by electrolyte
which transmits ions but not electrons. The fuel, hydrogen or a
hydrogen enriched gas, is supplied to the anode where hydrogen is
dissociated into hydrogen ions releasing electrons to the anode.
The hydrogen ions migrate through the electrolyte to the cathode,
where they react with oxygen and electrons to form water, in the
form of steam. The electrons produced on the anode flow through
the external electric circuit providing direct current electric
power.
Early practical fuel cells, developed for the space programme,
utilised hydrogen and oxygen directly. As hydrogen is not widely
available as a fuel, terrestial fuel cells utilise natural gas or
a similar fuel, e. g. bio-gas. A fuel cell system for CHP is
shown in Figure 4. This is passed through a steam reformer,
utilising steam produced in the fuel cell itself.
Although fuel cells are currently not available for CHP
applications, a range of units between 40 and 400 kW(e) output
are being developed. They are expected to be available in the
late 1980s (Ryan and Cameron, 1984) and are projected to cost
approximately £1,000/kW(e), a cost which could reduce to £500/kW(e)
with market expansion.
Fuel, which can be natural gas or bio-gas, is passed into a steam
reformer which produces hydrogen enriched gas for use in the fuel
cell itself. The dc power produced by the reaction between the
hydrogen enriched gas and the oxygen in the air within the fuel
cell, is converted to ac in an inverter or power conditioner.
Fuel cells have several advantages over conventional power
generation equipment. Firstly there are environment benefits.
The only effluent is pure water, no combustion products are given
out, less heat is dumped into the environment and noise levels
are too low. Other advantages also stem from the way in which
chemical energy is directly converted into power in a fuel cell.
Conventional power generation equipment converts chemical energy
in fuels into heat energy which is then converted into mechanical
energy. Fuel cell systems circumvent the limitations on total
system efficiency imposed by the second law of thermodynamics.

Technical Appendix 2
Figure 4 COMBINED HEAT AND POWER SYSTEM USING A FUEL CELL
AIR
P U, EL Hy D ROGEN
ENRIC1f1M
-F- ua L-
%-r e :! M
F ut L Ci;: LL
1 U, c.
POWER
A. c. PowER IN v4L(Z-rEA.
Y HEAT (No'r WAz c-_R)
REFERENCE for Technical Appendix 2
ReFORMF-R
RYAN, F and CAMERON, DS (1984) Fuel cells: a potential means of energy saving by on-site co-generation of heat and power. in Energy World, February 1984, No. 111.
Related Documents