The Positivity Scale Gian Vittorio Caprara and Guido Alessandri Sapienza University of Rome Nancy Eisenberg and A. Kupfer Arizona State University Patrizia Steca University of Milan–Bicocca Maria Giovanna Caprara Universidad a Distancia de Madrid Susumu Yamaguchi and Ai Fukuzawa University of Tokyo John Abela McGill University Five studies document the validity of a new 8-item scale designed to measure positivity, defined as the tendency to view life and experiences with a positive outlook. In the first study (N 372), the psychometric properties of Positivity Scale (P Scale) were examined in accordance with classical test theory using a large number of college participants. In Study 2, the unidimensionality of the P Scale was corroborated with confirmatory factor analysis in 2 independent samples (N 1 322; N 2 457). In Study 3, P Scale invariance across sexes and its relations with self-esteem, life satisfaction, optimism, positive negative affect, depression, and the Big Five provided further evidence of the internal and construct validity of the new measure in a large community sample (N 3,589). In Study 4, test–retest reliability of the P Scale was found in a sample of college students (N 262) who were readministered the scale after 5 weeks. In Study 5, measurement invariance and construct validity of P Scale were further supported across samples in different countries and cultures, including Italy (N 689), the United States (N 1,187), Japan (N 281), and Spain (N 302). Psychometric findings across diverse cultural context attest to the robustness of the P Scale and to positivity as a basic disposition. Keywords: scale development, positive orientation, well-being, confirmative factor analysis, measure- ment invariance Interest in the positive features of individual functioning has gained increasing attention over recent decades primarily due to the contributions of positive psychology movement (Seligman & Csikszentmihalyi, 2000). This movement has generated a call for a strong commitment of both scholars and practitioners to the identification of major determinants and proper indicators of op- timal functioning. In this regard, several authors at different times have pointed to individual differences that to various degrees can be traced to a general tendency to approach one’s experience with a positive outlook. Scheier and Carver (1993) suggested that positive thinking is at the core of individuals’ confidence in their future. Kozma, Stine, and Stones (2000) described positivity as a general dispositional determinant of subjective well-being, which operates much like a trait and may account for individual variation and stability in happiness despite environmental change. Diener, Scollon, Oishi, Dzokoto, and Suh (2000) referred to positivity as a propensity to evaluate aspects of life in general as good. Previous findings led Caprara and colleagues (Alessandri et al., in press; Caprara, Steca, Alessandri, Abela, & McWhinnie, 2010) to address what is common to self-esteem, life satisfaction, and optimism. Self-esteem refers to individuals’ global self-regard, and degree of acceptance of themselves (Harter, 1993). It is generally considered the stable (traitlike) “evaluative component” of the self-concept that includes cognitive, behavioral, and affective as- pects (Blascovich & Tomaka, 1991). Life satisfaction refers to individuals’ overall evaluation of their own lives (Diener, Em- mons, Larsen, & Griffin, 1985). Because it is inherently an eval- uation, judgments of life satisfaction have a large cognitive com- ponent. Furthermore, life satisfaction is considered the cognitive component of subjective well-being (Diener, Suh, Lucas, & Smith, 1999). The concepts of optimism, as theorized by the expectancy- value model (Scheier & Carver, 1993), concerns people’s expec- tations for the future. Optimistic people hold a view of future in which good things will be plentiful and bad things scarce (Scheier This article was published Online First January 16, 2012. Gian Vittorio Caprara and Guido Alessandri, Department of Psychol- ogy, Sapienza University of Rome, Rome, Italy; Nancy Eisenberg and A. Kupfer, Department of Psychology, Arizona State University; Patrizia Steca, Department of Psychology, University of Milan–Bicocca, Milan, Italy; Maria Giovanna Caprara, Department of Psychology, Universidad a Distancia de Madrid, Madrid, Spain; Susumu Yamaguchi and Ai Fuku- zawa, Department of Psychology, University of Tokyo, Tokyo, Japan; John Abela, Department of Psychology, McGill University, Montreal, Quebec, Canada. Unfortunately, John Abela passed away during the preparation of this article. The authors acknowledge his significant contribution to this re- search project. Correspondence concerning this article should be addressed to Gian Vittorio Caprara or Guido Alessandri, Department of Psychology, Sapi- enza University of Rome, Via Dei Marsi 78, Rome 00185, Italy. E-mail: [email protected] or [email protected] Psychological Assessment © 2012 American Psychological Association 2012, Vol. 24, No. 3, 701–712 1040-3590/12/$12.00 DOI: 10.1037/a0026681 701

Welcome message from author
This document is posted to help you gain knowledge. Please leave a comment to let me know what you think about it! Share it to your friends and learn new things together.
Transcript
The Positivity Scale
Gian Vittorio Caprara and Guido AlessandriSapienza University of Rome
Nancy Eisenberg and A. KupferArizona State University
Patrizia StecaUniversity of Milan–Bicocca
Maria Giovanna CapraraUniversidad a Distancia de Madrid
Susumu Yamaguchi and Ai FukuzawaUniversity of Tokyo
John AbelaMcGill University
Five studies document the validity of a new 8-item scale designed to measure positivity, defined as thetendency to view life and experiences with a positive outlook. In the first study (N � 372), thepsychometric properties of Positivity Scale (P Scale) were examined in accordance with classical testtheory using a large number of college participants. In Study 2, the unidimensionality of the P Scale wascorroborated with confirmatory factor analysis in 2 independent samples (N1 � 322; N2 � 457). In Study3, P Scale invariance across sexes and its relations with self-esteem, life satisfaction, optimism, positivenegative affect, depression, and the Big Five provided further evidence of the internal and constructvalidity of the new measure in a large community sample (N � 3,589). In Study 4, test–retest reliabilityof the P Scale was found in a sample of college students (N � 262) who were readministered the scaleafter 5 weeks. In Study 5, measurement invariance and construct validity of P Scale were furthersupported across samples in different countries and cultures, including Italy (N � 689), the United States(N � 1,187), Japan (N � 281), and Spain (N � 302). Psychometric findings across diverse culturalcontext attest to the robustness of the P Scale and to positivity as a basic disposition.
Keywords: scale development, positive orientation, well-being, confirmative factor analysis, measure-ment invariance
Interest in the positive features of individual functioning hasgained increasing attention over recent decades primarily due tothe contributions of positive psychology movement (Seligman &Csikszentmihalyi, 2000). This movement has generated a call fora strong commitment of both scholars and practitioners to theidentification of major determinants and proper indicators of op-timal functioning. In this regard, several authors at different timeshave pointed to individual differences that to various degrees can
be traced to a general tendency to approach one’s experience witha positive outlook. Scheier and Carver (1993) suggested thatpositive thinking is at the core of individuals’ confidence in theirfuture. Kozma, Stine, and Stones (2000) described positivity as ageneral dispositional determinant of subjective well-being, whichoperates much like a trait and may account for individual variationand stability in happiness despite environmental change. Diener,Scollon, Oishi, Dzokoto, and Suh (2000) referred to positivity as apropensity to evaluate aspects of life in general as good.
Previous findings led Caprara and colleagues (Alessandri et al.,in press; Caprara, Steca, Alessandri, Abela, & McWhinnie, 2010)to address what is common to self-esteem, life satisfaction, andoptimism. Self-esteem refers to individuals’ global self-regard, anddegree of acceptance of themselves (Harter, 1993). It is generallyconsidered the stable (traitlike) “evaluative component” of theself-concept that includes cognitive, behavioral, and affective as-pects (Blascovich & Tomaka, 1991). Life satisfaction refers toindividuals’ overall evaluation of their own lives (Diener, Em-mons, Larsen, & Griffin, 1985). Because it is inherently an eval-uation, judgments of life satisfaction have a large cognitive com-ponent. Furthermore, life satisfaction is considered the cognitivecomponent of subjective well-being (Diener, Suh, Lucas, & Smith,1999). The concepts of optimism, as theorized by the expectancy-value model (Scheier & Carver, 1993), concerns people’s expec-tations for the future. Optimistic people hold a view of future inwhich good things will be plentiful and bad things scarce (Scheier
This article was published Online First January 16, 2012.Gian Vittorio Caprara and Guido Alessandri, Department of Psychol-
ogy, Sapienza University of Rome, Rome, Italy; Nancy Eisenberg and A.Kupfer, Department of Psychology, Arizona State University; PatriziaSteca, Department of Psychology, University of Milan–Bicocca, Milan,Italy; Maria Giovanna Caprara, Department of Psychology, Universidad aDistancia de Madrid, Madrid, Spain; Susumu Yamaguchi and Ai Fuku-zawa, Department of Psychology, University of Tokyo, Tokyo, Japan; JohnAbela, Department of Psychology, McGill University, Montreal, Quebec,Canada.
Unfortunately, John Abela passed away during the preparation of thisarticle. The authors acknowledge his significant contribution to this re-search project.
Correspondence concerning this article should be addressed to GianVittorio Caprara or Guido Alessandri, Department of Psychology, Sapi-enza University of Rome, Via Dei Marsi 78, Rome 00185, Italy. E-mail:[email protected] or [email protected]
Psychological Assessment © 2012 American Psychological Association2012, Vol. 24, No. 3, 701–712 1040-3590/12/$12.00 DOI: 10.1037/a0026681
701
& Carver, 1993). Empirical findings show that dispositional opti-mism is linked to desirable outcomes and in particular to activeand effective coping (Scheier, Weintraub, & Carver, 1986).
All three constructs correspond to enduring global evaluationsthat exert a pervasive influence on people’s feelings, cognitions,and actions. All three constructs have been highly correlated toeach other and with a number of outcomes that reflect individualwell-being, such as health, job success, and positive interpersonalrelationships (Baumeister, Campbell, Krueger, & Vohs, 2003;Lyubomirsky, King, & Diener, 2005; Scheier, Carver, & Bridges,1994). Earlier studies led to the identification of a common latentfactor, termed positive thinking (Caprara & Steca, 2005, 2006),positive orientation (Alessandri et al., in press; Caprara et al.,2009, 2010), or positivity (henceforth labeled POS), correspondingto a quite pervasive mode of viewing and facing reality that affectsthe ways people evaluate their subjective experiences (Alessandriet al., in press; Caprara et al., 2010).
Cross-cultural findings have attested to the generality of POSmeasurement model tracing self-esteem, life satisfaction, and op-timism to a common latent factor, across cultures as different asthose of Italy, Canada, Germany, and Japan (Caprara, et al., inpress). Moreover, longitudinal studies have shown that POS isquite stable during through adolescence to adulthood (Alessandri,Caprara, & Tisak, 2011).
Findings from several studies have shown that POS is a signif-icant predictor of measures of depression, positive and negativeaffectivity, and quality of friendships and health, over and abovethe unique or summative power of the constructs of self-esteem,life satisfaction, and optimism, when all constructs were simulta-neously used in the same model as predictors of outcomes (Ales-sandri et al., in press; Caprara et al., 2010). In fact, there was littlevariance left to be accounted for by self-esteem, life satisfaction,and optimism once the amount of variance due to POS wascontrolled (Alessandri et al., in press; Caprara et al., 2010).
Further findings pointing to POS as a basic disposition derivefrom twin studies wherein mono- and dizygotic twin pairs an-swered self-report measures assessing self-esteem, life satisfac-tion, and optimism (Caprara et al., 2009). Multivariate geneticanalyses revealed high correlations of genetic factors (i.e., amountof variance two traits share due to the same genetic factors)between .80 and .87 for self-esteem, life satisfaction, and opti-mism, suggesting that a common genetic factor affects the threedimensions simultaneously (Caprara et al., 2009).
Ultimately, it has been argued that a basic disposition leading anindividual to appraise life and experiences with a positive outlookis needed to fulfill important biological functions (Caprara et al.2009). Such a disposition is needed for an individual to grow; toflourish; to cope with life despite adversities, failures, and loss;and to continue to care for living despite the decline of aging andthe idea of death (Alessandri et al., in press; Caprara et al., 2010).Yet, to our knowledge, no one has proposed a direct measure ofpositivity to further ascertain the extent to which positivity canoperate as a basic disposition.
Our aim in the present article was to report five studies sup-porting the psychometric strength of a new scale designed to assessPOS. In prior studies, POS has been assessed by estimating thecommon factor scores of self-esteem, optimism, and life-satisfaction using multiple scales (Caprara et al., 2010). Despitethe obvious advantages of this procedure, such as (a) using three
well-known and validated instruments and (b) assessing POS as alatent construct, it had two major limitations. First, POS was onlyindirectly measured through other instruments originally con-ceived to assess other constructs. Second, it required using a largernumber of items than an instrument specifically designed to assessPOS.
The first study (an exploratory study) was designed to select theitems included in the final version of the scale and to ascertain itsunidimensionality. Studies 2, 3, 4, and 5 were designed to corrob-orate the internal validity of the new scale (Study 2) and itsconvergent and discriminant validity, the gain in size of correla-tions with other important psychological constructs in comparisonto other standard measures of self-esteem, life satisfaction, andoptimism (Study 3), its temporal stability (Study 4), and its invari-ance across four cultures (Study 5). Ultimately, the psychometricfindings were expected to support the aforementioned argumentsregarding POS as a basic disposition predisposing people to ap-praise life and experiences with a positive outlook.
Study 1: The Development of the P Scale
The P Scale was designed as a short instrument with which todirectly assess POS. Items on the P Scale were written to assess apositive view of one’s self, one’s life, and one’s future, as well asone’s confidence in others. For each generative criterion (i.e., self,life, and future), eight or nine items were generated or selectedfrom existing measures of similar constructs (Beckham, Leber,Watkins, Boyer, & Cook, 1986; Diener et al., 1985; Rosenberg,1965; Scheier et al., 1994). This process yielded an initial pool of36 items. Subsequently, 10 items of the original pool were dis-carded to avoid ambiguity and redundancy. Finally, 26 items wereformatted with 5-point Likert scales ranging from 1 (stronglydisagree) to 5 (strongly agree). Then the psychometric propertiesof this instrument were examined preliminarily on a large sample.
Method
Sampling was based on the “snowball” method. Volunteerswere solicited by three undergraduate students to participate in thestudy and were encouraged to recruit their acquaintances to par-ticipate as well. This resulted in a final sample of 372 Italian adults(57% women) ranging in age from 19 to 61 years (M � 39.45,SD � 11.03). Participants were residents of Rome and variedwidely in demographic and socioeconomic backgrounds. Theiryears of education ranged from 8 to 18; 15% completed junior highschool, 63% completed high school, and 22% earned a universitydegree. Income ranged from less than 5,000 euro (8.8%) to morethan 80,000 euro (2.0%) annually; the mode was from 16,000 to29,000 euro (44.2%). As for marital status, 41% of the participantswere married, 44% were single, and 15% were divorced or wid-owed; 36% of the sample had children.
Results
Exploratory factor analysis. Prior to conducting the factoranalysis, we examined the interitem correlation matrix. Any itemthat correlated less than .40 with all other items was deleted fromthe analyses (Hinkin, 1998). Fifteen items were discarded for thisreason. Then an exploratory factor analysis was carried out on the
702 CAPRARA ET AL.

data. We extracted factors using the principal axis factoringmethod. In order to determine the number of factors to retain, weexamined the eigenvalues (Cattell & Vogelmann, 1977) and anindex of goodness of fit, the standardized root-mean-square resid-ual (SRMR). The SRMR is an absolute index of the discrepancybetween reproduced and observed correlations. Hu and Bentler(1998) suggested a cutoff criterion of .08, with higher valuesindicating poorer fit to the empirical data and values lower than .05indicating an excellent fit. After the successive deletion of threeitems that did not load significantly on the first factor, the first fiveeigenvalues were 3.08, 0.99, 0.88, 0.80, and 0.72. The analysis ofeigenvalues suggested a one-factor solution, given that the ratio ofthe first to the second eigenvalues was greater than 2 (i.e., 3.11;Hattie, 1985). The one-factor solution fit the data well (SRMR �.059). The residuals were all lower than .10 in absolute value,providing strong evidence for the adequacy of the hypothesizedone-factor structure (McDonald, 1985). The first factor accountedfor 47.58% of the total variance. All loadings were greater than .40(M � .55, SD � .09). The final set of items (Table 1) includedthree items related to individuals’ regard for themselves (Items 5,7, and 8); three items related to individuals’ confidence in thefuture (Items 1, 4, and 6), one item related to individuals’ confi-dence in others (Item 3), and one item related to individuals’satisfaction with their lives (Item 2). Only one reversed item wasretained (Item 6).
Descriptive statistics. Means (M), standard deviations (SD),skewness, and kurtosis were calculated for each of the eight PScale items under study (Table 1). The means of the 5-point Likertitems ranged from 3.22 (Item 6) to 4.22 (Item 7), with average Mof 3.69 and a SD of 0.43. The scores revealed a reasonably normaldistribution with the means for skewness and kurtosis being �0.61(SD � 0.36) and 0.19 (SD � 0.60), respectively. None of the itemshad a skew or a kurtosis greater than 1 (in absolute value) with theexception of Item 7.
Internal consistency. We evaluated the internal consistencyof the P Scale using Cronbach’s alpha with associated confidenceintervals (see Feldt, Woodruff, & Salih, 1987) and corrected item-total correlations. Cronbach’s alpha was .75 (95% confidenceinterval [CI]: lower � .71, higher � .79). The mean correcteditem-total correlation was .48 (SD � .06). Moreover, the factor
determinacy coefficient (i.e., a validity coefficient that is computedas the correlation between factor score estimates and their respec-tive latent factors and that represents the degree of convergence ofobserved score on a scale and the latent individual’s score) wascomputed (Grice, 2001). These data are important in the evaluationof factor analytic findings (e.g., a highly indeterminate factor canproduce radically different factor scores that are nonethelessequally consistent with the obtained factor loadings). For thepresent study, the determinacy coefficient of .89 can be consideredvery high (i.e., higher than .80; see Gorsuch, 1983).
Study 2. Confirming the Factor Structure of theP-scale
In this study, we evaluated the scale structure obtained in Study1 within the framework of structural equation modeling. Usingconfirmatory factor analysis (CFA), we specified a one-factorsolution for the eight-item scale resulting from Study 1; we eval-uated its fit with two different samples of individuals varyingwidely in their composition to cross-validate the results (Bagozzi,1994). We specified a congeneric model in which correlated errorswere not allowed. On one of the two new samples (i.e., Sample 1,the calibration sample), we tested the CFA one-factor modelresulting form Study 1; then we used the other sample (i.e., Sample2, the validation sample) to corroborate the obtained results.
Method
Sample 1. The first sample consisted of 322 individuals (47%women), recruited by three psychology majors during a largerresearch project designed to investigate the relations among per-sonality traits, positive orientation, and values. Participants rangedin age from 21 to 63 years (M � 37.8; SD � 8.09). Participantswere residents of Terni, a small city situated in the center of theItaly (Umbria). They varied widely in demographic and socioeco-nomic backgrounds. Indeed, their years of education ranged from8 to 18; 12% completed junior high school, 61% completed highschool, and 27% earned a university degree. Income ranged fromless than 5,000 euro (1.6%) to more than 80,000 euro (3.3%)annually; the mode was from 16,000 to 29,000 euro (29.9%). Most
Table 1Means, Standard Deviations, Skewness, Kurtosis, Factor Loadings, and Item-Total Score-Corrected Correlations of the Selected EightPositivity Scale Items (N � 372)
Item M SD Skewness Kurtosis Factor 1oading rtt
1. I have great faith in the future 3.41 1.01 �0.45 �0.13 .64 .542. I am satisfied with my life 4.13 0.88 �0.86 0.21 .45 .403. Others are generally here for me when I need them 3.44 1.40 �0.84 0.15 .52 .474. I look forward to the future with hope and enthusiasm 3.22 1.20 �0.04 �0.94 .54 .485. On the whole, I am satisfied with myself 3.90 0.88 �0.68 0.41 .58 .476. At times, the future seems unclear to me (reverse scored) 3.75 0.89 �0.52 0.35 .68 .577. I feel I have many things to be proud of 4.42 0.72 �1.20 1.20 .43 .398. I generally feel confident in myself 3.26 0.60 �0.32 0.30 .58 .52
Scale 3.91 0.59 �0.50 0.59 — —
Note. The introduction to the scale read “The following statements describe how a person might act in certain situations. Please indicate if you stronglyagree, agree, neither agree or disagree, disagree, or strongly disagree with each of these statements by circling the appropriate answer.” Factor loadings arefrom the exploratory factor analysis. M � mean; SD � standard deviation; rtt � item-total scale-score-corrected correlation coefficient.
703THE POSITIVITY SCALE

participants were married (51%) or single (37%); 12% were di-vorced or widowed; 56% of the sample had children.
Sample 2. The second sample was composed of 457 individ-uals (52% women) who were individually administered the eight-item P Scale. Subjects were recruited by several psychologymajors as a part of a course assignment at the University ofMilan–Bicocca. The procedure was similar to that used in the firststudy. Participants’ ages ranged from 19 to 56 years (M � 33.0.SD � 1.97). Years of education ranged from 8 to 18; 2.6%completed elementary school education, 9.7% completed juniorhigh school, 37.0% completed high school, and 51% earned auniversity degree. Income ranged from less than 5,000 euro (6.8%)to more than 80,000 euro (1.2%) annually; the mode was from16,000 to 29,000 euro (35.6%).
Results
Descriptive statistics. Table 2 presents Ms, SDs, skewness,and kurtosis of the items and P Scale for each sample. The meansfor the 5-point Likert items ranged from 3.18 (Item 2, Sample1) to4.22 (Item 7, Sample 2), with an M of 3.64, and a SD of 0.36. Thedistribution was fairly normal with the means for skewness andkurtosis being 0.45 (SD � 0.41) and �0.21 (SD � 0.46), respec-tively, for Sample 1 and Sample 2. None of the items had a skewor kurtosis greater than 1 (in absolute value).
Confirmatory factor analysis. The hypothesized model wasestimated via maximum likelihood (ML) using the software Mplus(Muthen & Muthen, 2004). For the evaluation of covariance struc-ture models, in addition to the previously presented SRMR, weused the chi-square goodness of fit supplemented by the compar-ative fit index (CFI) and the root-mean-square error of approxi-mation (RMSEA). The CFI (Bentler, 1990) assesses the reductionin misfit of a population target model relative to a populationbaseline model in which no structure is specified (i.e., all correla-tions among variables are equal to zero). Values of at least .90 areconsidered adequate for good models (Bentler, 1990). TheRMSEA is a measure of the discrepancy of the variance-covariance matrix of fitted model from the starting variance-covariance matrix per degree of freedom. Values lower than .05reflect a small error of approximation. Values between .05 and .08reflect an acceptable error of approximation. Values greater than.10 constitute poor model fit (Browne & Cudek, 1993).
The hypothesized one-factor model was fitted to the Sample 1data. This model provided an adequate fit to the data: �2(20, N �322) � 61.22, p � .01; CFI � .94; RMSEA � .071, 95% CI [.062,.078]; SRMR � .051. However, sequential fit diagnostic evalua-tion indicated that the points of ill fit pertained to the errorcovariances of Items 1 and 6. Examination of Item 1 content (i.e.,“I have great faith in the future”) revealed that the item containedthe same focus on enthusiastic expectations about future life eventssuch as Item 6 (i.e., “I look forward to the future with hope andenthusiasm”). Because these were the highest modification indicespertaining to error covariances, the CFA solution was respecifiedcorrelating the residuals of the item pair. The revised modelprovided a better fit to the data: �2(19, N � 322) � 41.22, p � .01;CFI � .96; RMSEA � .065, 95% CI [.059, 077]; SRMR � .046.All the loadings were high (Table 2), ranging from .41 to .84 (M �.57; SD � .15), and the covariance parameter between the itemresiduals was significant (i.e., ε1, 6 � .43, p � .01). This last model T
able
2M
eans
,St
anda
rdD
evia
tion
s,Sk
ewne
ss,
Kur
tosi
s,F
acto
rL
oadi
ngs,
and
Item
-Tot
alSc
ore-
Cor
rect
edC
orre
lati
ons
ofth
eSe
lect
edE
ight
Pos
itiv
ity
Scal
eIt
ems
for
Sam
ple
1(N
�32
2)an
dSa
mpl
e2
(N�
457)
Item
Sam
ple
1Sa
mpl
e2
MSD
Skew
ness
Kur
tosi
sFa
ctor
1oad
ing
r tt
MSD
Skew
ness
Kur
tosi
sFa
ctor
1oad
ing
r tt
1.I
have
grea
tfa
ithin
the
futu
re3.
310.
96�
0.25
�0.
27.4
6.5
03.
260.
97�
0.28
�0.
33.4
9.4
52.
Iam
satis
fied
with
my
life
3.90
1.48
�0.
68�
0.35
.50
.35
3.18
0.83
�0.
980.
89.3
2.4
73.
Oth
ers
are
gene
rally
here
for
me
whe
nI
need
them
4.13
0.83
�0.
97�
0.90
.71
.60
3.92
1.44
�0.
67�
0.36
.61
.72
4.I
look
forw
ard
toth
efu
ture
with
hope
and
enth
usia
sm3.
261.
09�
0.11
�0.
68.4
1.3
63.
261.
12�
0.16
�0.
72.3
8.4
95.
On
the
who
le,
Iam
satis
fied
with
mys
elf
3.46
0.98
�0.
39�
0.29
.65
.56
3.41
1.01
�0.
36�
0.39
.58
.69
6.A
ttim
es,
the
futu
rese
ems
uncl
ear
tom
e(r
ever
sesc
ored
)3.
580.
94�
0.47
�0.
07.5
8.5
93.
550.
98�
0.45
�0.
25.5
8.5
57.
Ife
elI
have
man
yth
ings
tobe
prou
dof
4.21
1.09
0.73
�0.
24.4
5.3
84.
221.
08�
0.72
�0.
24.4
0.4
78.
Ige
nera
llyfe
elco
nfid
ent
inm
ysel
f3.
830.
87�
0.72
0.58
.84
.69
3.80
0.88
�0.
640.
33.6
7.8
2
Scal
e3.
780.
600.
100.
80—
—3.
740.
690.
080.
90—
—
Not
e.T
hein
trod
uctio
nto
the
scal
ere
ad“T
hefo
llow
ing
stat
emen
tsde
scri
beho
wa
pers
onm
ight
acti
nce
rtai
nsi
tuat
ions
.Ple
ase
indi
cate
ifyo
ust
rong
lyag
ree,
agre
e,ne
ither
agre
eor
disa
gree
,dis
agre
e,or
stro
ngly
disa
gree
with
each
ofth
ese
stat
emen
tsby
circ
ling
the
appr
opri
ate
answ
er.”
Fact
orlo
adin
gsar
efr
omth
eco
nfir
mat
ory
fact
oran
alys
is.M
�m
ean;
SD�
stan
dard
devi
atio
n;r t
t�
item
-tot
alsc
ale-
scor
e-co
rrec
ted
corr
elat
ion
coef
fici
ent.
704 CAPRARA ET AL.
was specified in Sample 2 data and resulted in a good fit: �2(19,N � 457) � 52.99, p � .01; CFI � .96; RMSEA � .063, 95% CI[.043, .083]; SRMR � .043. Again, loadings for this model werehigh, ranging from .40 to .67 (M � .51; SD �.13). The covarianceparameter between the estimated item residuals was significant,ε1, 6 � .45, p � .01). Factor scores determinacy coefficients were,respectively, .81 (Sample 1) and .82 (Sample 2). Finally, the alphacoefficients obtained from Samples 1 and 2 were, respectively, .78(95% CI [lower � .75, higher � .82]) and .79 (95% CI [lower �.76, higher � .82]).
Study 3. Correlates of the P Scale, Stability of ItsStructure by Sex, and Association With Sex, Age, and
Socioeconomic Status (SES)
Our aim in this third study was to further corroborate the factorvalidity of the eight-item P Scale and to investigate its constructvalidity in a large community sample. Moreover, the cross-genderinvariance of this instrument was investigated (Meredith & Teresi,2006). To investigate construct validity, on the basis of previousstudies (Alessandri et al., in press; Caprara et al., 2010) andobvious conceptual links, we correlated individuals’ scores on theP Scale with depressive symptoms and negative and positiveaffect, as with measures of the Big Five traits of personality (i.e.,Extraversion, Conscientiousness, Agreeableness, Emotional Sta-bility, and Openness). On the basis of previous studies (e.g.,Alessandri et al., in press; Caprara et al., 2010) and theory, weexpected moderate-to-high positive correlations of the P Scalewith positive affectivity and all the Big Five scales. Conversely,we expected moderate-to-high negative correlations between the PScale and negative affect and level of depressive symptoms. Wealso included measures of self-esteem, life satisfaction, and opti-mism to further evaluate the relations of scores on P Scale with thethree first-order indicators of POS used in the earlier studies (seeAlessandri et al., in press; Caprara et al., 2010) and with theindividuals’ scores on a latent positive orientation factor derived,as in the past, from measures of self-esteem, life satisfaction, andoptimism.1 Very high correlations were expected between theindividual scores on the P Scale and self-esteem, life satisfaction,optimism, and the individual’s factor score on the latent constructof POS.
Finally, mean level gender differences and associations with ageand SES were investigated. Previous studies investigating genderdifferences in POS have shown inconsistent results: both a slightlyhigher score on POS for men than for women (Caprara, Caprara,& Steca, 2003) and no sex difference (Alessandri et al., 2011) havebeen reported. Whereas weak linear or curvilinear correlationshave been found for the relation between SES and well-being andage and well-being (see Argyle, 1999, for a review), no study hasaddressed directly this point for POS. Thus, age and SES (linearand quadratic) associations with P Scale total scores were exam-ined for exploratory purposes without any specific prediction.
Method
Participants. Participants were 3,589 Italian adults (58%women), ranging in age from 17 to 75 years (M � 39.01, SD �14.53). They were contacted by a group of trained researchersinvolved in a large research project to recruit a representative
national sample of individuals for the validation of the new Pos-itive Orientation Scale (P Scale). Participants completed the ques-tionnaire individually at their homes. They did not receive anycompensation for their participation in the research. Participantswere residents in various geographic areas of the country.
Years of education ranged from 8 to 18; 45% completed juniorhigh school, 40% completed high school, and 15% earned auniversity degree. Annual income ranged from less than 5,000euro (3.1%) to more than 80,000 euro (4.3%); the mode was from16,000 to 29,000 euro (31.1%). Most participants were married(53%) or single (27%); 20% were divorced or widowed; 67% hadchildren.
Instruments. The eight-item P Scale resulting from Study 1and Study 2 was administered, along with a large set of instru-ments.
Self-esteem (� � .84). Participants’ self-esteem was assessedwith 10 items from the Rosenberg (1965) Self-Esteem Scale. Ingeneral, this scale assesses the extent to which participants believethey possess good qualities, accept their own characteristics, andhave achieved personal success or experienced failure. For eachitem, ratings are provided on a 4-point scale ranging from1(strongly disagree) to 4 (strongly agree). A sample item is “I feelthat I’m a person of worth, at least on an equal plane with others.”To compute the correlation between the individual mean score onthe P Scale and self-esteem, we took out two items because theyclearly overlapped in content with those included in the P Scale(� � .83).
Life satisfaction (� � .90). Participants’ life satisfaction wasassessed with five items from the Satisfaction with Life Scale(Diener et al. 1985). For each item, participants rated the extent towhich they felt generally satisfied with life on a 7-point ratingscale ranging from 1 (strongly disagree) to 7 (strongly agree; e.g.,“In most ways, my life is close to my ideal”). To compute thecorrelation between the individual mean score on the P Scale andlife satisfaction, we dropped one item because it clearly overlappedin content with those included in the P Scale (� � .90).
Optimism (� � .79). Optimism was assessed with the 10-item Life Orientation Test (Scheier et al., 1994). We used the sixscale items (four items were fillers) that measure respondents’expectations about the future and a general sense of optimism.Participants provided their ratings on a 5-point scale ranging from1 (strongly disagree) to 5 (strongly agree). A sample item is “Inuncertain times, I usually expect the best.”
POS. As in earlier studies, we estimated individuals’ scoreson the latent POS construct using explorative factor analysis.Specifically, the aforementioned measures of self-esteem, life sat-isfaction, and optimism were factor analyzed (with principal axisfactor analysis), and an estimated factor score was obtained for allparticipants from the one-factor solution. Indices of fit for thisanalysis revealed only one eigenvalue higher than 1 (e.g., 5.44;45% of variance explained by the one-factor solution; SRMR �.021).
Depression (� � .83). Participants rated their levels of de-pressive symptoms using the 20-item scale developed by Radloff
1 In previous studies, POS was estimated as a factor score obtained by asimultaneous factor analyses of measures of self-esteem, life satisfaction,and optimism (see Caprara et al., 2010).
705THE POSITIVITY SCALE
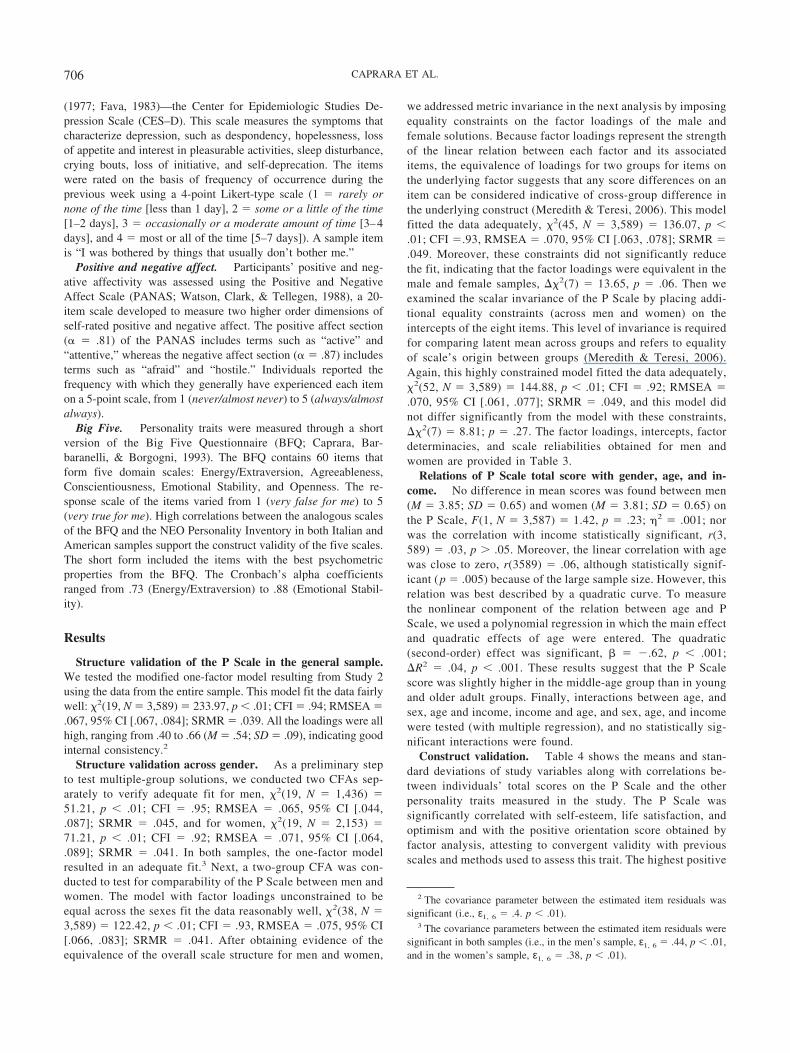
(1977; Fava, 1983)—the Center for Epidemiologic Studies De-pression Scale (CES–D). This scale measures the symptoms thatcharacterize depression, such as despondency, hopelessness, lossof appetite and interest in pleasurable activities, sleep disturbance,crying bouts, loss of initiative, and self-deprecation. The itemswere rated on the basis of frequency of occurrence during theprevious week using a 4-point Likert-type scale (1 � rarely ornone of the time [less than 1 day], 2 � some or a little of the time[1–2 days], 3 � occasionally or a moderate amount of time [3–4days], and 4 � most or all of the time [5–7 days]). A sample itemis “I was bothered by things that usually don’t bother me.”
Positive and negative affect. Participants’ positive and neg-ative affectivity was assessed using the Positive and NegativeAffect Scale (PANAS; Watson, Clark, & Tellegen, 1988), a 20-item scale developed to measure two higher order dimensions ofself-rated positive and negative affect. The positive affect section(� � .81) of the PANAS includes terms such as “active” and“attentive,” whereas the negative affect section (� � .87) includesterms such as “afraid” and “hostile.” Individuals reported thefrequency with which they generally have experienced each itemon a 5-point scale, from 1 (never/almost never) to 5 (always/almostalways).
Big Five. Personality traits were measured through a shortversion of the Big Five Questionnaire (BFQ; Caprara, Bar-baranelli, & Borgogni, 1993). The BFQ contains 60 items thatform five domain scales: Energy/Extraversion, Agreeableness,Conscientiousness, Emotional Stability, and Openness. The re-sponse scale of the items varied from 1 (very false for me) to 5(very true for me). High correlations between the analogous scalesof the BFQ and the NEO Personality Inventory in both Italian andAmerican samples support the construct validity of the five scales.The short form included the items with the best psychometricproperties from the BFQ. The Cronbach’s alpha coefficientsranged from .73 (Energy/Extraversion) to .88 (Emotional Stabil-ity).
Results
Structure validation of the P Scale in the general sample.We tested the modified one-factor model resulting from Study 2using the data from the entire sample. This model fit the data fairlywell: �2(19, N � 3,589) � 233.97, p � .01; CFI � .94; RMSEA �.067, 95% CI [.067, .084]; SRMR � .039. All the loadings were allhigh, ranging from .40 to .66 (M � .54; SD � .09), indicating goodinternal consistency.2
Structure validation across gender. As a preliminary stepto test multiple-group solutions, we conducted two CFAs sep-arately to verify adequate fit for men, �2(19, N � 1,436) �51.21, p � .01; CFI � .95; RMSEA � .065, 95% CI [.044,.087]; SRMR � .045, and for women, �2(19, N � 2,153) �71.21, p � .01; CFI � .92; RMSEA � .071, 95% CI [.064,.089]; SRMR � .041. In both samples, the one-factor modelresulted in an adequate fit.3 Next, a two-group CFA was con-ducted to test for comparability of the P Scale between men andwomen. The model with factor loadings unconstrained to beequal across the sexes fit the data reasonably well, �2(38, N �3,589) � 122.42, p � .01; CFI � .93, RMSEA � .075, 95% CI[.066, .083]; SRMR � .041. After obtaining evidence of theequivalence of the overall scale structure for men and women,
we addressed metric invariance in the next analysis by imposingequality constraints on the factor loadings of the male andfemale solutions. Because factor loadings represent the strengthof the linear relation between each factor and its associateditems, the equivalence of loadings for two groups for items onthe underlying factor suggests that any score differences on anitem can be considered indicative of cross-group difference inthe underlying construct (Meredith & Teresi, 2006). This modelfitted the data adequately, �2(45, N � 3,589) � 136.07, p �.01; CFI �.93, RMSEA � .070, 95% CI [.063, .078]; SRMR �.049. Moreover, these constraints did not significantly reducethe fit, indicating that the factor loadings were equivalent in themale and female samples, ��2(7) � 13.65, p � .06. Then weexamined the scalar invariance of the P Scale by placing addi-tional equality constraints (across men and women) on theintercepts of the eight items. This level of invariance is requiredfor comparing latent mean across groups and refers to equalityof scale’s origin between groups (Meredith & Teresi, 2006).Again, this highly constrained model fitted the data adequately,�2(52, N � 3,589) � 144.88, p � .01; CFI � .92; RMSEA �.070, 95% CI [.061, .077]; SRMR � .049, and this model didnot differ significantly from the model with these constraints,��2(7) � 8.81; p � .27. The factor loadings, intercepts, factordeterminacies, and scale reliabilities obtained for men andwomen are provided in Table 3.
Relations of P Scale total score with gender, age, and in-come. No difference in mean scores was found between men(M � 3.85; SD � 0.65) and women (M � 3.81; SD � 0.65) onthe P Scale, F(1, N � 3,587) � 1.42, p � .23; �2 � .001; norwas the correlation with income statistically significant, r(3,589) � .03, p � .05. Moreover, the linear correlation with agewas close to zero, r(3589) � .06, although statistically signif-icant (p � .005) because of the large sample size. However, thisrelation was best described by a quadratic curve. To measurethe nonlinear component of the relation between age and PScale, we used a polynomial regression in which the main effectand quadratic effects of age were entered. The quadratic(second-order) effect was significant, � �.62, p � .001;�R2 � .04, p � .001. These results suggest that the P Scalescore was slightly higher in the middle-age group than in youngand older adult groups. Finally, interactions between age, andsex, age and income, income and age, and sex, age, and incomewere tested (with multiple regression), and no statistically sig-nificant interactions were found.
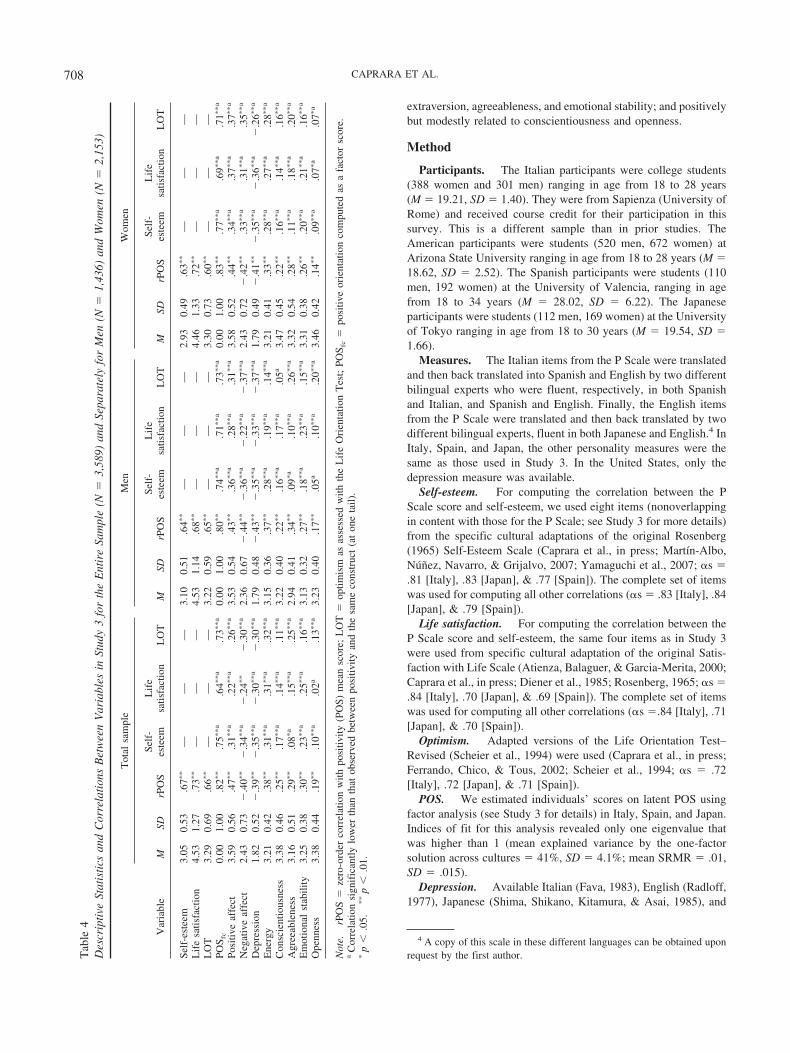
Construct validation. Table 4 shows the means and stan-dard deviations of study variables along with correlations be-tween individuals’ total scores on the P Scale and the otherpersonality traits measured in the study. The P Scale wassignificantly correlated with self-esteem, life satisfaction, andoptimism and with the positive orientation score obtained byfactor analysis, attesting to convergent validity with previousscales and methods used to assess this trait. The highest positive
2 The covariance parameter between the estimated item residuals wassignificant (i.e., ε1, 6 � .4. p � .01).
3 The covariance parameters between the estimated item residuals weresignificant in both samples (i.e., in the men’s sample, ε1, 6 � .44, p � .01,and in the women’s sample, ε1, 6 � .38, p � .01).
706 CAPRARA ET AL.
correlates of POS were positive affect, energy, agreeableness,and emotional stability. The highest negative correlates of PScale score were negative affect and depression. Accordingly,individuals with higher P Scale scores were characterized by apleasant affective state and a low incidence of depressive symp-toms. Weaker yet significant positive correlations were ob-served between the P Scale score and both conscientiousnessand openness to experience. Finally, we used the Fisher r-to-ztransformation (Cohen & Cohen, 1983) to examine one-taileddifferences in the magnitude of the correlation coefficients forPOS when correlated with positive and negative affectivity andthe Big Five and for analogous correlations of self-esteem, lifesatisfaction, and optimism with the same variables. Comparedwith those correlations of self-esteem, life satisfaction, andoptimism, the correlations between POS and the aforemen-tioned variables were statistically higher in size (Table 4).
Study 4
In this study, the test–retest stability of the P Scale was inves-tigated. The P Scale was administered during the first part of anacademic course on personality psychology (Time 1; October2010) and then administered again 5 weeks later (Time 2; Novem-ber 2010).
Method
Participants were 262 undergraduates (79% women) from Sa-pienza (University of Rome), with a mean age of 21.03 years(SD � 3.52). They filled out the P Scale two times, across aninterval of 5 weeks. These students received extra credit for theirparticipation in the current research. They completed the P Scaleduring class time.
Results
Reliability of the P Scale was .76 (95% CI [lower � .72,higher � .80]) and .78 (95% CI [lower � .76, higher � .80]) atTimes 1 and 2. The zero-order correlation between mean scores
was .69 for women and .73 for men, indicating measurementstability of the P Scale across a relatively short time period.
Study 5
Our aim in this study was to investigate the cross-culturalgenerality of the factorial structure of P Scale and its externalvalidity. Previous findings have supported the stability of themeasurement model of POS, with self-esteem, life satisfaction, andoptimism loading on a single latent construct (i.e., POS) acrossfour different cultural contexts, including Italy, Germany, Canada,and Japan (Caprara et al., 2010; in press). Thus, we tested whetherthis pattern of stability could be extended to findings for the PScale by investigating the generalizability of its psychometricsproperties in four cultures (i.e., Italy, the United States, Spain, andJapan) that differ considerably in terms of cultural models of self,language, historical roots, and ways of life. We chose Italy, theUnited States, Spain, and Japan for our investigation due to estab-lished collaboration among scientists from these countries. Peoplein Italy, the United States, and Spain score relatively high onindividualism (Hofstede, 2001), autonomy, and egalitarianism(Schwartz, 2008) compared with people in Japan. On the basis ofa previous study, which established the partial measurement in-variance of the measurement model for positive orientation (Ca-prara et al., in press), we expected at least partial measurementinvariance for the P Scale. Furthermore, we expected lower scoreson P Scale for Japanese than for Italian, American, and Spanishparticipants in accordance with previous findings pointing to thetendency for Japanese individuals to endorse a discrete and modestprofile when reporting about themselves (Yamaguchi, Lin, Morio,& Okumura, 2008). We did not expect Italian, American, andSpanish participants to differ on P Scale total score but investi-gated these differences in an exploratory manner. Finally, weinvestigated whether individuals’ mean scores on the P Scalewould reveal a similar pattern of correlations with the Big Fivetraits and with depression in different cultural contexts. In thisregard, on the basis of Study 3, we expected POS scores to behighly negatively related to depression; highly positively related to
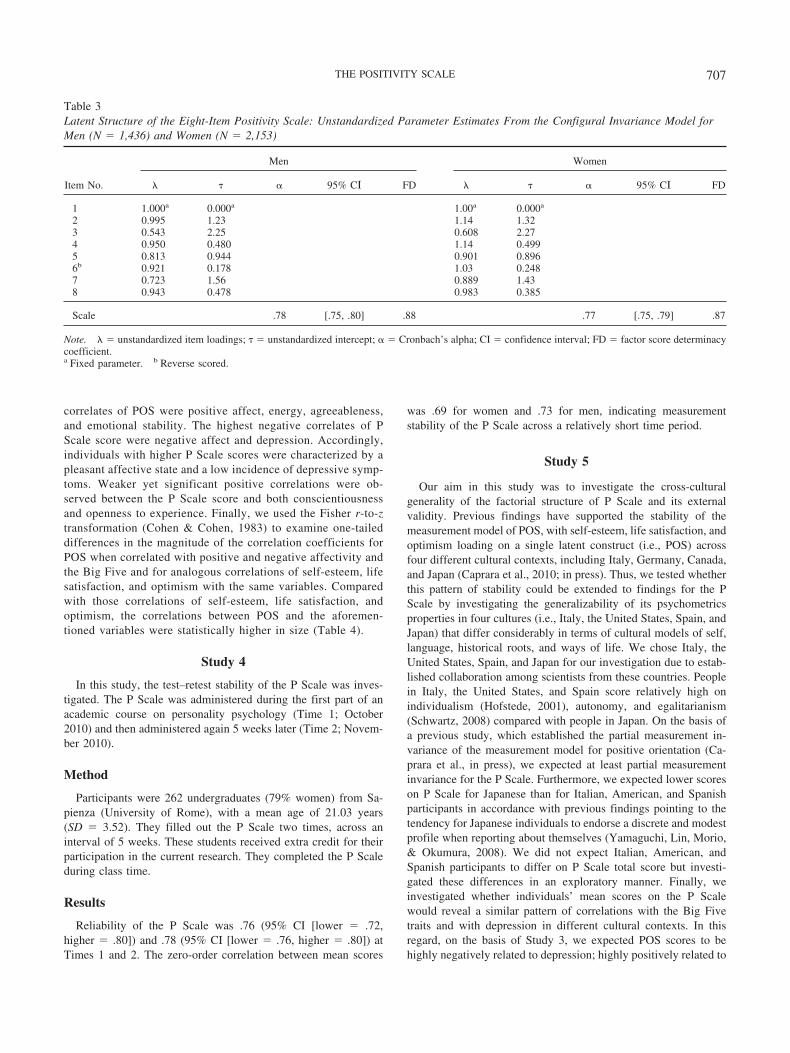
Table 3Latent Structure of the Eight-Item Positivity Scale: Unstandardized Parameter Estimates From the Configural Invariance Model forMen (N � 1,436) and Women (N � 2,153)
Item No.
Men Women
� � 95% C� FD � � 95% C� FD
1 1.000a 0.000a 1.00a 0.000a
2 0.995 1.23 1.14 1.323 0.543 2.25 0.608 2.274 0.950 0.480 1.14 0.4995 0.813 0.944 0.901 0.8966b 0.921 0.178 1.03 0.2487 0.723 1.56 0.889 1.438 0.943 0.478 0.983 0.385
Scale .78 [.75, .80] .88 .77 [.75, .79] .87
Note. � unstandardized item loadings; � � unstandardized intercept; � � Cronbach’s alpha; CI � confidence interval; FD � factor score determinacycoefficient.a Fixed parameter. b Reverse scored.
707THE POSITIVITY SCALE
extraversion, agreeableness, and emotional stability; and positivelybut modestly related to conscientiousness and openness.
Method
Participants. The Italian participants were college students(388 women and 301 men) ranging in age from 18 to 28 years(M � 19.21, SD � 1.40). They were from Sapienza (University ofRome) and received course credit for their participation in thissurvey. This is a different sample than in prior studies. TheAmerican participants were students (520 men, 672 women) atArizona State University ranging in age from 18 to 28 years (M �18.62, SD � 2.52). The Spanish participants were students (110men, 192 women) at the University of Valencia, ranging in agefrom 18 to 34 years (M � 28.02, SD � 6.22). The Japaneseparticipants were students (112 men, 169 women) at the Universityof Tokyo ranging in age from 18 to 30 years (M � 19.54, SD �1.66).
Measures. The Italian items from the P Scale were translatedand then back translated into Spanish and English by two differentbilingual experts who were fluent, respectively, in both Spanishand Italian, and Spanish and English. Finally, the English itemsfrom the P Scale were translated and then back translated by twodifferent bilingual experts, fluent in both Japanese and English.4 InItaly, Spain, and Japan, the other personality measures were thesame as those used in Study 3. In the United States, only thedepression measure was available.
Self-esteem. For computing the correlation between the PScale score and self-esteem, we used eight items (nonoverlappingin content with those for the P Scale; see Study 3 for more details)from the specific cultural adaptations of the original Rosenberg(1965) Self-Esteem Scale (Caprara et al., in press; Martın-Albo,Nunez, Navarro, & Grijalvo, 2007; Yamaguchi et al., 2007; �s �.81 [Italy], .83 [Japan], & .77 [Spain]). The complete set of itemswas used for computing all other correlations (�s � .83 [Italy], .84[Japan], & .79 [Spain]).
Life satisfaction. For computing the correlation between theP Scale score and self-esteem, the same four items as in Study 3were used from specific cultural adaptation of the original Satis-faction with Life Scale (Atienza, Balaguer, & Garcia-Merita, 2000;Caprara et al., in press; Diener et al., 1985; Rosenberg, 1965; �s �.84 [Italy], .70 [Japan], & .69 [Spain]). The complete set of itemswas used for computing all other correlations (�s �.84 [Italy], .71[Japan], & .70 [Spain]).
Optimism. Adapted versions of the Life Orientation Test–Revised (Scheier et al., 1994) were used (Caprara et al., in press;Ferrando, Chico, & Tous, 2002; Scheier et al., 1994; �s � .72[Italy], .72 [Japan], & .71 [Spain]).
POS. We estimated individuals’ scores on latent POS usingfactor analysis (see Study 3 for details) in Italy, Spain, and Japan.Indices of fit for this analysis revealed only one eigenvalue thatwas higher than 1 (mean explained variance by the one-factorsolution across cultures � 41%, SD � 4.1%; mean SRMR � .01,SD � .015).
Depression. Available Italian (Fava, 1983), English (Radloff,1977), Japanese (Shima, Shikano, Kitamura, & Asai, 1985), and
4 A copy of this scale in these different languages can be obtained uponrequest by the first author.T
able
4D
escr
ipti
veSt
atis
tics
and
Cor
rela
tion
sB
etw
een
Var
iabl
esin
Stud
y3
for
the
Ent
ire
Sam
ple
(N�
3,58
9)an
dSe
para
tely
for
Men
(N�
1,43
6)an
dW
omen
(N�
2,15
3)
Var
iabl
e
Tot
alsa
mpl
eM
enW
omen
MSD
rPO
SSe
lf-
este
emL
ife
satis
fact
ion
LO
TM
SDrP
OS
Self
-es
teem
Lif
esa
tisfa
ctio
nL
OT
MSD
rPO
SSe
lf-
este
emL
ife
satis
fact
ion
LO
T
Self
-est
eem
3.05
0.53
.67�
�—
——
3.10
0.51
.64�
�—
——
2.93
0.49
.63�
�—
——
Lif
esa
tisfa
ctio
n4.
531.
27.7
3��
——
—4.
531.
14.6
8��
——
—4.
461.
33.7
2��
——
—L
OT
3.29
0.69
.66�
�—
——
3.22
0.59
.65�
�—
——
3.30
0.73
.60�
�—
——
POS f
c0.
001.
00.8
2��
.75�
�a
.64�
�a
.73�
�a
0.00
1.00
.80�
�.7
4��
a.7
1��
a.7
3��
a0.
001.
00.8
3��
.77�
�a
.69�
�a
.71�
�a
Posi
tive
affe
ct3.
590.
56.4
7��
.31�
�a
.22�
�a
.26�
�a
3.53
0.54
.43�
�.3
6��
a.2
8��
a.3
1��
a3.
580.
52.4
4��
.34�
�a
.37�
�a
.37�
�a
Neg
ativ
eaf
fect
2.43
0.73
�.4
0��
�.3
4��
a�
.24�
��
.30�
�a
2.36
0.67
�.4
4��
�.3
6��
a�
.22�
�a
�.3
7��
a2.
430.
72�
.42�
�.3
3��
a.3
1��
a.3
5��
a
Dep
ress
ion
1.82
0.52
�.3
9��
�.3
5��
a�
.30�
�a
�.3
0��
a1.
790.
48�
.43�
��
.35�
�a
�.3
3��
a�
.37�
�a
1.79
0.49
�.4
1��
�.3
5��
a�
.36�
�a
�.2
6��
a
Ene
rgy
3.21
0.42
.38�
�.3
1��
a.3
1��
a.3
2��
a3.
150.
36.3
7��
.28�
�a
.19�
�a
.14�
�a
3.21
0.41
.33�
�.2
8��
a.2
7��
a.2
8��
a
Con
scie
ntio
usne
ss3.
380.
46.2
5��
.17�
�a
.14�
�a
.11�
�a
3.22
0.40
.22�
�.1
6��
a.1
7��
a.0
5a3.
470.
45.2
2��
.16�
�a
.14�
�a
.16�
�a
Agr
eeab
lene
ss3.
160.
51.2
9��
.08�
a.1
5��
a.2
5��
a2.
940.
41.3
4��
.09�
a.1
0��
a.2
6��
a3.
320.
54.2
8��
.11�
�a
.18�
�a
.20�
�a
Em
otio
nal
stab
ility
3.25
0.38
.30�
�.2
3��
a.2
5��
a.1
6��
a3.
130.
32.2
7��
.18�
�a
.23�
�a
.15�
�a
3.31
0.38
.26�
�.2
0��
a.2
1��
a.1
6��
a
Ope
nnes
s3.
380.
44.1
9��
.10�
�a
.02a
.13�
�a
3.23
0.40
.17�
�.0
5a.1
0��
a.2
0��
a3.
460.
42.1
4��
.09�
�a
.07�
a.0
7�a
Not
e.rP
OS
�ze
ro-o
rder
corr
elat
ion
with
posi
tivity
(PO
S)m
ean
scor
e;L
OT
�op
timis
mas
asse
ssed
with
the
Lif
eO
rien
tatio
nT
est;
POS f
c�
posi
tive
orie
ntat
ion
com
pute
das
afa
ctor
scor
e.a
Cor
rela
tion
sign
ific
antly
low
erth
anth
atob
serv
edbe
twee
npo
sitiv
ityan
dth
esa
me
cons
truc
t(a
ton
eta
il).
�p
�.0
5.��
p�
.01.
708 CAPRARA ET AL.
Spanish (Roberts & Vernon, 1983) versions of the CES–D wereused (�s � .88 [Italy], .87 [United States], .90 [Japan], & .89[Spain]).
Personality traits. Italian and Spanish versions of the shortBFQ were available and used (Caprara, Barbaranelli, Bermudez,Maslach, & Ruch, 2000). For Japan, we implemented the sameprocess of translation and back translation as for the P Scale.Reliabilities for the five scales in Italy, Japan, and Spain, respec-tively, were as follows: Energy. 78., 71, and .70; Conscientious-ness, .80. .74, and .73; Emotional Stability, .80, .70. and .75;Agreeableness, .74, .78, and .77; and Openness, .71, .73, and .78.
Results
CFAs. As a preliminary step to test cross-cultural invariance,we conducted four CFAs separately to verify an adequate fit inItaly, �2(19, N � 689) � 50.21, p � .01; CFI � .97; RMSEA �.061, 95% CI [.041, .081]; SRMR � .041; United States, �2(19,N � 1,187) � 152.75, p � .01; CFI � .95; RMSEA � .078, 95%CI [.068, .091]; SRMR � .036; Japan, �2(19, N � 281) � 38.68,p � .01; CFI � .96; RMSEA � .061, 95% CI [.033, .088];SRMR � .041; and Spain, �2(19, N � 302) � 24.98, p � .16;CFI � .98; RMSEA � .032, 95% CI [.00, .063]; SRMR � .033.In all samples, the one-factor model resulted in an adequate fit.5
Next, we conducted a four-group CFA to test for the comparabilityof the P Scale across cultures. The simultaneous equal formsolution testing structural equivalence fitted the data well, �2(76,N � 2,223) � 266.62, p � .01; CFI � .95; RMSEA � .068, 95%CI [.060, .077]; SRMR � .037. Next, after obtaining evidence ofthe equivalence of the overall scale structure in the four samples,we addressed metric invariance by imposing equality constraintson the factor loadings of the Italian, American, Japanese, andSpanish solutions. This model fitted the data reasonably well,�2(97, N � 2,223) � 411.42, p � .01; CFI � .92; RMSEA � .077,95% CI [.070, .085]; SRMR � .08, although significantly worsethan the previous one, ��2(7) � 144.80; p � .01. Using modifi-cation indices, we relaxed two loadings (i.e., Items 3 and 4) to bedifferent across any samples. Moreover, an additional loading(Item 7) was relaxed to be different in the Italian sample from anyof the three other countries. After that, the fit of the model
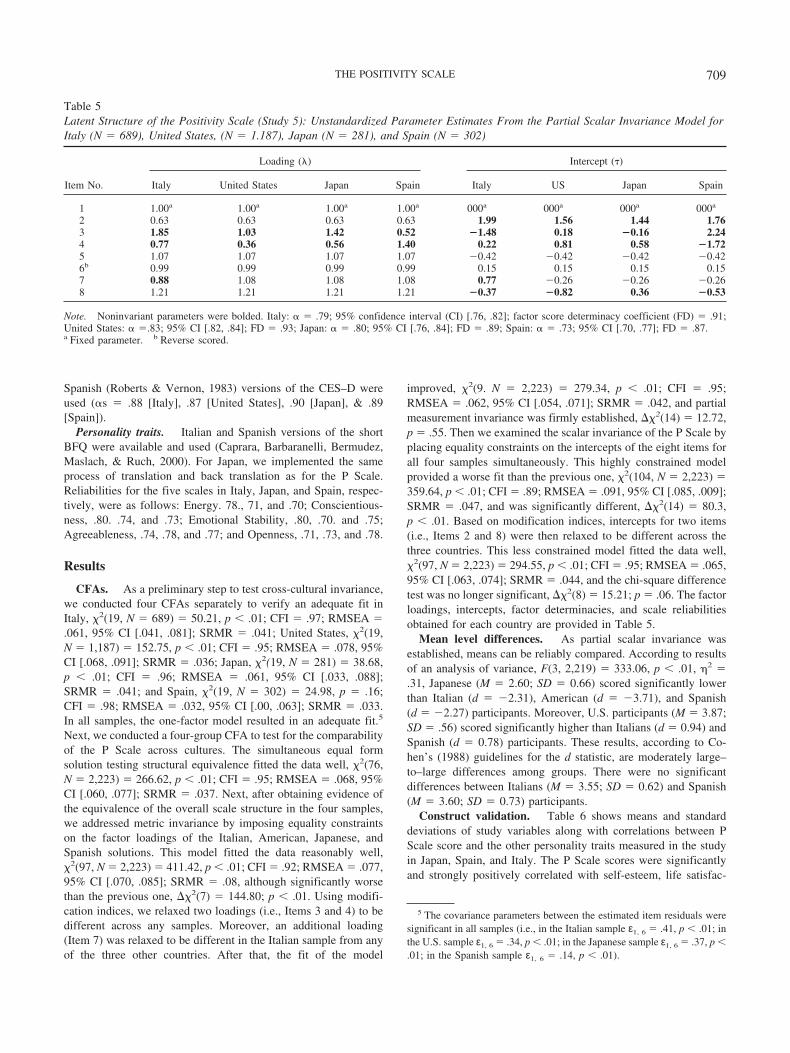
improved, �2(9. N � 2,223) � 279.34, p � .01; CFI � .95;RMSEA � .062, 95% CI [.054, .071]; SRMR � .042, and partialmeasurement invariance was firmly established, ��2(14) � 12.72,p � .55. Then we examined the scalar invariance of the P Scale byplacing equality constraints on the intercepts of the eight items forall four samples simultaneously. This highly constrained modelprovided a worse fit than the previous one, �2(104, N � 2,223) �359.64, p � .01; CFI � .89; RMSEA � .091, 95% CI [.085, .009];SRMR � .047, and was significantly different, ��2(14) � 80.3,p � .01. Based on modification indices, intercepts for two items(i.e., Items 2 and 8) were then relaxed to be different across thethree countries. This less constrained model fitted the data well,�2(97, N � 2,223) � 294.55, p � .01; CFI � .95; RMSEA � .065,95% CI [.063, .074]; SRMR � .044, and the chi-square differencetest was no longer significant, ��2(8) � 15.21; p � .06. The factorloadings, intercepts, factor determinacies, and scale reliabilitiesobtained for each country are provided in Table 5.
Mean level differences. As partial scalar invariance wasestablished, means can be reliably compared. According to resultsof an analysis of variance, F(3, 2,219) � 333.06, p � .01, �2 �.31, Japanese (M � 2.60; SD � 0.66) scored significantly lowerthan Italian (d � �2.31), American (d � �3.71), and Spanish(d � �2.27) participants. Moreover, U.S. participants (M � 3.87;SD � .56) scored significantly higher than Italians (d � 0.94) andSpanish (d � 0.78) participants. These results, according to Co-hen’s (1988) guidelines for the d statistic, are moderately large–to–large differences among groups. There were no significantdifferences between Italians (M � 3.55; SD � 0.62) and Spanish(M � 3.60; SD � 0.73) participants.
Construct validation. Table 6 shows means and standarddeviations of study variables along with correlations between PScale score and the other personality traits measured in the studyin Japan, Spain, and Italy. The P Scale scores were significantlyand strongly positively correlated with self-esteem, life satisfac-
5 The covariance parameters between the estimated item residuals weresignificant in all samples (i.e., in the Italian sample ε1, 6 � .41, p � .01; inthe U.S. sample ε1, 6 � .34, p � .01; in the Japanese sample ε1, 6 � .37, p �.01; in the Spanish sample ε1, 6 � .14, p � .01).
Table 5Latent Structure of the Positivity Scale (Study 5): Unstandardized Parameter Estimates From the Partial Scalar Invariance Model forItaly (N � 689), United States, (N � 1.187), Japan (N � 281), and Spain (N � 302)
Item No.
Loading () Intercept (�)
Italy United States Japan Spain Italy US Japan Spain
1 1.00a 1.00a 1.00a 1.00a 000a 000a 000a 000a
2 0.63 0.63 0.63 0.63 1.99 1.56 1.44 1.763 1.85 1.03 1.42 0.52 �1.48 0.18 �0.16 2.244 0.77 0.36 0.56 1.40 0.22 0.81 0.58 �1.725 1.07 1.07 1.07 1.07 �0.42 �0.42 �0.42 �0.426b 0.99 0.99 0.99 0.99 0.15 0.15 0.15 0.157 0.88 1.08 1.08 1.08 0.77 �0.26 �0.26 �0.268 1.21 1.21 1.21 1.21 �0.37 �0.82 0.36 �0.53
Note. Noninvariant parameters were bolded. Italy: � � .79; 95% confidence interval (CI) [.76, .82]; factor score determinacy coefficient (FD) � .91;United States: � �.83; 95% CI [.82, .84]; FD � .93; Japan: � � .80; 95% CI [.76, .84]; FD � .89; Spain: � � .73; 95% CI [.70, .77]; FD � .87.a Fixed parameter. b Reverse scored.
709THE POSITIVITY SCALE
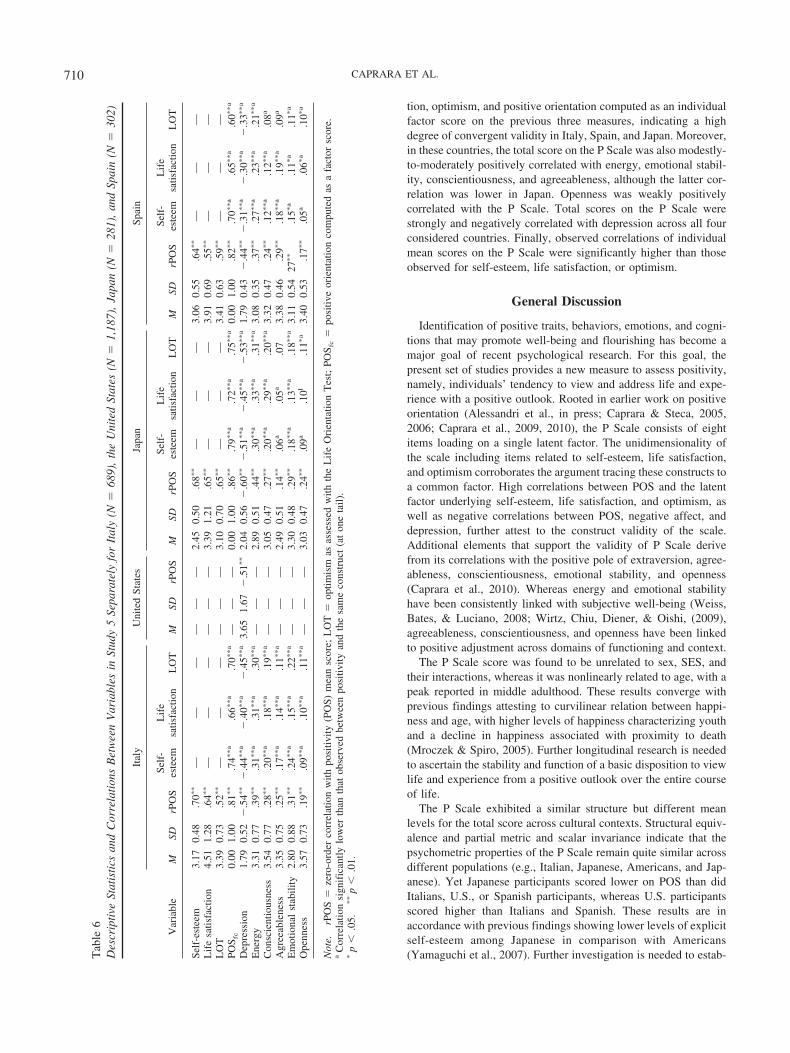
tion, optimism, and positive orientation computed as an individualfactor score on the previous three measures, indicating a highdegree of convergent validity in Italy, Spain, and Japan. Moreover,in these countries, the total score on the P Scale was also modestly-to-moderately positively correlated with energy, emotional stabil-ity, conscientiousness, and agreeableness, although the latter cor-relation was lower in Japan. Openness was weakly positivelycorrelated with the P Scale. Total scores on the P Scale werestrongly and negatively correlated with depression across all fourconsidered countries. Finally, observed correlations of individualmean scores on the P Scale were significantly higher than thoseobserved for self-esteem, life satisfaction, or optimism.
General Discussion
Identification of positive traits, behaviors, emotions, and cogni-tions that may promote well-being and flourishing has become amajor goal of recent psychological research. For this goal, thepresent set of studies provides a new measure to assess positivity,namely, individuals’ tendency to view and address life and expe-rience with a positive outlook. Rooted in earlier work on positiveorientation (Alessandri et al., in press; Caprara & Steca, 2005,2006; Caprara et al., 2009, 2010), the P Scale consists of eightitems loading on a single latent factor. The unidimensionality ofthe scale including items related to self-esteem, life satisfaction,and optimism corroborates the argument tracing these constructs toa common factor. High correlations between POS and the latentfactor underlying self-esteem, life satisfaction, and optimism, aswell as negative correlations between POS, negative affect, anddepression, further attest to the construct validity of the scale.Additional elements that support the validity of P Scale derivefrom its correlations with the positive pole of extraversion, agree-ableness, conscientiousness, emotional stability, and openness(Caprara et al., 2010). Whereas energy and emotional stabilityhave been consistently linked with subjective well-being (Weiss,Bates, & Luciano, 2008; Wirtz, Chiu, Diener, & Oishi, (2009),agreeableness, conscientiousness, and openness have been linkedto positive adjustment across domains of functioning and context.
The P Scale score was found to be unrelated to sex, SES, andtheir interactions, whereas it was nonlinearly related to age, with apeak reported in middle adulthood. These results converge withprevious findings attesting to curvilinear relation between happi-ness and age, with higher levels of happiness characterizing youthand a decline in happiness associated with proximity to death(Mroczek & Spiro, 2005). Further longitudinal research is neededto ascertain the stability and function of a basic disposition to viewlife and experience from a positive outlook over the entire courseof life.
The P Scale exhibited a similar structure but different meanlevels for the total score across cultural contexts. Structural equiv-alence and partial metric and scalar invariance indicate that thepsychometric properties of the P Scale remain quite similar acrossdifferent populations (e.g., Italian, Japanese, Americans, and Jap-anese). Yet Japanese participants scored lower on POS than didItalians, U.S., or Spanish participants, whereas U.S. participantsscored higher than Italians and Spanish. These results are inaccordance with previous findings showing lower levels of explicitself-esteem among Japanese in comparison with Americans(Yamaguchi et al., 2007). Further investigation is needed to estab-T
able
6D
escr
ipti
veSt
atis
tics
and
Cor
rela
tion
sB
etw
een
Var
iabl
esin
Stud
y5
Sepa
rate
lyfo
rIt
aly
(N�
689)
,th
eU
nite
dSt
ates
(N�
1,18
7),
Japa
n(N
�28
1),
and
Spai
n(N
�30
2)
Var
iabl
e
Ital
yU
nite
dSt
ates
Japa
nSp
ain
MSD
rPO
SSe
lf-
este
emL
ife
satis
fact
ion
LO
TM
SDrP
OS
MSD
rPO
SSe
lf-
este
emL
ife
satis
fact
ion
LO
TM
SDrP
OS
Self
-es
teem
Lif
esa
tisfa
ctio
nL
OT
Self
-est
eem
3.17
0.48
.70�
�—
——
——
—2.
450.
50.6
8��
——
—3.
060.
55.6
4��
——
—L
ife
satis
fact
ion
4.51
1.28
.64�
�—
——
——
—3.
391.
21.6
5��
——
—3.
910.
69.5
5��
——
—L
OT
3.39
0.73
.52�
�—
——
——
—3.
100.
70.6
5��
——
—3.
410.
63.5
9��
——
—PO
S fc
0.00
1.00
.81�
�.7
4��
a.6
6��
a.7
0��
a—
——
0.00
1.00
.86�
�.7
9��
a.7
2��
a.7
5��
a0.
001.
00.8
2��
.70�
�a
.65�
�a
.60�
�a
Dep
ress
ion
1.79
0.52
�.5
4��
�.4
4��
a�
.40�
�a
�.4
5��
a3.
651.
67�
.51�
�2.
040.
56�
.60�
��
.51�
�a
�.4
5��
a�
.53�
�a
1.79
0.43
�.4
4��
�.3
1��
a�
.30�
�a
�.3
3��
a
Ene
rgy
3.31
0.77
.39�
�.3
1��
a.3
1��
a.3
0��
a—
——
2.89
0.51
.44�
�.3
0��
a.3
3��
a.3
1��
a3.
080.
35.3
7��
.27�
�a
.23�
�a
.21�
�a
Con
scie
ntio
usne
ss3.
540.
77.2
8��
.20�
�a
.18�
�a
.19�
�a
——
—3.
050.
47.2
7��
.20�
�a
.29�
�a
.20�
�a
3.32
0.47
.24�
�.1
2��
a.1
2��
a.0
8a
Agr
eeab
lene
ss3.
350.
75.2
5��
.17�
�a
.14�
�a
.11�
�a
——
—2.
490.
51.1
4��
.06a
.05a
.07
3.38
0.46
.29�
�.1
8��
a.1
9��
a.0
9a
Em
otio
nal
stab
ility
2.80
0.88
.31�
�.2
4��
a.1
5��
a.2
2��
a—
——
3.30
0.48
.29�
�.1
8��
a.1
3��
a.1
8��
a3.
110.
5427
��
.15�
a.1
1�a
.11�
a
Ope
nnes
s3.
570.
73.1
9��
.09�
�a
.10�
�a
.11�
�a
——
—3.
030.
47.2
4��
.09a
.10l
.11�
a3.
400.
53.1
7��
.05a
.06�
a.1
0�a
Not
e.rP
OS
�ze
ro-o
rder
corr
elat
ion
with
posi
tivity
(PO
S)m
ean
scor
e;L
OT
�op
timis
mas
asse
ssed
with
the
Lif
eO
rien
tatio
nT
est;
POS f
c�
posi
tive
orie
ntat
ion
com
pute
das
afa
ctor
scor
e.a
Cor
rela
tion
sign
ific
antly
low
erth
anth
atob
serv
edbe
twee
npo
sitiv
ityan
dth
esa
me
cons
truc
t(a
ton
eta
il).
�p
�.0
5.��
p�
.01.
710 CAPRARA ET AL.
lish the extent to which lower scores in positivity are due tomodesty, self-criticism, concern for others’ reactions, or othercultural differences (Heine, Takata, & Lehman, 2000; Yamaguchiet al., 2007).
Finally, the potential usefulness and applicability of the P Scaleare quite broad. Researchers in the area of positive psychologymay benefit from a brief, reliable, and stable instrument that hasbeen found to be highly correlated with well-established indicatorsof well-being and adjustment. Clinical applications are also evi-dent due to the role that positivity may play in contrasting a varietyof psychological dysfunctions while fostering optimal functioning.Whereas present data offer limited insight in this regard, therobustness of factorial structure, the high reliability and the hightemporal stability of the P Scale, along with its strong associationswith positive and negative affectivity and depression, support suchapplications. Likewise, the development of theory regarding POSmay benefit from the new measure because it makes it morepractical to investigate the genetic basis and biological correlatesof POS as well as the degree to which positivity accounts for avariety of outcomes in applied settings such as work, school,sports, and health.
We acknowledge a few limitations of the present contribution.POS rests on a set of subjective evaluations that are not easilyaccessible other than through self-reports. However, future studiescould be implemented to evaluate the usefulness and the suitabilityof other methods of assessment, such as implicit measures, clinicalinterviews, and reports from other informants. Moreover, oursamples probably were somewhat slanted toward including edu-cated participants. Nonetheless, the new P Scale may represent aparsimonious instrument to address optimal functioning by assess-ing what is common to self-esteem, life satisfaction, and optimism.
References
Alessandri, G., Caprara, G. V., & Tisak, J. (2011). The contribution ofpositive orientation to well adjustment during emerging adulthood. Man-uscript submitted for publication.
Alessandri, G., Caprara, G. V., & Tisak, J. (in press). Further explorationson the unique contribution of positive orientation to optimal functioning.European Psychologist.
Argyle, M. (1999). Causes and correlates of happiness. In D. Kahneman, E.Diener, and N. Schwarz, (Eds.), Foundations of hedonic psychology:Scientific perspectives on enjoyment and suffering (pp. 353–373). NewYork, NY: Russell Sage Foundation.
Atienza, F. L., Balaguer, I., & Garcia-Merita, M. L. (2003). Satisfactionwith Life Scale: Analysis of factorial invariance across sexes. Person-ality and Individual Differences, 35, 1255–1260. doi:10.1016/S0191-8869(02)00332-X
Bagozzi, R. P. (1994). Structural equation models in marketing research:Basic principles. In R. Bagozzi (Ed.), Principles of marketing research(pp. 317–385). Cambridge, MA: Blackwell.
Baumeister, R. F., Campbell, J. D., Krueger, J. I., & Vohs, K. D. (2003).Does high self-esteem cause better performance, interpersonal success,happiness, or healthier lifestyle? Psychological Science in the PublicInterest, 4, 1–44. doi:10.1111/1529-1006.01431
Beckham, E. E., Leber, W. R., Watkins, J. T., Boyer, J. L., & Cook, J. B.(1986). Development of an instrument to measure Beck’s cognitivetriad: The Cognitive Triad Inventory. Journal of Consulting and ClinicalPsychology, 54, 566–567. doi:10.1037/0022-006X.54.4.566
Bentler P. M. (1990). Comparative fit indexes in structural models. Psy-chological Bulletin, 107, 238–246. doi:10.1037/0033-2909.107.2.238
Blascovich, J., & Tomaka, J. (1991). Measures of self-esteem. In J. P.Robinson, P. R. Shaver, & L. S. Wrightsman (Eds.), Measures ofpersonality and social psychological attitudes: Volume I. San Diego,CA: Academic Press.
Browne, M. W., & Cudek, R. (1993). Alternative ways of assessing modelfit. In K. A. Bollen, & J. S. Long (Eds.), Testing structural equationmodels (pp. 136–162). Newbury Park, CA: Sage.
Caprara, G. V., Alessandri, G., Trommsdorff, G., Heikamp, T., YamaguchiS., & Suzuki, F. (in press). Positive orientation across three cultures.Journal of Cross Cultural Psychology.
Caprara, G. V., Barbaranelli, C., Bermudez, J., Maslach, C., & Ruch, W.(2000). Multivariate methods for the comparison of factor structures incross-cultural research: An illustration with the Big Five Questionnaire.Journal of Cross-Cultural Psychology, 31, 437– 464. doi:10.1177/0022022100031004002
Caprara, G. V., Barbaranelli, C., & Borgogni, L. (1993). BFQ: Big FiveQuestionnaire. Manuale. Firenze, Italy: Organizzazioni Speciali.
Caprara, G. V., Caprara, M. G., & Steca, P. (2003). Personality’s correlatesof adult development and aging. European Psychologist, 8, 131–147.doi:10.1027//1016-9040.8.3.131
Caprara, G. V., Fagnani, C., Alessandri, G., Steca, P., Gigantesco, A.,Cavalli-Sforza, L. L., & Stazi, M. A. (2009). Human optimal function-ing: The genetics of positive orientation towards self, life, and the future.Behaviour Genetics, 39, 277–284. doi:10.1007/s10519-009-9267-y
Caprara, G. V., & Steca, P. (2005). Affective and social self-regulatoryefficacy beliefs as determinants of positive thinking and happiness.European Psychologist, 4, 275–286.
Caprara, G. V., & Steca, P. (2006). The contribution of self-regulatoryefficacy beliefs in managing affect and family relationships to positivethinking and hedonic balance. Journal of Social and Clinical Psychol-ogy, 25, 601–625.
Caprara, G. V., Steca, P., Alessandri, G., Abela, J. R. Z., & McWhinnie,C. M. (2010). Positive orientation: Explorations on what is common tolife satisfaction, self-esteem, and optimism. Epidemiologia e PsichiatriaSociale, 19, 63–71.
Cattell, R. B., & Vogelmann, S. (1977). A comprehensive trial of the screeand KG criteria for determining the number of factors. MultivariateBehavioral Research, 12, 289–325. doi:10.1207/s15327906mbr1203_2
Cohen, J. (1988). Statistical power analysis for the behavioral sciences(2nd ed.). Hillsdale, NJ: Erlbaum.
Cohen, J., & Cohen, P. (1983). Applied multiple regression/correlationanalysis for the behavioral sciences (2nd ed.). Hillsdale, NJ: Erlbaum.
Diener, E., Emmons, R. A., Larsen, R. J., & Griffin, S. (1985). TheSatisfaction With Life Scale. Journal of Personality Assessment, 49,71–75. doi:10.1207/s15327752jpa4901_13
Diener, E., Scollon, C. K. N., Oishi, S., Dzokoto, V., & Suh, E. M. (2000).Positivity and the construction of life satisfaction judgments: Globalhappiness is not the sum of its part. Journal of Happiness Studies, 1,159–176. doi:10.1023/A:1010031813405
Diener, E., Suh, E. M., Lucas, R. E., & Smith, H. L. (1999). Subjectivewell-being: Three decades of progress. Psychological Bulletin, 2, 276–302.
Fava, G. A. (1983). Assessing depressive symptoms across cultures: Italianvalidation of the CES–D Self-Rating Scale. Journal of Clinical Psychol-ogy, 39, 249 –251. doi:10.1002/1097-4679(198303)39:2�249::AID-JCLP2270390218�3.0.CO;2-Y
Feldt. L. S., Woodruff, D. J., & Salih. F. A. (1987). Statistical inference forcoefficient alpha. Applied Psychological Measurement, 11, 93–103.doi:10.1177/014662168701100107
Ferrando, P. J., Chico, E., & Tous, J. M. (2002). Propiedades psicometricasdel test de optimismo Life Orientation Test [Psychometric properties ofthe Life Orientation Test]. Psicothema, 14, 673–680.
Gorsuch, R. L. (1983). Factor analysis (2nd ed.). Hillsdale, NJ: Erlbaum.
711THE POSITIVITY SCALE
Grice, J. W. (2001). Computing and evaluating factor scores. Psycholog-ical Methods, 6, 430–450. doi:10.1037/1082-989X.6.4.430
Harter, S. (1993). Causes and consequences of low self-esteem in childrenand adolescents. In R. F. Baumeister (Ed). Self-esteem: The puzzle of lowself-regard (pp. 87–116). New York, NY: Plenum.
Hattie, J. (1985). Methodology review: Assessing unidimensionality oftests and items. Applied Psychological Measurement, 9, 139–164. doi:10.1177/014662168500900204
Heine, S. J., Takata, T., & Lehman, D. R. (2000). Beyond self-presentation:Evidence for self-criticism among Japanese. Personality and SocialPsychology Bulletin, 26, 71–78. doi:10.1177/0146167200261007
Hinkin, T. R. (1998). A brief tutorial on the development of measures foruse in survey questionnaires. Organizational Research Methods, 1,104–121. doi:10.1177/109442819800100106
Hofstede, G. (2001). Culture’s consequences: Comparing values, behav-iors, institutions and organizations across nations (2nd ed.). ThousandOaks, CA: Sage.
Hu, L., & Bentler, P. M. (1998). Fit indices in covariance structuremodeling: Sensitivity to under-parameterized model misspecification.Psychological Methods, 3, 424–453. doi:10.1037/1082-989X.3.4.424
Kozma, A., Stone, S., & Stones, M. J. (2000). Stability in components andpredictors of subjective well-being (SWB): Implications for SWB struc-ture. In E. Diener and D. R. Rahtz (Eds.), Advances in quality of lifetheory and research (Vol. 1, pp. 13–30). London, England: KluwerAcademic. doi:10.1007/978-94-011-4291-5_2
Lyubomirsky, S., King, L., & Diener, E. (2005). The benefits of frequentpositive affect: Does happiness lead to success? Psychological Bulletin,131, 803–855. doi:10.1037/0033-2909.131.6.803
Martın-Albo, J., Nunez, J. L., Navarro, J. C., & Grijalvo, F. (2007). TheRosenberg Self-Esteem Scale: Translation and validation in universitystudents. The Spanish Journal of Psychology, 10. 458–467.
McDonald, R. P. (1985). Factor analysis and related methods. Hillsdale,NJ: Erlbaum.
Meredith, W., & Teresi, J. (2006). An essay on measurement and factorialinvariance. Medical Care, 44, S69 –S77. doi:10.1097/01.mlr.0000245438.73837.89
Mroczek, D. K., & Spiro, A., III. (2005). Change in life satisfaction duringadulthood: Findings from the Veterans Affairs Normative Aging Study.Journal of Personality and Social Psychology, 88, 189 –202. doi:10.1037/0022-3514.88.1.189
Muthen, L., & Muthen, B. (1998). Mplus user’s guide. Los Angeles, CA:Authors.
Radloff, L. S. (1977). The CES–D Scale: A self-report depression scale forresearch in the general population. Applied Psychological Measurement,1, 385–401. doi:10.1177/014662167700100306
Roberts, R. E., & Vernon, S. W. (1983). The Center for Epidemiologic
Studies Depression Scale: Its use in a community sample. The AmericaJournal of Psychiatry, 140, 41–46.
Rosenberg, M. (1965). Society and the adolescent self-image. Princeton,NJ: Princeton University Press.
Scheier, M. F., & Carver, C. S. (1993). On the power of positive thinking:The benefits of being optimistic. Current Directions in PsychologicalScience, 2, 26–30. doi:10.1111/1467-8721.ep10770572
Scheier, M. F., Carver, C. S., & Bridges, M. W. (1994). Distinguishingoptimism from neuroticism (and trait anxiety, self-mastery, and self-esteem): A re-evaluation of the Life Orientation Test. Journal of Per-sonality and Social Psychology, 67, 1063–1078. doi:10.1037/0022-3514.67.6.1063
Scheier, M. F., Weintraub, J. K., & Carver, C. S. (1986). Coping withstress: Divergent strategies of optimists and pessimists. Journal of Per-sonality and Social Psychology, 51, 1257–1264.
Schwartz, S. H. (2008). Basic human values: An overview. Retrievedfrom http://segr-did2.fmag.unict.it/Allegati/convegno%207-8-10-05/Schwartzpaper.pdf
Seligman, M. E. P., & Csikszentmihalyi, M. (2000). Positive psychology:An introduction. American Psychologist, 55, 5–14. doi:10.1037/0003-066X.55.1.5
Shima, S., Shikano, T., Kitamura, T., & Asai, M. (1985). Atarashii yokuut-susei jiko hyouka syakudo ni tuite [New self-rating scale for depression].Clinical Psychiatry, 27, 717–723.
Watson, D., Clark, L. A., & Tellegen, A. (1988). Development and vali-dation of brief measures of positive and negative affect: The PANASScales. Journal of Personality and Social Psychology, 54, 1063–1070.doi:10.1037/0022-3514.54.6.1063
Weiss, A., Bates, T. C., & Luciano, M. (2008). Happiness is a personal(ity)thing: The genetics of personality and well-being in a representativesample. Psychological Science, 19, 205–210. doi:10.1111/j.1467-9280.2008.02068.x
Wirtz, D., Chiu, C.-Y., Diener, E., & Oishi, S. (2009). What constitutes agood life? Cultural differences in the role of positive and negative affectin subjective well-being. Journal of Personality, 77, 1167–1196. doi:10.1111/j.1467-6494.2009.00578.x
Yamaguchi, S., Lin, C., Morio, H., & Okumura, T. (2008). Motivatedexpression of self-esteem across cultures. In R. M. Sorrentino & S.Yamaguchi (Eds.), Handbook of motivation and cognition across cul-tures (pp. 369–392). San Diego, CA: Elsevier. doi:10.1016/B978-0-12-373694-9.00016-7
Received June 7, 2011Revision received September 28, 2011
Accepted October 3, 2011 �
712 CAPRARA ET AL.
Related Documents