The Population Dynamics of England’s Small Towns, 1991-2006 Tony Champion CURDS, Newcastle University Paul Norman School of Geography, University of Leeds Paper presented at British Society for Population Studies Annual Conference 2008 Acknowledgements • Mike Coombes, Simon Raybould (Newcastle) for comments & data • John Shepherd, Brian Linneker, Sam Waples (Birkbeck) for data & map • Peter Bibby (Sheffield) for data • ONS for census and population estimates data © Crown copyright

The Population Dynamics of England’s Small Towns, 1991-2006 Tony Champion CURDS, Newcastle University Paul Norman School of Geography, University of Leeds.
Dec 19, 2015
Welcome message from author
This document is posted to help you gain knowledge. Please leave a comment to let me know what you think about it! Share it to your friends and learn new things together.
Transcript

The Population Dynamics of England’s Small Towns, 1991-2006
Tony ChampionCURDS, Newcastle University
Paul NormanSchool of Geography, University of Leeds
Paper presented at British Society for Population Studies Annual Conference 2008
Acknowledgements
• Mike Coombes, Simon Raybould (Newcastle) for comments & data• John Shepherd, Brian Linneker, Sam Waples (Birkbeck) for data & map • Peter Bibby (Sheffield) for data • ONS for census and population estimates data © Crown copyright

Context
• The main foci of academic, policy and media attention on the settlement system is on ‘cities’ (the major ones) and ‘countryside’ (rural districts)
• Much less attention has been given to smaller cities and towns, least to Small Towns
• So: How far is this lack of interest justified by their occupying a small and static position in the settlement system?
• What makes them tick in terms of demographic dynamics and their drivers?
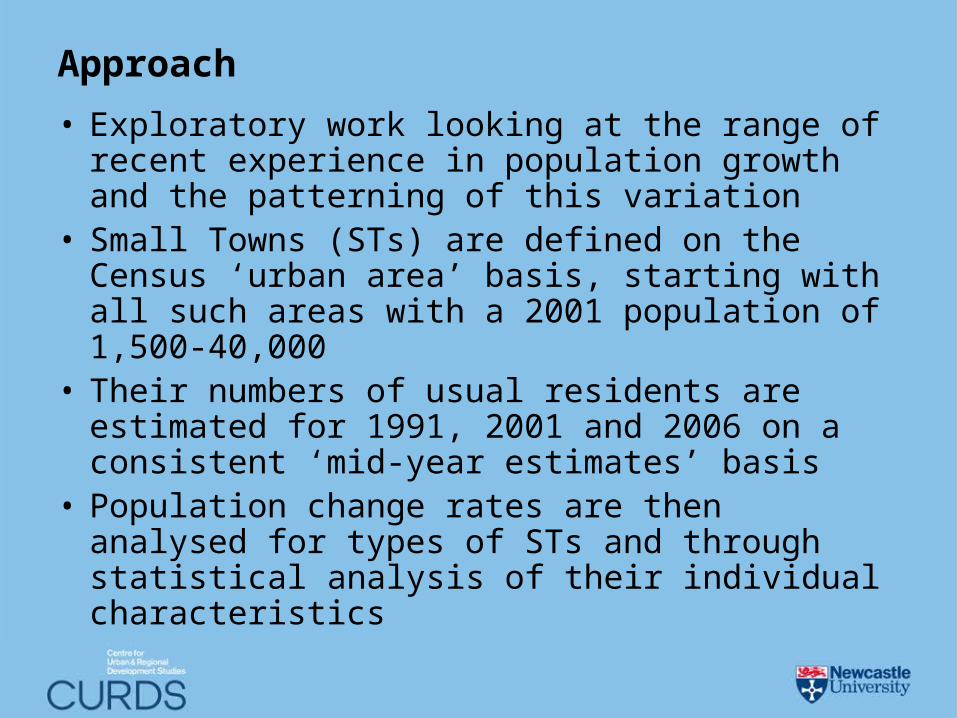
Approach
• Exploratory work looking at the range of recent experience in population growth and the patterning of this variation
• Small Towns (STs) are defined on the Census ‘urban area’ basis, starting with all such areas with a 2001 population of 1,500-40,000
• Their numbers of usual residents are estimated for 1991, 2001 and 2006 on a consistent ‘mid-year estimates’ basis
• Population change rates are then analysed for types of STs and through statistical analysis of their individual characteristics
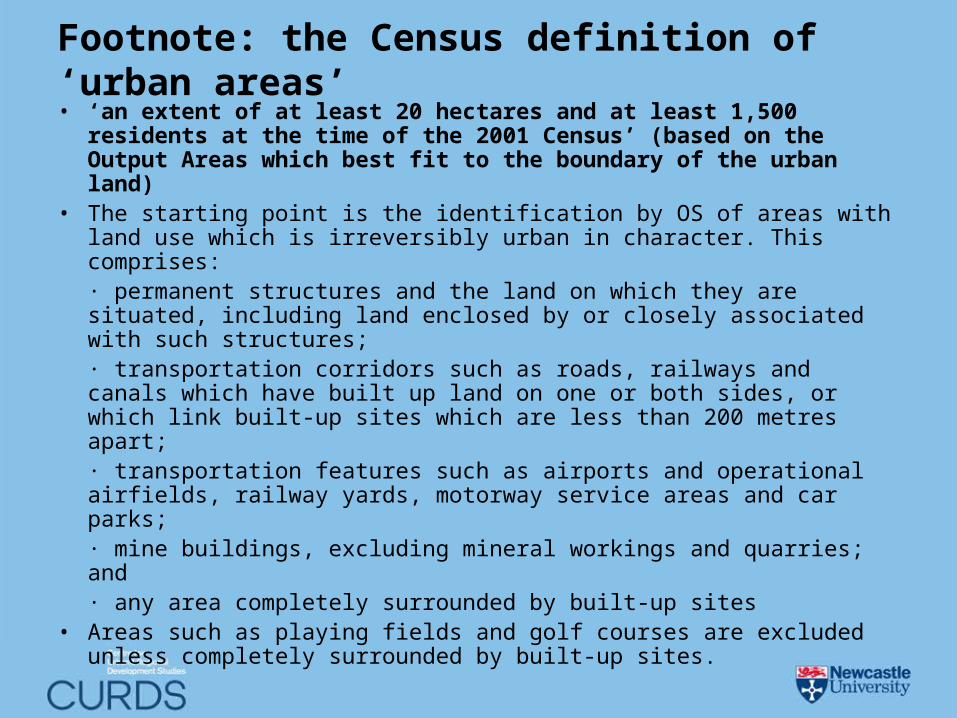
Footnote: the Census definition of ‘urban areas’• ‘an extent of at least 20 hectares and at least 1,500 residents at
the time of the 2001 Census’ (based on the Output Areas which best fit to the boundary of the urban land)
• The starting point is the identification by OS of areas with land use which is irreversibly urban in character. This comprises:· permanent structures and the land on which they are situated, including land enclosed by or closely associated with such structures;· transportation corridors such as roads, railways and canals which have built up land on one or both sides, or which link built-up sites which are less than 200 metres apart;· transportation features such as airports and operational airfields, railway yards, motorway service areas and car parks;· mine buildings, excluding mineral workings and quarries; and· any area completely surrounded by built-up sites
• Areas such as playing fields and golf courses are excluded unless completely surrounded by built-up sites.

Estimating the population of the ‘urban areas’ (i)
• Ward data 1991-2001– 1991 & 2001 age-sex estimates by CAS wards– Estimated during UPTAP project including revisions to
original Estimating with Confidence populations (Norman et al., 2008)
– 1990s births & deaths allocated to CAS wards
• Ward data 2002-2006– 2006 age-sex estimates for CAS wards achieved by
constraining 2005 estimates to 2006 district data (to be recalculated using now-released 2006 ward data)
– 2000s births & deaths allocated to CAS wards
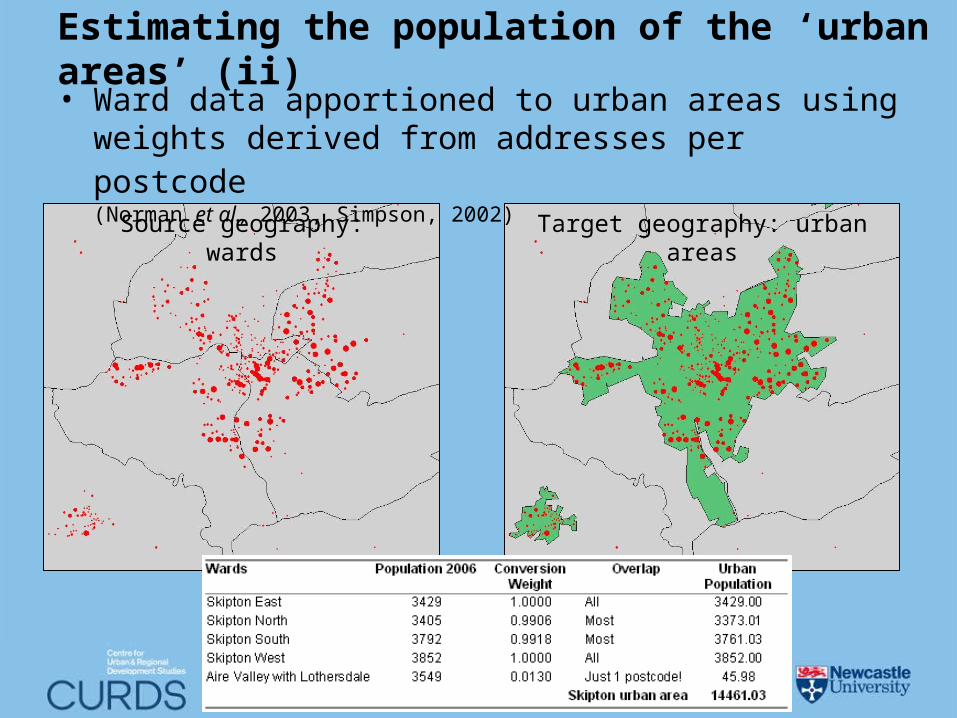
Estimating the population of the ‘urban areas’ (ii)• Ward data apportioned to urban areas using weights
derived from addresses per postcode (Norman et al., 2003, Simpson, 2002)
Source geography: wards Target geography: urban areas

Steps in the analysis
• Q1: What share do the STs make up of national population and population change 1991-2006?
• Q2: How far does their population growth vary by ST type based on population size, region, DEFRA district type, socio-demographic cluster?
• Q3: What characteristics are most strongly correlated with population growth rate?
• Q4a: How much of the variance in growth rate be ‘explained’ by regression-based models?
• Q4b: Which seem to be the key ‘drivers’ of ST population change differentials?
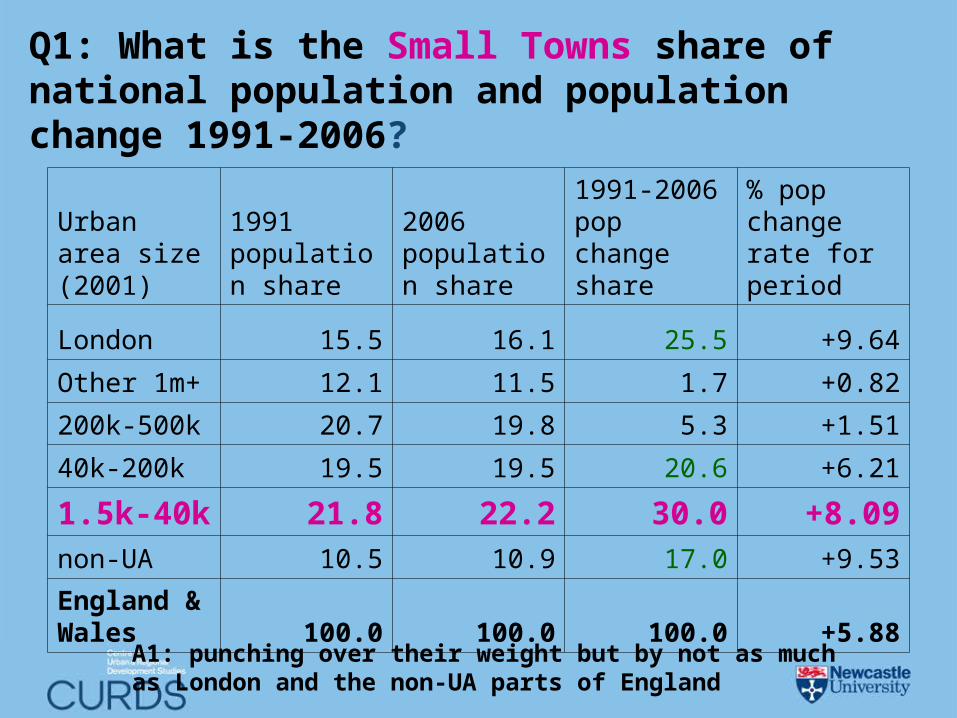
Q1: What is the Small Towns share of national population and population change 1991-2006?
Urban area size(2001)
1991 population share
2006 population share
1991-2006 pop change share
% pop change rate for period
London 15.5 16.1 25.5 +9.64
Other 1m+ 12.1 11.5 1.7 +0.82
200k-500k 20.7 19.8 5.3 +1.51
40k-200k 19.5 19.5 20.6 +6.21
1.5k-40k 21.8 22.2 30.0 +8.09non-UA 10.5 10.9 17.0 +9.53
England & Wales 100.0 100.0 100.0 +5.88
A1: punching over their weight but by not as much as London and the non-UA parts of England

Q2: Focusing on England’s 1,628 Small Towns, how far does population change vary by:
• Population size within the 1.5k-40k range?• Government Office Region excluding
London’s 3 STs? • DEFRA 6-fold urban/rural district typology
from Major Urban to Rural-80?• Socio-demographic type based on cluster
analysis of (mainly 2001 Census) variables for the 1,587 STs without a substantial institutional presence (e.g. military, prisons, universities, boarding schools)?

Population size?
Population change rate, by size group of urban area, England, 1991-2001 and 2001-2006, per 1000 per year
0.0 1.0 2.0 3.0 4.0 5.0 6.0 7.0 8.0 9.0
25k-40k
15k-25k
5k-15k
1.5k-5k
per 1000 per year
2001-2006
1991-2001
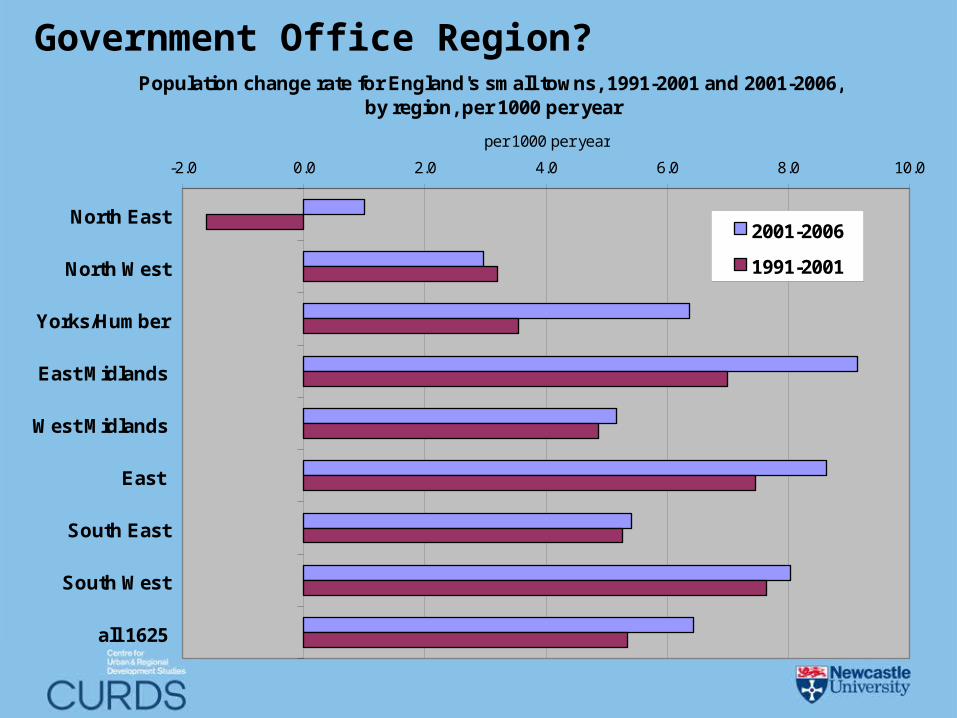
Government Office Region?Population change rate for England's small towns, 1991-2001 and 2001-2006,
by region, per 1000 per year
-2.0 0.0 2.0 4.0 6.0 8.0 10.0
North East
North West
Yorks/Humber
East Midlands
West Midlands
East
South East
South West
all 1625
per 1000 per year
2001-2006
1991-2001

DEFRA district type?Population change rate for England's small towns, 1991-2001 and 2001-2006,
by DEFRA district type, per 1000 per year
0.0 1.0 2.0 3.0 4.0 5.0 6.0 7.0 8.0 9.0
Major Urban
Large Urban
Other Urban
Significant Rural
Rural-50
Rural-80
per 1000 per year
2001-2006
1991-2001

Socio-demographic cluster?Population change rate for 1587 of England's small towns, 1991-2001 and 2001-2006, by 8 clusters, per 1000 per year
-2.0 0.0 2.0 4.0 6.0 8.0 10.0 12.0
Pensioners
Skilled service profs
Middle aged
High access, single, flats
Coastal, remote, hotel
Agric, low skill
Deprived
Young, high emprat
all 1587
per 1000 per year
2001-2006
1991-2001
N=1587, i.e. excluding 41 STs with large institutional presence
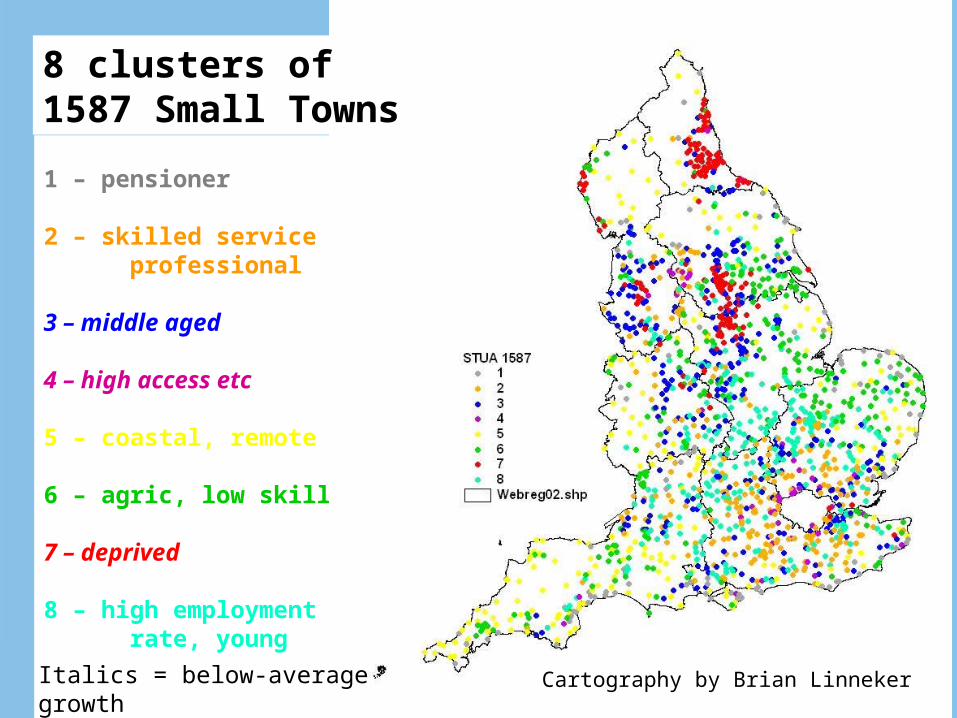
1 – pensioner
2 – skilled service professional
3 – middle aged
4 – high access etc
5 – coastal, remote
6 – agric, low skill
7 – deprived
8 – high employment rate, young
8 clusters of 1587 Small Towns
Cartography by Brian LinnekerItalics = below-average growth in both periods (3, 4 & 7)
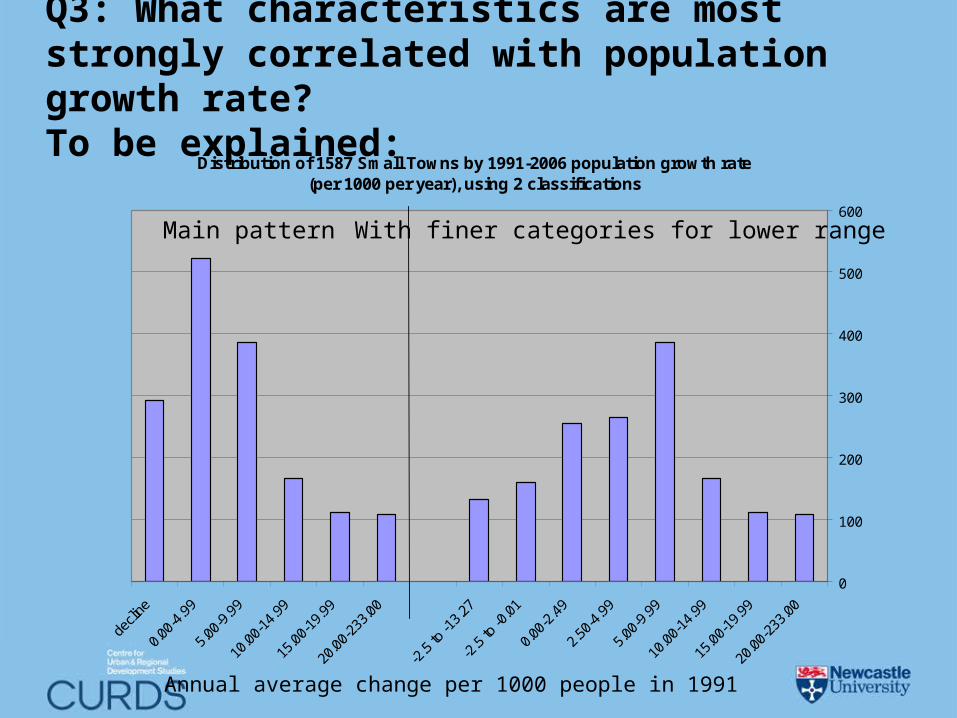
Q3: What characteristics are most strongly correlated with population growth rate?To be explained:
Distribution of 1587 Small Towns by 1991-2006 population growth rate (per 1000 per year), using 2 classifications
0
100
200
300
400
500
600
20.0
0-23
3.00
15.0
0-19
.99
10.0
0-14
.99
5.00
-9.9
9
2.50
-4.9
9
0.00
-2.4
9
-2.5
to -0
.01
-2.5
to -1
3.27
20.0
0-23
3.00
15.0
0-19
.99
10.0
0-14
.99
5.00
-9.9
9
0.00
-4.9
9
decli
ne
Annual average change per 1000 people in 1991
Main pattern With finer categories for lower range
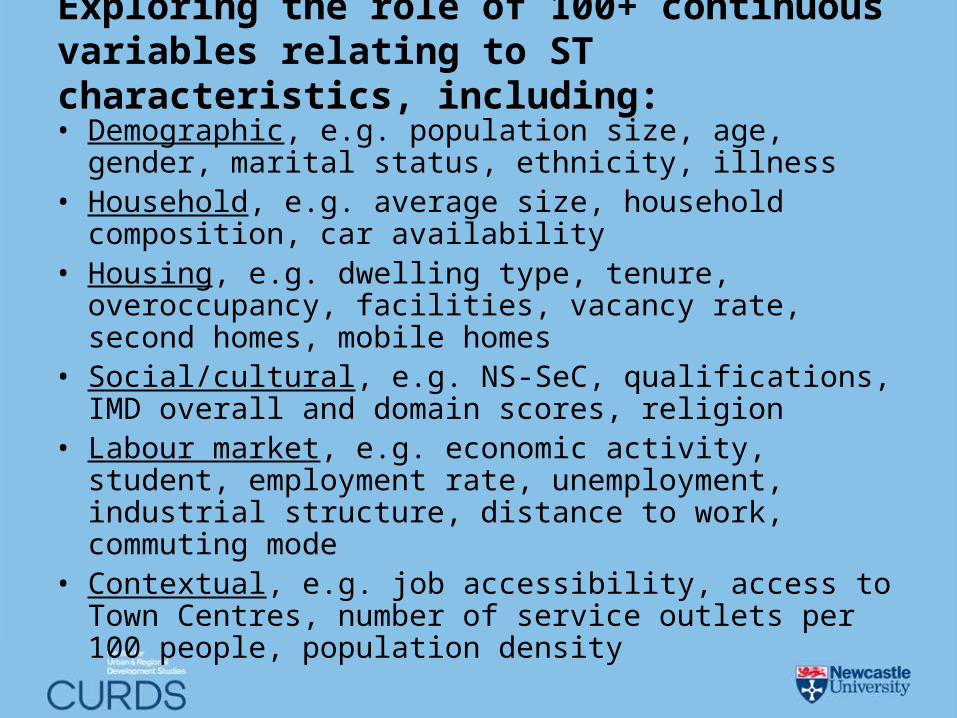
Exploring the role of 100+ continuous variables relating to ST characteristics, including:
• Demographic, e.g. population size, age, gender, marital status, ethnicity, illness
• Household, e.g. average size, household composition, car availability
• Housing, e.g. dwelling type, tenure, overoccupancy, facilities, vacancy rate, second homes, mobile homes
• Social/cultural, e.g. NS-SeC, qualifications, IMD overall and domain scores, religion
• Labour market, e.g. economic activity, student, employment rate, unemployment, industrial structure, distance to work, commuting mode
• Contextual, e.g. job accessibility, access to Town Centres, number of service outlets per 100 people, population density

The strongest positive and negative correlations
Most positive correlations Most negative correlations0.279 Aged 25-44 -0.303 Family with non-dependent child
0.249 Couple -0.279 Providing unpaid care
0.247 Remarried -0.272 Aged 45-64
0.235 Aged 0-14 -0.204 Households with no car
0.220 Employment rate -0.189 Long term limiting illness
0.214 Couple with no kids -0.185 IMD employment domain
0.190 Detached dwelling -0.176 Mean age
0.187 Households with 2+ cars -0.173 Households of 1 person of pension age
0.182 Traveling 20km+ to work -0.161 Widowed
0.164 Cars per household -0.158 Aged 15-24
0.142 Mean distance to work -0.154 IMD overall domain
0.140 IMD geography domain -0.153 Unemployment rate
0.128 No religion -0.144 IMD income domain
0.114 Rural-80 LA (ordinal) -0.139 Job accessibility 1991
0.109 Owner occupier -0.138 Public transport to work
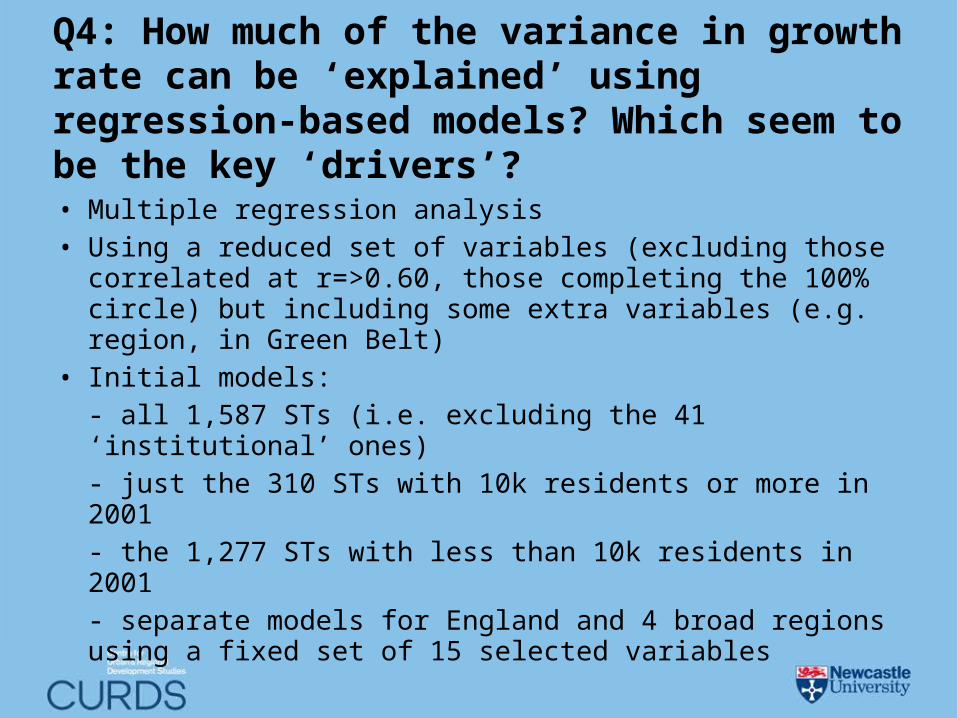
Q4: How much of the variance in growth rate can be ‘explained’ using regression-based models? Which seem to be the key ‘drivers’?
• Multiple regression analysis• Using a reduced set of variables (excluding those
correlated at r=>0.60, those completing the 100% circle) but including some extra variables (e.g. region, in Green Belt)
• Initial models:- all 1,587 STs (i.e. excluding the 41 ‘institutional’ ones)- just the 310 STs with 10k residents or more in 2001- the 1,277 STs with less than 10k residents in 2001- separate models for England and 4 broad regions using a fixed set of 15 selected variables
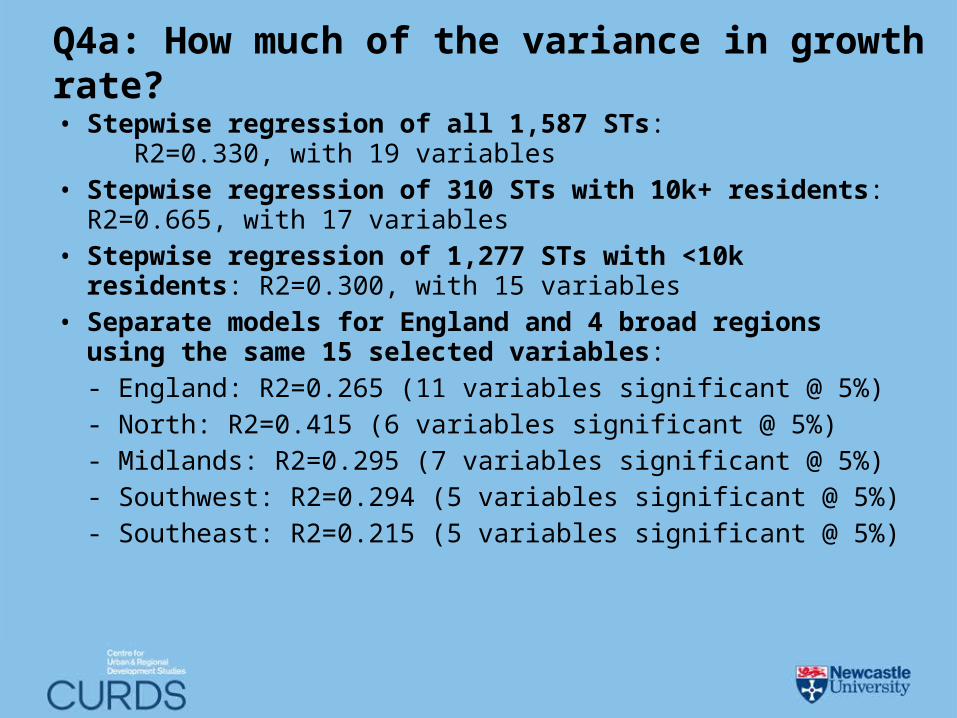
Q4a: How much of the variance in growth rate?
• Stepwise regression of all 1,587 STs: R2=0.330, with 19 variables
• Stepwise regression of 310 STs with 10k+ residents: R2=0.665, with 17 variables
• Stepwise regression of 1,277 STs with <10k residents: R2=0.300, with 15 variables
• Separate models for England and 4 broad regions using the same 15 selected variables:- England: R2=0.265 (11 variables significant @ 5%)- North: R2=0.415 (6 variables significant @ 5%) - Midlands: R2=0.295 (7 variables significant @ 5%) - Southwest: R2=0.294 (5 variables significant @ 5%)- Southeast: R2=0.215 (5 variables significant @ 5%)

Modelling 1991-2006 change rate by broad regionVariable name North Mids SW SE All
(Constant) -69.8 -113.8 -88.7 -119.6 -93.2
%pop who are aged 25-44 1.371 2.139 1.876 2.350 1.912
%pop who are aged 75+ 1.059 1.262 0.830 1.506 1.278
% households that are Couple/no-child 0.485 -0.122 -0.356 0.311 0.139
% classified persons Lower Manag/Prof 0.214 0.848 0.304 0.139 0.303
% 16-74 who have no qualifications -0.023 0.478 0.297 0.534 0.174
% active women who work part-time 0.127 -0.075 0.258 0.206 0.090
% employed who work in farming etc 0.687 0.205 0.385 -0.758 0.177
% employed who work in trade etc 0.337 0.370 0.537 0.178 0.460
% employed who travel 20km+ to work -0.064 0.190 0.046 0.265 0.094
Job accessibility -0.039 -0.205 -0.179 -0.108 -0.184
Number of services per 100 people 0.073 0.570 0.495 -0.156 0.285
% housing that is detached 0.111 0.305 0.214 0.313 0.233
% household spaces in caravan etc 0.091 0.427 0.941 0.358 0.476
In Area of Outstanding Natural Beauty 1.254 -1.647 -1.443 -1.248 -1.704
In Green Belt zone -2.646 -3.440 2.026 -0.361 -1.579
Adjusted R2 0.415 0.295 0.294 0.215 0.265

Q4b: Which seem to be the key ‘drivers’?
• Age structure: % 25-44, but also % 75+• Detached housing, but also caravans/mobile homes• Managerial and Professional, but also No qualifications• % commuting 20km+, and also Low access to jobs• Work in Trade (wholesale, retail, motors, etc), and also
in Hotels etc and Primary sector• Located outside AONBs and Green Belts, also in SW• Number of service outlets per 100 residents (weak)
Verdict:• All these are operating independently, suggesting
several growth components for any individual place• Results suggest diversity in drivers between places, too,
as also reflected in the analysis by socio-demog cluster
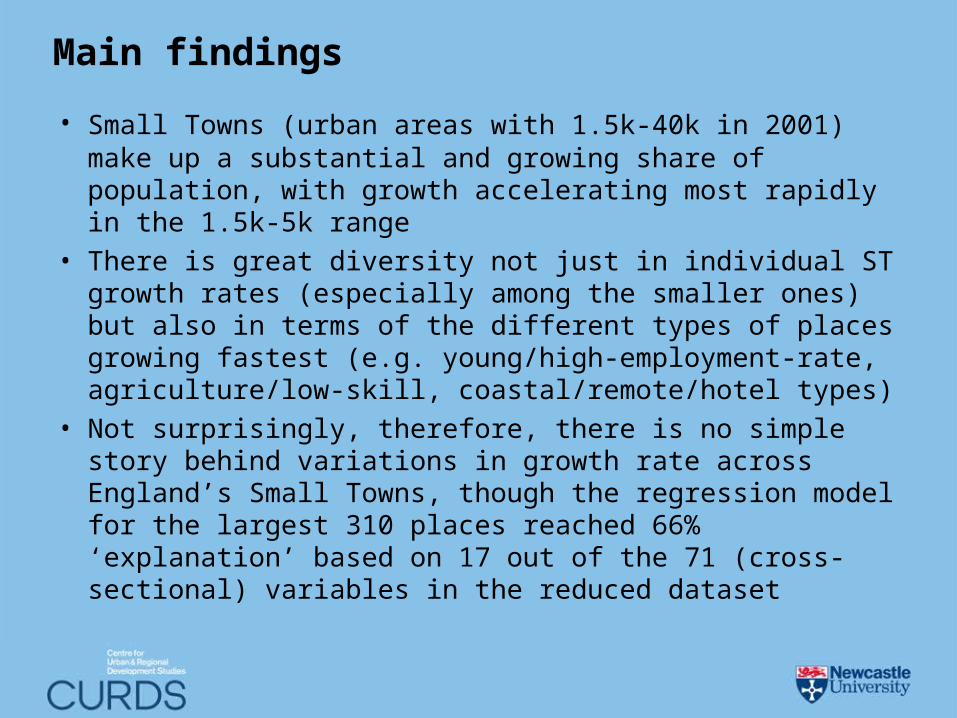
Main findings
• Small Towns (urban areas with 1.5k-40k in 2001) make up a substantial and growing share of population, with growth accelerating most rapidly in the 1.5k-5k range
• There is great diversity not just in individual ST growth rates (especially among the smaller ones) but also in terms of the different types of places growing fastest (e.g. young/high-employment-rate, agriculture/low-skill, coastal/remote/hotel types)
• Not surprisingly, therefore, there is no simple story behind variations in growth rate across England’s Small Towns, though the regression model for the largest 310 places reached 66% ‘explanation’ based on 17 out of the 71 (cross-sectional) variables in the reduced dataset
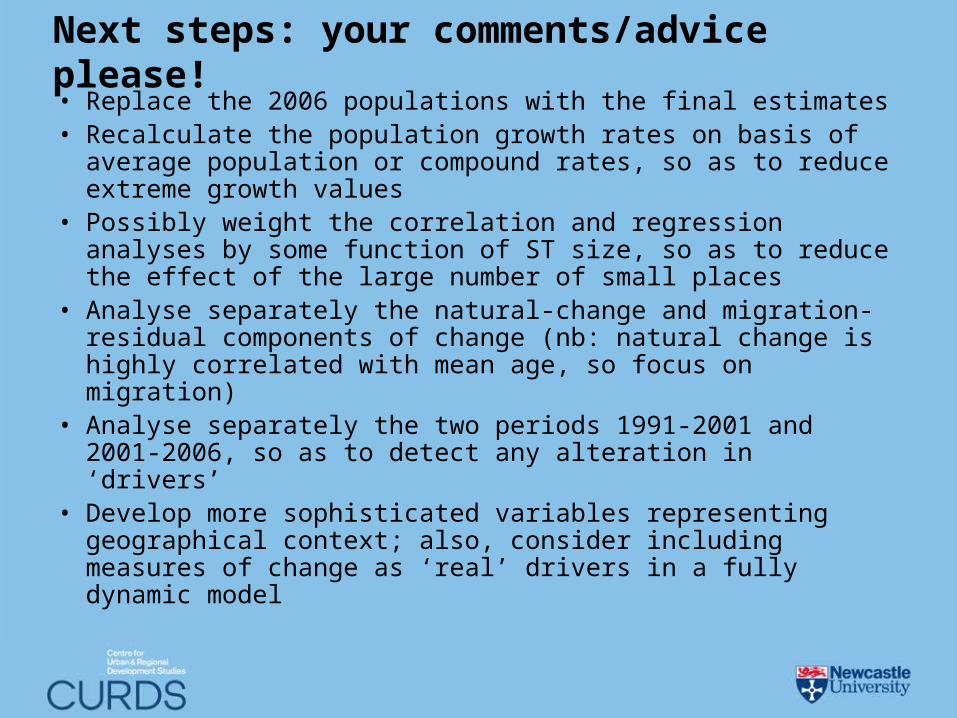
Next steps: your comments/advice please!• Replace the 2006 populations with the final estimates• Recalculate the population growth rates on basis of
average population or compound rates, so as to reduce extreme growth values
• Possibly weight the correlation and regression analyses by some function of ST size, so as to reduce the effect of the large number of small places
• Analyse separately the natural-change and migration-residual components of change (nb: natural change is highly correlated with mean age, so focus on migration)
• Analyse separately the two periods 1991-2001 and 2001-2006, so as to detect any alteration in ‘drivers’
• Develop more sophisticated variables representing geographical context; also, consider including measures of change as ‘real’ drivers in a fully dynamic model

References on estimating the population of urban areas
Norman P, Rees P, Boyle P (2003) Achieving data compatibility over space and time: creating consistent geographical zones. International Journal of Population Geography. 9(5): 365-386
Norman P, Simpson L & Sabater A (2008) ‘Estimating with Confidence’ and hindsight: new UK small area population estimates for 1991. Population, Space & Place (in press, due out 11/09/08)
Simpson L (2002) Geography conversion tables: a framework for conversion of data between geographical units. International Journal of Population Geography 8: 69-82
Related Documents