The plotting programs PlotXY and PlotXWin Short description and operating instructions (rel. November 2009) About this document . Since the program described in this document is designed to be very intuitive, it is deemed sufficient to give here only some very short information. This document contains some Generic Information Paragraphs (titles in NON-ITALIC BLACK) and modeless 1 window descriptions (titles in ITALIC BLUE). The document describes the features of two different programs: PlotXY.exe and PlotXWin.exe. Since the latter is an enhancement of the former, the majority of descriptions relate to both programs; parts specific to PlotXWin are written in red. Table of Contents General information ............................................................................................................................................. 1 Introduction ........................................................................................................................................................ 1 Main Program features (PlotXY and PlotXWin) ................................................................................................ 2 Features present only in PlotXWin..................................................................................................................... 2 User Interface highlights..................................................................................................................................... 2 The Data Selection Window ................................................................................................................................ 2 Basic information............................................................................................................................................... 2 Multi-file mode ................................................................................................................................................... 4 Program options ................................................................................................................................................. 5 The Plot window................................................................................................................................................... 5 Procedure to have plots with two vertical axes................................................................................................... 6 The Fourier Chart Window................................................................................................................................. 6 Command-line Parameters................................................................................................................................... 7 Additional Functions............................................................................................................................................ 7 Known Problems.................................................................................................................................................. 8 User Return .......................................................................................................................................................... 8 APPENDIX A: FILE FORMAT SPECIFICATIONS...................................................................................... 9 Format specification for ASCII files .................................................................................................................... 9 Matlab File Format Constraints.......................................................................................................................... 9 GENERAL INFORMATION Introduction PlotXY is a plotting program created by Massimo Ceraolo of University of Pisa to generate scientific line plots using data collected from: • C-LIKE PL4 files created with the program Alternative Transients Program (ATP) • generic ASCII files whose extension must be ADF (see Appendix). • Matlab files (some constraints on the accepted file structure are reported in Appendix) • IEEE Comtrade files While reading Comtrade files the Program tries to understand variable types from their unit of measure. It is also able to understand standard prefixes for unit of measure “k” and “m”. In the program arrays containing the data read the corresponding variables are converted into SI Units. If, for instance, a variable “X” is read from the Comtrade file with unit “kV”, the variable name will be “v:X”, will incorporate the 10^3 factor, and will be expressed in V (Volts). Starting from 2005 in the PlotXY package two executables are distributed: • file PlotXY.exe that is a direct evolution of previous versions of PlotXY.exe • file PlotXWin.exe that is able to manage several Plot Windows at a time, while PlotXY.exe manages only one. The choice between the two depends on users' preference, keeping into account that the bigger complexity of PlotXWin implies a larger utilisation of system resources (memory, registry space). Installation: 1 In the GUI interface language of operating systems modeless windows are those that may stay open even when the user switches to other windows of the same program. PlotXY – page N. 1

Welcome message from author
This document is posted to help you gain knowledge. Please leave a comment to let me know what you think about it! Share it to your friends and learn new things together.
Transcript
The plotting programs PlotXY and PlotXWin Short description and operating instructions (rel. November 2009)
About this document. Since the program described in this document is designed to be very intuitive, it is deemed sufficient to give here only some very short information. This document contains some Generic Information Paragraphs (titles in NON-ITALIC BLACK) and modeless1 window descriptions (titles in ITALIC BLUE).
The document describes the features of two different programs: PlotXY.exe and PlotXWin.exe. Since the latter is an enhancement of the former, the majority of descriptions relate to both programs; parts specific to PlotXWin are written in red.
Table of ContentsGeneral information.............................................................................................................................................1
Introduction........................................................................................................................................................1Main Program features (PlotXY and PlotXWin)................................................................................................2Features present only in PlotXWin.....................................................................................................................2User Interface highlights.....................................................................................................................................2
The Data Selection Window ................................................................................................................................2Basic information...............................................................................................................................................2Multi-file mode...................................................................................................................................................4Program options.................................................................................................................................................5
The Plot window...................................................................................................................................................5Procedure to have plots with two vertical axes...................................................................................................6
The Fourier Chart Window.................................................................................................................................6Command-line Parameters...................................................................................................................................7Additional Functions............................................................................................................................................7Known Problems..................................................................................................................................................8User Return..........................................................................................................................................................8APPENDIX A: FILE FORMAT SPECIFICATIONS......................................................................................9Format specification for ASCII files....................................................................................................................9Matlab File Format Constraints..........................................................................................................................9
GENERAL INFORMATIONIntroductionPlotXY is a plotting program created by Massimo Ceraolo of University of Pisa to generate scientific line plots using data collected from:• C-LIKE PL4 files created with the program Alternative Transients Program (ATP)• generic ASCII files whose extension must be ADF (see Appendix).• Matlab files (some constraints on the accepted file structure are reported in Appendix)• IEEE Comtrade files
While reading Comtrade files the Program tries to understand variable types from their unit of measure.It is also able to understand standard prefixes for unit of measure “k” and “m”. In the program arrays containing the data read the corresponding variables are converted into SI Units. If, for instance, a variable “X” is read from the Comtrade file with unit “kV”, the variable name will be “v:X”, will incorporate the 10^3 factor, and will be expressed in V (Volts).
Starting from 2005 in the PlotXY package two executables are distributed:• file PlotXY.exe that is a direct evolution of previous versions of PlotXY.exe• file PlotXWin.exe that is able to manage several Plot Windows at a time, while PlotXY.exe manages only one.The choice between the two depends on users' preference, keeping into account that the bigger complexity of PlotXWin implies a larger utilisation of system resources (memory, registry space).
Installation:
1In the GUI interface language of operating systems modeless windows are those that may stay open even when the user switches to other windows of the same program.
PlotXY – page N. 1
No installation procedure is needed (simply the file PlotXY.EXE or PlotXWin.exe is to be copied in a directory of choice)
At the first execution of PlotXY or PlotXWin, if previous versions of the program are present, the message “Error in registry” may be displayed. This is normal and will not be repeated at next executions. Note that PlotXY and PlotXWin use different registry areas so settings are independent to each other; however when one of the two programs clears the registry, it clears both registry areas, so all program settings are restored to their default values.
Main Program features (PlotXY and PlotXWin)• easy-to use Graphical User Interface• full 32 bit (win32) code for very fast operation• up to 8 plots per sheet• allows plots from up to 8 files on the same sheet• allows plots versus time, as well as X-Y plots• allows linear as well as logarithmic scales• factors and offsets and zoom support• clever automatic axis scaling and labelling• cursor to see values in numerical format, as well value differences• printing and Windows Metafile export facilities
Features present only in PlotXWin• Possibility to manage up to 5 simultaneous plot windows
User Interface highlightsThe program has no menu, since it is believed that for programs having a small number of commands, the use of buttons is to be preferred. Two types of buttons are present: - text buttons, for which the button names are directly shown on their face- graphic buttons, that have a graphic icon on their face, and the button name can be seen as a text hint shown
when the mouse pointer is left on the button face.
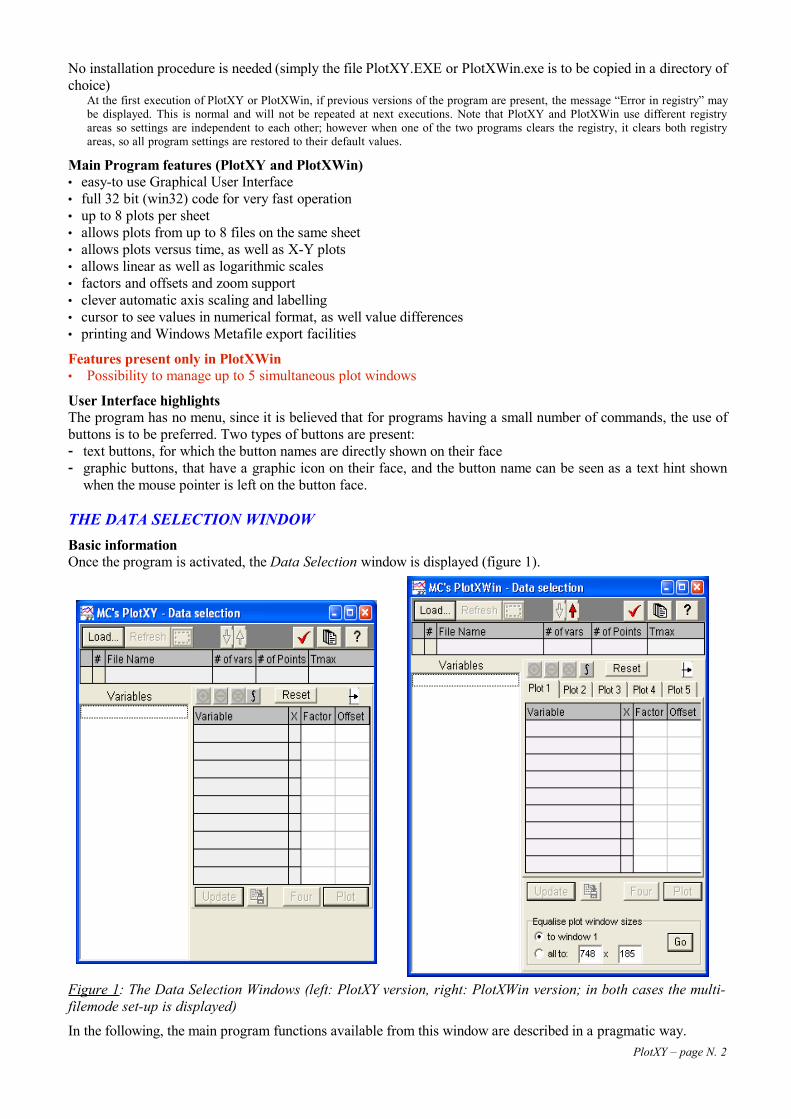
THE DATA SELECTION WINDOW Basic informationOnce the program is activated, the Data Selection window is displayed (figure 1).
Figure 1: The Data Selection Windows (left: PlotXY version, right: PlotXWin version; in both cases the multi-filemode set-up is displayed)
In the following, the main program functions available from this window are described in a pragmatic way.PlotXY – page N. 2
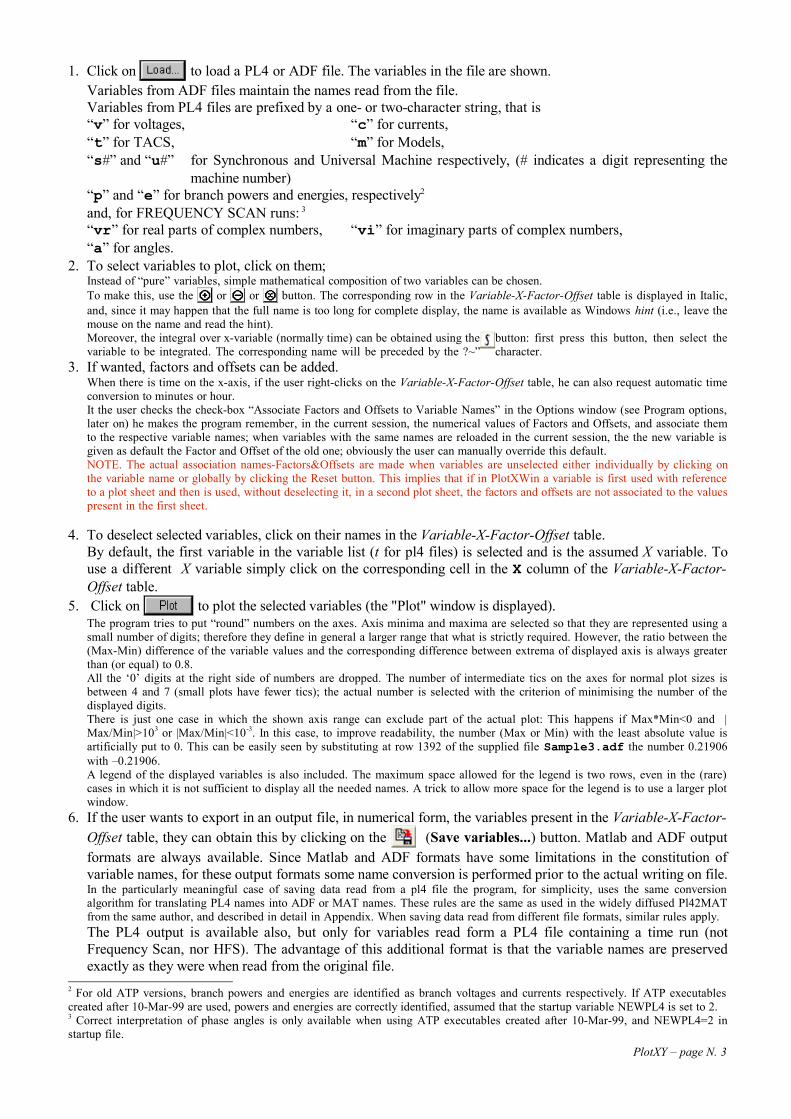
1. Click on to load a PL4 or ADF file. The variables in the file are shown. Variables from ADF files maintain the names read from the file.Variables from PL4 files are prefixed by a one- or two-character string, that is “v” for voltages, “c” for currents, “t” for TACS, “m” for Models, “s#” and “u#” for Synchronous and Universal Machine respectively, (# indicates a digit representing the
machine number)“p” and “e” for branch powers and energies, respectively2
and, for FREQUENCY SCAN runs: 3
“vr” for real parts of complex numbers, “vi” for imaginary parts of complex numbers,“a” for angles.
2. To select variables to plot, click on them;Instead of “pure” variables, simple mathematical composition of two variables can be chosen. To make this, use the or or button. The corresponding row in the Variable-X-Factor-Offset table is displayed in Italic, and, since it may happen that the full name is too long for complete display, the name is available as Windows hint (i.e., leave the mouse on the name and read the hint).Moreover, the integral over x-variable (normally time) can be obtained using the button: first press this button, then select the variable to be integrated. The corresponding name will be preceded by the ?~” character.
3. If wanted, factors and offsets can be added.When there is time on the x-axis, if the user right-clicks on the Variable-X-Factor-Offset table, he can also request automatic time conversion to minutes or hour.It the user checks the check-box “Associate Factors and Offsets to Variable Names” in the Options window (see Program options, later on) he makes the program remember, in the current session, the numerical values of Factors and Offsets, and associate them to the respective variable names; when variables with the same names are reloaded in the current session, the the new variable is given as default the Factor and Offset of the old one; obviously the user can manually override this default.NOTE. The actual association names-Factors&Offsets are made when variables are unselected either individually by clicking on the variable name or globally by clicking the Reset button. This implies that if in PlotXWin a variable is first used with reference to a plot sheet and then is used, without deselecting it, in a second plot sheet, the factors and offsets are not associated to the values present in the first sheet.
4. To deselect selected variables, click on their names in the Variable-X-Factor-Offset table.By default, the first variable in the variable list (t for pl4 files) is selected and is the assumed X variable. To use a different X variable simply click on the corresponding cell in the X column of the Variable-X-Factor-Offset table.
5. Click on to plot the selected variables (the "Plot" window is displayed).The program tries to put “round” numbers on the axes. Axis minima and maxima are selected so that they are represented using a small number of digits; therefore they define in general a larger range that what is strictly required. However, the ratio between the (Max-Min) difference of the variable values and the corresponding difference between extrema of displayed axis is always greater than (or equal) to 0.8. All the ‘0’ digits at the right side of numbers are dropped. The number of intermediate tics on the axes for normal plot sizes is between 4 and 7 (small plots have fewer tics); the actual number is selected with the criterion of minimising the number of the displayed digits.There is just one case in which the shown axis range can exclude part of the actual plot: This happens if Max*Min<0 and |Max/Min|>103 or |Max/Min|<10-3. In this case, to improve readability, the number (Max or Min) with the least absolute value is artificially put to 0. This can be easily seen by substituting at row 1392 of the supplied file Sample3.adf the number 0.21906 with –0.21906.A legend of the displayed variables is also included. The maximum space allowed for the legend is two rows, even in the (rare) cases in which it is not sufficient to display all the needed names. A trick to allow more space for the legend is to use a larger plot window.
6. If the user wants to export in an output file, in numerical form, the variables present in the Variable-X-Factor-Offset table, they can obtain this by clicking on the (Save variables...) button. Matlab and ADF output formats are always available. Since Matlab and ADF formats have some limitations in the constitution of variable names, for these output formats some name conversion is performed prior to the actual writing on file. In the particularly meaningful case of saving data read from a pl4 file the program, for simplicity, uses the same conversion algorithm for translating PL4 names into ADF or MAT names. These rules are the same as used in the widely diffused Pl42MAT from the same author, and described in detail in Appendix. When saving data read from different file formats, similar rules apply.The PL4 output is available also, but only for variables read form a PL4 file containing a time run (not Frequency Scan, nor HFS). The advantage of this additional format is that the variable names are preserved exactly as they were when read from the original file.
2 For old ATP versions, branch powers and energies are identified as branch voltages and currents respectively. If ATP executables created after 10-Mar-99 are used, powers and energies are correctly identified, assumed that the startup variable NEWPL4 is set to 2.3 Correct interpretation of phase angles is only available when using ATP executables created after 10-Mar-99, and NEWPL4=2 in startup file.
PlotXY – page N. 3
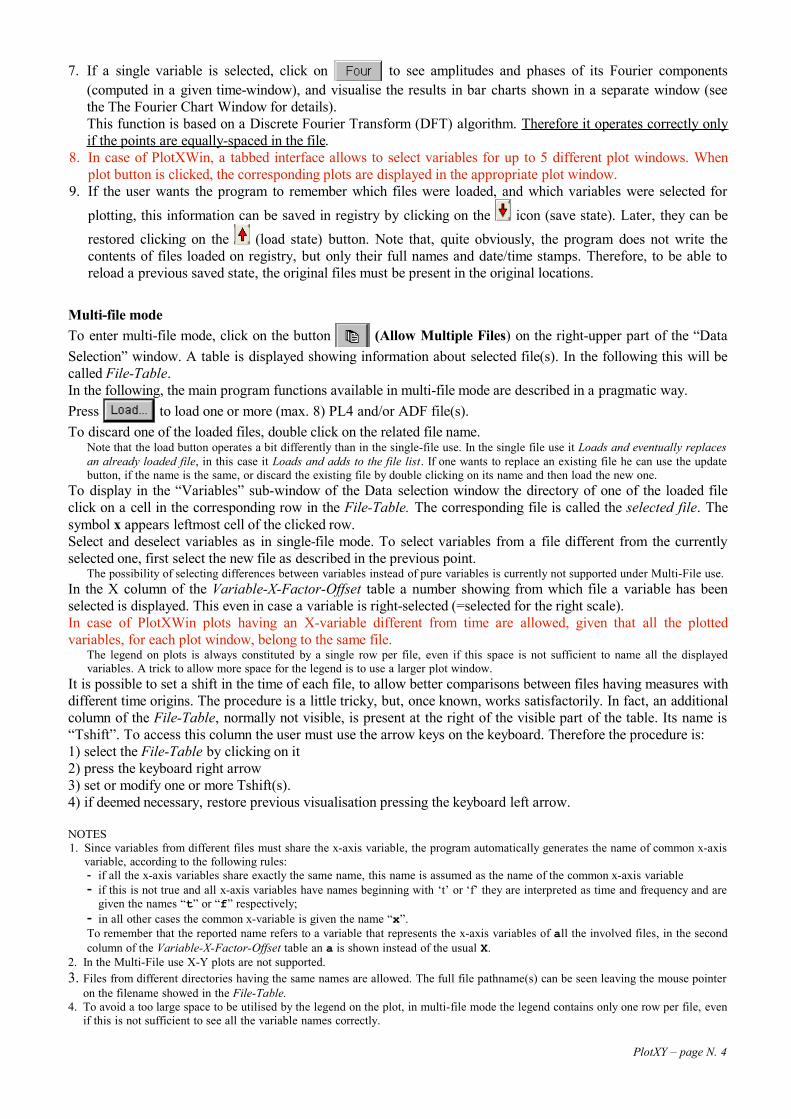
7. If a single variable is selected, click on to see amplitudes and phases of its Fourier components (computed in a given time-window), and visualise the results in bar charts shown in a separate window (see the The Fourier Chart Window for details).This function is based on a Discrete Fourier Transform (DFT) algorithm. Therefore it operates correctly only if the points are equally-spaced in the file.
8. In case of PlotXWin, a tabbed interface allows to select variables for up to 5 different plot windows. When plot button is clicked, the corresponding plots are displayed in the appropriate plot window.
9. If the user wants the program to remember which files were loaded, and which variables were selected for
plotting, this information can be saved in registry by clicking on the icon (save state). Later, they can be restored clicking on the (load state) button. Note that, quite obviously, the program does not write the contents of files loaded on registry, but only their full names and date/time stamps. Therefore, to be able to reload a previous saved state, the original files must be present in the original locations.
Multi-file modeTo enter multi-file mode, click on the button (Allow Multiple Files) on the right-upper part of the “Data Selection” window. A table is displayed showing information about selected file(s). In the following this will be called File-Table.In the following, the main program functions available in multi-file mode are described in a pragmatic way.Press to load one or more (max. 8) PL4 and/or ADF file(s). To discard one of the loaded files, double click on the related file name.
Note that the load button operates a bit differently than in the single-file use. In the single file use it Loads and eventually replaces an already loaded file, in this case it Loads and adds to the file list. If one wants to replace an existing file he can use the update button, if the name is the same, or discard the existing file by double clicking on its name and then load the new one.
To display in the “Variables” sub-window of the Data selection window the directory of one of the loaded file click on a cell in the corresponding row in the File-Table. The corresponding file is called the selected file. The symbol x appears leftmost cell of the clicked row.Select and deselect variables as in single-file mode. To select variables from a file different from the currently selected one, first select the new file as described in the previous point.
The possibility of selecting differences between variables instead of pure variables is currently not supported under Multi-File use.In the X column of the Variable-X-Factor-Offset table a number showing from which file a variable has been selected is displayed. This even in case a variable is right-selected (=selected for the right scale).In case of PlotXWin plots having an X-variable different from time are allowed, given that all the plotted variables, for each plot window, belong to the same file.
The legend on plots is always constituted by a single row per file, even if this space is not sufficient to name all the displayed variables. A trick to allow more space for the legend is to use a larger plot window.
It is possible to set a shift in the time of each file, to allow better comparisons between files having measures with different time origins. The procedure is a little tricky, but, once known, works satisfactorily. In fact, an additional column of the File-Table, normally not visible, is present at the right of the visible part of the table. Its name is “Tshift”. To access this column the user must use the arrow keys on the keyboard. Therefore the procedure is:1) select the File-Table by clicking on it2) press the keyboard right arrow 3) set or modify one or more Tshift(s).4) if deemed necessary, restore previous visualisation pressing the keyboard left arrow.
NOTES1. Since variables from different files must share the x-axis variable, the program automatically generates the name of common x-axis
variable, according to the following rules:- if all the x-axis variables share exactly the same name, this name is assumed as the name of the common x-axis variable- if this is not true and all x-axis variables have names beginning with ‘t’ or ‘f’ they are interpreted as time and frequency and are
given the names “t” or “f” respectively;- in all other cases the common x-variable is given the name “x”.To remember that the reported name refers to a variable that represents the x-axis variables of all the involved files, in the second column of the Variable-X-Factor-Offset table an a is shown instead of the usual X.
2. In the Multi-File use X-Y plots are not supported. 3. Files from different directories having the same names are allowed. The full file pathname(s) can be seen leaving the mouse pointer
on the filename showed in the File-Table.4. To avoid a too large space to be utilised by the legend on the plot, in multi-file mode the legend contains only one row per file, even
if this is not sufficient to see all the variable names correctly.
PlotXY – page N. 4
5. No output to file is possible in multi-file mode if the selected variables come from different files. This happens because, in general, different files have different time variables, and ADF and PL4 formats do not allow multiple-simulation data.
Program optionsSome program features can be customised. There are two ways to choose options:Click on the (Program Options) button, and choose the desired options. The selected options are stored in the Win32 registry. If you want to clean the registry, e.g. because you want to uninstall PlotXY, simply click on the default button.
The options are basically self-explanatory. Just some explanations follow:• checking any of the two check-boxes requesting bar charts for Frequency Scan and Harmonic Frequency Scan runs implies the
actual display of bar charts only for single-variable plots and when those files are correctly interpreted, i.e., the user has set NEWPL4 to 2 in his STARTUP file.
• Details on the “Associate Factors and Offsets to Variable Names” option are given above, under the “The Data Selection Window” main description, point 3
• Details on the options “Remember windows’ positions and sizes” and “Use small windows”, are reported in sect. “Additional Functions”, item 5.
Some additional options are available as command line parameters (see sect. “Command-line ”).
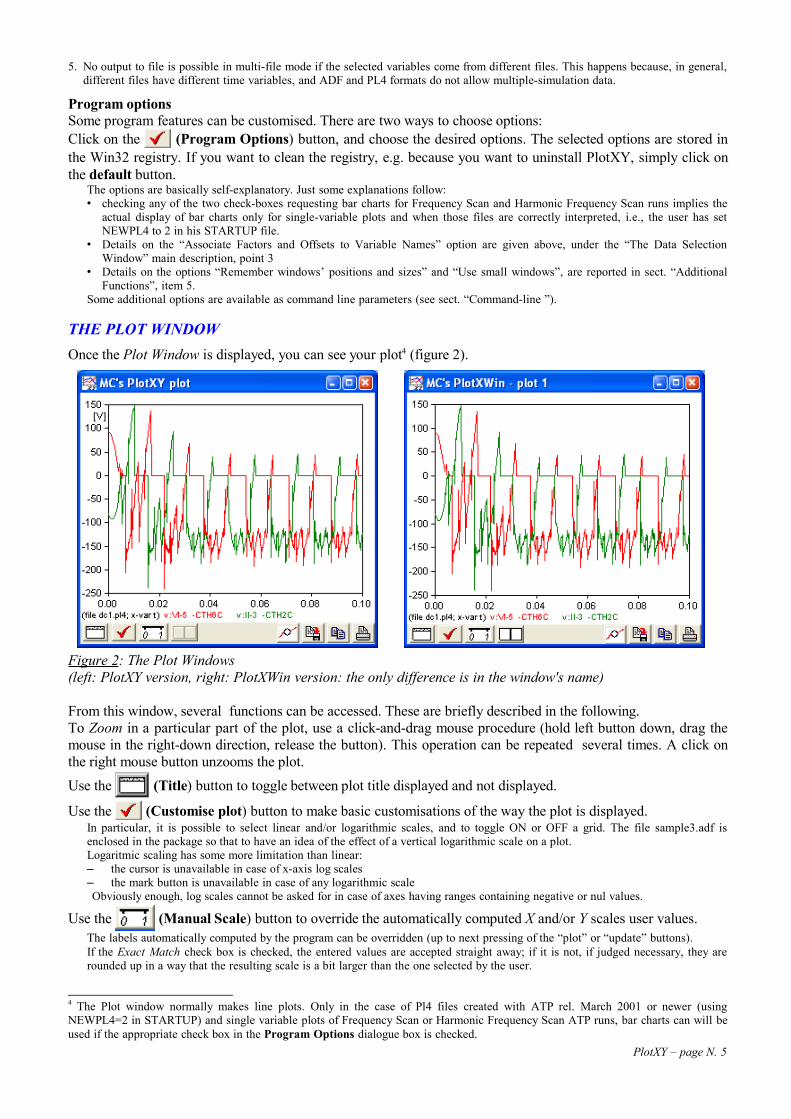
THE PLOT WINDOWOnce the Plot Window is displayed, you can see your plot4 (figure 2).
Figure 2: The Plot Windows (left: PlotXY version, right: PlotXWin version: the only difference is in the window's name)
From this window, several functions can be accessed. These are briefly described in the following.To Zoom in a particular part of the plot, use a click-and-drag mouse procedure (hold left button down, drag the mouse in the right-down direction, release the button). This operation can be repeated several times. A click on the right mouse button unzooms the plot.Use the (Title) button to toggle between plot title displayed and not displayed.
Use the (Customise plot) button to make basic customisations of the way the plot is displayed. In particular, it is possible to select linear and/or logarithmic scales, and to toggle ON or OFF a grid. The file sample3.adf is enclosed in the package so that to have an idea of the effect of a vertical logarithmic scale on a plot. Logaritmic scaling has some more limitation than linear:– the cursor is unavailable in case of x-axis log scales– the mark button is unavailable in case of any logarithmic scaleObviously enough, log scales cannot be asked for in case of axes having ranges containing negative or nul values.
Use the (Manual Scale) button to override the automatically computed X and/or Y scales user values. The labels automatically computed by the program can be overridden (up to next pressing of the “plot” or “update” buttons).If the Exact Match check box is checked, the entered values are accepted straight away; if it is not, if judged necessary, they are rounded up in a way that the resulting scale is a bit larger than the one selected by the user.
4 The Plot window normally makes line plots. Only in the case of Pl4 files created with ATP rel. March 2001 or newer (using NEWPL4=2 in STARTUP) and single variable plots of Frequency Scan or Harmonic Frequency Scan ATP runs, bar charts can will be used if the appropriate check box in the Program Options dialogue box is checked.
PlotXY – page N. 5
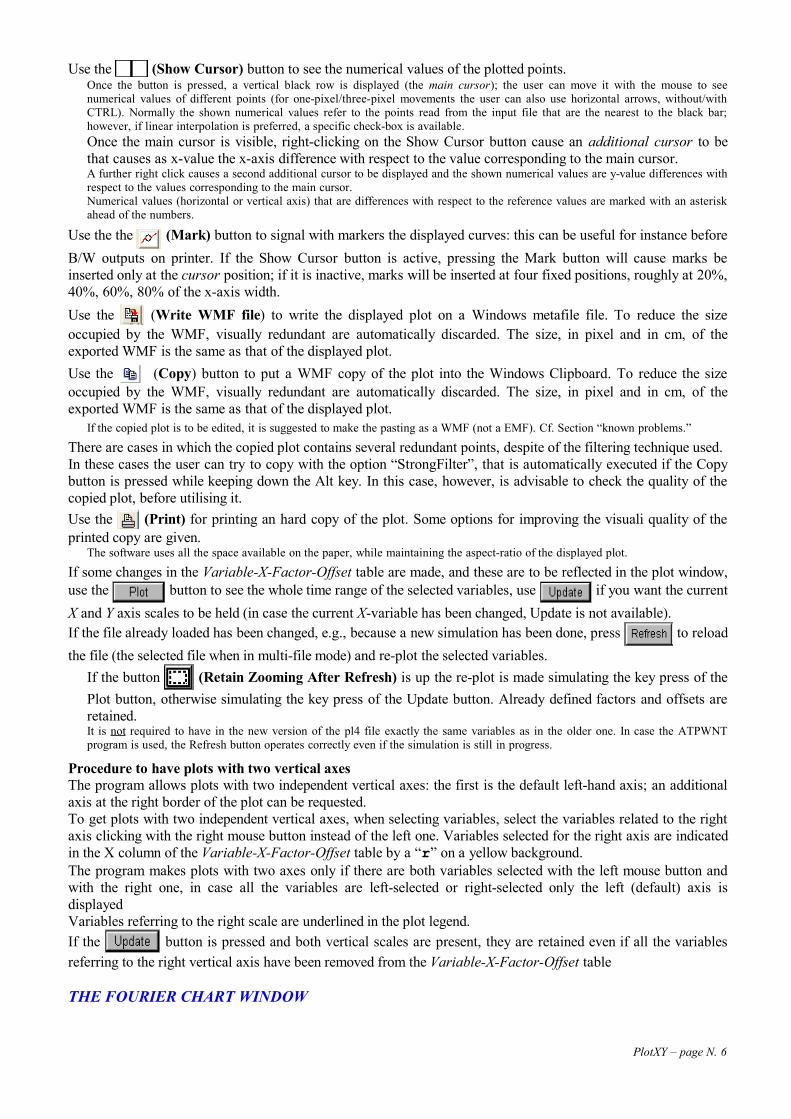
Use the (Show Cursor) button to see the numerical values of the plotted points. Once the button is pressed, a vertical black row is displayed (the main cursor); the user can move it with the mouse to see numerical values of different points (for one-pixel/three-pixel movements the user can also use horizontal arrows, without/with CTRL). Normally the shown numerical values refer to the points read from the input file that are the nearest to the black bar; however, if linear interpolation is preferred, a specific check-box is available. Once the main cursor is visible, right-clicking on the Show Cursor button cause an additional cursor to be that causes as x-value the x-axis difference with respect to the value corresponding to the main cursor.A further right click causes a second additional cursor to be displayed and the shown numerical values are y-value differences with respect to the values corresponding to the main cursor.Numerical values (horizontal or vertical axis) that are differences with respect to the reference values are marked with an asterisk ahead of the numbers.
Use the the (Mark) button to signal with markers the displayed curves: this can be useful for instance before B/W outputs on printer. If the Show Cursor button is active, pressing the Mark button will cause marks be inserted only at the cursor position; if it is inactive, marks will be inserted at four fixed positions, roughly at 20%, 40%, 60%, 80% of the x-axis width.Use the (Write WMF file) to write the displayed plot on a Windows metafile file. To reduce the size occupied by the WMF, visually redundant are automatically discarded. The size, in pixel and in cm, of the exported WMF is the same as that of the displayed plot.Use the (Copy) button to put a WMF copy of the plot into the Windows Clipboard. To reduce the size occupied by the WMF, visually redundant are automatically discarded. The size, in pixel and in cm, of the exported WMF is the same as that of the displayed plot.
If the copied plot is to be edited, it is suggested to make the pasting as a WMF (not a EMF). Cf. Section “known problems.”
There are cases in which the copied plot contains several redundant points, despite of the filtering technique used.In these cases the user can try to copy with the option “StrongFilter”, that is automatically executed if the Copy button is pressed while keeping down the Alt key. In this case, however, is advisable to check the quality of the copied plot, before utilising it.Use the (Print) for printing an hard copy of the plot. Some options for improving the visuali quality of the printed copy are given.
The software uses all the space available on the paper, while maintaining the aspect-ratio of the displayed plot.
If some changes in the Variable-X-Factor-Offset table are made, and these are to be reflected in the plot window, use the button to see the whole time range of the selected variables, use if you want the current X and Y axis scales to be held (in case the current X-variable has been changed, Update is not available).If the file already loaded has been changed, e.g., because a new simulation has been done, press to reload the file (the selected file when in multi-file mode) and re-plot the selected variables.
If the button (Retain Zooming After Refresh) is up the re-plot is made simulating the key press of the Plot button, otherwise simulating the key press of the Update button. Already defined factors and offsets are retained. It is not required to have in the new version of the pl4 file exactly the same variables as in the older one. In case the ATPWNT program is used, the Refresh button operates correctly even if the simulation is still in progress.
Procedure to have plots with two vertical axesThe program allows plots with two independent vertical axes: the first is the default left-hand axis; an additional axis at the right border of the plot can be requested.To get plots with two independent vertical axes, when selecting variables, select the variables related to the right axis clicking with the right mouse button instead of the left one. Variables selected for the right axis are indicated in the X column of the Variable-X-Factor-Offset table by a “r” on a yellow background.The program makes plots with two axes only if there are both variables selected with the left mouse button and with the right one, in case all the variables are left-selected or right-selected only the left (default) axis is displayedVariables referring to the right scale are underlined in the plot legend.If the button is pressed and both vertical scales are present, they are retained even if all the variables referring to the right vertical axis have been removed from the Variable-X-Factor-Offset table
THE FOURIER CHART WINDOW
PlotXY – page N. 6
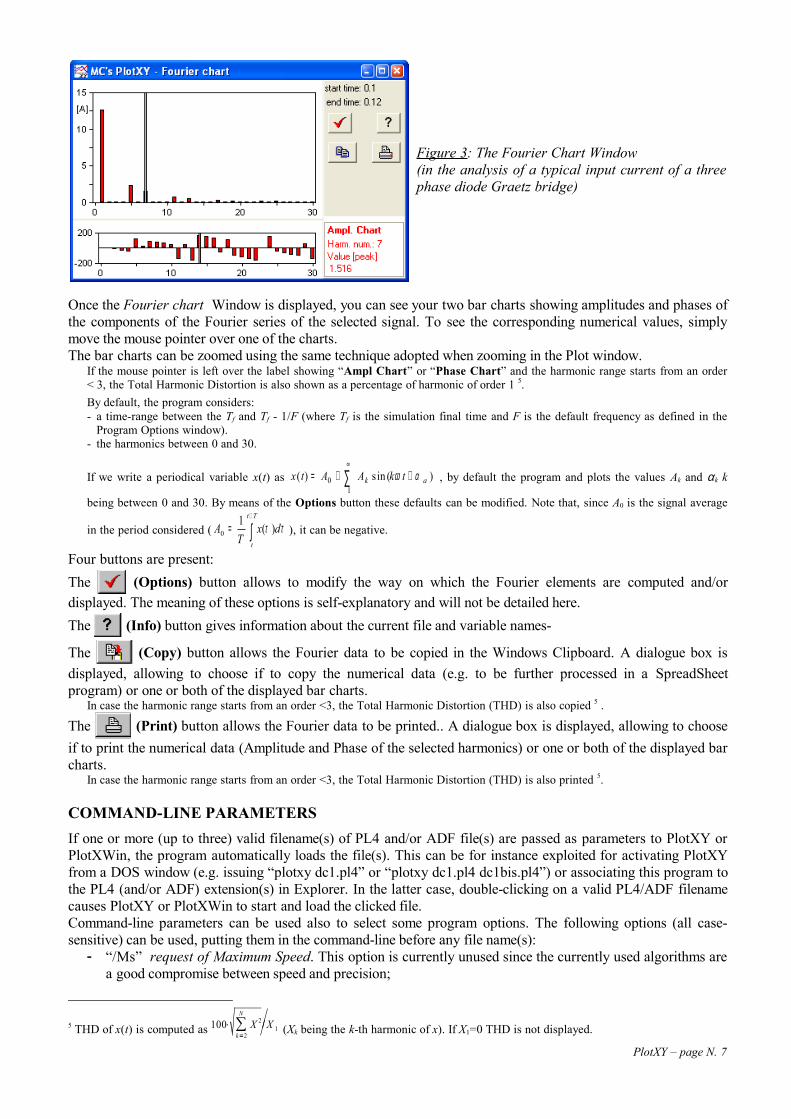
Figure 3: The Fourier Chart Window (in the analysis of a typical input current of a three phase diode Graetz bridge)
Once the Fourier chart Window is displayed, you can see your two bar charts showing amplitudes and phases of the components of the Fourier series of the selected signal. To see the corresponding numerical values, simply move the mouse pointer over one of the charts.The bar charts can be zoomed using the same technique adopted when zooming in the Plot window.
If the mouse pointer is left over the label showing “Ampl Chart” or “Phase Chart” and the harmonic range starts from an order < 3, the Total Harmonic Distortion is also shown as a percentage of harmonic of order 1 5.By default, the program considers:- a time-range between the Tf and Tf - 1/F (where Tf is the simulation final time and F is the default frequency as defined in the
Program Options window). - the harmonics between 0 and 30.
If we write a periodical variable x(t) as ∑∞
++=1
0 )sin ()( ak tkAAtx αω , by default the program and plots the values Ak and αk k
being between 0 and 30. By means of the Options button these defaults can be modified. Note that, since A0 is the signal average
in the period considered ( ∫+
=Tt
t
dxT
A ττ )(10 ), it can be negative.
Four buttons are present: The (Options) button allows to modify the way on which the Fourier elements are computed and/or displayed. The meaning of these options is self-explanatory and will not be detailed here.The (Info) button gives information about the current file and variable names-
The (Copy) button allows the Fourier data to be copied in the Windows Clipboard. A dialogue box is displayed, allowing to choose if to copy the numerical data (e.g. to be further processed in a SpreadSheet program) or one or both of the displayed bar charts.
In case the harmonic range starts from an order <3, the Total Harmonic Distortion (THD) is also copied 5 .
The (Print) button allows the Fourier data to be printed.. A dialogue box is displayed, allowing to choose if to print the numerical data (Amplitude and Phase of the selected harmonics) or one or both of the displayed bar charts.
In case the harmonic range starts from an order <3, the Total Harmonic Distortion (THD) is also printed 5.
COMMAND-LINE PARAMETERSIf one or more (up to three) valid filename(s) of PL4 and/or ADF file(s) are passed as parameters to PlotXY or PlotXWin, the program automatically loads the file(s). This can be for instance exploited for activating PlotXY from a DOS window (e.g. issuing “plotxy dc1.pl4” or “plotxy dc1.pl4 dc1bis.pl4”) or associating this program to the PL4 (and/or ADF) extension(s) in Explorer. In the latter case, double-clicking on a valid PL4/ADF filename causes PlotXY or PlotXWin to start and load the clicked file. Command-line parameters can be used also to select some program options. The following options (all case-sensitive) can be used, putting them in the command-line before any file name(s):
- “/Ms” request of Maximum Speed. This option is currently unused since the currently used algorithms are a good compromise between speed and precision;
5 THD of x(t) is computed as (Xk being the k-th harmonic of x). If X1=0 THD is not displayed.
PlotXY – page N. 7
100⋅∑k=2
N
X 2/X 1
- “/st” requests to Show plotting Times. If this option is set, a label showing the time spent to create plots will be displayed in the main program window.
ADDITIONAL FUNCTIONS1. Under conditions listed below the program sets “smart” labels on the axes, e.g., [kV] for kilo-volts, etc.
Conditions for enabling this auto labeling:- the “Autolabel known variables” option is to be checked on the Program Options menu of the main program window;- the x-variable of the considered plot it the first in the variable list- given that the variable types are identified by the first character of their names (“v” for voltages, “c” or “i” for currents, “p” for
powers, “e” for energies, “t” for time, the latter only for the x-axis variable), all the variables to be plotted on the same vertical axis are of the same type
In case of mathematical composition of two variables the program uses auto-labels whenever it is able to detect reliably the correct unit to be used; in case of a product of a voltage and a current, for instance, it uses correctly [W] as label.
2. One or more pl4 file(s) can be dragged over a PlotXY icon on the Win95/NT desktop and dropped, therefore causing PlotXY to start and load the file(s). Once the program is started, variables can be loaded using the Windows’ drag-and-drop facility instead of the load button.
3. Multiple instances of the program are allowed (up to 4). It is not forbidden for different program instances to access the same file(s). In case of multiple instances the main program windows of different instances are placed in different positions on screen and have the instance number in their titles to ease readability.
4. The program contains code to visualise its modeless windows (Data Selection, Plot and Fourier Chart Windows) satisfactorily in all screen resolutions. These windows have given “base” sizes chosen so that they are a good compromise between desktop space occupation and visual clarity; these sizes are such that the Data Selection and the Plot windows put aside are globally large 800 pixels. These default sizes are subjected to two types of changes:a) at program start-up they are scaled as a function of the screen resolution. In particular they are changed so
that the Data Selection and the Plot windows put aside are as large as the Desktop Area Width6 with a minimum of 700 pixels. There is also a maximum, equal to 750 or 950 pixels if the “Use small windows” option is selected or unselected respectively.
b) the user can change the window’s sizes using the mouse. It must be noted that this user scaling does not modify the windows homothetically:- the Data Selection Window can be varied only in height; the only window element correspondingly
modified is the “Variables” Listbox.- only the Plot or Chart areas of the Plot and Fourier Chart windows are modified, while the other
elements (buttons, labels) are unmodified.5. If the options “Remember windows’ positions and sizes” is set, the positions and sizes of all modeless
windows are stored in the registry when the program is closed and restored when is open after the execution of the scaling discussed in point a).
KNOWN PROBLEMS1. If a long filename is dragged and dropped on a PlotXY or PlotXWin icon on the computer desktop, the
program receives the DOS, reduced name, instead of the long name. This problem is indeed a problem of the compiler used, and therefore cannot be corrected up to when a new version of the compiler is utilised.
2. When the “copy” function is used and a plot pasted into another application, once the pasted plot is open for editing one or more plot(s) can be dramatically, and erroneously, compacted. This can be avoided pasting as a WMF (Windows metafile) instead of a EMF (enhanced Windows metafile).
USER RETURNComments, suggestions, and/or bug reports from the users are very much welcome, preferably at the e-mail address: [email protected] features are added to new versions of the program, keeping in the maximum consideration those frequently-requested by the users.
6 According to the Win32 terminology the desktop area is the area of the screen not covered by the taskbar.PlotXY – page N. 8
APPENDIX A: FILE FORMAT SPECIFICATIONS
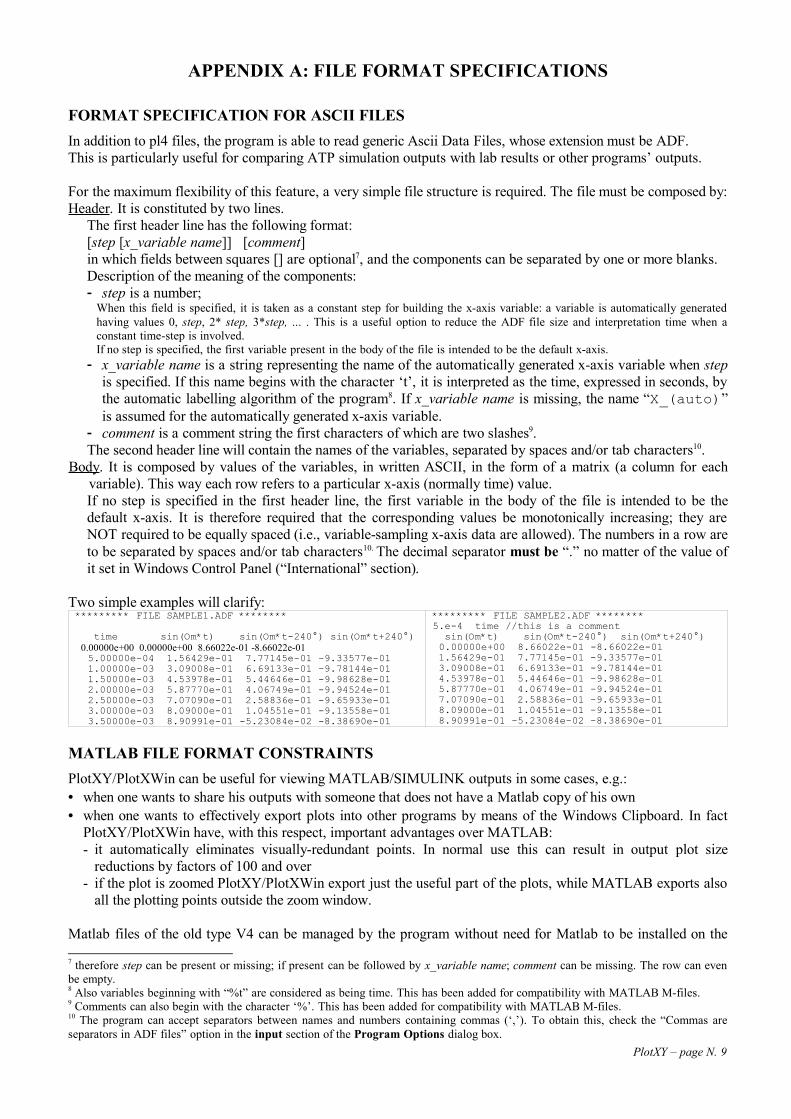
FORMAT SPECIFICATION FOR ASCII FILESIn addition to pl4 files, the program is able to read generic Ascii Data Files, whose extension must be ADF.This is particularly useful for comparing ATP simulation outputs with lab results or other programs’ outputs.
For the maximum flexibility of this feature, a very simple file structure is required. The file must be composed by:Header. It is constituted by two lines.
The first header line has the following format: [step [x_variable name]] [comment] in which fields between squares [] are optional7, and the components can be separated by one or more blanks. Description of the meaning of the components:- step is a number;
When this field is specified, it is taken as a constant step for building the x-axis variable: a variable is automatically generated having values 0, step, 2* step, 3*step, ... . This is a useful option to reduce the ADF file size and interpretation time when a constant time-step is involved.If no step is specified, the first variable present in the body of the file is intended to be the default x-axis.
- x_variable name is a string representing the name of the automatically generated x-axis variable when step is specified. If this name begins with the character ‘t’, it is interpreted as the time, expressed in seconds, by the automatic labelling algorithm of the program8. If x_variable name is missing, the name “X_(auto)” is assumed for the automatically generated x-axis variable.
- comment is a comment string the first characters of which are two slashes9. The second header line will contain the names of the variables, separated by spaces and/or tab characters10.
Body. It is composed by values of the variables, in written ASCII, in the form of a matrix (a column for each variable). This way each row refers to a particular x-axis (normally time) value.If no step is specified in the first header line, the first variable in the body of the file is intended to be the default x-axis. It is therefore required that the corresponding values be monotonically increasing; they are NOT required to be equally spaced (i.e., variable-sampling x-axis data are allowed). The numbers in a row are to be separated by spaces and/or tab characters10. The decimal separator must be “.” no matter of the value of it set in Windows Control Panel (“International” section).
Two simple examples will clarify:********* FILE SAMPLE1.ADF ******** time sin(Om*t) sin(Om*t-240°) sin(Om*t+240°) 0.00000e+00 0.00000e+00 8.66022e-01 -8.66022e-01 5.00000e-04 1.56429e-01 7.77145e-01 -9.33577e-01 1.00000e-03 3.09008e-01 6.69133e-01 -9.78144e-01 1.50000e-03 4.53978e-01 5.44646e-01 -9.98628e-01 2.00000e-03 5.87770e-01 4.06749e-01 -9.94524e-01 2.50000e-03 7.07090e-01 2.58836e-01 -9.65933e-01 3.00000e-03 8.09000e-01 1.04551e-01 -9.13558e-01 3.50000e-03 8.90991e-01 -5.23084e-02 -8.38690e-01
********* FILE SAMPLE2.ADF ********5.e-4 time //this is a comment sin(Om*t) sin(Om*t-240°) sin(Om*t+240°) 0.00000e+00 8.66022e-01 -8.66022e-01 1.56429e-01 7.77145e-01 -9.33577e-01 3.09008e-01 6.69133e-01 -9.78144e-01 4.53978e-01 5.44646e-01 -9.98628e-01 5.87770e-01 4.06749e-01 -9.94524e-01 7.07090e-01 2.58836e-01 -9.65933e-01 8.09000e-01 1.04551e-01 -9.13558e-01 8.90991e-01 -5.23084e-02 -8.38690e-01
MATLAB FILE FORMAT CONSTRAINTSPlotXY/PlotXWin can be useful for viewing MATLAB/SIMULINK outputs in some cases, e.g.:• when one wants to share his outputs with someone that does not have a Matlab copy of his own• when one wants to effectively export plots into other programs by means of the Windows Clipboard. In fact
PlotXY/PlotXWin have, with this respect, important advantages over MATLAB:- it automatically eliminates visually-redundant points. In normal use this can result in output plot size
reductions by factors of 100 and over- if the plot is zoomed PlotXY/PlotXWin export just the useful part of the plots, while MATLAB exports also
all the plotting points outside the zoom window.
Matlab files of the old type V4 can be managed by the program without need for Matlab to be installed on the
7 therefore step can be present or missing; if present can be followed by x_variable name; comment can be missing. The row can even be empty.8 Also variables beginning with “%t” are considered as being time. This has been added for compatibility with MATLAB M-files.9 Comments can also begin with the character ‘%’. This has been added for compatibility with MATLAB M-files.10 The program can accept separators between names and numbers containing commas (‘,’). To obtain this, check the “Commas are separators in ADF files” option in the input section of the Program Options dialog box.
PlotXY – page N. 9
computer. More recent versions are managed accessing the matlab libraries installed on your computer. When saving, che indication “MATLAB4” indicates matlab binary format version 4, while “MATLAB” indicates the version installed on your computer.Note matlab programs allow to write backard-compatible .mat files, for instance using the “-V4” flag in the save format.
Different kinds of arrays can be stored in a Matlab file: matrices of integers, floats, text strings. However PlotXY/PlotXWin are intended for dealing with files containing output of either measures or simulations. Therefore the files managed by the program must always contain a “time” (i.e., a quantity monotonically increasing) and some “signals” associated to that time (therefore all the signals should have a number of point equal to that of time).As a consequence of these characteristics, to be understood by the program, a mat file has to comply with some specific requirements:- it must contain only matrices of floats sharing the same number of rows- it has to contain a “time” variable. If there is in the file a single column variable having as name “t” it is
assumed to be time. Otherwise, the first column of the first variable in the file is assumed to be time.If some of the variables in the file has multiple columns it stores multiple signals. In this case the program adds a unique suffix to the different columns, constituted by a progressive number between parentheses.
NOTE. The best way to exploit PlotXY or PlotXWin as a SIMULINK graphical post-processor is as follows:• use for any variable sent to workspace the same value of the “Decimation” parameter• send data to workspace using “To workspace” blocks instead of the “Save data to workspace” feature of
Scopes (this way replications of time vectors is avoided);• send the simulation time to workspace just once by means of the “Save to workspace” feature of the
Simulation|Parameters|Workspace I/O dialogue box.
PlotXY – page N. 10
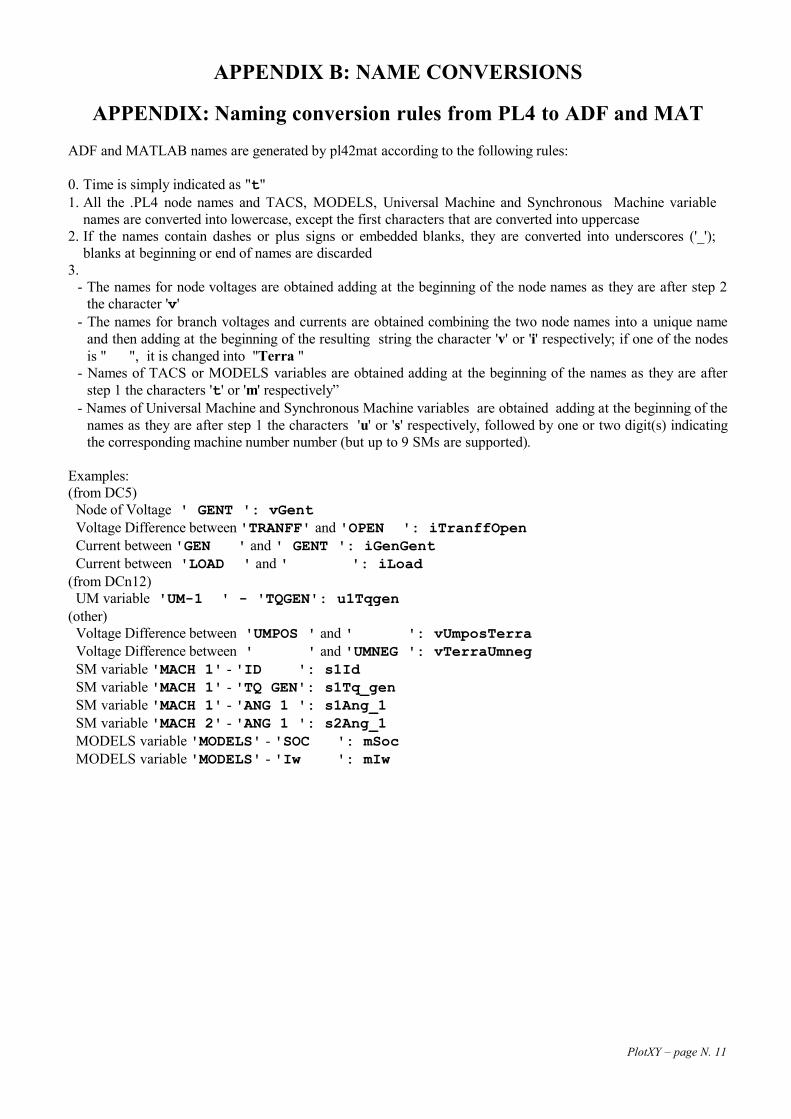
APPENDIX B: NAME CONVERSIONS
APPENDIX: Naming conversion rules from PL4 to ADF and MATADF and MATLAB names are generated by pl42mat according to the following rules:
0. Time is simply indicated as "t"1. All the .PL4 node names and TACS, MODELS, Universal Machine and Synchronous Machine variable
names are converted into lowercase, except the first characters that are converted into uppercase 2. If the names contain dashes or plus signs or embedded blanks, they are converted into underscores ('_');
blanks at beginning or end of names are discarded 3.
- The names for node voltages are obtained adding at the beginning of the node names as they are after step 2 the character 'v'
- The names for branch voltages and currents are obtained combining the two node names into a unique name and then adding at the beginning of the resulting string the character 'v' or 'i' respectively; if one of the nodes is " ", it is changed into "Terra "
- Names of TACS or MODELS variables are obtained adding at the beginning of the names as they are after step 1 the characters 't' or 'm' respectively”
- Names of Universal Machine and Synchronous Machine variables are obtained adding at the beginning of the names as they are after step 1 the characters 'u' or 's' respectively, followed by one or two digit(s) indicating the corresponding machine number number (but up to 9 SMs are supported).
Examples:(from DC5) Node of Voltage ' GENT ': vGent Voltage Difference between 'TRANFF' and 'OPEN ': iTranffOpen Current between 'GEN ' and ' GENT ': iGenGent Current between 'LOAD ' and ' ': iLoad(from DCn12) UM variable 'UM-1 ' - 'TQGEN': u1Tqgen(other) Voltage Difference between 'UMPOS ' and ' ': vUmposTerra Voltage Difference between ' ' and 'UMNEG ': vTerraUmneg SM variable 'MACH 1' - 'ID ': s1Id SM variable 'MACH 1' - 'TQ GEN': s1Tq_gen SM variable 'MACH 1' - 'ANG 1 ': s1Ang_1 SM variable 'MACH 2' - 'ANG 1 ': s2Ang_1 MODELS variable 'MODELS' - 'SOC ': mSoc MODELS variable 'MODELS' - 'Iw ': mIw
PlotXY – page N. 11
Related Documents