Is the pleasure of driving a constraint for leaving the car? Antonio Borriello, Stefano Scagnolari, Rico Maggi Conference paper STRC 2016 Draft version – please do not cite without permission of the author STRC 16 th Swiss Transport Research Conference Monte Verità / Ascona, May 18-20/2016

Welcome message from author
This document is posted to help you gain knowledge. Please leave a comment to let me know what you think about it! Share it to your friends and learn new things together.
Transcript

Is the pleasure of driving a constraint for leaving the car?
Antonio Borriello, Stefano Scagnolari, Rico Maggi
Conference paper STRC 2016 Draft version – please do not cite without permission of the author
STRC
16 th
Swiss Transport Research Conference
Monte Verità / Ascona, May 18-20/2016
Is the pleasure of driving a constraint for leaving the car?
Antonio Borriello*, Stefano Scagnolari, Rico Maggi * Università della Svizzera italiana (USI)
email: [email protected]
Abstract
Society exhibits an increasing dependence on private car use for commuting: city paralysis, pollution
and resources waste are main effects of this conduct. Although technological innovations, it is
necessary to reduce the volume of individual motorized means in order to improve environmental
quality and to decrease congestion. In this study, we examine through a stated preference (SP)
experiment to what extent new generations are willing to accept new possibilities for mobility and
spatial development. The second important goal is to understand how sociocultural indicators can
affect the choices. In fact, several studies showed that in addition to instrumental factors, also symbolic
(as status and prestige) and affective (as love driving and freedom) motives influence car use. Through
a hybrid discrete choice experiment, we explain how a latent construct, named pleasure of driving, can
influence the choice. Data are collected by means of a paper and pencil survey among young people
that work or study in Lugano.
Keywords
Hybrid discrete choice experiment – latent construct – pleasure of driving
1. Introduction
In the last decades, the use of private car has increased: in Switzerland, approximately 65% of transfers
per year (independently from the reason) are done using an individual motorized transport mean (car
and motorbike). Commuting is the second reason (24%) for travelling after leisure and the most
preferred mean is an individual motorized one, from almost 55% in Zurich to 83% in Ticino (Bundesamt
für Statistik, 2010).
This practice entails negative externalities, such as pollution. Transport accounts for approximately 23%
of current global energy-related CO2 emissions and nearly 75% of these are generated by road transport
(International Energy Agency, 2009). Furthermore also the quality of urban life, congestion, the
accessibility of destinations are negatively influenced by the car use. Considering the limited help that
technological innovations can bring, attention to behavioral changes towards more sustainable future
must be invested.
Literature underlines that that instrumental factors like cost, travel time and comfort play a
determinant role in mode choice. However, in the last 20 years, researchers are focusing on
psychological factors to better understand the transport decision-making process (Golob and Hensher,
1998; Steg, 2005; Collins and Chambers, 2005; Nilsson and Küller, 2000). For that purpose,
understanding commuters’ attitudes and behaviors is a fundamental and necessary condition to attract
individuals to the desirable public modes of transport.
A determinant factor, that needs to be explored in depth in order to reduce travel, is the degree to
which travel is enjoyed: indeed, the more the travel is enjoyed, the less the desire to reduce it (Ory,
Mokhtarian, 2009). According to Mokhtarian and Salomon (2001); Páez and Whalen (2010); Ory,
Mokhtarian (2005) travel time is not simply a cost to be minimized as long as one enjoys the travel:
activities such as interacting with nature, being with others, relaxing can in fact act as motivations (or
in some circumstances as reason) for travelling.
Attention on this topic is mostly relegated to activities that one can do while travelling, like reading,
listening to music, enjoying the landscape (Mokhtarian et al., 2001), but very few researchers focused
their attention on the act of driving itself (Handy et al., 2005).
What this work pretend to do is to consider the wide construct “pleasure of driving” and explore
whether (and how) it affects the transport choice through a stated preference experiment. In order to
reach our aim, we designed a hybrid discrete choice model in which we inserted an innovative
transportation system (i.e. moving walkways) in addition to more classical solutions (public transport,
car, carpooling, car sharing).
This paper is organized as follows: Section 2 describes data and methodology; Section 3 reports the
results; Section 4 discusses the key findings and the future research plans.

2. Data and methodology
2.1 Data and descriptive statistics
Data used in this research were collected through a paper and pencil questionnaire among young
commuters in Lugano, Switzerland. We recruited respondents among professional schools, universities
(Università della Svizzera Italiana and Scuola Universitaria Professionale della Svizzera Italiana) and
some local firms. Throughout seven months (from February to September 2015) we interviewed 405
people with a slight majority of male respondents (56%). Most respondents were students (74%), the
remaining were apprentices (13%), full time (7%) and half time (6%) workers. Mean age was 22 years,
almost 90% stated to have a private car available but only about 79% of the sample had a driver’s
license.
The questionnaire is made up of two sections: an SP experiment with six scenarios (see the section 2.2
Design), and a battery of attitudinal questions related to driving. In the present work, we focus our
attention exclusively on the first section.
In table 1, we report the comparison between the actual (mode that respondents effectively use for
commuting) and the stated (choices in the SP experiment) transportation mode for the respondents.
The hugest difference is in bike and e-bike shares: this is probably because in the stated experiment we
fixed the distance for getting to the workplace/university to 2.6 km, which is the average commuting
distance for Lugano (Bundesamt für Statistik, 2010). This distance is greater than the actual, since most
respondents (56%) stated to live more than 7 km far from their workplace/university, making
impossible to commute effectively by bike. Another notable difference is in public means (train, bus,
tram) that account for about 48% in the actual choices but only for 12% in stated choices. Interestingly
the share for moving walkway, an innovative transportation system introduced in the experiment,
equals 13%: this mode is composed by several walkways, similar to ones located into the airports, set
on the main sidewalks of the city center, completely free but uncovered. Its width allows two columns
of passengers and its speed reaches 15 km/h (boarding and disembark have a lower speed).
Tab. 1: actual choice vs state choice for commuting
ACTUAL CHOICE STATED CHOICE
Public means Private means Public means Private means
Train 28% Bike 2% PT 12% Bike 18%
Bus 20% Walking 16% Moving Walkway 13% E-bike 15%
Tram 0% Private car 20% Car sharing 0% Private car 25%
Car sharing 1% Carpooling 2% Carpooling 3%
Missing 4% Motorbike 5% Missing 2% Motorbike 12%
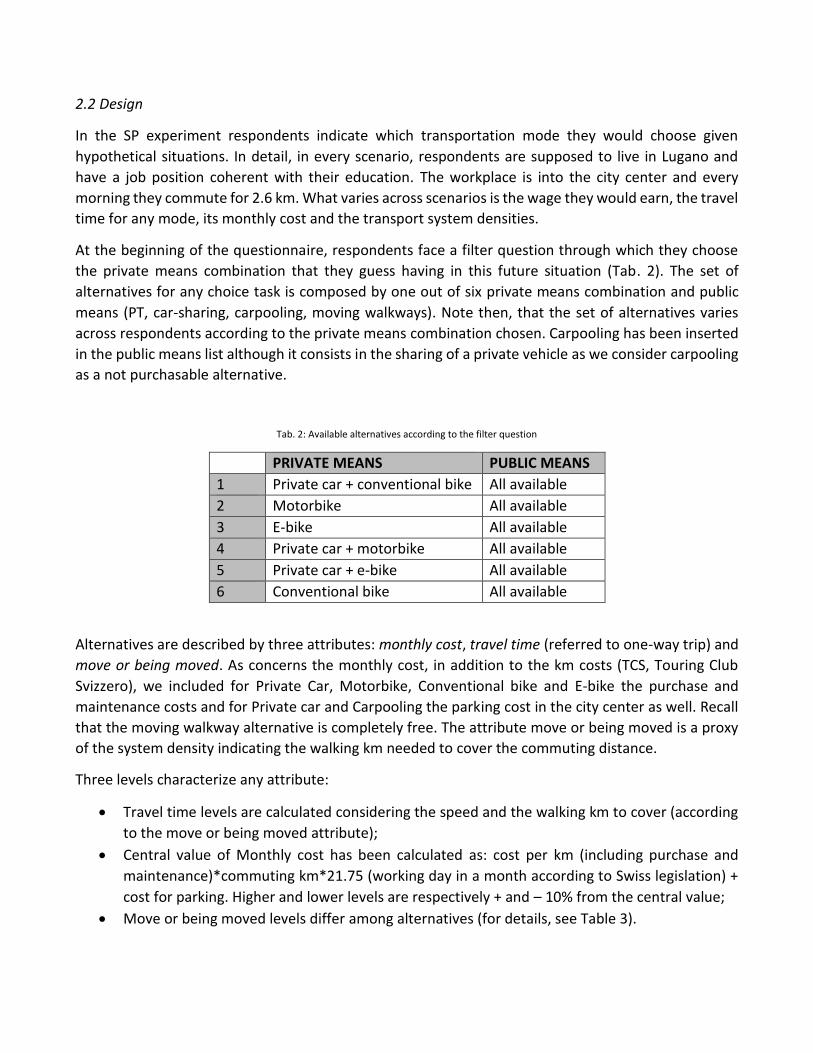
2.2 Design
In the SP experiment respondents indicate which transportation mode they would choose given
hypothetical situations. In detail, in every scenario, respondents are supposed to live in Lugano and
have a job position coherent with their education. The workplace is into the city center and every
morning they commute for 2.6 km. What varies across scenarios is the wage they would earn, the travel
time for any mode, its monthly cost and the transport system densities.
At the beginning of the questionnaire, respondents face a filter question through which they choose
the private means combination that they guess having in this future situation (Tab. 2). The set of
alternatives for any choice task is composed by one out of six private means combination and public
means (PT, car-sharing, carpooling, moving walkways). Note then, that the set of alternatives varies
across respondents according to the private means combination chosen. Carpooling has been inserted
in the public means list although it consists in the sharing of a private vehicle as we consider carpooling
as a not purchasable alternative.
Tab. 2: Available alternatives according to the filter question
PRIVATE MEANS PUBLIC MEANS
1 Private car + conventional bike All available
2 Motorbike All available
3 E-bike All available
4 Private car + motorbike All available
5 Private car + e-bike All available
6 Conventional bike All available
Alternatives are described by three attributes: monthly cost, travel time (referred to one-way trip) and
move or being moved. As concerns the monthly cost, in addition to the km costs (TCS, Touring Club
Svizzero), we included for Private Car, Motorbike, Conventional bike and E-bike the purchase and
maintenance costs and for Private car and Carpooling the parking cost in the city center as well. Recall
that the moving walkway alternative is completely free. The attribute move or being moved is a proxy
of the system density indicating the walking km needed to cover the commuting distance.
Three levels characterize any attribute:
Travel time levels are calculated considering the speed and the walking km to cover (according
to the move or being moved attribute);
Central value of Monthly cost has been calculated as: cost per km (including purchase and
maintenance)*commuting km*21.75 (working day in a month according to Swiss legislation) +
cost for parking. Higher and lower levels are respectively + and – 10% from the central value;
Move or being moved levels differ among alternatives (for details, see Table 3).
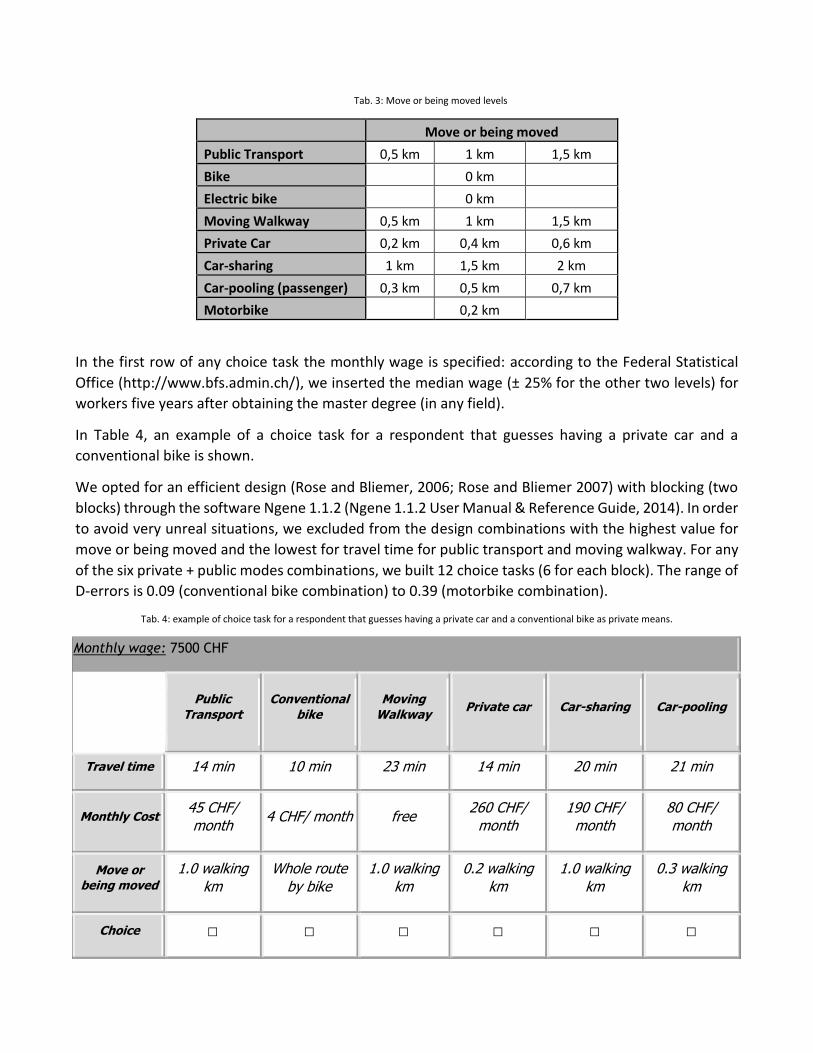
Tab. 3: Move or being moved levels
Move or being moved
Public Transport 0,5 km 1 km 1,5 km
Bike 0 km
Electric bike 0 km
Moving Walkway 0,5 km 1 km 1,5 km
Private Car 0,2 km 0,4 km 0,6 km
Car-sharing 1 km 1,5 km 2 km
Car-pooling (passenger) 0,3 km 0,5 km 0,7 km
Motorbike 0,2 km
In the first row of any choice task the monthly wage is specified: according to the Federal Statistical
Office (http://www.bfs.admin.ch/), we inserted the median wage (± 25% for the other two levels) for
workers five years after obtaining the master degree (in any field).
In Table 4, an example of a choice task for a respondent that guesses having a private car and a
conventional bike is shown.
We opted for an efficient design (Rose and Bliemer, 2006; Rose and Bliemer 2007) with blocking (two
blocks) through the software Ngene 1.1.2 (Ngene 1.1.2 User Manual & Reference Guide, 2014). In order
to avoid very unreal situations, we excluded from the design combinations with the highest value for
move or being moved and the lowest for travel time for public transport and moving walkway. For any
of the six private + public modes combinations, we built 12 choice tasks (6 for each block). The range of
D-errors is 0.09 (conventional bike combination) to 0.39 (motorbike combination).
Tab. 4: example of choice task for a respondent that guesses having a private car and a conventional bike as private means.
Monthly wage: 7500 CHF
Public
Transport
Conventional
bike
Moving
Walkway Private car Car-sharing Car-pooling
Travel time 14 min 10 min 23 min 14 min 20 min 21 min
Monthly Cost 45 CHF/
month 4 CHF/ month free
260 CHF/
month
190 CHF/
month
80 CHF/
month
Move or being moved
1.0 walking
km
Whole route
by bike
1.0 walking
km
0.2 walking
km
1.0 walking
km
0.3 walking
km
Choice □ □ □ □ □ □
2.3 Methodology
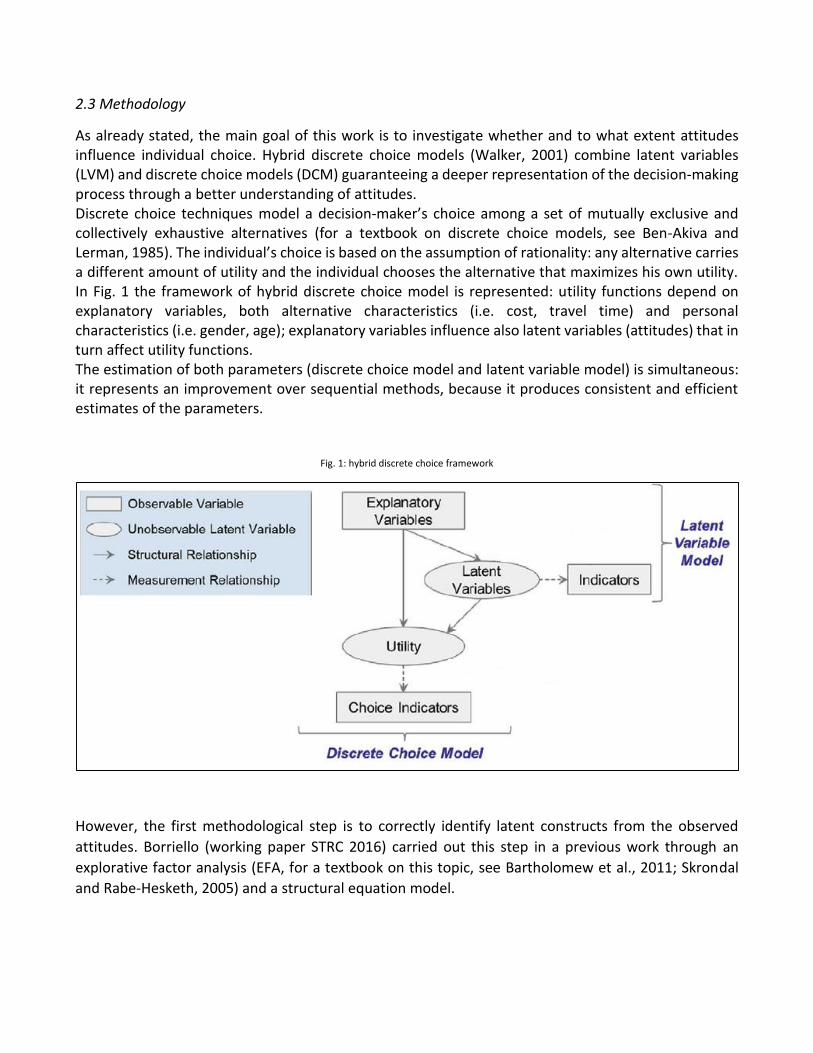
As already stated, the main goal of this work is to investigate whether and to what extent attitudes influence individual choice. Hybrid discrete choice models (Walker, 2001) combine latent variables (LVM) and discrete choice models (DCM) guaranteeing a deeper representation of the decision-making process through a better understanding of attitudes. Discrete choice techniques model a decision-maker’s choice among a set of mutually exclusive and collectively exhaustive alternatives (for a textbook on discrete choice models, see Ben-Akiva and Lerman, 1985). The individual’s choice is based on the assumption of rationality: any alternative carries a different amount of utility and the individual chooses the alternative that maximizes his own utility. In Fig. 1 the framework of hybrid discrete choice model is represented: utility functions depend on explanatory variables, both alternative characteristics (i.e. cost, travel time) and personal characteristics (i.e. gender, age); explanatory variables influence also latent variables (attitudes) that in turn affect utility functions. The estimation of both parameters (discrete choice model and latent variable model) is simultaneous: it represents an improvement over sequential methods, because it produces consistent and efficient estimates of the parameters.
Fig. 1: hybrid discrete choice framework
However, the first methodological step is to correctly identify latent constructs from the observed
attitudes. Borriello (working paper STRC 2016) carried out this step in a previous work through an
explorative factor analysis (EFA, for a textbook on this topic, see Bartholomew et al., 2011; Skrondal
and Rabe-Hesketh, 2005) and a structural equation model.
3. Results
The model presented here includes eight alternatives, both public and private, for a commuting trip in
Lugano. In the utility functions we inserted three attributes (i.e. travel time, monthly cost and move or
being moved), socioeconomic variables, two error components for private and motorized means and
five latent constructs obtained from the structural equation model. Specifically, the first latent variable
summarizes attitudes related to car performance (hereafter, Performance), the second one includes
environmental concerns (Environment), the third regards practicality and convenience (Convenience),
the fourth represents attitudes related to car-sharing and carpooling (CsCp) and the last factor
describes emotions (Emotion).
Commenting results of the HDCM, travel time, monthly cost and move or being moved have the
expected negative coefficient meaning that an increase in these attributes leads to a decrease in the
utility functions of all alternatives. It is possible to calculate to what extent people are inclined to pay
in order to decrease the travel time: for saving one minute in a commuting trip, the willingness to pay
(WTP) is 0.25 CHF, which amounts to pay 53 CHF more per month for saving 5 minutes every day per
route. In a study on Swiss commuters, Axhausen et al. (2004) found a value of 0.46 CHF for saving one
commuting minute using public transport and 0.51 CHF using private means; few years later Axhausen
et al. (2008) reviewed estimations respectively to 0.31 CHF/min for public transport and 0.32 CHF/min
for private means. The WTP is smaller in the present study maybe due to the sample composition
differences: we interviewed mostly students or young workers (22 years old is the average) that stated
to earn less than 30,000 CHF per year, while in their studies Axhausen et al. had an average income for
commuters of 84,656 CHF. On this topic, Hess et al. (2008) calculated the WTP for Swiss commuters
according to distance and income: who works 5 km from home and has a gross income household lower
than 12,000 CHF/year and commutes by private means is willing to pay 0.33 CHF/min, twice commuting
by public means (0.16 CHF/min).
Monthly wage has a positive effect (three different levels for wage) on the most expensive alternatives:
higher wage increases the utility of private car, car-sharing and carpooling with respect to the other
alternatives.
Both error components are significant meaning that there is inter-alternative correlation among
motorized alternatives (public transport, private car, car-sharing, carpooling, motorbike) and private
means groups, as well as heteroscedasticity.
The significance of all socio-economic variables included in the HDCM model facilitates the
understanding of the transport mode choice process. Working rather than studying increases the utility
of choosing car and motorbike: workers might face higher time constraints than students, and they
might need more flexibility on the job. Those who used to commute by private means have a higher
probability to prefer private means for commuting and those who use the car at least three days per
week (as driver or as passenger) have a higher utility from private car use than occasional drivers or
passengers. Interestingly young people (from 18 to 25) have a higher utility from private car use than
older people (> 26 years old). This could be an “early years” effect having waited so long for the driving
license as well as an innovation effect due to the opportunity to commute by a new mean that makes
them feel adult and independent. The negative sign of the coefficient for sportsman (p-value 0.06)
related to the light transport mode is intriguing: people who do sport frequently (two or more times
per week) have a lower utility from choosing bike and moving walkway than people that rarely do sport.
An explanation could be that sporty people do not perceive walking or cycling to reach the workplace
or the university as an exercise that can improve their performances, while persons rarely practicing
sports consider walking or cycling essential for a healthier life.
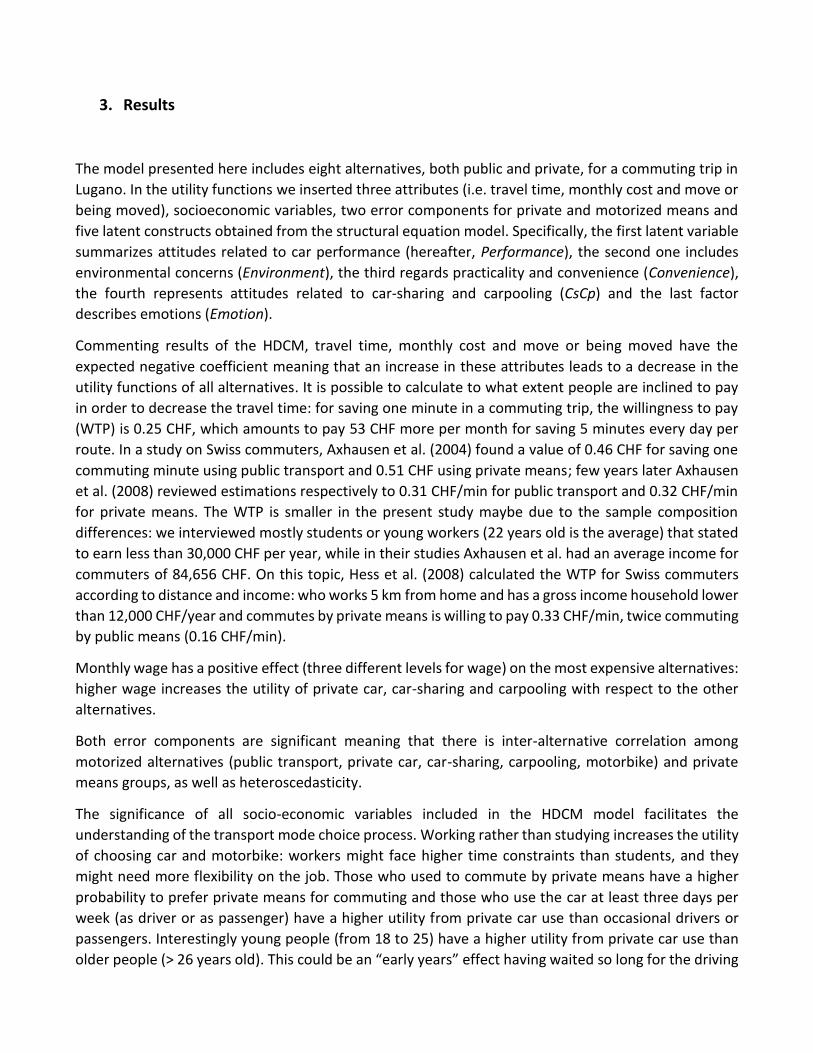
As concerns the latent variables, all coefficients are significant in the measurement equations (Table 5).
Table 5: measurement model coefficients
LATENT VARIABLE NAME VALUE T-TEST P-VALUE
Performance brand -1.30 -11.18 0.00
Performance design -1.37 -14.58 0.00
Performance envy -1.36 -11.93 0.00
Performance fast -1.58 -14.48 0.00
Performance power -1.42 -13.35 0.00
Performance rumble -1.77 -14.68 0.00
Environment airq1 1.19 11.59 0.00
Environment airq2 0.952 8.75 0.00
Environment ecodist 0.942 10.21 0.00
Environment futgen 0.905 7.91 0.00
Environment morept 1.11 10.61 0.00
CsCp cpconv 1.25 10.45 0.00
CsCp cpstrang 1.06 11.01 0.00
CsCp cspark 1.15 10.08 0.00
CsCp csstat 1.14 10.23 0.00
Convenience challeng -1.01 -17.90 0.00
Convenience comfort 0.974 14.92 0.00
Convenience discomf -0.988 -14.71 0.00
Convenience handy 1.06 17.90 0.00
Sensation boring -0.401 -5.98 0.00
Sensation funny 0.268 3.83 0.00
Sensation stress -0.392 -4.96 0.00
Sensation relax 0.337 4.55 0.00
Performance is positively reflected in its six items: higher is the latent variable score, higher will be any
measured attitude (brand, design, envy, fast, power, and rumble). In other words, those who are deeply
interested in car performances show higher scores on attitudes like “Powerful cars make me feel
strong” or “Car design is essential for me”. The same result appears with Environment (airq1, airq2,
ecodist, futgen and morept) and CsCp (cpconv, cpstrang, cspark and csstat): people who care more
about environment, ecology and sharing trips confer higher scores on attitudes like “I limit my auto
travel to help improve congestion and air quality” and “I am incline to pool a ride, since it is economically
convenient, environmentally friendly and less boring” more likely. Latent construct Convenience is
positively linked to comfort and handy and negatively to discomfort and challenging: people who feel
that commuting by car is a convenient solution, tend to give high values to comfort and practicality and
low values to discomfort and unpracticality. Finally, Sensation has similar results, being positively
related to relax and funny and negatively to stress and boring: those who feel good commuting by car,
score higher on relax and fun items and lower on stress and boredom.
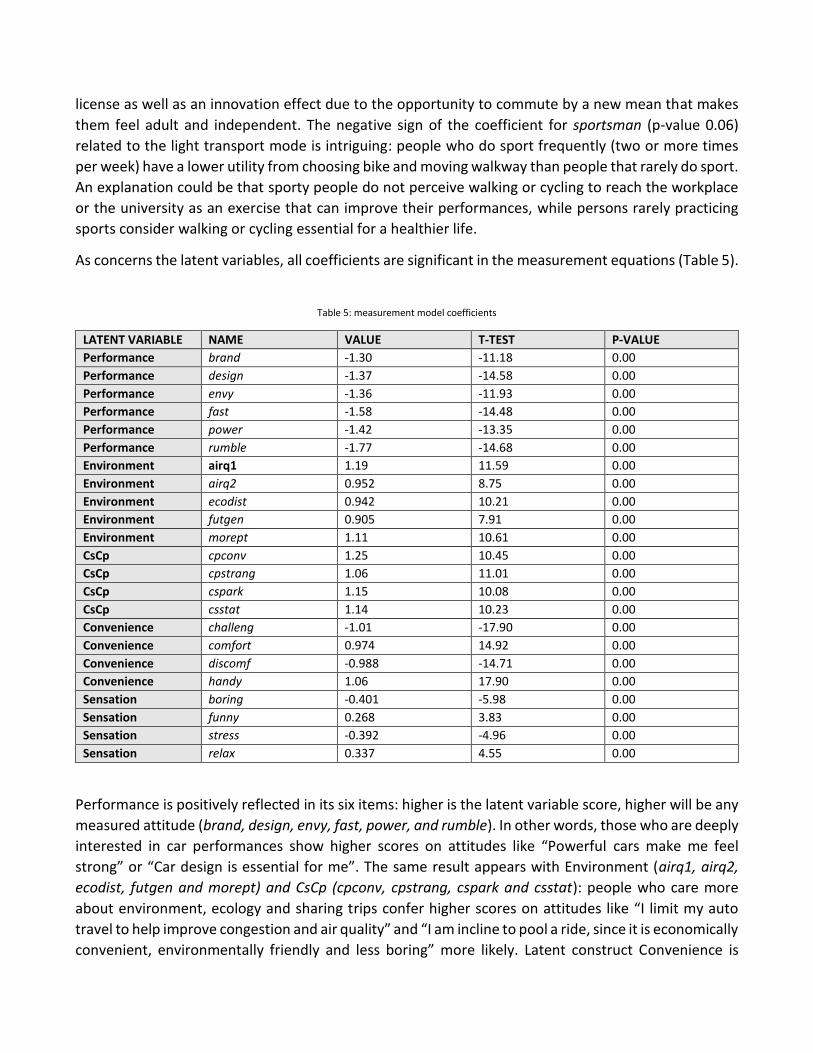
In the DC model, latent variables inclusion helps to better understand the decision-making process,
pointing out how attitudes can affect the choice (Table 6).
Table 6: latent variables estimates in DC
LATENT VARIABLE VALUE T-TEST P-VALUE
Convenience 0.875 4.90 0.00
CsCp 1.67 7.83 0.00
Environment 2.05 8.85 0.00
Performance -2.18 -2.65 0.01
Sensation 3.36 5.69 0.00
Envi*Gend -0.259 -0.79 0.43
Perf*Gend 0.018 0.06 0.96
Perf*Ita 2.81 3.50 0.00
Sens*Ita -6.07 -9.11 0.00
Monthly cost -0.011 -6.27 0.00
Travel time -0.118 -8.97 0.00
M.o.b.m. -1.33 -8.58 0.00
EC motorized 3.13 13.69 0.00
EC private -2.40 -14.03 0.00
In the specification presented in this work, we inserted the main effect of the latent variable
Performance in private car and car-sharing utility functions (remember that in carpooling we only
consider the possibility to be a passenger) and two interactions between the latent variable and,
respectively, gender and Italian speaking dummy variable (Italian citizens and Swiss citizens living in
Ticino). Results surprisingly suggest that, everything else being equal, there is a difference between
those who speak Italian and those who do not, while the gender difference is not significant: in detail,
commuters who speak Italian increase their utility for private car and car-sharing while the main effect
of Performance increases, and conversely, commuters who do not speak Italian increase their utility for
such modes while Performance decreases. That is, if Italian speaking people are car fanatic, showing
interest in fast and powerful cars, liking to be envied while they are driving their dream car and
identifying themselves with the brand of the car, they evaluate private car and car-sharing utilities

higher than not Italian speaking people. It is an expression of how much car matters in Italian culture,
of its importance and its meaning as status symbol, more important than elsewhere.
The latent variable Environment, inserted in public transport, bike, moving walkway and e-bike utility
functions, has a significant and positive estimated coefficient. Commuters who have high score on this
latent construct, that is those who feel guilty for the quality of life of future generations, who are willing
to pay more to use an electric or other clean fuel vehicle, or those who think that it is urgent to do
something to limit ecological problems, are more inclined to choose ecological and not motorized
solutions or public transport (all else being equal). Also in this case, the interaction with the gender is
not significant, suggesting that young commuters in Lugano, males and females, equally care about the
environment.
CsCp latent construct has been inserted into both car-sharing and carpooling utility functions.
Everything else being equal, higher score in this latent variable translates into higher probability of
choosing sharing vehicles. In particular, persons who pool a ride for its convenience, for environmental
awareness and persons who do not worry about parking in doing car-sharing, confer higher utility to
car-sharing and carpooling.
As concerns Convenience, ceteris partibus, the more respondents care about practicality and comfort
the higher is the utility associated to private car.
Also the results concerning the latent construct Sensation differ according to the Italian speaking
dummy: specifically, those who do not speak Italian who stated that commuting by car is a relaxing and
funny solution, tend to confer higher utility to private car. Italian speaking people, quite opposite, tend
to choose private car also when stress and boredom in commuting increase (see the coefficients
magnitude in Table 6). It is still a signal that cultural and social background has a strong influence on
the transportation mode choice: Italian speaking people are deeply attached to the car and have a
higher probability to choose this mode, even if they judge commuting by car stressing and boring.
4. Discussion
This work, by means of a SP experiment, aimed at providing a deeper knowledge of the decision-making
process for commuting mode choice through a hybrid discrete choice model.
In the last two decades, researchers moved their attention from instrumental factors to psychological
attitudes to better explain choices in transport, mainly considering environmental awareness (Nilsson
and Küller, 2000), symbolic and affective factors (Steg, 2005), pleasure of travelling (Ory and
Mokhtarian, 2005). However, in the current state-of-practice very few researchers focused strictly on
the wide construct of pleasure of driving (Hagman, 2010; Marsch and Collett, 1986). Borriello (STRC
2016) identified this global attitude in three latent constructs that are Performance, Convenience and
Sensation. Performance includes attitudes related to car aesthetics and characteristics (i.e. design,
brand, speed, power), Convenience incorporates comfort and practicality and Sensation reflects fun
and relax in commuting by car. Moreover, from his analysis emerges another wide construct, Green
Attitude, made up of two latent constructs, Environment awareness and CsCp (attitudes pro car-sharing
and carpooling).
The sample is composed by young students and workers in Lugano. Main result of our analysis suggests
that commuters who have higher scores in Convenience, Performance and Sensation (these last two
interacted with a dummy for Italian speaking people) choose private car more likely than commuters
who have not. Conversely, people who scored higher values in Environmental and CsCp tend to confer
higher utility at public transport, bike and e-bike and moving walkway than people who scored lower
values.
From the analysis also emerges that cultural background matters in choosing transportation mode:
there is a difference between Italian speaking people and others regarding latent variables Performance
and Sensation. People who speak Italian tend to choose more likely private car than people who do not,
when Performance increases and even when Sensation decreases. This is a clear expression of the
attachment to the car of Italian (by culture, not citizenship) people, of its importance and its
manifestation as status symbol. Note that due to the proximity of Lugano to the Italian boarder, the
sample just contains 10% of not Italian speaking people.
Differently from Lois and López-Sáez (2009) findings, interactions between gender and the
abovementioned latent constructs are not significant.
Another important finding is the willingness to pay for reducing commuting time: 0.25 CHF for saving
one minute, which amounts to pay 53 CHF more per month for saving 5 minutes every day per route.
This result is slightly lower than Axahusen et al. (2008) found on Swiss commuters, but their sample
included people with higher incomes.
The pleasure of driving is an important factor affecting the transportation mode choice: higher is the
pleasure, higher is the utility from private car use. This empirical finding suggests to consider also
sensations that people feel when they drive in establishing policies aimed at reducing externalities like
congestion and pollution. Follow that it is hard to convince commuters who feel deep pleasure when
driving to leave their private car: policy makers could intervene reinforcing and subsidizing car-sharing
and making more attractive electric vehicles. Certainly, it would be profitable to identify commuters
who do not feel pleasure when driving and concentrate policies efforts on this cluster. This research
identifies significant differences in social and cultural background and suggests to focus on not Italian
speaking people.
The presented work will be improved including in the sample young people studying or working in
Zurich, Luzern, Lausanne and Neuchatel in order to explore whether and how the social and cultural
context can affect the pleasure of driving, and in turn the mode choice.
In closing, it should be reminded that the specification presented in this work is one among several
tested and more work remains to be done in performing different specifications.
References
Axhausen, K. W., König, A., Abay, G., Bates, J.J., Bierlaire, M., 2004. Swiss value of travel time savings. In: Paper
presented at the European Transport Conference, Strasbourg.
Axhausen, K.W., Hess, S., König, A., Abay, G., Bates, J.J., Bierlaire, M., 2008. Income and distance elasticities of
values of travel time savings: New Swiss results. Transport Policy 15, 173 – 185.
Bartholomew, D.J., Knott, M., Moustaki, I., 2011. Latent Variable Models and Factor Analysis: A Unified
Approach (3rd ed). Wiley.
Ben-Akiva, M., Lerman, S.R., 1985. Discrete Choice Analysis: Theory and Application to Travel Demand. MIT
Press Series in Transportation Studies.
Borriello, A. Pleasure of driving components: a partial least square – path modeling approach. Working paper,
STRC 2016.
Bundesamt für Statistik, Bundesamt für Raumentwicklung; Mikrozensus Mobilität und Verkehr, 2010.
Collins, C.M., Chambers, S.M., 2005. Psychological and Situational Influences on Commuter-Transport-Mode
Choice. Environment and Behavior 37, 640 – 661.
Golob, T.F., Hensher, D.A., 1998. Greenhouse gas emissions and Australian commuters’ attitudes and behavior
concerning abatement policies and personal involvement. Transportation Research D 1, 1 – 18.
Hagman, O., 2010. Driving pleasure: a key concept in Swedish car culture. Mobilities Vol. 5, No. 1, 25 – 39.
Hair, J.F., Tatham, R.L., Anderson, R.E., Black, W., 1998. Multivariate data analysis 5th Ed. Prentice-Hall: London.
Handy, S., Weston, L., Mokhtarian, P.L., 2005. Driving by choice or necessity? Transportation Research Part A,
39, 183 – 203.
Hess, S., Erath, A., Axhausen, K.W., 2008. Zeitwerte im Personenverkehr: Wahrnehmungs- und
Distanzabhängigkeit. Forschungsauftrag SVI 2005/007 auf Antrag der Vereinigung Schweizerischer
Verkehrsingenieure (SVI), September 2008.
International Energy Agency, 2009. http://www.iea.org/
Lois, D., López-Sáez. M., 2009. The relationship between instrumental, symbolic and affective factors as
predictors of car use: a structural equation modeling approach. Transport Research A: Policy and Practice 43,
790 – 799.
Marsch, P., Collett, P., 1986. Driving passion. The psychology of the car. London: Jonathan Cape.
Mokhtarian, P.L., Salomon, I., 2001. How derived is the demand for travel? Some conceptual and measurement
considerarions. Transportation Research Part A – Policy and Practice 35, 695 – 719.
Mokhtarian, P.L., Salomon, I., Redmond, L.S., 2001. Understanding the demand for travel: it’s not purely
“derived”. Innovation, Vol. 14, No. 4.
Ngene 1.1.2 User Manual & Reference Guide, 2014. http://www.choice-metrics.com/features.html
Nilsson, M., Küller, R., 2000. Travel behaviour and environmental concern. Transportation Research Part D,
Volume 5, Issue 3, 211 – 234.
Ory, D.T., Mokhtarian, P.L., 2005. When is getting there half of the fun? Modeling the liking for travel.
Transportation Research Part A, 39, 97 – 123.
Ory, D.T., Mokhtarian, P.L., 2009. Modeling the structural relationships among short-distance travel amounts,
perceptions, affections, and desires. Transportation Research Part A, 43, 26 – 43.
Páez, A., Whalen, K., 2010. Enjoyment of commute: A comparison of different transportation modes.
Transportation Research Part A, 44, 537 – 549.
Rose, J.M., Bliemer, M.C.J., 2006. Designing efficient data for stated choice experiments. Paper presented at
the 11th International Conference on Travel Behaviour Research, Kyoto, Japan.

Rose, J.M., Bliemer, M.C.J., 2007. Stated preference experimental design strategies, in: D.A. Hensher, K. Button
(Eds.), Transport Modelling, Handbooks in Transport (second ed.), vol. 1, Elsevier Science, Oxford (2007)
(Chapter 8)
Skrondal, A., Rabe-Hesketh, S., 2005. Generalized Latent Variable Models. Chapman and Hall/CRC.
Steg, L., 2005. Car use: Lust and must. Instrumental, symbolic, and affective motives for car use. Transportation
Research A, 39, 147 – 162.
TCS, https://www.tcs.ch/it/auto-due-ruote/comprare-vendere-auto/costi-delle-auto/costi-chilometrici.php
Walker, J.L., 2001. Extended discrete choice models: integrated framework, flexible error structures, and latent
variables. PhD Thesis. Massachusetts Institute of Technology.
Related Documents


![Untitled-1 [] · CHOCOMILO; Bouillon - MAGGI CUBE, MAGGI CHICKEN, MAGGI CRAYFISH, MAGGI MIX'PY; and table water ... and marketing company.](https://static.cupdf.com/doc/110x72/5aedc9577f8b9a6625906f43/untitled-1-bouillon-maggi-cube-maggi-chicken-maggi-crayfish-maggi-mixpy.jpg)


