arXiv:0706.3356v2 [nucl-ex] 25 Jun 2007 The Physics of Ultraperipheral Collisions at the LHC Editors and Conveners: K. Hencken 7,8 , M. Strikman 18 , R. Vogt 11,19,20 , P. Yepes 22 Contributors: A. J. Baltz 1 , G. Baur 2 , D. d’Enterria 3 , L. Frankfurt 4 , F. Gelis 5 , V. Guzey 6 , K. Hencken 7,8 , Yu. Kharlov 9 , M. Klasen 10 , S. R. Klein 11 , V. Nikulin 12 , J. Nystrand 13 , I. A. Pshenichnov 14,15 , S. Sadovsky 9 , E. Scapparone 16 , J. Seger 17 , M. Strikman 18 , M. Tverskoy 12 , R. Vogt 11,19,20 , S. N. White 1 , U. A. Wiedemann 21 , P. Yepes 22 , M. Zhalov 12 1 Physics Department, Brookhaven National Laboratory, Upton, NY, USA 2 Institut fuer Kernphysik, Forschungszentrum Juelich, Juelich, Germany 3 Experimental Physics Division, CERN, Geneva, Switzerland 4 Nuclear Physics Department, Tel Aviv University, Tel Aviv, Israel 5 CEA/DSM/SPhT, Saclay, France 6 Institut f¨ ur Theoretische Physik II, Ruhr-Universit¨at Bochum, Bochum, Germany 7 University of Basel, Basel, Switzerland 8 ABB Corporate Research, Baden-Daettwil, Switzerland 9 Institute for High Energy Physics, Protvino, Russia 10 Laboratoire de Physique Subatomique et de Cosmologie, Universit´ e Joseph Fourier/CNRS-IN2P3, Grenoble, France 11 Nuclear Science Division, Lawrence Berkeley National Laboratory, Berkeley, USA 12 Petersburg Nuclear Physics Institute, Gatchina, Russia 13 Department of Physics and Technology, University of Bergen, Bergen, Norway 14 Frankfurt Institute for Advanced Studies, Frankfurt am Main, Germany 15 Institute for Nuclear Research, Russian Academy of Sciences, Moscow, Russia 16 INFN, Sezione di Bologna, Bologna, Italy 17 Physics Department, Creighton University, Omaha, NE, USA 18 Physics Department, Pennsylvania State University, State College, PA, USA 19 Physics Department, University of California at Davis, Davis, CA, USA 20 Lawrence Livermore National Laboratory, Livermore, CA, USA 21 Theory Division, CERN, Geneva, Switzerland 22 Physics and Astronomy Department, Rice University, Houston, TX, USA Abstract. We discuss the physics of large impact parameter interactions at the LHC: ultraperipheral collisions (UPCs). The dominant processes in UPCs are photon- nucleon (nucleus) interactions. The current LHC detector configurations can explore small x hard phenomena with nuclei and nucleons at photon-nucleon center-of-mass energies above 1 TeV, extending the x range of HERA by a factor of ten. In particular, it will be possible to probe diffractive and inclusive parton densities in nuclei using several processes. The interaction of small dipoles with protons and nuclei can be

Welcome message from author
This document is posted to help you gain knowledge. Please leave a comment to let me know what you think about it! Share it to your friends and learn new things together.
Transcript
arX
iv:0
706.
3356
v2 [
nucl
-ex]
25
Jun
2007
The Physics of Ultraperipheral Collisions at the
LHC
Editors and Conveners: K. Hencken7,8, M. Strikman18,
R. Vogt11,19,20, P. Yepes22
Contributors: A. J. Baltz1, G. Baur2, D. d’Enterria3,
L. Frankfurt4, F. Gelis5, V. Guzey6, K. Hencken7,8,
Yu. Kharlov9, M. Klasen10, S. R. Klein11, V. Nikulin12,
J. Nystrand13, I. A. Pshenichnov14,15, S. Sadovsky9,
E. Scapparone16, J. Seger17, M. Strikman18, M. Tverskoy12,
R. Vogt11,19,20, S. N. White1, U. A. Wiedemann21, P. Yepes22,
M. Zhalov12
1Physics Department, Brookhaven National Laboratory, Upton, NY, USA2Institut fuer Kernphysik, Forschungszentrum Juelich, Juelich, Germany3Experimental Physics Division, CERN, Geneva, Switzerland4Nuclear Physics Department, Tel Aviv University, Tel Aviv, Israel5CEA/DSM/SPhT, Saclay, France6Institut fur Theoretische Physik II, Ruhr-Universitat Bochum, Bochum, Germany7University of Basel, Basel, Switzerland8ABB Corporate Research, Baden-Daettwil, Switzerland9Institute for High Energy Physics, Protvino, Russia10Laboratoire de Physique Subatomique et de Cosmologie, Universite Joseph
Fourier/CNRS-IN2P3, Grenoble, France11Nuclear Science Division, Lawrence Berkeley National Laboratory, Berkeley, USA12Petersburg Nuclear Physics Institute, Gatchina, Russia13Department of Physics and Technology, University of Bergen, Bergen, Norway14Frankfurt Institute for Advanced Studies, Frankfurt am Main, Germany15Institute for Nuclear Research, Russian Academy of Sciences, Moscow, Russia16INFN, Sezione di Bologna, Bologna, Italy17Physics Department, Creighton University, Omaha, NE, USA18Physics Department, Pennsylvania State University, State College, PA, USA19Physics Department, University of California at Davis, Davis, CA, USA20Lawrence Livermore National Laboratory, Livermore, CA, USA21Theory Division, CERN, Geneva, Switzerland22Physics and Astronomy Department, Rice University, Houston, TX, USA
Abstract. We discuss the physics of large impact parameter interactions at the
LHC: ultraperipheral collisions (UPCs). The dominant processes in UPCs are photon-
nucleon (nucleus) interactions. The current LHC detector configurations can explore
small x hard phenomena with nuclei and nucleons at photon-nucleon center-of-mass
energies above 1 TeV, extending the x range of HERA by a factor of ten. In particular,
it will be possible to probe diffractive and inclusive parton densities in nuclei using
several processes. The interaction of small dipoles with protons and nuclei can be
investigated in elastic and quasi-elastic J/ψ and Υ production as well as in high t ρ0
production accompanied by a rapidity gap. Several of these phenomena provide clean
signatures of the onset of the new high gluon density QCD regime. The LHC is in
the kinematic range where nonlinear effects are several times larger than at HERA.
Two-photon processes in UPCs are also studied. In addition, while UPCs play a role
in limiting the maximum beam luminosity, they can also be used a luminosity monitor
by measuring mutual electromagnetic dissociation of the beam nuclei. We also review
similar studies at HERA and RHIC as well as describe the potential use of the LHC
detectors for UPC measurements.
2
1. Introduction
Contributed by: K. Hencken, M. Strikman, R. Vogt and P. Yepes
In 1924 Enrico Fermi, 23 at the time, proposed the equivalent photon method [1]
which treated the moving electromagnetic fields of a charged particle as a flux of virtual
photons. A decade later, Weizsacker and Williams applied the method [2] to relativistic
ions. Ultraperipheral collisions, UPCs, are those reactions in which two ions interact via
their cloud of virtual photons. The intensity of the electromagnetic field, and therefore
the number of photons in the cloud surrounding the nucleus, is proportional to Z2. Thus
these types of interactions are highly favored when heavy ions collide. Figure 1 shows
a schematic view of an ultraperipheral heavy-ion collision. The pancake shape of the
nuclei is due to Lorentz contraction.
b>R +R
Z
Z
A B
Figure 1. Schematic diagram of an ultraperipheral collision of two ions. The impact
parameter, b, is larger than the sum of the two radii, RA+RB. Reprinted from Ref. [3]
with permission from Elsevier.
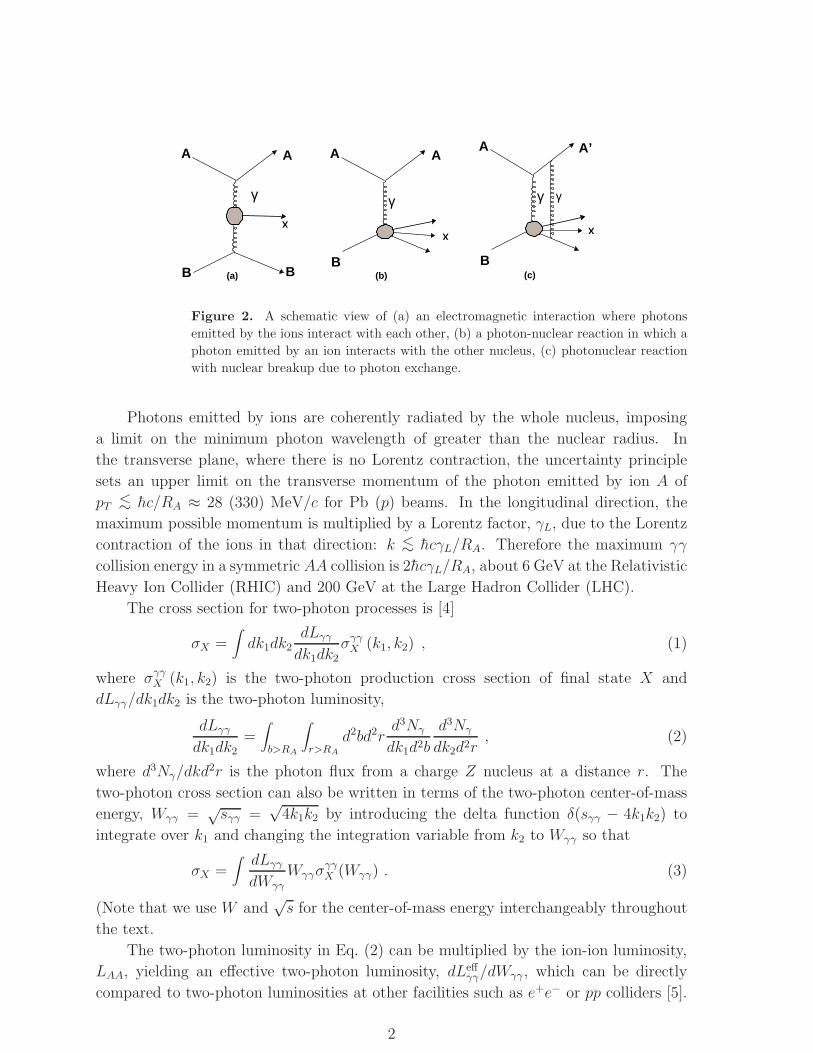
Ultraperipheral photon-photon collisions are interactions where the radiated
photons interact with each other. In addition, photonuclear collisions, where one
radiated photon interacts with a constituent of the other nucleus, are also possible.
The two processes are illustrated in Fig. 2(a) and (b). In these diagrams the nucleus
that emits the photon remains intact after the collision. However, it is possible to have
an ultraperipheral interaction in which one or both nuclei break up. The breakup may
occur through the exchange of an additional photon, as illustrated in Fig. 2(c).
In calculations of ultraperipheral AB collisions, the impact parameter is usually
required to be larger than the sum of the two nuclear radii, b > RA + RB. Strictly
speaking, an ultraperipheral electromagnetic interaction could occur simultaneously
with a hadronic collision. However, since it is not possible to separate the hadronic and
electromagnetic components in such collisions, the hadronic components are excluded
by the impact parameter cut.
1
B
A
γ
B
A
X
(a)B
A
γ
A
X
(b)B
A
γ
A’
X
(c)
γ
Figure 2. A schematic view of (a) an electromagnetic interaction where photons
emitted by the ions interact with each other, (b) a photon-nuclear reaction in which a
photon emitted by an ion interacts with the other nucleus, (c) photonuclear reaction
with nuclear breakup due to photon exchange.
Photons emitted by ions are coherently radiated by the whole nucleus, imposing
a limit on the minimum photon wavelength of greater than the nuclear radius. In
the transverse plane, where there is no Lorentz contraction, the uncertainty principle
sets an upper limit on the transverse momentum of the photon emitted by ion A of
pT <∼ hc/RA ≈ 28 (330) MeV/c for Pb (p) beams. In the longitudinal direction, the
maximum possible momentum is multiplied by a Lorentz factor, γL, due to the Lorentz
contraction of the ions in that direction: k <∼ hcγL/RA. Therefore the maximum γγ
collision energy in a symmetric AA collision is 2hcγL/RA, about 6 GeV at the Relativistic
Heavy Ion Collider (RHIC) and 200 GeV at the Large Hadron Collider (LHC).
The cross section for two-photon processes is [4]
σX =∫dk1dk2
dLγγdk1dk2
σγγX (k1, k2) , (1)
where σγγX (k1, k2) is the two-photon production cross section of final state X and
dLγγ/dk1dk2 is the two-photon luminosity,
dLγγdk1dk2
=∫
b>RA
∫
r>RA
d2bd2rd3Nγ
dk1d2b
d3Nγ
dk2d2r, (2)
where d3Nγ/dkd2r is the photon flux from a charge Z nucleus at a distance r. The
two-photon cross section can also be written in terms of the two-photon center-of-mass
energy, Wγγ =√sγγ =
√4k1k2 by introducing the delta function δ(sγγ − 4k1k2) to
integrate over k1 and changing the integration variable from k2 to Wγγ so that
σX =∫dLγγdWγγ
WγγσγγX (Wγγ) . (3)
(Note that we use W and√s for the center-of-mass energy interchangeably throughout
the text.
The two-photon luminosity in Eq. (2) can be multiplied by the ion-ion luminosity,
LAA, yielding an effective two-photon luminosity, dLeffγγ/dWγγ, which can be directly
compared to two-photon luminosities at other facilities such as e+e− or pp colliders [5].
2

Figure 3 shows the two-photon effective luminosities for various ion species and protons
as a function of Wγγ for the LHC (left) and for RHIC (right) [3]. Note the difference
in energy scales between the LHC and RHIC. The ion collider luminosities are also
compared to the γγ luminosity at LEP II. The LHC will have significant energy and
luminosity reach beyond LEP II and could be a bridge to γγ collisions at a future linear
e+e− collider. Indeed, the LHC two-photon luminosities for light ion beams are higher
than available elsewhere for energies up to Wγγ ≈ 500 GeV/c2.
10 23
10 24
10 25
10 26
10 27
10 28
10 29
10 30
10 31
100 200 300 400
Pb+PbAr+Arp pe+e–
Wγγ [GeV/c2]
LA
AdL
γγ /d
Wγγ
[cm
–2s–1
GeV
–1]
10 24
10 25
10 26
10 27
10 28
10 29
10 30
10 31
5 10 15
Au+AuCu+Cup pe+e–
Wγγ [GeV/c2]
LA
AdL
γγ /d
Wγγ
[cm
–2s–1
GeV
–1]
Figure 3. Effective γγ luminosity at LHC (left) and RHIC (right) for different ion
species and protons as well as at LEP II. In pp and e+e− collisions, LAA corresponds
to the pp or e+e− luminosity. Reprinted from Ref. [3] with permission from Elsevier.
The photoproduction cross section can also be factorized into the product of the
photonuclear cross section and the photon flux, dNγ/dk,
σX =∫dkdNγ
dkσγX(k) , (4)
where σγX(k) is the photonuclear cross section.
The photon flux used to calculate the two-photon luminosity in Eq. (2) and the
photoproduction cross section in Eq. (4) is given by the Weizsacker-Williams method
[8]. The flux is evaluated in impact parameter space, as is appropriate for heavy-ion
interactions [9, 10]. The flux at distance r away from a charge Z nucleus is
d3Nγ
dkd2r=Z2αw2
π2kr2
[K2
1 (w) +1
γ2L
K20 (w)
](5)
where w = kr/γL and K0(w) and K1(w) are modified Bessel functions. The photon flux
decreases exponentially above a cutoff energy determined by the size of the nucleus. In
the laboratory frame, the cutoff is kmax ≈ γLhc/RA. In the rest frame of the target
nucleus, the cutoff is boosted to Emax = (2γ2L − 1)hc/RA, about 500 GeV at RHIC and
1 PeV (1000 TeV) at the LHC. The photon flux for heavy ions at RHIC and the LHC
3
k dN
/dk
k (MeV)
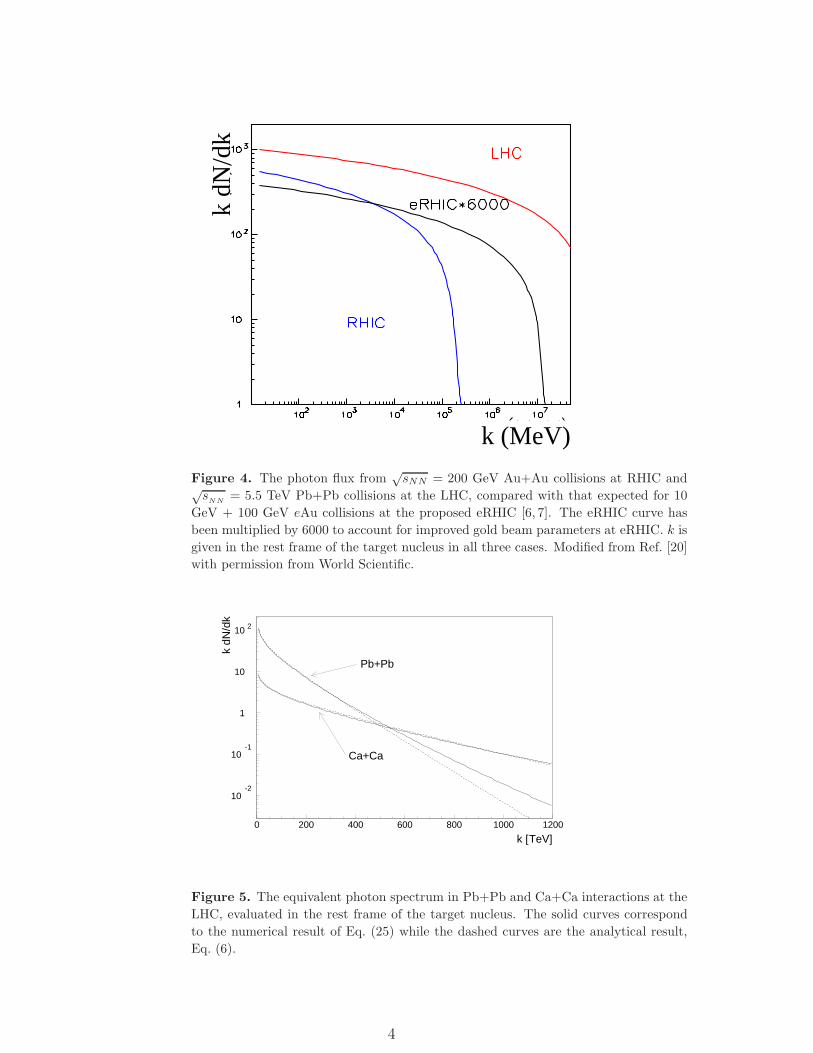
Figure 4. The photon flux from√sNN = 200 GeV Au+Au collisions at RHIC and√
sNN
= 5.5 TeV Pb+Pb collisions at the LHC, compared with that expected for 10
GeV + 100 GeV eAu collisions at the proposed eRHIC [6, 7]. The eRHIC curve has
been multiplied by 6000 to account for improved gold beam parameters at eRHIC. k is
given in the rest frame of the target nucleus in all three cases. Modified from Ref. [20]
with permission from World Scientific.
k [TeV]
k dN
/dk
Pb+Pb
Ca+Ca
10-2
10-1
1
10
10 2
0 200 400 600 800 1000 1200
Figure 5. The equivalent photon spectrum in Pb+Pb and Ca+Ca interactions at the
LHC, evaluated in the rest frame of the target nucleus. The solid curves correspond
to the numerical result of Eq. (25) while the dashed curves are the analytical result,
Eq. (6).
4
is depicted in Fig. 4. Also shown, for comparison, is the flux for the proposed electron-
ion collider at RHIC, eRHIC‡. The eA flux has been multiplied by 6000 to include the
expected luminosity increase for eRHIC relative to RHIC. Although both RHIC and
eRHIC are high luminosity γA colliders, the LHC has an energy reach far beyond other
existing or planned machines.
In these collisions, the accelerated ion is surrounded by a cloud of almost real
photons of virtuality |q2| < (hc/RA)2 where RA is the nuclear radius. The virtuality, less
than (60 MeV)2 for nuclei with A > 16, can be neglected. Since the photon interaction
is long range, photons can interact with partons in the opposite nucleus even when
the nuclei themselves do not interpenetrate. Because the photon energies are less than
those of the nucleons, these photonuclear interactions have a smaller average center-of-
mass energy than hadronic parton-parton collisions. However, even though the energy
is smaller, coherent photon beams have a flux proportional to the square of the nuclear
charge, Z, enhancing the rates relative to those of photoproduction in pp collisions.
Although the photons are nearly real, their high energy allows interactions at high
virtualities, Q2, in the photon-parton center of mass. Thus, massive vector mesons,
heavy quarks and jets can be produced with high rates in UPCs.
Table 1 shows the nucleon-nucleon center-of-mass energies,√s
NN, the beam
energies in the center-of-mass frame, Ebeam, Lorentz factors, γL, kmax, and Emax, as
well as the corresponding maximum γA center-of-mass energy per nucleon,√sγN =
WγN = [2kmax√s
NN]1/2 =
√2Emaxmp. We give the appropriate default kinematics for
AA, pA and pp collisions at the LHC. The resulting values are compared to the fixed-
target kinematics of the SPS as well as the proton and gold beams at the RHIC collider.
In fixed-target kinematics, Emax is obtained from γLhc/RA with the Lorentz boost of
the beam while kmax is calculated with γL =√s
NN/2mp. In pA collisions, the photon
field of the nucleus is stronger so that the interacting photon almost always comes from
the nucleus. Note also that the LHC pA results are calculated in the center-of-mass
kinematics although the different Z/A ratios in asymmetric collisions mean that the
beams have different velocities. In pp collisions, we use rp = 0.6 fm to calculate Emax
and kmax. Note that, at high energy, the maximum photon energy is 25% of the proton
energy for this choice of rp, significantly increasing the probability of proton breakup.
More work is required to understand the usable pp luminosity in this case.
We have also included the best available estimates [11–13] of the beam-beam
luminosities for AA and pp collisions in Table 1 to aid rate calculations. No beam-
beam luminosity is given for the fixed-target kinematics of the SPS. Only an estimate
of the initial LHC pA luminosities are given [12]. The maximum machine luminosities
are applicable to CMS and ATLAS. Unfortunately the interaction rate in ALICE is
limited to 200 kHz. Therefore its maximum pp luminosities are significantly lower. The
luminosities for collision modes other than pp and Pb+Pb are unofficial and, as such,
are subject to revision.
‡ We give estimates for the 10 GeV + 100 GeV version of the proposed electron-ion collider eRHIC.
5
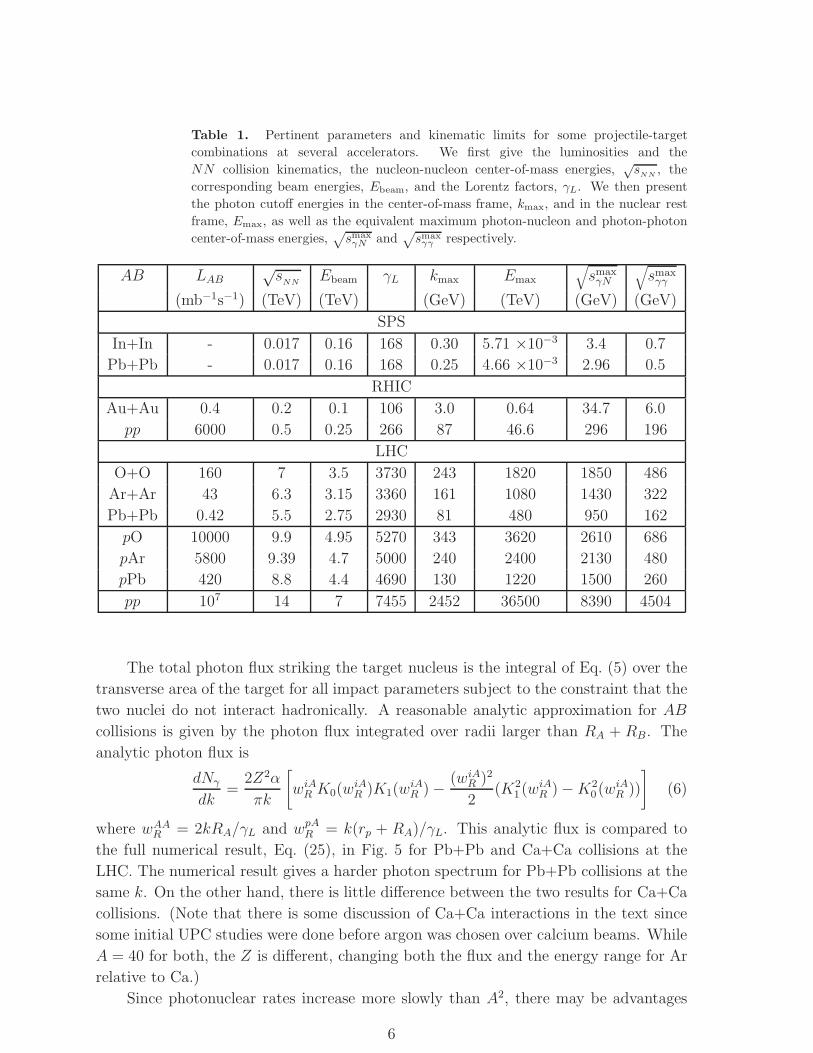
Table 1. Pertinent parameters and kinematic limits for some projectile-target
combinations at several accelerators. We first give the luminosities and the
NN collision kinematics, the nucleon-nucleon center-of-mass energies,√s
NN, the
corresponding beam energies, Ebeam, and the Lorentz factors, γL. We then present
the photon cutoff energies in the center-of-mass frame, kmax, and in the nuclear rest
frame, Emax, as well as the equivalent maximum photon-nucleon and photon-photon
center-of-mass energies,√smaxγN and
√smaxγγ respectively.
AB LAB√s
NNEbeam γL kmax Emax
√smaxγN
√smaxγγ
(mb−1s−1) (TeV) (TeV) (GeV) (TeV) (GeV) (GeV)
SPS
In+In - 0.017 0.16 168 0.30 5.71 ×10⁻³ 3.4 0.7
Pb+Pb - 0.017 0.16 168 0.25 4.66 ×10⁻³ 2.96 0.5
RHIC
Au+Au 0.4 0.2 0.1 106 3.0 0.64 34.7 6.0
pp 6000 0.5 0.25 266 87 46.6 296 196
LHC
O+O 160 7 3.5 3730 243 1820 1850 486
Ar+Ar 43 6.3 3.15 3360 161 1080 1430 322
Pb+Pb 0.42 5.5 2.75 2930 81 480 950 162
pO 10000 9.9 4.95 5270 343 3620 2610 686
pAr 5800 9.39 4.7 5000 240 2400 2130 480
pPb 420 8.8 4.4 4690 130 1220 1500 260
pp 107 14 7 7455 2452 36500 8390 4504
The total photon flux striking the target nucleus is the integral of Eq. (5) over the
transverse area of the target for all impact parameters subject to the constraint that the
two nuclei do not interact hadronically. A reasonable analytic approximation for AB
collisions is given by the photon flux integrated over radii larger than RA + RB. The
analytic photon flux is
dNγ
dk=
2Z2α
πk
[wiAR K0(w
iAR )K1(w
iAR ) − (wiAR )2
2(K2
1 (wiAR ) −K20(w
iAR ))
](6)
where wAAR = 2kRA/γL and wpAR = k(rp + RA)/γL. This analytic flux is compared to
the full numerical result, Eq. (25), in Fig. 5 for Pb+Pb and Ca+Ca collisions at the
LHC. The numerical result gives a harder photon spectrum for Pb+Pb collisions at the
same k. On the other hand, there is little difference between the two results for Ca+Ca
collisions. (Note that there is some discussion of Ca+Ca interactions in the text since
some initial UPC studies were done before argon was chosen over calcium beams. While
A = 40 for both, the Z is different, changing both the flux and the energy range for Ar
relative to Ca.)
Since photonuclear rates increase more slowly than A2, there may be advantages
6
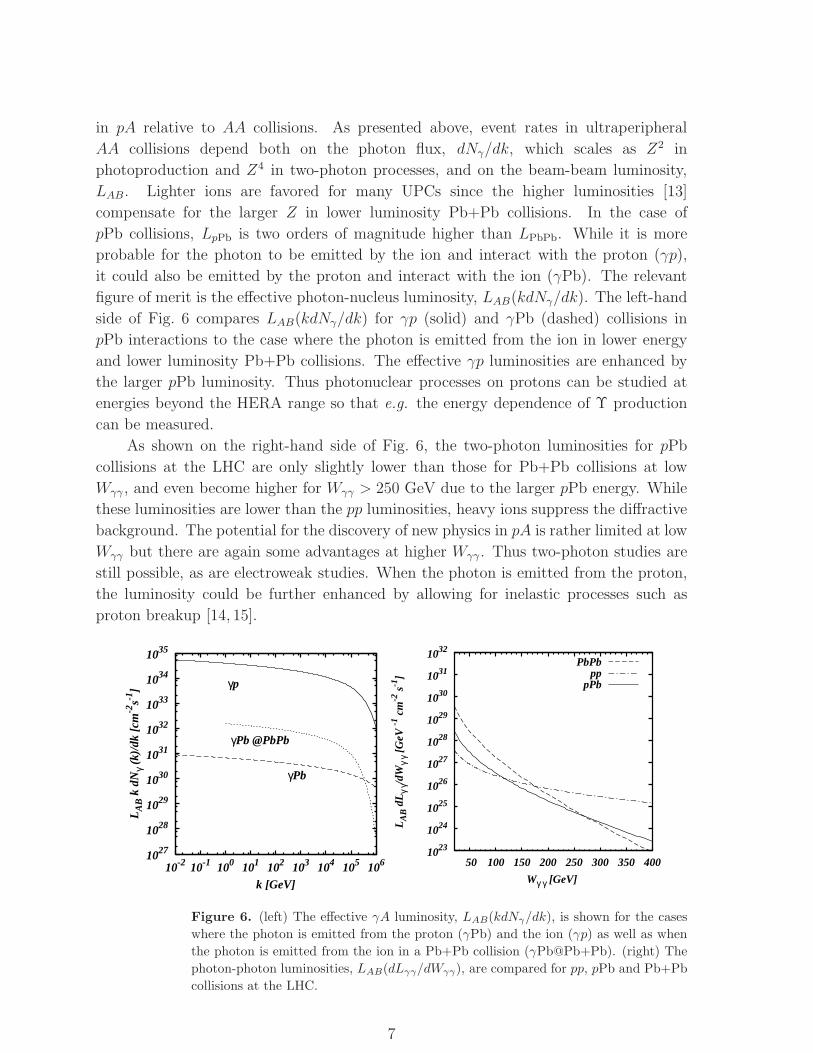
in pA relative to AA collisions. As presented above, event rates in ultraperipheral
AA collisions depend both on the photon flux, dNγ/dk, which scales as Z2 in
photoproduction and Z4 in two-photon processes, and on the beam-beam luminosity,
LAB. Lighter ions are favored for many UPCs since the higher luminosities [13]
compensate for the larger Z in lower luminosity Pb+Pb collisions. In the case of
pPb collisions, LpPb is two orders of magnitude higher than LPbPb. While it is more
probable for the photon to be emitted by the ion and interact with the proton (γp),
it could also be emitted by the proton and interact with the ion (γPb). The relevant
figure of merit is the effective photon-nucleus luminosity, LAB(kdNγ/dk). The left-hand
side of Fig. 6 compares LAB(kdNγ/dk) for γp (solid) and γPb (dashed) collisions in
pPb interactions to the case where the photon is emitted from the ion in lower energy
and lower luminosity Pb+Pb collisions. The effective γp luminosities are enhanced by
the larger pPb luminosity. Thus photonuclear processes on protons can be studied at
energies beyond the HERA range so that e.g. the energy dependence of Υ production
can be measured.
As shown on the right-hand side of Fig. 6, the two-photon luminosities for pPb
collisions at the LHC are only slightly lower than those for Pb+Pb collisions at low
Wγγ , and even become higher for Wγγ > 250 GeV due to the larger pPb energy. While
these luminosities are lower than the pp luminosities, heavy ions suppress the diffractive
background. The potential for the discovery of new physics in pA is rather limited at low
Wγγ but there are again some advantages at higher Wγγ . Thus two-photon studies are
still possible, as are electroweak studies. When the photon is emitted from the proton,
the luminosity could be further enhanced by allowing for inelastic processes such as
proton breakup [14, 15].
1027
1028
1029
1030
1031
1032
1033
1034
1035
10-2 10-1 100 101 102 103 104 105 106
LA
B k
dN
γ (k
)/dk
[cm
-2s-1
]
k [GeV]
γp
γPb @PbPb
γPb
1023
1024
1025
1026
1027
1028
1029
1030
1031
1032
50 100 150 200 250 300 350 400
LA
B d
Lγ
γ/dW
γ γ [
GeV
-1 c
m-2
s-1
]
Wγ γ [GeV]
PbPbpp
pPb
Figure 6. (left) The effective γA luminosity, LAB(kdNγ/dk), is shown for the cases
where the photon is emitted from the proton (γPb) and the ion (γp) as well as when
the photon is emitted from the ion in a Pb+Pb collision (γPb@Pb+Pb). (right) The
photon-photon luminosities, LAB(dLγγ/dWγγ), are compared for pp, pPb and Pb+Pb
collisions at the LHC.
7
The physics of UPCs has been reviewed by a number of groups. The first
comprehensive study was by Baur and Bertulani in 1988 [4]. More recent reviews are
by Krauss, Greiner and Soff [16], Baur and collaborators [3], and by Bertulani, Klein
and Nystrand [17]. The LHC FELIX proposal also did much to advance UPCs [18], as
did a UPC workshop in Erice, Italy [19, 20]. Useful related material is discussed in a
recent photoproduction review by Butterworth and Wing [21].
The remainder of this introduction will address some of the physics issues that can
be studied with UPCs. A few of these will be described in more detail in the body of
the report.
1.1. Physics of photonuclear reactions
Data from HERA show that the gluon and sea quark distributions rise quickly as their
momentum fraction x drops. At small enough x, the growth of the proton parton
densities may decrease proportionally with ln(1/x). The increase of the parton densities
is regulated by phenomena such as shadowing, recombination reactions, e.g. gg → g,
as well as possible tunneling between different QCD vacua that are suppressed at large
x. These phenomena are most significant in the central core of a nucleon. Scattering
off the periphery of the nucleon will dominate at small x, causing the cross section to
increase asymptotically as fast as ∝ ln3(1/x) [22]. The large diffractive gluon densities
observed at HERA demonstrate nonlinear effects for squared momentum transfer of the
virtual photon of up to Q2 ∼ 4 GeV2 at the smallest x values studied, x ∼ 10−4. At the
LHC, these QCD phenomena should be visible at larger x in central collisions of both
protons and heavy ions.
Studies of small x deep inelastic scattering (DIS) at HERA substantially improved
our understanding of strong interactions at high energies. There are several key findings
of HERA in this field. Rapid growth of the small x parton densities was observed over
a wide range of Q2. A significant probability for hard diffraction was seen, consistent
with approximate scaling and a logarithmicQ2 dependence (“leading-twist” dominance).
HERA also found a new class of hard exclusive processes – light vector meson production
at large Q2 and heavy QQ vector mesons at all Q2. These processes are described by the
QCD factorization theorem [23, 24] and related to the generalized parton distributions
in the target. In the small x limit, they can be calculated for zero squared momentum
transfer, t, using standard parton distributions. This new class of interactions probes
small qq dipole interactions with hadrons. The t-dependence provides direct information
on the gluon distribution of hadrons in the transverse plane as a function of x.
Combined analyses of inclusive DIS and hard vector meson production suggest
that the strength of the interactions, especially in channels where a hard probe directly
couples to low x gluons, approaches the maximum possible strength – the black disk
regime (BDR) – for Q2 ≤ 4 GeV2. This conclusion is confirmed by studies of hard
inclusive diffraction [22].
However, the Q2 range over which the black disk regime holds is relatively small,
8
with even smaller values for processes where a hard probe couples to a qq dipole with
Q2 ∼ 1 GeV2, making it difficult to separate perturbative from nonperturbative effects
and draw unambiguous conclusions.
The interaction regime where hard probes of small target x occur with high
probability should be a generic feature of strong interactions at high energies. This
feature is related to high gluon densities, reached for any target at sufficiently small x.
Extended targets are expected to reach this high density regime at substantially higher
x. At very high gluon density, even the notion of inclusive parton densities is ill-defined.
The onset of the BDR corresponds to a drastic departure from the linear regime
of QCD. Observing the onset of nonlinear QCD dynamics at small x would be of great
importance. The problems which emerge in the BDR kinematics can be visualized
by considering DIS interactions and exclusive diffractive processes in the language of
small dipoles interacting with the target. In the leading-log approximation, the inelastic
quark-antiquark (gluon-gluon) dipole-hadron cross section for a dipole of size d has the
form [25–27]
σdiph(sdiph, d2) =
π2
4C2Fd
2αs(Q2eff)xg(x,Q2
eff) (7)
where x = Q2eff/sdiph and sdiph is the square of the dipole-hadron center-of-mass energy.
Here C2F is the Casimir operator, equal to 4/3 for qq and 3 for gg, αs(Q
2eff) is the leading
order (LO) strong coupling constant and g(x,Q2eff) is the LO gluon density in the target.
The coupling constant and the gluon density are evaluated atQ2eff ∝ d−2. Since the gluon
densities increase at small x, the cross section in Eq. (7) ultimately becomes larger than
allowed by the unitarity constraint, πr2h, where rh is the transverse radius of the gluon
distribution in the hadron at the corresponding x. Since the unitarity bound corresponds
to complete absorption at impact parameters b ≤ rh, the resulting diffractive cross
section reflects absorption at small b. If the regime of complete absorption at b ≤ rhis reached, the diffractive absorption cross section becomes nearly equal to the inelastic
scattering cross section. At sufficiently high energies, the small x gluon fields resolved
by the small color dipole become so strong that the dipole cannot propagate through
extended nuclear media without absorption, signaling the breakdown of the linear scaling
regime of Eq. (7) and the onset of the BDR.
In the dipole picture, a high energy photon can be considered to be a superposition
of large and small size dipoles. Smaller and smaller dipoles begin to interact in the BDR
with increasing energy. Photons contain more small dipoles than hadrons such as pions,
leading to faster growth of σtot(γp) than given by the Froissart bound for hadrons. Thus
real photon interactions are sensitive to these small dipoles. As a result, a number of
theoretical issues concerning the onset of the BDR can be studied using UPCs. The
energy scale at which the dipole-target cross section in Eq. (7) is tamed by the unitarity
constraint near the BDR and no longer undergoes rapid growth is unknown, as is the
energy dependence of the cross section. The energy at which the dipole cross section
makes the transition from color transparency (no screening) to color opacity (strong
screening) and, ultimately, the BDR also needs to be determined. Answers may be
9
found by selecting processes where gluons interact directly. High gluon densities may
be achieved at lower energies using nuclei, as we now discuss.
To reach the regime where Eq. (7) breaks down, measurements need to be extended
to higher energies, smaller x, and to higher gluon densities, at the same energy and x,
using nuclei. Nuclear beams were discussed for HERA [28] but will not be implemented.
Studies of small x physics at the LHC using hadronic pp or pA collisions will be rather
difficult because, at central rapidities, the backgrounds due to multiple hard collisions
will likely prevent measurements at virtualities less than Q2eff ∼ 100 − 200 GeV2.
Although the fragmentation region at forward rapidity, with smaller backgrounds, is
likely beyond the acceptance of the currently planned detectors, some small x studies
using the CMS forward hadron calorimeter, HF, or CASTOR have been performed
[29, 30]. Thus, instead of using eA collisions to reach the small x regime, many of the
approaches used at HERA could be implemented at the LHC using UPCs in both AA
and pA collisions.
A primary focus of UPC studies in AB and pA collisions is on hard interactions in
the kinematics which probe high gluon densities in nucleons and nuclei. Hard scatter-
ings on nuclear targets will extend the low x range of previous studies by nearly three
orders of magnitude. In pA collisions, the HERA x range could be extended to an order
of magnitude smaller x. Thus all three HERA highlights: gluon density measurements,
gluon-induced hard diffraction, and exclusive J/ψ and Υ production can be studied in
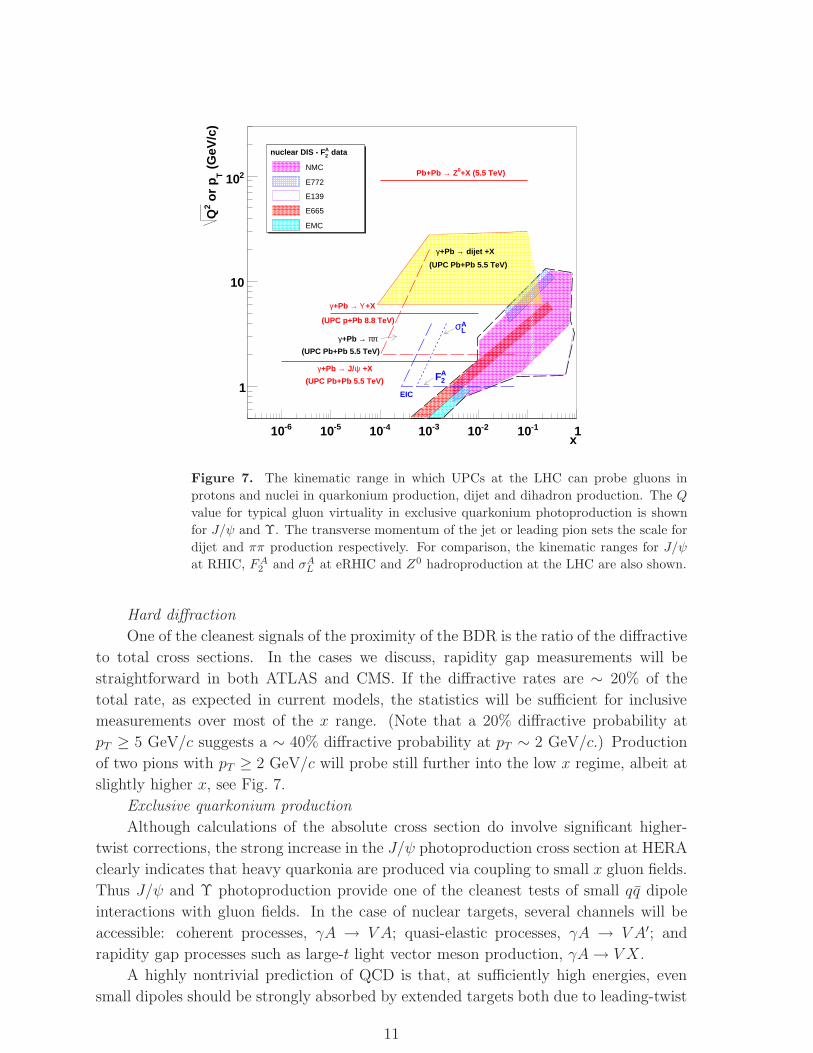
ultraperipheral pA and AB collisions. Figure 7 shows the x and Q2 ranges covered
by UPCs at the LHC. For comparison, the kinematic range of both Z0 production in
pp collisions at the LHC and the nuclear structure function at eRHIC are also shown.
The x range of ep collisions at eRHIC is a factor of ∼ 30 lower than at HERA for the
same pT . In the remainder of the introduction, we summarize some of the possible UPC
measurements that could further our understanding of small x dynamics.
Measurements of parton distributions in nuclei/nucleons
The studies in Section 4 will demonstrate that hard ultraperipheral collisions
investigate hard photon-nucleus (proton) collisions at significantly higher energies than
at HERA. The dominant process is photon-gluon fusion to two jets with leading light
or heavy quarks, γg → jet1 + jet2, fixing the gluon densities in protons/nuclei. The
LHC rates will be high enough to measure dijets and c and b quarks, probing the gluon
distribution at x ∼ 5 × 10⁻⁵ for pT ≥ 6 GeV/c [31].
The virtualities that can be probed in UPCs will be much higher than those reached
in lepton-nucleon/nucleus interactions. The larger x range and direct gluon couplings
will make these measurements competitive with those at HERA and the planned eRHIC
as a way to probe nonlinear effects. Indeed if it is possible to go down to pT ∼ 5 GeV/c,
the nonlinear effects in UPCs would be a factor of six higher than at HERA and a
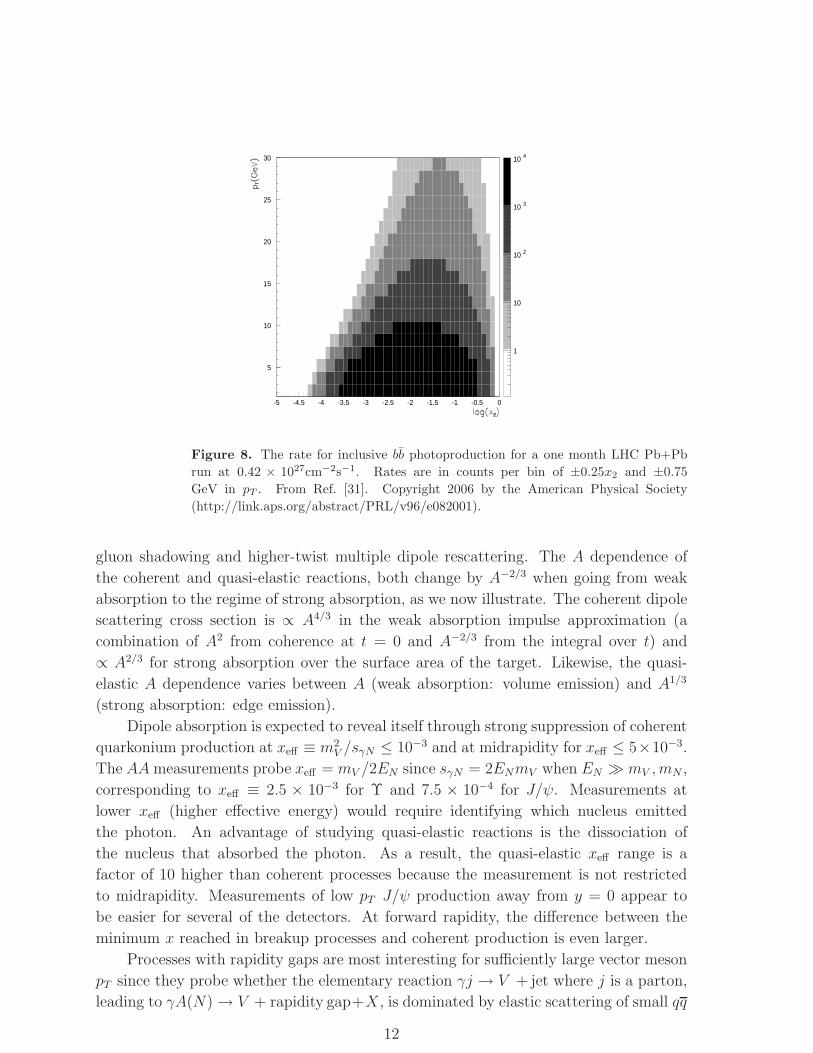
factor of two larger than at eRHIC [31]. An example of the b quark rate in the ATLAS
detector [31] is presented in Fig. 8.
10
x-610 -510 -410 -310 -210 -110 1
(G
eV/c
)T
or
p2
Q
1
10
210
dataA2nuclear DIS - F
NMC
E772
E139
E665
EMC
dijet +X→+Pb γ
(UPC Pb+Pb 5.5 TeV)
+Xψ J/→+Pb γ(UPC Pb+Pb 5.5 TeV)
ππ →+Pb γ(UPC Pb+Pb 5.5 TeV)
+XΥ →+Pb γ
(UPC p+Pb 8.8 TeV)
+X (5.5 TeV)0 Z→Pb+Pb
EIC
A2F
ALσ
Figure 7. The kinematic range in which UPCs at the LHC can probe gluons in
protons and nuclei in quarkonium production, dijet and dihadron production. The Q
value for typical gluon virtuality in exclusive quarkonium photoproduction is shown
for J/ψ and Υ. The transverse momentum of the jet or leading pion sets the scale for
dijet and ππ production respectively. For comparison, the kinematic ranges for J/ψ
at RHIC, FA2 and σAL at eRHIC and Z0 hadroproduction at the LHC are also shown.
Hard diffraction
One of the cleanest signals of the proximity of the BDR is the ratio of the diffractive
to total cross sections. In the cases we discuss, rapidity gap measurements will be
straightforward in both ATLAS and CMS. If the diffractive rates are ∼ 20% of the
total rate, as expected in current models, the statistics will be sufficient for inclusive
measurements over most of the x range. (Note that a 20% diffractive probability at
pT ≥ 5 GeV/c suggests a ∼ 40% diffractive probability at pT ∼ 2 GeV/c.) Production
of two pions with pT ≥ 2 GeV/c will probe still further into the low x regime, albeit at
slightly higher x, see Fig. 7.
Exclusive quarkonium production
Although calculations of the absolute cross section do involve significant higher-
twist corrections, the strong increase in the J/ψ photoproduction cross section at HERA
clearly indicates that heavy quarkonia are produced via coupling to small x gluon fields.
Thus J/ψ and Υ photoproduction provide one of the cleanest tests of small qq dipole
interactions with gluon fields. In the case of nuclear targets, several channels will be
accessible: coherent processes, γA → V A; quasi-elastic processes, γA → V A′; and
rapidity gap processes such as large-t light vector meson production, γA→ V X.
A highly nontrivial prediction of QCD is that, at sufficiently high energies, even
small dipoles should be strongly absorbed by extended targets both due to leading-twist
11
5
10
15
20
25
30
-5 -4.5 -4 -3.5 -3 -2.5 -2 -1.5 -1 -0.5 0
1
10
10 2
10 3
10 4
Figure 8. The rate for inclusive bb photoproduction for a one month LHC Pb+Pb
run at 0.42 × 1027cm−2s−1. Rates are in counts per bin of ±0.25x2 and ±0.75
GeV in pT . From Ref. [31]. Copyright 2006 by the American Physical Society
(http://link.aps.org/abstract/PRL/v96/e082001).
gluon shadowing and higher-twist multiple dipole rescattering. The A dependence of
the coherent and quasi-elastic reactions, both change by A−2/3 when going from weak
absorption to the regime of strong absorption, as we now illustrate. The coherent dipole
scattering cross section is ∝ A4/3 in the weak absorption impulse approximation (a
combination of A2 from coherence at t = 0 and A−2/3 from the integral over t) and
∝ A2/3 for strong absorption over the surface area of the target. Likewise, the quasi-
elastic A dependence varies between A (weak absorption: volume emission) and A1/3
(strong absorption: edge emission).
Dipole absorption is expected to reveal itself through strong suppression of coherent
quarkonium production at xeff ≡ m2V /sγN ≤ 10−3 and at midrapidity for xeff ≤ 5×10⁻³.
The AAmeasurements probe xeff = mV /2EN since sγN = 2ENmV when EN ≫ mV , mN ,
corresponding to xeff ≡ 2.5 × 10⁻³ for Υ and 7.5 × 10⁻⁴ for J/ψ. Measurements at
lower xeff (higher effective energy) would require identifying which nucleus emitted
the photon. An advantage of studying quasi-elastic reactions is the dissociation of
the nucleus that absorbed the photon. As a result, the quasi-elastic xeff range is a
factor of 10 higher than coherent processes because the measurement is not restricted
to midrapidity. Measurements of low pT J/ψ production away from y = 0 appear to
be easier for several of the detectors. At forward rapidity, the difference between the
minimum x reached in breakup processes and coherent production is even larger.
Processes with rapidity gaps are most interesting for sufficiently large vector meson
pT since they probe whether the elementary reaction γj → V + jet where j is a parton,
leading to γA(N) → V + rapidity gap+X, is dominated by elastic scattering of small qq
12
dipole components of the photon wavefunction with partons in the nucleon. Light vector
mesons, including the ρ0, are then also effective probes. Such reactions are an effective
way of studying the properties of perturbative colorless interactions in the vacuum (the
“perturbative Pomeron”) at finite t. The LHC kinematics and detector acceptances
would greatly increase the energy range covered by HERA. Nuclear scattering would
provide a complementary method of studying the dynamics of small dipole propagation
through the nuclear medium. UPCs at the LHC are expected to reach both the large t
and moderate W regime where the onset of the perturbative color transparency limit,
σ ∝ A, is expected as well as the onset of the BDR at large W where σ ∝ A1/3.
UPCs in pA interactions
Proton-nucleus collisions are also an important part of the LHC program.
Ultraperipheral pA studies will further extend the HERA range for several important
processes. The small x gluon densities can be studied through heavy quark production
by photon-gluon fusion when the gluon comes from the nucleus and, in the diffractive
case, when the gluon comes from the Pomeron.
Exclusive J/ψ production should be able to determine whether the growth of the
J/ψ cross section with W decreases as the BDR is approached. If the proposed forward
proton counters at 420 m downstream are approved [32], accurate measurements of
the t-dependences of these reactions could determine the transverse gluon distribution
over a wide x range. In contrast, HERA could not directly detect protons and had to
rely on vetoing. Measurements of the Υ photoproduction cross section could verify the
prediction that the cross section should increase as W 1.7γp [33, 34].
The ATLAS and CMS detectors can study vector meson production both as
functions of the vector meson rapidity and the rapidity gap, ∆y, between the vector
meson and other produced particles. While ∆ymax ∼ 2 at HERA, at the LHC ∆ymax ∼ 8,
making studies of Pomeron dynamics much more effective.
In summary, UPC studies in pA interactions will probe the small x dynamics for
x ≥ 10−4 in a number of complementary ways. They will address the high density
regime, a primary motivation for the proposals to extend HERA running beyond 2007
[35], with the added advantage of much higher densities than accessible in ep collisions.
Since these measurements will cover the x range probed in AA collisions at the LHC,
these studies are also important for understanding the AA collision dynamics.
1.2. Overview of interesting γγ processes
Two-photon collisions are fundamental processes that have previously been studied at
every lepton collider, particularly in e+e− at the CERN LEP and also in ep at HERA.
There are three areas of two-photon physics that may be studied using UPCs at the
LHC: QED processes in strong electromagnetic fields; QCD processes; and new physics
searches.
At low photon energies, QED processes in strong electromagnetic fields can
be studied. The photon-ion coupling constant is Zα ≈ 0.6. Therefore Coulomb
13
corrections, processes beyond leading order, can become important. In the case of e+e−
pair production, higher-order processes can be studied either as unitarity corrections,
resulting in multiple pair production in single collisions, or as Coulomb corrections,
giving a reduction relative to the Born cross section. Together with the possibility of
tagging additional nuclear excitations, these processes can be studied at small impact
parameter where the effects may be enhanced.
An important beam-physics effect is “bound-free pair production” or “electron
capture from pair production”, a pair production process where the electron is produced
in a bound state with one of the ions. As the Z/A ratio changes, the ion is no longer
kept in the beam. These ions then hit the wall of the beam pipe, leading to large heating
and potentially quenching the superconducting magnets. This is the dominant process
restricting the maximum Pb+Pb luminosity at the LHC. They also cause approximately
half of the beam losses and therefore shorten the heavy-ion beam lifetime. Bound-free
pair production was observed during the 2005 RHIC Cu+Cu run [36].
At higher photon energies, QCD two-photon processes may be of interest. The large
photon flux allows more detailed studies of processes that are separable from diffractive
γA → XA processes. In double vector meson production, not only light mesons like
ρ0ρ0 but also J/ψJ/ψ or pairs of two different vector mesons could be studied. Vector
meson pair production can be distinguished from production of two independent vector
mesons in coherent γA scattering since the transverse momenta of two vector mesons
produced in γγ processes are much larger and back-to-back.
The high photon energies and the correspondingly large available two-photon
invariant mass, together with the large photon flux, motivated previous new physics
searches such as Higgs and supersymmetric particle production in two-photon
interactions. However, experimental limits on the masses of many new particles have
increased in recent years, making their discovery in γγ processes at the LHC unlikely.
The parameter space for production beyond the Standard Model may still be explored.
In pp collisions, it is possible to tag the photons if they have lost more than 10% of their
energy, making electroweak studies of γγ or γW processes possible. Although the cross
section are not large, the higher energies, longer runs and high beam luminosities in pp
collisions offer some advantages.
2. Exclusive photonuclear processes
2.1. Introduction
Contributed by: L. Frankfurt, V. Guzey, M. Strikman, R. Vogt, and M. Zhalov
During the last decade, studies of small x phenomena at HERA have revealed
that, at the highest energies available in ep collisions, the interaction strength becomes
comparable to the maximum allowed by unitarity over a wide range of Q2. An increase
in interaction energies and/or the extension to ion beams is needed to reach higher
14
interaction strengths.
The most practical way to carry out such a program in the next decade appears
to be investigation of photon-nucleus interactions at the LHC [3, 18, 37]. Though it
is not possible to vary the virtuality of the photon in photonuclear interactions, as
in lepton-nucleus scattering, the isolated nature of direct photon events provides an
effective means of determining the virtuality of the probe. An important advantage
of ultraperipheral heavy-ion collisions relative to the HERA program is the ability
to simultaneously study γN and γA scattering, making it possible to investigate
the onset of a variety of hard QCD phenomena leading to a new strong interaction
regime including: color transparency and color opacity; leading-twist nuclear shadowing
and the breakdown of linear QCD evolution, These phenomena will be clearer in
hard scattering with nuclear beams since the onset should occur at larger x than in
nucleons. In general, nuclear targets are ideal probes of the space-time evolution of
small dipoles of size d which can be selected in high energy γN scattering either by
considering small x processes withQ2 ∝ 1/d2, or by studying special diffractive processes
such as quarkonium or dijet production. Understanding the space-time evolution has
consequences for other branches of physics, including the early universe since the
emergence of color-singlet clusters may play a role in the quark-hadron transition.
This program makes it possible to study coherent (and some incoherent) photonuclear
interactions at energies which exceed those at HERA by at least an order of magnitude.
Thus coherent UPC studies at the LHC will answer a number of fundamental questions
in QCD. They will identify and investigate a new regime of strong interactions by probing
the dependence on the projectile, the final state, and the nuclear size and thickness.
Several QCD regimes may be accessible, depending on the incident energy, the Q2
of the process and the nuclear thickness. High-energy interactions of hadrons with nuclei
rapidly approach the black-disk regime (BDR) where the total interaction cross section
is ≈ 2πR2A where RA ≃ 1.2A1/3. At another extreme, the photon interacts like a small
color singlet dipole. In this case, the system remains small over a wide energy range
while traversing the nucleus, known as color transparency. In this regime, small dipole
interactions with nuclei are rather weak and proportional to A. Color transparency
predicts that the forward scattering cross section in γA collisions should be proportional
to A2 since the amplitude is proportional to A. Color transparency has recently been
observed in exclusive dijet production by coherent diffraction in πA interactions [38]. A
similar A dependence has also been observed in coherent J/ψ production in fixed-target
γA interactions at FNAL [39]. At higher energies, the interactions of small color dipoles
may be described in the perturbative color opacity regime. Here, the dipole still couples
to the gluon field of the nucleus through the nuclear gluon density, gA(x,Q2), as in
the color transparency regime. However, the scattering amplitude is not ∝ A due to
leading-twist (LT) shadowing, resulting in gA(x,Q2)/AgN(x,Q2) < 1. The onset of LT
gluon shadowing partially tames the increase of gA(x,Q2) for 10−4 < x < 10−2, slowing
the increase of the dipole-nucleus cross section with energy. However, the reduction of
gA(x,Q2) at small x is insufficient to prevent the LT approximation of the total inelastic
15
cross section from reaching and exceeding its maximum value, violating unitarity, an
unambiguous signal of the breakdown of the LT approximation at small x. We will
discuss how to unambiguously distinguish between leading-twist nuclear shadowing and
the blackening of hard interactions.
It is important to determine whether dipole-nuclear interactions are strongly
modified by LT shadowing at small x [40]. Some models neglect this effect [41]
and focus on higher-twist effects, often modeled using the impact-parameter space
eikonal approach [42, 43]. If LT shadowing was small and only higher-twist effects
reduced the increase of the dipole-nucleus cross section, the DGLAP approximation
of parton evolution would break down at rather large x. On the other hand, the
DGLAP breakdown may be due to the onset of the BDR, taming the dipole-nucleus
cross section at smaller x. We argue that the relative importance of leading and
higher-twist contributions could be experimentally resolved using coherent quarkonium
photoproduction.
If LT gluon shadowing effects are small, qq dipoles with d ≥ 0.3 − 0.4 fm could
be in the BDR in central AA collisions at x ≥ 10−3, the kinematic regime where ln x
effects on the parton evolution are also small. In any case, the limiting behavior of
the dipole-nuclear interaction is of great theoretical interest since it represents a new
regime of strong interactions where the LT QCD approximation, and therefore the
notion of parton distributions, becomes inapplicable at small x even though αs is small.
We emphasize that, besides higher parton densities in nuclei, the dependence of the
scattering amplitude on impact parameter is rather weak over a wide range of b. Thus
the dependence of the amplitudes on the nuclear thickness can be studied by employing
both heavy and light nuclear targets. On the other hand, nucleon scattering at large b is
important at small x, making the change of interaction regime at small b and leading to
different energy dependencies of the deep-inelastic scattering cross sections for nucleons
(∝ ln3 s) and nuclei (∝ ln s). In hard diffraction, the forward cross sections and the t
dependence of the slope parameter B also increase rapidly with energy: σ ∝ ln4 s and
B ≈ B0 +B1 ln2 s respectively.
Theoretical studies of the limiting behavior of the dipole-nucleus cross sections have
so far not produced any definitive results. QCD dynamics may slow the increase of the
dipole-nucleus cross section at central impact parameters (b ∼ 0) at significantly larger
x than allowed by the BDR. In the following discussion, we assume that the BDR is
reached at small b to emphasize the distinguishing features of the new regime where the
elastic and inelastic cross sections are equal.
In many processes, the projectile wavefunction may be described as a superposition
of different size configurations (qq, qqg, etc.) leading to fluctuations in the interaction
strength. Interactions of real and virtual photons with heavy nuclei can therefore
provide unique information since the photon wavefunction contains both “hadron-like”
configurations (vector meson dominance) and “photon-like” configurations (light qq
components and heavy QQ components). In high-energy photonuclear interactions, the
BDR is manifested by inelastic diffraction of the photon into a multitude of hadronic
16
final states while elastic diffraction, γ → γ, is negligible. On the other hand, only
elastic hadron diffraction survives in the BDR, hiding the detailed dynamics. Moreover,
it is possible to post-select a small or large configuration of the photon wavefunction by
choosing a particular final state. Such post-selection is more difficult for hadrons since
the configuration size distribution is wider for photons.
Spectacular manifestations of the BDR in (virtual) photon diffraction include strong
enhancement of the high mass tail of the diffractive spectrum relative to the triple
Pomeron limit and large dijet production cross sections at high pT [44]. We emphasize
that the study of diffractive channels can distinguish between the two scenarios of strong
cross section suppression: leading-twist shadowing and the black-disk regime. Studies
of coherent diffraction in the BDR will uniquely measure components of the light-cone
photon wavefunction, providing more detailed information than similar measurements
where leading-twist dominates.
2.2. Color transparency, nuclear shadowing and quarkonium production
Contributed by: L. Frankfurt, V. Guzey, M. Strikman, R. Vogt, and M. Zhalov
The interaction of small color singlets with hadrons is one of the most actively
studied issues in high-energy QCD. In exclusive electroproduction of mesons at high
Q2 as well as J/ψ and Υ photoproduction, the QCD factorization theorem separates
the vector meson wave function at zero transverse separation into the hard scattering
amplitude and the generalized parton densities, making evaluation of the vector
meson production amplitude possible [23, 24]§. The leading-twist approximation differs
strongly from predictions based on the Glauber model and two-gluon exchange models.
The LT approximation accounts for the dominance of the space-time evolution of small
quark-gluon wave packets in electroproduction, leading to the formation of a softer gluon
field which effectively increases the dipole size with energy.
In perturbative QCD, similar to QED, the total cross section for the interaction of
small systems with hadrons is proportional to the area occupied by the color charge in
the projectile hadron [47], predicting color transparency hard interactions with nuclei.
Incoherent cross sections are expected to be proportional to the nuclear mass number,
A, while the coherent amplitude is proportional to A times the nuclear form factor, F .
The approximation of a quarkonium projectile as a colorless QQ dipole can be formally
derived from QCD within the limit mQ → ∞ and a fixed, finite momentum fraction,
x = 4m2Q/s [48]. In these kinematics, the quarkonium radius is sufficiently small to
justify the applicability of pQCD.
It is important to determine the Q2 in vector meson production where squeezing
becomes effective and the dipole size decreases as 1/Q. Perhaps the most sensitive
§ The proportionality of hard diffractive amplitudes to the nucleon gluon density was discussed for
hard pp diffraction [45], J/ψ production [46] in the BFKL approximation, and pion diffraction into two
jets [26] in the leading log Q2 approximation [26].
17
indicator of small dipole size is the t-dependence of vector meson production. The
current HERA data are consistent with the prediction [23, 48] that the slopes of the ρ0
and J/ψ production amplitudes should converge to the same value. Thus configurations
much smaller than average, d ∼ 0.6 fm in light mesons, dominate small x ρ0 production
at Q2 ≥ 5 GeV2. However, at all Q2, J/ψ production is dominated by small size
configurations. Therefore, color transparency is expected for x ≥ 0.03 where gluon
shadowing is either very small or absent.
Color transparency (CT) was observed at Fermilab [38] with coherent dissociation
in πA→ jet1 + jet2+A interactions at 500 GeV. Diffractive masses of up to 5 GeV were
observed, consistent with two jets. The results confirmed the A dependence and the pTand longitudinal jet momentum distributions predicted in Ref. [26]. Color transparency
was also previously observed in coherent J/ψ photoproduction at 〈Eγ〉 = 120 GeV [39].
It is not clear whether CT will hold at arbitrarily high energies since two phenomena
are expected to counter it at high energies: leading-twist gluon shadowing and the
increase of the dipole-nucleon cross section with energy.
Leading-twist gluon shadowing predicts that the gluon distribution in a nucleus
will be depleted at low x relative to the nucleon, gA(x,Q2)/AgN(x,Q2) < 1. Such
expectations are tentatively supported by the current analyzes of nuclear DIS although
the data does not extend deep enough into the shadowing region for confirmation.
Shadowing should lead to a gradual but calculable disappearance of color transparency
[23, 26] and the onset of a new regime, the color opacity regime. It is possible to consider
color opacity to be generalized color transparency since the small qq dipole still couples
to the gluon field of the target by two gluons with an amplitude proportional to the
generalized nuclear gluon density.
The small dipole-nucleon cross section is expected to increase with energy as
xgN(x,Q2) where x ∝ 1/s(qq)N . For sufficiently large energies the cross section
becomes comparable to the meson-nucleon cross sections which may result in significant
suppression of hard exclusive diffraction relative to the leading-twist approximation.
While this suppression may be beyond the kinematics achievable for J/ψ
photoproduction in UPCs at RHIC [63], x ≈ 0.015 and Q2eff ≈ 4 GeV2, it could
be important in UPCs at the LHC. Thus systematic studies of coherent quarkonium
production in ultraperipheral AA interactions at collider energies should be very
interesting. We emphasize that the eikonal (higher-twist) contributions die out quickly
with decreasing quarkonium size for fixed x. In particular, for the Υ, nuclear gluon
fields at transverse scale ∼ 0.1 fm (Q2eff ∼ 40 GeV2) are probed. The J/ψ is closer
to the border between the perturbative and nonperturbative domains. As a result,
the nonperturbative region appears to give a significant contribution to the production
amplitude [49].
We now discuss the quarkonium photoproduction amplitude, γA → J/ψ (Υ)A,
in greater detail. The Wγp range probed at the LHC corresponds to rather small x.
The key theoretical issue is how to properly incorporate nuclear shadowing. A number
of coherent mechanisms have been suggested. Here leading-twist shadowing, shown
18
P PPP
P
A
AA
A A A
γ
γ Q
Q
Q
QJ/
J/
ψ
ψ
−
−γ
−J/ψ
2
2
,Υ
1
xxx
xx
121
,Υ
(a)
(b) (c)
x
xx −x
,Υ
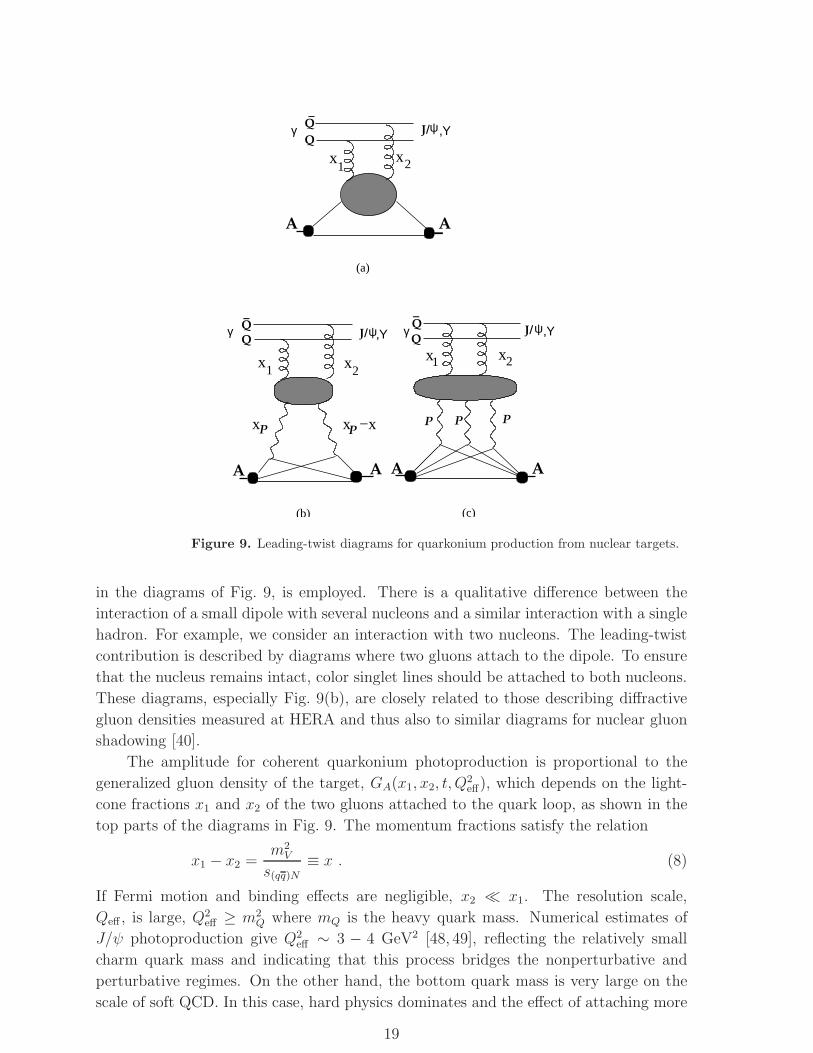
Figure 9. Leading-twist diagrams for quarkonium production from nuclear targets.
in the diagrams of Fig. 9, is employed. There is a qualitative difference between the
interaction of a small dipole with several nucleons and a similar interaction with a single
hadron. For example, we consider an interaction with two nucleons. The leading-twist
contribution is described by diagrams where two gluons attach to the dipole. To ensure
that the nucleus remains intact, color singlet lines should be attached to both nucleons.
These diagrams, especially Fig. 9(b), are closely related to those describing diffractive
gluon densities measured at HERA and thus also to similar diagrams for nuclear gluon
shadowing [40].
The amplitude for coherent quarkonium photoproduction is proportional to the
generalized gluon density of the target, GA(x1, x2, t, Q2eff), which depends on the light-
cone fractions x1 and x2 of the two gluons attached to the quark loop, as shown in the
top parts of the diagrams in Fig. 9. The momentum fractions satisfy the relation
x1 − x2 =m2V
s(qq)N
≡ x . (8)
If Fermi motion and binding effects are negligible, x2 ≪ x1. The resolution scale,
Qeff , is large, Q2eff ≥ m2
Q where mQ is the heavy quark mass. Numerical estimates of
J/ψ photoproduction give Q2eff ∼ 3 − 4 GeV2 [48, 49], reflecting the relatively small
charm quark mass and indicating that this process bridges the nonperturbative and
perturbative regimes. On the other hand, the bottom quark mass is very large on the
scale of soft QCD. In this case, hard physics dominates and the effect of attaching more
19
than two gluons to the bb is negligible. The QCD factorization theorem then provides
a reliable description of Υ production. Higher-twist effects due to the overlap of the bb
component of the photon and the Υ cancel in the ratio of Υ production on different
targets. As a result, in the leading-twist shadowing approximation, the γA→ ΥA cross
section is proportional to the square of the generalized nuclear gluon density so that
σγA→V A(sγN) =dσγN→V N(sγN )
dt
∣∣∣∣t=tmin
[GA(x1, x2, t = 0, Q2
eff)
AGN(x1, x2, t = 0, Q2eff)
]2
×tmin∫
−∞
dt∣∣∣∣∫d2bdzei~qT ·
~be−iqlzρA(~b, z)∣∣∣∣2
. (9)
Numerical estimates using realistic potential model wave functions indicate that
for J/ψ, x2/x1 ∼ 0.33 [49] while for the Υ, x2/x1 ∼ 0.1 [33]. Models of generalized
parton distributions (GPDs) at moderate Q2 suggest that, for any hadron or nucleus,
G(x1, x2, t = 0, Q2) can be approximated by the inclusive gluon density, g(x,Q2), at
x = (x1 +x2)/2 [23, 50]. At large Q2 and small x, the GPDs are dominated by evolution
from xiniti ≫ xi. Since evolution on the gluon ladder conserves x1 − x2, the effect
of skewedness (x2/x1 < 1) is determined primarily by evolution from nearly diagonal
(x1 ∼ x2) distributions [51].
Skewedness increases the Υ cross section by a factor of ∼ 2 [33, 34], potentially
obscuring the connection between the suppression of the cross section discussed
above and nuclear gluon shadowing. However, Ref. [49] showed that the ratio
GA(x1, x2, t, Q2eff)/AGN(x1, x2, t, Q
2eff) is a weak function of x2 at t = 0, slowly dropping
from the diagonal value, x2 = x1, for decreasing x2. This observation suggests that
it is more appropriate to compare the diagonal and non-diagonal (skewed) ratios at
x = (x1 + x2)/2.
In the following, the ratio of generalized nuclear to nucleon gluon densities is
approximated by the ratio of gluon densities at x = m2V /s(qq)N ,
GA(x1, x2, t = 0, Q2eff)
AGN(x1, x2, t = 0, Q2eff)
≈ gA(x,Q2eff)
AgN(x,Q2eff )
. (10)
For the Υ, x/2 may be more appropriate, leading to slightly larger shadowing effects
than with x alone.
Reference [40] showed that nuclear shadowing may be expressed in a model-
independent way, through the corresponding diffractive parton densities, using the
Gribov theory of inelastic shadowing [52, 53] and the QCD factorization theorem for the
hard diffraction [54]. HERA demonstrated that hard diffraction is dominated by the
leading-twist contribution with gluons playing an important role in diffraction, referred
to as “gluon dominance of the Pomeron”. Analysis of diffractive HERA data indicates
that the probability of diffraction in gluon-induced processes is significantly larger than
in quark-induced processes [40]. The recent H1 data on diffractive dijet production
[55] provide an additional confirmation of this observation. The large probability of
diffraction in gluon-induced hard scattering can be understood in the s-channel language
20
as the formation of large color-octet dipoles which can diffractively scatter with a
correspondingly large cross section. The interaction strength can be quantified using
the optical theorem, introducing the effective cross section,
σgeff(x,Q20) =
16π
σtot(x,Q20)
dσdiff(x,Q20, tmin)
dt
=16π
xgN(x,Q20)
∫ x0IP
xdxIP βg
DN(
x
xIP, xIP , Q
20, tmin) (11)
for hard scattering of a virtual photon off the gluon field of the nucleon. Here Q20 = 4
GeV2 is the resolution scale for the gluons; xIP is the longitudinal momentum fraction
of the Pomeron; x0IP = 0.1; and gDN is the diffractive gluon density of the nucleon, known
from the H1 Fit B diffractive analysis [56, 57]. While this coherent mechanism may
effectively be absent for x ≥ 0.02− 0.03, it may quickly become important at smaller x.
0
10
20
30
40
50
60
1e-05 1e-04 0.001 0.01 0.1
σe
ff, m
b
x
Q2=4 GeV2
gluon channel
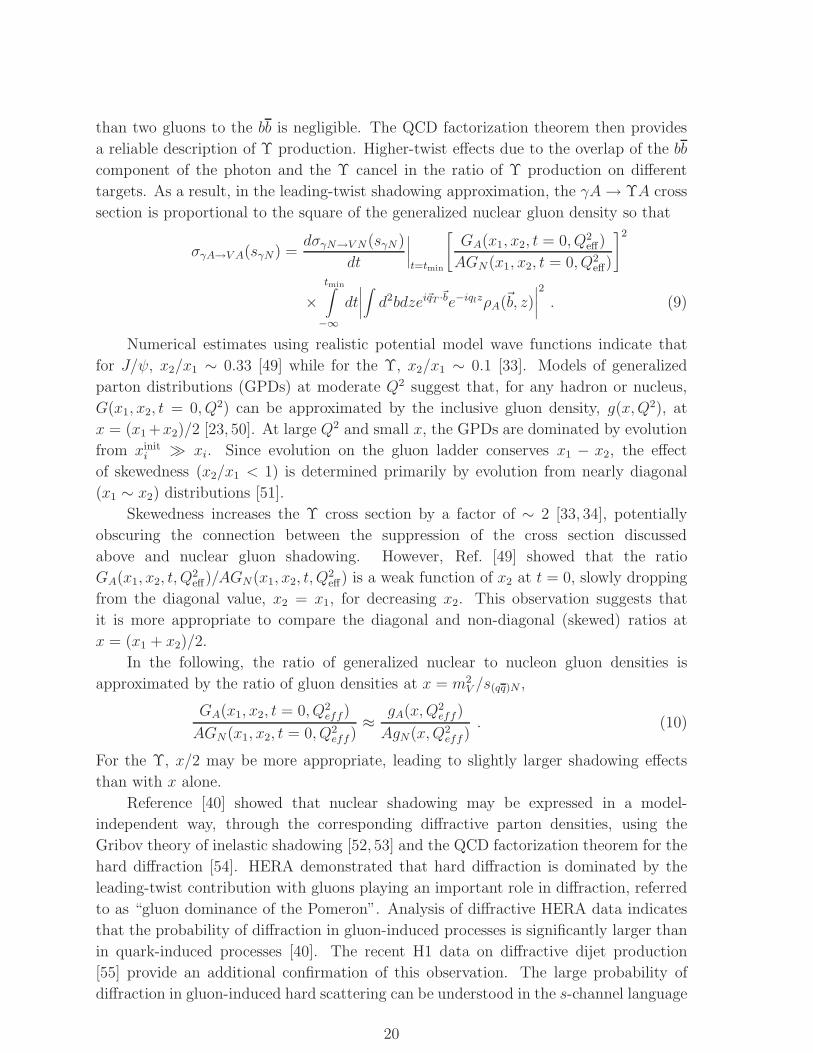
Figure 10. The effective gluon shadowing cross section, σgeff(x), at Q2 = 4 GeV2 as a
function of x for the H1 parameterizations of the diffractive gluon density.
The ratio of the inclusive gluon densities in Eq. (10) is calculated using leading-
twist shadowing [40], see Ref. [58] for details. First, the nuclear gluon density, including
leading-twist shadowing is calculated at the minimum scale, Q20 = 4 GeV2
gA(x,Q20) = AgN(x,Q2
0) − 8πRe
[(1 − iη)2
1 + η2(12)
×∫d2b
∫ ∞
−∞dz1
∫ ∞
z1dz2
∫ x0IP
xdxIPβg
DN(
x
xIP, xIP , Q
20, tmin)
× ρA(b, z1)ρA(b, z2) eixIPmN (z1−z2) e
− 1−iη
2σg
eff(x,Q2
0)∫ z2
z1dz′ρA(b,z′)
],
where η is the ratio of the real to imaginary parts of the elementary diffractive amplitude.
The H1 parametrization of gDN(x/xIP , xIP , Q20, tmin) is used as input. The effective cross
21
section, σgeff(x,Q20), determined by Eq. (11), accounts for elastic rescattering of the
produced diffractive state with a nucleon. Numerically, σgeff is very large at Q20, see
Fig. 10, and corresponds to a probability for gluon-induced diffraction of close to ∼ 50%
at x ∼ 10−5 (see Fig. 44). Consequently at Q20, gluon interactions with nucleons
approach the BDR at x ∼ 10−4 − 10−5 while, for nuclei, a similar regime should hold
for x ≤ 10−3 over a large range of impact parameters.
The double scattering term in Eq. (12), proportional to σg eff , for the nuclear parton
densities satisfies QCD evolution, while higher-order terms (higher powers of σg eff) do
not. Thus if a different Q20 is used, a different g(x,Q2) would be obtained since the
higher-order terms, ∝ (σgeff)n, n ≥ 2 are sensitive to the Q2-dependent fluctuations in
the diffractive cross sections. The Q2 dependence of the fluctuations are included in the
QCD evolution, violating the Glauber-like structure of shadowing for Q2 > Q20. The
approximation for n ≥ 3 in Eq. (12) corresponds to the assumption that the fluctuations
are small atQ20 since this scale is close to the soft interaction scale [40]. Thus we use NLO
QCD evolution to calculate shadowing at larger Q2 using the Q20 result as a boundary
condition. We also include gluon enhancement at x ∼ 0.1 which influences shadowing at
larger Q2. The proximity to the BDR, reflected in large σg eff , may result in corrections
to the LT evolution.
0.1
0.2
0.3
0.4
0.5
0.6
0.7
0.8
0.9
1
1e-05 1e-04 0.001 0.01
σLT/σ
IA
x
A(γ,J/ψ)APb, H1 2006Pb, H1 1997Ca, H1 2006Ca, H1 1997
0.3
0.4
0.5
0.6
0.7
0.8
0.9
1
1e-05 1e-04 0.001 0.01
σLT/σ
IA
x
A(γ,Υ)APb, H1 2006Pb, H1 1997Ca, H1 2006Ca, H1 1997
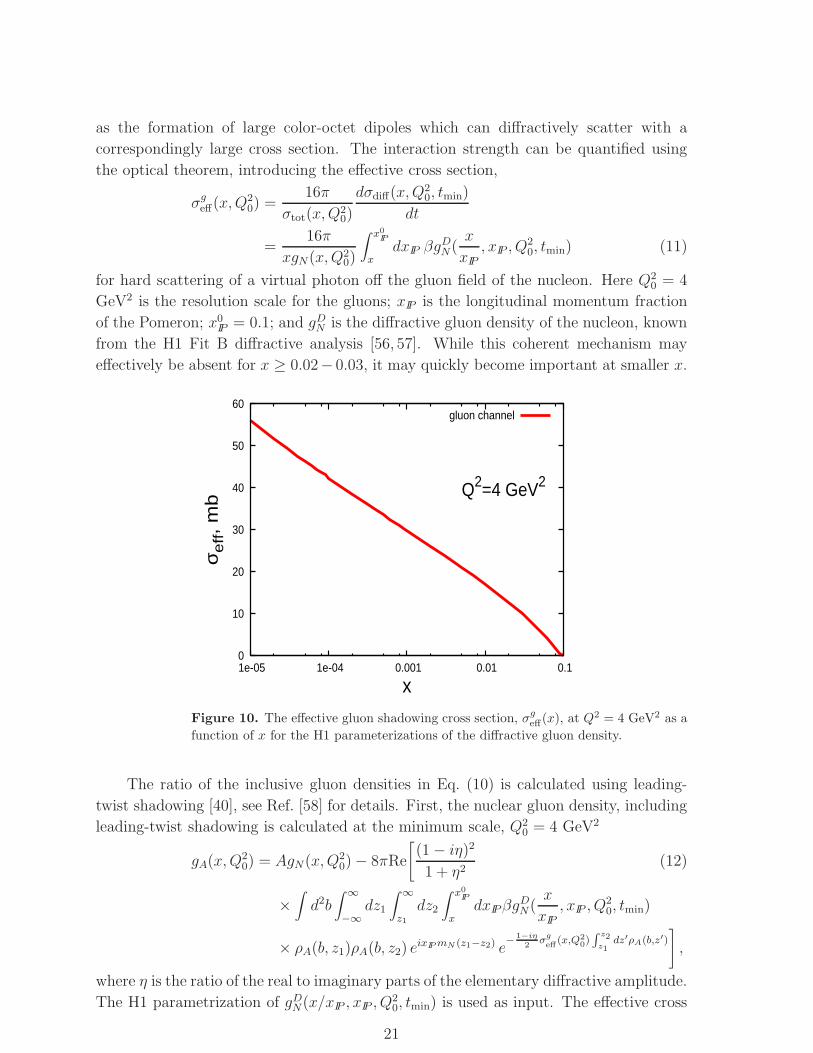
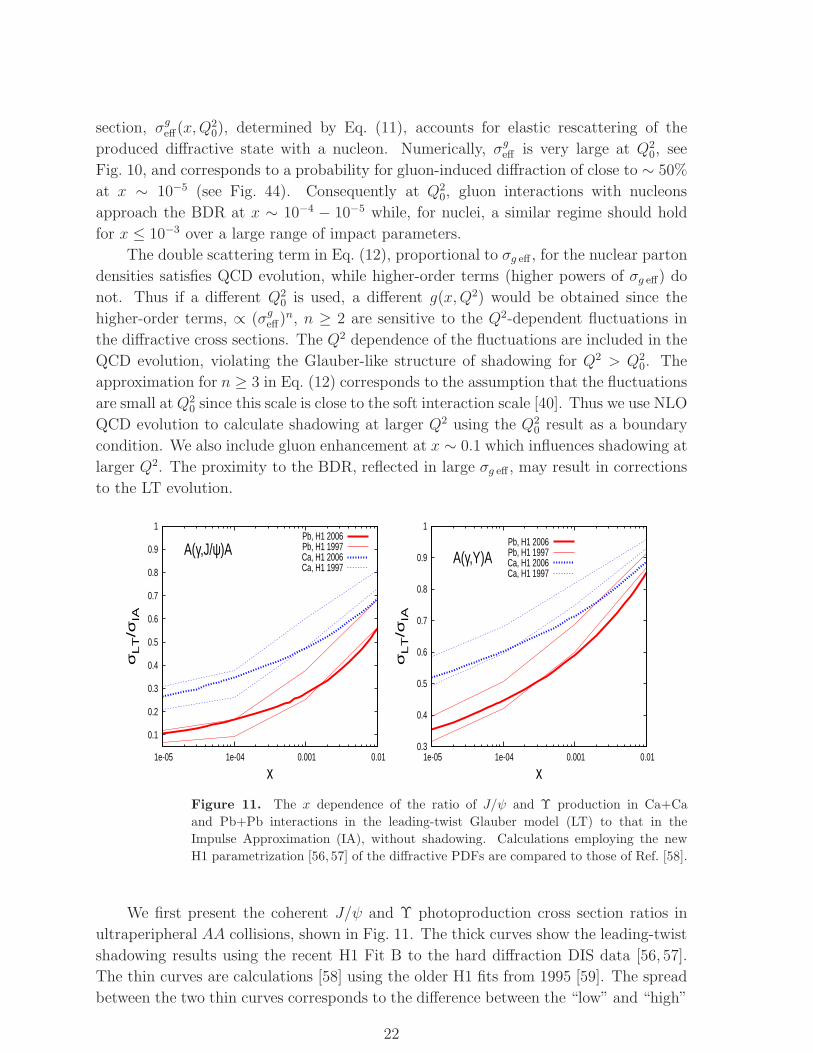
Figure 11. The x dependence of the ratio of J/ψ and Υ production in Ca+Ca
and Pb+Pb interactions in the leading-twist Glauber model (LT) to that in the
Impulse Approximation (IA), without shadowing. Calculations employing the new
H1 parametrization [56, 57] of the diffractive PDFs are compared to those of Ref. [58].
We first present the coherent J/ψ and Υ photoproduction cross section ratios in
ultraperipheral AA collisions, shown in Fig. 11. The thick curves show the leading-twist
shadowing results using the recent H1 Fit B to the hard diffraction DIS data [56, 57].
The thin curves are calculations [58] using the older H1 fits from 1995 [59]. The spread
between the two thin curves corresponds to the difference between the “low” and “high”
22
gluon shadowing scenarios introduced in Ref. [58].
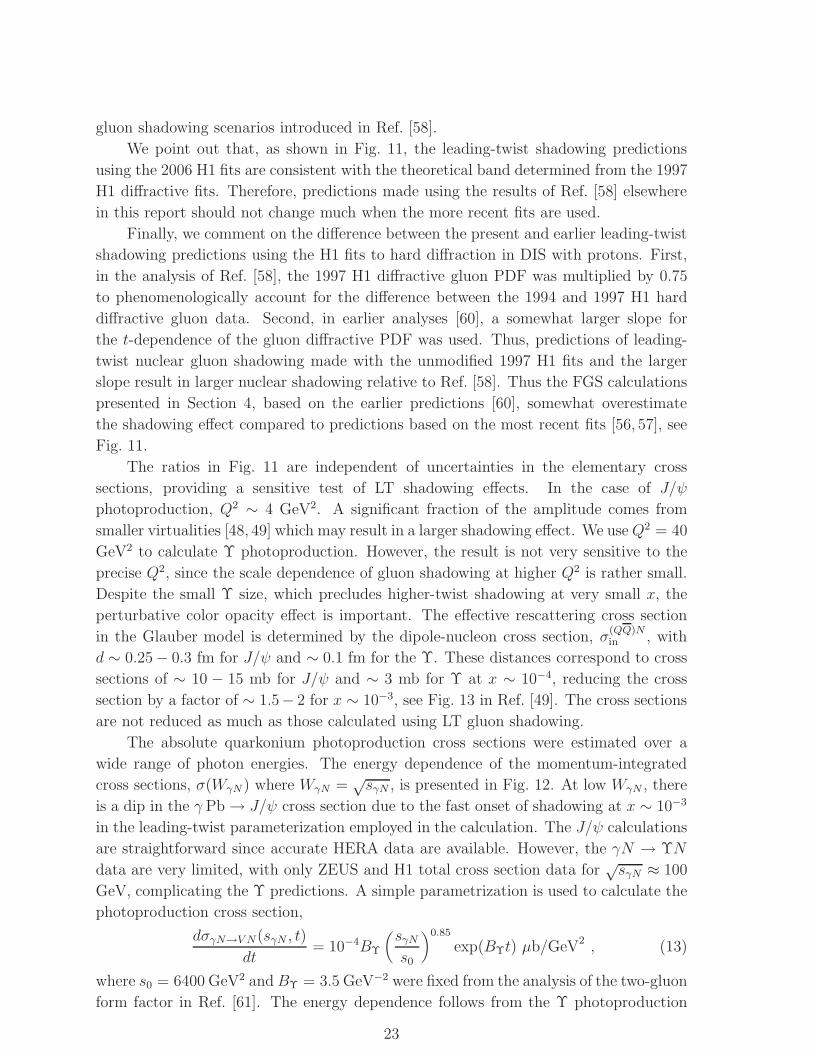
We point out that, as shown in Fig. 11, the leading-twist shadowing predictions
using the 2006 H1 fits are consistent with the theoretical band determined from the 1997
H1 diffractive fits. Therefore, predictions made using the results of Ref. [58] elsewhere
in this report should not change much when the more recent fits are used.
Finally, we comment on the difference between the present and earlier leading-twist
shadowing predictions using the H1 fits to hard diffraction in DIS with protons. First,
in the analysis of Ref. [58], the 1997 H1 diffractive gluon PDF was multiplied by 0.75
to phenomenologically account for the difference between the 1994 and 1997 H1 hard
diffractive gluon data. Second, in earlier analyses [60], a somewhat larger slope for
the t-dependence of the gluon diffractive PDF was used. Thus, predictions of leading-
twist nuclear gluon shadowing made with the unmodified 1997 H1 fits and the larger
slope result in larger nuclear shadowing relative to Ref. [58]. Thus the FGS calculations
presented in Section 4, based on the earlier predictions [60], somewhat overestimate
the shadowing effect compared to predictions based on the most recent fits [56, 57], see
Fig. 11.
The ratios in Fig. 11 are independent of uncertainties in the elementary cross
sections, providing a sensitive test of LT shadowing effects. In the case of J/ψ
photoproduction, Q2 ∼ 4 GeV2. A significant fraction of the amplitude comes from
smaller virtualities [48, 49] which may result in a larger shadowing effect. We useQ2 = 40
GeV2 to calculate Υ photoproduction. However, the result is not very sensitive to the
precise Q2, since the scale dependence of gluon shadowing at higher Q2 is rather small.
Despite the small Υ size, which precludes higher-twist shadowing at very small x, the
perturbative color opacity effect is important. The effective rescattering cross section
in the Glauber model is determined by the dipole-nucleon cross section, σ(QQ)Nin , with
d ∼ 0.25− 0.3 fm for J/ψ and ∼ 0.1 fm for the Υ. These distances correspond to cross
sections of ∼ 10 − 15 mb for J/ψ and ∼ 3 mb for Υ at x ∼ 10−4, reducing the cross
section by a factor of ∼ 1.5− 2 for x ∼ 10−3, see Fig. 13 in Ref. [49]. The cross sections
are not reduced as much as those calculated using LT gluon shadowing.
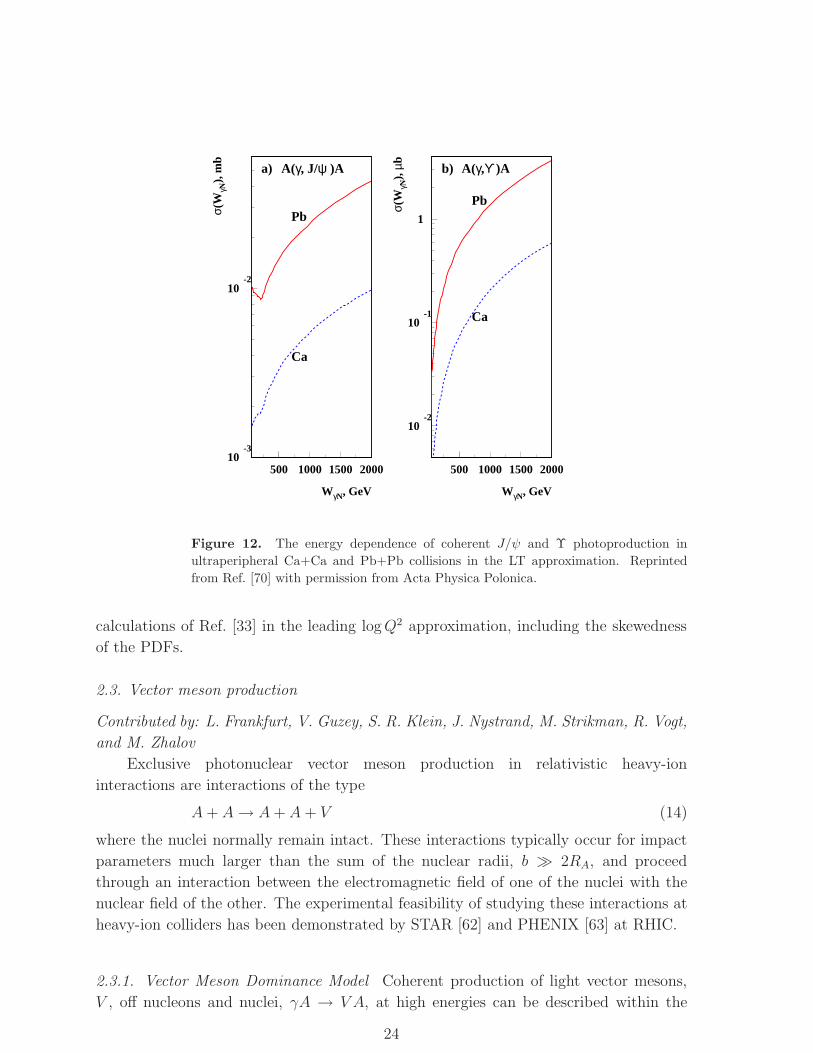
The absolute quarkonium photoproduction cross sections were estimated over a
wide range of photon energies. The energy dependence of the momentum-integrated
cross sections, σ(WγN ) where WγN =√sγN , is presented in Fig. 12. At low WγN , there
is a dip in the γ Pb → J/ψ cross section due to the fast onset of shadowing at x ∼ 10−3
in the leading-twist parameterization employed in the calculation. The J/ψ calculations
are straightforward since accurate HERA data are available. However, the γN → ΥN
data are very limited, with only ZEUS and H1 total cross section data for√sγN ≈ 100
GeV, complicating the Υ predictions. A simple parametrization is used to calculate the
photoproduction cross section,
dσγN→V N(sγN , t)
dt= 10−4BΥ
(sγNs0
)0.85
exp(BΥt) µb/GeV2 , (13)
where s0 = 6400 GeV2 andBΥ = 3.5 GeV−2 were fixed from the analysis of the two-gluon
form factor in Ref. [61]. The energy dependence follows from the Υ photoproduction
23
10-3
10-2
500 1000 1500 2000
WγN, GeV
σ(W
γN),
mb
10-2
10-1
1
500 1000 1500 2000
WγN, GeV
σ(W
γN),
µb
A(γ, J/ψ )A A(γ,ϒ )Aa) b)
Pb
Ca
Pb
Ca
Figure 12. The energy dependence of coherent J/ψ and Υ photoproduction in
ultraperipheral Ca+Ca and Pb+Pb collisions in the LT approximation. Reprinted
from Ref. [70] with permission from Acta Physica Polonica.
calculations of Ref. [33] in the leading logQ2 approximation, including the skewedness
of the PDFs.
2.3. Vector meson production
Contributed by: L. Frankfurt, V. Guzey, S. R. Klein, J. Nystrand, M. Strikman, R. Vogt,
and M. Zhalov
Exclusive photonuclear vector meson production in relativistic heavy-ion
interactions are interactions of the type
A+ A→ A+ A + V (14)
where the nuclei normally remain intact. These interactions typically occur for impact
parameters much larger than the sum of the nuclear radii, b ≫ 2RA, and proceed
through an interaction between the electromagnetic field of one of the nuclei with the
nuclear field of the other. The experimental feasibility of studying these interactions at
heavy-ion colliders has been demonstrated by STAR [62] and PHENIX [63] at RHIC.
2.3.1. Vector Meson Dominance Model Coherent production of light vector mesons,
V , off nucleons and nuclei, γA → V A, at high energies can be described within the
24
framework of the Vector Meson Dominance Model (VDM) or the Generalized Vector
Meson Dominance Model (GVDM) [64, 65] reviewed in Refs. [66–68].
At low and moderate energies, the hadronic interaction of a low-virtuality photon
is dominated by quantum mechanical fluctuations into a strongly interacting state,
preferentially a vector meson, with the quantum numbers of the photon, JPC = 1−−.
The photon wavefunction can be written as a sum of Fock states,
|γ〉 = Cpure|γpure〉+Cρ0 |ρ0〉+Cω|ω〉+Cφ|φ〉+CJ/ψ|J/ψ〉+· · ·+Cqq|qq〉 ,(15)
where |γpure〉 corresponds to a bare photon which may interact with a parton in the
target, Cpure ≈ 1. The amplitude, CV , for the photon to fluctuate into vector meson V
is proportional to the inverse of the photon-vector meson coupling, fV . This coupling
can be related to the measured dilepton decay width, ΓV→e+e−,
|CV |2 =4πα
f 2V
=3 ΓV→e+e−
α2MV, (16)
where α is the electromagnetic coupling constant and MV the vector meson mass.
The VDM neglects contributions from non-diagonal transitions, i.e. 〈ρ0|ω〉 = 0.
The GVDM includes these non-diagonal transitions. In such transitions, the photon
fluctuates into a different hadronic state from the observed final-state vector meson.
The observed final state is produced by hadronic rescattering, V ′A → V A where V ′ is
the initially-produced vector meson and V the final-state meson.
Squaring Eq. (15) and assuming the diagonal approximation of the VDM, the
differential photoproduction cross section, dσγA→V A/dt, calculated using the Glauber
scattering model, is
dσγA→V Adt
=dσγN→V N
dt
∣∣∣∣∣t=0
×
∣∣∣∣∣∣∣
∫d2b dz ei~qT ·
~beiqLzρA(b, z)e− 1
2σV Ntot (1−iǫ)
∞∫z
dz′ ρA(b,z′)
∣∣∣∣∣∣∣
2
. (17)
The square of the transverse momentum transfer in the γ → V transition, |~qT | 2 =
|tT | = |tmin − t|, depends on the photon energy, ω, through tmin since −tmin = M4V /4ω
2.
The ratio of the real to imaginary parts of the vector meson scattering amplitude is
denoted ǫ in Eq. (17).
The longitudinal momentum transfer, qL, reflects the large longitudinal distances
over which the transition γ → V occurs. The hadronic fluctuation extends over distance
lc, the coherence length, restricted by the uncertainty principle so that
lc = 1/qL = ∆tc =hc
∆E=
hc
EV − Eγ=
2EγM2
V +Q2hc , (18)
where EV is the vector meson energy while Eγ and Q are the energy and virtuality
of the photon, respectively. In the limit where the coherence length is much larger
than the nuclear radius, lc ≫ RA, Eq. (17) is reduced to the usual Glauber expression
for elastic hadron-nucleus scattering by making the substitutions (dσγN→V N/dt)|t=0 →(dσV N→V N/dt)|t=0 and (dσγA→V A/dt) → (dσV A→V A/dt).
25
In the nuclear rest frame, for light vector meson production at midrapidity the limit
lc ≫ RA holds at RHIC and LHC so that
dσγA→V Adt
= |CV |2dσV A→V A
dt. (19)
The exclusive photo-nuclear scattering amplitude is thus proportional to the amplitude
for elastic vector meson scattering. If two vector meson states, V and V ′, contribute
then non-diagonal transitions, V ′A → V A, have to be considered in GVDM [69]. The
more general expression for the scattering amplitude,
MγA→V A = CV MV A→V A + CV ′ MV ′A→V A , (20)
is then needed.
The t-dependence of the differential cross section for coherent elastic scattering off
a heavy nucleus is primarily determined by the nuclear form factor, F (t),
dσγA→V Adt
= |F (t)|2dσγA→V Adt
∣∣∣∣∣t=0
, (21)
where F (t) is the Fourier transform of the nuclear density distribution The elastic cross
section at t = 0 is related to the total cross section, σtot, by the optical theorem,
dσV A→V Adt
∣∣∣∣∣t=0
=σ2
tot
16π
(1 + ǫ2
). (22)
The GVDM describes all available data at intermediate energies, see e.g. Fig. 13
from Ref. [70]. Hence vector meson production is very useful for checking the basic
approximations of UPC theory.
2.3.2. Cross sections in heavy-ion colliders The first calculations of exclusive vector
meson production at heavy-ion colliders were made in Ref. [72]. The model is briefly
described here. The total photo-nuclear cross section is the convolution of the photon
flux with the differential photo-nuclear cross section, integrated over the photon energy,
σAA→AAV =∫ ∞
0dk
dNγ(k)
dk
dσγA→V Adt
∣∣∣∣t=0
∫ ∞
−tmin
dt |F (t)|2 . (23)
Here −tmin = (M2V /2k)
2 is the minimum momentum transfer squared needed to produce
a vector meson of mass MV . The nuclear form factor, F (t), is significant only for
|t| < (hc/RA)2. Thus only photons with k > M2VRA/2hc can contribute to coherent
production.
The expression for dNγ/dk in Eq. (6) corresponds to the photon flux at the center
of the target nucleus, r = b. The flux on the target surface will be higher near the
photon-emitting projectile, b − RA < r < b and lower further away, b < r < b + RA.
In coherent interactions, where the fields couple to the entire nucleus or at least to
the entire nuclear surface, a better estimate of the total flux is obtained by taking the
average over the target surface
dNγ(k)
dk= 2π
∫ ∞
2RA
db b∫ R
0
dr r
πR2A
∫ 2π
0dφ
d3Nγ(k, b+ r cos φ)
dkd2r. (24)
26
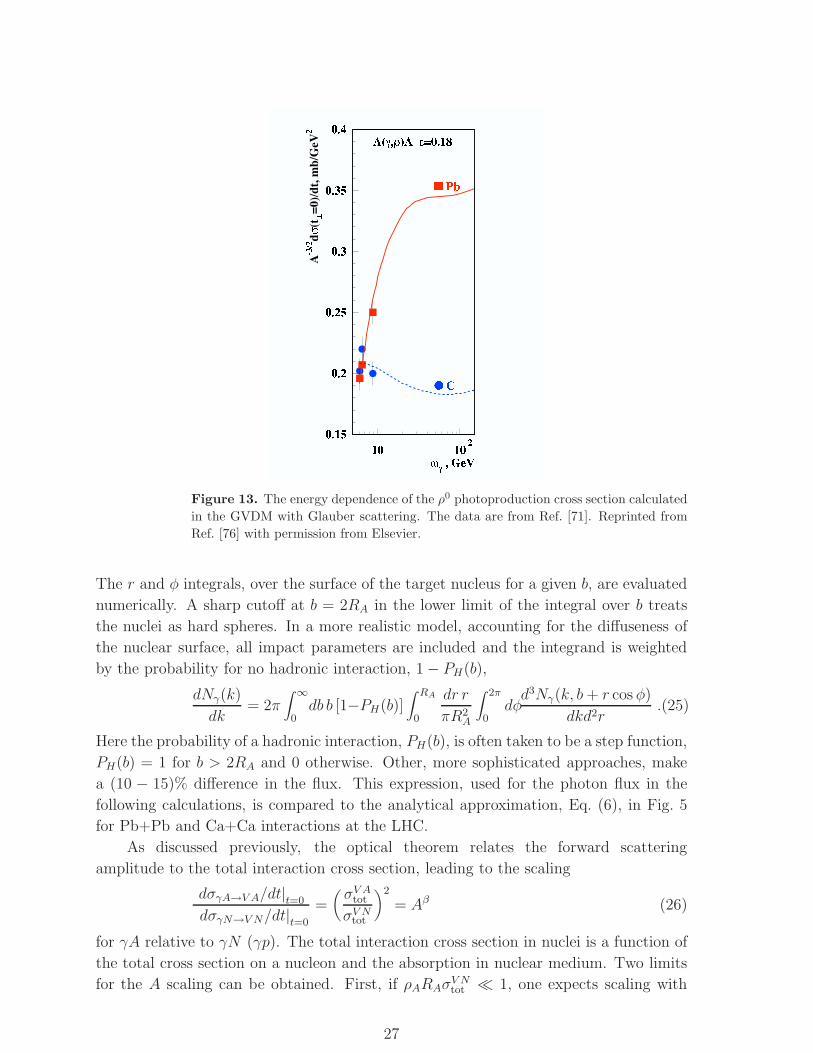
ρ ρ ′ ρ
σγ →
σ∣∣∣∣ γ →
σ
σ∣∣∣∣ →
σ
π
(ǫ)
Figure 13. The energy dependence of the ρ0 photoproduction cross section calculated
in the GVDM with Glauber scattering. The data are from Ref. [71]. Reprinted from
Ref. [76] with permission from Elsevier.
The r and φ integrals, over the surface of the target nucleus for a given b, are evaluated
numerically. A sharp cutoff at b = 2RA in the lower limit of the integral over b treats
the nuclei as hard spheres. In a more realistic model, accounting for the diffuseness of
the nuclear surface, all impact parameters are included and the integrand is weighted
by the probability for no hadronic interaction, 1 − PH(b),
dNγ(k)
dk= 2π
∫ ∞
0db b [1−PH(b)]
∫ RA
0
dr r
πR2A
∫ 2π
0dφd3Nγ(k, b+ r cos φ)
dkd2r.(25)
Here the probability of a hadronic interaction, PH(b), is often taken to be a step function,
PH(b) = 1 for b > 2RA and 0 otherwise. Other, more sophisticated approaches, make
a (10 − 15)% difference in the flux. This expression, used for the photon flux in the
following calculations, is compared to the analytical approximation, Eq. (6), in Fig. 5
for Pb+Pb and Ca+Ca interactions at the LHC.
As discussed previously, the optical theorem relates the forward scattering
amplitude to the total interaction cross section, leading to the scaling
dσγA→V A/dt|t=0
dσγN→V N/dt|t=0
=(σV Atot
σV Ntot
)2
= Aβ (26)
for γA relative to γN (γp). The total interaction cross section in nuclei is a function of
the total cross section on a nucleon and the absorption in nuclear medium. Two limits
for the A scaling can be obtained. First, if ρARAσV Ntot ≪ 1, one expects scaling with
27
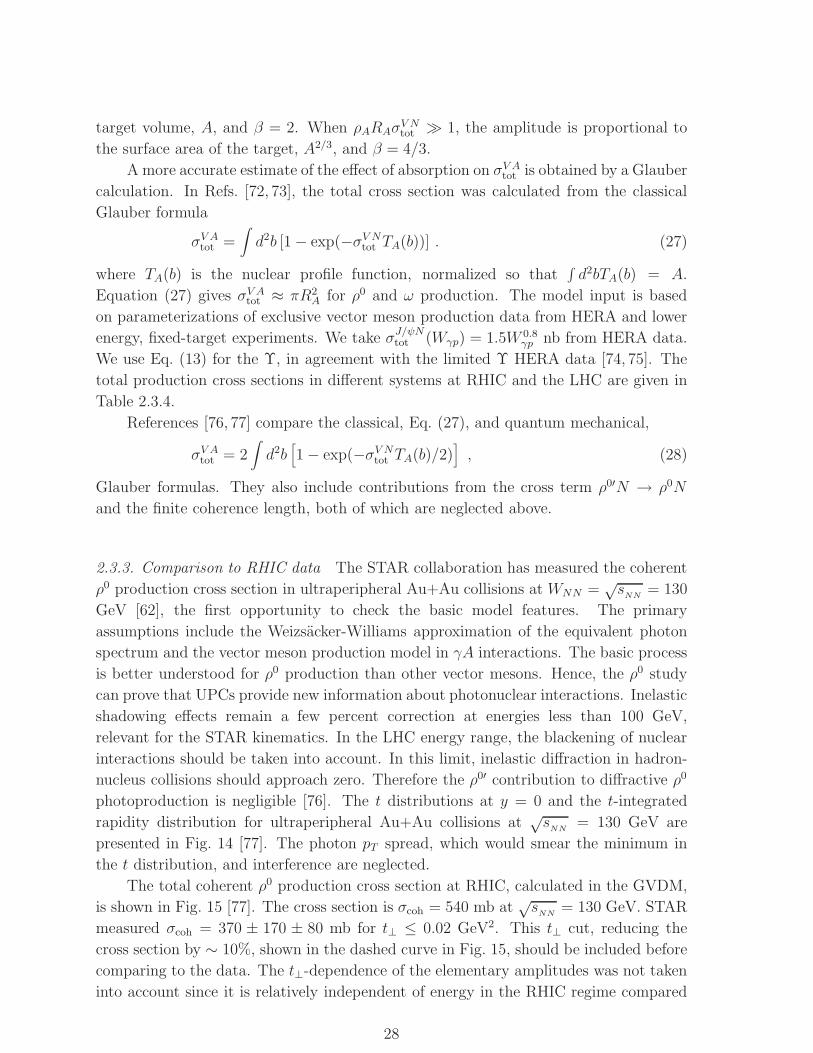
target volume, A, and β = 2. When ρARAσV Ntot ≫ 1, the amplitude is proportional to
the surface area of the target, A2/3, and β = 4/3.
A more accurate estimate of the effect of absorption on σV Atot is obtained by a Glauber
calculation. In Refs. [72, 73], the total cross section was calculated from the classical
Glauber formula
σV Atot =∫d2b [1 − exp(−σV Ntot TA(b))] . (27)
where TA(b) is the nuclear profile function, normalized so that∫d2bTA(b) = A.
Equation (27) gives σV Atot ≈ πR2A for ρ0 and ω production. The model input is based
on parameterizations of exclusive vector meson production data from HERA and lower
energy, fixed-target experiments. We take σJ/ψNtot (Wγp) = 1.5W 0.8
γp nb from HERA data.
We use Eq. (13) for the Υ, in agreement with the limited Υ HERA data [74, 75]. The
total production cross sections in different systems at RHIC and the LHC are given in
Table 2.3.4.
References [76, 77] compare the classical, Eq. (27), and quantum mechanical,
σV Atot = 2∫d2b
[1 − exp(−σV Ntot TA(b)/2)
], (28)
Glauber formulas. They also include contributions from the cross term ρ0′N → ρ0N
and the finite coherence length, both of which are neglected above.
2.3.3. Comparison to RHIC data The STAR collaboration has measured the coherent
ρ0 production cross section in ultraperipheral Au+Au collisions at WNN =√s
NN= 130
GeV [62], the first opportunity to check the basic model features. The primary
assumptions include the Weizsacker-Williams approximation of the equivalent photon
spectrum and the vector meson production model in γA interactions. The basic process
is better understood for ρ0 production than other vector mesons. Hence, the ρ0 study
can prove that UPCs provide new information about photonuclear interactions. Inelastic
shadowing effects remain a few percent correction at energies less than 100 GeV,
relevant for the STAR kinematics. In the LHC energy range, the blackening of nuclear
interactions should be taken into account. In this limit, inelastic diffraction in hadron-
nucleus collisions should approach zero. Therefore the ρ0′ contribution to diffractive ρ0
photoproduction is negligible [76]. The t distributions at y = 0 and the t-integrated
rapidity distribution for ultraperipheral Au+Au collisions at√s
NN= 130 GeV are
presented in Fig. 14 [77]. The photon pT spread, which would smear the minimum in
the t distribution, and interference are neglected.
The total coherent ρ0 production cross section at RHIC, calculated in the GVDM,
is shown in Fig. 15 [77]. The cross section is σcoh = 540 mb at√s
NN= 130 GeV. STAR
measured σcoh = 370 ± 170 ± 80 mb for t⊥ ≤ 0.02 GeV2. This t⊥ cut, reducing the
cross section by ∼ 10%, shown in the dashed curve in Fig. 15, should be included before
comparing to the data. The t⊥-dependence of the elementary amplitudes was not taken
into account since it is relatively independent of energy in the RHIC regime compared
28
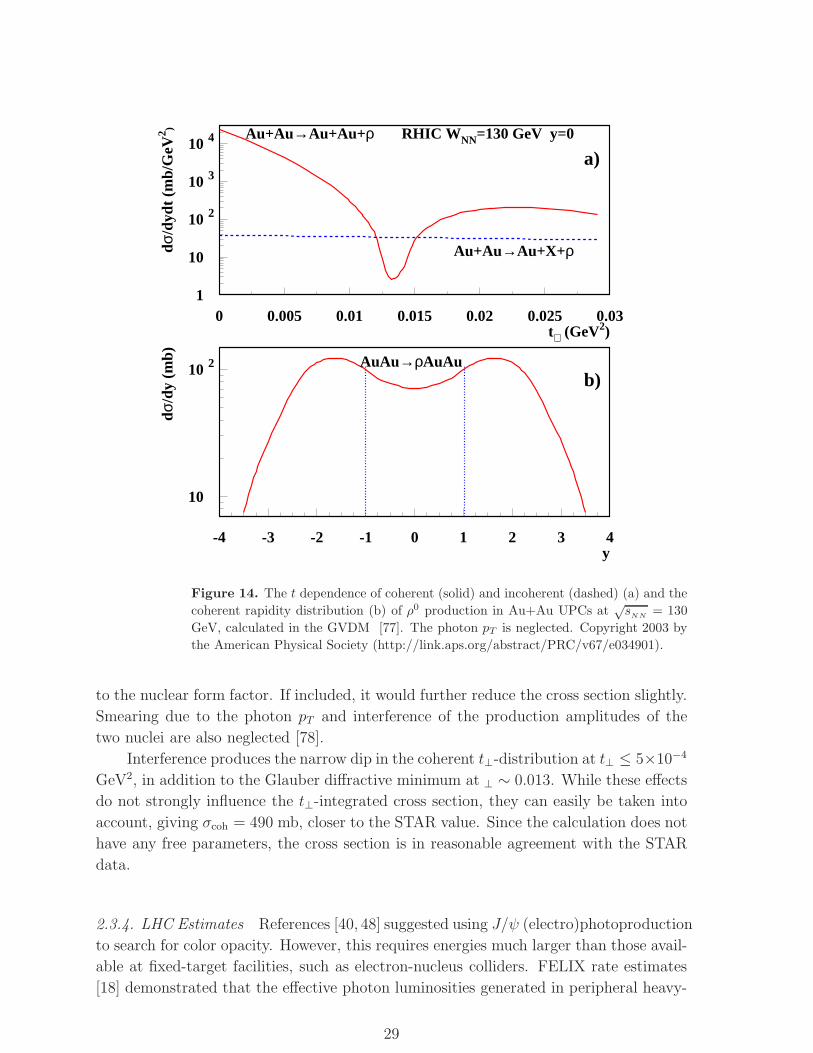
1
10
10 2
10 3
10 4
0 0.005 0.01 0.015 0.02 0.025 0.03t⊥ (GeV2)
dσ/d
ydt
(mb/
GeV
2 )
10
10 2
-4 -3 -2 -1 0 1 2 3 4y
dσ/d
y (m
b)
Au+Au→Au+Au+ρ
Au+Au→Au+X+ρ
RHIC WNN=130 GeV y=0
AuAu→ρAuAu
a)
b)
Figure 14. The t dependence of coherent (solid) and incoherent (dashed) (a) and the
coherent rapidity distribution (b) of ρ0 production in Au+Au UPCs at√s
NN= 130
GeV, calculated in the GVDM [77]. The photon pT is neglected. Copyright 2003 by
the American Physical Society (http://link.aps.org/abstract/PRC/v67/e034901).
to the nuclear form factor. If included, it would further reduce the cross section slightly.
Smearing due to the photon pT and interference of the production amplitudes of the
two nuclei are also neglected [78].
Interference produces the narrow dip in the coherent t⊥-distribution at t⊥ ≤ 5×10⁻⁴
GeV2, in addition to the Glauber diffractive minimum at ⊥ ∼ 0.013. While these effects
do not strongly influence the t⊥-integrated cross section, they can easily be taken into
account, giving σcoh = 490 mb, closer to the STAR value. Since the calculation does not
have any free parameters, the cross section is in reasonable agreement with the STAR
data.
2.3.4. LHC Estimates References [40, 48] suggested using J/ψ (electro)photoproduction
to search for color opacity. However, this requires energies much larger than those avail-
able at fixed-target facilities, such as electron-nucleus colliders. FELIX rate estimates
[18] demonstrated that the effective photon luminosities generated in peripheral heavy-
29
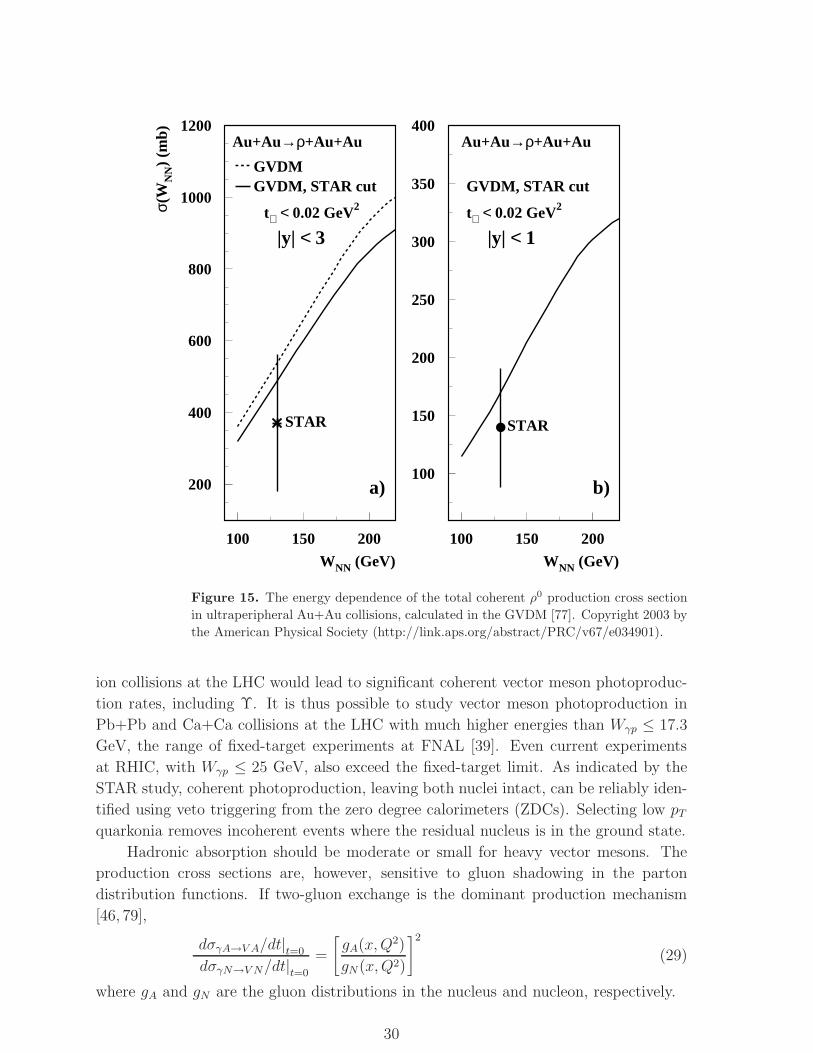
200
400
600
800
1000
1200
100 150 200
WNN (GeV)
σ(W
NN
) (m
b)
100
150
200
250
300
350
400
100 150 200
WNN (GeV)
GVDM, STAR cut
t⊥ < 0.02 GeV2
STAR
Au+Au→ρ+Au+Au
|y| < 3
Au+Au→ρ+Au+Au
GVDM, STAR cut
t⊥ < 0.02 GeV2
STAR
|y| < 1
GVDM
a) b)
Figure 15. The energy dependence of the total coherent ρ0 production cross section
in ultraperipheral Au+Au collisions, calculated in the GVDM [77]. Copyright 2003 by
the American Physical Society (http://link.aps.org/abstract/PRC/v67/e034901).
ion collisions at the LHC would lead to significant coherent vector meson photoproduc-
tion rates, including Υ. It is thus possible to study vector meson photoproduction in
Pb+Pb and Ca+Ca collisions at the LHC with much higher energies than Wγp ≤ 17.3
GeV, the range of fixed-target experiments at FNAL [39]. Even current experiments
at RHIC, with Wγp ≤ 25 GeV, also exceed the fixed-target limit. As indicated by the
STAR study, coherent photoproduction, leaving both nuclei intact, can be reliably iden-
tified using veto triggering from the zero degree calorimeters (ZDCs). Selecting low pTquarkonia removes incoherent events where the residual nucleus is in the ground state.
Hadronic absorption should be moderate or small for heavy vector mesons. The
production cross sections are, however, sensitive to gluon shadowing in the parton
distribution functions. If two-gluon exchange is the dominant production mechanism
[46, 79],
dσγA→V A/dt|t=0
dσγN→V N/dt|t=0
=
[gA(x,Q2)
gN(x,Q2)
]2
(29)
where gA and gN are the gluon distributions in the nucleus and nucleon, respectively.
30
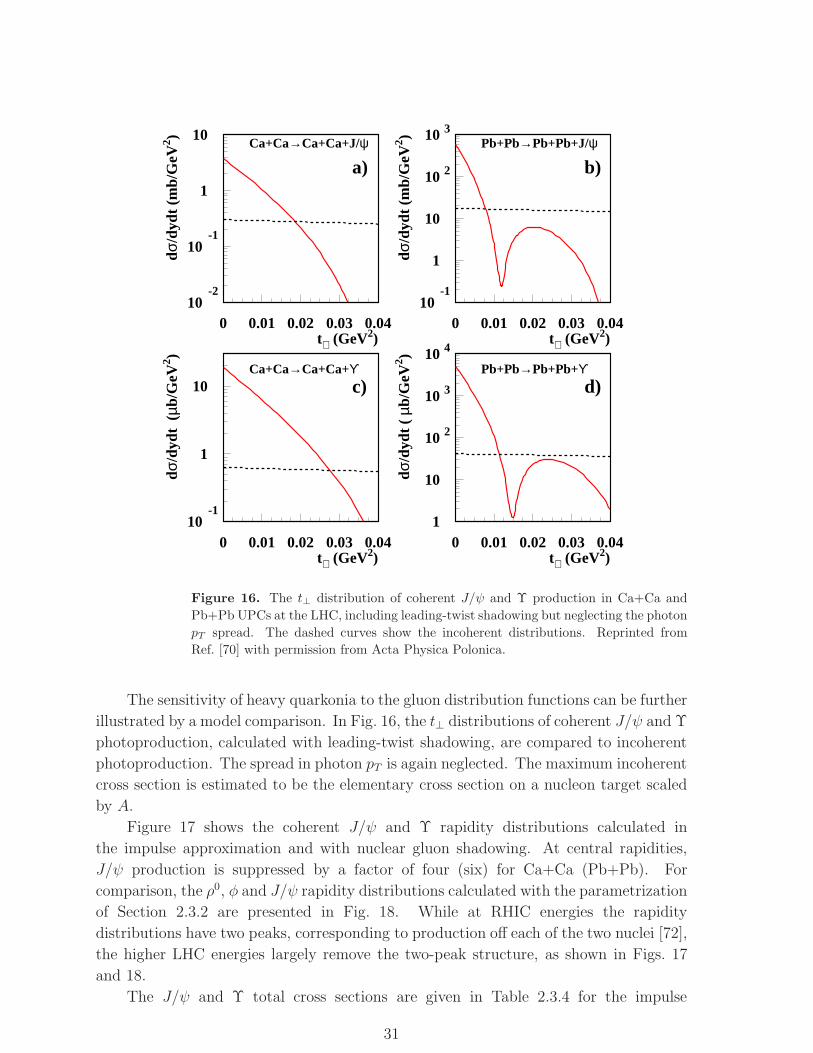
10-2
10-1
1
10
0 0.01 0.02 0.03 0.04t⊥ (GeV2)
dσ/d
ydt
(mb/
GeV
2 )
10-1
1
10
10 2
10 3
0 0.01 0.02 0.03 0.04t⊥ (GeV2)
dσ/d
ydt
(mb/
GeV
2 )
10-1
1
10
0 0.01 0.02 0.03 0.04t⊥ (GeV2)
dσ/d
ydt
(µb
/GeV
2 )
1
10
10 2
10 3
10 4
0 0.01 0.02 0.03 0.04t⊥ (GeV2)
dσ/d
ydt
( µb
/GeV
2 )
Ca+Ca→Ca+Ca+J/ψ Pb+Pb→Pb+Pb+J/ψ
Ca+Ca→Ca+Ca+ϒ Pb+Pb→Pb+Pb+ϒ
b)
d)
a)
c)
Figure 16. The t⊥ distribution of coherent J/ψ and Υ production in Ca+Ca and
Pb+Pb UPCs at the LHC, including leading-twist shadowing but neglecting the photon
pT spread. The dashed curves show the incoherent distributions. Reprinted from
Ref. [70] with permission from Acta Physica Polonica.
The sensitivity of heavy quarkonia to the gluon distribution functions can be further
illustrated by a model comparison. In Fig. 16, the t⊥ distributions of coherent J/ψ and Υ
photoproduction, calculated with leading-twist shadowing, are compared to incoherent
photoproduction. The spread in photon pT is again neglected. The maximum incoherent
cross section is estimated to be the elementary cross section on a nucleon target scaled
by A.
Figure 17 shows the coherent J/ψ and Υ rapidity distributions calculated in
the impulse approximation and with nuclear gluon shadowing. At central rapidities,
J/ψ production is suppressed by a factor of four (six) for Ca+Ca (Pb+Pb). For
comparison, the ρ0, φ and J/ψ rapidity distributions calculated with the parametrization
of Section 2.3.2 are presented in Fig. 18. While at RHIC energies the rapidity
distributions have two peaks, corresponding to production off each of the two nuclei [72],
the higher LHC energies largely remove the two-peak structure, as shown in Figs. 17
and 18.
The J/ψ and Υ total cross sections are given in Table 2.3.4 for the impulse
31
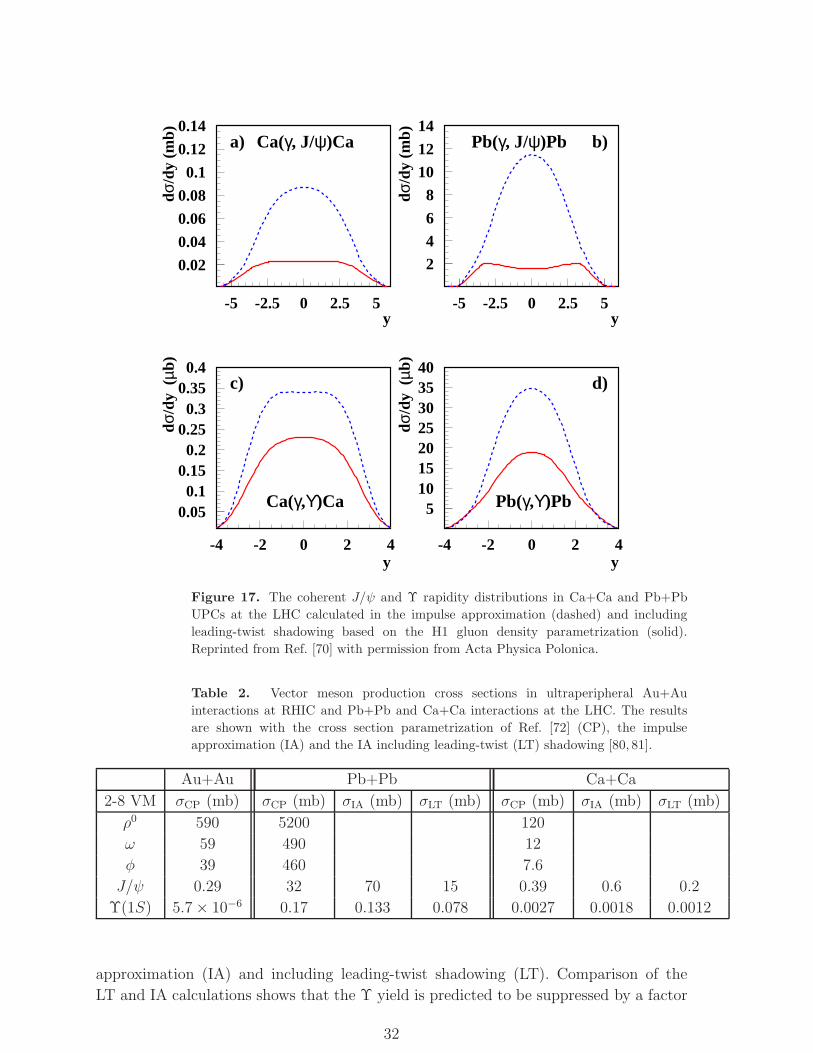
0.02
0.04
0.06
0.08
0.1
0.12
0.14
-5 -2.5 0 2.5 5y
dσ/d
y (m
b)
2
4
6
8
10
12
14
-5 -2.5 0 2.5 5y
dσ/d
y (m
b)
0.050.1
0.150.2
0.250.3
0.350.4
-4 -2 0 2 4y
dσ/d
y (
µb)
510152025303540
-4 -2 0 2 4y
dσ/d
y (
µb)
Ca(γ, J/ψ)Ca Pb(γ, J/ψ)Pb
Ca(γ,ϒ)Ca Pb(γ,ϒ)Pb
a) b)
c) d)
Figure 17. The coherent J/ψ and Υ rapidity distributions in Ca+Ca and Pb+Pb
UPCs at the LHC calculated in the impulse approximation (dashed) and including
leading-twist shadowing based on the H1 gluon density parametrization (solid).
Reprinted from Ref. [70] with permission from Acta Physica Polonica.
Table 2. Vector meson production cross sections in ultraperipheral Au+Au
interactions at RHIC and Pb+Pb and Ca+Ca interactions at the LHC. The results
are shown with the cross section parametrization of Ref. [72] (CP), the impulse
approximation (IA) and the IA including leading-twist (LT) shadowing [80, 81].
Au+Au Pb+Pb Ca+Ca
2-8 VM σCP (mb) σCP (mb) σIA (mb) σLT (mb) σCP (mb) σIA (mb) σLT (mb)
ρ0 590 5200 120
ω 59 490 12
φ 39 460 7.6
J/ψ 0.29 32 70 15 0.39 0.6 0.2
Υ(1S) 5.7 × 10⁻⁶ 0.17 0.133 0.078 0.0027 0.0018 0.0012
approximation (IA) and including leading-twist shadowing (LT). Comparison of the
LT and IA calculations shows that the Υ yield is predicted to be suppressed by a factor
32
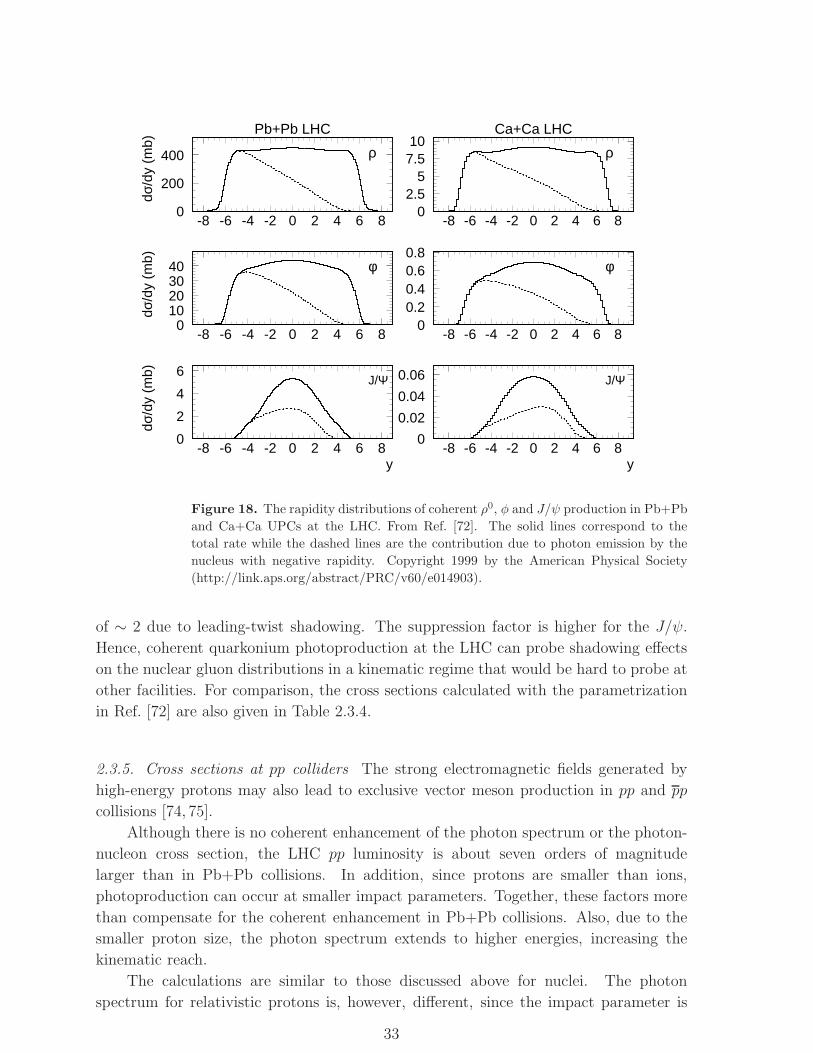
dσ/d
y (m
b)Pb+Pb LHC
ρ
φ
dσ/d
y (m
b)
J/Ψ
y
dσ/d
y (m
b)Ca+Ca LHC
ρ
φ
J/Ψ
y
0
200
400
-8 -6 -4 -2 0 2 4 6 8
010203040
-8 -6 -4 -2 0 2 4 6 8
0
2
4
6
-8 -6 -4 -2 0 2 4 6 8
02.5
57.510
-8 -6 -4 -2 0 2 4 6 8
00.20.40.60.8
-8 -6 -4 -2 0 2 4 6 8
0
0.02
0.04
0.06
-8 -6 -4 -2 0 2 4 6 8
Figure 18. The rapidity distributions of coherent ρ0, φ and J/ψ production in Pb+Pb
and Ca+Ca UPCs at the LHC. From Ref. [72]. The solid lines correspond to the
total rate while the dashed lines are the contribution due to photon emission by the
nucleus with negative rapidity. Copyright 1999 by the American Physical Society
(http://link.aps.org/abstract/PRC/v60/e014903).
of ∼ 2 due to leading-twist shadowing. The suppression factor is higher for the J/ψ.
Hence, coherent quarkonium photoproduction at the LHC can probe shadowing effects
on the nuclear gluon distributions in a kinematic regime that would be hard to probe at
other facilities. For comparison, the cross sections calculated with the parametrization
in Ref. [72] are also given in Table 2.3.4.
2.3.5. Cross sections at pp colliders The strong electromagnetic fields generated by
high-energy protons may also lead to exclusive vector meson production in pp and pp
collisions [74, 75].
Although there is no coherent enhancement of the photon spectrum or the photon-
nucleon cross section, the LHC pp luminosity is about seven orders of magnitude
larger than in Pb+Pb collisions. In addition, since protons are smaller than ions,
photoproduction can occur at smaller impact parameters. Together, these factors more
than compensate for the coherent enhancement in Pb+Pb collisions. Also, due to the
smaller proton size, the photon spectrum extends to higher energies, increasing the
kinematic reach.
The calculations are similar to those discussed above for nuclei. The photon
spectrum for relativistic protons is, however, different, since the impact parameter is
33
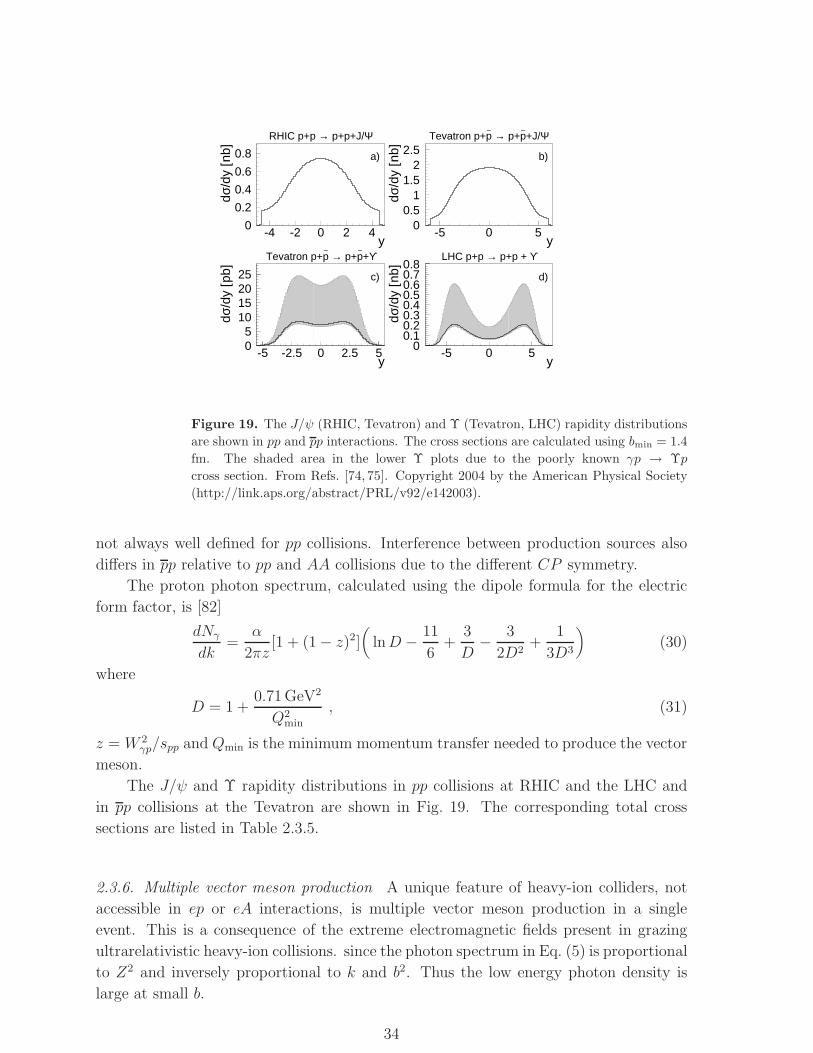
ydσ
/dy
[nb]
RHIC p+p → p+p+J/Ψ
a)
y
dσ/d
y [n
b]
Tevatron p+p– → p+p
–+J/Ψ
b)
y
dσ/d
y [p
b]
Tevatron p+p– → p+p
–+ϒ
c)
y
dσ/d
y [n
b]
LHC p+p → p+p + ϒ
d)
0
0.2
0.4
0.6
0.8
-4 -2 0 2 40
0.51
1.52
2.5
-5 0 5
05
10152025
-5 -2.5 0 2.5 50
0.10.20.30.40.50.60.70.8
-5 0 5
Figure 19. The J/ψ (RHIC, Tevatron) and Υ (Tevatron, LHC) rapidity distributions
are shown in pp and pp interactions. The cross sections are calculated using bmin = 1.4
fm. The shaded area in the lower Υ plots due to the poorly known γp → Υp
cross section. From Refs. [74, 75]. Copyright 2004 by the American Physical Society
(http://link.aps.org/abstract/PRL/v92/e142003).
not always well defined for pp collisions. Interference between production sources also
differs in pp relative to pp and AA collisions due to the different CP symmetry.
The proton photon spectrum, calculated using the dipole formula for the electric
form factor, is [82]
dNγ
dk=
α
2πz[1 + (1 − z)2]
(lnD − 11
6+
3
D− 3
2D2+
1
3D3
)(30)
where
D = 1 +0.71 GeV2
Q2min
, (31)
z = W 2γp/spp and Qmin is the minimum momentum transfer needed to produce the vector
meson.
The J/ψ and Υ rapidity distributions in pp collisions at RHIC and the LHC and
in pp collisions at the Tevatron are shown in Fig. 19. The corresponding total cross
sections are listed in Table 2.3.5.
2.3.6. Multiple vector meson production A unique feature of heavy-ion colliders, not
accessible in ep or eA interactions, is multiple vector meson production in a single
event. This is a consequence of the extreme electromagnetic fields present in grazing
ultrarelativistic heavy-ion collisions. since the photon spectrum in Eq. (5) is proportional
to Z2 and inversely proportional to k and b2. Thus the low energy photon density is
large at small b.
34
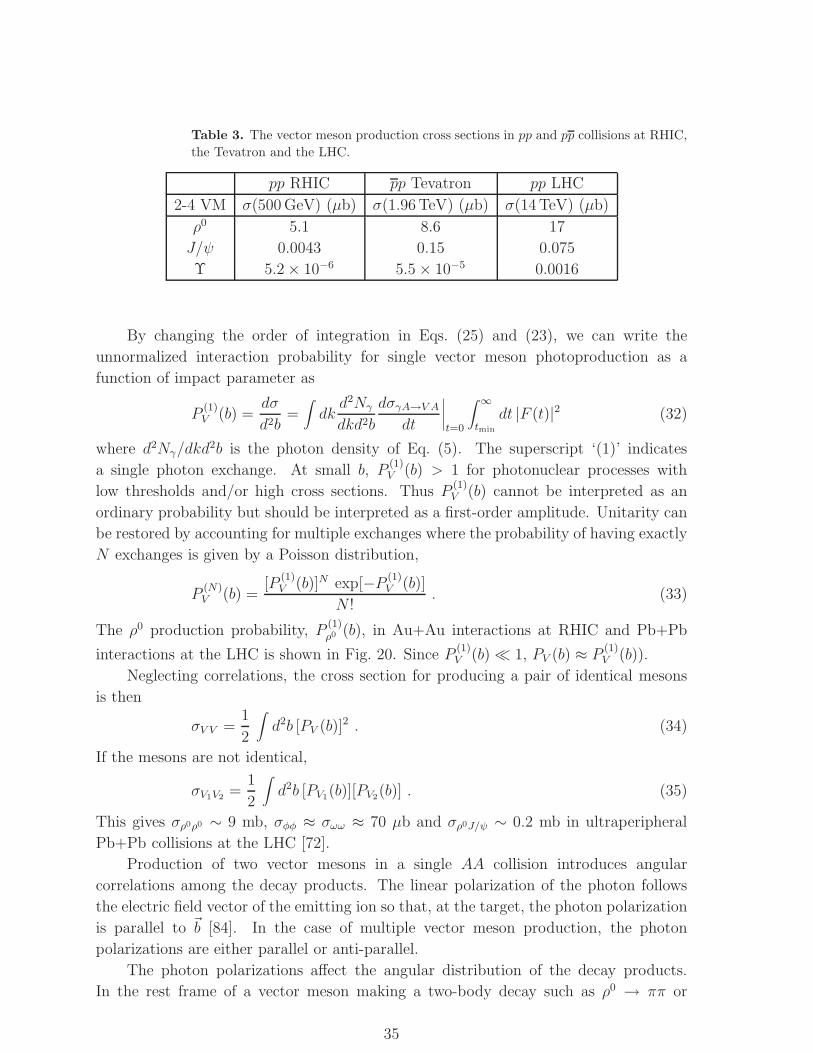
Table 3. The vector meson production cross sections in pp and pp collisions at RHIC,
the Tevatron and the LHC.
pp RHIC pp Tevatron pp LHC
2-4 VM σ(500 GeV) (µb) σ(1.96 TeV) (µb) σ(14 TeV) (µb)
ρ0 5.1 8.6 17
J/ψ 0.0043 0.15 0.075
Υ 5.2 × 10⁻⁶ 5.5 × 10⁻⁵ 0.0016
By changing the order of integration in Eqs. (25) and (23), we can write the
unnormalized interaction probability for single vector meson photoproduction as a
function of impact parameter as
P(1)V (b) =
dσ
d2b=∫dk
d2Nγ
dkd2b
dσγA→V Adt
∣∣∣∣t=0
∫ ∞
tmin
dt |F (t)|2 (32)
where d2Nγ/dkd2b is the photon density of Eq. (5). The superscript ‘(1)’ indicates
a single photon exchange. At small b, P(1)V (b) > 1 for photonuclear processes with
low thresholds and/or high cross sections. Thus P(1)V (b) cannot be interpreted as an
ordinary probability but should be interpreted as a first-order amplitude. Unitarity can
be restored by accounting for multiple exchanges where the probability of having exactly
N exchanges is given by a Poisson distribution,
P(N)V (b) =
[P(1)V (b)]N exp[−P (1)
V (b)]
N !. (33)
The ρ0 production probability, P(1)ρ0 (b), in Au+Au interactions at RHIC and Pb+Pb
interactions at the LHC is shown in Fig. 20. Since P(1)V (b) ≪ 1, PV (b) ≈ P
(1)V (b)).
Neglecting correlations, the cross section for producing a pair of identical mesons
is then
σV V =1
2
∫d2b [PV (b)]2 . (34)
If the mesons are not identical,
σV1V2=
1
2
∫d2b [PV1
(b)][PV2(b)] . (35)
This gives σρ0ρ0 ∼ 9 mb, σφφ ≈ σωω ≈ 70 µb and σρ0J/ψ ∼ 0.2 mb in ultraperipheral
Pb+Pb collisions at the LHC [72].
Production of two vector mesons in a single AA collision introduces angular
correlations among the decay products. The linear polarization of the photon follows
the electric field vector of the emitting ion so that, at the target, the photon polarization
is parallel to ~b [84]. In the case of multiple vector meson production, the photon
polarizations are either parallel or anti-parallel.
The photon polarizations affect the angular distribution of the decay products.
In the rest frame of a vector meson making a two-body decay such as ρ0 → ππ or
35
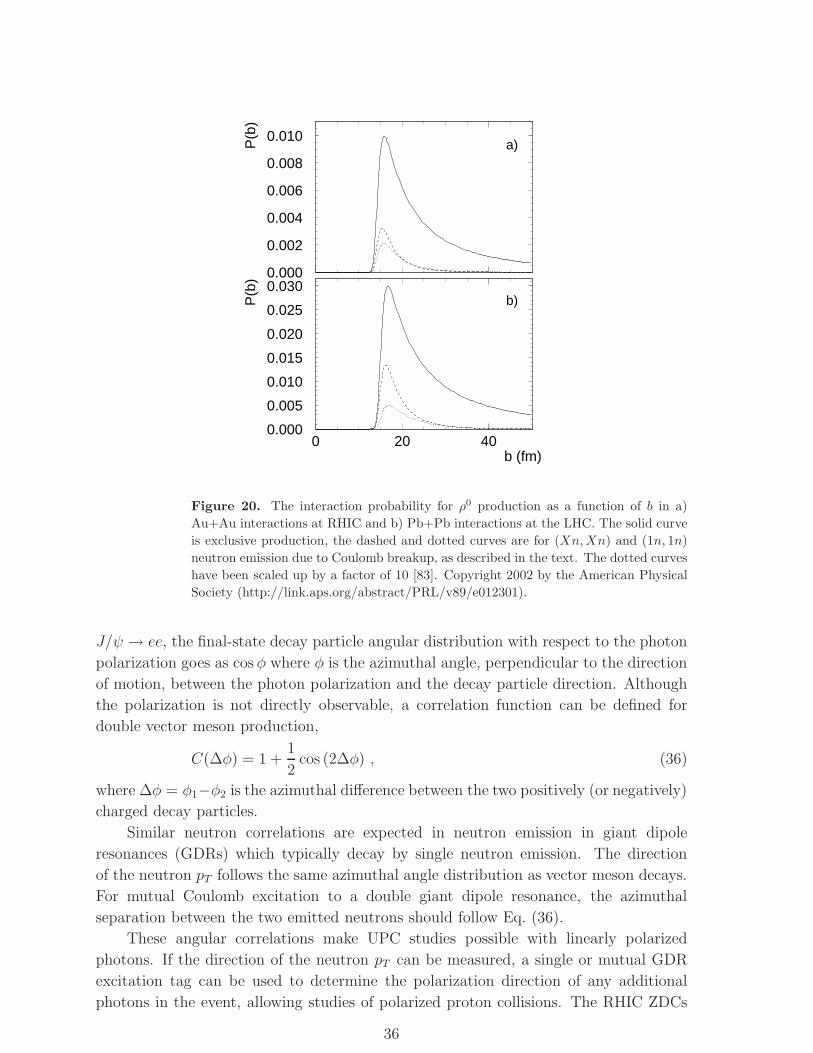
P(b
)
a)
b (fm)
P(b
)
b)
0.000
0.002
0.004
0.006
0.008
0.010
0.000
0.005
0.010
0.015
0.020
0.025
0.030
0 20 40
Figure 20. The interaction probability for ρ0 production as a function of b in a)
Au+Au interactions at RHIC and b) Pb+Pb interactions at the LHC. The solid curve
is exclusive production, the dashed and dotted curves are for (Xn,Xn) and (1n, 1n)
neutron emission due to Coulomb breakup, as described in the text. The dotted curves
have been scaled up by a factor of 10 [83]. Copyright 2002 by the American Physical
Society (http://link.aps.org/abstract/PRL/v89/e012301).
J/ψ → ee, the final-state decay particle angular distribution with respect to the photon
polarization goes as cosφ where φ is the azimuthal angle, perpendicular to the direction
of motion, between the photon polarization and the decay particle direction. Although
the polarization is not directly observable, a correlation function can be defined for
double vector meson production,
C(∆φ) = 1 +1
2cos (2∆φ) , (36)
where ∆φ = φ1−φ2 is the azimuthal difference between the two positively (or negatively)
charged decay particles.
Similar neutron correlations are expected in neutron emission in giant dipole
resonances (GDRs) which typically decay by single neutron emission. The direction
of the neutron pT follows the same azimuthal angle distribution as vector meson decays.
For mutual Coulomb excitation to a double giant dipole resonance, the azimuthal
separation between the two emitted neutrons should follow Eq. (36).
These angular correlations make UPC studies possible with linearly polarized
photons. If the direction of the neutron pT can be measured, a single or mutual GDR
excitation tag can be used to determine the polarization direction of any additional
photons in the event, allowing studies of polarized proton collisions. The RHIC ZDCs
36
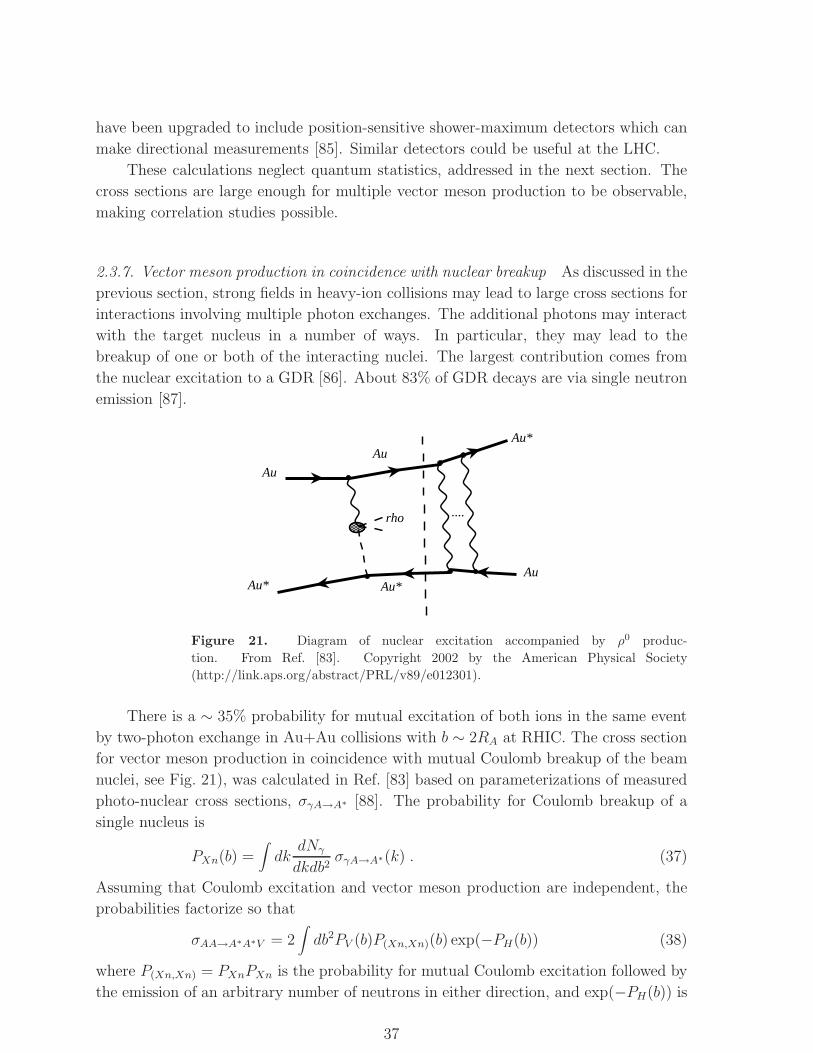
have been upgraded to include position-sensitive shower-maximum detectors which can
make directional measurements [85]. Similar detectors could be useful at the LHC.
These calculations neglect quantum statistics, addressed in the next section. The
cross sections are large enough for multiple vector meson production to be observable,
making correlation studies possible.
2.3.7. Vector meson production in coincidence with nuclear breakup As discussed in the
previous section, strong fields in heavy-ion collisions may lead to large cross sections for
interactions involving multiple photon exchanges. The additional photons may interact
with the target nucleus in a number of ways. In particular, they may lead to the
breakup of one or both of the interacting nuclei. The largest contribution comes from
the nuclear excitation to a GDR [86]. About 83% of GDR decays are via single neutron
emission [87].
....
Au*
Au
Au
rho
Au*
Au
Au*
Figure 21. Diagram of nuclear excitation accompanied by ρ0 produc-
tion. From Ref. [83]. Copyright 2002 by the American Physical Society
(http://link.aps.org/abstract/PRL/v89/e012301).
There is a ∼ 35% probability for mutual excitation of both ions in the same event
by two-photon exchange in Au+Au collisions with b ∼ 2RA at RHIC. The cross section
for vector meson production in coincidence with mutual Coulomb breakup of the beam
nuclei, see Fig. 21), was calculated in Ref. [83] based on parameterizations of measured
photo-nuclear cross sections, σγA→A∗ [88]. The probability for Coulomb breakup of a
single nucleus is
PXn(b) =∫dk
dNγ
dkdb2σγA→A∗(k) . (37)
Assuming that Coulomb excitation and vector meson production are independent, the
probabilities factorize so that
σAA→A∗A∗V = 2∫db2PV (b)P(Xn,Xn)(b) exp(−PH(b)) (38)
where P(Xn,Xn) = PXnPXn is the probability for mutual Coulomb excitation followed by
the emission of an arbitrary number of neutrons in either direction, and exp(−PH(b)) is
37
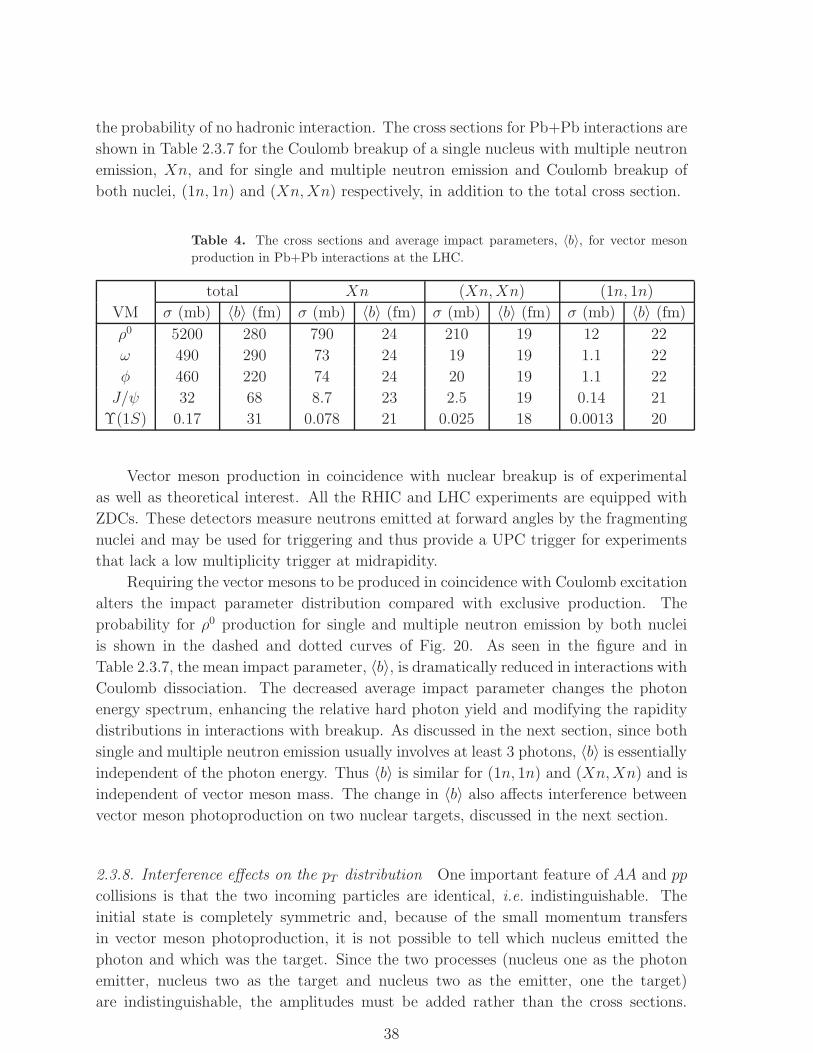
the probability of no hadronic interaction. The cross sections for Pb+Pb interactions are
shown in Table 2.3.7 for the Coulomb breakup of a single nucleus with multiple neutron
emission, Xn, and for single and multiple neutron emission and Coulomb breakup of
both nuclei, (1n, 1n) and (Xn,Xn) respectively, in addition to the total cross section.
Table 4. The cross sections and average impact parameters, 〈b〉, for vector meson
production in Pb+Pb interactions at the LHC.
total Xn (Xn,Xn) (1n, 1n)
VM σ (mb) 〈b〉 (fm) σ (mb) 〈b〉 (fm) σ (mb) 〈b〉 (fm) σ (mb) 〈b〉 (fm)
ρ0 5200 280 790 24 210 19 12 22
ω 490 290 73 24 19 19 1.1 22
φ 460 220 74 24 20 19 1.1 22
J/ψ 32 68 8.7 23 2.5 19 0.14 21
Υ(1S) 0.17 31 0.078 21 0.025 18 0.0013 20
Vector meson production in coincidence with nuclear breakup is of experimental
as well as theoretical interest. All the RHIC and LHC experiments are equipped with
ZDCs. These detectors measure neutrons emitted at forward angles by the fragmenting
nuclei and may be used for triggering and thus provide a UPC trigger for experiments
that lack a low multiplicity trigger at midrapidity.
Requiring the vector mesons to be produced in coincidence with Coulomb excitation
alters the impact parameter distribution compared with exclusive production. The
probability for ρ0 production for single and multiple neutron emission by both nuclei
is shown in the dashed and dotted curves of Fig. 20. As seen in the figure and in
Table 2.3.7, the mean impact parameter, 〈b〉, is dramatically reduced in interactions with
Coulomb dissociation. The decreased average impact parameter changes the photon
energy spectrum, enhancing the relative hard photon yield and modifying the rapidity
distributions in interactions with breakup. As discussed in the next section, since both
single and multiple neutron emission usually involves at least 3 photons, 〈b〉 is essentially
independent of the photon energy. Thus 〈b〉 is similar for (1n, 1n) and (Xn,Xn) and is
independent of vector meson mass. The change in 〈b〉 also affects interference between
vector meson photoproduction on two nuclear targets, discussed in the next section.
2.3.8. Interference effects on the pT distribution One important feature of AA and pp
collisions is that the two incoming particles are identical, i.e. indistinguishable. The
initial state is completely symmetric and, because of the small momentum transfers
in vector meson photoproduction, it is not possible to tell which nucleus emitted the
photon and which was the target. Since the two processes (nucleus one as the photon
emitter, nucleus two as the target and nucleus two as the emitter, one the target)
are indistinguishable, the amplitudes must be added rather than the cross sections.
38
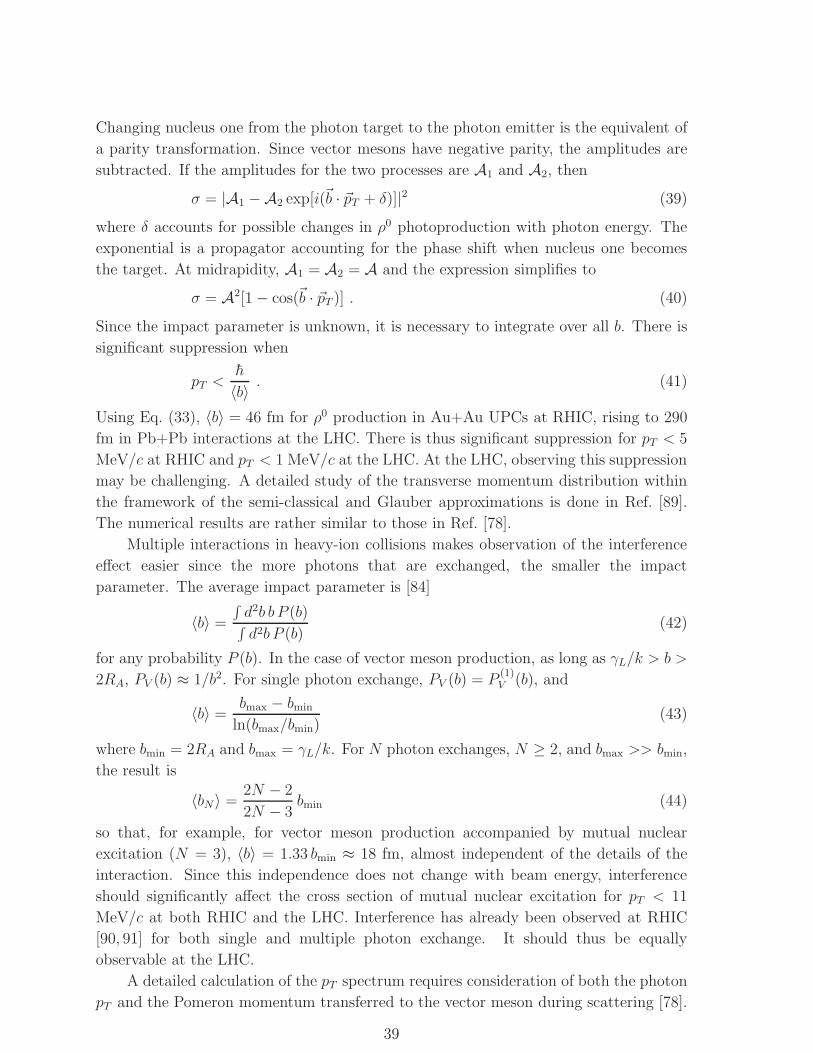
Changing nucleus one from the photon target to the photon emitter is the equivalent of
a parity transformation. Since vector mesons have negative parity, the amplitudes are
subtracted. If the amplitudes for the two processes are A1 and A2, then
σ = |A1 −A2 exp[i(~b · ~pT + δ)]|2 (39)
where δ accounts for possible changes in ρ0 photoproduction with photon energy. The
exponential is a propagator accounting for the phase shift when nucleus one becomes
the target. At midrapidity, A1 = A2 = A and the expression simplifies to
σ = A2[1 − cos(~b · ~pT )] . (40)
Since the impact parameter is unknown, it is necessary to integrate over all b. There is
significant suppression when
pT <h
〈b〉 . (41)
Using Eq. (33), 〈b〉 = 46 fm for ρ0 production in Au+Au UPCs at RHIC, rising to 290
fm in Pb+Pb interactions at the LHC. There is thus significant suppression for pT < 5
MeV/c at RHIC and pT < 1 MeV/c at the LHC. At the LHC, observing this suppression
may be challenging. A detailed study of the transverse momentum distribution within
the framework of the semi-classical and Glauber approximations is done in Ref. [89].
The numerical results are rather similar to those in Ref. [78].
Multiple interactions in heavy-ion collisions makes observation of the interference
effect easier since the more photons that are exchanged, the smaller the impact
parameter. The average impact parameter is [84]
〈b〉 =
∫d2b b P (b)∫d2b P (b)
(42)
for any probability P (b). In the case of vector meson production, as long as γL/k > b >
2RA, PV (b) ≈ 1/b2. For single photon exchange, PV (b) = P(1)V (b), and
〈b〉 =bmax − bmin
ln(bmax/bmin)(43)
where bmin = 2RA and bmax = γL/k. For N photon exchanges, N ≥ 2, and bmax >> bmin,
the result is
〈bN〉 =2N − 2
2N − 3bmin (44)
so that, for example, for vector meson production accompanied by mutual nuclear
excitation (N = 3), 〈b〉 = 1.33 bmin ≈ 18 fm, almost independent of the details of the
interaction. Since this independence does not change with beam energy, interference
should significantly affect the cross section of mutual nuclear excitation for pT < 11
MeV/c at both RHIC and the LHC. Interference has already been observed at RHIC
[90, 91] for both single and multiple photon exchange. It should thus be equally
observable at the LHC.
A detailed calculation of the pT spectrum requires consideration of both the photon
pT and the Pomeron momentum transferred to the vector meson during scattering [78].
39
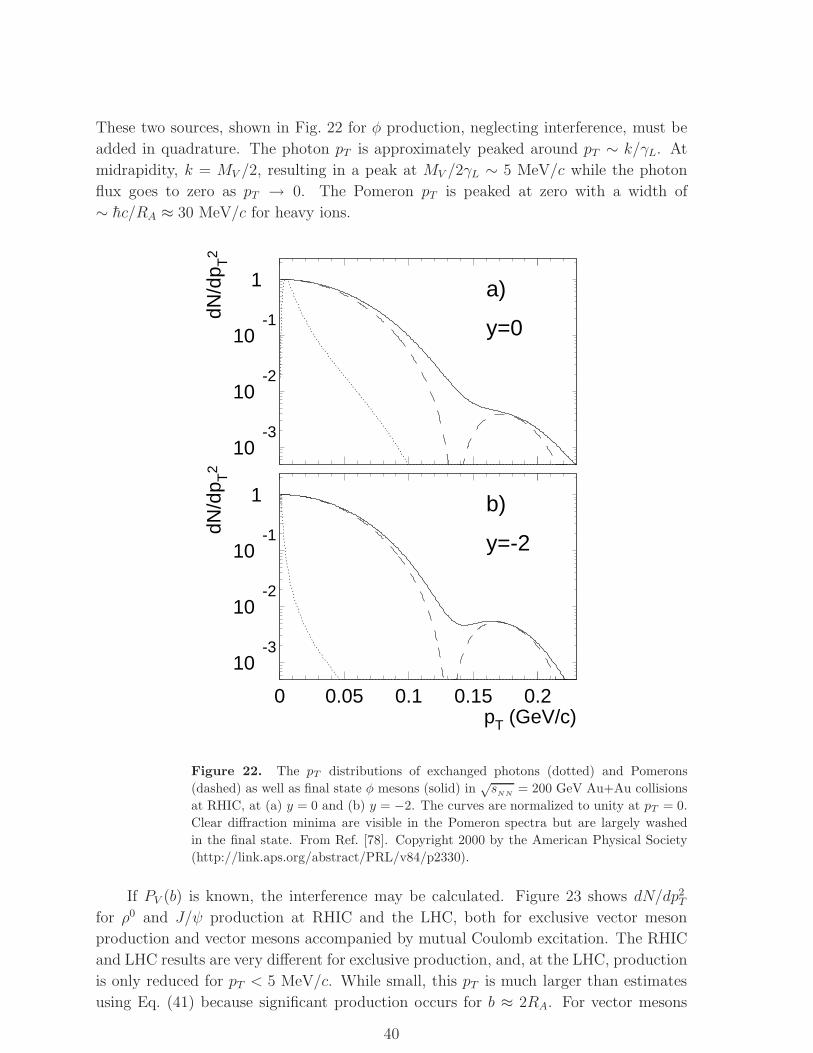
These two sources, shown in Fig. 22 for φ production, neglecting interference, must be
added in quadrature. The photon pT is approximately peaked around pT ∼ k/γL. At
midrapidity, k = MV /2, resulting in a peak at MV /2γL ∼ 5 MeV/c while the photon
flux goes to zero as pT → 0. The Pomeron pT is peaked at zero with a width of
∼ hc/RA ≈ 30 MeV/c for heavy ions.dN
/dp T
2
a)
y=0
pT (GeV/c)
dN/d
p T2
b)
y=-2
10-3
10-2
10-1
1
10-3
10-2
10-1
1
0 0.05 0.1 0.15 0.2
Figure 22. The pT distributions of exchanged photons (dotted) and Pomerons
(dashed) as well as final state φ mesons (solid) in√s
NN= 200 GeV Au+Au collisions
at RHIC, at (a) y = 0 and (b) y = −2. The curves are normalized to unity at pT = 0.
Clear diffraction minima are visible in the Pomeron spectra but are largely washed
in the final state. From Ref. [78]. Copyright 2000 by the American Physical Society
(http://link.aps.org/abstract/PRL/v84/p2330).
If PV (b) is known, the interference may be calculated. Figure 23 shows dN/dp2T
for ρ0 and J/ψ production at RHIC and the LHC, both for exclusive vector meson
production and vector mesons accompanied by mutual Coulomb excitation. The RHIC
and LHC results are very different for exclusive production, and, at the LHC, production
is only reduced for pT < 5 MeV/c. While small, this pT is much larger than estimates
using Eq. (41) because significant production occurs for b ≈ 2RA. For vector mesons
40
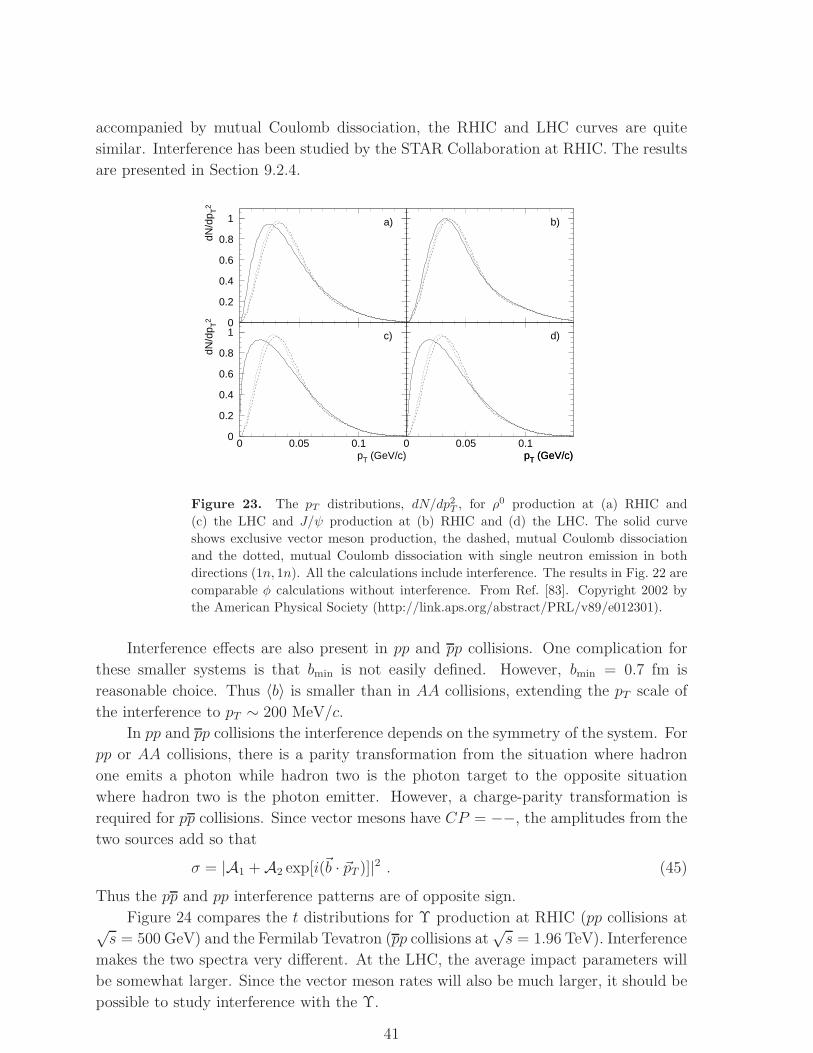
accompanied by mutual Coulomb dissociation, the RHIC and LHC curves are quite
similar. Interference has been studied by the STAR Collaboration at RHIC. The results
are presented in Section 9.2.4.
dN/d
p T2
a) b)
pT (GeV/c)
dN/d
p T2
c)
pT (GeV/c)
d)
pT (GeV/c)
0
0.2
0.4
0.6
0.8
1
0
0.2
0.4
0.6
0.8
1
0 0.05 0.1 0 0.05 0.1
Figure 23. The pT distributions, dN/dp2T , for ρ0 production at (a) RHIC and
(c) the LHC and J/ψ production at (b) RHIC and (d) the LHC. The solid curve
shows exclusive vector meson production, the dashed, mutual Coulomb dissociation
and the dotted, mutual Coulomb dissociation with single neutron emission in both
directions (1n, 1n). All the calculations include interference. The results in Fig. 22 are
comparable φ calculations without interference. From Ref. [83]. Copyright 2002 by
the American Physical Society (http://link.aps.org/abstract/PRL/v89/e012301).
Interference effects are also present in pp and pp collisions. One complication for
these smaller systems is that bmin is not easily defined. However, bmin = 0.7 fm is
reasonable choice. Thus 〈b〉 is smaller than in AA collisions, extending the pT scale of
the interference to pT ∼ 200 MeV/c.
In pp and pp collisions the interference depends on the symmetry of the system. For
pp or AA collisions, there is a parity transformation from the situation where hadron
one emits a photon while hadron two is the photon target to the opposite situation
where hadron two is the photon emitter. However, a charge-parity transformation is
required for pp collisions. Since vector mesons have CP = −−, the amplitudes from the
two sources add so that
σ = |A1 + A2 exp[i(~b · ~pT )]|2 . (45)
Thus the pp and pp interference patterns are of opposite sign.
Figure 24 compares the t distributions for Υ production at RHIC (pp collisions at√s = 500 GeV) and the Fermilab Tevatron (pp collisions at
√s = 1.96 TeV). Interference
makes the two spectra very different. At the LHC, the average impact parameters will
be somewhat larger. Since the vector meson rates will also be much larger, it should be
possible to study interference with the Υ.
41
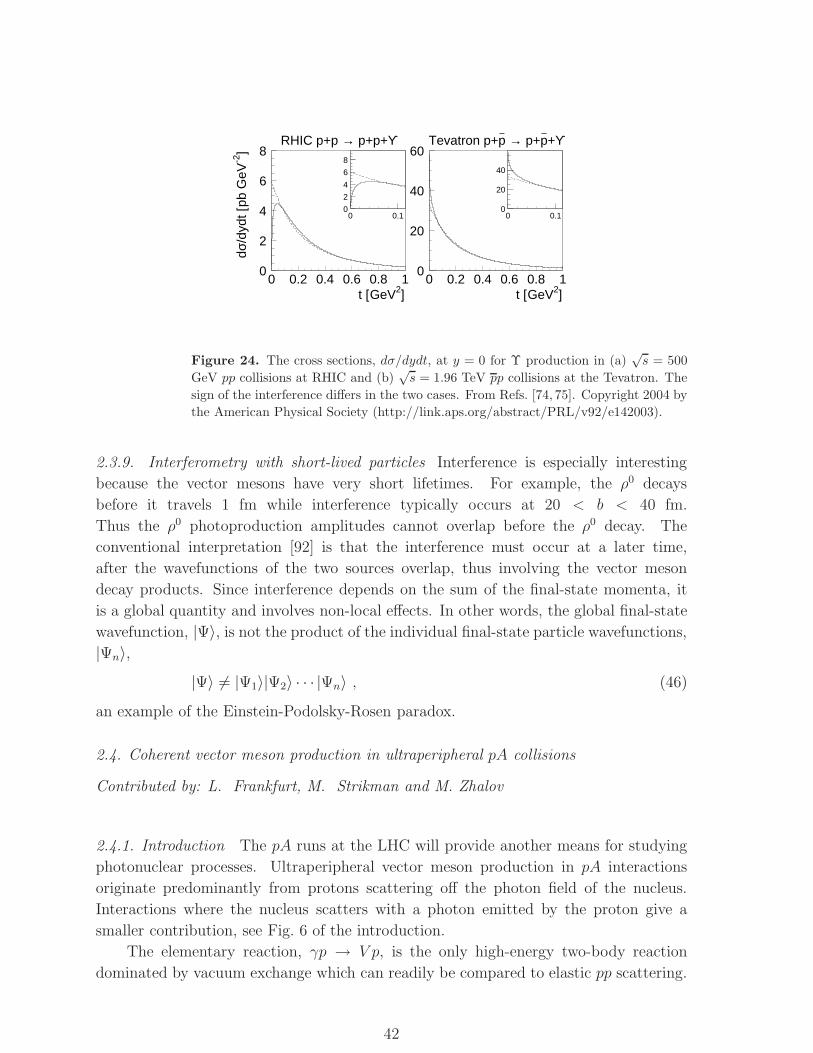
t [GeV2]
dσ/d
ydt [
pb G
eV-2
]
RHIC p+p → p+p+ϒ
t [GeV2]
Tevatron p+p– → p+p
–+ϒ
0
2
4
6
8
0 0.2 0.4 0.6 0.8 1
0
2
4
6
8
0 0.1
0
20
40
60
0 0.2 0.4 0.6 0.8 1
0
20
40
0 0.1
Figure 24. The cross sections, dσ/dydt, at y = 0 for Υ production in (a)√s = 500
GeV pp collisions at RHIC and (b)√s = 1.96 TeV pp collisions at the Tevatron. The
sign of the interference differs in the two cases. From Refs. [74, 75]. Copyright 2004 by
the American Physical Society (http://link.aps.org/abstract/PRL/v92/e142003).
2.3.9. Interferometry with short-lived particles Interference is especially interesting
because the vector mesons have very short lifetimes. For example, the ρ0 decays
before it travels 1 fm while interference typically occurs at 20 < b < 40 fm.
Thus the ρ0 photoproduction amplitudes cannot overlap before the ρ0 decay. The
conventional interpretation [92] is that the interference must occur at a later time,
after the wavefunctions of the two sources overlap, thus involving the vector meson
decay products. Since interference depends on the sum of the final-state momenta, it
is a global quantity and involves non-local effects. In other words, the global final-state
wavefunction, |Ψ〉, is not the product of the individual final-state particle wavefunctions,
|Ψn〉,|Ψ〉 6= |Ψ1〉|Ψ2〉 · · · |Ψn〉 , (46)
an example of the Einstein-Podolsky-Rosen paradox.
2.4. Coherent vector meson production in ultraperipheral pA collisions
Contributed by: L. Frankfurt, M. Strikman and M. Zhalov
2.4.1. Introduction The pA runs at the LHC will provide another means for studying
photonuclear processes. Ultraperipheral vector meson production in pA interactions
originate predominantly from protons scattering off the photon field of the nucleus.
Interactions where the nucleus scatters with a photon emitted by the proton give a
smaller contribution, see Fig. 6 of the introduction.
The elementary reaction, γp → V p, is the only high-energy two-body reaction
dominated by vacuum exchange which can readily be compared to elastic pp scattering.
42
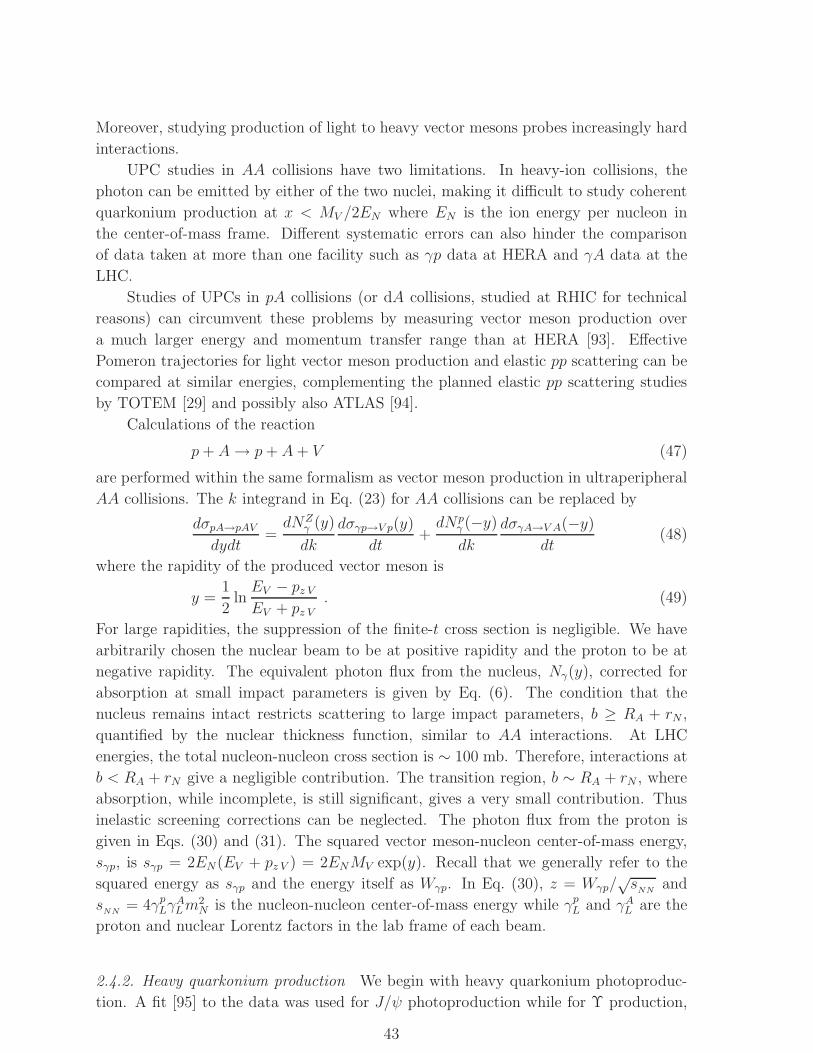
Moreover, studying production of light to heavy vector mesons probes increasingly hard
interactions.
UPC studies in AA collisions have two limitations. In heavy-ion collisions, the
photon can be emitted by either of the two nuclei, making it difficult to study coherent
quarkonium production at x < MV /2EN where EN is the ion energy per nucleon in
the center-of-mass frame. Different systematic errors can also hinder the comparison
of data taken at more than one facility such as γp data at HERA and γA data at the
LHC.
Studies of UPCs in pA collisions (or dA collisions, studied at RHIC for technical
reasons) can circumvent these problems by measuring vector meson production over
a much larger energy and momentum transfer range than at HERA [93]. Effective
Pomeron trajectories for light vector meson production and elastic pp scattering can be
compared at similar energies, complementing the planned elastic pp scattering studies
by TOTEM [29] and possibly also ATLAS [94].
Calculations of the reaction
p+ A→ p+ A+ V (47)
are performed within the same formalism as vector meson production in ultraperipheral
AA collisions. The k integrand in Eq. (23) for AA collisions can be replaced by
dσpA→pAVdydt
=dNZ
γ (y)
dk
dσγp→V p(y)
dt+dNp
γ (−y)dk
dσγA→V A(−y)dt
(48)
where the rapidity of the produced vector meson is
y =1
2lnEV − pz VEV + pz V
. (49)
For large rapidities, the suppression of the finite-t cross section is negligible. We have
arbitrarily chosen the nuclear beam to be at positive rapidity and the proton to be at
negative rapidity. The equivalent photon flux from the nucleus, Nγ(y), corrected for
absorption at small impact parameters is given by Eq. (6). The condition that the
nucleus remains intact restricts scattering to large impact parameters, b ≥ RA + rN ,
quantified by the nuclear thickness function, similar to AA interactions. At LHC
energies, the total nucleon-nucleon cross section is ∼ 100 mb. Therefore, interactions at
b < RA + rN give a negligible contribution. The transition region, b ∼ RA + rN , where
absorption, while incomplete, is still significant, gives a very small contribution. Thus
inelastic screening corrections can be neglected. The photon flux from the proton is
given in Eqs. (30) and (31). The squared vector meson-nucleon center-of-mass energy,
sγp, is sγp = 2EN(EV + pz V ) = 2ENMV exp(y). Recall that we generally refer to the
squared energy as sγp and the energy itself as Wγp. In Eq. (30), z = Wγp/√s
NNand
sNN
= 4γpLγALm
2N is the nucleon-nucleon center-of-mass energy while γpL and γAL are the
proton and nuclear Lorentz factors in the lab frame of each beam.
2.4.2. Heavy quarkonium production We begin with heavy quarkonium photoproduc-
tion. A fit [95] to the data was used for J/ψ photoproduction while for Υ production,
43
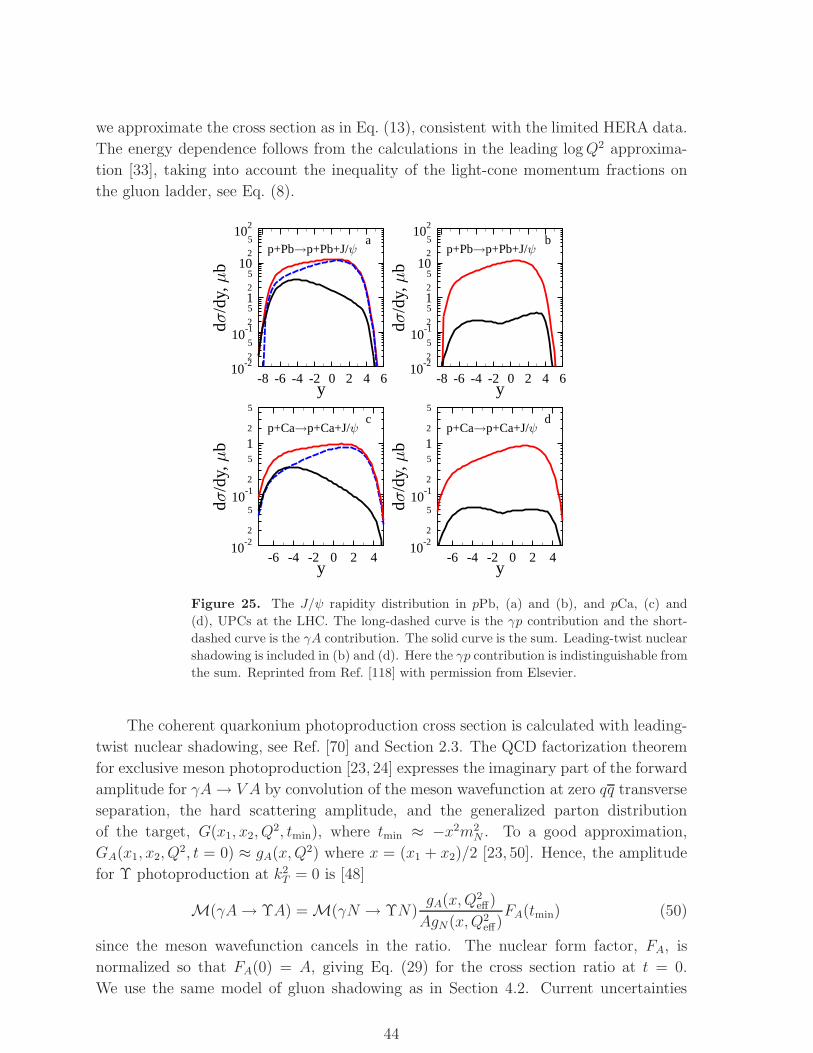
we approximate the cross section as in Eq. (13), consistent with the limited HERA data.
The energy dependence follows from the calculations in the leading logQ2 approxima-
tion [33], taking into account the inequality of the light-cone momentum fractions on
the gluon ladder, see Eq. (8).
-6 -4 -2 0 2 4y
10-22
510
-12
5
12
5
d/d
y,b
-6 -4 -2 0 2 4y
10-22
510
-12
5
12
5d
/dy,
b-8 -6 -4 -2 0 2 4 6
y10
-22
510
-12
512
510
2
510
2d
/dy,
b
-8 -6 -4 -2 0 2 4 6y
10-22
510
-12
512
510
2
510
2
d/d
y,b
a b
c d
p+Pb p+Pb+J/ p+Pb p+Pb+J/
p+Ca p+Ca+J/ p+Ca p+Ca+J/
Figure 25. The J/ψ rapidity distribution in pPb, (a) and (b), and pCa, (c) and
(d), UPCs at the LHC. The long-dashed curve is the γp contribution and the short-
dashed curve is the γA contribution. The solid curve is the sum. Leading-twist nuclear
shadowing is included in (b) and (d). Here the γp contribution is indistinguishable from
the sum. Reprinted from Ref. [118] with permission from Elsevier.
The coherent quarkonium photoproduction cross section is calculated with leading-
twist nuclear shadowing, see Ref. [70] and Section 2.3. The QCD factorization theorem
for exclusive meson photoproduction [23, 24] expresses the imaginary part of the forward
amplitude for γA→ V A by convolution of the meson wavefunction at zero qq transverse
separation, the hard scattering amplitude, and the generalized parton distribution
of the target, G(x1, x2, Q2, tmin), where tmin ≈ −x2m2
N . To a good approximation,
GA(x1, x2, Q2, t = 0) ≈ gA(x,Q2) where x = (x1 + x2)/2 [23, 50]. Hence, the amplitude
for Υ photoproduction at k2T = 0 is [48]
M(γA→ ΥA) = M(γN → ΥN)gA(x,Q2
eff)
AgN(x,Q2eff)
FA(tmin) (50)
since the meson wavefunction cancels in the ratio. The nuclear form factor, FA, is
normalized so that FA(0) = A, giving Eq. (29) for the cross section ratio at t = 0.
We use the same model of gluon shadowing as in Section 4.2. Current uncertainties
44
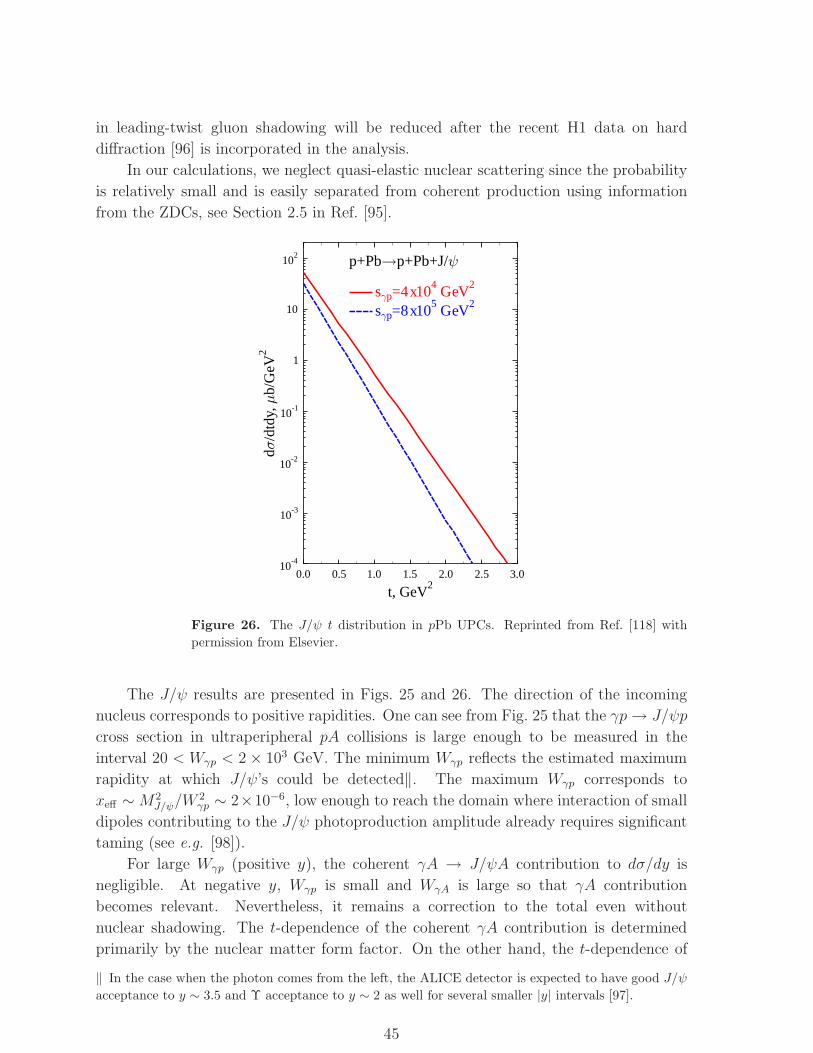
in leading-twist gluon shadowing will be reduced after the recent H1 data on hard
diffraction [96] is incorporated in the analysis.
In our calculations, we neglect quasi-elastic nuclear scattering since the probability
is relatively small and is easily separated from coherent production using information
from the ZDCs, see Section 2.5 in Ref. [95].
0.0 0.5 1.0 1.5 2.0 2.5 3.0
t, GeV2
10-4
10-3
10-2
10-1
1
10
102
d/d
tdy,
b/G
eV2
s p=4x10⁴
GeV2
s p=8x10⁵
GeV2
p+Pb p+Pb+J/
Figure 26. The J/ψ t distribution in pPb UPCs. Reprinted from Ref. [118] with
permission from Elsevier.
The J/ψ results are presented in Figs. 25 and 26. The direction of the incoming
nucleus corresponds to positive rapidities. One can see from Fig. 25 that the γp→ J/ψp
cross section in ultraperipheral pA collisions is large enough to be measured in the
interval 20 < Wγp < 2 × 10³ GeV. The minimum Wγp reflects the estimated maximum
rapidity at which J/ψ’s could be detected‖. The maximum Wγp corresponds to
xeff ∼M2J/ψ/W
2γp ∼ 2×10⁻⁶, low enough to reach the domain where interaction of small
dipoles contributing to the J/ψ photoproduction amplitude already requires significant
taming (see e.g. [98]).
For large Wγp (positive y), the coherent γA → J/ψA contribution to dσ/dy is
negligible. At negative y, Wγp is small and WγA is large so that γA contribution
becomes relevant. Nevertheless, it remains a correction to the total even without
nuclear shadowing. The t-dependence of the coherent γA contribution is determined
primarily by the nuclear matter form factor. On the other hand, the t-dependence of
‖ In the case when the photon comes from the left, the ALICE detector is expected to have good J/ψ
acceptance to y ∼ 3.5 and Υ acceptance to y ∼ 2 as well for several smaller |y| intervals [97].
45
the coherent γp contribution is due to the gluon transverse momentum distribution at
the relevant x value and is a much weaker function of t. Both these t-dependencies can
be approximated by exponentials. Accordingly, the γA contribution can be determined
by fitting dσ/dt to a sum of two exponentials. The γA contribution to J/ψ production
could be effectively enhanced or reduced by introducing a pT cut, e.g. pT < 300 MeV/c
to enhance the γA contribution or pT ≥ 300 MeV/c to reduce it. An observation of
the γA contribution with the low pT cut would probe the small dipole interaction with
nuclei at xA ∼ 10−5 − 10−6. If gluon shadowing is large, observing the γA contribution
for such xA would require very good pT resolution, pT ≤ 150 MeV/c or better. It may be
possible to eliminate/estimate the γp contribution by measuring recoil protons produced
with xIP = M2J/ψ/W
2γp. In the kinematic range 0.1 ≤ xIP ≤ 0.001, the proton could be
detected, for example, by the TOTEM T1 and T2 trackers or by the Roman pot system
proposed in Ref. [32].
-6 -4 -2 0 2 4y
10-2
2
3
4
5
6
789
10-1
2
d/d
y,b
-6 -4 -2 0 2 4y
10-2
2
3
4
5
6
789
10-1
2
d/d
y,b
p+Pb p+Pb+LT gluon shadowing
p+Pb p+Pb+no shadowing
xA=10-5
xp=10-4
Figure 27. The Υ rapidity distribution in pPb UPCs at the LHC without (left-hand
side) and with (right-hand side) leading-twist nuclear shadowing. The γp contribution
is given by the long-dashed lines, γA the short-dashed lines and the solid curves are
the sum. Reprinted from Ref. [118] with permission from Elsevier.
The J/ψ production cross section will be sufficiently large to measure the t
dependence of the γp contribution, shown in Fig. 26, up to −t ∼ 2 GeV2, if the
contribution from proton dissociation can be suppressed. This measurement provides
a unique opportunity to study the t dependence of the hard Pomeron trajectory since
the power of sγp/s0 in e.g. Eq. (13) can be written as 2(αhardIP (t) − 1). This study will
complement measurements of αhardIP (t) in vector meson production with rapidity gaps,
46
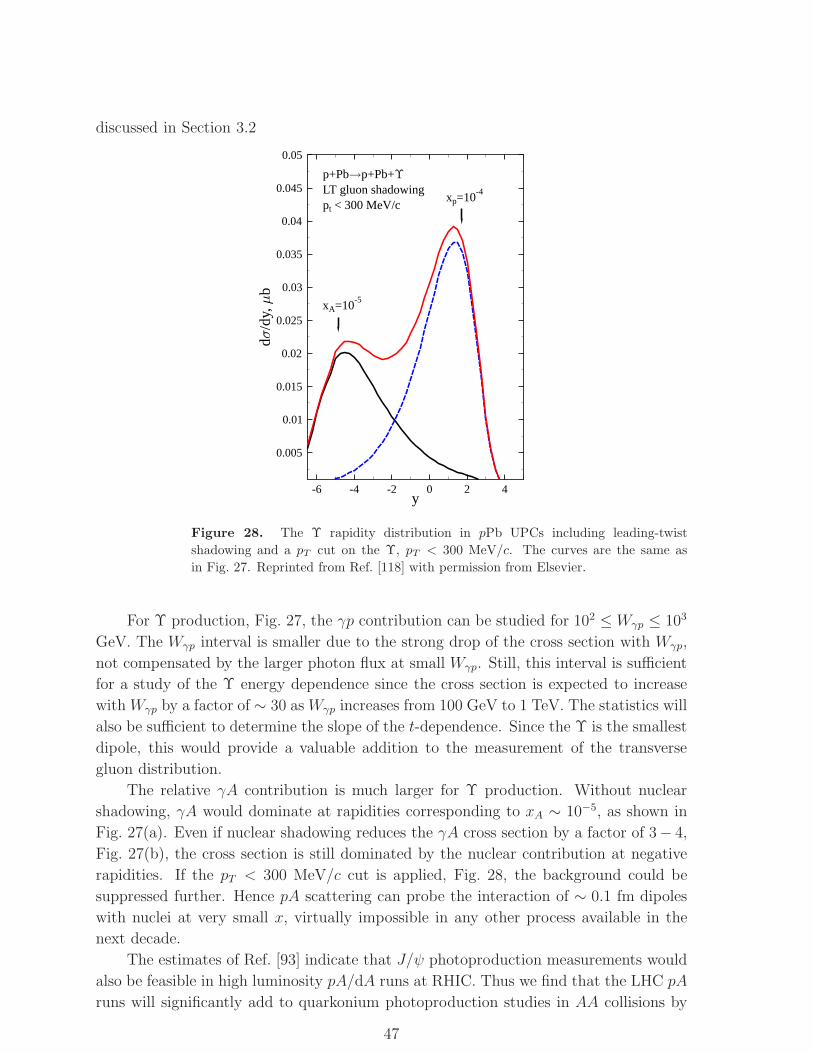
discussed in Section 3.2
-6 -4 -2 0 2 4y
0.005
0.01
0.015
0.02
0.025
0.03
0.035
0.04
0.045
0.05
d/d
y,b
p+Pb p+Pb+LT gluon shadowingpt < 300 MeV/c
xA=10-5
xp=10-4
Figure 28. The Υ rapidity distribution in pPb UPCs including leading-twist
shadowing and a pT cut on the Υ, pT < 300 MeV/c. The curves are the same as
in Fig. 27. Reprinted from Ref. [118] with permission from Elsevier.
For Υ production, Fig. 27, the γp contribution can be studied for 102 ≤Wγp ≤ 103
GeV. The Wγp interval is smaller due to the strong drop of the cross section with Wγp,
not compensated by the larger photon flux at small Wγp. Still, this interval is sufficient
for a study of the Υ energy dependence since the cross section is expected to increase
with Wγp by a factor of ∼ 30 as Wγp increases from 100 GeV to 1 TeV. The statistics will
also be sufficient to determine the slope of the t-dependence. Since the Υ is the smallest
dipole, this would provide a valuable addition to the measurement of the transverse
gluon distribution.
The relative γA contribution is much larger for Υ production. Without nuclear
shadowing, γA would dominate at rapidities corresponding to xA ∼ 10−5, as shown in
Fig. 27(a). Even if nuclear shadowing reduces the γA cross section by a factor of 3− 4,
Fig. 27(b), the cross section is still dominated by the nuclear contribution at negative
rapidities. If the pT < 300 MeV/c cut is applied, Fig. 28, the background could be
suppressed further. Hence pA scattering can probe the interaction of ∼ 0.1 fm dipoles
with nuclei at very small x, virtually impossible in any other process available in the
next decade.
The estimates of Ref. [93] indicate that J/ψ photoproduction measurements would
also be feasible in high luminosity pA/dA runs at RHIC. Thus we find that the LHC pA
runs will significantly add to quarkonium photoproduction studies in AA collisions by
47
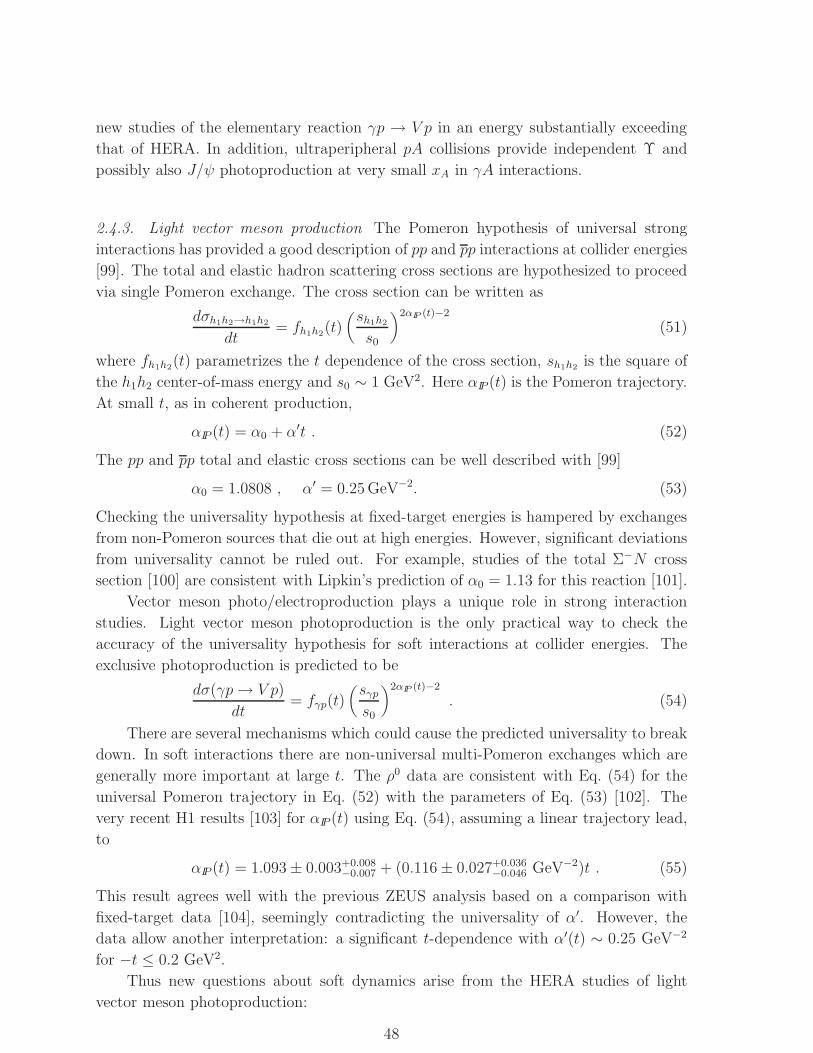
new studies of the elementary reaction γp → V p in an energy substantially exceeding
that of HERA. In addition, ultraperipheral pA collisions provide independent Υ and
possibly also J/ψ photoproduction at very small xA in γA interactions.
2.4.3. Light vector meson production The Pomeron hypothesis of universal strong
interactions has provided a good description of pp and pp interactions at collider energies
[99]. The total and elastic hadron scattering cross sections are hypothesized to proceed
via single Pomeron exchange. The cross section can be written as
dσh1h2→h1h2
dt= fh1h2
(t)(sh1h2
s0
)2αIP (t)−2
(51)
where fh1h2(t) parametrizes the t dependence of the cross section, sh1h2
is the square of
the h1h2 center-of-mass energy and s0 ∼ 1 GeV2. Here αIP (t) is the Pomeron trajectory.
At small t, as in coherent production,
αIP (t) = α0 + α′t . (52)
The pp and pp total and elastic cross sections can be well described with [99]
α0 = 1.0808 , α′ = 0.25 GeV−2. (53)
Checking the universality hypothesis at fixed-target energies is hampered by exchanges
from non-Pomeron sources that die out at high energies. However, significant deviations
from universality cannot be ruled out. For example, studies of the total Σ−N cross
section [100] are consistent with Lipkin’s prediction of α0 = 1.13 for this reaction [101].
Vector meson photo/electroproduction plays a unique role in strong interaction
studies. Light vector meson photoproduction is the only practical way to check the
accuracy of the universality hypothesis for soft interactions at collider energies. The
exclusive photoproduction is predicted to be
dσ(γp→ V p)
dt= fγp(t)
(sγps0
)2αIP (t)−2
. (54)
There are several mechanisms which could cause the predicted universality to break
down. In soft interactions there are non-universal multi-Pomeron exchanges which are
generally more important at large t. The ρ0 data are consistent with Eq. (54) for the
universal Pomeron trajectory in Eq. (52) with the parameters of Eq. (53) [102]. The
very recent H1 results [103] for αIP (t) using Eq. (54), assuming a linear trajectory lead,
to
αIP (t) = 1.093 ± 0.003+0.008−0.007 + (0.116 ± 0.027+0.036
−0.046 GeV−2)t . (55)
This result agrees well with the previous ZEUS analysis based on a comparison with
fixed-target data [104], seemingly contradicting the universality of α′. However, the
data allow another interpretation: a significant t-dependence with α′(t) ∼ 0.25 GeV−2
for −t ≤ 0.2 GeV2.
Thus new questions about soft dynamics arise from the HERA studies of light
vector meson photoproduction:
48
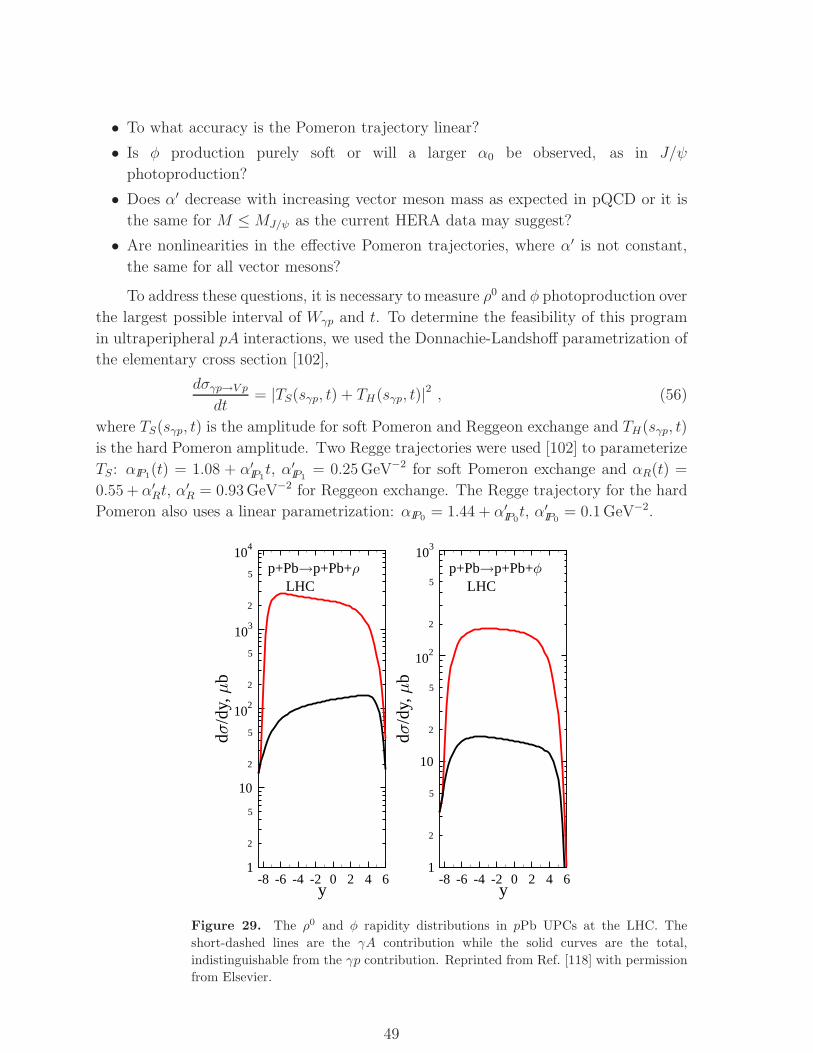
• To what accuracy is the Pomeron trajectory linear?
• Is φ production purely soft or will a larger α0 be observed, as in J/ψ
photoproduction?
• Does α′ decrease with increasing vector meson mass as expected in pQCD or it is
the same for M ≤MJ/ψ as the current HERA data may suggest?
• Are nonlinearities in the effective Pomeron trajectories, where α′ is not constant,
the same for all vector mesons?
To address these questions, it is necessary to measure ρ0 and φ photoproduction over
the largest possible interval of Wγp and t. To determine the feasibility of this program
in ultraperipheral pA interactions, we used the Donnachie-Landshoff parametrization of
the elementary cross section [102],
dσγp→V pdt
= |TS(sγp, t) + TH(sγp, t)|2 , (56)
where TS(sγp, t) is the amplitude for soft Pomeron and Reggeon exchange and TH(sγp, t)
is the hard Pomeron amplitude. Two Regge trajectories were used [102] to parameterize
TS: αIP1(t) = 1.08 + α′IP1
t, α′IP1= 0.25 GeV−2 for soft Pomeron exchange and αR(t) =
0.55 + α′Rt, α′R = 0.93 GeV−2 for Reggeon exchange. The Regge trajectory for the hard
Pomeron also uses a linear parametrization: αIP0= 1.44 + α′IP0
t, α′IP0= 0.1 GeV−2.
-8 -6 -4 -2 0 2 4 6y
1
2
5
10
2
5
102
2
5
103
2
5
104
d/d
y,b
-8 -6 -4 -2 0 2 4 6y
1
2
5
10
2
5
102
2
5
103
d/d
y,b
p+Pb p+Pb+LHC
p+Pb p+Pb+LHC
Figure 29. The ρ0 and φ rapidity distributions in pPb UPCs at the LHC. The
short-dashed lines are the γA contribution while the solid curves are the total,
indistinguishable from the γp contribution. Reprinted from Ref. [118] with permission
from Elsevier.
49
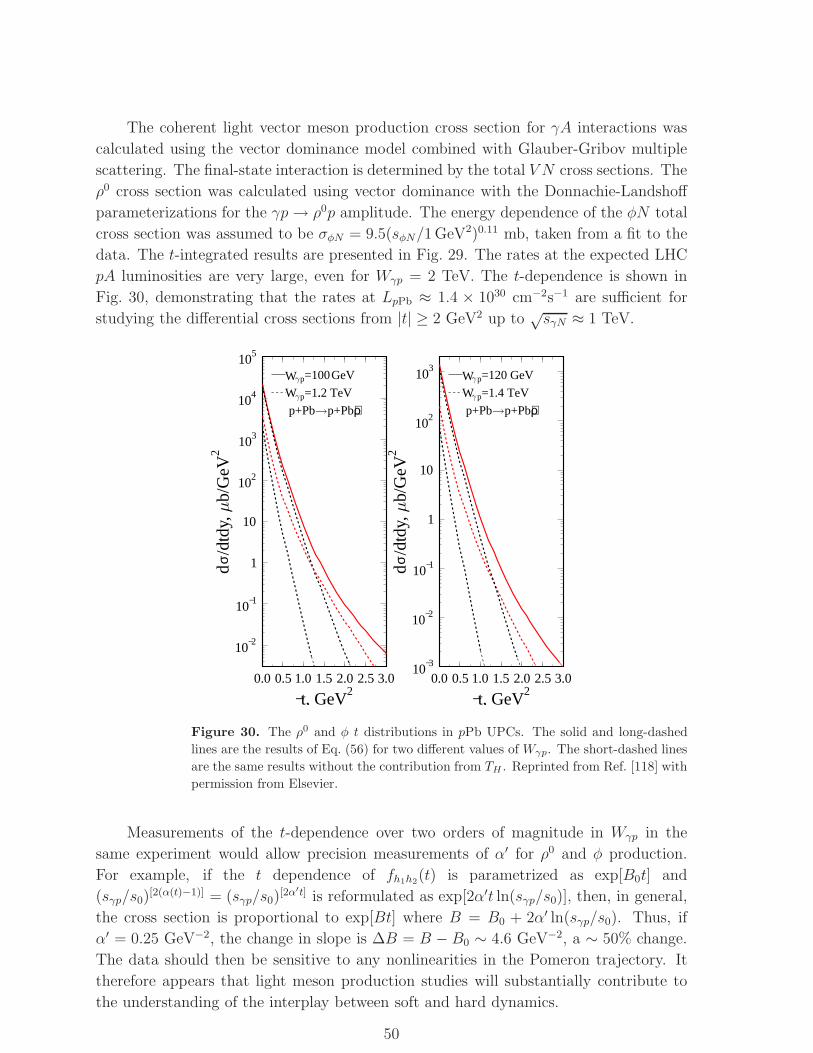
The coherent light vector meson production cross section for γA interactions was
calculated using the vector dominance model combined with Glauber-Gribov multiple
scattering. The final-state interaction is determined by the total V N cross sections. The
ρ0 cross section was calculated using vector dominance with the Donnachie-Landshoff
parameterizations for the γp→ ρ0p amplitude. The energy dependence of the φN total
cross section was assumed to be σφN = 9.5(sφN/1 GeV2)0.11 mb, taken from a fit to the
data. The t-integrated results are presented in Fig. 29. The rates at the expected LHC
pA luminosities are very large, even for Wγp = 2 TeV. The t-dependence is shown in
Fig. 30, demonstrating that the rates at LpPb ≈ 1.4 × 1030 cm−2s−1 are sufficient for
studying the differential cross sections from |t| ≥ 2 GeV2 up to√sγN ≈ 1 TeV.
0.0 0.5 1.0 1.5 2.0 2.5 3.0
−t, GeV2
10−2
10−1
1
10
102
103
104
105
d/d
tdy,
b/G
eV2
0.0 0.5 1.0 1.5 2.0 2.5 3.0
−t, GeV2
10−3
10−2
10−1
1
10
102
103
d/d
tdy,
b/G
eV2
W p=100 GeV
W p=1.2 TeV.
p+Pb p+Pb+ρ
W p=120 GeV
W p=1.4 TeV
p+Pb p+Pb+ρ
σ σ
Figure 30. The ρ0 and φ t distributions in pPb UPCs. The solid and long-dashed
lines are the results of Eq. (56) for two different values of Wγp. The short-dashed lines
are the same results without the contribution from TH . Reprinted from Ref. [118] with
permission from Elsevier.
Measurements of the t-dependence over two orders of magnitude in Wγp in the
same experiment would allow precision measurements of α′ for ρ0 and φ production.
For example, if the t dependence of fh1h2(t) is parametrized as exp[B0t] and
(sγp/s0)[2(α(t)−1)] = (sγp/s0)
[2α′t] is reformulated as exp[2α′t ln(sγp/s0)], then, in general,
the cross section is proportional to exp[Bt] where B = B0 + 2α′ ln(sγp/s0). Thus, if
α′ = 0.25 GeV−2, the change in slope is ∆B = B − B0 ∼ 4.6 GeV−2, a ∼ 50% change.
The data should then be sensitive to any nonlinearities in the Pomeron trajectory. It
therefore appears that light meson production studies will substantially contribute to
the understanding of the interplay between soft and hard dynamics.
50
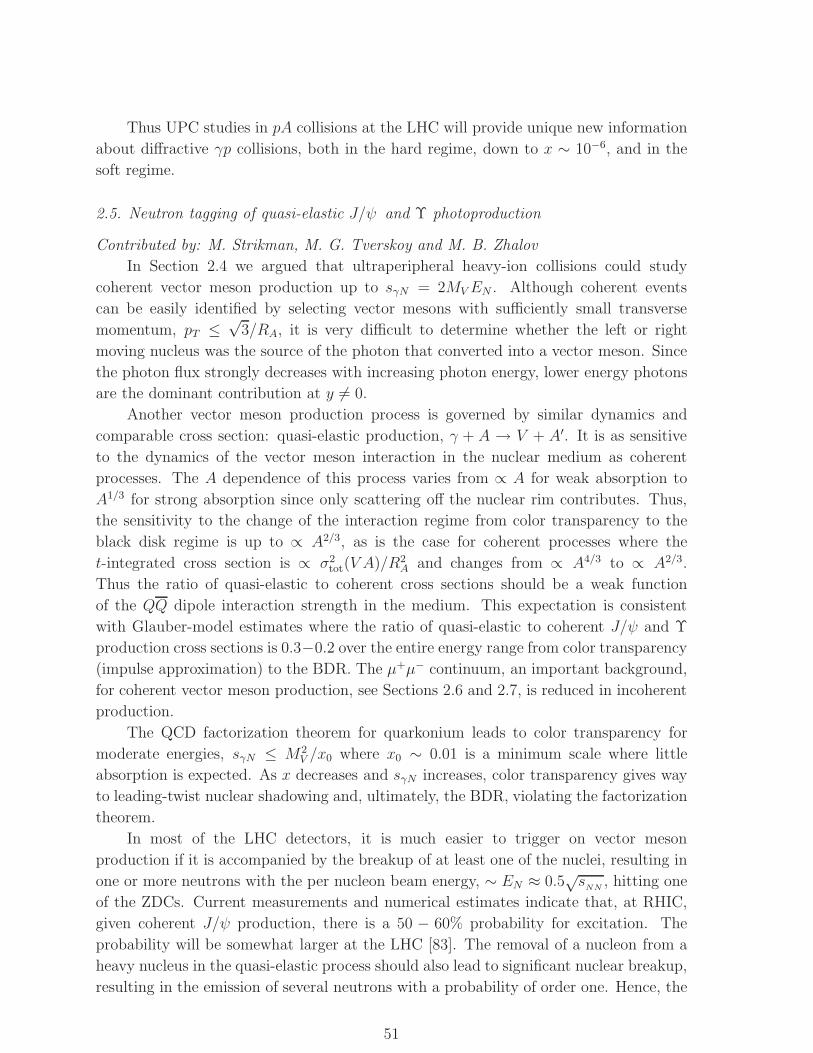
Thus UPC studies in pA collisions at the LHC will provide unique new information
about diffractive γp collisions, both in the hard regime, down to x ∼ 10−6, and in the
soft regime.
2.5. Neutron tagging of quasi-elastic J/ψ and Υ photoproduction
Contributed by: M. Strikman, M. G. Tverskoy and M. B. Zhalov
In Section 2.4 we argued that ultraperipheral heavy-ion collisions could study
coherent vector meson production up to sγN = 2MVEN . Although coherent events
can be easily identified by selecting vector mesons with sufficiently small transverse
momentum, pT ≤√
3/RA, it is very difficult to determine whether the left or right
moving nucleus was the source of the photon that converted into a vector meson. Since
the photon flux strongly decreases with increasing photon energy, lower energy photons
are the dominant contribution at y 6= 0.
Another vector meson production process is governed by similar dynamics and
comparable cross section: quasi-elastic production, γ + A → V + A′. It is as sensitive
to the dynamics of the vector meson interaction in the nuclear medium as coherent
processes. The A dependence of this process varies from ∝ A for weak absorption to
A1/3 for strong absorption since only scattering off the nuclear rim contributes. Thus,
the sensitivity to the change of the interaction regime from color transparency to the
black disk regime is up to ∝ A2/3, as is the case for coherent processes where the
t-integrated cross section is ∝ σ2tot(V A)/R2
A and changes from ∝ A4/3 to ∝ A2/3.
Thus the ratio of quasi-elastic to coherent cross sections should be a weak function
of the QQ dipole interaction strength in the medium. This expectation is consistent
with Glauber-model estimates where the ratio of quasi-elastic to coherent J/ψ and Υ
production cross sections is 0.3−0.2 over the entire energy range from color transparency
(impulse approximation) to the BDR. The µ+µ− continuum, an important background,
for coherent vector meson production, see Sections 2.6 and 2.7, is reduced in incoherent
production.
The QCD factorization theorem for quarkonium leads to color transparency for
moderate energies, sγN ≤ M2V /x0 where x0 ∼ 0.01 is a minimum scale where little
absorption is expected. As x decreases and sγN increases, color transparency gives way
to leading-twist nuclear shadowing and, ultimately, the BDR, violating the factorization
theorem.
In most of the LHC detectors, it is much easier to trigger on vector meson
production if it is accompanied by the breakup of at least one of the nuclei, resulting in
one or more neutrons with the per nucleon beam energy, ∼ EN ≈ 0.5√s
NN, hitting one
of the ZDCs. Current measurements and numerical estimates indicate that, at RHIC,
given coherent J/ψ production, there is a 50 − 60% probability for excitation. The
probability will be somewhat larger at the LHC [83]. The removal of a nucleon from a
heavy nucleus in the quasi-elastic process should also lead to significant nuclear breakup,
resulting in the emission of several neutrons with a probability of order one. Hence, the
51
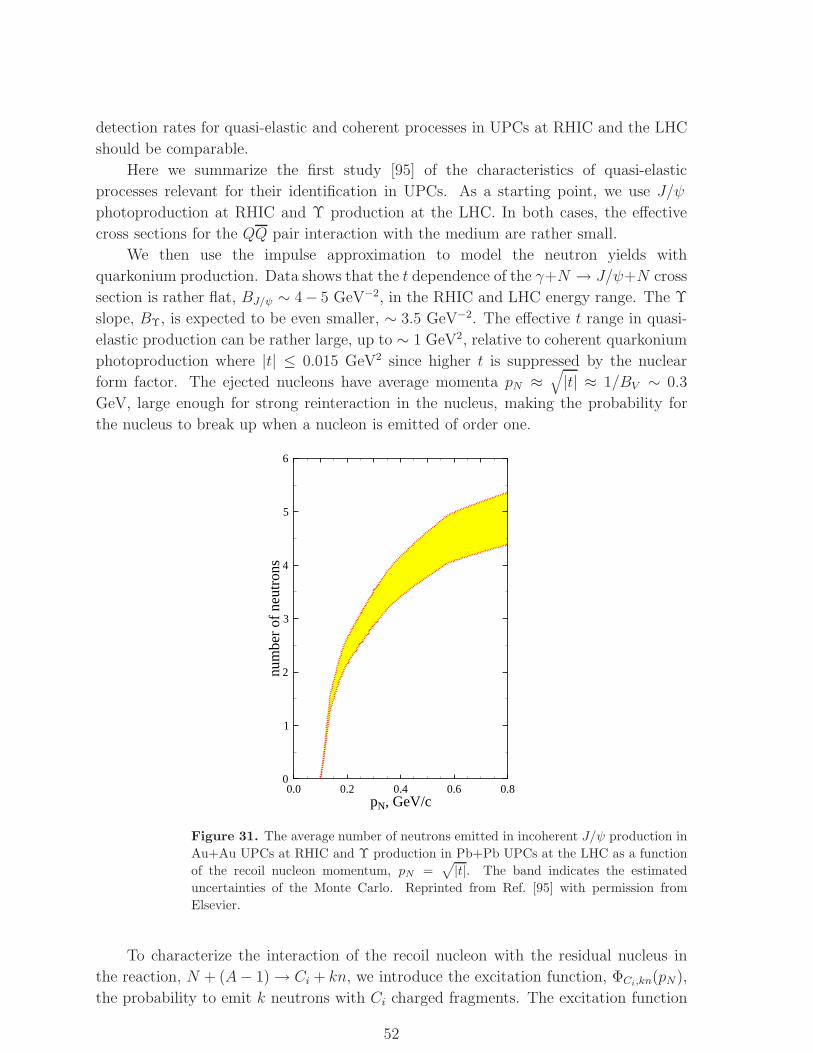
detection rates for quasi-elastic and coherent processes in UPCs at RHIC and the LHC
should be comparable.
Here we summarize the first study [95] of the characteristics of quasi-elastic
processes relevant for their identification in UPCs. As a starting point, we use J/ψ
photoproduction at RHIC and Υ production at the LHC. In both cases, the effective
cross sections for the QQ pair interaction with the medium are rather small.
We then use the impulse approximation to model the neutron yields with
quarkonium production. Data shows that the t dependence of the γ+N → J/ψ+N cross
section is rather flat, BJ/ψ ∼ 4− 5 GeV−2, in the RHIC and LHC energy range. The Υ
slope, BΥ, is expected to be even smaller, ∼ 3.5 GeV−2. The effective t range in quasi-
elastic production can be rather large, up to ∼ 1 GeV2, relative to coherent quarkonium
photoproduction where |t| ≤ 0.015 GeV2 since higher t is suppressed by the nuclear
form factor. The ejected nucleons have average momenta pN ≈√|t| ≈ 1/BV ∼ 0.3
GeV, large enough for strong reinteraction in the nucleus, making the probability for
the nucleus to break up when a nucleon is emitted of order one.
0.0 0.2 0.4 0.6 0.8pN, GeV/c
0
1
2
3
4
5
6
num
ber
ofne
utro
ns
Figure 31. The average number of neutrons emitted in incoherent J/ψ production in
Au+Au UPCs at RHIC and Υ production in Pb+Pb UPCs at the LHC as a function
of the recoil nucleon momentum, pN =√|t|. The band indicates the estimated
uncertainties of the Monte Carlo. Reprinted from Ref. [95] with permission from
Elsevier.
To characterize the interaction of the recoil nucleon with the residual nucleus in
the reaction, N + (A− 1) → Ci + kn, we introduce the excitation function, ΦCi,kn(pN),
the probability to emit k neutrons with Ci charged fragments. The excitation function
52
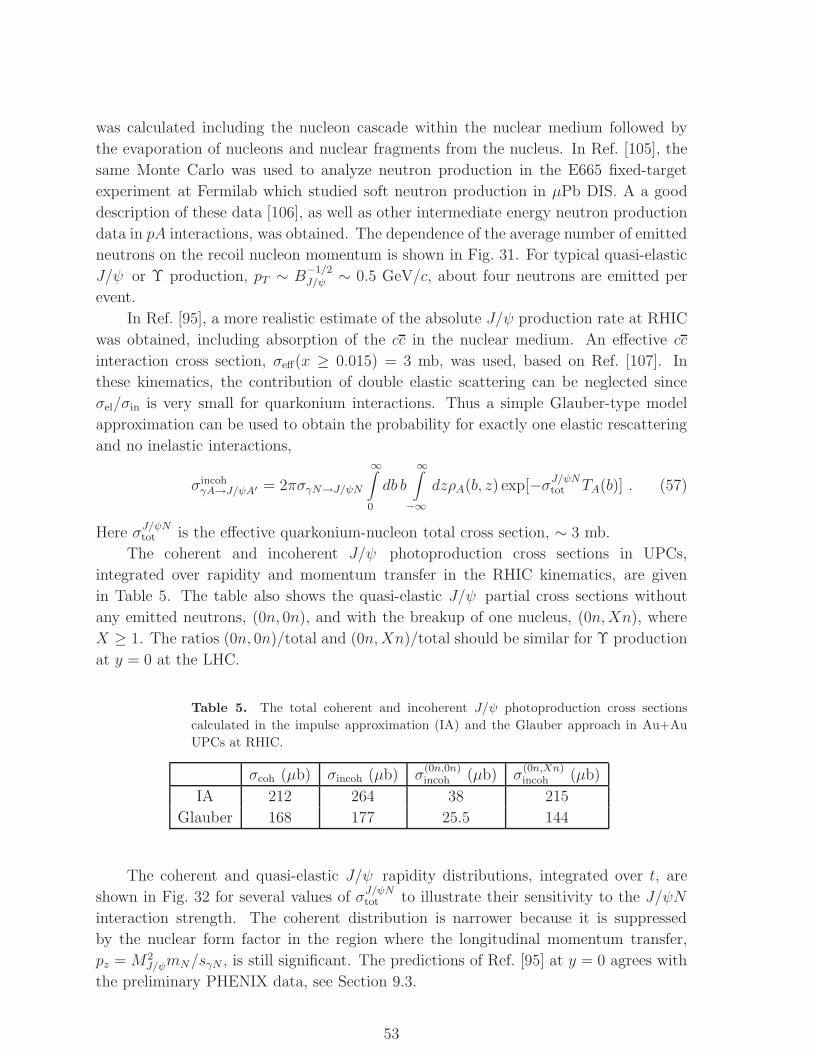
was calculated including the nucleon cascade within the nuclear medium followed by
the evaporation of nucleons and nuclear fragments from the nucleus. In Ref. [105], the
same Monte Carlo was used to analyze neutron production in the E665 fixed-target
experiment at Fermilab which studied soft neutron production in µPb DIS. A a good
description of these data [106], as well as other intermediate energy neutron production
data in pA interactions, was obtained. The dependence of the average number of emitted
neutrons on the recoil nucleon momentum is shown in Fig. 31. For typical quasi-elastic
J/ψ or Υ production, pT ∼ B−1/2J/ψ ∼ 0.5 GeV/c, about four neutrons are emitted per
event.
In Ref. [95], a more realistic estimate of the absolute J/ψ production rate at RHIC
was obtained, including absorption of the cc in the nuclear medium. An effective cc
interaction cross section, σeff(x ≥ 0.015) = 3 mb, was used, based on Ref. [107]. In
these kinematics, the contribution of double elastic scattering can be neglected since
σel/σin is very small for quarkonium interactions. Thus a simple Glauber-type model
approximation can be used to obtain the probability for exactly one elastic rescattering
and no inelastic interactions,
σincohγA→J/ψA′ = 2πσγN→J/ψN
∞∫
0
db b
∞∫
−∞
dzρA(b, z) exp[−σJ/ψNtot TA(b)] . (57)
Here σJ/ψNtot is the effective quarkonium-nucleon total cross section, ∼ 3 mb.
The coherent and incoherent J/ψ photoproduction cross sections in UPCs,
integrated over rapidity and momentum transfer in the RHIC kinematics, are given
in Table 5. The table also shows the quasi-elastic J/ψ partial cross sections without
any emitted neutrons, (0n, 0n), and with the breakup of one nucleus, (0n,Xn), where
X ≥ 1. The ratios (0n, 0n)/total and (0n,Xn)/total should be similar for Υ production
at y = 0 at the LHC.
Table 5. The total coherent and incoherent J/ψ photoproduction cross sections
calculated in the impulse approximation (IA) and the Glauber approach in Au+Au
UPCs at RHIC.
σcoh (µb) σincoh (µb) σ(0n,0n)incoh (µb) σ
(0n,Xn)incoh (µb)
IA 212 264 38 215
Glauber 168 177 25.5 144
The coherent and quasi-elastic J/ψ rapidity distributions, integrated over t, are
shown in Fig. 32 for several values of σJ/ψNtot to illustrate their sensitivity to the J/ψN
interaction strength. The coherent distribution is narrower because it is suppressed
by the nuclear form factor in the region where the longitudinal momentum transfer,
pz = M2J/ψmN/sγN , is still significant. The predictions of Ref. [95] at y = 0 agrees with
the preliminary PHENIX data, see Section 9.3.
53
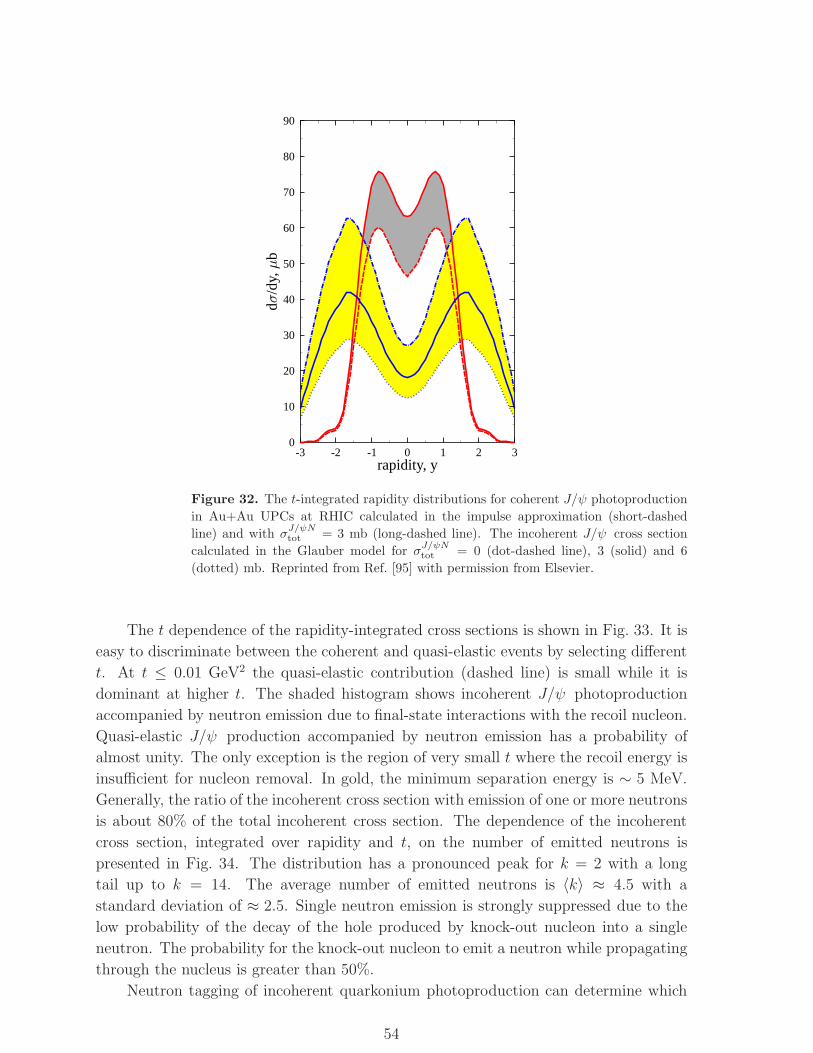
-3 -2 -1 0 1 2 3rapidity, y
0
10
20
30
40
50
60
70
80
90
d/d
y,b
Figure 32. The t-integrated rapidity distributions for coherent J/ψ photoproduction
in Au+Au UPCs at RHIC calculated in the impulse approximation (short-dashed
line) and with σJ/ψNtot = 3 mb (long-dashed line). The incoherent J/ψ cross section
calculated in the Glauber model for σJ/ψNtot = 0 (dot-dashed line), 3 (solid) and 6
(dotted) mb. Reprinted from Ref. [95] with permission from Elsevier.
The t dependence of the rapidity-integrated cross sections is shown in Fig. 33. It is
easy to discriminate between the coherent and quasi-elastic events by selecting different
t. At t ≤ 0.01 GeV2 the quasi-elastic contribution (dashed line) is small while it is
dominant at higher t. The shaded histogram shows incoherent J/ψ photoproduction
accompanied by neutron emission due to final-state interactions with the recoil nucleon.
Quasi-elastic J/ψ production accompanied by neutron emission has a probability of
almost unity. The only exception is the region of very small t where the recoil energy is
insufficient for nucleon removal. In gold, the minimum separation energy is ∼ 5 MeV.
Generally, the ratio of the incoherent cross section with emission of one or more neutrons
is about 80% of the total incoherent cross section. The dependence of the incoherent
cross section, integrated over rapidity and t, on the number of emitted neutrons is
presented in Fig. 34. The distribution has a pronounced peak for k = 2 with a long
tail up to k = 14. The average number of emitted neutrons is 〈k〉 ≈ 4.5 with a
standard deviation of ≈ 2.5. Single neutron emission is strongly suppressed due to the
low probability of the decay of the hole produced by knock-out nucleon into a single
neutron. The probability for the knock-out nucleon to emit a neutron while propagating
through the nucleus is greater than 50%.
Neutron tagging of incoherent quarkonium photoproduction can determine which
54
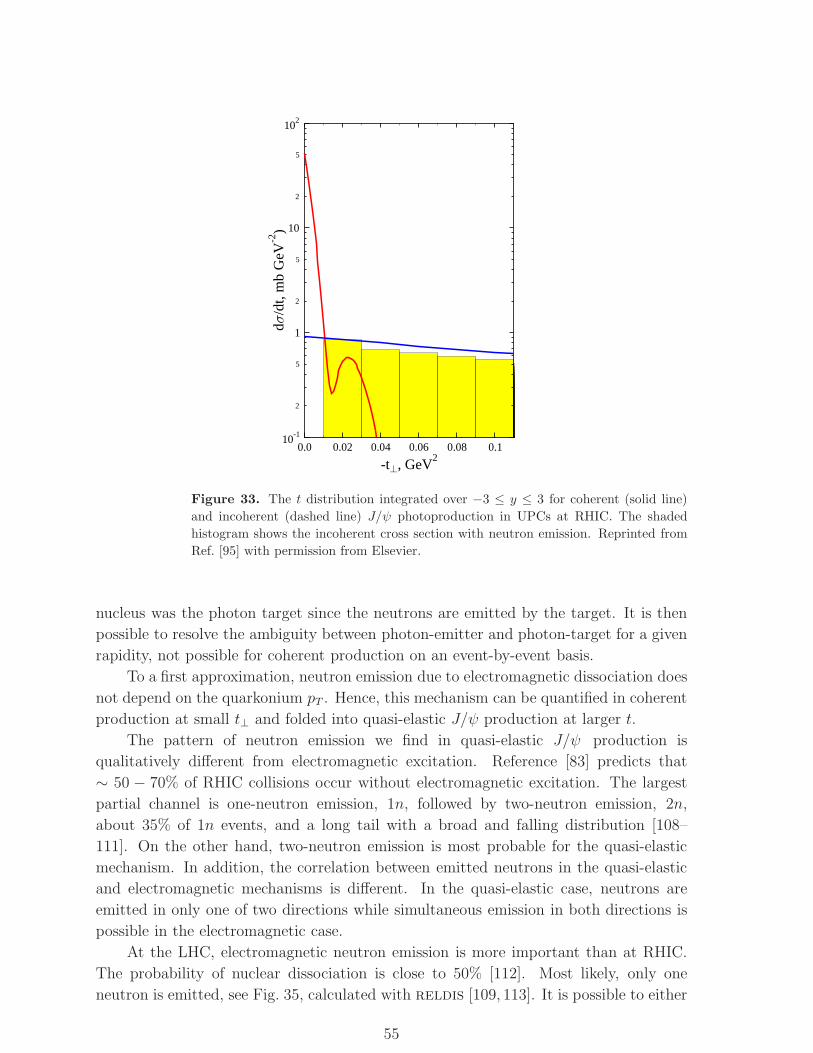
0.0 0.02 0.04 0.06 0.08 0.1
-t , GeV2
10-1
2
5
1
2
5
10
2
5
102
d/d
t,m
bG
eV-2
)
Figure 33. The t distribution integrated over −3 ≤ y ≤ 3 for coherent (solid line)
and incoherent (dashed line) J/ψ photoproduction in UPCs at RHIC. The shaded
histogram shows the incoherent cross section with neutron emission. Reprinted from
Ref. [95] with permission from Elsevier.
nucleus was the photon target since the neutrons are emitted by the target. It is then
possible to resolve the ambiguity between photon-emitter and photon-target for a given
rapidity, not possible for coherent production on an event-by-event basis.
To a first approximation, neutron emission due to electromagnetic dissociation does
not depend on the quarkonium pT . Hence, this mechanism can be quantified in coherent
production at small t⊥ and folded into quasi-elastic J/ψ production at larger t.
The pattern of neutron emission we find in quasi-elastic J/ψ production is
qualitatively different from electromagnetic excitation. Reference [83] predicts that
∼ 50 − 70% of RHIC collisions occur without electromagnetic excitation. The largest
partial channel is one-neutron emission, 1n, followed by two-neutron emission, 2n,
about 35% of 1n events, and a long tail with a broad and falling distribution [108–
111]. On the other hand, two-neutron emission is most probable for the quasi-elastic
mechanism. In addition, the correlation between emitted neutrons in the quasi-elastic
and electromagnetic mechanisms is different. In the quasi-elastic case, neutrons are
emitted in only one of two directions while simultaneous emission in both directions is
possible in the electromagnetic case.
At the LHC, electromagnetic neutron emission is more important than at RHIC.
The probability of nuclear dissociation is close to 50% [112]. Most likely, only one
neutron is emitted, see Fig. 35, calculated with reldis [109, 113]. It is possible to either
55

0 2 4 6 8 10 12 14number of neutrons
0
10
20
30
40
50
60
70
80
90
100
,b
Figure 34. The incoherent J/ψ cross section in Au+Au UPCs at RHIC as a function
of the number of emitted neutrons. A similar dependence is expected for Υ production
at the LHC. Reprinted from Ref. [95] with permission from Elsevier.
select only events where one nucleus did not dissociate or use a deconvolution procedure
to separate events where neutron emission is due to electromagnetic excitation rather
than nuclear dissociation. For example, the difference between the number of neutrons
emitted by two nuclear decays could be studied. A more detailed analysis, including
both electromagnetic and quasi-elastic neutron emission in quarkonium photoproduction
in UPCs will be presented elsewhere.
We have neglected diffractive quarkonium production with nucleon breakup, γ+p→J/ψ(Υ)+MX . For relatively small MX , the dissociation products will be not detected in
the central detector and the process would be identified as quasi-elastic. At HERA, the
ratio of quasi-elastic to elastic channels at t = 0, (dσγp→J/ψMX/dt)/(dσγp→J/ψp/dt) ≈ 0.2
and increases with t. Hence, although this process will be a small correction to low t
quasi-elastic scattering, it will dominate at |t| ≥ 0.5 GeV2. It will thus further enhance
the quasi-elastic signal. In principle, diffractive production could be separated using the
t-dependence of quasi-elastic quarkonium production with the neutron signal.
In summary, neutron tagging of incoherent quarkonium photoproduction in
ultraperipheral heavy-ion collisions may provide reliable event selection for quarkonium
production by high energy photons. Precision measurements of quasi-elastic processes,
combined with improved γp measurements, described in Section 2.4, could improve the
understanding of QQ propagation through the nuclear medium.
56
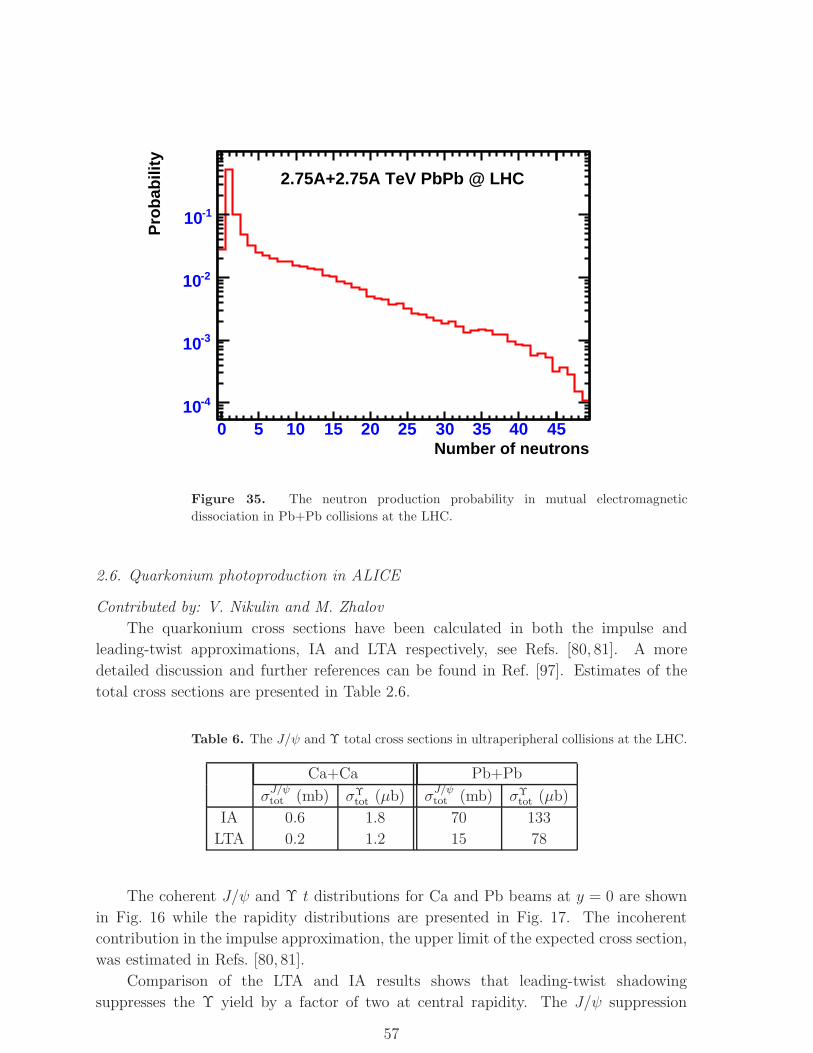
Number of neutrons0 5 10 15 20 25 30 35 40 45
Pro
bab
ility
-410
-310
-210
-110
2.75A+2.75A TeV PbPb @ LHC
Figure 35. The neutron production probability in mutual electromagnetic
dissociation in Pb+Pb collisions at the LHC.
2.6. Quarkonium photoproduction in ALICE
Contributed by: V. Nikulin and M. Zhalov
The quarkonium cross sections have been calculated in both the impulse and
leading-twist approximations, IA and LTA respectively, see Refs. [80, 81]. A more
detailed discussion and further references can be found in Ref. [97]. Estimates of the
total cross sections are presented in Table 2.6.
Table 6. The J/ψ and Υ total cross sections in ultraperipheral collisions at the LHC.
Ca+Ca Pb+Pb
σJ/ψtot (mb) σΥ
tot (µb) σJ/ψtot (mb) σΥ
tot (µb)
IA 0.6 1.8 70 133
LTA 0.2 1.2 15 78
The coherent J/ψ and Υ t distributions for Ca and Pb beams at y = 0 are shown
in Fig. 16 while the rapidity distributions are presented in Fig. 17. The incoherent
contribution in the impulse approximation, the upper limit of the expected cross section,
was estimated in Refs. [80, 81].
Comparison of the LTA and IA results shows that leading-twist shadowing
suppresses the Υ yield by a factor of two at central rapidity. The J/ψ suppression
57
is a factor of 4− 6 larger. In principle, multiple eikonal-type rescatterings due to gluon
exchanges could also suppress vector meson production. This mechanism predicts up to
a factor of two less suppression than leading-twist shadowing, at least for x ≤ 0.001.
Coherent quarkonium photoproduction in ultraperipheral AA collisions has a clear
signature: a single muon pair in the detector. Since the ions remain in the ground state,
there should be no ZDC signal. Any hadronic interaction would show ZDC activity. The
ZDC inefficiency is expected to be very low. Further improvement could be achieved, if
necessary, with a veto from the outer rings of the V0 detectors, see Section 10.2
The standard ALICE Level-0 trigger, L0, was not well suited for ultraperipheral
studies since it did not cover the barrel rapidity region, |y| < 1. However, the recently
proposed inner tracking system (ITS) pixel L0 trigger [114] might improve the situation.
Additional studies are still required to determine its utility for UPCs. Therefore events
with two muons in the barrel are not considered here. The photon detector (PHOS) L0
trigger has recently been introduced. It covers a relatively small area, about 10% of the
barrel solid angle. A fast veto from PHOS or the future electromagnetic calorimeter can
suppress more central events.
The dimuon trigger [115], covering −4 < η < −2.5, together with the PHOS veto
could select very low multiplicity events accompanied by fast muons. In addition, low
multiplicity selection could be applied at Level 1, L1. The dimuon L0 processor can
produce three kinds of triggers. The minimal-pT trigger, initially intended for monitoring
and testing, fires when a single muon passes a loose cut of pT > 0.5 GeV/c. The low-pTtrigger, used predominantly to select two-muon events with pT > 1 GeV/c, is designed
to tag J/ψ decays. The high-pT trigger selects heavy resonances (Υ, Υ′) by tagging
muon pairs with pT > 2 GeV/c. The minimal trigger rate is expected to be at the level
of 8 kHz for Pb+Pb interactions. The two last, tighter, triggers are intended to reduce
the dimuon rate to 1 kHz or less.
We have studied which trigger configurations may be most useful for studies of
quarkonium photoproduction in ALICE. At L0, only the muon trigger is used. The
minimal-pT muon trigger is vetoed by activity in PHOS. It selects events with at least one
muon in the muon spectrometer, including events with one muon in the spectrometer and
a second muon in the barrel. If the trigger rates are too high, the low-pT and/or the high-
pT triggers will be utilized. Here, only events with two muons in the spectrometer can be
triggered. At L1, ZDC information will be used to perform additional selection of very
peripheral events. The Level-2 trigger performs standard TPC past-future protection
while the high level trigger checks that the event contains only a few tracks.
Thus the proposed trigger enables the study of a class of events with “abnormally”
low multiplicity tagged by a muon. Among the reactions that could be measured are
coherent and incoherent quarkonium photoproduction and lepton pair production in
γγ interactions. Such a trigger could be integrated into the standard ALICE running
conditions.
The expected rates were estimated using the ALICE simulation code AliRoot [116].
In the simulation, a muon which traverses ten tracking and four trigger chambers of the
58
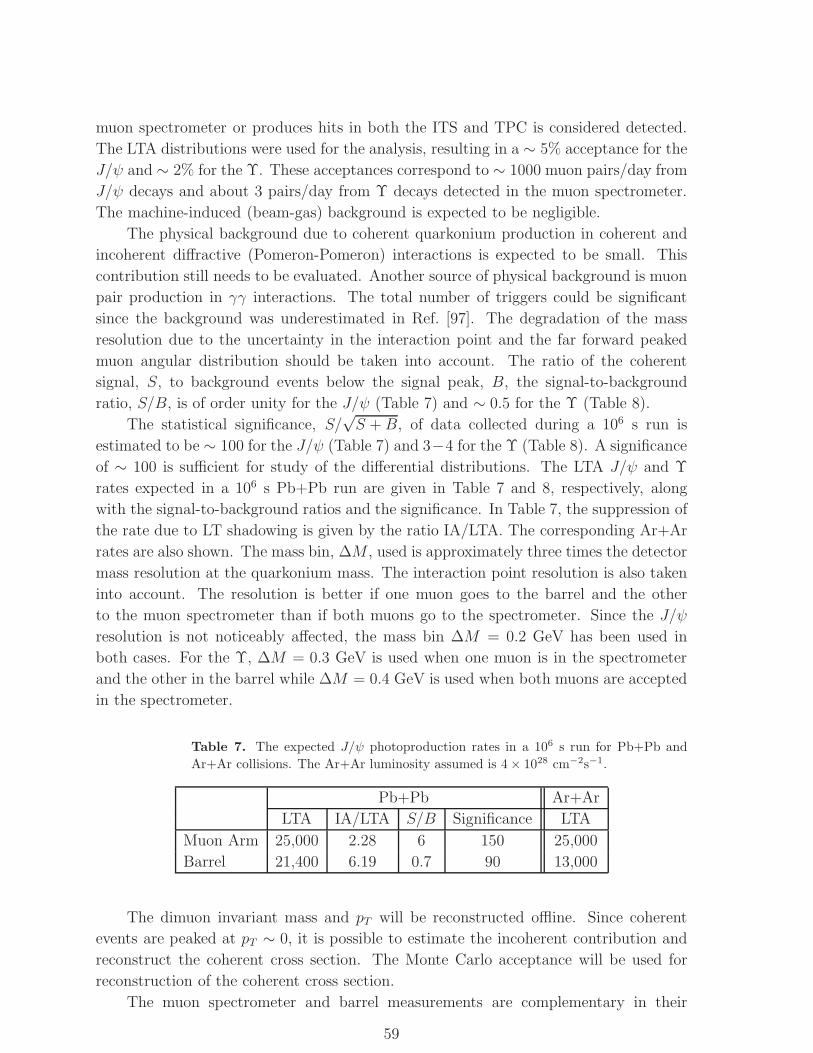
muon spectrometer or produces hits in both the ITS and TPC is considered detected.
The LTA distributions were used for the analysis, resulting in a ∼ 5% acceptance for the
J/ψ and ∼ 2% for the Υ. These acceptances correspond to ∼ 1000 muon pairs/day from
J/ψ decays and about 3 pairs/day from Υ decays detected in the muon spectrometer.
The machine-induced (beam-gas) background is expected to be negligible.
The physical background due to coherent quarkonium production in coherent and
incoherent diffractive (Pomeron-Pomeron) interactions is expected to be small. This
contribution still needs to be evaluated. Another source of physical background is muon
pair production in γγ interactions. The total number of triggers could be significant
since the background was underestimated in Ref. [97]. The degradation of the mass
resolution due to the uncertainty in the interaction point and the far forward peaked
muon angular distribution should be taken into account. The ratio of the coherent
signal, S, to background events below the signal peak, B, the signal-to-background
ratio, S/B, is of order unity for the J/ψ (Table 7) and ∼ 0.5 for the Υ (Table 8).
The statistical significance, S/√S +B, of data collected during a 106 s run is
estimated to be ∼ 100 for the J/ψ (Table 7) and 3−4 for the Υ (Table 8). A significance
of ∼ 100 is sufficient for study of the differential distributions. The LTA J/ψ and Υ
rates expected in a 106 s Pb+Pb run are given in Table 7 and 8, respectively, along
with the signal-to-background ratios and the significance. In Table 7, the suppression of
the rate due to LT shadowing is given by the ratio IA/LTA. The corresponding Ar+Ar
rates are also shown. The mass bin, ∆M , used is approximately three times the detector
mass resolution at the quarkonium mass. The interaction point resolution is also taken
into account. The resolution is better if one muon goes to the barrel and the other
to the muon spectrometer than if both muons go to the spectrometer. Since the J/ψ
resolution is not noticeably affected, the mass bin ∆M = 0.2 GeV has been used in
both cases. For the Υ, ∆M = 0.3 GeV is used when one muon is in the spectrometer
and the other in the barrel while ∆M = 0.4 GeV is used when both muons are accepted
in the spectrometer.
Table 7. The expected J/ψ photoproduction rates in a 106 s run for Pb+Pb and
Ar+Ar collisions. The Ar+Ar luminosity assumed is 4 × 1028 cm−2s−1.
Pb+Pb Ar+Ar
LTA IA/LTA S/B Significance LTA
Muon Arm 25,000 2.28 6 150 25,000
Barrel 21,400 6.19 0.7 90 13,000
The dimuon invariant mass and pT will be reconstructed offline. Since coherent
events are peaked at pT ∼ 0, it is possible to estimate the incoherent contribution and
reconstruct the coherent cross section. The Monte Carlo acceptance will be used for
reconstruction of the coherent cross section.
The muon spectrometer and barrel measurements are complementary in their
59
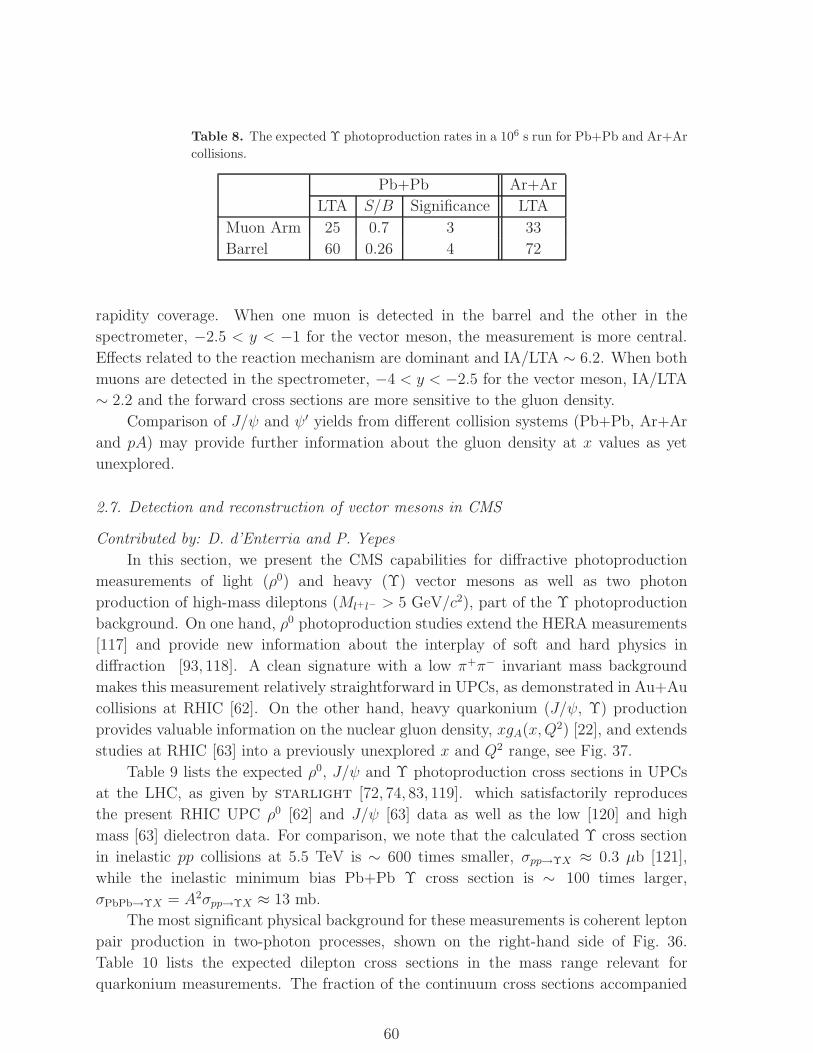
Table 8. The expected Υ photoproduction rates in a 106 s run for Pb+Pb and Ar+Ar
collisions.
Pb+Pb Ar+Ar
LTA S/B Significance LTA
Muon Arm 25 0.7 3 33
Barrel 60 0.26 4 72
rapidity coverage. When one muon is detected in the barrel and the other in the
spectrometer, −2.5 < y < −1 for the vector meson, the measurement is more central.
Effects related to the reaction mechanism are dominant and IA/LTA ∼ 6.2. When both
muons are detected in the spectrometer, −4 < y < −2.5 for the vector meson, IA/LTA
∼ 2.2 and the forward cross sections are more sensitive to the gluon density.
Comparison of J/ψ and ψ′ yields from different collision systems (Pb+Pb, Ar+Ar
and pA) may provide further information about the gluon density at x values as yet
unexplored.
2.7. Detection and reconstruction of vector mesons in CMS
Contributed by: D. d’Enterria and P. Yepes
In this section, we present the CMS capabilities for diffractive photoproduction
measurements of light (ρ0) and heavy (Υ) vector mesons as well as two photon
production of high-mass dileptons (Ml+l− > 5 GeV/c2), part of the Υ photoproduction
background. On one hand, ρ0 photoproduction studies extend the HERA measurements
[117] and provide new information about the interplay of soft and hard physics in
diffraction [93, 118]. A clean signature with a low π+π− invariant mass background
makes this measurement relatively straightforward in UPCs, as demonstrated in Au+Au
collisions at RHIC [62]. On the other hand, heavy quarkonium (J/ψ, Υ) production
provides valuable information on the nuclear gluon density, xgA(x,Q2) [22], and extends
studies at RHIC [63] into a previously unexplored x and Q2 range, see Fig. 37.
Table 9 lists the expected ρ0, J/ψ and Υ photoproduction cross sections in UPCs
at the LHC, as given by starlight [72, 74, 83, 119]. which satisfactorily reproduces
the present RHIC UPC ρ0 [62] and J/ψ [63] data as well as the low [120] and high
mass [63] dielectron data. For comparison, we note that the calculated Υ cross section
in inelastic pp collisions at 5.5 TeV is ∼ 600 times smaller, σpp→ΥX ≈ 0.3 µb [121],
while the inelastic minimum bias Pb+Pb Υ cross section is ∼ 100 times larger,
σPbPb→ΥX = A2σpp→ΥX ≈ 13 mb.
The most significant physical background for these measurements is coherent lepton
pair production in two-photon processes, shown on the right-hand side of Fig. 36.
Table 10 lists the expected dilepton cross sections in the mass range relevant for
quarkonium measurements. The fraction of the continuum cross sections accompanied
60
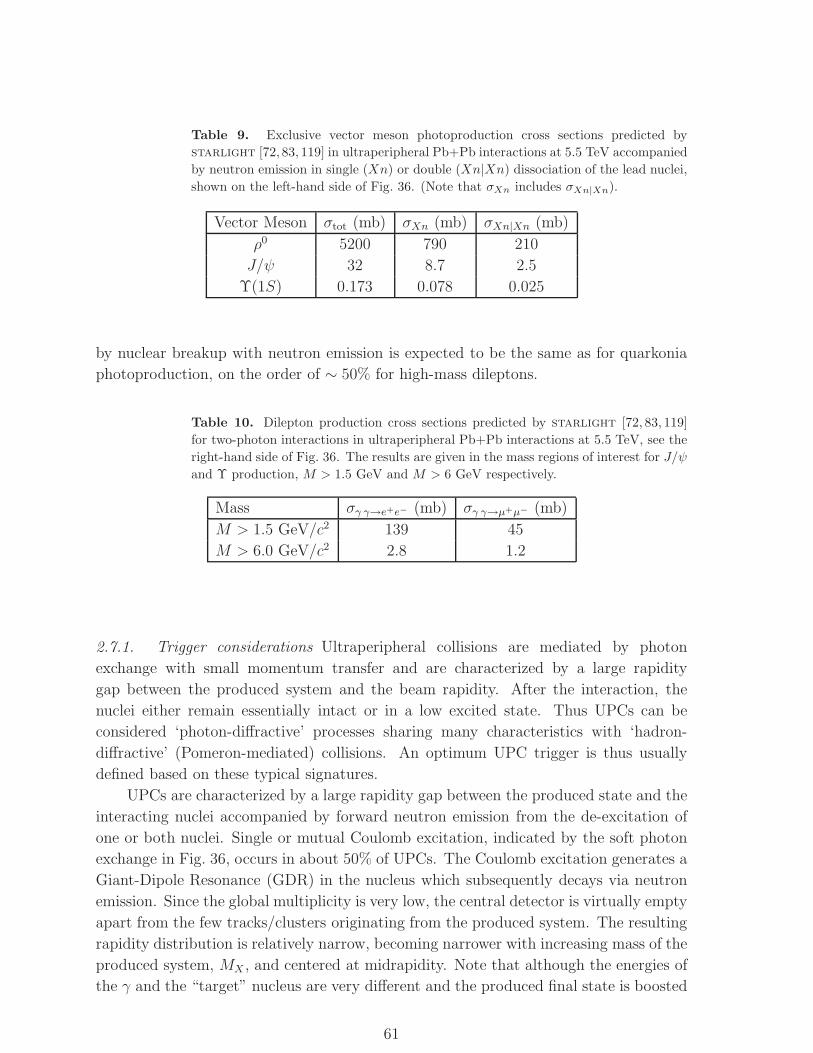
Table 9. Exclusive vector meson photoproduction cross sections predicted by
starlight [72, 83, 119] in ultraperipheral Pb+Pb interactions at 5.5 TeV accompanied
by neutron emission in single (Xn) or double (Xn|Xn) dissociation of the lead nuclei,
shown on the left-hand side of Fig. 36. (Note that σXn includes σXn|Xn).
Vector Meson σtot (mb) σXn (mb) σXn|Xn (mb)
ρ0 5200 790 210
J/ψ 32 8.7 2.5
Υ(1S) 0.173 0.078 0.025
by nuclear breakup with neutron emission is expected to be the same as for quarkonia
photoproduction, on the order of ∼ 50% for high-mass dileptons.
Table 10. Dilepton production cross sections predicted by starlight [72, 83, 119]
for two-photon interactions in ultraperipheral Pb+Pb interactions at 5.5 TeV, see the
right-hand side of Fig. 36. The results are given in the mass regions of interest for J/ψ
and Υ production, M > 1.5 GeV and M > 6 GeV respectively.
Mass σγ γ→e+e− (mb) σγ γ→µ+µ− (mb)
M > 1.5 GeV/c2 139 45
M > 6.0 GeV/c2 2.8 1.2
2.7.1. Trigger considerations Ultraperipheral collisions are mediated by photon
exchange with small momentum transfer and are characterized by a large rapidity
gap between the produced system and the beam rapidity. After the interaction, the
nuclei either remain essentially intact or in a low excited state. Thus UPCs can be
considered ‘photon-diffractive’ processes sharing many characteristics with ‘hadron-
diffractive’ (Pomeron-mediated) collisions. An optimum UPC trigger is thus usually
defined based on these typical signatures.
UPCs are characterized by a large rapidity gap between the produced state and the
interacting nuclei accompanied by forward neutron emission from the de-excitation of
one or both nuclei. Single or mutual Coulomb excitation, indicated by the soft photon
exchange in Fig. 36, occurs in about 50% of UPCs. The Coulomb excitation generates a
Giant-Dipole Resonance (GDR) in the nucleus which subsequently decays via neutron
emission. Since the global multiplicity is very low, the central detector is virtually empty
apart from the few tracks/clusters originating from the produced system. The resulting
rapidity distribution is relatively narrow, becoming narrower with increasing mass of the
produced system, MX , and centered at midrapidity. Note that although the energies of
the γ and the “target” nucleus are very different and the produced final state is boosted
61
in the direction of the latter, since each of the nuclei can act as both “emitter” and
“target”, the sum of their rapidity distributions is symmetric around y = 0.
Given these general properties of UPC events and based upon our previous
experience with the J/ψ in Au+Au UPCs at RHIC [63], we devised the following CMS
Level-1 primitives for the ultraperipheral trigger.
To ensure a large rapidity gap in one or in both hemispheres, we reject events
with signals in the forward hadron calorimeters towers, 3 < |η| < 5, above the default
energy threshold for triggering on minimum-bias nuclear interactions (HF+.OR.HF−).
Although pure γPb coherent events have rapidity gaps in both hemispheres, we are also
interested in triggering on “incoherent” γ N photoproduction which usually breaks the
target nucleus, partially filling one of the hemispheres with particles.
To tag Pb∗ Coulomb breakup by GDR neutron de-excitation, we require energy
deposition in the Zero Degree Calorimeters [122] (ZDC + .OR.ZDC−) above the default
threshold in normal Pb+Pb running. The availability of the ZDC signals in the L1
trigger decision is an advantage of CMS.
2.7.2. Light meson reconstruction Contributed by: P. Yepes
Here we present a feasibility study of light meson analysis in UPCs with CMS.
Triggering on reactions without nuclear breakup in CMS is difficult because the detector
is designed to trigger on transverse energy rather than multiplicity. The mesons
considered here, with masses less than a few GeV/c2, will deposit little energy in the
calorimeters. However, even for low mass particles, triggering on reactions with nuclear
breakup should be feasible using the CMS ZDCs. The ρ0 is used as a test case. We
show that, despite the 4 T magnetic field of CMS and a tracker designed for high pTparticles, acceptable reconstruction efficiencies are achieved.
A set of 1000 ρ0s produced in ultraperipheral Pb+Pb collisions was generated
[72, 83] and run through the detailed geant-3 based CMS simulation package, CMSIM
125, using a silicon pixel detector with three layers. Events were then passed through the
digitization packages using version 7.1.1 of the ORCA reconstruction program. Only
information from the silicon pixels was used. The performance of the reconstruction
algorithm does not significantly improve with one or two additional silicon layers. The
ρ0 candidates are reconstructed by combining opposite-sign tracks. The same-sign
background was negligible. The overall reconstruction efficiency is ǫ = 35%. For central
rapidities, |η| < 1, ǫ = 42%, while for more forward rapidities, 1 < η < 1.8, ǫ = 16%.
Therefore, we conclude that light mesons produced in UPCs with nuclear breakup can
be reconstructed in CMS if they are triggered with the ZDCs.
2.7.3. Υ Detection in CMS Contributed by: D. d’Enterria
At leading order, diffractive γA→ J/ψ (Υ) proceeds through a colorless two-gluon
(Pomeron) exchange, see the left-hand side of Fig. 36. After the scattering, both nuclei
62
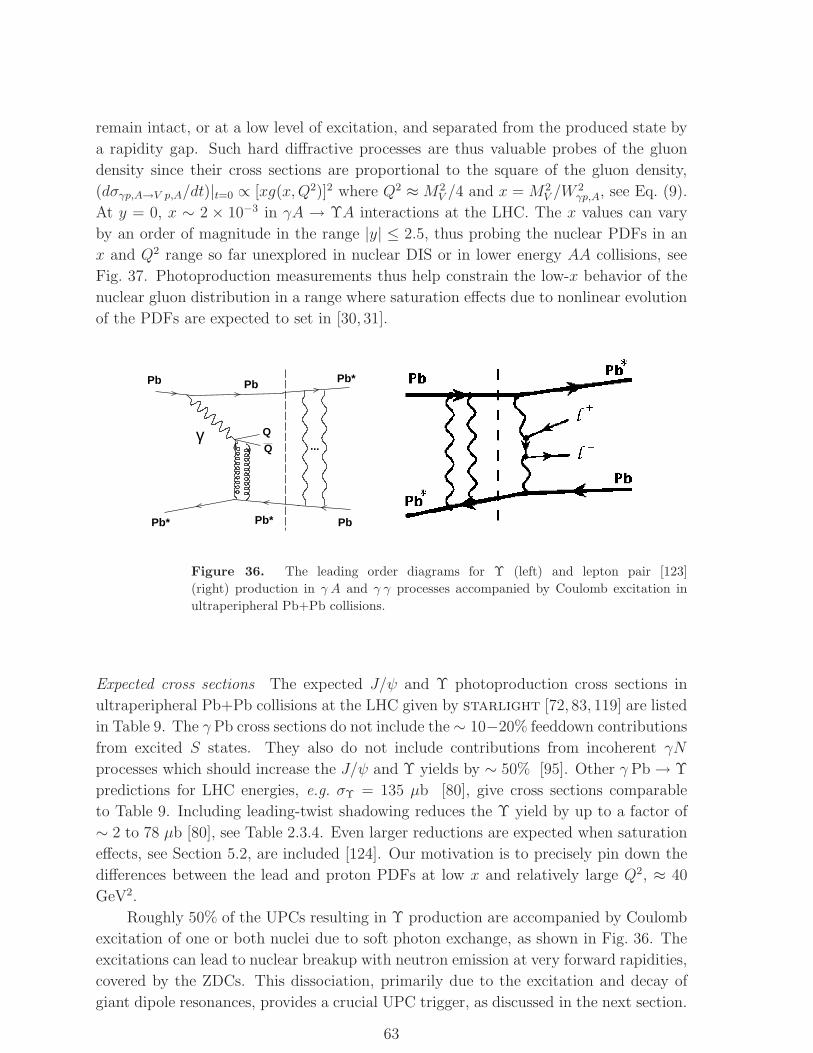
remain intact, or at a low level of excitation, and separated from the produced state by
a rapidity gap. Such hard diffractive processes are thus valuable probes of the gluon
density since their cross sections are proportional to the square of the gluon density,
(dσγp,A→V p,A/dt)|t=0 ∝ [xg(x,Q2)]2 where Q2 ≈M2V /4 and x = M2
V /W2γp,A, see Eq. (9).
At y = 0, x ∼ 2 × 10⁻³ in γA → ΥA interactions at the LHC. The x values can vary
by an order of magnitude in the range |y| ≤ 2.5, thus probing the nuclear PDFs in an
x and Q2 range so far unexplored in nuclear DIS or in lower energy AA collisions, see
Fig. 37. Photoproduction measurements thus help constrain the low-x behavior of the
nuclear gluon distribution in a range where saturation effects due to nonlinear evolution
of the PDFs are expected to set in [30, 31].
Pb*
Pb
γQ
Q...
Pb*
Pb
Pb
Pb*
Figure 36. The leading order diagrams for Υ (left) and lepton pair [123]
(right) production in γ A and γ γ processes accompanied by Coulomb excitation in
ultraperipheral Pb+Pb collisions.
Expected cross sections The expected J/ψ and Υ photoproduction cross sections in
ultraperipheral Pb+Pb collisions at the LHC given by starlight [72, 83, 119] are listed
in Table 9. The γ Pb cross sections do not include the ∼ 10−20% feeddown contributions
from excited S states. They also do not include contributions from incoherent γN
processes which should increase the J/ψ and Υ yields by ∼ 50% [95]. Other γ Pb → Υ
predictions for LHC energies, e.g. σΥ = 135 µb [80], give cross sections comparable
to Table 9. Including leading-twist shadowing reduces the Υ yield by up to a factor of
∼ 2 to 78 µb [80], see Table 2.3.4. Even larger reductions are expected when saturation
effects, see Section 5.2, are included [124]. Our motivation is to precisely pin down the
differences between the lead and proton PDFs at low x and relatively large Q2, ≈ 40
GeV2.
Roughly 50% of the UPCs resulting in Υ production are accompanied by Coulomb
excitation of one or both nuclei due to soft photon exchange, as shown in Fig. 36. The
excitations can lead to nuclear breakup with neutron emission at very forward rapidities,
covered by the ZDCs. This dissociation, primarily due to the excitation and decay of
giant dipole resonances, provides a crucial UPC trigger, as discussed in the next section.
63

x -610 -510 -410 -310 -210 -110 1
)2 (G
eV2
Q
-210
-110
1
10
210
310
410
510
x -610 -510 -410 -310 -210 -110 1
)2 (G
eV2
Q
-210
-110
1
10
210
310
410
510 )ηRHIC data (forw.
= 3.2)η (±BRAHMS h
= 1.8)η (±PHENIX h
Nuclear DIS & DY data:NMC (DIS)SLAC-E139 (DIS)FNAL-E665 (DIS)EMC (DIS)FNAL-E772 (DY)
perturbative
non-perturbative
Υ →UPC PbPb = 5.5 TeVNNs|y|<2.5,
Figure 37. Measurements in the (x,Q2) plane used to constrain the nuclear PDFs.
The approximate (x,Q2) range covered by ultraperipheral Υ photoproduction in
Pb+Pb collisions at√s
NN= 5.5 TeV in |η| < 2.5 is indicated. Reprinted from
Ref. [125] with permission from the Institute of Physics.
The coherent photon fields generated by the ultrarelativistic nuclei have very small
virtualities, pT < 2hc/RA ≈ 50 MeV/c. Coherent production thus results in very low
pT J/ψs so that the pT of the decay leptons, ∼ mJ/ψ/2, is too low to reach the detectors
due to the large CMS magnetic field. We thus concentrate on the Υ since the decay
lepton energies are ∼ 5 GeV and can, therefore, reach the electromagnetic calorimeter
(ECAL) and the muon chambers to be detected. In particular, this analysis focuses on
Υ measurements in the CMS barrel and endcap regions, |η| < 2.5, for:
(1) γ Pb → Υ + Pb⋆Pb(⋆), Υ → e+e− measured in the ECAL;
(2) γ Pb → Υ + Pb⋆Pb(⋆), Υ → µ+µ− measured in the muon chambers.
The ⋆ superscript indicates that one or both lead nuclei may be excited. Here and below,
the presence of the lead nucleus that emits the photon is implied but not explicitly
shown.
The most significant background source is coherent dilepton production in two-
photon processes, shown on the right-hand side of Fig. 36:
(1) γ γ → Pb⋆Pb(⋆) + e+e−, measured in the ECAL;
(2) γ γ → Pb⋆Pb(⋆) + µ+µ−, measured in the muon chambers.
These are interesting pure QED processes and have been proposed as a luminosity
monitor in pp and AA collisions at the LHC [126, 127]. As such, they may be used to
normalize the absolute cross section of this and other heavy-ion measurements. Table 10
lists the expected dilepton cross sections in the mass ranges relevant for the quarkonia
measurements. The fraction of the continuum cross sections accompanied by nuclear
breakup with neutron emission is of the order of ∼ 50%, as is the case for quarkonium
photoproduction.
Level-1 and High-Level Triggers
64
Level-1 trigger
Given the general considerations discussed in Section 2.7.1 and experience with J/ψ
photoproduction studies in ultraperipheral Au+Au collisions at RHIC [63], we propose
to use several CMS Level-1 (L1) primitives as part of the ultraperipheral trigger.
We require a large rapidity gap in one or both hemispheres (forward/backward of
midrapidity). Thus we veto signals in the forward hadron (HF) calorimeters, 3 < |η| < 5,
above the default minimum bias energy threshold, HF+.OR.HF−, where the ± refers to
the forward/backward region and the bar over the HF signifies veto. We do not make an
AND veto to require the absence of a signal in both HF towers, a signal of coherent γPb
events with gaps in both hemispheres, because we also want to trigger on incoherent
photoproduction (γN) where the target nucleus breaks up, partially populating the
hemisphere on that side. There should be one or more neutrons, Xn, in at least one
ZDC, ZDC + .OR.ZDC−, to tag Coulomb breakup of the excited lead nucleus due to de-
excitation of the GDR by neutron emission.
Leptons from Υ decays have energy El >∼ mΥ/2 ∼ 4.6 GeV. Electrons and muons
from these decays are triggered in two different ways. Electrons from Υ decays are
selected by energy deposition in an isolated ECAL trigger tower with threshold energy
greater than 3 GeV. Muons can be selected by hits in the muon resistive plate chambers
(RPCs), |η| < 2.1, or cathode strip chambers (CSCs), 0.8 < |η| < 2.4. No track
momentum threshold is required since the material budget in front of the chambers
effectively reduces any muon background below ∼ 4 GeV.
The following two dedicated L1 UPC triggers are thus proposed:
UPC-mu-L1=(ZDC+.OR.ZDC-).AND.(HF+.OR.HF−).AND.(muonRPC.OR.muonCSC) ;
UPC-e-L1=(ZDC+.OR.ZDC-).AND.(HF+.OR.HF−).AND.ECALtower(E > 2.5 GeV) .
Expected L1 trigger rates
The coherent Υ → l+ l− photoproduction rate, NΥ, assuming a perfect trigger, full
acceptance and no efficiency losses at the nominal Pb+Pb luminosity, LPbPb = 0.5
mb−1s−1, is
NΥ = LPbPb B(Υ → l+ l−) σΥ (58)
= 0.5 mb−1s−1 × 0.024 × 0.078 mb = 0.001 Hz
or 1000 Υ(1S) dilepton decays in a 106 s run.
There will be several sources of background that will also satisfy the UPC-L1
triggers defined above. For the purpose of estimating the trigger rates, we consider
sources of physical and “non-physical” backgrounds which have characteristics similar
to a UPC event and, therefore, can potentially fulfill UPC-L1 trigger criteria. All these
processes give a ZDC signal.
Beam-gas and beam-halo collisions do not have a good vertex. They have a
comparatively large multiplicity with an asymmetric dN/dy and relatively low transverse
65
energy, ET . However, this process will be suppressed by the rapidity gap requirement,
(HF+.OR.HF−), and will not be discussed further.
High L1 background rates may be generated by the coincidence of cosmic-ray muons
with electromagnetic nuclear dissociation (ED) and peripheral nuclear collisions. Cosmic
rays in coincidence with ED, γA → Pb⋆ + Pb(⋆) with Xn neutrons hitting the ZDC,
will have large net pT tracks in the muon chambers alone but no collision vertex. The
ZDC signal is from lead dissociation. Peripheral nuclear collisions, AA → X also have
a ZDC signal but have relatively large hadron multiplicities with large pT .
A background process with an almost indistinguishable signal at L1 arises from
two-photon production of dileptons, γγ → l+l−. We thus discuss this process further
as a possible reference process in the remainder of this section. This background can
be significantly reduced by an asymmetry cut on the lepton pair while the residual
contribution below the Υ mass can be statistically subtracted in the offline analysis, see
Section 2.7.3.
Finally, some background arises from interesting low rate processes that can be
studied offline as a byproduct of the UPC trigger. These include hadronic diffraction,
hard diffractive photoproduction and two-photon hadronic production. Hadronic
diffractive collisions, IP Pb, IP IP → X, have larger multiplicities than diffractive
photoproduction and predominantly produce pions rather than vector states. A like-
sign subtraction can remove the pion background. The pT is also larger for diffractive
processes, pT (IPIP ) > pT (γIP ) > pT (γ γ). Hard diffraction, e.g. dijet and QQ
production, is also characterized by larger multiplicities. These background events can
be removed offline using standard subtraction techniques.
The single and mutual electromagnetic lead dissociation cross section at the crossing
point of the two beams is σS(M)ED = 215 b [109], the main limitation on the Pb+Pb
luminosity achievable at the LHC. Such large cross sections translate into very large
rates, NS(M)ED = LPbPbσS(M)ED = 105 Hz. Thus accidental coincidences with cosmic ray
muons traversing the muon chamber and activating the UPC-mu-L1 trigger are possible.
The typical cosmic ray muon rate at ground level is about 60 Hz/m2 with 〈Eµ〉 ≈ 4
GeV [128]. At the IP5 cavern, ∼ 80 m underground, the rate is reduced to ∼ 6 Hz/m2.
Muons which traverse the rock overburden above CMS typically have an energy at the
surface of at least 10 GeV. Since the surface area of the muon chambers is ∼ 20 × 15
m2, the total rate of cosmic ray muons entering the chambers is Ncosmic ≈ 2 kHz. The
accidental coincidence rate for two detectors with counting rates N1 and N2 in a trigger
time window ∆ttrig is Nacc = 2N1N2 ∆ttrig. If ∆ttrig = 10 ns around the nominal bunch
crossing time of 25 ns, we have
NS(M)EDcosmic = 2NS(M)EDNcosmic ∆ttrig (59)
≈ 2 × 105 Hz × 2000 Hz × 10−8 Hz−1 ≈ 4 Hz .
However, very few cosmic ray muons pass the trigger if we require the tracks to be
pointing to the vertex. There is a factor of 2500 reduction when we require zhit < 60
cm and Rhit < 20 cm. In the high-level trigger (HLT), this background can be reduced
66
by requiring vertex reconstruction.
At RHIC energies, usually ǫperiph ≈ 5% of the most peripheral nuclear AA
interactions (95 − 100% of the total AA cross section) do not generate activity within
3 < |η| < 4 but still produce a signal in the ZDC [129]. Assuming that the same fraction
of Pb+Pb collisions at the LHC will be accepted by the virtually identical L1 condition
(ZDC+.OR.ZDC-).AND.(HF+.OR. HF−). Such Pb+Pb collisions will fire UPC-e-L1 and/or
UPC-mu-L1 provided that these reactions also produce a lepton of sufficient energy. An
analysis of a few hundred thousand minimum-bias pp events at 5.5 TeV generated using
pythia 6.4 [130], ǫl ≈ 1% of the collisions generate at least one lepton within |η| < 2.5
above the UPC-L1 energy thresholds. We assume the same relative fraction will hold
for peripheral Pb+Pb interactions. The corresponding rate for this background is
Nhad = LPbPb σtot ǫperiph ǫl (60)
= 0.5 mb−1s−1 × 8000 mb × 0.05 × 0.01 ≈ 2 Hz .
If the HF veto is insufficient to reduce these background rates at L1, an additional
L1 primitive may be considered such as the total energy in the ECAL-HCAL system,
requiring an energy deposition only a few GeV above the calorimeter noise level. This
will suppress peripheral hadronic interactions since their multiplicity is much larger than
ultraperipheral events.
We now discuss the γγ → e+e− background in more detail. The known γγ → e+e−
QED cross sections are given in Table 10. Simulations have shown that the fraction of
these events producing an electron within |η| < 2.5 and above the 3 GeV ECAL trigger
threshold and potentially firing UPC-e-L1, is only ǫe ∼ 5%. Since the corresponding
fraction of muons triggering UPC-mu-L1 is even lower, we do not include it here. There
is a 50% probability for neutron emission, Pn, incorporated into the rate. Thus, the
expected rate for this background is
Nγ γ = LPbPb σγ γ→e+e− Pn ǫe (61)
= 0.5 mb−1s−1 × 139 mb × 0.5 × 0.05 = 1.7 Hz .
The conservative background sum, NL1 = NS(M)EDcosmic +Nhad +Nγ γ+ others ∼ 5 − 7
Hz, is a factor of ∼ 5000 − 7000 smaller than the Υ rate in Eq. (59). It is therefore
important to not have any significant trigger dead-time and not to remove good events
in the high-level trigger selection.
High Level Trigger
The CMS L1 trigger can pass all selected Pb+Pb events, ∼ 3 kHz on average, and send
them to the HLT without reduction [131, 384]. The UPC trigger bandwidth allocated
in the HLT is 2.25 MByte/s (1% of the total rate) or ∼ 1− 2 Hz for an ultraperipheral
event of 1 − 2 MB. The estimated event size of a very peripheral Pb+Pb hadronic
interaction with b > 12 fm is 0.3 MB plus a conservative 1 MB “noise” overhead. Since
events triggering the UPC-L1 trigger have, by design, very low multiplicities, they will
be below 2 MB already at L1.
67
Recording UPC-HLT rates at the allocated 1−2 Hz rate requires a factor of 2.5−7
reduction relative to the expected UPC-L1 rates. To do so, we will need to apply
one or more simple algorithms at the HLT level to match the allocated bandwidth.
First, the L1 electron/muon candidates should be verified with a L1-improved software
check to remove fake triggers. Next, the event vertex should be within z < 15 cm of
(0,0,0). The inherent low track/cluster multiplicity of UPC events results in a rather
wide vertex distribution. An even looser cut, z < 60 cm, is expected to reduce the
cosmic ray background by a factor of 2500, as well as any remaining beam-gas or beam-
halo events. Finally, two pT cuts can be applied. The total pT of all particles should
be low. This can be checked by making a rough determination of the net pT of all
muon/electron HLT candidates in the event. Hadrons emitted in peripheral hadronic
events at√s
NN= 5.5 TeV have 〈pT 〉 ≈ 600 MeV/c, much larger than the 〈pT 〉 ≈ 70
MeV/c expected for coherent photoproduction events. Thus this cut should significantly
reduce the peripheral AA background. However, we may also want to study other hard
photoproduction events with larger pT which satisfy the UPC-L1 trigger. Therefore
it is probably more appropriate to select back-to-back dileptons, part of the global
calorimeter and muon triggers. All these considerations can be taken into account when
setting the final L1 thresholds and HLT algorithms and do not affect the quantitative
conclusions about the Υ measurement described here.
Input Monte Carlo Event samples for the Υ → l+l− signal and the dilepton continuum
are generated with the starlight Monte Carlo [72, 83, 119]. The input Monte Carlo
pT , rapidity and lepton pair invariant mass distributions for the signal and background
are shown in Figs. 38 and 39.
The most significant characteristic of coherent particle production in UPCs is the
extremely soft pT distribution. The Υ and the lepton pairs are produced almost at
rest. The Υ pT distribution is also sensitive to the nuclear form factor for lead.
Figure 38 shows a diffractive pattern with several diminishing local maxima. The
dilepton mass distribution decreases locally like an exponential or power law, shown
in the top left plot of Fig. 39. The signal and background rapidity distributions are
peaked at y = 0. The continuum distribution is broader because it also includes lower
mass pairs. Interestingly, the rapidity distributions of the single decay leptons are much
narrower for the Υ (Fig. 38, right) than the l+ l− continuum (Fig. 39, bottom right).
One or both leptons from the continuum is often emitted outside the CMS rapidity
coverage and, therefore, will not affect the Υ invariant mass reconstruction.
Υ → l+l− acceptance and reconstruction efficiency Figure 40 shows the convolution
of efficiency with acceptance for CMS as a function of the Υ rapidity and transverse
momentum respectively in the µ+µ− (dashed) and e+e− (solid) analyses, obtained by
taking the ratio of reconstructed relative to input spectra. Note that although the
68
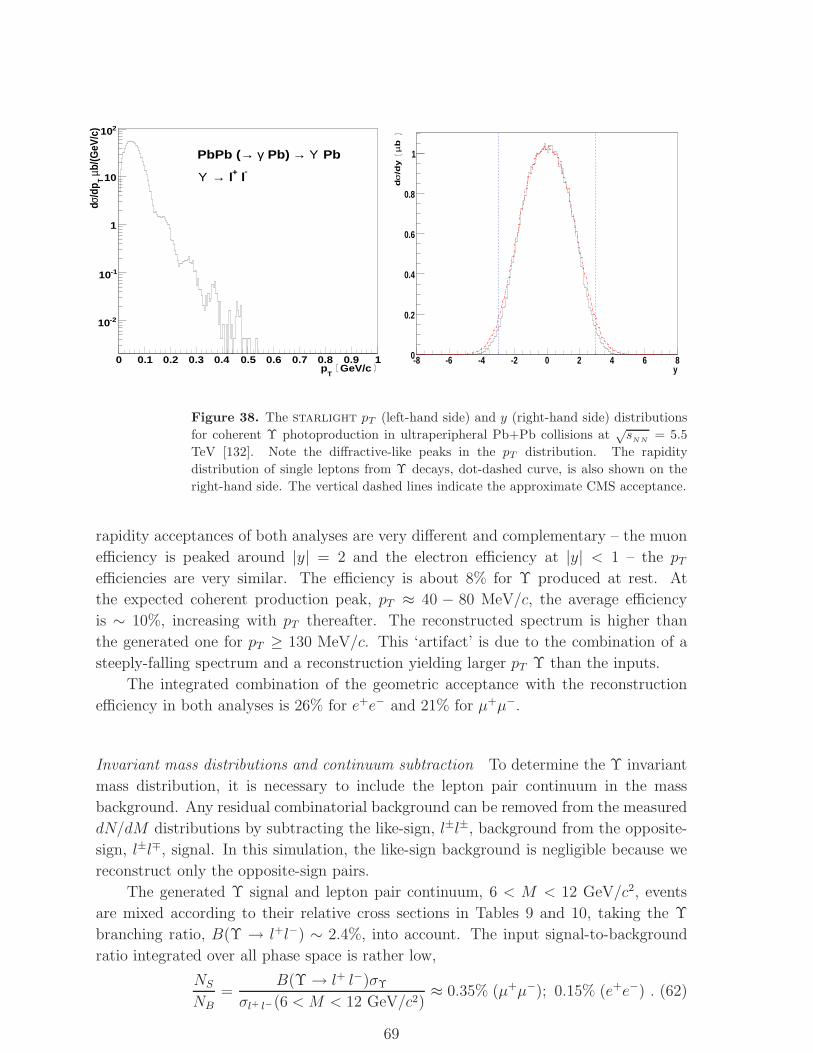
GeV/c T
p0 0.1 0.2 0.3 0.4 0.5 0.6 0.7 0.8 0.9 1
b/(G
eV/c
)µ T
/dp
σd
-210
-110
1
10
210
PbΥ → Pb) γ →PbPb (- l+ l→ Υ
y-8 -6 -4 -2 0 2 4 6 8
b
µ/d
y
σd
0
0.2
0.4
0.6
0.8
1
Figure 38. The starlight pT (left-hand side) and y (right-hand side) distributions
for coherent Υ photoproduction in ultraperipheral Pb+Pb collisions at√s
NN= 5.5
TeV [132]. Note the diffractive-like peaks in the pT distribution. The rapidity
distribution of single leptons from Υ decays, dot-dashed curve, is also shown on the
right-hand side. The vertical dashed lines indicate the approximate CMS acceptance.
rapidity acceptances of both analyses are very different and complementary – the muon
efficiency is peaked around |y| = 2 and the electron efficiency at |y| < 1 – the pTefficiencies are very similar. The efficiency is about 8% for Υ produced at rest. At
the expected coherent production peak, pT ≈ 40 − 80 MeV/c, the average efficiency
is ∼ 10%, increasing with pT thereafter. The reconstructed spectrum is higher than
the generated one for pT ≥ 130 MeV/c. This ‘artifact’ is due to the combination of a
steeply-falling spectrum and a reconstruction yielding larger pT Υ than the inputs.
The integrated combination of the geometric acceptance with the reconstruction
efficiency in both analyses is 26% for e+e− and 21% for µ+µ−.
Invariant mass distributions and continuum subtraction To determine the Υ invariant
mass distribution, it is necessary to include the lepton pair continuum in the mass
background. Any residual combinatorial background can be removed from the measured
dN/dM distributions by subtracting the like-sign, l±l±, background from the opposite-
sign, l±l∓, signal. In this simulation, the like-sign background is negligible because we
reconstruct only the opposite-sign pairs.
The generated Υ signal and lepton pair continuum, 6 < M < 12 GeV/c2, events
are mixed according to their relative cross sections in Tables 9 and 10, taking the Υ
branching ratio, B(Υ → l+l−) ∼ 2.4%, into account. The input signal-to-background
ratio integrated over all phase space is rather low,
NS
NB=
B(Υ → l+ l−)σΥ
σl+ l−(6 < M < 12 GeV/c2)≈ 0.35% (µ+µ−); 0.15% (e+e−) . (62)
69
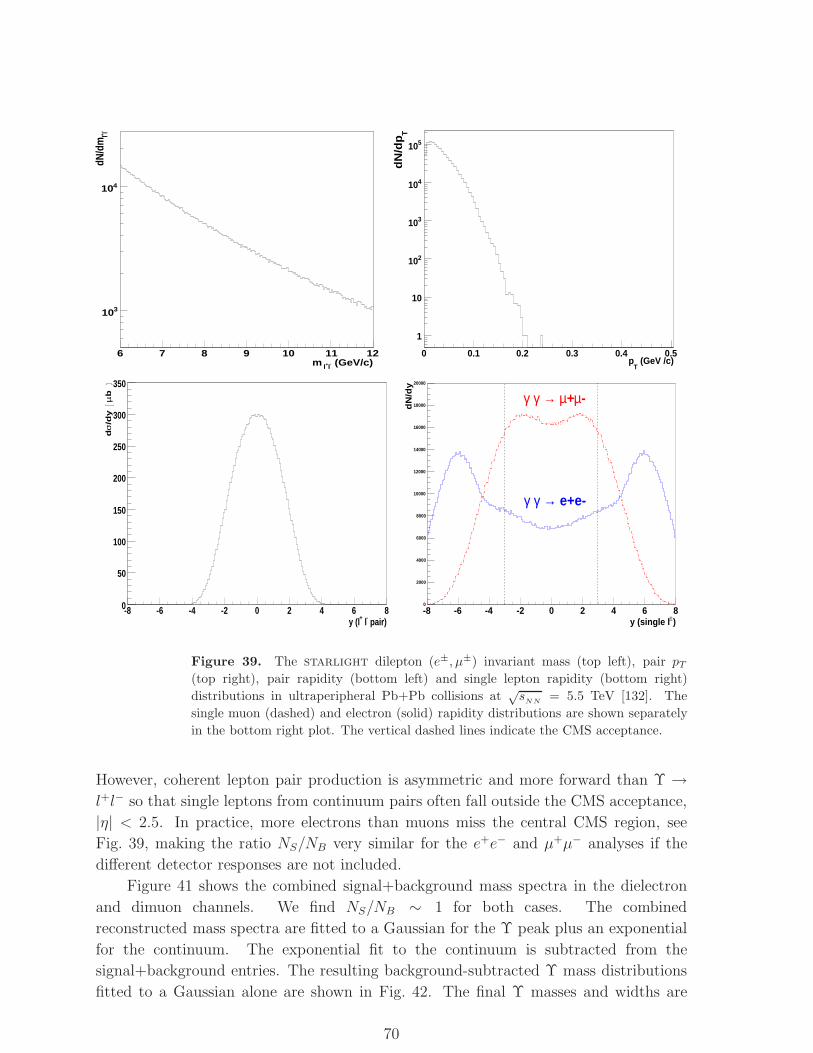
(GeV/c)-l+ lm6 7 8 9 10 11 12
- l+ ldN
/dm
310
410
(GeV /c)T
p0 0.1 0.2 0.3 0.4 0.5
Td
N/d
p
1
10
210
310
410
510
pair)- l+y (l-8 -6 -4 -2 0 2 4 6 8
b
µ/d
y
σd
0
50
100
150
200
250
300
350
)±y (single l-8 -6 -4 -2 0 2 4 6 8
dN
/dy
0
2000
4000
6000
8000
10000
12000
14000
16000
18000
20000
e+e-→ γ γ
-µ+µ → γ γ
Figure 39. The starlight dilepton (e±, µ±) invariant mass (top left), pair pT(top right), pair rapidity (bottom left) and single lepton rapidity (bottom right)
distributions in ultraperipheral Pb+Pb collisions at√s
NN= 5.5 TeV [132]. The
single muon (dashed) and electron (solid) rapidity distributions are shown separately
in the bottom right plot. The vertical dashed lines indicate the CMS acceptance.
However, coherent lepton pair production is asymmetric and more forward than Υ →l+l− so that single leptons from continuum pairs often fall outside the CMS acceptance,
|η| < 2.5. In practice, more electrons than muons miss the central CMS region, see
Fig. 39, making the ratio NS/NB very similar for the e+e− and µ+µ− analyses if the
different detector responses are not included.
Figure 41 shows the combined signal+background mass spectra in the dielectron
and dimuon channels. We find NS/NB ∼ 1 for both cases. The combined
reconstructed mass spectra are fitted to a Gaussian for the Υ peak plus an exponential
for the continuum. The exponential fit to the continuum is subtracted from the
signal+background entries. The resulting background-subtracted Υ mass distributions
fitted to a Gaussian alone are shown in Fig. 42. The final Υ masses and widths are
70
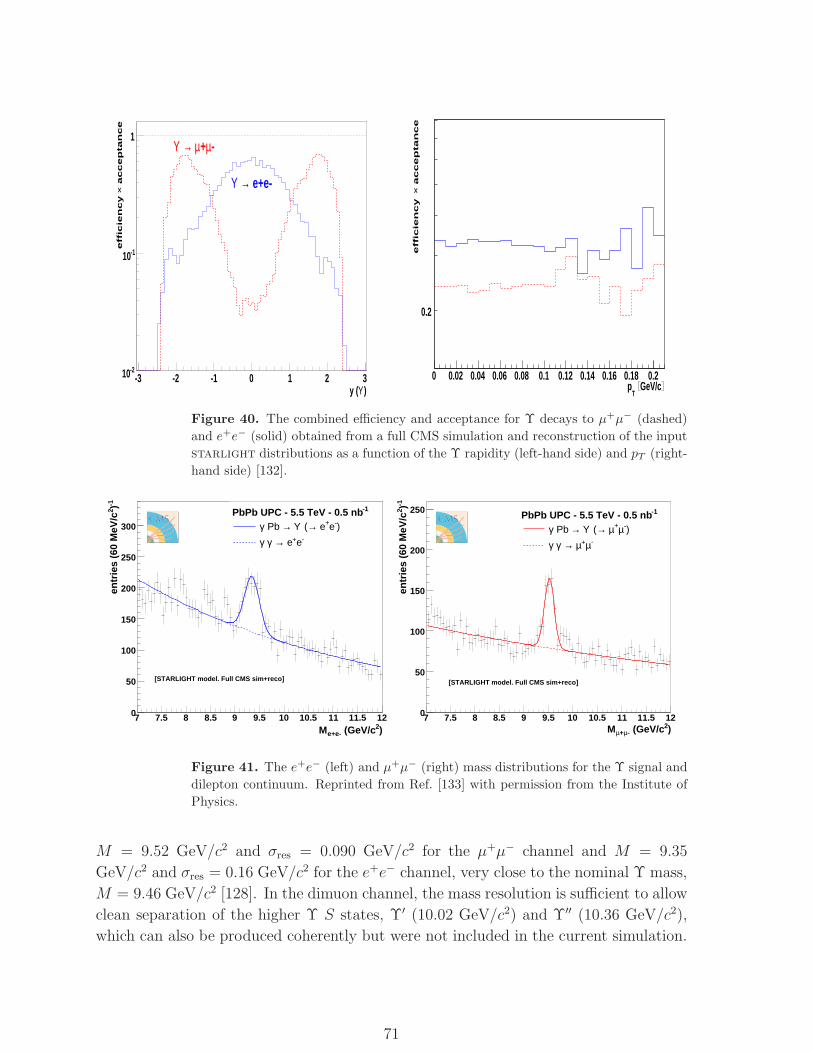
)Υy (-3 -2 -1 0 1 2 3
accep
tan
ce
×eff
icie
ncy
-210
-110
1
e+e-→ Υ
-µ+µ → Υ
GeV/c T
p0 0.02 0.04 0.06 0.08 0.1 0.12 0.14 0.16 0.18 0.2
accep
tan
ce
×eff
icie
ncy
0.2
Figure 40. The combined efficiency and acceptance for Υ decays to µ+µ− (dashed)
and e+e− (solid) obtained from a full CMS simulation and reconstruction of the input
starlight distributions as a function of the Υ rapidity (left-hand side) and pT (right-
hand side) [132].
)2 (GeV/ce+e-M7 7.5 8 8.5 9 9.5 10 10.5 11 11.5 12
-1 )2en
trie
s (6
0 M
eV/c
0
50
100
150
200
250
300
-1PbPb UPC - 5.5 TeV - 0.5 nb)-e+ e→ (Υ → Pb γ
-e+ e→ γ γ
[STARLIGHT model. Full CMS sim+reco]
)2 (GeV/c-µ+µM7 7.5 8 8.5 9 9.5 10 10.5 11 11.5 12
-1 )2en
trie
s (6
0 M
eV/c
0
50
100
150
200
250 -1PbPb UPC - 5.5 TeV - 0.5 nb)-µ+µ → (Υ → Pb γ
-µ+µ → γ γ
[STARLIGHT model. Full CMS sim+reco]
Figure 41. The e+e− (left) and µ+µ− (right) mass distributions for the Υ signal and
dilepton continuum. Reprinted from Ref. [133] with permission from the Institute of
Physics.
M = 9.52 GeV/c2 and σres = 0.090 GeV/c2 for the µ+µ− channel and M = 9.35
GeV/c2 and σres = 0.16 GeV/c2 for the e+e− channel, very close to the nominal Υ mass,
M = 9.46 GeV/c2 [128]. In the dimuon channel, the mass resolution is sufficient to allow
clean separation of the higher Υ S states, Υ′ (10.02 GeV/c2) and Υ′′ (10.36 GeV/c2),
which can also be produced coherently but were not included in the current simulation.
71
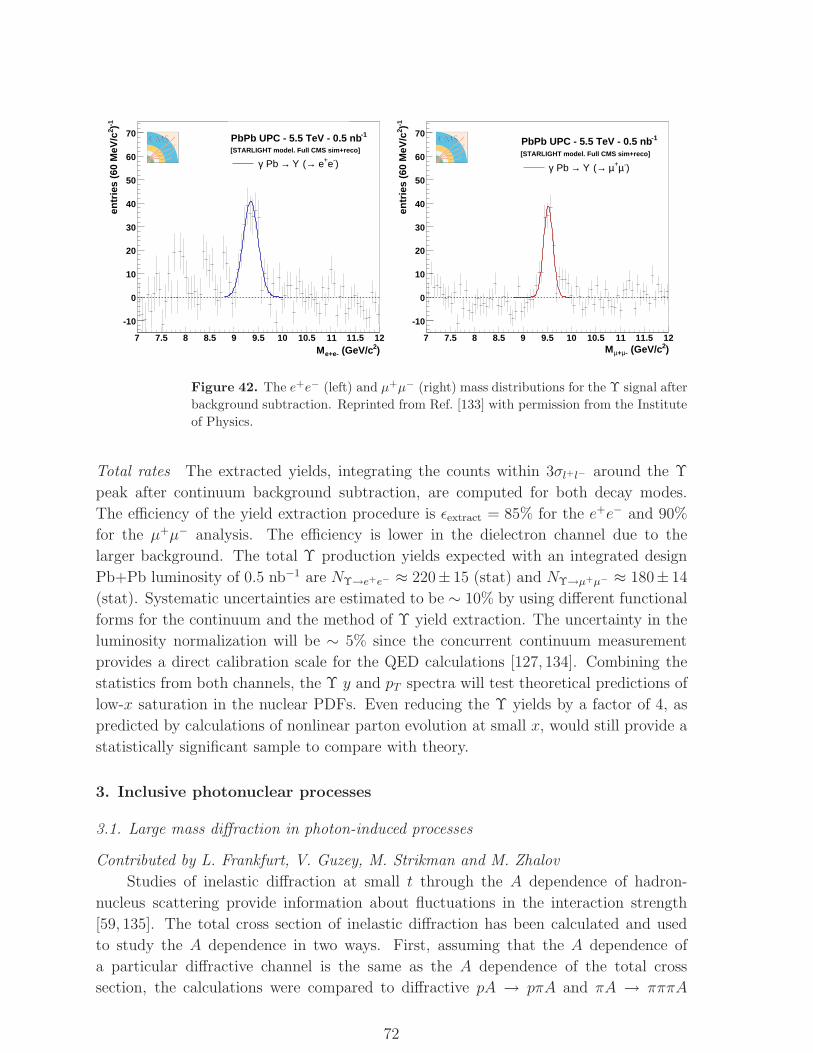
)2 (GeV/ce+e-M7 7.5 8 8.5 9 9.5 10 10.5 11 11.5 12
-1 )2en
trie
s (6
0 M
eV/c
-10
0
10
20
30
40
50
60
70 -1PbPb UPC - 5.5 TeV - 0.5 nb
)-e+ e→ (Υ → Pb γ[STARLIGHT model. Full CMS sim+reco]
)2 (GeV/c-µ+µM7 7.5 8 8.5 9 9.5 10 10.5 11 11.5 12
-1 )2en
trie
s (6
0 M
eV/c
-10
0
10
20
30
40
50
60
70 -1PbPb UPC - 5.5 TeV - 0.5 nb
)-µ+µ → (Υ → Pb γ[STARLIGHT model. Full CMS sim+reco]
Figure 42. The e+e− (left) and µ+µ− (right) mass distributions for the Υ signal after
background subtraction. Reprinted from Ref. [133] with permission from the Institute
of Physics.
Total rates The extracted yields, integrating the counts within 3σl+l− around the Υ
peak after continuum background subtraction, are computed for both decay modes.
The efficiency of the yield extraction procedure is ǫextract = 85% for the e+e− and 90%
for the µ+µ− analysis. The efficiency is lower in the dielectron channel due to the
larger background. The total Υ production yields expected with an integrated design
Pb+Pb luminosity of 0.5 nb−1 are NΥ→e+e− ≈ 220± 15 (stat) and NΥ→µ+µ− ≈ 180± 14
(stat). Systematic uncertainties are estimated to be ∼ 10% by using different functional
forms for the continuum and the method of Υ yield extraction. The uncertainty in the
luminosity normalization will be ∼ 5% since the concurrent continuum measurement
provides a direct calibration scale for the QED calculations [127, 134]. Combining the
statistics from both channels, the Υ y and pT spectra will test theoretical predictions of
low-x saturation in the nuclear PDFs. Even reducing the Υ yields by a factor of 4, as
predicted by calculations of nonlinear parton evolution at small x, would still provide a
statistically significant sample to compare with theory.
3. Inclusive photonuclear processes
3.1. Large mass diffraction in photon-induced processes
Contributed by L. Frankfurt, V. Guzey, M. Strikman and M. Zhalov
Studies of inelastic diffraction at small t through the A dependence of hadron-
nucleus scattering provide information about fluctuations in the interaction strength
[59, 135]. The total cross section of inelastic diffraction has been calculated and used
to study the A dependence in two ways. First, assuming that the A dependence of
a particular diffractive channel is the same as the A dependence of the total cross
section, the calculations were compared to diffractive pA → pπA and πA → πππA
72
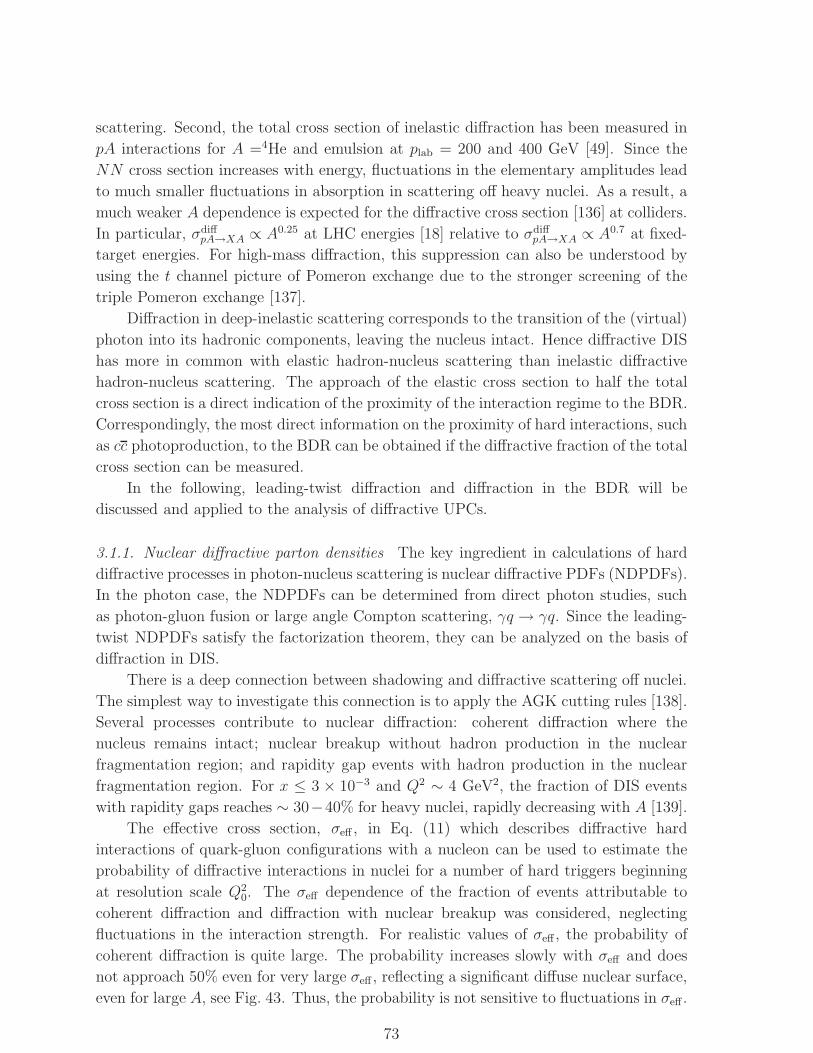
scattering. Second, the total cross section of inelastic diffraction has been measured in
pA interactions for A =4He and emulsion at plab = 200 and 400 GeV [49]. Since the
NN cross section increases with energy, fluctuations in the elementary amplitudes lead
to much smaller fluctuations in absorption in scattering off heavy nuclei. As a result, a
much weaker A dependence is expected for the diffractive cross section [136] at colliders.
In particular, σdiffpA→XA ∝ A0.25 at LHC energies [18] relative to σdiff
pA→XA ∝ A0.7 at fixed-
target energies. For high-mass diffraction, this suppression can also be understood by
using the t channel picture of Pomeron exchange due to the stronger screening of the
triple Pomeron exchange [137].
Diffraction in deep-inelastic scattering corresponds to the transition of the (virtual)
photon into its hadronic components, leaving the nucleus intact. Hence diffractive DIS
has more in common with elastic hadron-nucleus scattering than inelastic diffractive
hadron-nucleus scattering. The approach of the elastic cross section to half the total
cross section is a direct indication of the proximity of the interaction regime to the BDR.
Correspondingly, the most direct information on the proximity of hard interactions, such
as cc photoproduction, to the BDR can be obtained if the diffractive fraction of the total
cross section can be measured.
In the following, leading-twist diffraction and diffraction in the BDR will be
discussed and applied to the analysis of diffractive UPCs.
3.1.1. Nuclear diffractive parton densities The key ingredient in calculations of hard
diffractive processes in photon-nucleus scattering is nuclear diffractive PDFs (NDPDFs).
In the photon case, the NDPDFs can be determined from direct photon studies, such
as photon-gluon fusion or large angle Compton scattering, γq → γq. Since the leading-
twist NDPDFs satisfy the factorization theorem, they can be analyzed on the basis of
diffraction in DIS.
There is a deep connection between shadowing and diffractive scattering off nuclei.
The simplest way to investigate this connection is to apply the AGK cutting rules [138].
Several processes contribute to nuclear diffraction: coherent diffraction where the
nucleus remains intact; nuclear breakup without hadron production in the nuclear
fragmentation region; and rapidity gap events with hadron production in the nuclear
fragmentation region. For x ≤ 3 × 10⁻³ and Q2 ∼ 4 GeV2, the fraction of DIS events
with rapidity gaps reaches ∼ 30−40% for heavy nuclei, rapidly decreasing with A [139].
The effective cross section, σeff , in Eq. (11) which describes diffractive hard
interactions of quark-gluon configurations with a nucleon can be used to estimate the
probability of diffractive interactions in nuclei for a number of hard triggers beginning
at resolution scale Q20. The σeff dependence of the fraction of events attributable to
coherent diffraction and diffraction with nuclear breakup was considered, neglecting
fluctuations in the interaction strength. For realistic values of σeff , the probability of
coherent diffraction is quite large. The probability increases slowly with σeff and does
not approach 50% even for very large σeff , reflecting a significant diffuse nuclear surface,
even for large A, see Fig. 43. Thus, the probability is not sensitive to fluctuations in σeff .
73
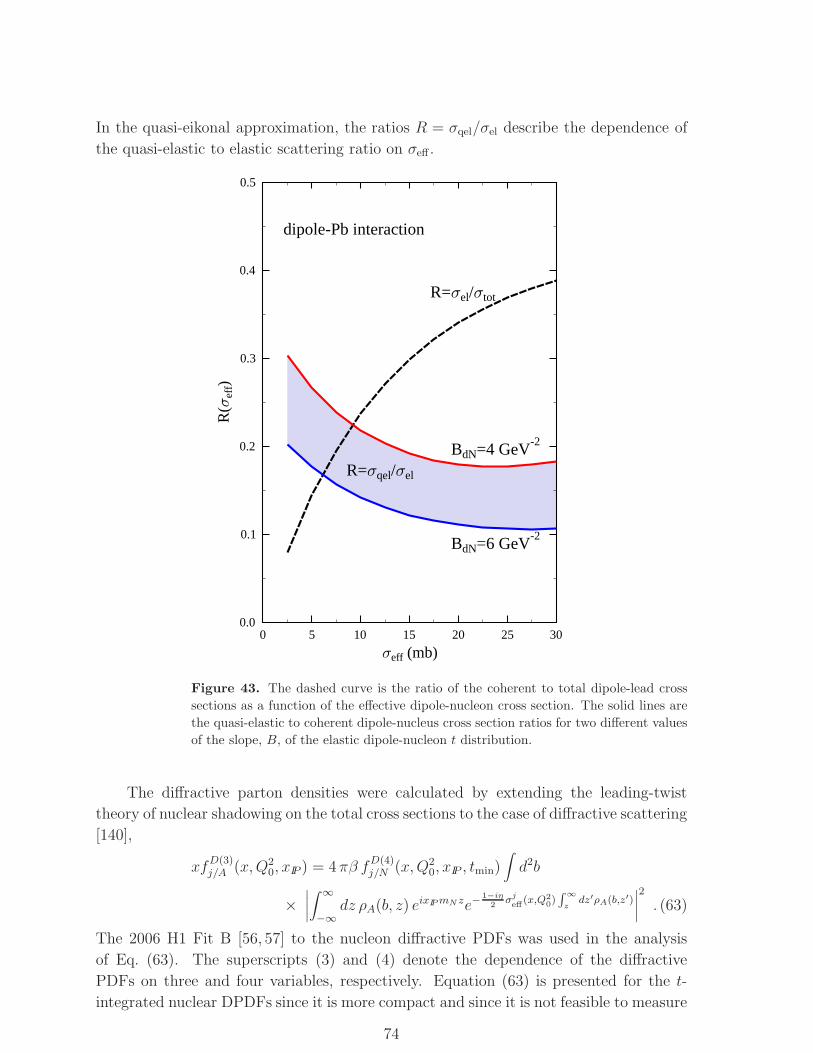
In the quasi-eikonal approximation, the ratios R = σqel/σel describe the dependence of
the quasi-elastic to elastic scattering ratio on σeff .
0 5 10 15 20 25 30
eff (mb)
0.0
0.1
0.2
0.3
0.4
0.5
R(
eff)
dipole-Pb interaction
R= el/ tot
R= qel/ el
BdN=4 GeV-2
BdN=6 GeV-2
Figure 43. The dashed curve is the ratio of the coherent to total dipole-lead cross
sections as a function of the effective dipole-nucleon cross section. The solid lines are
the quasi-elastic to coherent dipole-nucleus cross section ratios for two different values
of the slope, B, of the elastic dipole-nucleon t distribution.
The diffractive parton densities were calculated by extending the leading-twist
theory of nuclear shadowing on the total cross sections to the case of diffractive scattering
[140],
xfD(3)j/A (x,Q2
0, xIP ) = 4 πβ fD(4)j/N (x,Q2
0, xIP , tmin)∫d2b
×∣∣∣∣∫ ∞
−∞dz ρA(b, z) eixIPmN ze−
1−iη
2σj
eff(x,Q2
0)∫∞
zdz′ρA(b,z′)
∣∣∣∣2
. (63)
The 2006 H1 Fit B [56, 57] to the nucleon diffractive PDFs was used in the analysis
of Eq. (63). The superscripts (3) and (4) denote the dependence of the diffractive
PDFs on three and four variables, respectively. Equation (63) is presented for the t-
integrated nuclear DPDFs since it is more compact and since it is not feasible to measure
74
t in diffraction off nuclei in colliders. In deriving Eq. (63) any possible dependence of
σjeff(x,Q2) on β = x/xIP in the exponential factor was neglected and an average value of
σjeff was employed. Note that any suppression of small β diffraction in interactions with
nuclei in the soft regime is neglected since there are only elastic components for heavy
nuclei (inelastic diffraction is zero). Hence the soft contribution at Q20 due to triple
Pomeron exchange is strongly suppressed [139]. As a result, the small β nuclear DPDFs
are suppressed by a factor ∝ A1/3 at Q20. This suppression will be less pronounced at
large Q2 due to QCD evolution.
The nucleon DPDFs are well approximated by the factorized product of two
functions, one dependent on xIP and t and the other dependent on β and Q2. However,
it is clear from Eq. (63) that the factorization approximation is not valid for the nuclear
DPDFs. At fixed xIP , the right-hand side of Eq. (63) depends not only on β but also on
Bjorken x since the screening factor depends on σjeff , a function of x. Equation (63) also
depends on A since nuclear shadowing increases with A. The breakdown of factorization
results from the increase of the nuclear shadowing effects with incident energy and A.
The resulting nuclear DPDFs are evolved to higher Q2 using the NLO leading-twist
(DGLAP) evolution equations.
3.1.2. Numerical results It is convenient for our discussion to quantify the nucleon and
nuclear diffractive PDFs by introducing P jdiff , the probability of diffraction for a given
parton flavor j,
P jdiff =
∫ x0IP
x dxIP xfD(3)j (x,Q2, xIP )
xfj(x,Q2). (64)
First we discuss nucleon diffractive PDFs. Figure 44 presents the nucleon P jdiff as
a function of x for Q2 = 4, 10 and 100 GeV2 for u quarks and gluons. At low Q2,
P gdiff > P u
diff . Note also that P geff is very close to the unitarity limit, P j
diff,max = 1/2. The
larger probability of diffraction for gluons is related to the larger gluon color dipole cross
section in the 8 × 8 representation relative to the triplet qq dipole.
Next, we turn to hard diffraction with nuclear targets. Figure 45 presents P jdiff
for 40Ca and 208Pb at Q2 = 4 GeV2 as a function of x for u quarks and gluons. The
A dependence of P jdiff is rather weak for A ≥ 40 because at large A and small b, the
interaction is almost completely absorptive (black) with a small contribution from the
opaque nuclear edge. The A dependence for gluons is somewhat weaker since gluon
interactions are closer to the black disk regime.
At small x, the A dependence of P jdiff is qualitatively different for quarks and gluons.
While the A dependence of P gdiff is expected to be very weak¶, P q
diff is expected to grow
with A since the diffractive probability for quarks, shown in Fig. 44, is rather far from
the BDR and thus can increase.
¶ The probability P gdiff for nuclei increases faster than for nucleons with decreasing x since the nuclear
center is like a black disk. However, scattering off nucleons near the edge of the nucleus slows the
increase of P gdiff for nuclei as the ratio σdiff/σtot approaches 0.5.
75
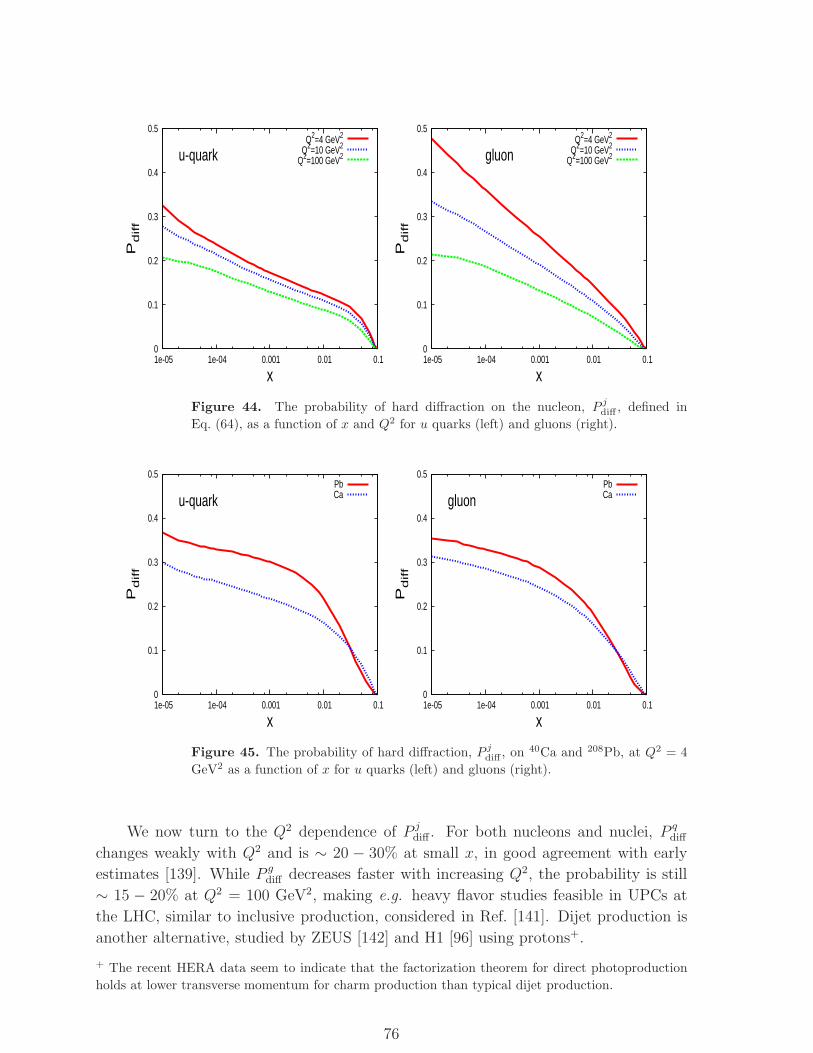
0
0.1
0.2
0.3
0.4
0.5
1e-05 1e-04 0.001 0.01 0.1
Pdiff
x
u-quarkQ2=4 GeV2
Q2=10 GeV2
Q2=100 GeV2
0
0.1
0.2
0.3
0.4
0.5
1e-05 1e-04 0.001 0.01 0.1
Pdiff
x
gluonQ2=4 GeV2
Q2=10 GeV2
Q2=100 GeV2
Figure 44. The probability of hard diffraction on the nucleon, P jdiff , defined in
Eq. (64), as a function of x and Q2 for u quarks (left) and gluons (right).
0
0.1
0.2
0.3
0.4
0.5
1e-05 1e-04 0.001 0.01 0.1
Pdiff
x
u-quarkPbCa
0
0.1
0.2
0.3
0.4
0.5
1e-05 1e-04 0.001 0.01 0.1
Pdiff
x
gluonPbCa
Figure 45. The probability of hard diffraction, P jdiff , on 40Ca and 208Pb, at Q2 = 4
GeV2 as a function of x for u quarks (left) and gluons (right).
We now turn to the Q2 dependence of P jdiff . For both nucleons and nuclei, P q
diff
changes weakly with Q2 and is ∼ 20 − 30% at small x, in good agreement with early
estimates [139]. While P gdiff decreases faster with increasing Q2, the probability is still
∼ 15 − 20% at Q2 = 100 GeV2, making e.g. heavy flavor studies feasible in UPCs at
the LHC, similar to inclusive production, considered in Ref. [141]. Dijet production is
another alternative, studied by ZEUS [142] and H1 [96] using protons+.
+ The recent HERA data seem to indicate that the factorization theorem for direct photoproduction
holds at lower transverse momentum for charm production than typical dijet production.
76
The discussion presented here is relevant for hard processes produced in direct
proton interactions. Spectator parton interactions will suppress the probability of
diffraction for resolved photons. Estimates [143] indicate that spectator interactions will
decrease the probability of nuclear diffraction by at least a factor of two for A ∼ 200.
Thus, the A dependence of diffraction with resolved photons will also be interesting
since it will measure the interaction strength of the spectator system with the media,
providing another handle on the photon wavefunction.
3.1.3. Large mass diffraction in the black disk regime One striking feature of the BDR
is the orthogonality of the Fock components of the photon wavefunction [64]. Thus there
can be no transitions between non-diagonal components, e.g. 〈qq|qqg〉 ≡ 0. Since the
dominant contribution to coherent diffraction in the BDR originates from a ‘shadow’ of
fully-absorptive interactions for b ≤ RA, the orthogonality argument is applicable. The
orthonormality condition is used to derive the BDR expression for the differential cross
section of the process γA → XA where X is a final state of invariant mass M [44]. In
the real photon case,
dσγA→XAdtdM2
=α
3π
(2πR2A)2
16π
ρ(M2)
M2
4∣∣∣J1(
√−tRA)
∣∣∣2
−tR2A
(65)
where ρ(M2) = σe+e−→hadrons/σe+e−→µ+µ− at s = M2. Diffractive measurements of states
with a range of masses would determine the blackness of the photon wavefunction as a
function of mass by comparing to the BDR results in Eq. (65). A similar equation for
production of specific final states is valid in the BDR in the case of coherent nuclear
recoil. It is then possible to determine the components of the photon wavefunction
which interacts with the BDR strength in the coherent processes.
The onset of the BDR limit for hard processes should also reveal itself in a faster
increase of the photoproduction cross sections of radial excited states with energy
relative to the ground state cross section. Utilizing both an intermediate and a heavy
nuclear beam, such as Ar and Pb, would make it possible to remove edge effects as well
as maximize the path length through nuclear matter, about 10 fm in a large nucleus.
One especially interesting process is exclusive diffractive dijet production by real
photons. For the γA energies available at the Electron Ion Collider [6, 7] or in UPCs
at the LHC, the BDR would be a good approximation for M ∼ few GeV in the
photon wavefunction, the domain described by perturbative QCD for x ∼ 10−3 with
proton targets, and larger x for nuclei. The condition of large longitudinal distances,
a small longitudinal momentum transfer, will be applicable up to quite large values
of the produced diffractive mass M . In the BDR, the dominant channel for large
mass diffraction is dijet production with a total cross section given by Eq. (65) and
characteristic center-of-mass angular distribution (1 + cos2 θ) [44]. In contrast, except
for charm, diffractive dijet production is strongly suppressed in the perturbative QCD
limit [144, 145]. The suppression is due to the coupling of the qq component of the
photon wavefunction to two gluons, calculated to lowest order in αs. As a result,
77
for real photons, hard diffraction with light quarks is connected to the production
of qqg and higher states. The mass distribution of diffractively-produced jets thus
provides an important test of the onset of the BDR. In the DGLAP/color transparency
regime, forward diffractive dijet production cross sections should should be ∝ 1/M8
and dominated by charm and bottom jet production, strikingly different from the BDR
expressions of Ref. [44].
Thus, dijet photoproduction should be very sensitive to the onset of the BDR.
The qq component of the photon light-cone wavefunction can be measured using three
independent diffractive phenomena: in the BDR off protons and heavy nuclei and in
the color transparency regime where the wavefunction can be measured as a function of
the inter-quark distance [26]. A competing process for dijet photoproduction off heavy
nuclei is the process γγ → dijets where the second photon comes from the Coulomb
field of the opposite nucleus. Dijets produced in γγ collisions have positive C parity.
Thus this amplitude does not interfere with dijet production in γIP interactions with
negative C-parity. Therefore γγ → dijets are a small background over a wide range of
energies [76].
3.1.4. High mass diffraction in UPCs The large predicted hard diffraction probability
can be checked in UPCs at the LHC. For example, γA → jet1 + jet2 + X + A can be
studied in the kinematics where the direct photon process, γg → qq, dominates. In this
case, for pT ∼ 10 GeV/c and Q2 ∼ 100 GeV2, ∼ 20% of the events will be diffractive.
The hadroproduction background originates from glancing collisions where two nucleons
interact through the double diffractive process pp → ppX where X contains jets. The
probability of hard processes with two gaps is very small at collider energies, even smaller
than the probability of single diffractive hard processes [146]. Therefore, the relative
backgrounds in the diffractive case are expected to be at least as good as in the inclusive
case [141]. Thus, it would be rather straightforward to extract coherent diffraction by
simply using anti-coincidence with the forward neutron detector, especially for heavy
nuclei [105]. As a result, it would be possible to measure the nuclear DPDFs with
high statistical accuracy. In contrast to diffractive vector meson production, it would
be possible to determine the energy of the photon which induced the reaction on an
event-by-event basis since the photon rapidity is close to the rapidities of the two jets.
It would be possible to measure large rapidities by selecting photoproduction events
with the highest kinematically allowed energies of the produced particles in the rapidity
interval y1 < y < y2 and determine the DPDFs for rather small x.
There are two contributions to dijet photoproduction, direct and resolved. In
the direct process, the entire photon energy contributes to the hard process. In the
resolved process, only a fraction of the photon energy, zγ , is involved. HERA studies
indicate that the requirement zγ ≥ 0.8 eliminates the resolved photon contribution.
However, at higher Q2, DGLAP evolution increases the relative importance of the
resolved component.
78
In AA collisions, there are two possible contributions since the photon can come
from either nucleus. It is thus more convenient to refer to the x of the photon and the
Pomeron. The values of x can be reconstructed from the kinematics of the diffractive
state, X, with mass MX , produced in the reaction AA → AAX. The light cone
momentum fractions of the two nuclei, x1 and x2 are normalized to A and satisfy the
kinematic relation
x1x2sNN= M2
X . (66)
One x is carried by the photon and the other by the Pomeron. (Here Pomeron is
used to define the kinematics of the process without specifying a particular dynamical
mechanism). When no high pT jets are produced, the values of x are related to the
rapidity range of the produced system. In a symmetric AA interaction, the convention
is to define y1 = yA − ln(1/x1) and y2 = −yA + ln(1/x2).) The cross section for the
production of state X is
dσAA→XAAdx1dx2
=dNγ(x1)
dk
dσγA→XA(s = x1sNN, xIP = x2)
dxIP
+dNγ(x2)
dk
dσγA→XA(s = x2sNN, xIP = x1)
dxIP. (67)
The direct photoproduction cross section for a hard process such as dijet or heavy quark
production is given by the standard pQCD convolution formulas over the nuclear DPDFs
and the photon flux. In the resolved case, zγ ≪ 1, diffraction should be suppressed
by interaction of spectators in the photon wavefunction with the target, increasing
the multiplicity and reducing the rapidity gap. Though these processes appear to be
negligible for protons, they are likely to reduce the diffractive cross section considerably,
see Section 3.1.2.
There is a potential problem specific to diffractive events: determining which
nucleus emitted the photon and which emitted the “Pomeron”. Such an event is shown
schematically in Fig. 46. The photon source can generally be identified by comparing
the invariant mass of the entire produced system, the dijet and the accompanying soft
hadrons, the diffractive mass MX , to that of the dijet alone, Mdijet. For most events,
the diffractive mass is much larger than the dijet mass, MX ≫ Mdijet, and the gap
between the dijet and the photon-emitting nucleus is larger than that on the Pomeron-
emitter side, making identification of the photon source possible. In the rare cases where
MX ∼ Mdijet, fewer accompanying hadrons are produced in a limited rapidity range and
the gaps on both sides of the produced system are nearly the same, making identification
of the photon source impossible. In this case, the x range is more restricted.
3.2. Large t diffractive ρ0 photoproduction with target dissociation
Contributed by: L. Frankfurt, M. Strikman and M. Zhalov
3.2.1. Introduction An important feature of small x processes is the nontrivial interplay
between evolution in ln(x0/x) and ln(Q2/Q20) on the perturbative ladder. Large t
79

IP, xIPγ, xγ
−yA yA
!
!
∆ y = ln(1/xIP ) ∆ y = ln(1/xγ)
jet1
jet2
Figure 46. A schematic lego plot of a diffractive photoproduction event showing
the gap between the photon-emitter nucleus and the produced dijet system on the
right-hand side and the additional gap between the Pomeron-emitter nucleus and
the dijet system on the left-hand side. The dijet is accompanied by fewer soft
hadrons than in inclusive photoproduction where the nucleus that emits the parton
breaks up. From Ref. [31]. Copyright 2006 by the American Physical Society
(http://link.aps.org/abstract/PRL/v96/e082001).
processes accompanied by a large rapidity gap ensure that QCD evolution is suppressed
as a function of Q2 at small coupling. As a result, it is possible to investigate ln(x0/x)
and ln(Q2/Q20) evolution separately. Such phenomena include the transition from color
transparency to color opacity in nuclei. Though color transparency is experimentally
established [38, 39], further studies are necessary to determine the range of energies and
virtualities at which the phenomenon occurs. There are a number of indirect indications
for the color opacity regime although direct evidence is limited [147]. The rapidity gap
processes we discuss here will provide additional means of addressing these questions.
A number of small x processes which originate due to elastic parton scattering with
small color-singlet qq dipoles (referred to as dipoles in the remainder of this section)
at large momentum transfer and at high energies have been suggested including hard
diffraction in pp → pX at large t. Jet studies include two jet production accompanied
by a rapidity gap, the ‘coherent Pomeron’ [45], and enhanced production of back-to-
back dijets separated by a large rapidity gap [148] relative to the dijet rate in the same
kinematics without a gap [149, 150]. Dijet production accompanied by a gap was studied
at the Tevatron [151]. In addition, high t vector meson photo- and electroproduction
with a rapidity gap has also been proposed [152–154]. Over the last decade, theoretical
and experimental vector meson studies were focused on interactions with protons.
HERA measured the relevant cross sections [117, 155–158] in the γp center-of-mass
range 20 ≤ Wγp ≤ 200 GeV. The HERA data agree well with most predictions of
QCD-motivated models [117], several of which use the LO BFKL approximation [159].
It would clearly be beneficial to extend these studies to higher Wγp and over a larger
range of rapidity gap, ∆y, to investigate the s(qq)j and t dependencies of dipole-parton
scattering where j is the interacting parton. Here we summarize feasibility studies
[93, 118] for probing these processes in UPCs at the LHC.
We focus on ρ0 photoproduction at large t with a rapidity gap, ∆y, between the ρ0
80

and the hadronic system X produced in ultraperipheral pA and AA collisions,
γ + p(A) → ρ0 + ∆y +X . (68)
We consider the kinematics where ∆y ≥ 4, sufficiently large to suppress the
fragmentation contribution. Related investigations include diffractive charm or dijet
production where the hard final state is separated from the nucleon fragmentation
region by large ∆y. For example, studies of the A dependence of dijet production
in e.g. γA→ (jet +M1) + ∆y + (jet +M2) can probe color transparency effects on gap
survival in hard-photon induced processes [143]. CMS and ATLAS are well suited for
such observations since they cover large rapidity intervals.
The main variables are the mass of the system produced in the proton dissociation,
MX , the square of momentum transfer −t ≡ Q2 = −(pγ − pV )2, and the square of the
qq-parton elastic scattering energy
s(qq)j = xW 2γp = xsγp . (69)
Here
x =−t
(−t+M2X −m2
N)(70)
is the minimum fraction of the proton momentum carried by the elastically-scattered
parton for a given MX and t. At large t and Wγp, the gap, ∆y, between the rapidity of
the produced vector meson and the final-state parton, at the leading edge of the rapidity
range of the hadronic system X, is
∆y = lnxW 2
γp√(−t)(M2
V − t). (71)
It is rather difficult to measure MX or x directly. However, they can be adequately
determined by studying the leading hadrons close to the rapidity gap; full reconstruction
is not required.
Generally, large t scattering with a rapidity gap can be described as an incoherent
sum of terms describing elastic quark and gluon scattering. Each term is the product
of the quasi-elastic large t cross section of p(A)j → V j and the density of parton j
in the target [45, 152, 153]. Large t ensures two important simplifications: the parton
ladder mediating quasi-elastic scattering is attached to the projectile via two gluons
while the attachment of the dipole ladder to more than one target parton is strongly
suppressed. The gluon elastic-scattering cross section is enhanced by 81/16 relative to
quark scattering. Gluon scattering dominates over a wide x range, constituting ∼ 80%
(70%) of the cross section at x = 0.1 (0.3). The t dependence can be parametrized as
a power law where the power is twice the number of constituents in the hadron vertex,
1/t6 for three quarks [45] and 1/t4 for the qq system [153].
The cross section for vector meson photoproduction with target dissociation in the
range −t≫ 1/r2V > Λ2
QCD where rV is the vector meson radius; W 2γp ≫ M2
X ≫ m2N ; and
fixed x (x < 1) is [153]
dσγp→V Xdtdx
=dσγq→V q
dt
[81
16gp(x, t) +
∑
i
[qip(x, t) + qip(x, t)]]. (72)
81
Here gp(x, t), qip(x, t) and qip(x, t) are the gluon, quark and antiquark distributions in the
proton. The γq → V q amplitude, fq(s(qq)q, t), is dominated by quasi-elastic scattering
of the small qq dipole configuration of the photon that transitions into the final-state
vector meson.
Diffractive vector meson photoproduction from hadron and nuclear targets is a
special case where evolution in x is separated from evolution in the hard scale, see
Ref. [45, 149, 152, 153]. Since t is the same on all rungs of the ladder mediating quasi-
elastic scattering, the amplitude fq(s(qq)j , Q2 = −t) probes evolution in ln(1/x) at fixed
Q2. Because the momentum transfer is shared between two gluons, the characteristic
virtuality of t-channel gluons on the ladder is ≈ Q2/4 while the hard scale in the target
parton density is ≈ Q2.
To lowest order in ln(1/x), the amplitude, fq(s(qq)j , t), is independent of Wγp for
fixed t. Higher order terms in ln(1/x) were incorporated in the leading and next-to-
leading log approximations, including both lnQ2 and ln x effects so that fq increases
with energy as a power of exp(∆y) in Eq. (71) with a weak t dependence,
fq(s(qq)j , t) ∝(s(qq)j
|t|
)δ(t)(73)
for |t| ≫ M2V . Within NLO BFKL this dependence is not obvious since the solution may
be given by a different saddle point at higher Q2 [160, 161]. The value of δ(0) changes
significantly between LO and NLO BFKL, δ(0) ∼ 0.6 at LO and δ(0) ∼ 0.1 at NLO.
The difference between NLO and resummed BFKL is smaller since δ(0) ∼ 0.2− 0.25 in
resummed BFKL over a wide range of Q2 [162]. Hence we treat δ(t) as a free parameter
and generally assume it weakly depends on t.
Similar small t processes could be described by the triple Pomeron approximation
of the amplitude,
fq ∝(W 2
γp
M2X
)αsoftIP
(t)−1
, (74)
where the soft Pomeron trajectory is
αsoftIP (t) = α0 + α′t (75)
with α0 ∼ 1.08 and α′ ∼ 0.25 GeV−2. The amplitude decreases with energy for −t ≥ 0.4
GeV2.
We first use a simple parametrization of the HERA data based on a hard reaction
mechanism [93] to estimate the γp → ρ0 + ∆y + X rates in pA collisions at the LHC.
We find that it will be possible to extend the HERA energy range by a factor of 10. We
then analyze the A dependence of the process and show that it provides a critical test
of the interplay between hard and soft dynamics as well as probes the onset of the hard
black disk regime. We find that it will be possible to study this process to Wγp ∼ 1 TeV
and study hard dynamics up to xsγp/Q2 ∼ 105, corresponding to an rapidity interval
of ∼ 12 units for gluon emission. Hence the emission of several gluons in the ladder
kinematics (when the rapidity interval between two gluons on the ladder is larger than
one) is possible.
82
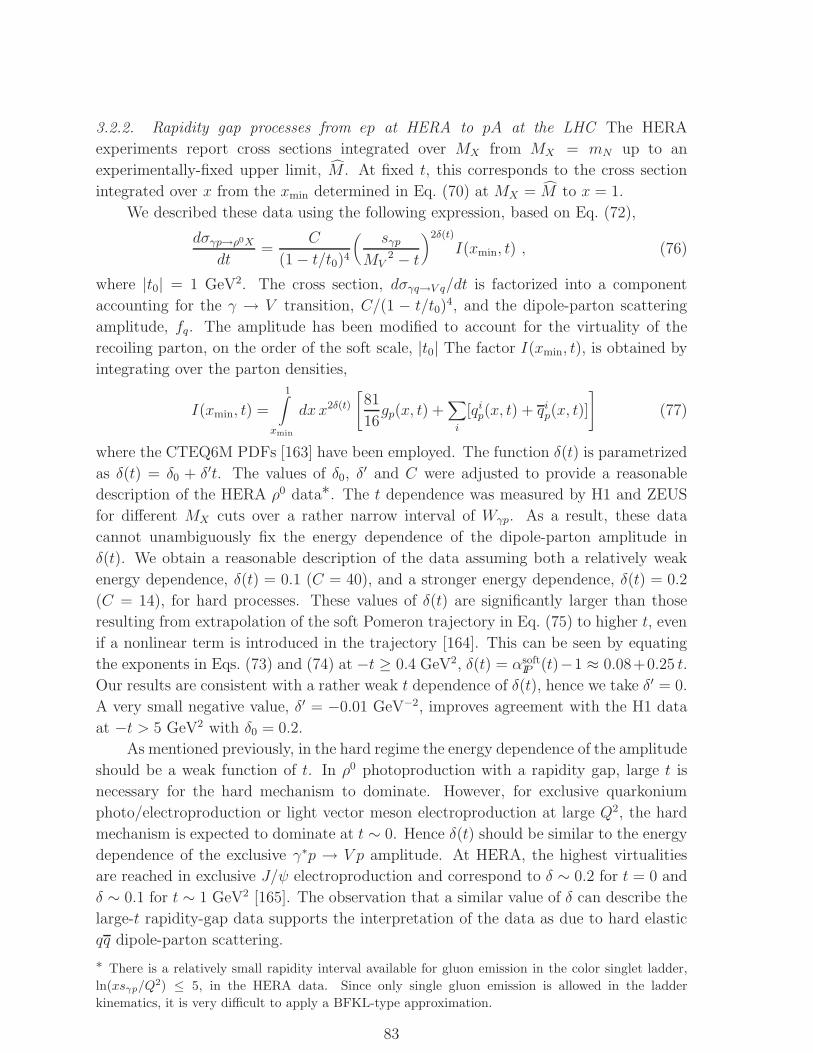
3.2.2. Rapidity gap processes from ep at HERA to pA at the LHC The HERA
experiments report cross sections integrated over MX from MX = mN up to an
experimentally-fixed upper limit, M . At fixed t, this corresponds to the cross section
integrated over x from the xmin determined in Eq. (70) at MX = M to x = 1.
We described these data using the following expression, based on Eq. (72),
dσγp→ρ0Xdt
=C
(1 − t/t0)4
(sγp
MV2 − t
)2δ(t)
I(xmin, t) , (76)
where |t0| = 1 GeV2. The cross section, dσγq→V q/dt is factorized into a component
accounting for the γ → V transition, C/(1 − t/t0)4, and the dipole-parton scattering
amplitude, fq. The amplitude has been modified to account for the virtuality of the
recoiling parton, on the order of the soft scale, |t0| The factor I(xmin, t), is obtained by
integrating over the parton densities,
I(xmin, t) =
1∫
xmin
dx x2δ(t)
[81
16gp(x, t) +
∑
i
[qip(x, t) + qip(x, t)]
](77)
where the CTEQ6M PDFs [163] have been employed. The function δ(t) is parametrized
as δ(t) = δ0 + δ′t. The values of δ0, δ′ and C were adjusted to provide a reasonable
description of the HERA ρ0 data∗. The t dependence was measured by H1 and ZEUS
for different MX cuts over a rather narrow interval of Wγp. As a result, these data
cannot unambiguously fix the energy dependence of the dipole-parton amplitude in
δ(t). We obtain a reasonable description of the data assuming both a relatively weak
energy dependence, δ(t) = 0.1 (C = 40), and a stronger energy dependence, δ(t) = 0.2
(C = 14), for hard processes. These values of δ(t) are significantly larger than those
resulting from extrapolation of the soft Pomeron trajectory in Eq. (75) to higher t, even
if a nonlinear term is introduced in the trajectory [164]. This can be seen by equating
the exponents in Eqs. (73) and (74) at −t ≥ 0.4 GeV2, δ(t) = αsoftIP (t)−1 ≈ 0.08+0.25 t.
Our results are consistent with a rather weak t dependence of δ(t), hence we take δ′ = 0.
A very small negative value, δ′ = −0.01 GeV−2, improves agreement with the H1 data
at −t > 5 GeV2 with δ0 = 0.2.
As mentioned previously, in the hard regime the energy dependence of the amplitude
should be a weak function of t. In ρ0 photoproduction with a rapidity gap, large t is
necessary for the hard mechanism to dominate. However, for exclusive quarkonium
photo/electroproduction or light vector meson electroproduction at large Q2, the hard
mechanism is expected to dominate at t ∼ 0. Hence δ(t) should be similar to the energy
dependence of the exclusive γ∗p → V p amplitude. At HERA, the highest virtualities
are reached in exclusive J/ψ electroproduction and correspond to δ ∼ 0.2 for t = 0 and
δ ∼ 0.1 for t ∼ 1 GeV2 [165]. The observation that a similar value of δ can describe the
large-t rapidity-gap data supports the interpretation of the data as due to hard elastic
qq dipole-parton scattering.
∗ There is a relatively small rapidity interval available for gluon emission in the color singlet ladder,
ln(xsγp/Q2) ≤ 5, in the HERA data. Since only single gluon emission is allowed in the ladder
kinematics, it is very difficult to apply a BFKL-type approximation.
83
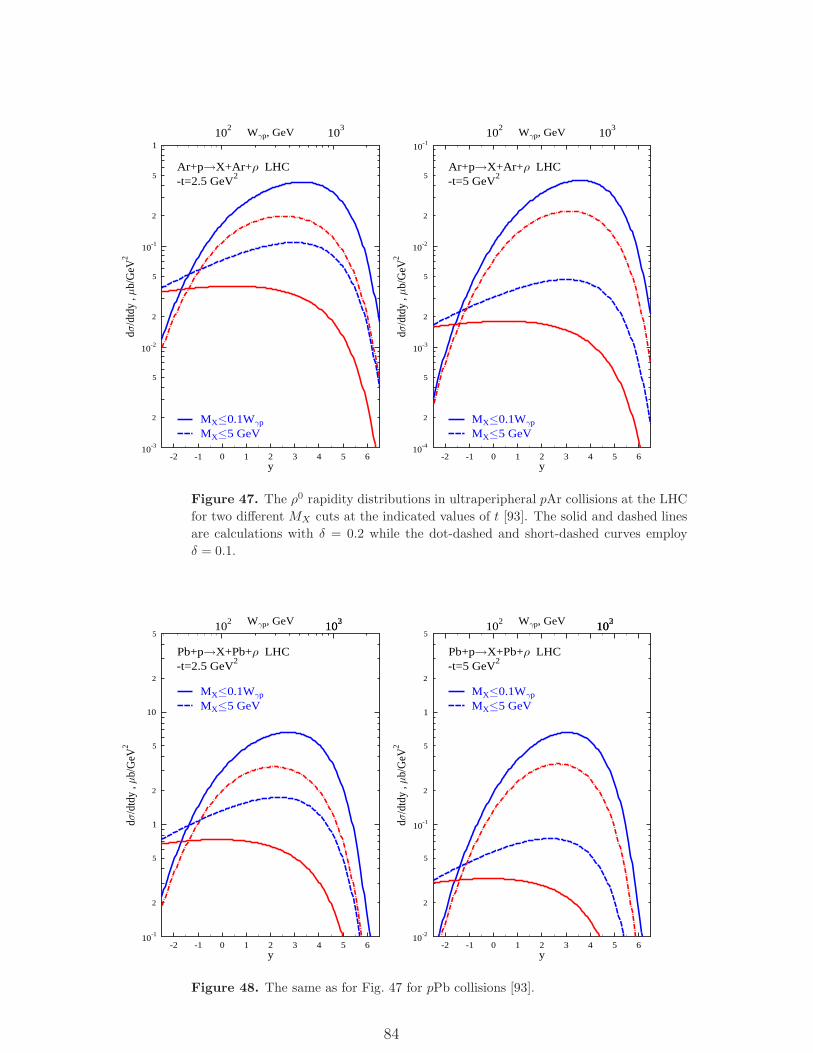
-2 -1 0 1 2 3 4 5 6y
10-3
2
5
10-2
2
5
10-1
2
5
1
d/d
tdy
,b/
GeV
2W p, GeV
MX 0.1W p
MX 5 GeV
102
103
Ar+p X+Ar+ LHC-t=2.5 GeV
2
-2 -1 0 1 2 3 4 5 6y
10-4
2
5
10-3
2
5
10-2
2
5
10-1
d/d
tdy
,b/
GeV
2
W p, GeV
MX 0.1W p
MX 5 GeV
102
103
Ar+p X+Ar+ LHC-t=5 GeV
2
Figure 47. The ρ0 rapidity distributions in ultraperipheral pAr collisions at the LHC
for two different MX cuts at the indicated values of t [93]. The solid and dashed lines
are calculations with δ = 0.2 while the dot-dashed and short-dashed curves employ
δ = 0.1.
-2 -1 0 1 2 3 4 5 6y
10-1
2
5
1
2
5
10
2
5
d/d
tdy
,b/
GeV
2
W p, GeV
MX 0.1W p
MX 5 GeV
Pb+p X+Pb+ LHC-t=2.5 GeV
2
102
103
102
-2 -1 0 1 2 3 4 5 6y
10-2
2
5
10-1
2
5
1
2
5
d/d
tdy
,b/
GeV
2
W p, GeV
MX 0.1W p
MX 5 GeV
Pb+p X+Pb+ LHC-t=5 GeV
2
102
103
102
Figure 48. The same as for Fig. 47 for pPb collisions [93].
84
It is unlikely that further HERA studies will cover a sufficiently wide range of Wγp
and ∆y to study the energy dependence of the large-t elastic dipole-parton scattering
amplitude. On the other hand, at the LHC, CMS and ATLAS will have sufficient
rapidity coverage to study the process in Eq. (68) in ultraperipheral pA collisions. Hence
we use the parametrization of the γp → Xρ0 cross section in Eqs. (76) and (77) to
estimate the large-t rapidity-gap ρ0 cross section in ultraperipheral pA and, later in AA
collisions at the LHC. We do not address the pA contribution from γA→ ρ0X since it is
very small and can easily be separated experimentally. The large-t nucleon-dissociation
cross section is then
dσpA→ρ0XAdtdy
=dNZ
γ (y)
dk
dσγN→ρ0X(y)
dt(78)
where dNZγ (y)/dk is the photon flux generated by the ion with energy k =
(Mρ0/2) exp(y). We consider intermediate and large momentum transfer in UPCs at
the LHC, analogous to those studied at HERA.
The cross section can be studied at fixed t as a function of the ρ0 rapidity with
the restriction MX ≤ 5 GeV to determine the energy dependence of the dipole-parton
amplitude and thus δ(t). In this case, xmin does not depend on Wγp and the dipole-
parton elastic scattering amplitude varies with Wγp due to the increase of the rapidity
gap with y.
We also study the cross section when MX ∝Wγp, specifically MX ≤ 0.1Wγp. This
cut corresponds to fixing ∆y and changing xmin. Such studies could test the parton
distribution functions and the reaction mechanism by extracting I(xmin, t) from the
data in different xmin and t bins.
We do not consider Wγp < 20 GeV where our HERA-based parametrization,
Eqs. (76) and (77), are unreliable, particularly for MX ≤ 5 GeV. In any case, the
data indicate that the cross section is very small if MX ≤ 2 GeV.
The rapidity distribution of diffractive ρ0 photoproduction accompanied by a
rapidity gap between the ρ0 and the system X produced by the target proton break
up is shown in Figs. 47 and 48 for pAr and pPb collisions respectively. The distributions
are shown for two fixed values of t: −t = 2.5 and 5 GeV2. We use the same sets of cuts
as those employed in the HERA experiments. The cut MX ≤ 5 GeV corresponds to
a fixed rapidity interval occupied by the hadrons in system X. The energy-based cut,
MX ≤ 0.1Wγp, corresponds to the same minimum ∆y between the vector meson and
the produced hadrons.
The choice MX ≤ 5 GeV gives a flatter and broader rapidity distribution since
xmin is independent of Wγp and not very small. When MX ≤ 0.1Wγp, smaller values of
xmin are reached for the same −t, giving a larger cross section over most of the rapidity
range, particularly for −t = 5 GeV2. The two choices exhibit the same behavior at
large forward rapidity due to the steep decrease of the photon flux. Results are also
shown for two assumptions of δ(t): 0.2 and 0.1. The assumption δ(t) = 0.1 narrows the
rapidity distribution, as does going to a higher −t. The rates, which can be obtained by
85
multiplying the cross sections by luminosities of 6 µb−1 for pAr and pPb respectively,
are high.
The t-dependence of the cross section in Eq. (76) should decrease more slowly than
the asymptotic behavior of the (qq) + j → V + j cross section, ∝ 1/t4. As a result, the
rate for |t| > |tmin| ≥ 2.5 GeV2 drop rather slowly with tmin (more slowly than 1/t3min).
With the expected LHC pA luminosities, the rates remain high up to rather large t.
The rates for −t > 10 GeV2 are only a factor of 10 smaller than for −t > 5 GeV2. The
J/ψ production rates would also be significant. Although the rates are smaller than for
ρ0 production at fixed t, it would be possible to use −t ≥ 1 GeV2 in the analysis where
the rates are larger than for the exclusive diffractive reaction, γp→ J/ψp.
Most events in these kinematics correspond to x ≥ 0.01. Thus we can primarily
infer the energy dependence of the elastic (qq)j amplitude at different Q2. Some events
will also probe as low as x ∼ 10−3. However, it will be probably very difficult to reach
the x range where quark scattering is larger than gluon scattering, x ≥ 0.4. Overall,
the energy range, smax/smin ≥ 4 × 10³, is large enough for precision measurements of
the energy dependence of the amplitude. If δ(t) ≈ 0.2, the elastic cross section should
increase by a factor of ∼ 30 in the energy range.
3.2.3. A dependence of rapidity gap production in AA collisions Since large t rapidity
gap processes, γ(γ∗)N → V X, are dominated by elastic qq-parton scattering, these
processes provide a novel way to investigate small dipole interactions in the nuclear
medium.
Ultraperipheral AA collisions at the LHC will provide the first opportunity to
investigate the new QCD regime of strong interactions at small coupling as well as large
target thickness. Further studies will be possible at a future eA collider. Ultraperipheral
AA collisions differ from pA collisions since vector mesons can be produced by photons
emitted from either nucleus. The cross section is the sum of the two contributions,
dσAA→ρ0XAA′
dydt=dNZ
γ (y)
dk
dσγA→ρ0XA′(y)
dt+NZγ (−y)dk
dσγA→ρ0XA′(−y)dt
.(79)
Here σγA→ρ0XA′ is the ρ0 photoproduction cross section with dissociation, the system X
results from diffractive dissociation of a nucleon and A′ is the residual nucleus. Several
neutrons will be produced in the electromagnetic excitation of A′ by the photon-emitting
nucleus, A, in Eq. (68).
The system X should be similar to that produced in nuclear DIS at similar x
and Q2 ∼ −t except that here the system can be produced by both quark and gluon
scattering. The hadron spectrum is obtained from quark and gluon fragmentation in
the proportion of parton production given by Eq. (72). These hadrons should balance
the vector meson transverse momentum. The leading hadron momenta in the nuclear
rest frame are ∼ −t/(2mNx). Hence, based on EMC measurements [166], we expect
that, at large t and x ≤ 0.05, leading hadron absorption is small. Nevertheless, a few
neutrons will be produced in the nuclear fragmentation region by final-state hadronic
86
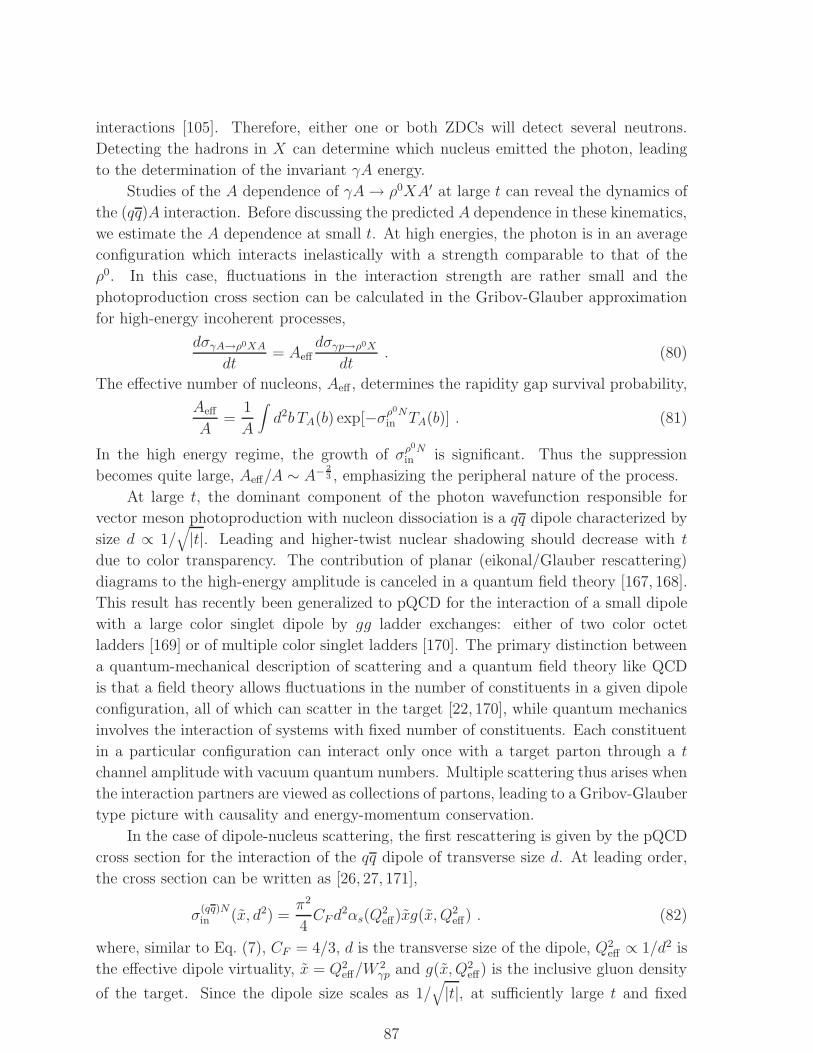
interactions [105]. Therefore, either one or both ZDCs will detect several neutrons.
Detecting the hadrons in X can determine which nucleus emitted the photon, leading
to the determination of the invariant γA energy.
Studies of the A dependence of γA→ ρ0XA′ at large t can reveal the dynamics of
the (qq)A interaction. Before discussing the predicted A dependence in these kinematics,
we estimate the A dependence at small t. At high energies, the photon is in an average
configuration which interacts inelastically with a strength comparable to that of the
ρ0. In this case, fluctuations in the interaction strength are rather small and the
photoproduction cross section can be calculated in the Gribov-Glauber approximation
for high-energy incoherent processes,
dσγA→ρ0XAdt
= Aeffdσγp→ρ0X
dt. (80)
The effective number of nucleons, Aeff , determines the rapidity gap survival probability,
Aeff
A=
1
A
∫d2b TA(b) exp[−σρ0Nin TA(b)] . (81)
In the high energy regime, the growth of σρ0N
in is significant. Thus the suppression
becomes quite large, Aeff/A ∼ A−23 , emphasizing the peripheral nature of the process.
At large t, the dominant component of the photon wavefunction responsible for
vector meson photoproduction with nucleon dissociation is a qq dipole characterized by
size d ∝ 1/√|t|. Leading and higher-twist nuclear shadowing should decrease with t
due to color transparency. The contribution of planar (eikonal/Glauber rescattering)
diagrams to the high-energy amplitude is canceled in a quantum field theory [167, 168].
This result has recently been generalized to pQCD for the interaction of a small dipole
with a large color singlet dipole by gg ladder exchanges: either of two color octet
ladders [169] or of multiple color singlet ladders [170]. The primary distinction between
a quantum-mechanical description of scattering and a quantum field theory like QCD
is that a field theory allows fluctuations in the number of constituents in a given dipole
configuration, all of which can scatter in the target [22, 170], while quantum mechanics
involves the interaction of systems with fixed number of constituents. Each constituent
in a particular configuration can interact only once with a target parton through a t
channel amplitude with vacuum quantum numbers. Multiple scattering thus arises when
the interaction partners are viewed as collections of partons, leading to a Gribov-Glauber
type picture with causality and energy-momentum conservation.
In the case of dipole-nucleus scattering, the first rescattering is given by the pQCD
cross section for the interaction of the qq dipole of transverse size d. At leading order,
the cross section can be written as [26, 27, 171],
σ(qq)Nin (x, d2) =
π2
4CFd
2αs(Q2eff)xg(x, Q2
eff) . (82)
where, similar to Eq. (7), CF = 4/3, d is the transverse size of the dipole, Q2eff ∝ 1/d2 is
the effective dipole virtuality, x = Q2eff/W
2γp and g(x, Q2
eff) is the inclusive gluon density
of the target. Since the dipole size scales as 1/√|t|, at sufficiently large t and fixed
87
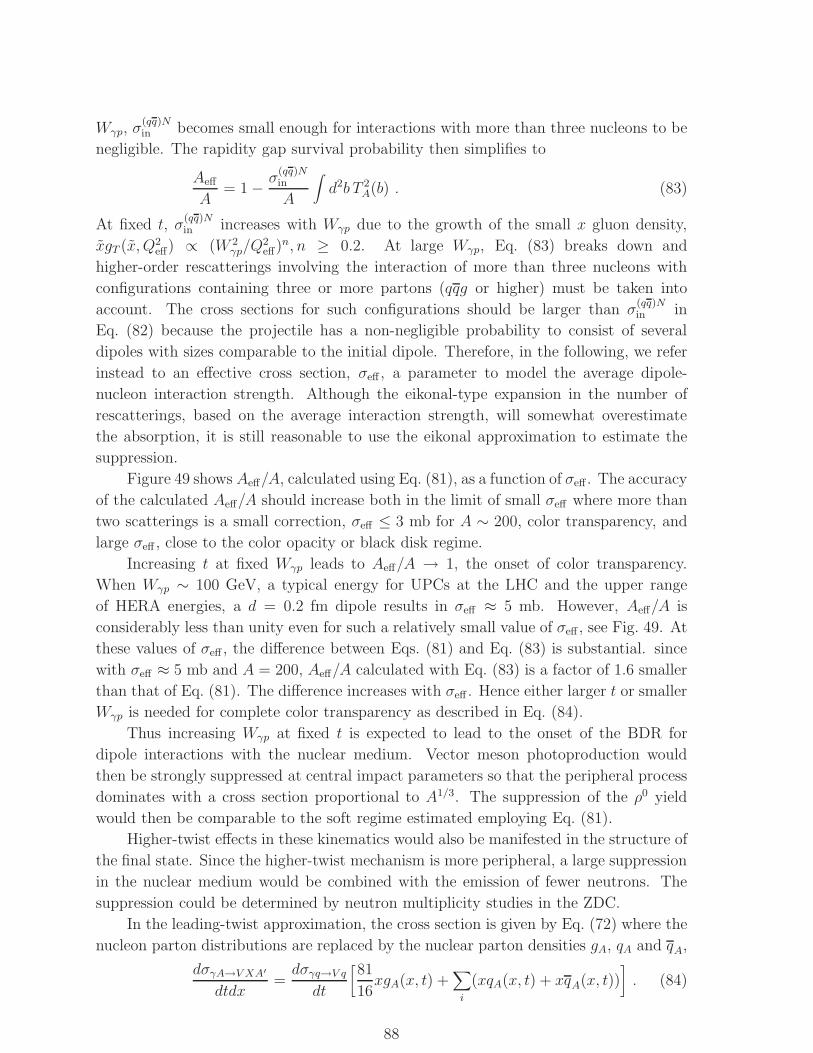
Wγp, σ(qq)Nin becomes small enough for interactions with more than three nucleons to be
negligible. The rapidity gap survival probability then simplifies to
Aeff
A= 1 − σ
(qq)Nin
A
∫d2b T 2
A(b) . (83)
At fixed t, σ(qq)Nin increases with Wγp due to the growth of the small x gluon density,
xgT (x, Q2eff) ∝ (W 2
γp/Q2eff)n, n ≥ 0.2. At large Wγp, Eq. (83) breaks down and
higher-order rescatterings involving the interaction of more than three nucleons with
configurations containing three or more partons (qqg or higher) must be taken into
account. The cross sections for such configurations should be larger than σ(qq)Nin in
Eq. (82) because the projectile has a non-negligible probability to consist of several
dipoles with sizes comparable to the initial dipole. Therefore, in the following, we refer
instead to an effective cross section, σeff , a parameter to model the average dipole-
nucleon interaction strength. Although the eikonal-type expansion in the number of
rescatterings, based on the average interaction strength, will somewhat overestimate
the absorption, it is still reasonable to use the eikonal approximation to estimate the
suppression.
Figure 49 shows Aeff/A, calculated using Eq. (81), as a function of σeff . The accuracy
of the calculated Aeff/A should increase both in the limit of small σeff where more than
two scatterings is a small correction, σeff ≤ 3 mb for A ∼ 200, color transparency, and
large σeff , close to the color opacity or black disk regime.
Increasing t at fixed Wγp leads to Aeff/A → 1, the onset of color transparency.
When Wγp ∼ 100 GeV, a typical energy for UPCs at the LHC and the upper range
of HERA energies, a d = 0.2 fm dipole results in σeff ≈ 5 mb. However, Aeff/A is
considerably less than unity even for such a relatively small value of σeff , see Fig. 49. At
these values of σeff , the difference between Eqs. (81) and Eq. (83) is substantial. since
with σeff ≈ 5 mb and A = 200, Aeff/A calculated with Eq. (83) is a factor of 1.6 smaller
than that of Eq. (81). The difference increases with σeff . Hence either larger t or smaller
Wγp is needed for complete color transparency as described in Eq. (84).
Thus increasing Wγp at fixed t is expected to lead to the onset of the BDR for
dipole interactions with the nuclear medium. Vector meson photoproduction would
then be strongly suppressed at central impact parameters so that the peripheral process
dominates with a cross section proportional to A1/3. The suppression of the ρ0 yield
would then be comparable to the soft regime estimated employing Eq. (81).
Higher-twist effects in these kinematics would also be manifested in the structure of
the final state. Since the higher-twist mechanism is more peripheral, a large suppression
in the nuclear medium would be combined with the emission of fewer neutrons. The
suppression could be determined by neutron multiplicity studies in the ZDC.
In the leading-twist approximation, the cross section is given by Eq. (72) where the
nucleon parton distributions are replaced by the nuclear parton densities gA, qA and qA,
dσγA→V XA′
dtdx=dσγq→V q
dt
[81
16xgA(x, t) +
∑
i
(xqA(x, t) + xqA(x, t))]. (84)
88
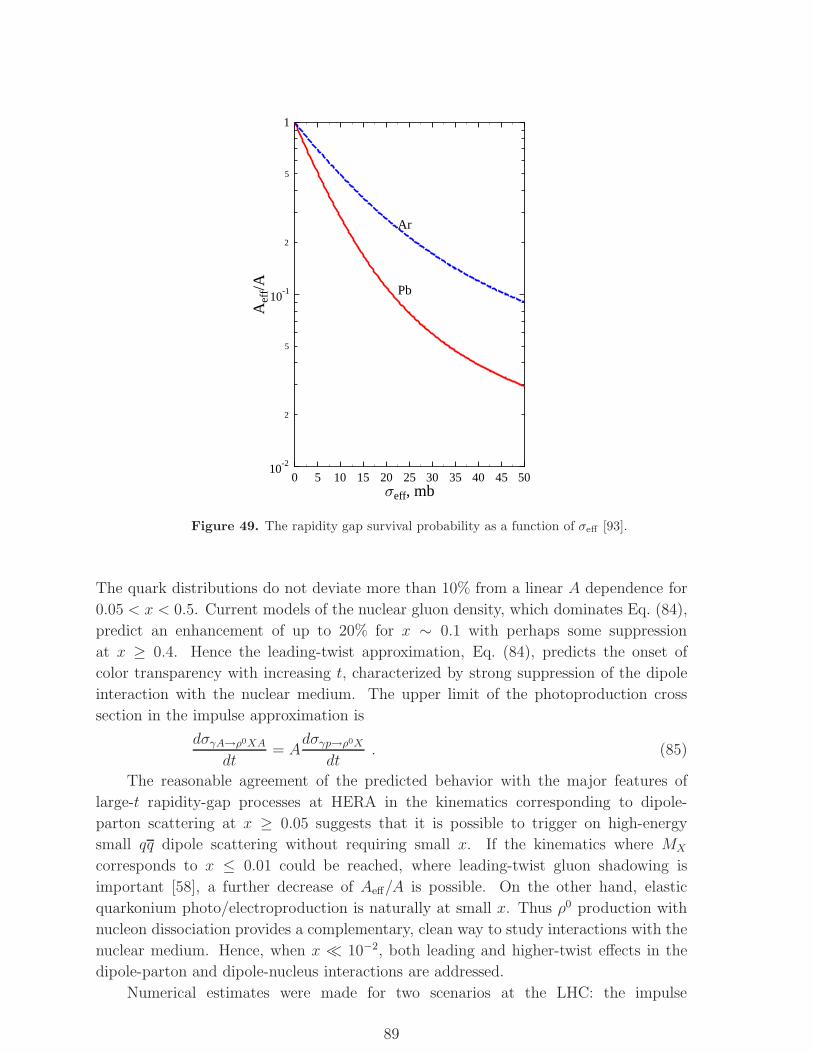
0 5 10 15 20 25 30 35 40 45 50
eff, mb
10-2
2
5
10-1
2
5
1
Aef
f/A Pb
Ar
Figure 49. The rapidity gap survival probability as a function of σeff [93].
The quark distributions do not deviate more than 10% from a linear A dependence for
0.05 < x < 0.5. Current models of the nuclear gluon density, which dominates Eq. (84),
predict an enhancement of up to 20% for x ∼ 0.1 with perhaps some suppression
at x ≥ 0.4. Hence the leading-twist approximation, Eq. (84), predicts the onset of
color transparency with increasing t, characterized by strong suppression of the dipole
interaction with the nuclear medium. The upper limit of the photoproduction cross
section in the impulse approximation is
dσγA→ρ0XAdt
= Adσγp→ρ0X
dt. (85)
The reasonable agreement of the predicted behavior with the major features of
large-t rapidity-gap processes at HERA in the kinematics corresponding to dipole-
parton scattering at x ≥ 0.05 suggests that it is possible to trigger on high-energy
small qq dipole scattering without requiring small x. If the kinematics where MX
corresponds to x ≤ 0.01 could be reached, where leading-twist gluon shadowing is
important [58], a further decrease of Aeff/A is possible. On the other hand, elastic
quarkonium photo/electroproduction is naturally at small x. Thus ρ0 production with
nucleon dissociation provides a complementary, clean way to study interactions with the
nuclear medium. Hence, when x ≪ 10−2, both leading and higher-twist effects in the
dipole-parton and dipole-nucleus interactions are addressed.
Numerical estimates were made for two scenarios at the LHC: the impulse
89
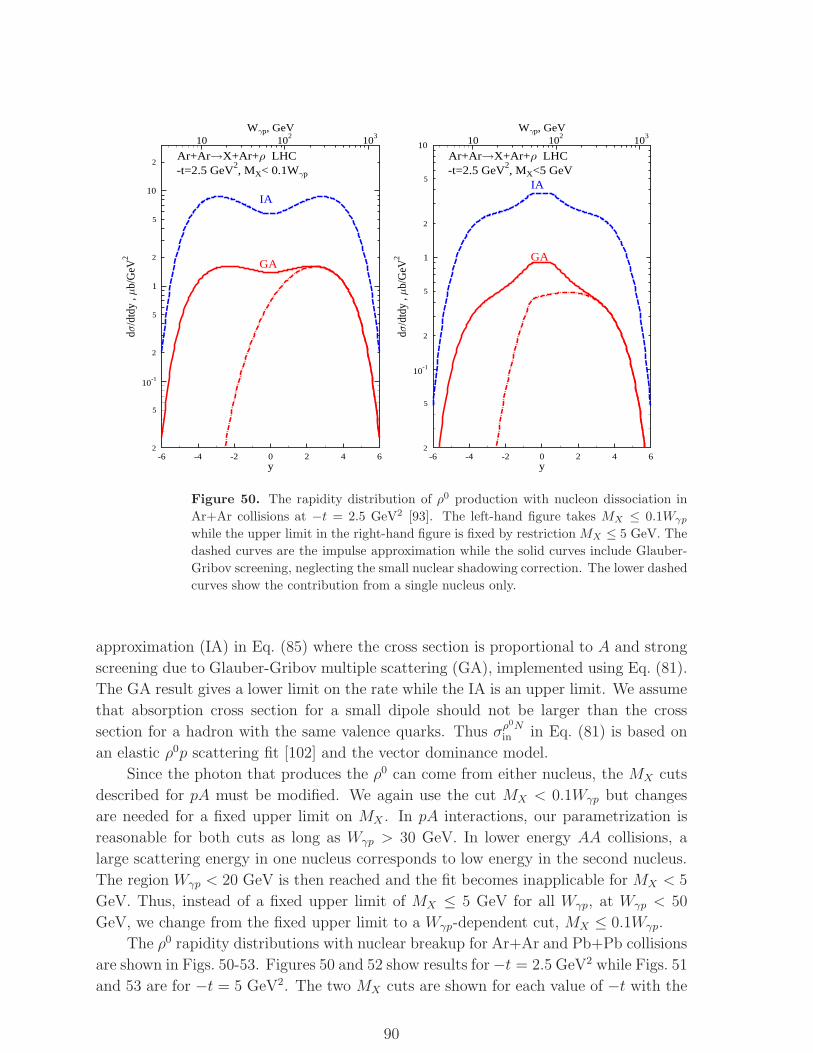
-6 -4 -2 0 2 4 6y
2
5
10-1
2
5
1
2
5
10
2
d/d
tdy
,b/
GeV
2W p, GeV
GA
IA
Ar+Ar X+Ar+ LHC-t=2.5 GeV
2, MX< 0.1W p
10 102
103
-6 -4 -2 0 2 4 6y
2
5
10-1
2
5
1
2
5
10
d/d
tdy
,b/
GeV
2
W p, GeV
GA
IA
Ar+Ar X+Ar+ LHC-t=2.5 GeV
2, MX<5 GeV
10 102
103
Figure 50. The rapidity distribution of ρ0 production with nucleon dissociation in
Ar+Ar collisions at −t = 2.5 GeV2 [93]. The left-hand figure takes MX ≤ 0.1Wγp
while the upper limit in the right-hand figure is fixed by restriction MX ≤ 5 GeV. The
dashed curves are the impulse approximation while the solid curves include Glauber-
Gribov screening, neglecting the small nuclear shadowing correction. The lower dashed
curves show the contribution from a single nucleus only.
approximation (IA) in Eq. (85) where the cross section is proportional to A and strong
screening due to Glauber-Gribov multiple scattering (GA), implemented using Eq. (81).
The GA result gives a lower limit on the rate while the IA is an upper limit. We assume
that absorption cross section for a small dipole should not be larger than the cross
section for a hadron with the same valence quarks. Thus σρ0N
in in Eq. (81) is based on
an elastic ρ0p scattering fit [102] and the vector dominance model.
Since the photon that produces the ρ0 can come from either nucleus, the MX cuts
described for pA must be modified. We again use the cut MX < 0.1Wγp but changes
are needed for a fixed upper limit on MX . In pA interactions, our parametrization is
reasonable for both cuts as long as Wγp > 30 GeV. In lower energy AA collisions, a
large scattering energy in one nucleus corresponds to low energy in the second nucleus.
The region Wγp < 20 GeV is then reached and the fit becomes inapplicable for MX < 5
GeV. Thus, instead of a fixed upper limit of MX ≤ 5 GeV for all Wγp, at Wγp < 50
GeV, we change from the fixed upper limit to a Wγp-dependent cut, MX ≤ 0.1Wγp.
The ρ0 rapidity distributions with nuclear breakup for Ar+Ar and Pb+Pb collisions
are shown in Figs. 50-53. Figures 50 and 52 show results for −t = 2.5 GeV2 while Figs. 51
and 53 are for −t = 5 GeV2. The two MX cuts are shown for each value of −t with the
90
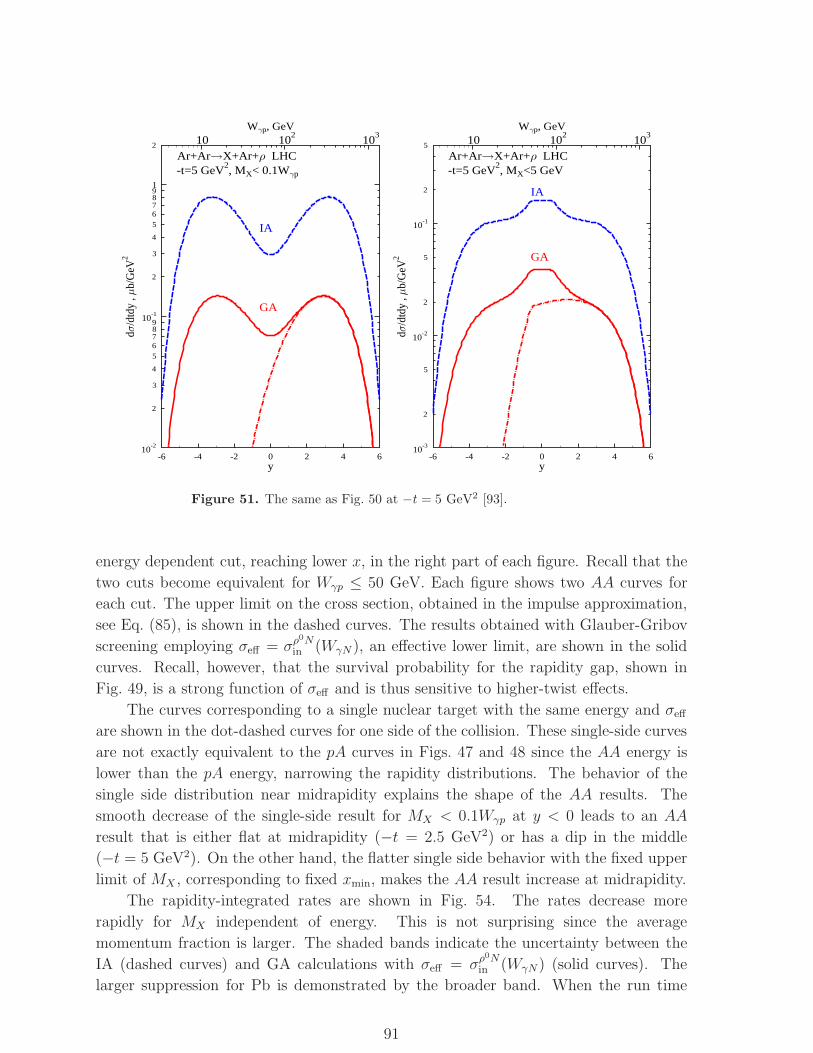
-6 -4 -2 0 2 4 6y
10-2
2
3
4
5678910-1
2
3
4
567891
2
d/d
tdy
,b/
GeV
2W p, GeV
GA
IA
Ar+Ar X+Ar+ LHC-t=5 GeV
2, MX< 0.1W p
10 102
103
-6 -4 -2 0 2 4 6y
10-3
2
5
10-2
2
5
10-1
2
5
d/d
tdy
,b/
GeV
2
W p, GeV
GA
IA
Ar+Ar X+Ar+ LHC-t=5 GeV
2, MX<5 GeV
10 102
103
Figure 51. The same as Fig. 50 at −t = 5 GeV2 [93].
energy dependent cut, reaching lower x, in the right part of each figure. Recall that the
two cuts become equivalent for Wγp ≤ 50 GeV. Each figure shows two AA curves for
each cut. The upper limit on the cross section, obtained in the impulse approximation,
see Eq. (85), is shown in the dashed curves. The results obtained with Glauber-Gribov
screening employing σeff = σρ0N
in (WγN ), an effective lower limit, are shown in the solid
curves. Recall, however, that the survival probability for the rapidity gap, shown in
Fig. 49, is a strong function of σeff and is thus sensitive to higher-twist effects.
The curves corresponding to a single nuclear target with the same energy and σeff
are shown in the dot-dashed curves for one side of the collision. These single-side curves
are not exactly equivalent to the pA curves in Figs. 47 and 48 since the AA energy is
lower than the pA energy, narrowing the rapidity distributions. The behavior of the
single side distribution near midrapidity explains the shape of the AA results. The
smooth decrease of the single-side result for MX < 0.1Wγp at y < 0 leads to an AA
result that is either flat at midrapidity (−t = 2.5 GeV2) or has a dip in the middle
(−t = 5 GeV2). On the other hand, the flatter single side behavior with the fixed upper
limit of MX , corresponding to fixed xmin, makes the AA result increase at midrapidity.
The rapidity-integrated rates are shown in Fig. 54. The rates decrease more
rapidly for MX independent of energy. This is not surprising since the average
momentum fraction is larger. The shaded bands indicate the uncertainty between the
IA (dashed curves) and GA calculations with σeff = σρ0N
in (WγN ) (solid curves). The
larger suppression for Pb is demonstrated by the broader band. When the run time
91
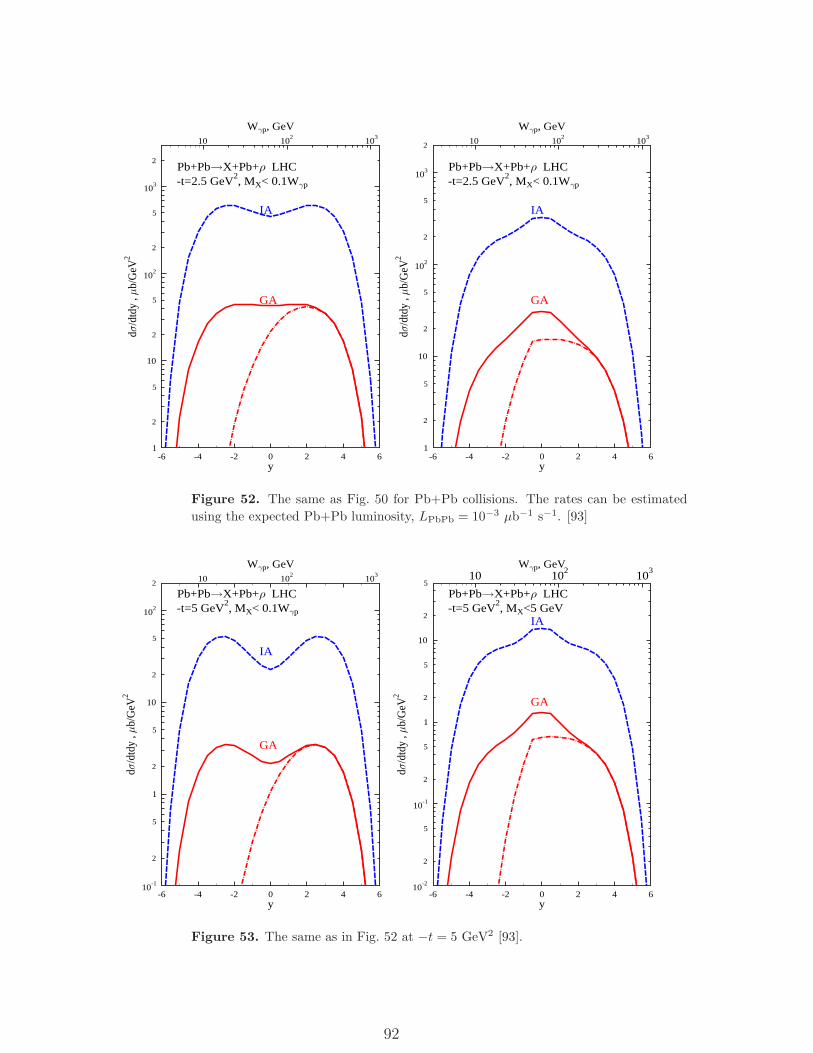
-6 -4 -2 0 2 4 6y
1
2
5
10
2
5
102
2
5
103
2
d/d
tdy
,b/
GeV
2W p, GeV
GA
IA
Pb+Pb X+Pb+ LHC-t=2.5 GeV
2, MX< 0.1W p
10 102
103
-6 -4 -2 0 2 4 6y
1
2
5
10
2
5
102
2
5
103
2
d/d
tdy
,b/
GeV
2
W p, GeV
GA
IA
Pb+Pb X+Pb+ LHC-t=2.5 GeV
2, MX< 0.1W p
10 102
103
Figure 52. The same as Fig. 50 for Pb+Pb collisions. The rates can be estimated
using the expected Pb+Pb luminosity, LPbPb = 10−3 µb−1 s−1. [93]
-6 -4 -2 0 2 4 6y
10-1
2
5
1
2
5
10
2
5
102
2
d/d
tdy
,b/
GeV
2
W p, GeV
GA
IA
Pb+Pb X+Pb+ LHC-t=5 GeV
2, MX< 0.1W p
10 102
103
-6 -4 -2 0 2 4 6y
10-2
2
5
10-1
2
5
1
2
5
10
2
5
d/d
tdy
,b/
GeV
2
W p, GeV
GA
IA
Pb+Pb X+Pb+ LHC-t=5 GeV
2, MX<5 GeV
10 102
103
Figure 53. The same as in Fig. 52 at −t = 5 GeV2 [93].
92
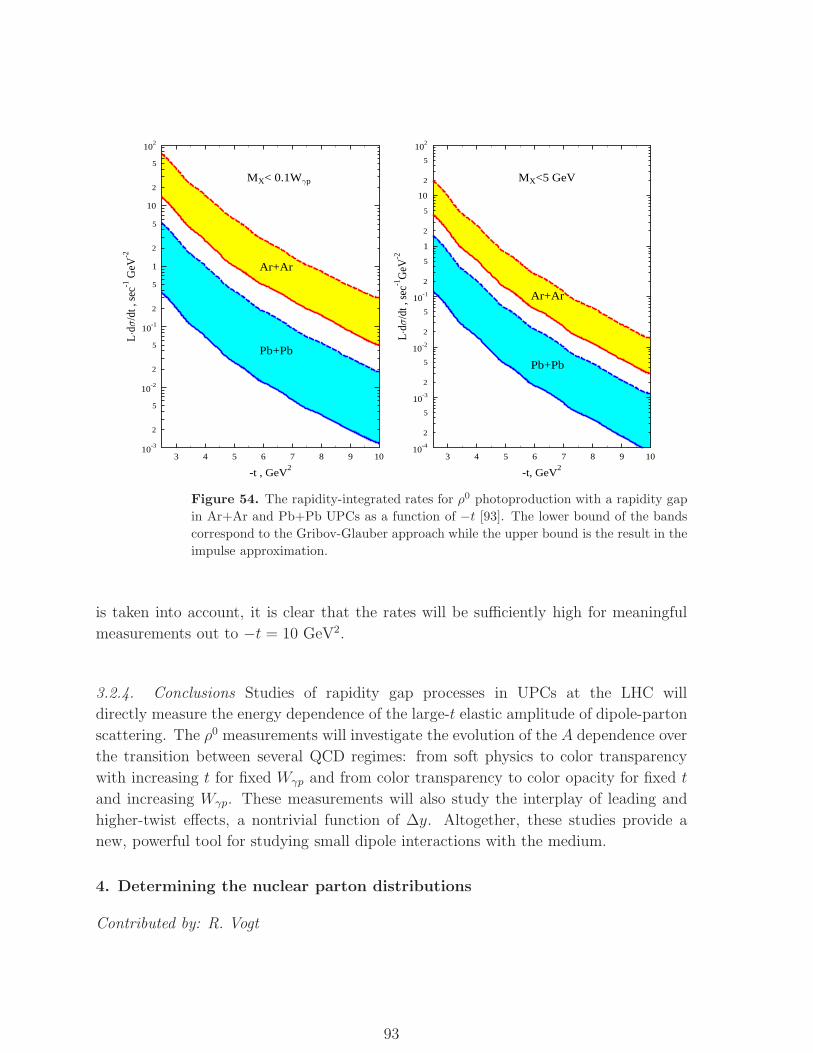
3 4 5 6 7 8 9 10
-t , GeV2
10-3
2
5
10-2
2
5
10-1
2
5
1
2
5
10
2
5
102
Ld
/dt,
sec-1
GeV
-2
Pb+Pb
Ar+Ar
MX< 0.1W p
3 4 5 6 7 8 9 10
-t, GeV2
10-4
2
5
10-3
2
5
10-2
2
5
10-1
2
5
1
2
5
10
2
5
102
Ld
/dt,
sec-1
GeV
-2
Pb+Pb
Ar+Ar
MX<5 GeV
Figure 54. The rapidity-integrated rates for ρ0 photoproduction with a rapidity gap
in Ar+Ar and Pb+Pb UPCs as a function of −t [93]. The lower bound of the bands
correspond to the Gribov-Glauber approach while the upper bound is the result in the
impulse approximation.
is taken into account, it is clear that the rates will be sufficiently high for meaningful
measurements out to −t = 10 GeV2.
3.2.4. Conclusions Studies of rapidity gap processes in UPCs at the LHC will
directly measure the energy dependence of the large-t elastic amplitude of dipole-parton
scattering. The ρ0 measurements will investigate the evolution of the A dependence over
the transition between several QCD regimes: from soft physics to color transparency
with increasing t for fixed Wγp and from color transparency to color opacity for fixed t
and increasing Wγp. These measurements will also study the interplay of leading and
higher-twist effects, a nontrivial function of ∆y. Altogether, these studies provide a
new, powerful tool for studying small dipole interactions with the medium.
4. Determining the nuclear parton distributions
Contributed by: R. Vogt
93
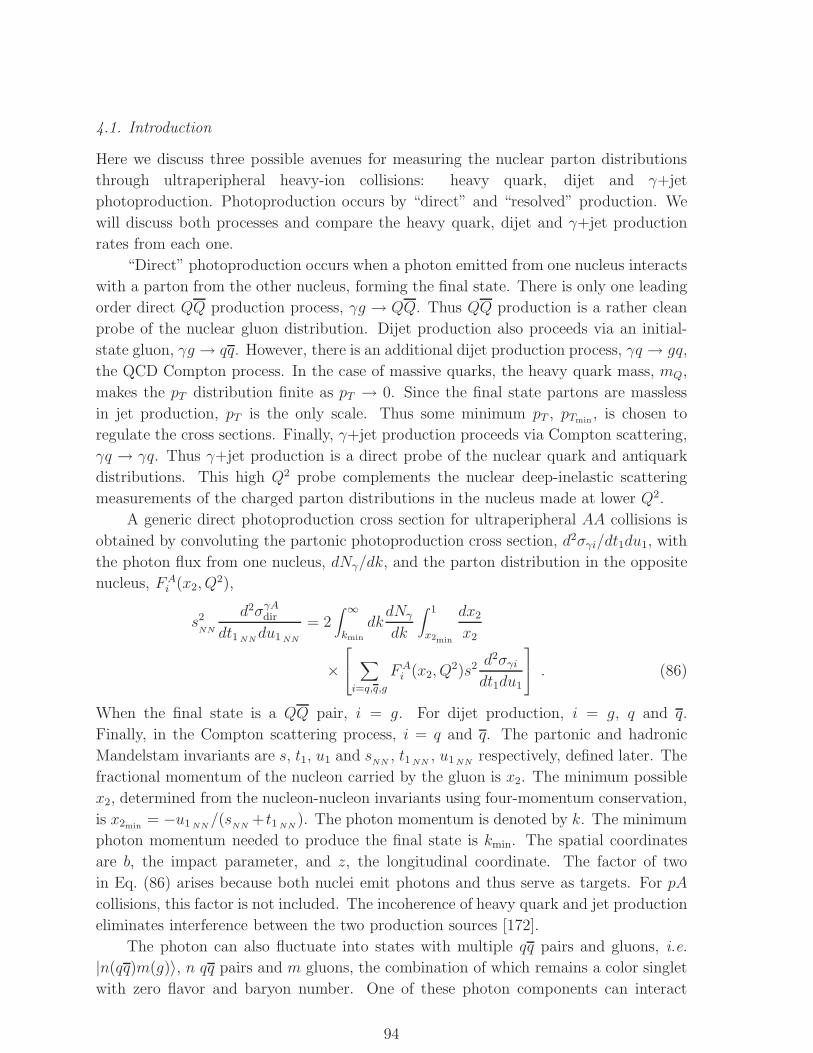
4.1. Introduction
Here we discuss three possible avenues for measuring the nuclear parton distributions
through ultraperipheral heavy-ion collisions: heavy quark, dijet and γ+jet
photoproduction. Photoproduction occurs by “direct” and “resolved” production. We
will discuss both processes and compare the heavy quark, dijet and γ+jet production
rates from each one.
“Direct” photoproduction occurs when a photon emitted from one nucleus interacts
with a parton from the other nucleus, forming the final state. There is only one leading
order direct QQ production process, γg → QQ. Thus QQ production is a rather clean
probe of the nuclear gluon distribution. Dijet production also proceeds via an initial-
state gluon, γg → qq. However, there is an additional dijet production process, γq → gq,
the QCD Compton process. In the case of massive quarks, the heavy quark mass, mQ,
makes the pT distribution finite as pT → 0. Since the final state partons are massless
in jet production, pT is the only scale. Thus some minimum pT , pTmin, is chosen to
regulate the cross sections. Finally, γ+jet production proceeds via Compton scattering,
γq → γq. Thus γ+jet production is a direct probe of the nuclear quark and antiquark
distributions. This high Q2 probe complements the nuclear deep-inelastic scattering
measurements of the charged parton distributions in the nucleus made at lower Q2.
A generic direct photoproduction cross section for ultraperipheral AA collisions is
obtained by convoluting the partonic photoproduction cross section, d2σγi/dt1du1, with
the photon flux from one nucleus, dNγ/dk, and the parton distribution in the opposite
nucleus, FAi (x2, Q
2),
s2NN
d2σγAdir
dt1 NNdu1 NN
= 2∫ ∞
kmin
dkdNγ
dk
∫ 1
x2min
dx2
x2
×
∑
i=q,q,g
FAi (x2, Q
2)s2 d2σγi
dt1du1
. (86)
When the final state is a QQ pair, i = g. For dijet production, i = g, q and q.
Finally, in the Compton scattering process, i = q and q. The partonic and hadronic
Mandelstam invariants are s, t1, u1 and sNN
, t1 NN, u1 NN
respectively, defined later. The
fractional momentum of the nucleon carried by the gluon is x2. The minimum possible
x2, determined from the nucleon-nucleon invariants using four-momentum conservation,
is x2min= −u1 NN
/(sNN
+ t1 NN). The photon momentum is denoted by k. The minimum
photon momentum needed to produce the final state is kmin. The spatial coordinates
are b, the impact parameter, and z, the longitudinal coordinate. The factor of two
in Eq. (86) arises because both nuclei emit photons and thus serve as targets. For pA
collisions, this factor is not included. The incoherence of heavy quark and jet production
eliminates interference between the two production sources [172].
The photon can also fluctuate into states with multiple qq pairs and gluons, i.e.
|n(qq)m(g)〉, n qq pairs and m gluons, the combination of which remains a color singlet
with zero flavor and baryon number. One of these photon components can interact
94
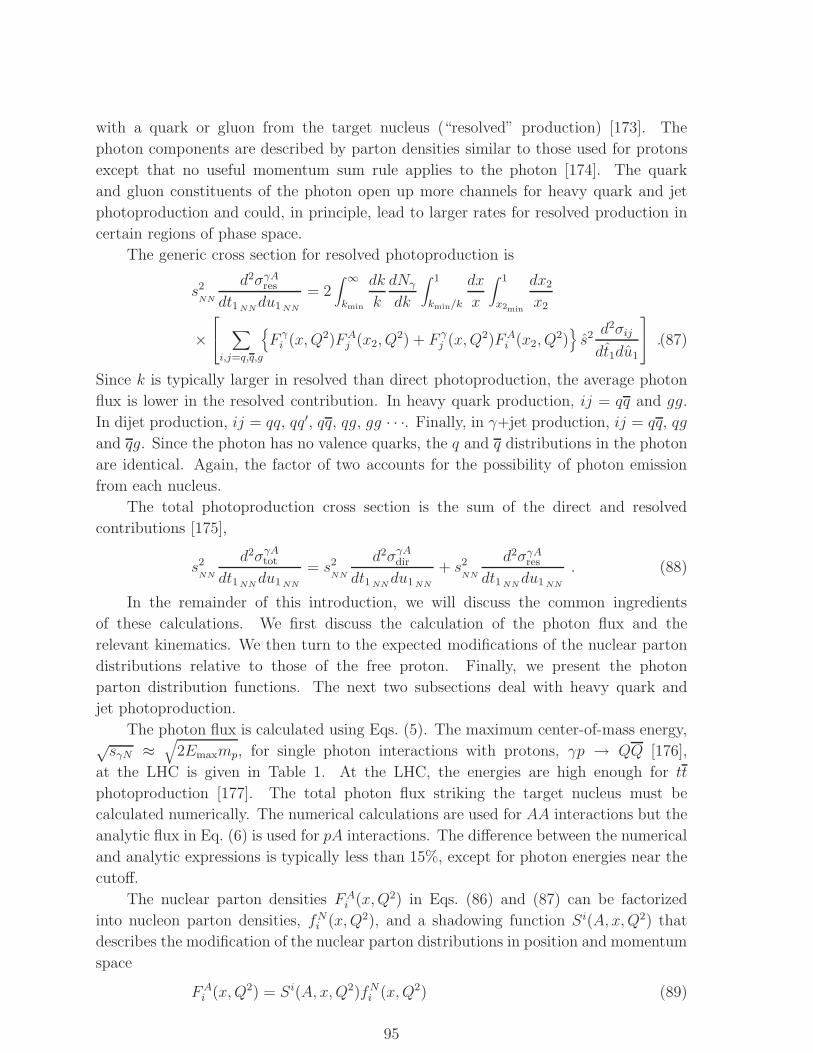
with a quark or gluon from the target nucleus (“resolved” production) [173]. The
photon components are described by parton densities similar to those used for protons
except that no useful momentum sum rule applies to the photon [174]. The quark
and gluon constituents of the photon open up more channels for heavy quark and jet
photoproduction and could, in principle, lead to larger rates for resolved production in
certain regions of phase space.
The generic cross section for resolved photoproduction is
s2NN
d2σγAres
dt1 NNdu1 NN
= 2∫ ∞
kmin
dk
k
dNγ
dk
∫ 1
kmin/k
dx
x
∫ 1
x2min
dx2
x2
×
∑
i,j=q,q,g
{F γi (x,Q2)FA
j (x2, Q2) + F γ
j (x,Q2)FAi (x2, Q
2)}s2 d
2σij
dt1du1
.(87)
Since k is typically larger in resolved than direct photoproduction, the average photon
flux is lower in the resolved contribution. In heavy quark production, ij = qq and gg.
In dijet production, ij = qq, qq′, qq, qg, gg · · ·. Finally, in γ+jet production, ij = qq, qg
and qg. Since the photon has no valence quarks, the q and q distributions in the photon
are identical. Again, the factor of two accounts for the possibility of photon emission
from each nucleus.
The total photoproduction cross section is the sum of the direct and resolved
contributions [175],
s2NN
d2σγAtot
dt1 NNdu1 NN
= s2NN
d2σγAdir
dt1 NNdu1 NN
+ s2NN
d2σγAres
dt1 NNdu1 NN
. (88)
In the remainder of this introduction, we will discuss the common ingredients
of these calculations. We first discuss the calculation of the photon flux and the
relevant kinematics. We then turn to the expected modifications of the nuclear parton
distributions relative to those of the free proton. Finally, we present the photon
parton distribution functions. The next two subsections deal with heavy quark and
jet photoproduction.
The photon flux is calculated using Eqs. (5). The maximum center-of-mass energy,√sγN ≈
√2Emaxmp, for single photon interactions with protons, γp → QQ [176],
at the LHC is given in Table 1. At the LHC, the energies are high enough for tt
photoproduction [177]. The total photon flux striking the target nucleus must be
calculated numerically. The numerical calculations are used for AA interactions but the
analytic flux in Eq. (6) is used for pA interactions. The difference between the numerical
and analytic expressions is typically less than 15%, except for photon energies near the
cutoff.
The nuclear parton densities FAi (x,Q2) in Eqs. (86) and (87) can be factorized
into nucleon parton densities, fNi (x,Q2), and a shadowing function Si(A, x,Q2) that
describes the modification of the nuclear parton distributions in position and momentum
space
FAi (x,Q2) = Si(A, x,Q2)fNi (x,Q2) (89)
95
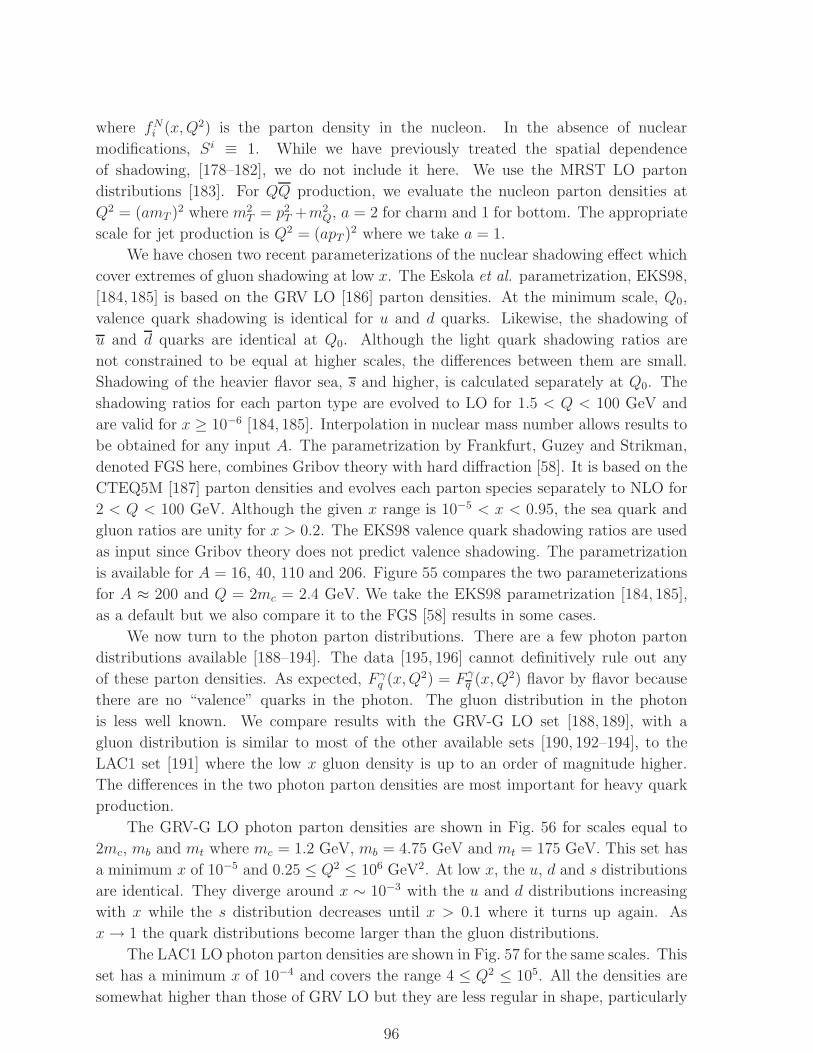
where fNi (x,Q2) is the parton density in the nucleon. In the absence of nuclear
modifications, Si ≡ 1. While we have previously treated the spatial dependence
of shadowing, [178–182], we do not include it here. We use the MRST LO parton
distributions [183]. For QQ production, we evaluate the nucleon parton densities at
Q2 = (amT )2 where m2T = p2
T +m2Q, a = 2 for charm and 1 for bottom. The appropriate
scale for jet production is Q2 = (apT )2 where we take a = 1.
We have chosen two recent parameterizations of the nuclear shadowing effect which
cover extremes of gluon shadowing at low x. The Eskola et al. parametrization, EKS98,
[184, 185] is based on the GRV LO [186] parton densities. At the minimum scale, Q0,
valence quark shadowing is identical for u and d quarks. Likewise, the shadowing of
u and d quarks are identical at Q0. Although the light quark shadowing ratios are
not constrained to be equal at higher scales, the differences between them are small.
Shadowing of the heavier flavor sea, s and higher, is calculated separately at Q0. The
shadowing ratios for each parton type are evolved to LO for 1.5 < Q < 100 GeV and
are valid for x ≥ 10−6 [184, 185]. Interpolation in nuclear mass number allows results to
be obtained for any input A. The parametrization by Frankfurt, Guzey and Strikman,
denoted FGS here, combines Gribov theory with hard diffraction [58]. It is based on the
CTEQ5M [187] parton densities and evolves each parton species separately to NLO for
2 < Q < 100 GeV. Although the given x range is 10−5 < x < 0.95, the sea quark and
gluon ratios are unity for x > 0.2. The EKS98 valence quark shadowing ratios are used
as input since Gribov theory does not predict valence shadowing. The parametrization
is available for A = 16, 40, 110 and 206. Figure 55 compares the two parameterizations
for A ≈ 200 and Q = 2mc = 2.4 GeV. We take the EKS98 parametrization [184, 185],
as a default but we also compare it to the FGS [58] results in some cases.
We now turn to the photon parton distributions. There are a few photon parton
distributions available [188–194]. The data [195, 196] cannot definitively rule out any
of these parton densities. As expected, F γq (x,Q2) = F γ
q (x,Q2) flavor by flavor because
there are no “valence” quarks in the photon. The gluon distribution in the photon
is less well known. We compare results with the GRV-G LO set [188, 189], with a
gluon distribution is similar to most of the other available sets [190, 192–194], to the
LAC1 set [191] where the low x gluon density is up to an order of magnitude higher.
The differences in the two photon parton densities are most important for heavy quark
production.
The GRV-G LO photon parton densities are shown in Fig. 56 for scales equal to
2mc, mb and mt where mc = 1.2 GeV, mb = 4.75 GeV and mt = 175 GeV. This set has
a minimum x of 10−5 and 0.25 ≤ Q2 ≤ 106 GeV2. At low x, the u, d and s distributions
are identical. They diverge around x ∼ 10−3 with the u and d distributions increasing
with x while the s distribution decreases until x > 0.1 where it turns up again. As
x→ 1 the quark distributions become larger than the gluon distributions.
The LAC1 LO photon parton densities are shown in Fig. 57 for the same scales. This
set has a minimum x of 10−4 and covers the range 4 ≤ Q2 ≤ 105. All the densities are
somewhat higher than those of GRV LO but they are less regular in shape, particularly
96
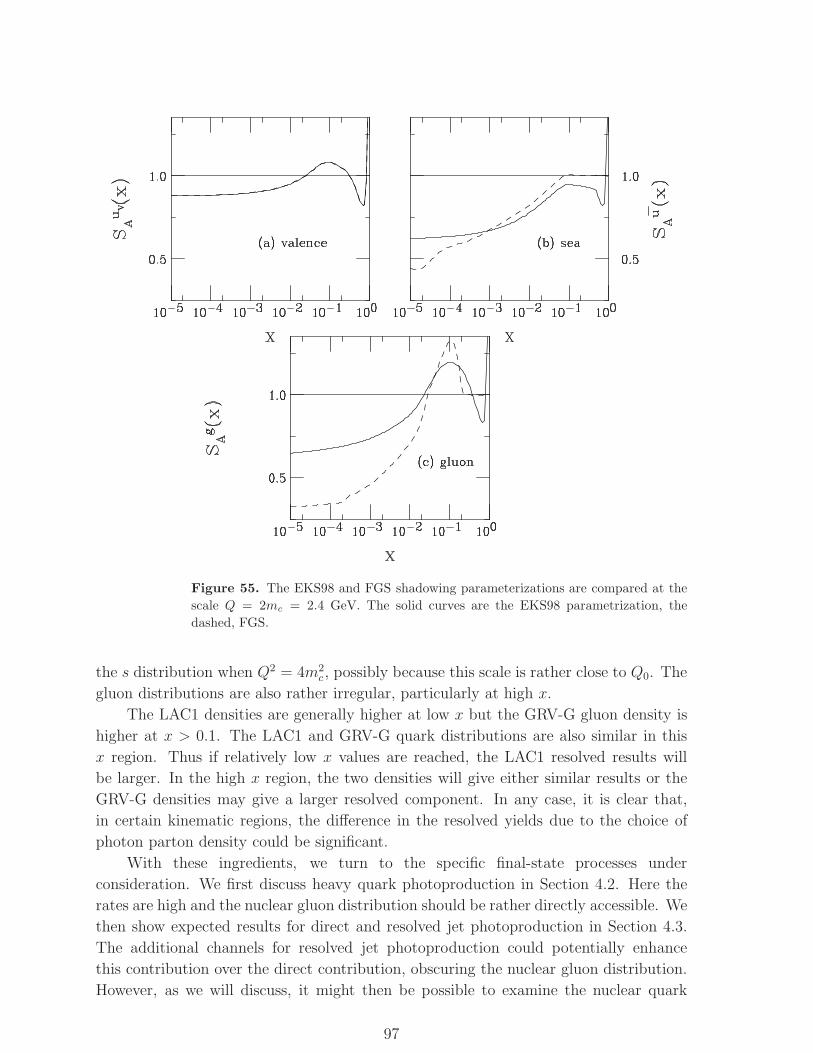
Figure 55. The EKS98 and FGS shadowing parameterizations are compared at the
scale Q = 2mc = 2.4 GeV. The solid curves are the EKS98 parametrization, the
dashed, FGS.
the s distribution when Q2 = 4m2c , possibly because this scale is rather close to Q0. The
gluon distributions are also rather irregular, particularly at high x.
The LAC1 densities are generally higher at low x but the GRV-G gluon density is
higher at x > 0.1. The LAC1 and GRV-G quark distributions are also similar in this
x region. Thus if relatively low x values are reached, the LAC1 resolved results will
be larger. In the high x region, the two densities will give either similar results or the
GRV-G densities may give a larger resolved component. In any case, it is clear that,
in certain kinematic regions, the difference in the resolved yields due to the choice of
photon parton density could be significant.
With these ingredients, we turn to the specific final-state processes under
consideration. We first discuss heavy quark photoproduction in Section 4.2. Here the
rates are high and the nuclear gluon distribution should be rather directly accessible. We
then show expected results for direct and resolved jet photoproduction in Section 4.3.
The additional channels for resolved jet photoproduction could potentially enhance
this contribution over the direct contribution, obscuring the nuclear gluon distribution.
However, as we will discuss, it might then be possible to examine the nuclear quark
97
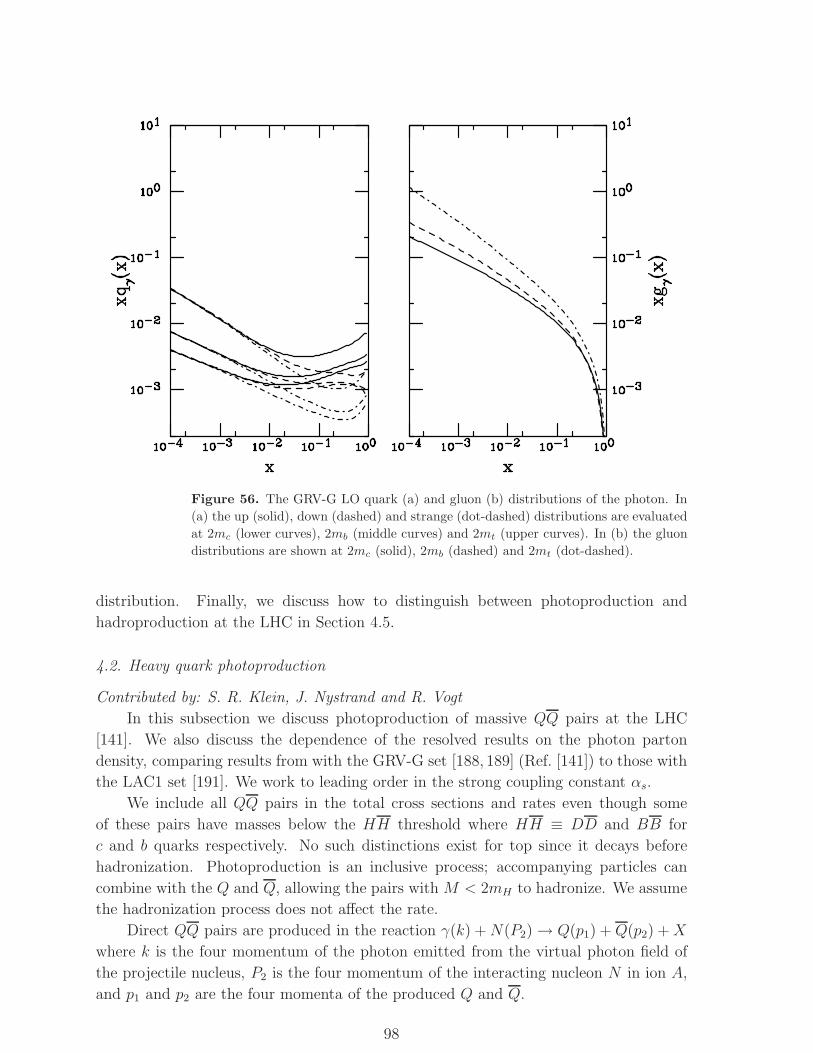
Figure 56. The GRV-G LO quark (a) and gluon (b) distributions of the photon. In
(a) the up (solid), down (dashed) and strange (dot-dashed) distributions are evaluated
at 2mc (lower curves), 2mb (middle curves) and 2mt (upper curves). In (b) the gluon
distributions are shown at 2mc (solid), 2mb (dashed) and 2mt (dot-dashed).
distribution. Finally, we discuss how to distinguish between photoproduction and
hadroproduction at the LHC in Section 4.5.
4.2. Heavy quark photoproduction
Contributed by: S. R. Klein, J. Nystrand and R. Vogt
In this subsection we discuss photoproduction of massive QQ pairs at the LHC
[141]. We also discuss the dependence of the resolved results on the photon parton
density, comparing results from with the GRV-G set [188, 189] (Ref. [141]) to those with
the LAC1 set [191]. We work to leading order in the strong coupling constant αs.
We include all QQ pairs in the total cross sections and rates even though some
of these pairs have masses below the HH threshold where HH ≡ DD and BB for
c and b quarks respectively. No such distinctions exist for top since it decays before
hadronization. Photoproduction is an inclusive process; accompanying particles can
combine with the Q and Q, allowing the pairs with M < 2mH to hadronize. We assume
the hadronization process does not affect the rate.
Direct QQ pairs are produced in the reaction γ(k) +N(P2) → Q(p1) +Q(p2) +X
where k is the four momentum of the photon emitted from the virtual photon field of
the projectile nucleus, P2 is the four momentum of the interacting nucleon N in ion A,
and p1 and p2 are the four momenta of the produced Q and Q.
98
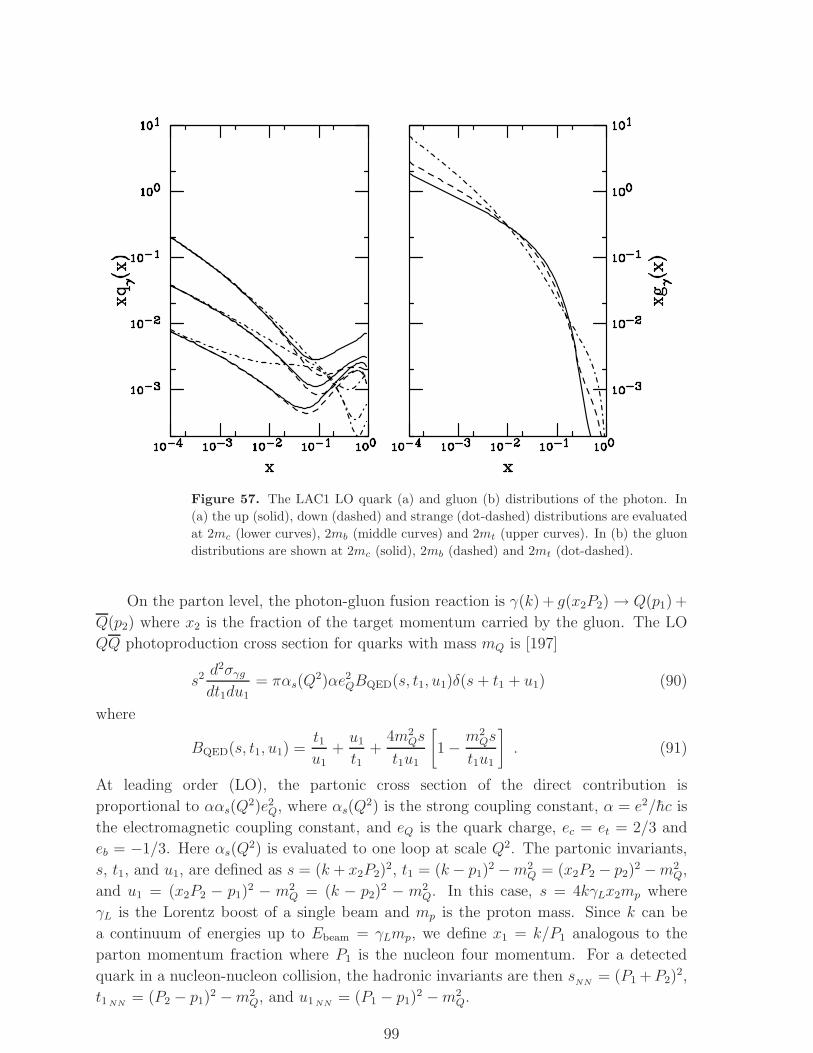
Figure 57. The LAC1 LO quark (a) and gluon (b) distributions of the photon. In
(a) the up (solid), down (dashed) and strange (dot-dashed) distributions are evaluated
at 2mc (lower curves), 2mb (middle curves) and 2mt (upper curves). In (b) the gluon
distributions are shown at 2mc (solid), 2mb (dashed) and 2mt (dot-dashed).
On the parton level, the photon-gluon fusion reaction is γ(k) + g(x2P2) → Q(p1) +
Q(p2) where x2 is the fraction of the target momentum carried by the gluon. The LO
QQ photoproduction cross section for quarks with mass mQ is [197]
s2 d2σγg
dt1du1= παs(Q
2)αe2QBQED(s, t1, u1)δ(s+ t1 + u1) (90)
where
BQED(s, t1, u1) =t1u1
+u1
t1+
4m2Qs
t1u1
[1 −
m2Qs
t1u1
]. (91)
At leading order (LO), the partonic cross section of the direct contribution is
proportional to ααs(Q2)e2Q, where αs(Q
2) is the strong coupling constant, α = e2/hc is
the electromagnetic coupling constant, and eQ is the quark charge, ec = et = 2/3 and
eb = −1/3. Here αs(Q2) is evaluated to one loop at scale Q2. The partonic invariants,
s, t1, and u1, are defined as s = (k + x2P2)2, t1 = (k − p1)
2 −m2Q = (x2P2 − p2)
2 −m2Q,
and u1 = (x2P2 − p1)2 − m2
Q = (k − p2)2 − m2
Q. In this case, s = 4kγLx2mp where
γL is the Lorentz boost of a single beam and mp is the proton mass. Since k can be
a continuum of energies up to Ebeam = γLmp, we define x1 = k/P1 analogous to the
parton momentum fraction where P1 is the nucleon four momentum. For a detected
quark in a nucleon-nucleon collision, the hadronic invariants are then sNN
= (P1 +P2)2,
t1 NN= (P2 − p1)
2 −m2Q, and u1 NN
= (P1 − p1)2 −m2
Q.
99

We label the quark rapidity as y1 and the antiquark rapidity as y2. The quark
rapidity is related to the invariant t1 NNby t1 NN
= −√s
NNmT e
−y1. The invariant mass of
the pair can be determined if both the Q and Q are detected. The square of the invariant
mass, M2 = s = 2m2T (1 + cosh(y1 − y2)), is the partonic center-of-mass energy squared.
For QQ pair production, kmin = M2/4γLmp. At LO, x1 = (mT/√s
NN)(ey1 + ey2) and
x2 = (mT/√s
NN)(e−y1 + e−y2). We calculate x1 and x2 as in an NN collision and then
determine the flux in the lab frame for k = x1γLmp, equivalent to the center-of-mass
frame in a collider. The photon flux is exponentially suppressed for k > γLhc/RA,
corresponding to a momentum fraction x1 > hc/mpRA. The maximum γN center-of-
mass energy,√sγN , is much lower than the hadronic
√s
NN.
The cross section for direct photon-nucleon heavy quark photoproduction is
obtained by inserting Eq. (90) into Eq. (86). The equivalent hadronic invariants can be
defined for photon four momentum k as sγN = (k + P2)2, t1,γN = (P2 − p1)
2 −m2Q, and
u1,γN = (k− p1)2 −m2
Q [198]. The partonic and equivalent hadronic invariants for fixed
k are related by s = x2sγN , t1 = u1,γN , and u1 = x2t1,γN .
The charm and bottom photoproduction distributions are shown in Fig. 58 for
Pb+Pb, Ar+Ar and O+O collisions. The direct top photoproduction distributions
for these three systems are given on the left-hand side of Fig. 59. There are three
curves for each contribution, one without shadowing and two with homogeneous nuclear
shadowing employing the EKS98 and FGS parameterizations. The photon comes from
the left. Then y1 < 0 corresponds to k < γLx2mp in the center-of-mass (lab) frame.
If the photon emitter and target nucleus are interchanged, the resulting unshadowed
rapidity distribution, Si = 1, is the mirror image of these distributions around y1 = 0.
The Q and Q distributions are asymmetric around y1 = 0. The total heavy quark
rapidity distributions are then the sum of the displayed results with their mirror images
when both nuclei emit photons. This factor of two, shown in Eq. (86), is included in
the transverse momentum and invariant mass distributions. Note that the peak in the
rapidity distributions moves towards more negative y1 and the distribution narrows as
the quark mass increases. The y1 phase space for a single top quark is ≈ 3.7, a decrease
of more than a factor of two relative to charm.
Since the distributions are shown on a logarithmic scale, shadowing appears to be
a rather small effect over most of phase space. It is most prominent in the rapidity
distributions and are otherwise is only distinguishable for charm production at low pTand low invariant mass. Shadowing is largest at forward rapidities where low momentum
fractions in the nucleus are reached.
The total cross sections for direct QQ photoproduction are given in Table 11♯. The
EKS98 shadowing parametrization has a 10 − 20% effect on the total cc cross section.
The effect is smallest for O+O collisions, due to the small A, even though the energy
is higher and the effective x values probed are smaller. The stronger shadowing of the
FGS parametrization gives a 23 − 46% reduction of the cc cross sections. Both the x
♯ A typo in the direct cross section code caused the cross sections in Refs. [141, 177] to be somewhat
overestimated. The results given here are correct.
100
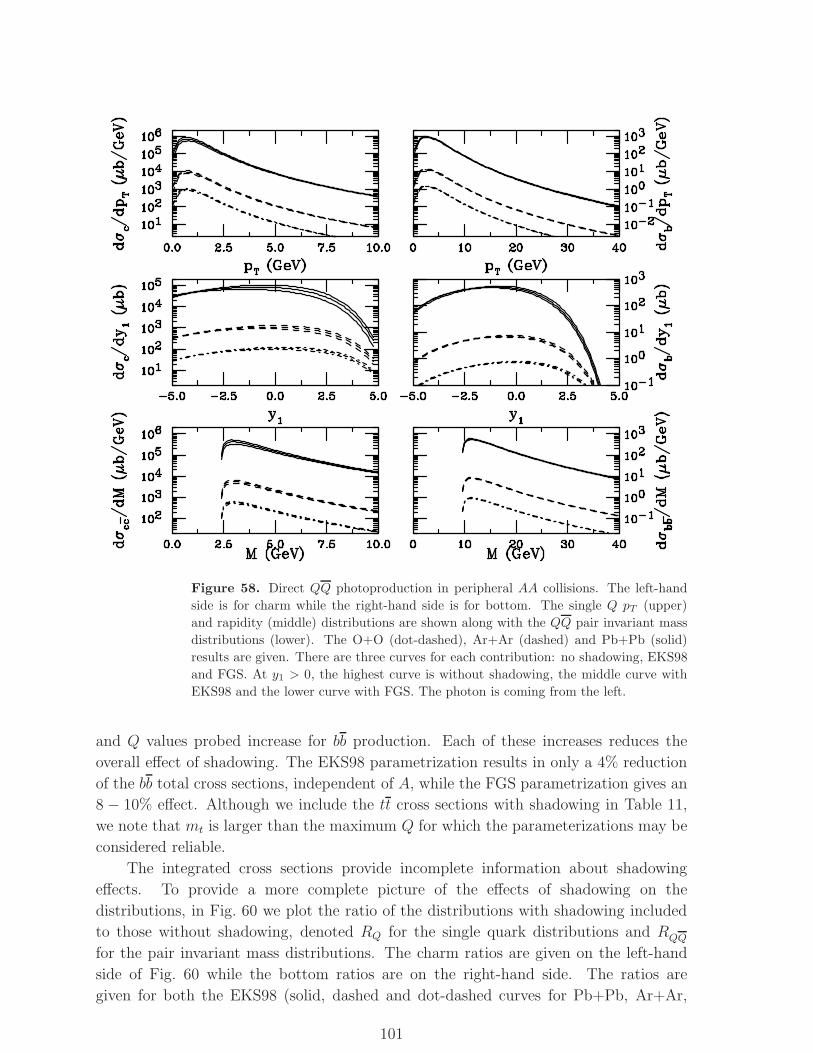
Figure 58. Direct QQ photoproduction in peripheral AA collisions. The left-hand
side is for charm while the right-hand side is for bottom. The single Q pT (upper)
and rapidity (middle) distributions are shown along with the QQ pair invariant mass
distributions (lower). The O+O (dot-dashed), Ar+Ar (dashed) and Pb+Pb (solid)
results are given. There are three curves for each contribution: no shadowing, EKS98
and FGS. At y1 > 0, the highest curve is without shadowing, the middle curve with
EKS98 and the lower curve with FGS. The photon is coming from the left.
and Q values probed increase for bb production. Each of these increases reduces the
overall effect of shadowing. The EKS98 parametrization results in only a 4% reduction
of the bb total cross sections, independent of A, while the FGS parametrization gives an
8 − 10% effect. Although we include the tt cross sections with shadowing in Table 11,
we note that mt is larger than the maximum Q for which the parameterizations may be
considered reliable.
The integrated cross sections provide incomplete information about shadowing
effects. To provide a more complete picture of the effects of shadowing on the
distributions, in Fig. 60 we plot the ratio of the distributions with shadowing included
to those without shadowing, denoted RQ for the single quark distributions and RQQ
for the pair invariant mass distributions. The charm ratios are given on the left-hand
side of Fig. 60 while the bottom ratios are on the right-hand side. The ratios are
given for both the EKS98 (solid, dashed and dot-dashed curves for Pb+Pb, Ar+Ar,
101
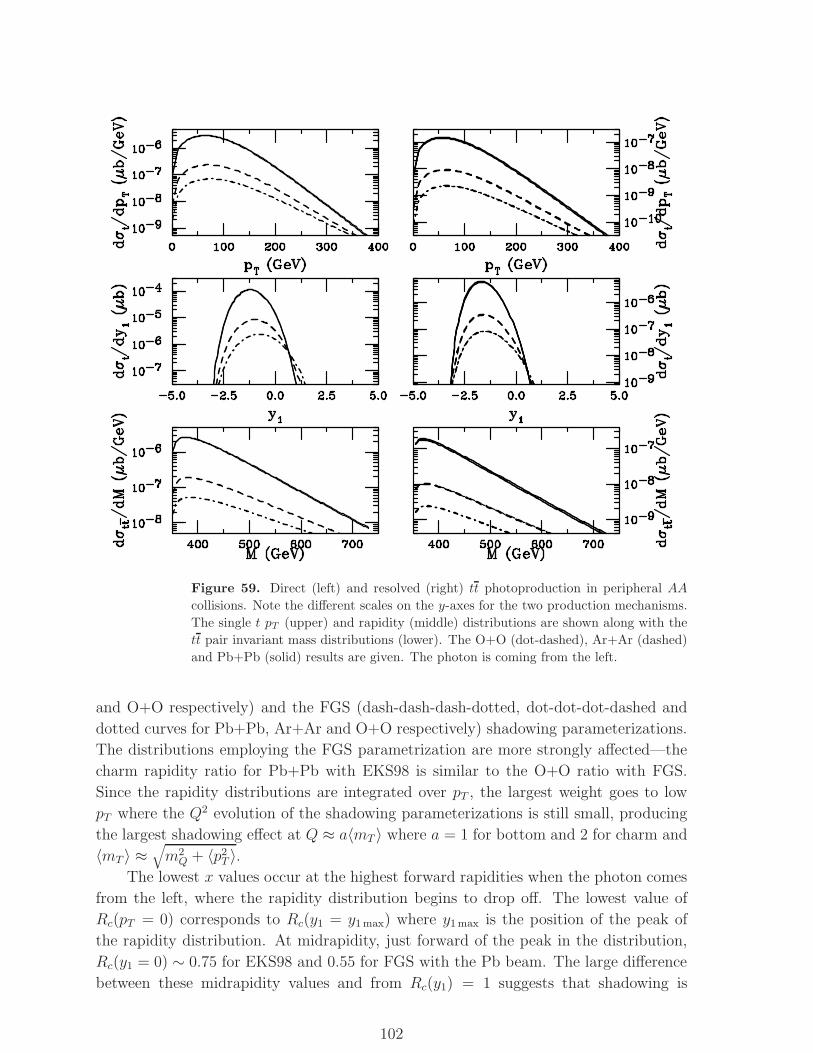
Figure 59. Direct (left) and resolved (right) tt photoproduction in peripheral AA
collisions. Note the different scales on the y-axes for the two production mechanisms.
The single t pT (upper) and rapidity (middle) distributions are shown along with the
tt pair invariant mass distributions (lower). The O+O (dot-dashed), Ar+Ar (dashed)
and Pb+Pb (solid) results are given. The photon is coming from the left.
and O+O respectively) and the FGS (dash-dash-dash-dotted, dot-dot-dot-dashed and
dotted curves for Pb+Pb, Ar+Ar and O+O respectively) shadowing parameterizations.
The distributions employing the FGS parametrization are more strongly affected—the
charm rapidity ratio for Pb+Pb with EKS98 is similar to the O+O ratio with FGS.
Since the rapidity distributions are integrated over pT , the largest weight goes to low
pT where the Q2 evolution of the shadowing parameterizations is still small, producing
the largest shadowing effect at Q ≈ a〈mT 〉 where a = 1 for bottom and 2 for charm and
〈mT 〉 ≈√m2Q + 〈p2
T 〉.The lowest x values occur at the highest forward rapidities when the photon comes
from the left, where the rapidity distribution begins to drop off. The lowest value of
Rc(pT = 0) corresponds to Rc(y1 = y1max) where y1max is the position of the peak of
the rapidity distribution. At midrapidity, just forward of the peak in the distribution,
Rc(y1 = 0) ∼ 0.75 for EKS98 and 0.55 for FGS with the Pb beam. The large difference
between these midrapidity values and from Rc(y1) = 1 suggests that shadowing is
102
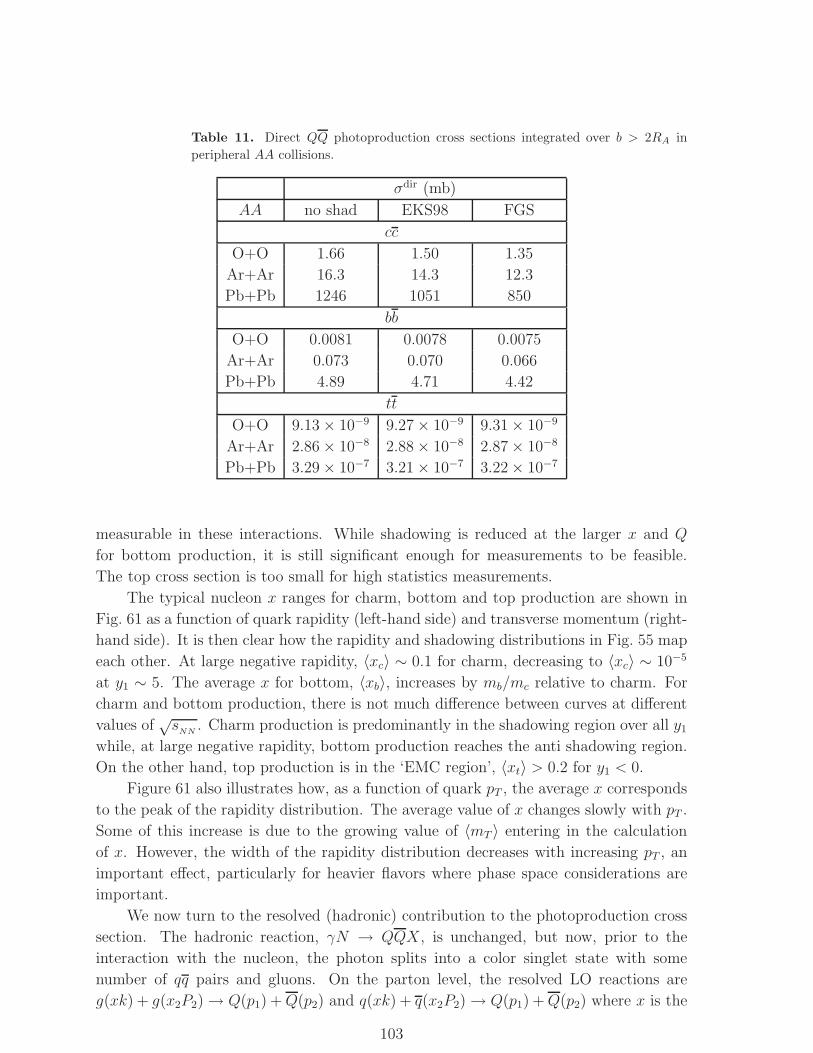
Table 11. Direct QQ photoproduction cross sections integrated over b > 2RA in
peripheral AA collisions.
σdir (mb)
AA no shad EKS98 FGS
cc
O+O 1.66 1.50 1.35
Ar+Ar 16.3 14.3 12.3
Pb+Pb 1246 1051 850
bb
O+O 0.0081 0.0078 0.0075
Ar+Ar 0.073 0.070 0.066
Pb+Pb 4.89 4.71 4.42
tt
O+O 9.13 × 10⁻⁹ 9.27 × 10⁻⁹ 9.31 × 10⁻⁹
Ar+Ar 2.86 × 10⁻⁸ 2.88 × 10⁻⁸ 2.87 × 10⁻⁸
Pb+Pb 3.29 × 10⁻⁷ 3.21 × 10⁻⁷ 3.22 × 10⁻⁷
measurable in these interactions. While shadowing is reduced at the larger x and Q
for bottom production, it is still significant enough for measurements to be feasible.
The top cross section is too small for high statistics measurements.
The typical nucleon x ranges for charm, bottom and top production are shown in
Fig. 61 as a function of quark rapidity (left-hand side) and transverse momentum (right-
hand side). It is then clear how the rapidity and shadowing distributions in Fig. 55 map
each other. At large negative rapidity, 〈xc〉 ∼ 0.1 for charm, decreasing to 〈xc〉 ∼ 10−5
at y1 ∼ 5. The average x for bottom, 〈xb〉, increases by mb/mc relative to charm. For
charm and bottom production, there is not much difference between curves at different
values of√s
NN. Charm production is predominantly in the shadowing region over all y1
while, at large negative rapidity, bottom production reaches the anti shadowing region.
On the other hand, top production is in the ‘EMC region’, 〈xt〉 > 0.2 for y1 < 0.
Figure 61 also illustrates how, as a function of quark pT , the average x corresponds
to the peak of the rapidity distribution. The average value of x changes slowly with pT .
Some of this increase is due to the growing value of 〈mT 〉 entering in the calculation
of x. However, the width of the rapidity distribution decreases with increasing pT , an
important effect, particularly for heavier flavors where phase space considerations are
important.
We now turn to the resolved (hadronic) contribution to the photoproduction cross
section. The hadronic reaction, γN → QQX, is unchanged, but now, prior to the
interaction with the nucleon, the photon splits into a color singlet state with some
number of qq pairs and gluons. On the parton level, the resolved LO reactions are
g(xk) + g(x2P2) → Q(p1) +Q(p2) and q(xk) + q(x2P2) → Q(p1) +Q(p2) where x is the
103
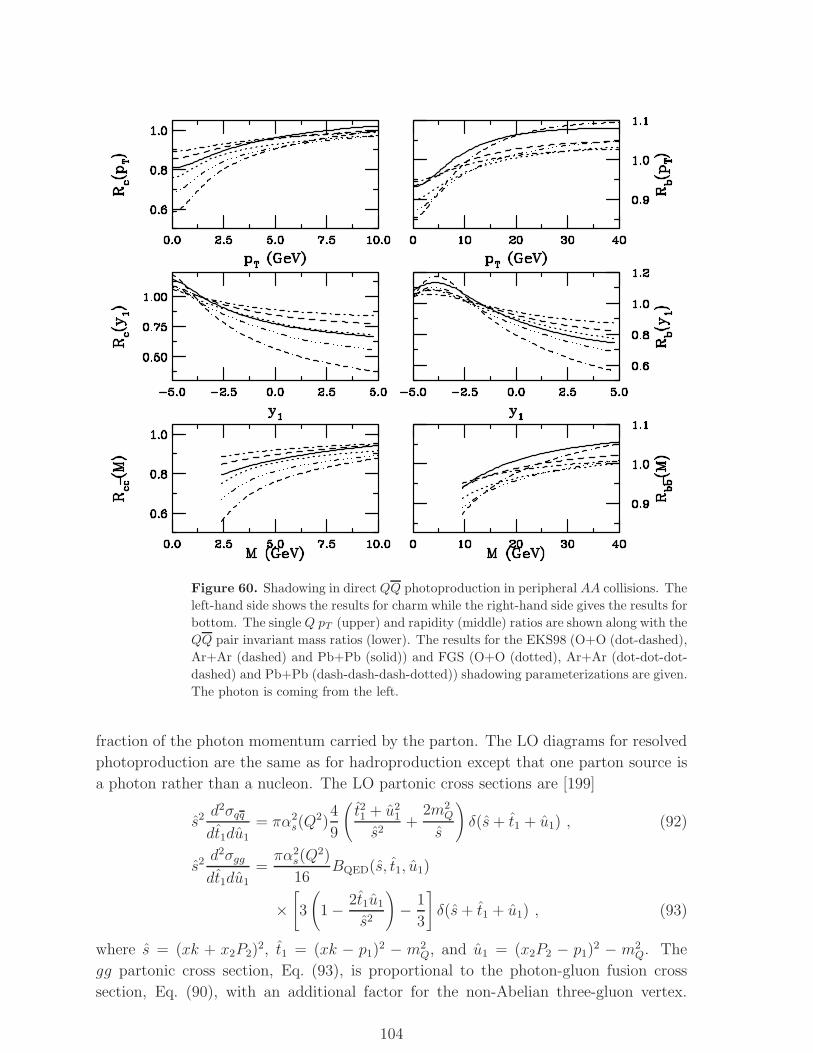
Figure 60. Shadowing in direct QQ photoproduction in peripheral AA collisions. The
left-hand side shows the results for charm while the right-hand side gives the results for
bottom. The single Q pT (upper) and rapidity (middle) ratios are shown along with the
QQ pair invariant mass ratios (lower). The results for the EKS98 (O+O (dot-dashed),
Ar+Ar (dashed) and Pb+Pb (solid)) and FGS (O+O (dotted), Ar+Ar (dot-dot-dot-
dashed) and Pb+Pb (dash-dash-dash-dotted)) shadowing parameterizations are given.
The photon is coming from the left.
fraction of the photon momentum carried by the parton. The LO diagrams for resolved
photoproduction are the same as for hadroproduction except that one parton source is
a photon rather than a nucleon. The LO partonic cross sections are [199]
s2 d2σqq
dt1du1
= πα2s(Q
2)4
9
(t21 + u2
1
s2+
2m2Q
s
)δ(s+ t1 + u1) , (92)
s2 d2σgg
dt1du1
=πα2
s(Q2)
16BQED(s, t1, u1)
×[3
(1 − 2t1u1
s2
)− 1
3
]δ(s+ t1 + u1) , (93)
where s = (xk + x2P2)2, t1 = (xk − p1)
2 − m2Q, and u1 = (x2P2 − p1)
2 − m2Q. The
gg partonic cross section, Eq. (93), is proportional to the photon-gluon fusion cross
section, Eq. (90), with an additional factor for the non-Abelian three-gluon vertex.
104
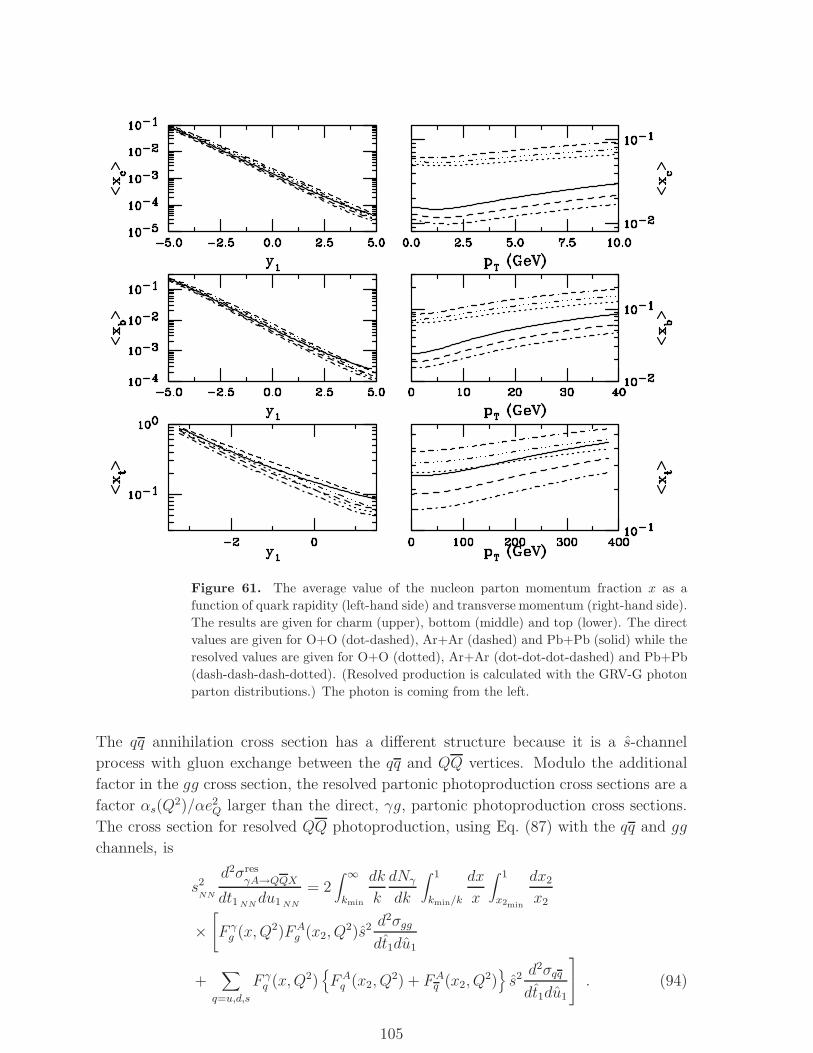
Figure 61. The average value of the nucleon parton momentum fraction x as a
function of quark rapidity (left-hand side) and transverse momentum (right-hand side).
The results are given for charm (upper), bottom (middle) and top (lower). The direct
values are given for O+O (dot-dashed), Ar+Ar (dashed) and Pb+Pb (solid) while the
resolved values are given for O+O (dotted), Ar+Ar (dot-dot-dot-dashed) and Pb+Pb
(dash-dash-dash-dotted). (Resolved production is calculated with the GRV-G photon
parton distributions.) The photon is coming from the left.
The qq annihilation cross section has a different structure because it is a s-channel
process with gluon exchange between the qq and QQ vertices. Modulo the additional
factor in the gg cross section, the resolved partonic photoproduction cross sections are a
factor αs(Q2)/αe2Q larger than the direct, γg, partonic photoproduction cross sections.
The cross section for resolved QQ photoproduction, using Eq. (87) with the qq and gg
channels, is
s2NN
d2σresγA→QQX
dt1 NNdu1 NN
= 2∫ ∞
kmin
dk
k
dNγ
dk
∫ 1
kmin/k
dx
x
∫ 1
x2min
dx2
x2
×[F γg (x,Q2)FA
g (x2, Q2)s2 d
2σgg
dt1du1
+∑
q=u,d,s
F γq (x,Q2)
{FAq (x2, Q
2) + FAq (x2, Q
2)}s2 d
2σqq
dt1du1
. (94)
105
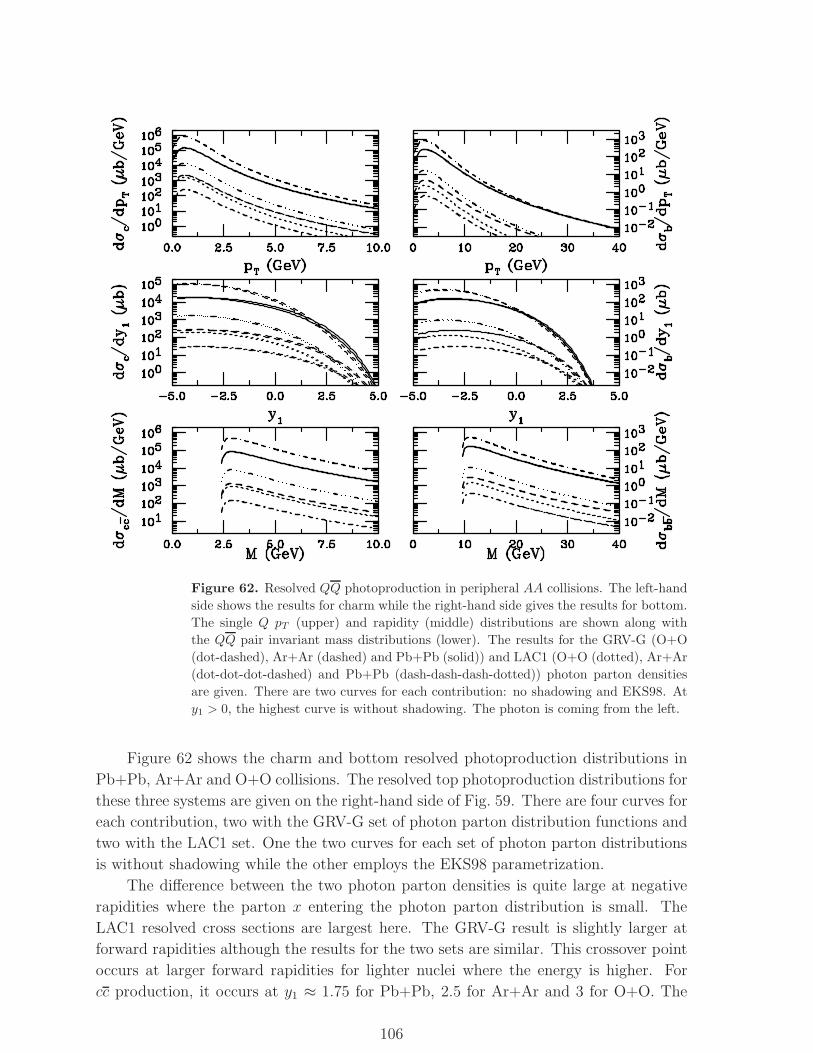
Figure 62. Resolved QQ photoproduction in peripheral AA collisions. The left-hand
side shows the results for charm while the right-hand side gives the results for bottom.
The single Q pT (upper) and rapidity (middle) distributions are shown along with
the QQ pair invariant mass distributions (lower). The results for the GRV-G (O+O
(dot-dashed), Ar+Ar (dashed) and Pb+Pb (solid)) and LAC1 (O+O (dotted), Ar+Ar
(dot-dot-dot-dashed) and Pb+Pb (dash-dash-dash-dotted)) photon parton densities
are given. There are two curves for each contribution: no shadowing and EKS98. At
y1 > 0, the highest curve is without shadowing. The photon is coming from the left.
Figure 62 shows the charm and bottom resolved photoproduction distributions in
Pb+Pb, Ar+Ar and O+O collisions. The resolved top photoproduction distributions for
these three systems are given on the right-hand side of Fig. 59. There are four curves for
each contribution, two with the GRV-G set of photon parton distribution functions and
two with the LAC1 set. One the two curves for each set of photon parton distributions
is without shadowing while the other employs the EKS98 parametrization.
The difference between the two photon parton densities is quite large at negative
rapidities where the parton x entering the photon parton distribution is small. The
LAC1 resolved cross sections are largest here. The GRV-G result is slightly larger at
forward rapidities although the results for the two sets are similar. This crossover point
occurs at larger forward rapidities for lighter nuclei where the energy is higher. For
cc production, it occurs at y1 ≈ 1.75 for Pb+Pb, 2.5 for Ar+Ar and 3 for O+O. The
106
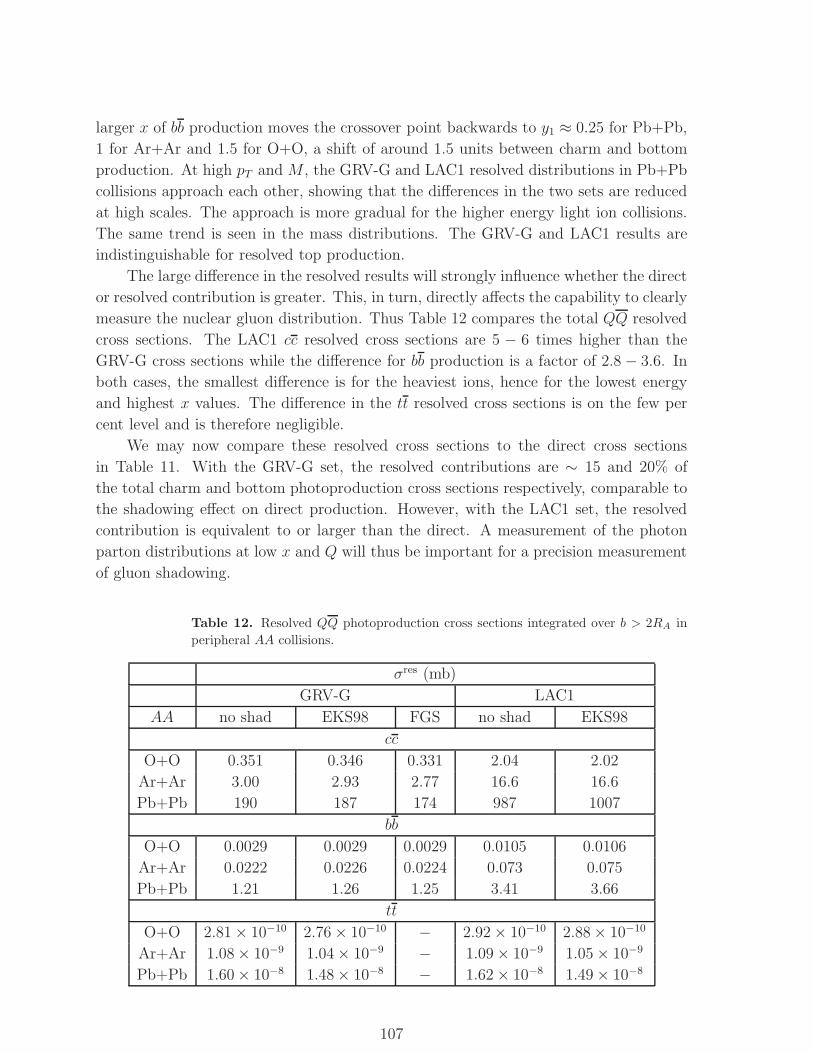
larger x of bb production moves the crossover point backwards to y1 ≈ 0.25 for Pb+Pb,
1 for Ar+Ar and 1.5 for O+O, a shift of around 1.5 units between charm and bottom
production. At high pT and M , the GRV-G and LAC1 resolved distributions in Pb+Pb
collisions approach each other, showing that the differences in the two sets are reduced
at high scales. The approach is more gradual for the higher energy light ion collisions.
The same trend is seen in the mass distributions. The GRV-G and LAC1 results are
indistinguishable for resolved top production.
The large difference in the resolved results will strongly influence whether the direct
or resolved contribution is greater. This, in turn, directly affects the capability to clearly
measure the nuclear gluon distribution. Thus Table 12 compares the total QQ resolved
cross sections. The LAC1 cc resolved cross sections are 5 − 6 times higher than the
GRV-G cross sections while the difference for bb production is a factor of 2.8 − 3.6. In
both cases, the smallest difference is for the heaviest ions, hence for the lowest energy
and highest x values. The difference in the tt resolved cross sections is on the few per
cent level and is therefore negligible.
We may now compare these resolved cross sections to the direct cross sections
in Table 11. With the GRV-G set, the resolved contributions are ∼ 15 and 20% of
the total charm and bottom photoproduction cross sections respectively, comparable to
the shadowing effect on direct production. However, with the LAC1 set, the resolved
contribution is equivalent to or larger than the direct. A measurement of the photon
parton distributions at low x and Q will thus be important for a precision measurement
of gluon shadowing.
Table 12. Resolved QQ photoproduction cross sections integrated over b > 2RA in
peripheral AA collisions.
σres (mb)
GRV-G LAC1
AA no shad EKS98 FGS no shad EKS98
cc
O+O 0.351 0.346 0.331 2.04 2.02
Ar+Ar 3.00 2.93 2.77 16.6 16.6
Pb+Pb 190 187 174 987 1007
bb
O+O 0.0029 0.0029 0.0029 0.0105 0.0106
Ar+Ar 0.0222 0.0226 0.0224 0.073 0.075
Pb+Pb 1.21 1.26 1.25 3.41 3.66
tt
O+O 2.81 × 10⁻¹⁰ 2.76 × 10⁻¹⁰ − 2.92 × 10⁻¹⁰ 2.88 × 10⁻¹⁰
Ar+Ar 1.08 × 10⁻⁹ 1.04 × 10⁻⁹ − 1.09 × 10⁻⁹ 1.05 × 10⁻⁹
Pb+Pb 1.60 × 10⁻⁸ 1.48 × 10⁻⁸ − 1.62 × 10⁻⁸ 1.49 × 10⁻⁸
107
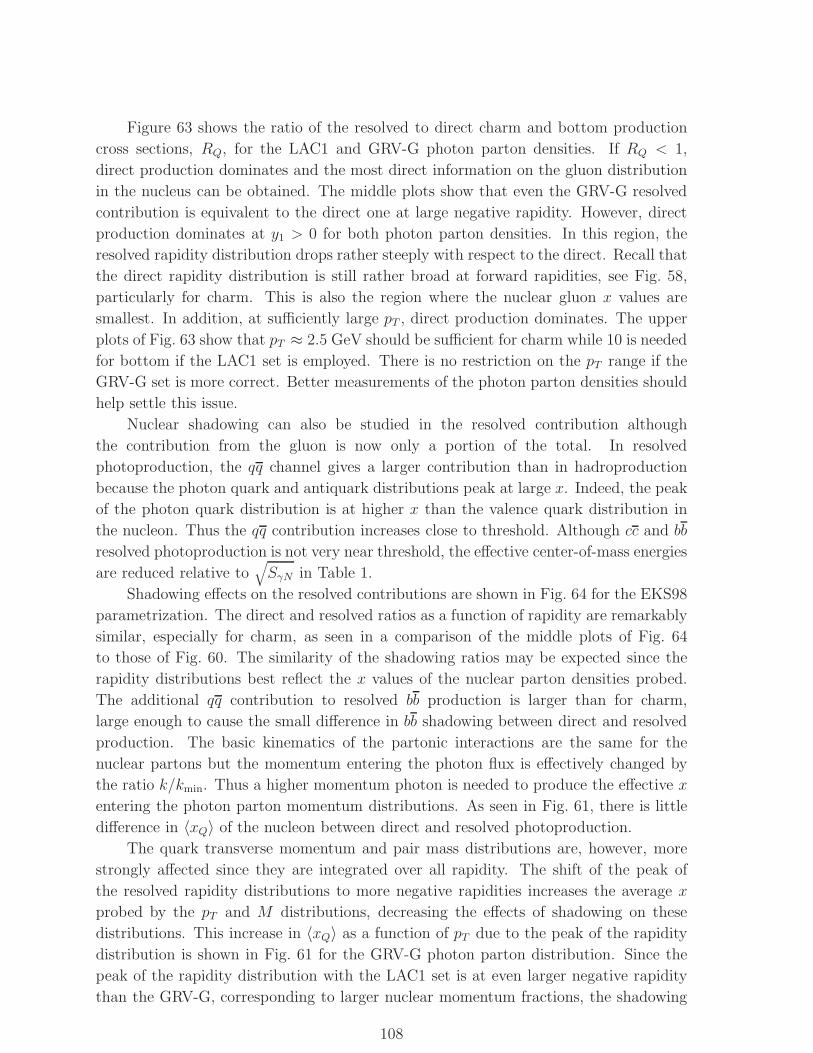
Figure 63 shows the ratio of the resolved to direct charm and bottom production
cross sections, RQ, for the LAC1 and GRV-G photon parton densities. If RQ < 1,
direct production dominates and the most direct information on the gluon distribution
in the nucleus can be obtained. The middle plots show that even the GRV-G resolved
contribution is equivalent to the direct one at large negative rapidity. However, direct
production dominates at y1 > 0 for both photon parton densities. In this region, the
resolved rapidity distribution drops rather steeply with respect to the direct. Recall that
the direct rapidity distribution is still rather broad at forward rapidities, see Fig. 58,
particularly for charm. This is also the region where the nuclear gluon x values are
smallest. In addition, at sufficiently large pT , direct production dominates. The upper
plots of Fig. 63 show that pT ≈ 2.5 GeV should be sufficient for charm while 10 is needed
for bottom if the LAC1 set is employed. There is no restriction on the pT range if the
GRV-G set is more correct. Better measurements of the photon parton densities should
help settle this issue.
Nuclear shadowing can also be studied in the resolved contribution although
the contribution from the gluon is now only a portion of the total. In resolved
photoproduction, the qq channel gives a larger contribution than in hadroproduction
because the photon quark and antiquark distributions peak at large x. Indeed, the peak
of the photon quark distribution is at higher x than the valence quark distribution in
the nucleon. Thus the qq contribution increases close to threshold. Although cc and bb
resolved photoproduction is not very near threshold, the effective center-of-mass energies
are reduced relative to√SγN in Table 1.
Shadowing effects on the resolved contributions are shown in Fig. 64 for the EKS98
parametrization. The direct and resolved ratios as a function of rapidity are remarkably
similar, especially for charm, as seen in a comparison of the middle plots of Fig. 64
to those of Fig. 60. The similarity of the shadowing ratios may be expected since the
rapidity distributions best reflect the x values of the nuclear parton densities probed.
The additional qq contribution to resolved bb production is larger than for charm,
large enough to cause the small difference in bb shadowing between direct and resolved
production. The basic kinematics of the partonic interactions are the same for the
nuclear partons but the momentum entering the photon flux is effectively changed by
the ratio k/kmin. Thus a higher momentum photon is needed to produce the effective x
entering the photon parton momentum distributions. As seen in Fig. 61, there is little
difference in 〈xQ〉 of the nucleon between direct and resolved photoproduction.
The quark transverse momentum and pair mass distributions are, however, more
strongly affected since they are integrated over all rapidity. The shift of the peak of
the resolved rapidity distributions to more negative rapidities increases the average x
probed by the pT and M distributions, decreasing the effects of shadowing on these
distributions. This increase in 〈xQ〉 as a function of pT due to the peak of the rapidity
distribution is shown in Fig. 61 for the GRV-G photon parton distribution. Since the
peak of the rapidity distribution with the LAC1 set is at even larger negative rapidity
than the GRV-G, corresponding to larger nuclear momentum fractions, the shadowing
108
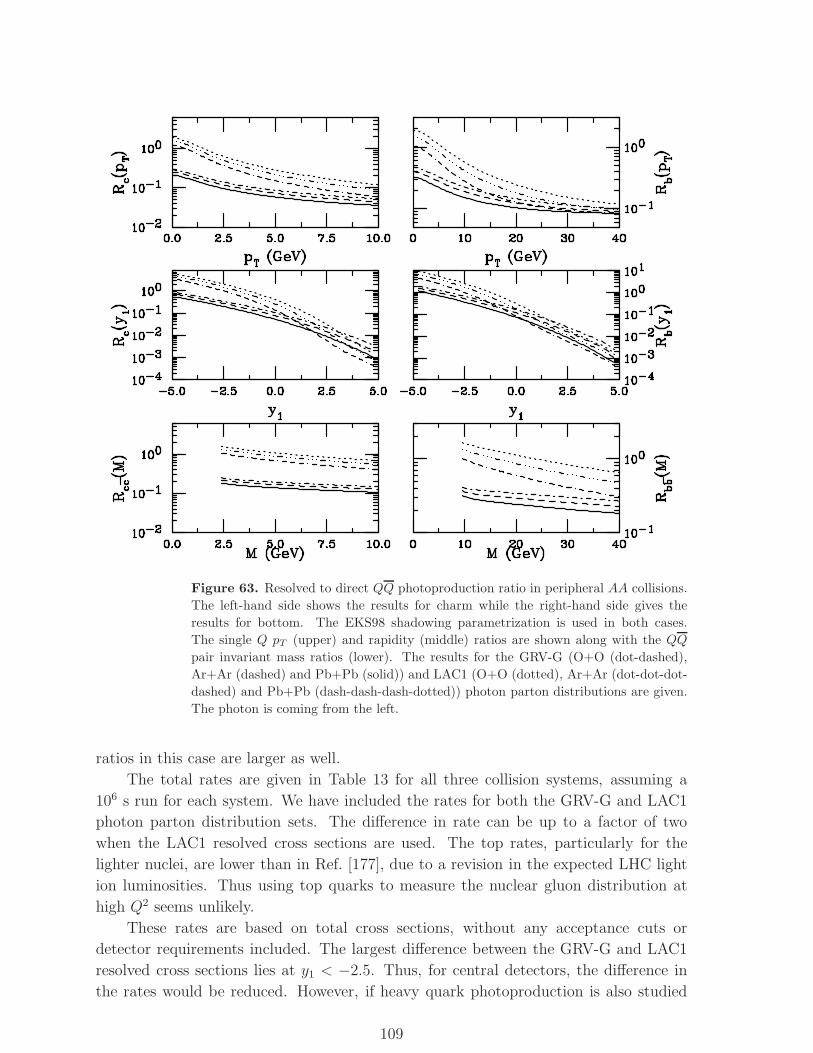
Figure 63. Resolved to direct QQ photoproduction ratio in peripheral AA collisions.
The left-hand side shows the results for charm while the right-hand side gives the
results for bottom. The EKS98 shadowing parametrization is used in both cases.
The single Q pT (upper) and rapidity (middle) ratios are shown along with the QQ
pair invariant mass ratios (lower). The results for the GRV-G (O+O (dot-dashed),
Ar+Ar (dashed) and Pb+Pb (solid)) and LAC1 (O+O (dotted), Ar+Ar (dot-dot-dot-
dashed) and Pb+Pb (dash-dash-dash-dotted)) photon parton distributions are given.
The photon is coming from the left.
ratios in this case are larger as well.
The total rates are given in Table 13 for all three collision systems, assuming a
106 s run for each system. We have included the rates for both the GRV-G and LAC1
photon parton distribution sets. The difference in rate can be up to a factor of two
when the LAC1 resolved cross sections are used. The top rates, particularly for the
lighter nuclei, are lower than in Ref. [177], due to a revision in the expected LHC light
ion luminosities. Thus using top quarks to measure the nuclear gluon distribution at
high Q2 seems unlikely.
These rates are based on total cross sections, without any acceptance cuts or
detector requirements included. The largest difference between the GRV-G and LAC1
resolved cross sections lies at y1 < −2.5. Thus, for central detectors, the difference in
the rates would be reduced. However, if heavy quark photoproduction is also studied
109

Figure 64. Shadowing in resolved QQ photoproduction in peripheral AA collisions.
The left-hand side shows the results for charm while the right-hand side gives the
results for bottom. The EKS98 shadowing parametrization is used in both cases.
The single Q pT (upper) and rapidity (middle) ratios are shown along with the QQ
pair invariant mass ratios (lower). The results for the GRV-G (O+O (dot-dashed),
Ar+Ar (dashed) and Pb+Pb (solid)) and LAC1 (O+O (dotted), Ar+Ar (dot-dot-dot-
dashed) and Pb+Pb (dash-dash-dash-dotted)) photon parton distributions are given.
The photon is coming from the left.
through its leptonic decays, the forward muon arm of ALICE, 2.4 < y < 4, would be
sensitive to the photon parton densities when the photon comes from the right-hand
side, the mirror image of the plots.
The high cc and bb rates provide sufficient statistics to distinguish between
shadowing parameterizations and perhaps the photon parton distributions as well, even
with finite acceptance. The rates for the different systems are all of the same order of
magnitude. The lower photon flux for light, smaller Z ions is compensated by their
higher luminosities. Unfortunately however, the top rates are discouragingly low, even
for light ions.
There are a number of theoretical uncertainties in the calculations shown here
aside from the obvious ones in the nuclear and photon parton densities and the photon
flux. First, the calculation is to leading order only. Higher order corrections can be
110
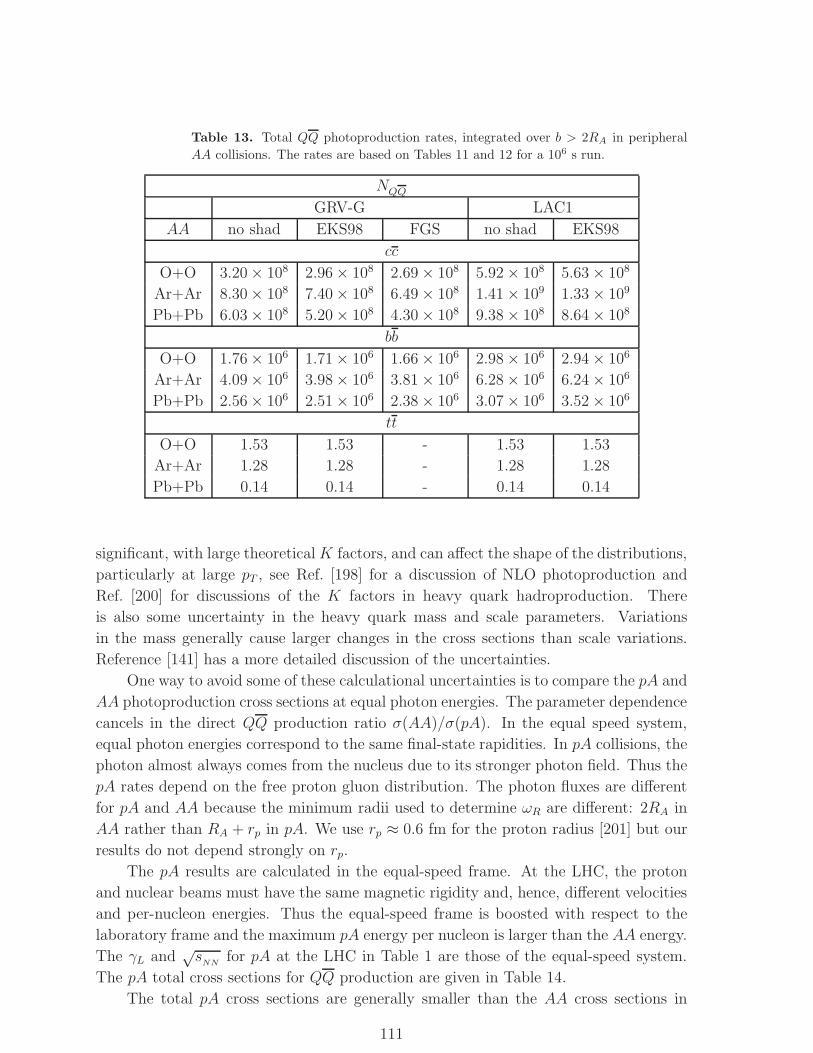
Table 13. Total QQ photoproduction rates, integrated over b > 2RA in peripheral
AA collisions. The rates are based on Tables 11 and 12 for a 106 s run.
NQQ
GRV-G LAC1
AA no shad EKS98 FGS no shad EKS98
cc
O+O 3.20 × 10⁸ 2.96 × 10⁸ 2.69 × 10⁸ 5.92 × 10⁸ 5.63 × 10⁸
Ar+Ar 8.30 × 10⁸ 7.40 × 10⁸ 6.49 × 10⁸ 1.41 × 10⁹ 1.33 × 10⁹
Pb+Pb 6.03 × 10⁸ 5.20 × 10⁸ 4.30 × 10⁸ 9.38 × 10⁸ 8.64 × 10⁸
bb
O+O 1.76 × 10⁶ 1.71 × 10⁶ 1.66 × 10⁶ 2.98 × 10⁶ 2.94 × 10⁶
Ar+Ar 4.09 × 10⁶ 3.98 × 10⁶ 3.81 × 10⁶ 6.28 × 10⁶ 6.24 × 10⁶
Pb+Pb 2.56 × 10⁶ 2.51 × 10⁶ 2.38 × 10⁶ 3.07 × 10⁶ 3.52 × 10⁶
tt
O+O 1.53 1.53 - 1.53 1.53
Ar+Ar 1.28 1.28 - 1.28 1.28
Pb+Pb 0.14 0.14 - 0.14 0.14
significant, with large theoreticalK factors, and can affect the shape of the distributions,
particularly at large pT , see Ref. [198] for a discussion of NLO photoproduction and
Ref. [200] for discussions of the K factors in heavy quark hadroproduction. There
is also some uncertainty in the heavy quark mass and scale parameters. Variations
in the mass generally cause larger changes in the cross sections than scale variations.
Reference [141] has a more detailed discussion of the uncertainties.
One way to avoid some of these calculational uncertainties is to compare the pA and
AA photoproduction cross sections at equal photon energies. The parameter dependence
cancels in the direct QQ production ratio σ(AA)/σ(pA). In the equal speed system,
equal photon energies correspond to the same final-state rapidities. In pA collisions, the
photon almost always comes from the nucleus due to its stronger photon field. Thus the
pA rates depend on the free proton gluon distribution. The photon fluxes are different
for pA and AA because the minimum radii used to determine ωR are different: 2RA in
AA rather than RA + rp in pA. We use rp ≈ 0.6 fm for the proton radius [201] but our
results do not depend strongly on rp.
The pA results are calculated in the equal-speed frame. At the LHC, the proton
and nuclear beams must have the same magnetic rigidity and, hence, different velocities
and per-nucleon energies. Thus the equal-speed frame is boosted with respect to the
laboratory frame and the maximum pA energy per nucleon is larger than the AA energy.
The γL and√s
NNfor pA at the LHC in Table 1 are those of the equal-speed system.
The pA total cross sections for QQ production are given in Table 14.
The total pA cross sections are generally smaller than the AA cross sections in
111
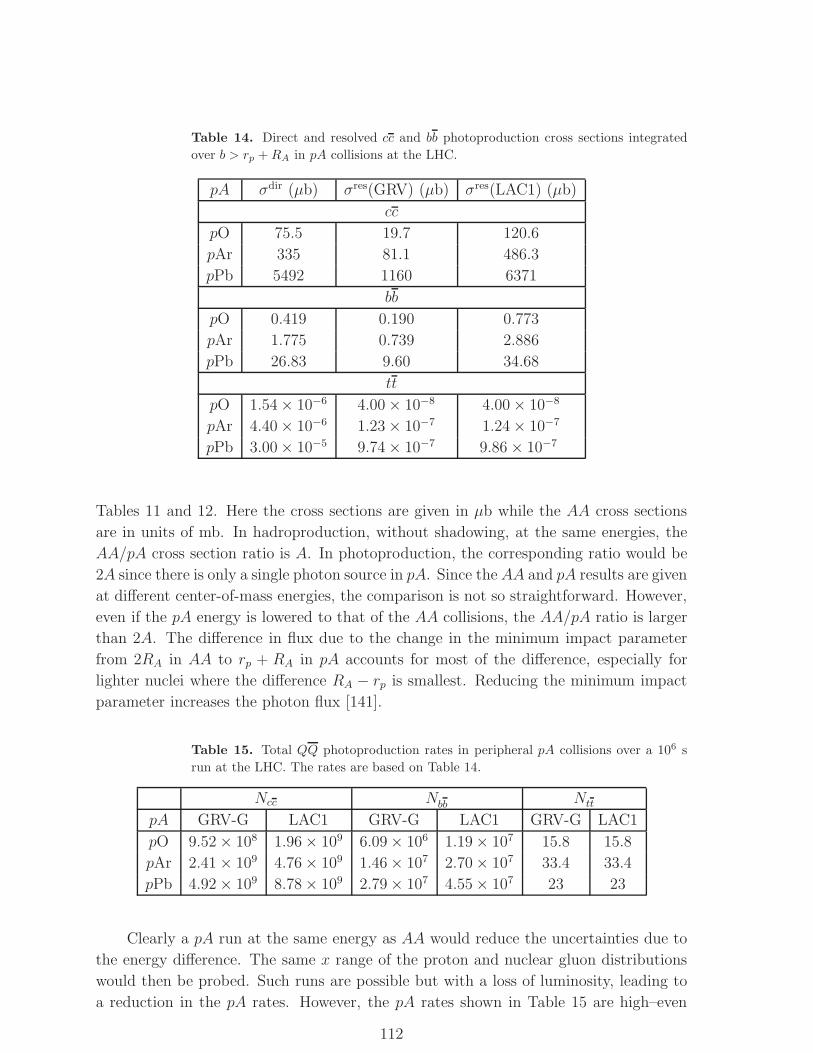
Table 14. Direct and resolved cc and bb photoproduction cross sections integrated
over b > rp +RA in pA collisions at the LHC.
pA σdir (µb) σres(GRV) (µb) σres(LAC1) (µb)
cc
pO 75.5 19.7 120.6
pAr 335 81.1 486.3
pPb 5492 1160 6371
bb
pO 0.419 0.190 0.773
pAr 1.775 0.739 2.886
pPb 26.83 9.60 34.68
tt
pO 1.54 × 10⁻⁶ 4.00 × 10⁻⁸ 4.00 × 10⁻⁸
pAr 4.40 × 10⁻⁶ 1.23 × 10⁻⁷ 1.24 × 10⁻⁷
pPb 3.00 × 10⁻⁵ 9.74 × 10⁻⁷ 9.86 × 10⁻⁷
Tables 11 and 12. Here the cross sections are given in µb while the AA cross sections
are in units of mb. In hadroproduction, without shadowing, at the same energies, the
AA/pA cross section ratio is A. In photoproduction, the corresponding ratio would be
2A since there is only a single photon source in pA. Since the AA and pA results are given
at different center-of-mass energies, the comparison is not so straightforward. However,
even if the pA energy is lowered to that of the AA collisions, the AA/pA ratio is larger
than 2A. The difference in flux due to the change in the minimum impact parameter
from 2RA in AA to rp + RA in pA accounts for most of the difference, especially for
lighter nuclei where the difference RA − rp is smallest. Reducing the minimum impact
parameter increases the photon flux [141].
Table 15. Total QQ photoproduction rates in peripheral pA collisions over a 106 s
run at the LHC. The rates are based on Table 14.
Ncc Nbb Ntt
pA GRV-G LAC1 GRV-G LAC1 GRV-G LAC1
pO 9.52 × 10⁸ 1.96 × 10⁹ 6.09 × 10⁶ 1.19 × 10⁷ 15.8 15.8
pAr 2.41 × 10⁹ 4.76 × 10⁹ 1.46 × 10⁷ 2.70 × 10⁷ 33.4 33.4
pPb 4.92 × 10⁹ 8.78 × 10⁹ 2.79 × 10⁷ 4.55 × 10⁷ 23 23
Clearly a pA run at the same energy as AA would reduce the uncertainties due to
the energy difference. The same x range of the proton and nuclear gluon distributions
would then be probed. Such runs are possible but with a loss of luminosity, leading to
a reduction in the pA rates. However, the pA rates shown in Table 15 are high–even
112
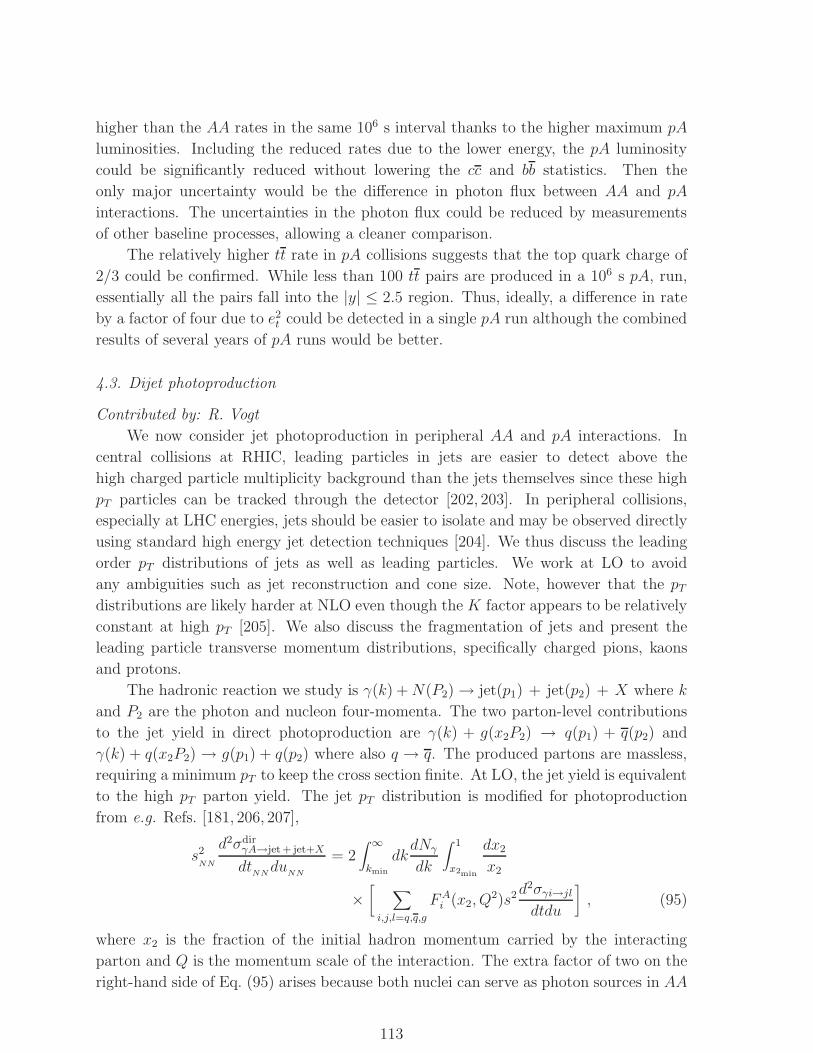
higher than the AA rates in the same 106 s interval thanks to the higher maximum pA
luminosities. Including the reduced rates due to the lower energy, the pA luminosity
could be significantly reduced without lowering the cc and bb statistics. Then the
only major uncertainty would be the difference in photon flux between AA and pA
interactions. The uncertainties in the photon flux could be reduced by measurements
of other baseline processes, allowing a cleaner comparison.
The relatively higher tt rate in pA collisions suggests that the top quark charge of
2/3 could be confirmed. While less than 100 tt pairs are produced in a 106 s pA, run,
essentially all the pairs fall into the |y| ≤ 2.5 region. Thus, ideally, a difference in rate
by a factor of four due to e2t could be detected in a single pA run although the combined
results of several years of pA runs would be better.
4.3. Dijet photoproduction
Contributed by: R. Vogt
We now consider jet photoproduction in peripheral AA and pA interactions. In
central collisions at RHIC, leading particles in jets are easier to detect above the
high charged particle multiplicity background than the jets themselves since these high
pT particles can be tracked through the detector [202, 203]. In peripheral collisions,
especially at LHC energies, jets should be easier to isolate and may be observed directly
using standard high energy jet detection techniques [204]. We thus discuss the leading
order pT distributions of jets as well as leading particles. We work at LO to avoid
any ambiguities such as jet reconstruction and cone size. Note, however that the pTdistributions are likely harder at NLO even though the K factor appears to be relatively
constant at high pT [205]. We also discuss the fragmentation of jets and present the
leading particle transverse momentum distributions, specifically charged pions, kaons
and protons.
The hadronic reaction we study is γ(k) +N(P2) → jet(p1) + jet(p2) + X where k
and P2 are the photon and nucleon four-momenta. The two parton-level contributions
to the jet yield in direct photoproduction are γ(k) + g(x2P2) → q(p1) + q(p2) and
γ(k) + q(x2P2) → g(p1) + q(p2) where also q → q. The produced partons are massless,
requiring a minimum pT to keep the cross section finite. At LO, the jet yield is equivalent
to the high pT parton yield. The jet pT distribution is modified for photoproduction
from e.g. Refs. [181, 206, 207],
s2NN
d2σdirγA→jet+ jet+X
dtNNdu
NN
= 2∫ ∞
kmin
dkdNγ
dk
∫ 1
x2min
dx2
x2
×[ ∑
i,j,l=q,q,g
FAi (x2, Q
2)s2d2σγi→jldtdu
], (95)
where x2 is the fraction of the initial hadron momentum carried by the interacting
parton and Q is the momentum scale of the interaction. The extra factor of two on the
right-hand side of Eq. (95) arises because both nuclei can serve as photon sources in AA
113
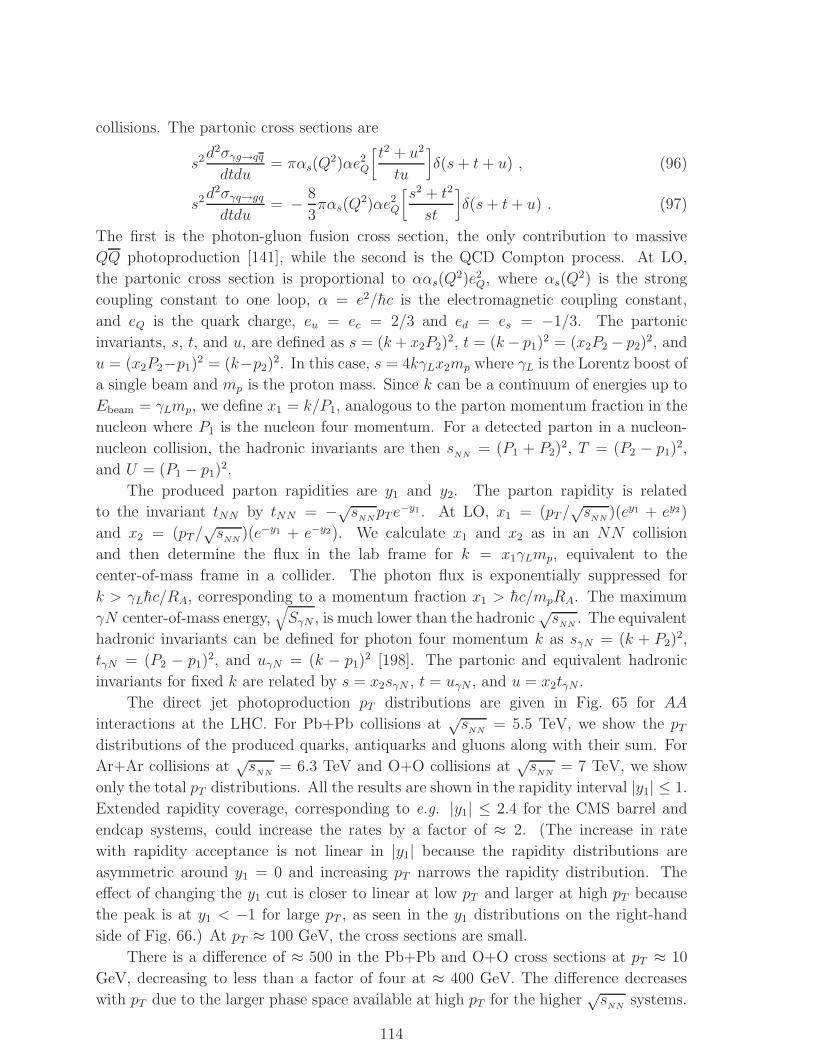
collisions. The partonic cross sections are
s2d2σγg→qqdtdu
= παs(Q2)αe2Q
[t2 + u2
tu
]δ(s+ t+ u) , (96)
s2d2σγq→gqdtdu
= − 8
3παs(Q
2)αe2Q
[s2 + t2
st
]δ(s+ t+ u) . (97)
The first is the photon-gluon fusion cross section, the only contribution to massive
QQ photoproduction [141], while the second is the QCD Compton process. At LO,
the partonic cross section is proportional to ααs(Q2)e2Q, where αs(Q
2) is the strong
coupling constant to one loop, α = e2/hc is the electromagnetic coupling constant,
and eQ is the quark charge, eu = ec = 2/3 and ed = es = −1/3. The partonic
invariants, s, t, and u, are defined as s = (k+ x2P2)2, t = (k− p1)
2 = (x2P2 − p2)2, and
u = (x2P2−p1)2 = (k−p2)
2. In this case, s = 4kγLx2mp where γL is the Lorentz boost of
a single beam and mp is the proton mass. Since k can be a continuum of energies up to
Ebeam = γLmp, we define x1 = k/P1, analogous to the parton momentum fraction in the
nucleon where P1 is the nucleon four momentum. For a detected parton in a nucleon-
nucleon collision, the hadronic invariants are then sNN
= (P1 + P2)2, T = (P2 − p1)
2,
and U = (P1 − p1)2.
The produced parton rapidities are y1 and y2. The parton rapidity is related
to the invariant tNN by tNN = −√s
NNpT e
−y1 . At LO, x1 = (pT/√s
NN)(ey1 + ey2)
and x2 = (pT/√s
NN)(e−y1 + e−y2). We calculate x1 and x2 as in an NN collision
and then determine the flux in the lab frame for k = x1γLmp, equivalent to the
center-of-mass frame in a collider. The photon flux is exponentially suppressed for
k > γLhc/RA, corresponding to a momentum fraction x1 > hc/mpRA. The maximum
γN center-of-mass energy,√SγN , is much lower than the hadronic
√s
NN. The equivalent
hadronic invariants can be defined for photon four momentum k as sγN = (k + P2)2,
tγN = (P2 − p1)2, and uγN = (k − p1)
2 [198]. The partonic and equivalent hadronic
invariants for fixed k are related by s = x2sγN , t = uγN , and u = x2tγN .
The direct jet photoproduction pT distributions are given in Fig. 65 for AA
interactions at the LHC. For Pb+Pb collisions at√s
NN= 5.5 TeV, we show the pT
distributions of the produced quarks, antiquarks and gluons along with their sum. For
Ar+Ar collisions at√s
NN= 6.3 TeV and O+O collisions at
√s
NN= 7 TeV, we show
only the total pT distributions. All the results are shown in the rapidity interval |y1| ≤ 1.
Extended rapidity coverage, corresponding to e.g. |y1| ≤ 2.4 for the CMS barrel and
endcap systems, could increase the rates by a factor of ≈ 2. (The increase in rate
with rapidity acceptance is not linear in |y1| because the rapidity distributions are
asymmetric around y1 = 0 and increasing pT narrows the rapidity distribution. The
effect of changing the y1 cut is closer to linear at low pT and larger at high pT because
the peak is at y1 < −1 for large pT , as seen in the y1 distributions on the right-hand
side of Fig. 66.) At pT ≈ 100 GeV, the cross sections are small.
There is a difference of ≈ 500 in the Pb+Pb and O+O cross sections at pT ≈ 10
GeV, decreasing to less than a factor of four at ≈ 400 GeV. The difference decreases
with pT due to the larger phase space available at high pT for the higher√s
NNsystems.
114

The rates are nearly the same for all systems because the higher luminosities and higher√s
NNcompensate for the lower A in lighter systems.
The dijet jet hadroproduction cross sections are much higher because hard processes
increase with the number of binary collisions in AA collisions, a factor of ≈ A2 for the
minimum bias cross section. (The relation is not exact due to shadowing.) Integration
over all impact parameters leads to ≈ A2 scaling while there is only a factor of A in dijet
photoproduction since the photon flux is already integrated over impact parameter for
b > 2RA. This, combined with the lower effective energy and fewer channels considerably
reduces the photoproduction rates relative to hadroproduction.
Quarks and antiquarks are produced in greatest abundance, with only a small
difference at high pT . Photon-gluon fusion alone produces equal numbers of quarks
and antiquarks. The quark excess arises from the QCD Compton diagram which also
produces the small final-state gluon contribution. The γ(q+ q) contribution grows with
pT since the valence quark distributions eventually dominate production, as shown in
Fig. 65(b) where the γg contribution is compared to the total. At low pT , the γg
contribution is ≈ 90% of the total, dropping to 10 − 30% at pT ≈ 400 GeV. At the
large values of x needed for high pT jet production, fuVp > f gp . Thus the QCD Compton
process eventually dominates dijet production, albeit in a region of very low statistics.
The γg contribution is larger for the lighter nuclei since the higher energies reduce the
average x values.
The direct dijet photoproduction cross section is significantly lower than the
hadroproduction cross section. Some of this reduction is due to the different couplings.
The photoproduction rate is reduced by a factor of αe2Q/αs, ≈ 100. There are also fewer
diagrams for jet photoproduction relative to all 2 → 2 scatterings in hadroproduction.
In addition, the gg → gg hadroproduction process, with its high parton luminosity, has
no direct photoproduction equivalent.
Since the typical scales of jet production are large, the effects of shadowing,
reflected in R(pT ) = (dσ[SiA]/dpT )/(dσ[SiA = 1]/dpT ), are rather small, see Fig. 65(c)
and (d), because the average x is high. The differences between the two shadowing
parameterizations are on the few percent level. At low pT , the produced quarks and
antiquarks are mainly from gluons. The produced gluons only come from quarks. The
peak for the produced quarks and antiquarks in R(pT ) between 50 ≤ pT ≤ 100 GeV is
due to gluon anti-shadowing. The total R(pT ) for all produced partons in Pb+Pb
collisions is dominated by the γg contribution. The maximum value of SiA in the
antishadowing region is ≈ 1.07 for EKS98 and ≈ 1.1 for FGS, reflecting the high Q2
behavior of the shadowing parameterizations.
The EKS98 ratios for the produced quarks and antiquarks in Fig. 65(c) follow R(pT )
for the total rather closely over all pT . The quark and antiquark ratios are slightly above
the total at low pT due to the small γq contribution. They continue to follow the total
at high pT since all the EKS98 ratios exhibit similar behavior at large x. The produced
gluon ratio follows the quark ratios for pT > 200 GeV. The large pT contribution arises
from the valence quarks. Some antishadowing is observed at low pT , due to the valence
115
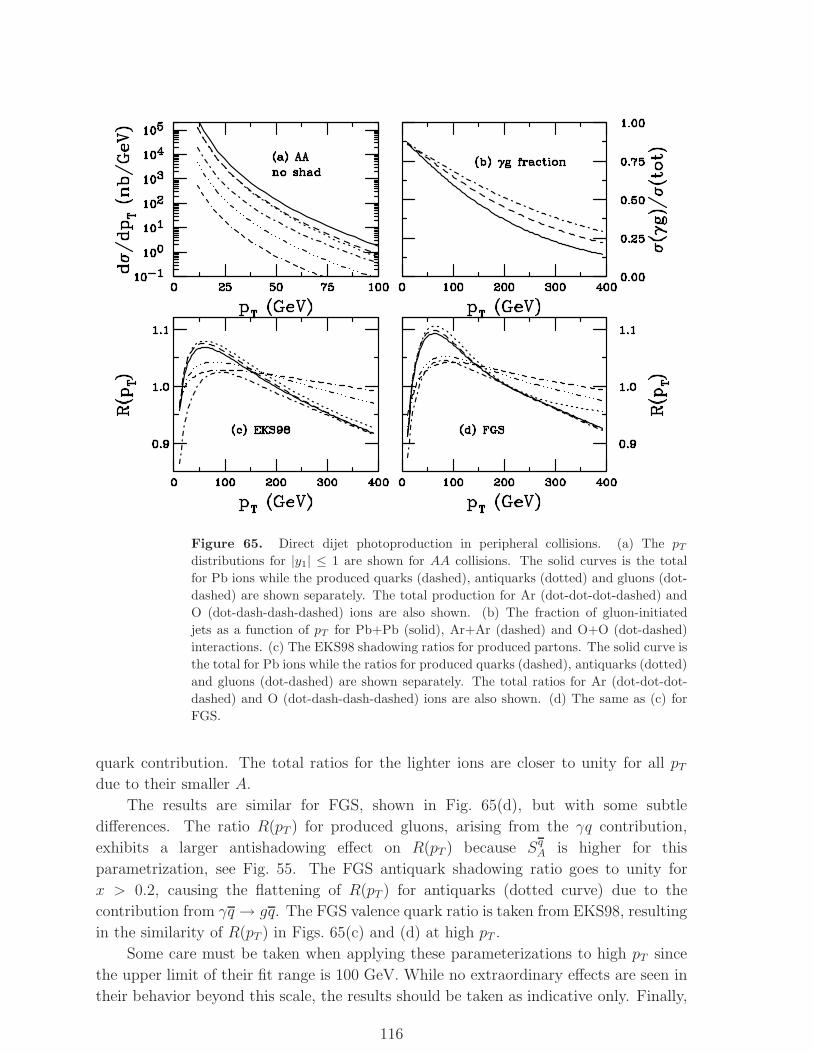
Figure 65. Direct dijet photoproduction in peripheral collisions. (a) The pTdistributions for |y1| ≤ 1 are shown for AA collisions. The solid curves is the total
for Pb ions while the produced quarks (dashed), antiquarks (dotted) and gluons (dot-
dashed) are shown separately. The total production for Ar (dot-dot-dot-dashed) and
O (dot-dash-dash-dashed) ions are also shown. (b) The fraction of gluon-initiated
jets as a function of pT for Pb+Pb (solid), Ar+Ar (dashed) and O+O (dot-dashed)
interactions. (c) The EKS98 shadowing ratios for produced partons. The solid curve is
the total for Pb ions while the ratios for produced quarks (dashed), antiquarks (dotted)
and gluons (dot-dashed) are shown separately. The total ratios for Ar (dot-dot-dot-
dashed) and O (dot-dash-dash-dashed) ions are also shown. (d) The same as (c) for
FGS.
quark contribution. The total ratios for the lighter ions are closer to unity for all pTdue to their smaller A.
The results are similar for FGS, shown in Fig. 65(d), but with some subtle
differences. The ratio R(pT ) for produced gluons, arising from the γq contribution,
exhibits a larger antishadowing effect on R(pT ) because SqA is higher for this
parametrization, see Fig. 55. The FGS antiquark shadowing ratio goes to unity for
x > 0.2, causing the flattening of R(pT ) for antiquarks (dotted curve) due to the
contribution from γq → gq. The FGS valence quark ratio is taken from EKS98, resulting
in the similarity of R(pT ) in Figs. 65(c) and (d) at high pT .
Some care must be taken when applying these parameterizations to high pT since
the upper limit of their fit range is 100 GeV. While no extraordinary effects are seen in
their behavior beyond this scale, the results should be taken as indicative only. Finally,
116
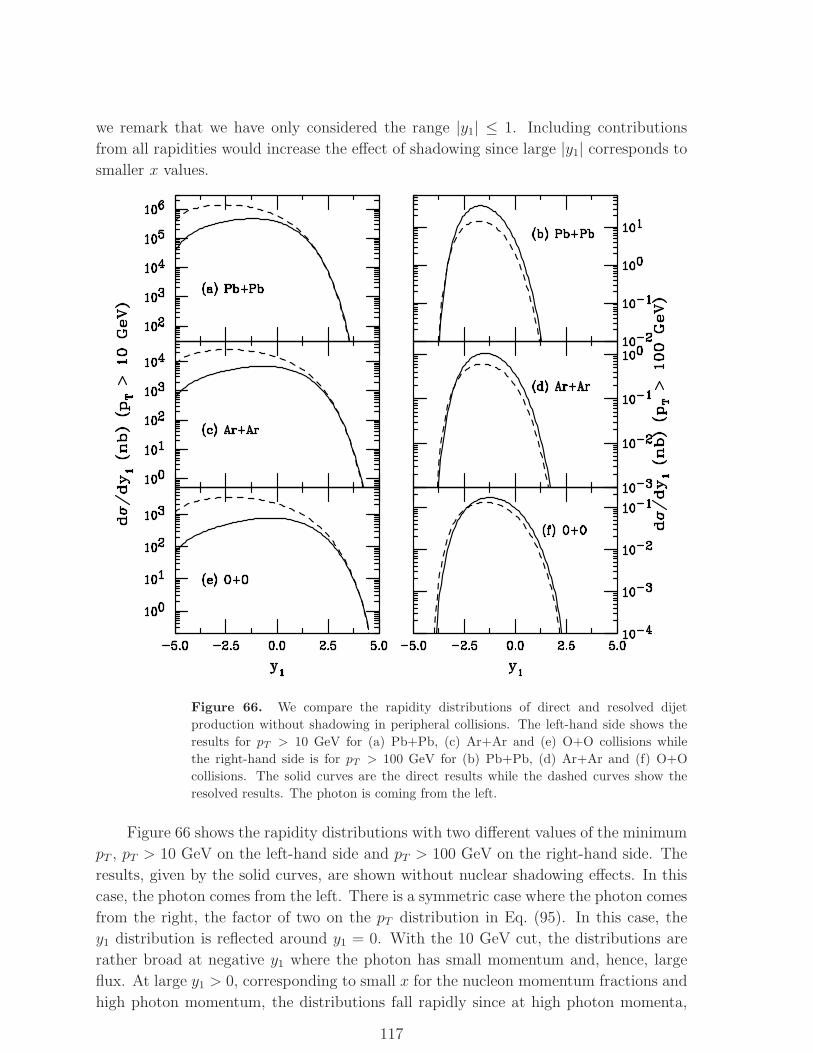
we remark that we have only considered the range |y1| ≤ 1. Including contributions
from all rapidities would increase the effect of shadowing since large |y1| corresponds to
smaller x values.
Figure 66. We compare the rapidity distributions of direct and resolved dijet
production without shadowing in peripheral collisions. The left-hand side shows the
results for pT > 10 GeV for (a) Pb+Pb, (c) Ar+Ar and (e) O+O collisions while
the right-hand side is for pT > 100 GeV for (b) Pb+Pb, (d) Ar+Ar and (f) O+O
collisions. The solid curves are the direct results while the dashed curves show the
resolved results. The photon is coming from the left.
Figure 66 shows the rapidity distributions with two different values of the minimum
pT , pT > 10 GeV on the left-hand side and pT > 100 GeV on the right-hand side. The
results, given by the solid curves, are shown without nuclear shadowing effects. In this
case, the photon comes from the left. There is a symmetric case where the photon comes
from the right, the factor of two on the pT distribution in Eq. (95). In this case, the
y1 distribution is reflected around y1 = 0. With the 10 GeV cut, the distributions are
rather broad at negative y1 where the photon has small momentum and, hence, large
flux. At large y1 > 0, corresponding to small x for the nucleon momentum fractions and
high photon momentum, the distributions fall rapidly since at high photon momenta,
117
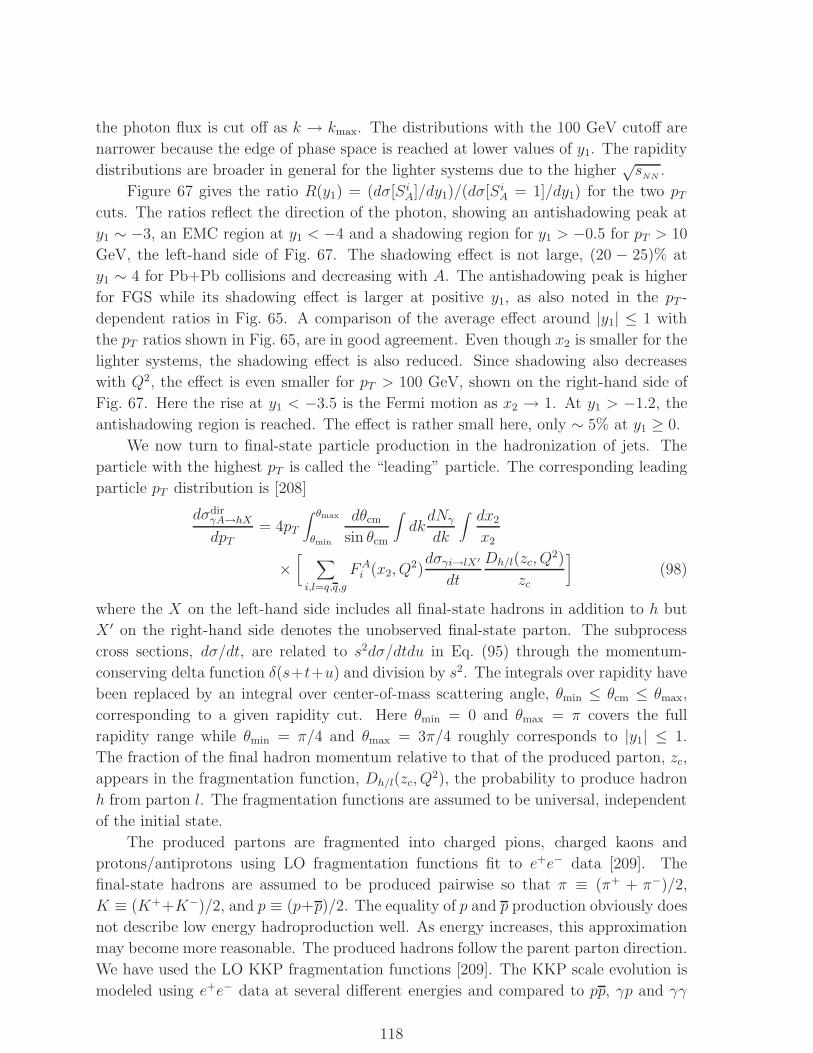
the photon flux is cut off as k → kmax. The distributions with the 100 GeV cutoff are
narrower because the edge of phase space is reached at lower values of y1. The rapidity
distributions are broader in general for the lighter systems due to the higher√s
NN.
Figure 67 gives the ratio R(y1) = (dσ[SiA]/dy1)/(dσ[SiA = 1]/dy1) for the two pTcuts. The ratios reflect the direction of the photon, showing an antishadowing peak at
y1 ∼ −3, an EMC region at y1 < −4 and a shadowing region for y1 > −0.5 for pT > 10
GeV, the left-hand side of Fig. 67. The shadowing effect is not large, (20 − 25)% at
y1 ∼ 4 for Pb+Pb collisions and decreasing with A. The antishadowing peak is higher
for FGS while its shadowing effect is larger at positive y1, as also noted in the pT -
dependent ratios in Fig. 65. A comparison of the average effect around |y1| ≤ 1 with
the pT ratios shown in Fig. 65, are in good agreement. Even though x2 is smaller for the
lighter systems, the shadowing effect is also reduced. Since shadowing also decreases
with Q2, the effect is even smaller for pT > 100 GeV, shown on the right-hand side of
Fig. 67. Here the rise at y1 < −3.5 is the Fermi motion as x2 → 1. At y1 > −1.2, the
antishadowing region is reached. The effect is rather small here, only ∼ 5% at y1 ≥ 0.
We now turn to final-state particle production in the hadronization of jets. The
particle with the highest pT is called the “leading” particle. The corresponding leading
particle pT distribution is [208]
dσdirγA→hX
dpT= 4pT
∫ θmax
θmin
dθcmsin θcm
∫dkdNγ
dk
∫dx2
x2
×[ ∑
i,l=q,q,g
FAi (x2, Q
2)dσγi→lX′
dt
Dh/l(zc, Q2)
zc
](98)
where the X on the left-hand side includes all final-state hadrons in addition to h but
X ′ on the right-hand side denotes the unobserved final-state parton. The subprocess
cross sections, dσ/dt, are related to s2dσ/dtdu in Eq. (95) through the momentum-
conserving delta function δ(s+t+u) and division by s2. The integrals over rapidity have
been replaced by an integral over center-of-mass scattering angle, θmin ≤ θcm ≤ θmax,
corresponding to a given rapidity cut. Here θmin = 0 and θmax = π covers the full
rapidity range while θmin = π/4 and θmax = 3π/4 roughly corresponds to |y1| ≤ 1.
The fraction of the final hadron momentum relative to that of the produced parton, zc,
appears in the fragmentation function, Dh/l(zc, Q2), the probability to produce hadron
h from parton l. The fragmentation functions are assumed to be universal, independent
of the initial state.
The produced partons are fragmented into charged pions, charged kaons and
protons/antiprotons using LO fragmentation functions fit to e+e− data [209]. The
final-state hadrons are assumed to be produced pairwise so that π ≡ (π+ + π−)/2,
K ≡ (K++K−)/2, and p ≡ (p+p)/2. The equality of p and p production obviously does
not describe low energy hadroproduction well. As energy increases, this approximation
may become more reasonable. The produced hadrons follow the parent parton direction.
We have used the LO KKP fragmentation functions [209]. The KKP scale evolution is
modeled using e+e− data at several different energies and compared to pp, γp and γγ
118
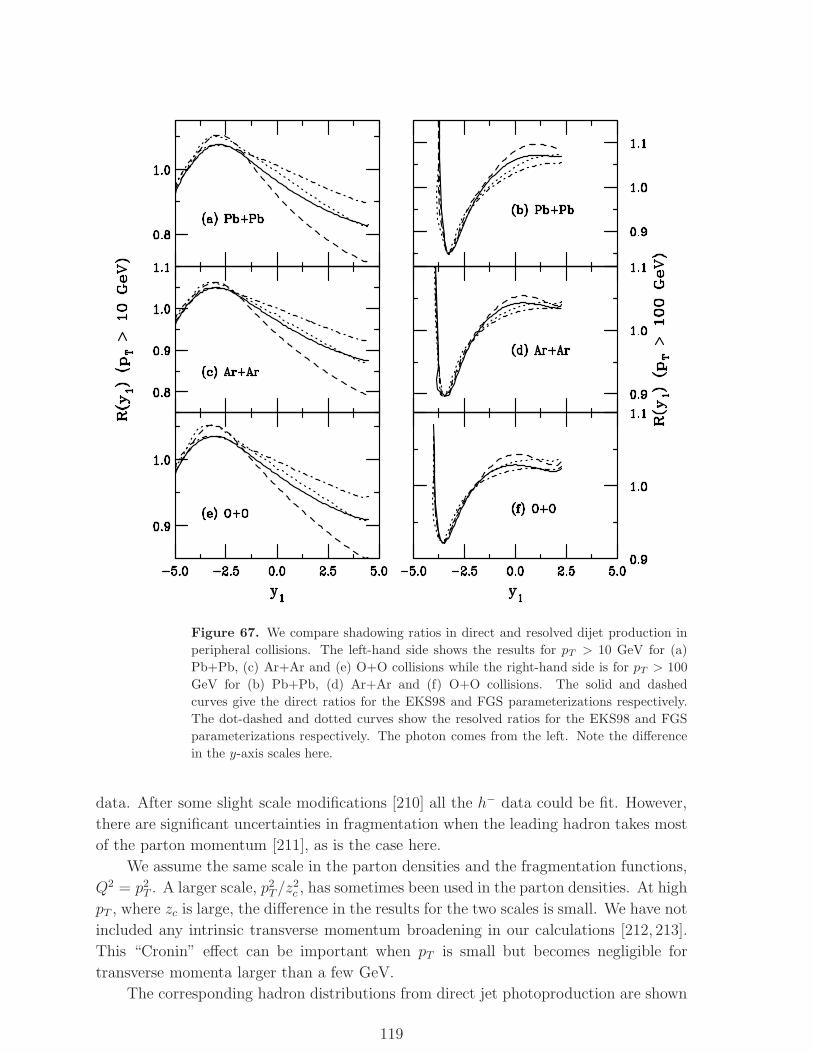
Figure 67. We compare shadowing ratios in direct and resolved dijet production in
peripheral collisions. The left-hand side shows the results for pT > 10 GeV for (a)
Pb+Pb, (c) Ar+Ar and (e) O+O collisions while the right-hand side is for pT > 100
GeV for (b) Pb+Pb, (d) Ar+Ar and (f) O+O collisions. The solid and dashed
curves give the direct ratios for the EKS98 and FGS parameterizations respectively.
The dot-dashed and dotted curves show the resolved ratios for the EKS98 and FGS
parameterizations respectively. The photon comes from the left. Note the difference
in the y-axis scales here.
data. After some slight scale modifications [210] all the h− data could be fit. However,
there are significant uncertainties in fragmentation when the leading hadron takes most
of the parton momentum [211], as is the case here.
We assume the same scale in the parton densities and the fragmentation functions,
Q2 = p2T . A larger scale, p2
T/z2c , has sometimes been used in the parton densities. At high
pT , where zc is large, the difference in the results for the two scales is small. We have not
included any intrinsic transverse momentum broadening in our calculations [212, 213].
This “Cronin” effect can be important when pT is small but becomes negligible for
transverse momenta larger than a few GeV.
The corresponding hadron distributions from direct jet photoproduction are shown
119
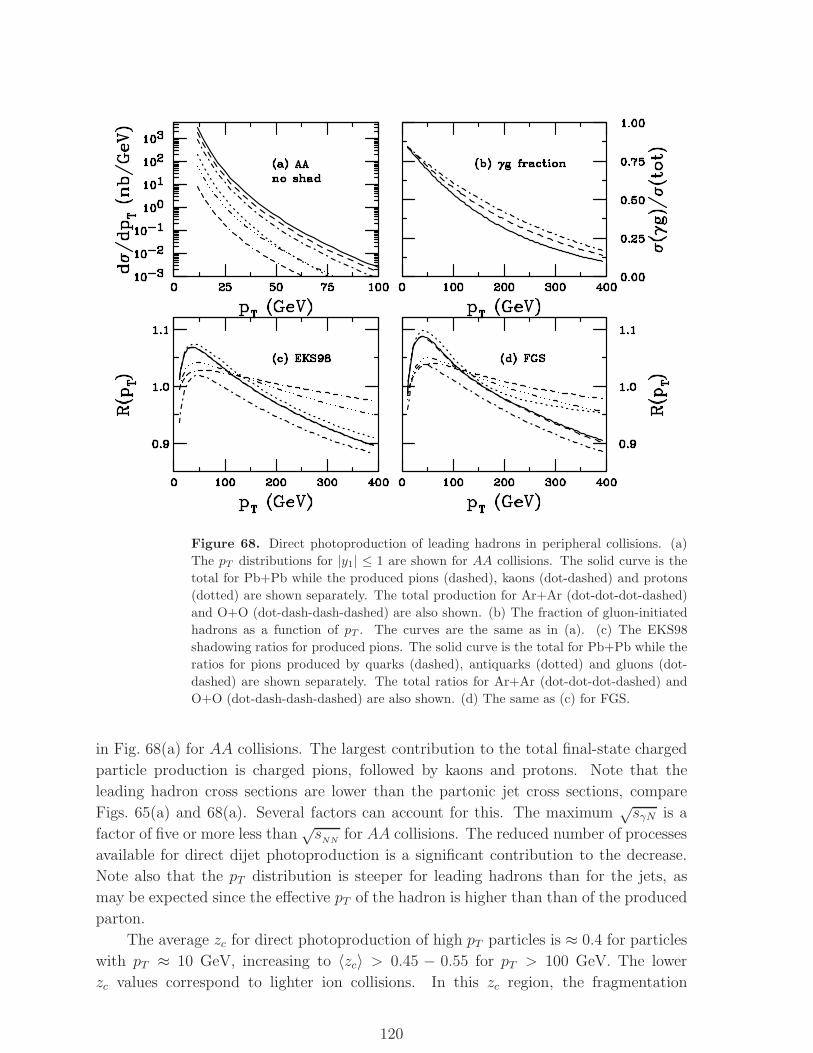
Figure 68. Direct photoproduction of leading hadrons in peripheral collisions. (a)
The pT distributions for |y1| ≤ 1 are shown for AA collisions. The solid curve is the
total for Pb+Pb while the produced pions (dashed), kaons (dot-dashed) and protons
(dotted) are shown separately. The total production for Ar+Ar (dot-dot-dot-dashed)
and O+O (dot-dash-dash-dashed) are also shown. (b) The fraction of gluon-initiated
hadrons as a function of pT . The curves are the same as in (a). (c) The EKS98
shadowing ratios for produced pions. The solid curve is the total for Pb+Pb while the
ratios for pions produced by quarks (dashed), antiquarks (dotted) and gluons (dot-
dashed) are shown separately. The total ratios for Ar+Ar (dot-dot-dot-dashed) and
O+O (dot-dash-dash-dashed) are also shown. (d) The same as (c) for FGS.
in Fig. 68(a) for AA collisions. The largest contribution to the total final-state charged
particle production is charged pions, followed by kaons and protons. Note that the
leading hadron cross sections are lower than the partonic jet cross sections, compare
Figs. 65(a) and 68(a). Several factors can account for this. The maximum√sγN is a
factor of five or more less than√s
NNfor AA collisions. The reduced number of processes
available for direct dijet photoproduction is a significant contribution to the decrease.
Note also that the pT distribution is steeper for leading hadrons than for the jets, as
may be expected since the effective pT of the hadron is higher than than of the produced
parton.
The average zc for direct photoproduction of high pT particles is ≈ 0.4 for particles
with pT ≈ 10 GeV, increasing to 〈zc〉 > 0.45 − 0.55 for pT > 100 GeV. The lower
zc values correspond to lighter ion collisions. In this zc region, the fragmentation
120
functions are not very well known. As pointed out in Ref. [211], a small change in
the fragmentation function fits can produce significant changes at large zc. This region
is not well constrained by the e+e− data used in the fits.
The effect of fragmentation on the production channels is shown in Fig. 68(b)
where we present the fraction of leading hadron production from the γg channel for all
charged hadrons. The ratios are rather similar to those of the partonic jets although
the γg fraction is somewhat smaller due to the larger average x of hadron production
with respect to jets, as we discuss later.
The shadowing ratios for charged pions produced in Pb+Pb collisions by quarks,
antiquarks, gluons and the total from all partons, are shown for the EKS98 and FGS
parameterizations in Fig. 68(c) and (d). The ratios for pion production in Ar+Ar and
O+O collisions are also shown. The high pT FGS antiquark ratios flatten out relative to
the EKS98 ratio because the γq channel dominates gluon production at high pT . The
flattening behavior sets in earlier here because the x for hadron production is higher
than that for the jets. The ratio of pions arising from produced gluons follows the
valence ratio, as expected. The ratios decrease with increasing pT due to the EMC
effect for x > 0.2 when pT > 100 GeV.
Figure 69. The average value of the nucleon parton momentum fraction x as a
function of transverse momentum. Results are given for (a) direct and (b) resolved
gluon jet production and for (c) direct and (d) resolved pion production by gluons.
The results are given for O+O (dot-dashed), Ar+Ar (dashed) and Pb+Pb (solid)
interactions.
121
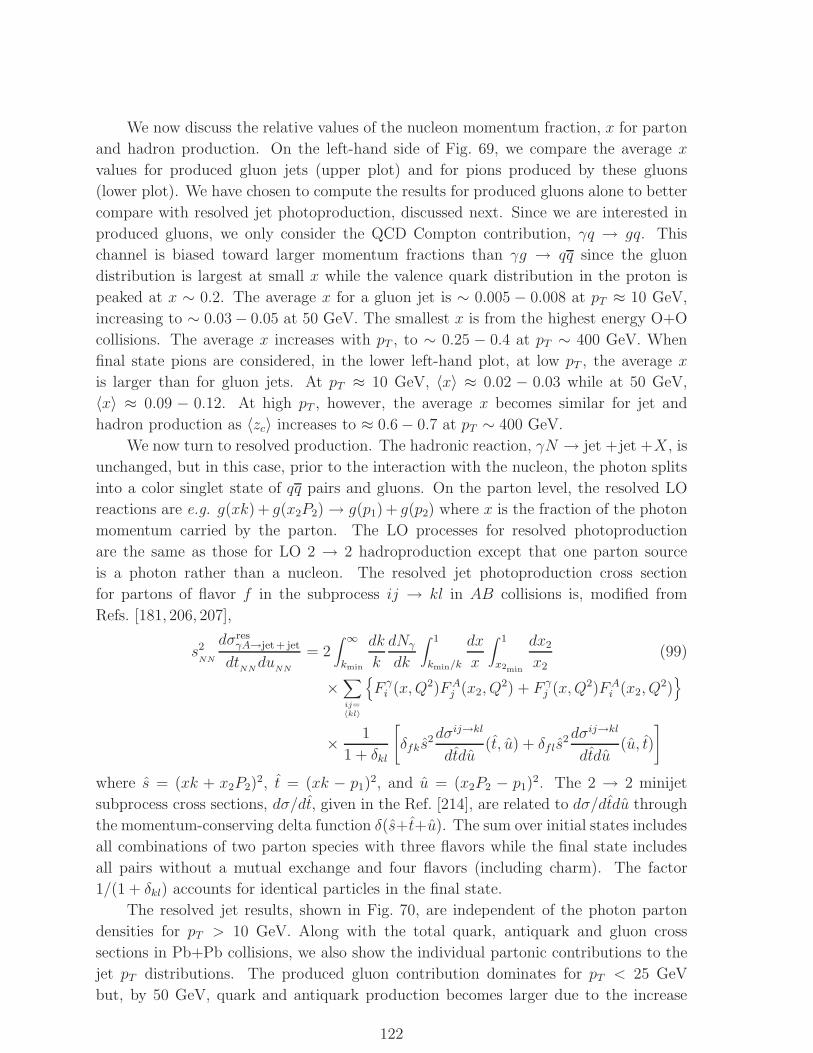
We now discuss the relative values of the nucleon momentum fraction, x for parton
and hadron production. On the left-hand side of Fig. 69, we compare the average x
values for produced gluon jets (upper plot) and for pions produced by these gluons
(lower plot). We have chosen to compute the results for produced gluons alone to better
compare with resolved jet photoproduction, discussed next. Since we are interested in
produced gluons, we only consider the QCD Compton contribution, γq → gq. This
channel is biased toward larger momentum fractions than γg → qq since the gluon
distribution is largest at small x while the valence quark distribution in the proton is
peaked at x ∼ 0.2. The average x for a gluon jet is ∼ 0.005 − 0.008 at pT ≈ 10 GeV,
increasing to ∼ 0.03− 0.05 at 50 GeV. The smallest x is from the highest energy O+O
collisions. The average x increases with pT , to ∼ 0.25 − 0.4 at pT ∼ 400 GeV. When
final state pions are considered, in the lower left-hand plot, at low pT , the average x
is larger than for gluon jets. At pT ≈ 10 GeV, 〈x〉 ≈ 0.02 − 0.03 while at 50 GeV,
〈x〉 ≈ 0.09 − 0.12. At high pT , however, the average x becomes similar for jet and
hadron production as 〈zc〉 increases to ≈ 0.6 − 0.7 at pT ∼ 400 GeV.
We now turn to resolved production. The hadronic reaction, γN → jet +jet +X, is
unchanged, but in this case, prior to the interaction with the nucleon, the photon splits
into a color singlet state of qq pairs and gluons. On the parton level, the resolved LO
reactions are e.g. g(xk) + g(x2P2) → g(p1) + g(p2) where x is the fraction of the photon
momentum carried by the parton. The LO processes for resolved photoproduction
are the same as those for LO 2 → 2 hadroproduction except that one parton source
is a photon rather than a nucleon. The resolved jet photoproduction cross section
for partons of flavor f in the subprocess ij → kl in AB collisions is, modified from
Refs. [181, 206, 207],
s2NN
dσresγA→jet+ jet
dtNNdu
NN
= 2∫ ∞
kmin
dk
k
dNγ
dk
∫ 1
kmin/k
dx
x
∫ 1
x2min
dx2
x2(99)
×∑
ij=〈kl〉
{F γi (x,Q2)FA
j (x2, Q2) + F γ
j (x,Q2)FAi (x2, Q
2)}
× 1
1 + δkl
[δfks
2dσij→kl
dtdu(t, u) + δfls
2dσij→kl
dtdu(u, t)
]
where s = (xk + x2P2)2, t = (xk − p1)
2, and u = (x2P2 − p1)2. The 2 → 2 minijet
subprocess cross sections, dσ/dt, given in the Ref. [214], are related to dσ/dtdu through
the momentum-conserving delta function δ(s+t+u). The sum over initial states includes
all combinations of two parton species with three flavors while the final state includes
all pairs without a mutual exchange and four flavors (including charm). The factor
1/(1 + δkl) accounts for identical particles in the final state.
The resolved jet results, shown in Fig. 70, are independent of the photon parton
densities for pT > 10 GeV. Along with the total quark, antiquark and gluon cross
sections in Pb+Pb collisions, we also show the individual partonic contributions to the
jet pT distributions. The produced gluon contribution dominates for pT < 25 GeV
but, by 50 GeV, quark and antiquark production becomes larger due to the increase
122
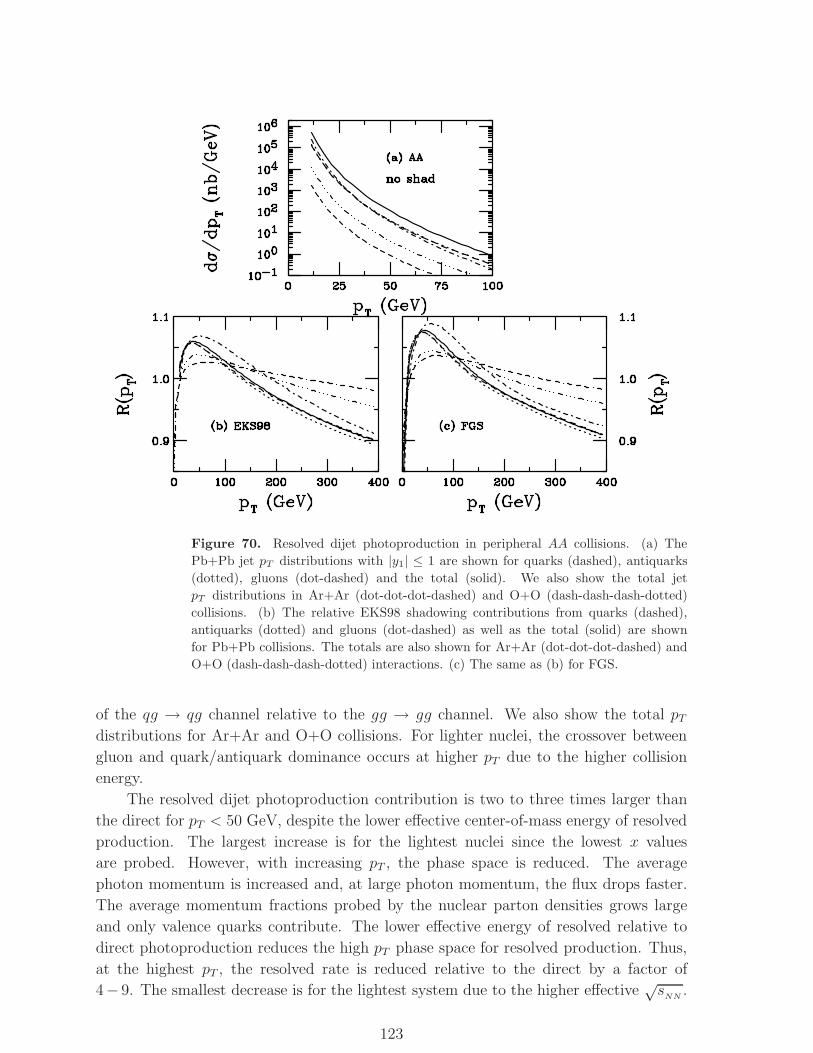
Figure 70. Resolved dijet photoproduction in peripheral AA collisions. (a) The
Pb+Pb jet pT distributions with |y1| ≤ 1 are shown for quarks (dashed), antiquarks
(dotted), gluons (dot-dashed) and the total (solid). We also show the total jet
pT distributions in Ar+Ar (dot-dot-dot-dashed) and O+O (dash-dash-dash-dotted)
collisions. (b) The relative EKS98 shadowing contributions from quarks (dashed),
antiquarks (dotted) and gluons (dot-dashed) as well as the total (solid) are shown
for Pb+Pb collisions. The totals are also shown for Ar+Ar (dot-dot-dot-dashed) and
O+O (dash-dash-dash-dotted) interactions. (c) The same as (b) for FGS.
of the qg → qg channel relative to the gg → gg channel. We also show the total pTdistributions for Ar+Ar and O+O collisions. For lighter nuclei, the crossover between
gluon and quark/antiquark dominance occurs at higher pT due to the higher collision
energy.
The resolved dijet photoproduction contribution is two to three times larger than
the direct for pT < 50 GeV, despite the lower effective center-of-mass energy of resolved
production. The largest increase is for the lightest nuclei since the lowest x values
are probed. However, with increasing pT , the phase space is reduced. The average
photon momentum is increased and, at large photon momentum, the flux drops faster.
The average momentum fractions probed by the nuclear parton densities grows large
and only valence quarks contribute. The lower effective energy of resolved relative to
direct photoproduction reduces the high pT phase space for resolved production. Thus,
at the highest pT , the resolved rate is reduced relative to the direct by a factor of
4− 9. The smallest decrease is for the lightest system due to the higher effective√s
NN.
123
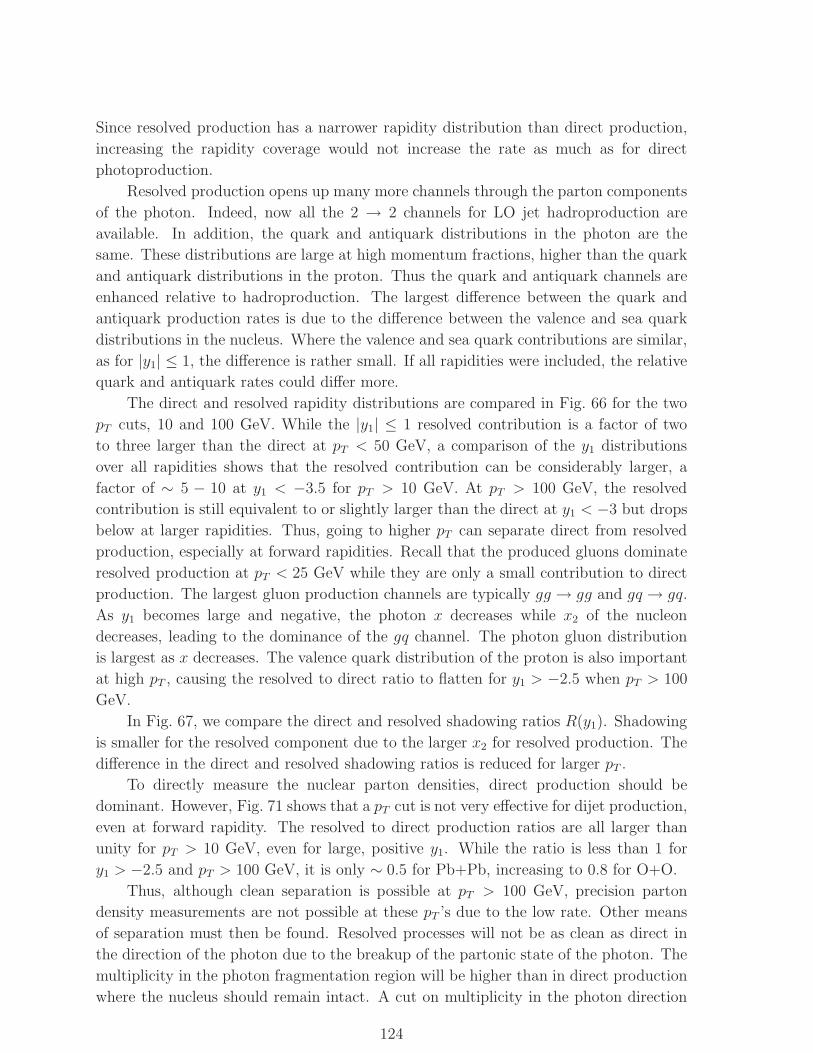
Since resolved production has a narrower rapidity distribution than direct production,
increasing the rapidity coverage would not increase the rate as much as for direct
photoproduction.
Resolved production opens up many more channels through the parton components
of the photon. Indeed, now all the 2 → 2 channels for LO jet hadroproduction are
available. In addition, the quark and antiquark distributions in the photon are the
same. These distributions are large at high momentum fractions, higher than the quark
and antiquark distributions in the proton. Thus the quark and antiquark channels are
enhanced relative to hadroproduction. The largest difference between the quark and
antiquark production rates is due to the difference between the valence and sea quark
distributions in the nucleus. Where the valence and sea quark contributions are similar,
as for |y1| ≤ 1, the difference is rather small. If all rapidities were included, the relative
quark and antiquark rates could differ more.
The direct and resolved rapidity distributions are compared in Fig. 66 for the two
pT cuts, 10 and 100 GeV. While the |y1| ≤ 1 resolved contribution is a factor of two
to three larger than the direct at pT < 50 GeV, a comparison of the y1 distributions
over all rapidities shows that the resolved contribution can be considerably larger, a
factor of ∼ 5 − 10 at y1 < −3.5 for pT > 10 GeV. At pT > 100 GeV, the resolved
contribution is still equivalent to or slightly larger than the direct at y1 < −3 but drops
below at larger rapidities. Thus, going to higher pT can separate direct from resolved
production, especially at forward rapidities. Recall that the produced gluons dominate
resolved production at pT < 25 GeV while they are only a small contribution to direct
production. The largest gluon production channels are typically gg → gg and gq → gq.
As y1 becomes large and negative, the photon x decreases while x2 of the nucleon
decreases, leading to the dominance of the gq channel. The photon gluon distribution
is largest as x decreases. The valence quark distribution of the proton is also important
at high pT , causing the resolved to direct ratio to flatten for y1 > −2.5 when pT > 100
GeV.
In Fig. 67, we compare the direct and resolved shadowing ratios R(y1). Shadowing
is smaller for the resolved component due to the larger x2 for resolved production. The
difference in the direct and resolved shadowing ratios is reduced for larger pT .
To directly measure the nuclear parton densities, direct production should be
dominant. However, Fig. 71 shows that a pT cut is not very effective for dijet production,
even at forward rapidity. The resolved to direct production ratios are all larger than
unity for pT > 10 GeV, even for large, positive y1. While the ratio is less than 1 for
y1 > −2.5 and pT > 100 GeV, it is only ∼ 0.5 for Pb+Pb, increasing to 0.8 for O+O.
Thus, although clean separation is possible at pT > 100 GeV, precision parton
density measurements are not possible at these pT ’s due to the low rate. Other means
of separation must then be found. Resolved processes will not be as clean as direct in
the direction of the photon due to the breakup of the partonic state of the photon. The
multiplicity in the photon fragmentation region will be higher than in direct production
where the nucleus should remain intact. A cut on multiplicity in the photon direction
124
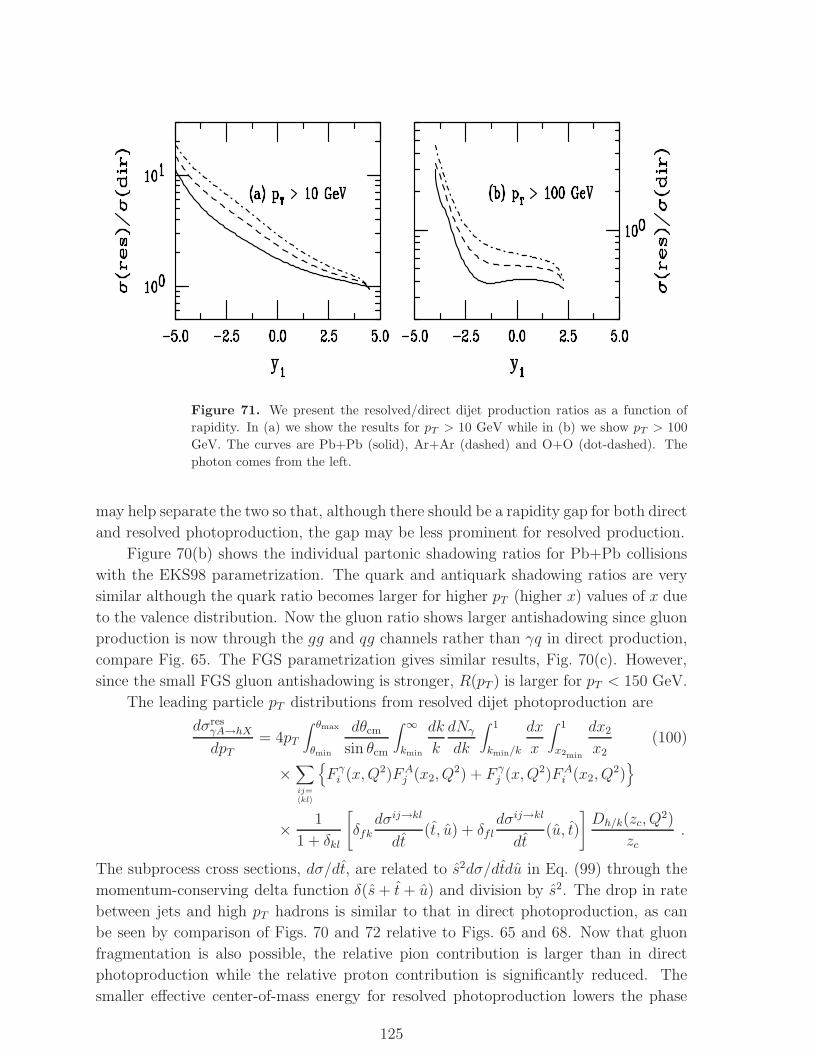
Figure 71. We present the resolved/direct dijet production ratios as a function of
rapidity. In (a) we show the results for pT > 10 GeV while in (b) we show pT > 100
GeV. The curves are Pb+Pb (solid), Ar+Ar (dashed) and O+O (dot-dashed). The
photon comes from the left.
may help separate the two so that, although there should be a rapidity gap for both direct
and resolved photoproduction, the gap may be less prominent for resolved production.
Figure 70(b) shows the individual partonic shadowing ratios for Pb+Pb collisions
with the EKS98 parametrization. The quark and antiquark shadowing ratios are very
similar although the quark ratio becomes larger for higher pT (higher x) values of x due
to the valence distribution. Now the gluon ratio shows larger antishadowing since gluon
production is now through the gg and qg channels rather than γq in direct production,
compare Fig. 65. The FGS parametrization gives similar results, Fig. 70(c). However,
since the small FGS gluon antishadowing is stronger, R(pT ) is larger for pT < 150 GeV.
The leading particle pT distributions from resolved dijet photoproduction are
dσresγA→hX
dpT= 4pT
∫ θmax
θmin
dθcmsin θcm
∫ ∞
kmin
dk
k
dNγ
dk
∫ 1
kmin/k
dx
x
∫ 1
x2min
dx2
x2(100)
×∑
ij=〈kl〉
{F γi (x,Q2)FA
j (x2, Q2) + F γ
j (x,Q2)FAi (x2, Q
2)}
× 1
1 + δkl
[δfk
dσij→kl
dt(t, u) + δfl
dσij→kl
dt(u, t)
]Dh/k(zc, Q
2)
zc.
The subprocess cross sections, dσ/dt, are related to s2dσ/dtdu in Eq. (99) through the
momentum-conserving delta function δ(s+ t+ u) and division by s2. The drop in rate
between jets and high pT hadrons is similar to that in direct photoproduction, as can
be seen by comparison of Figs. 70 and 72 relative to Figs. 65 and 68. Now that gluon
fragmentation is also possible, the relative pion contribution is larger than in direct
photoproduction while the relative proton contribution is significantly reduced. The
smaller effective center-of-mass energy for resolved photoproduction lowers the phase
125
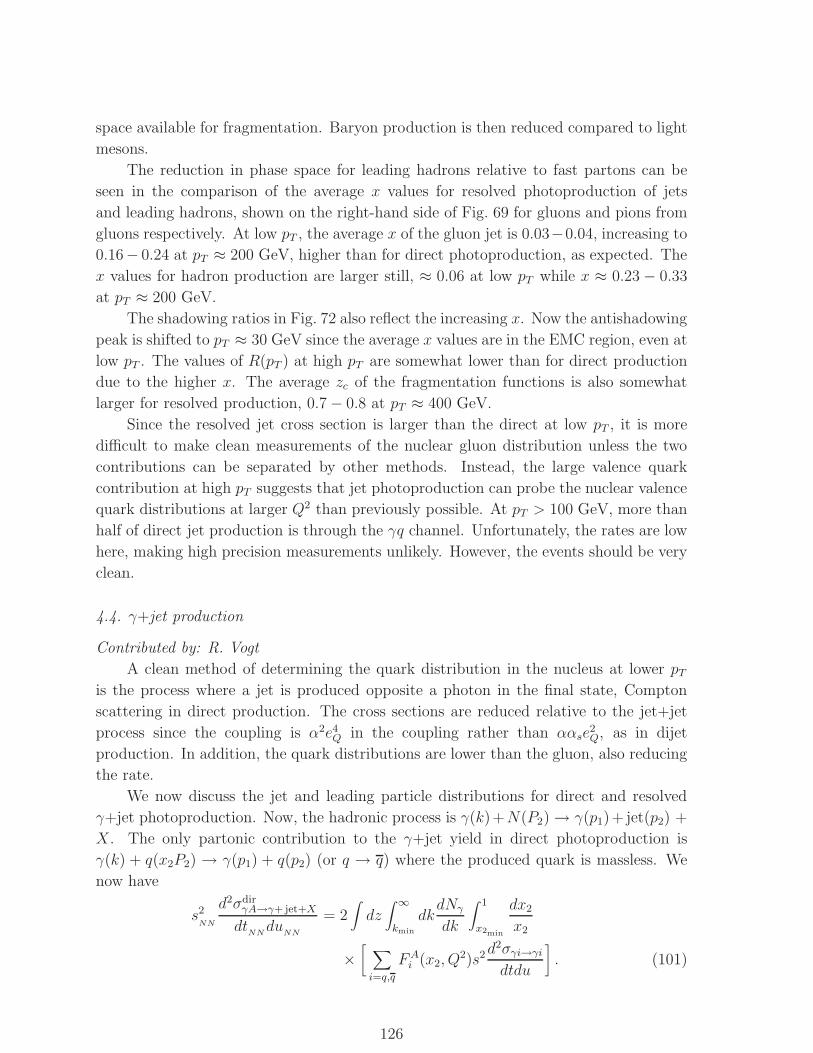
space available for fragmentation. Baryon production is then reduced compared to light
mesons.
The reduction in phase space for leading hadrons relative to fast partons can be
seen in the comparison of the average x values for resolved photoproduction of jets
and leading hadrons, shown on the right-hand side of Fig. 69 for gluons and pions from
gluons respectively. At low pT , the average x of the gluon jet is 0.03−0.04, increasing to
0.16− 0.24 at pT ≈ 200 GeV, higher than for direct photoproduction, as expected. The
x values for hadron production are larger still, ≈ 0.06 at low pT while x ≈ 0.23 − 0.33
at pT ≈ 200 GeV.
The shadowing ratios in Fig. 72 also reflect the increasing x. Now the antishadowing
peak is shifted to pT ≈ 30 GeV since the average x values are in the EMC region, even at
low pT . The values of R(pT ) at high pT are somewhat lower than for direct production
due to the higher x. The average zc of the fragmentation functions is also somewhat
larger for resolved production, 0.7 − 0.8 at pT ≈ 400 GeV.
Since the resolved jet cross section is larger than the direct at low pT , it is more
difficult to make clean measurements of the nuclear gluon distribution unless the two
contributions can be separated by other methods. Instead, the large valence quark
contribution at high pT suggests that jet photoproduction can probe the nuclear valence
quark distributions at larger Q2 than previously possible. At pT > 100 GeV, more than
half of direct jet production is through the γq channel. Unfortunately, the rates are low
here, making high precision measurements unlikely. However, the events should be very
clean.
4.4. γ+jet production
Contributed by: R. Vogt
A clean method of determining the quark distribution in the nucleus at lower pTis the process where a jet is produced opposite a photon in the final state, Compton
scattering in direct production. The cross sections are reduced relative to the jet+jet
process since the coupling is α2e4Q in the coupling rather than ααse2Q, as in dijet
production. In addition, the quark distributions are lower than the gluon, also reducing
the rate.
We now discuss the jet and leading particle distributions for direct and resolved
γ+jet photoproduction. Now, the hadronic process is γ(k)+N(P2) → γ(p1)+ jet(p2) +
X. The only partonic contribution to the γ+jet yield in direct photoproduction is
γ(k) + q(x2P2) → γ(p1) + q(p2) (or q → q) where the produced quark is massless. We
now have
s2NN
d2σdirγA→γ+ jet+X
dtNNdu
NN
= 2∫dz∫ ∞
kmin
dkdNγ
dk
∫ 1
x2min
dx2
x2
×[ ∑
i=q,q
FAi (x2, Q
2)s2d2σγi→γidtdu
]. (101)
126
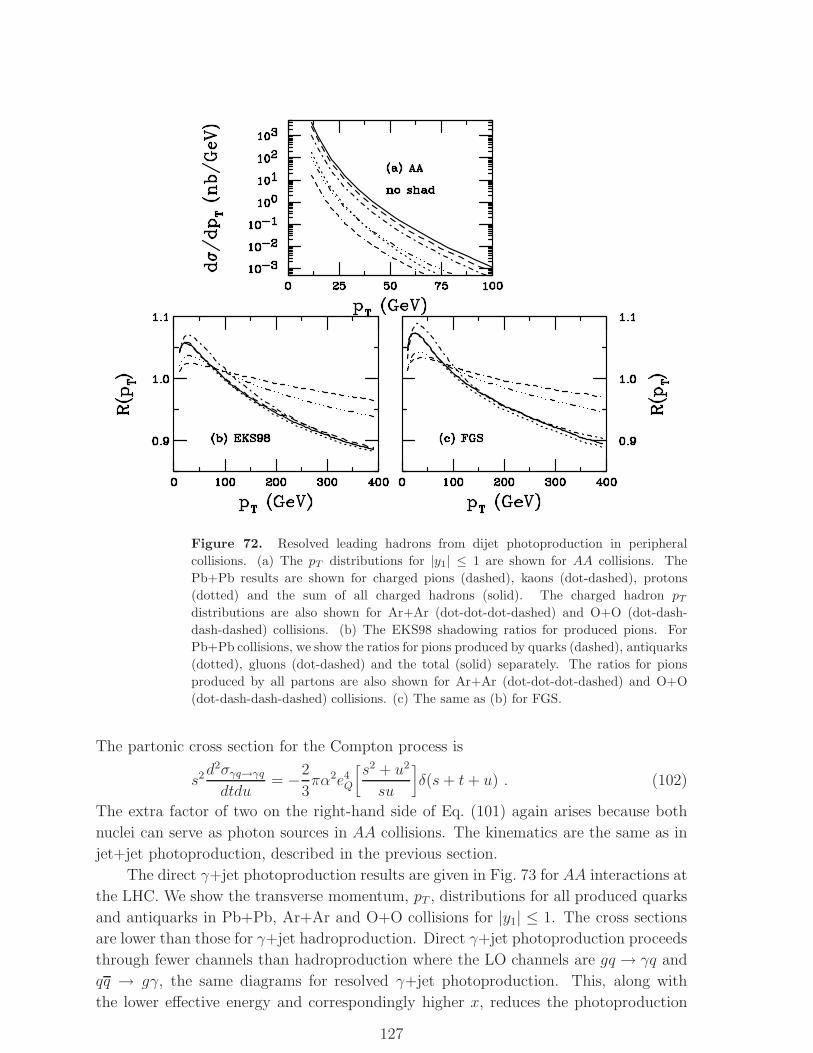
Figure 72. Resolved leading hadrons from dijet photoproduction in peripheral
collisions. (a) The pT distributions for |y1| ≤ 1 are shown for AA collisions. The
Pb+Pb results are shown for charged pions (dashed), kaons (dot-dashed), protons
(dotted) and the sum of all charged hadrons (solid). The charged hadron pTdistributions are also shown for Ar+Ar (dot-dot-dot-dashed) and O+O (dot-dash-
dash-dashed) collisions. (b) The EKS98 shadowing ratios for produced pions. For
Pb+Pb collisions, we show the ratios for pions produced by quarks (dashed), antiquarks
(dotted), gluons (dot-dashed) and the total (solid) separately. The ratios for pions
produced by all partons are also shown for Ar+Ar (dot-dot-dot-dashed) and O+O
(dot-dash-dash-dashed) collisions. (c) The same as (b) for FGS.
The partonic cross section for the Compton process is
s2d2σγq→γqdtdu
= −2
3πα2e4Q
[s2 + u2
su
]δ(s+ t+ u) . (102)
The extra factor of two on the right-hand side of Eq. (101) again arises because both
nuclei can serve as photon sources in AA collisions. The kinematics are the same as in
jet+jet photoproduction, described in the previous section.
The direct γ+jet photoproduction results are given in Fig. 73 for AA interactions at
the LHC. We show the transverse momentum, pT , distributions for all produced quarks
and antiquarks in Pb+Pb, Ar+Ar and O+O collisions for |y1| ≤ 1. The cross sections
are lower than those for γ+jet hadroproduction. Direct γ+jet photoproduction proceeds
through fewer channels than hadroproduction where the LO channels are gq → γq and
qq → gγ, the same diagrams for resolved γ+jet photoproduction. This, along with
the lower effective energy and correspondingly higher x, reduces the photoproduction
127
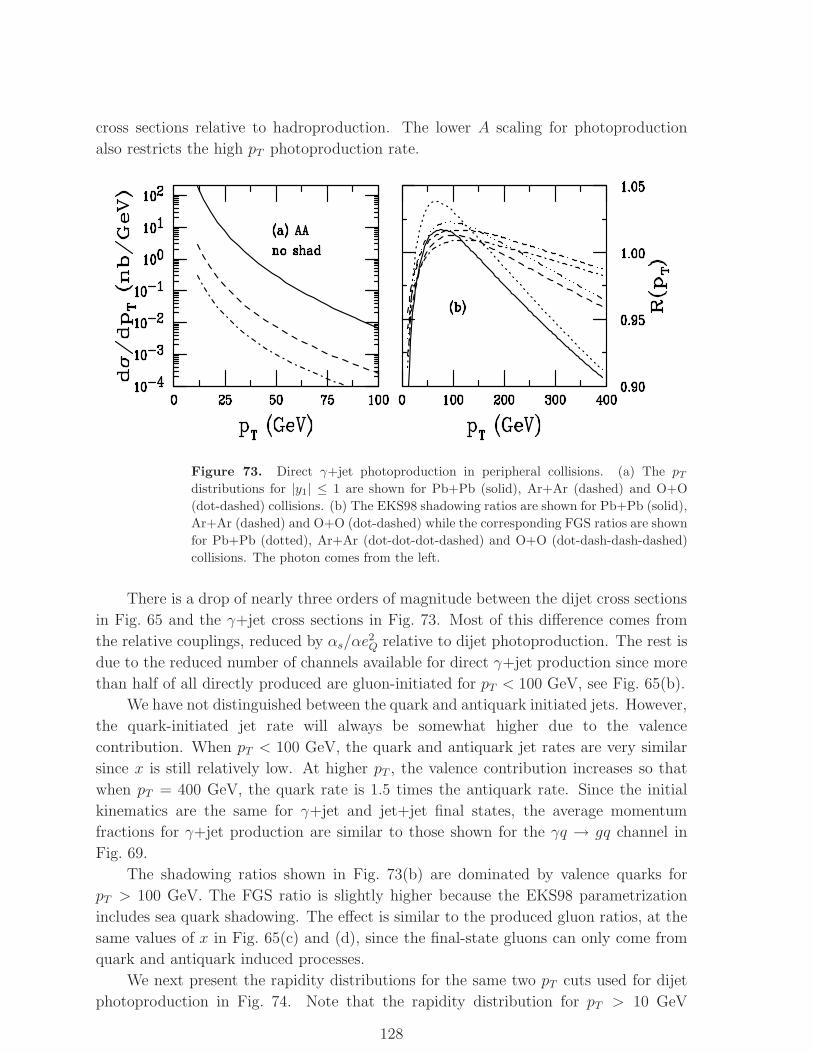
cross sections relative to hadroproduction. The lower A scaling for photoproduction
also restricts the high pT photoproduction rate.
Figure 73. Direct γ+jet photoproduction in peripheral collisions. (a) The pTdistributions for |y1| ≤ 1 are shown for Pb+Pb (solid), Ar+Ar (dashed) and O+O
(dot-dashed) collisions. (b) The EKS98 shadowing ratios are shown for Pb+Pb (solid),
Ar+Ar (dashed) and O+O (dot-dashed) while the corresponding FGS ratios are shown
for Pb+Pb (dotted), Ar+Ar (dot-dot-dot-dashed) and O+O (dot-dash-dash-dashed)
collisions. The photon comes from the left.
There is a drop of nearly three orders of magnitude between the dijet cross sections
in Fig. 65 and the γ+jet cross sections in Fig. 73. Most of this difference comes from
the relative couplings, reduced by αs/αe2Q relative to dijet photoproduction. The rest is
due to the reduced number of channels available for direct γ+jet production since more
than half of all directly produced are gluon-initiated for pT < 100 GeV, see Fig. 65(b).
We have not distinguished between the quark and antiquark initiated jets. However,
the quark-initiated jet rate will always be somewhat higher due to the valence
contribution. When pT < 100 GeV, the quark and antiquark jet rates are very similar
since x is still relatively low. At higher pT , the valence contribution increases so that
when pT = 400 GeV, the quark rate is 1.5 times the antiquark rate. Since the initial
kinematics are the same for γ+jet and jet+jet final states, the average momentum
fractions for γ+jet production are similar to those shown for the γq → gq channel in
Fig. 69.
The shadowing ratios shown in Fig. 73(b) are dominated by valence quarks for
pT > 100 GeV. The FGS ratio is slightly higher because the EKS98 parametrization
includes sea quark shadowing. The effect is similar to the produced gluon ratios, at the
same values of x in Fig. 65(c) and (d), since the final-state gluons can only come from
quark and antiquark induced processes.
We next present the rapidity distributions for the same two pT cuts used for dijet
photoproduction in Fig. 74. Note that the rapidity distribution for pT > 10 GeV
128
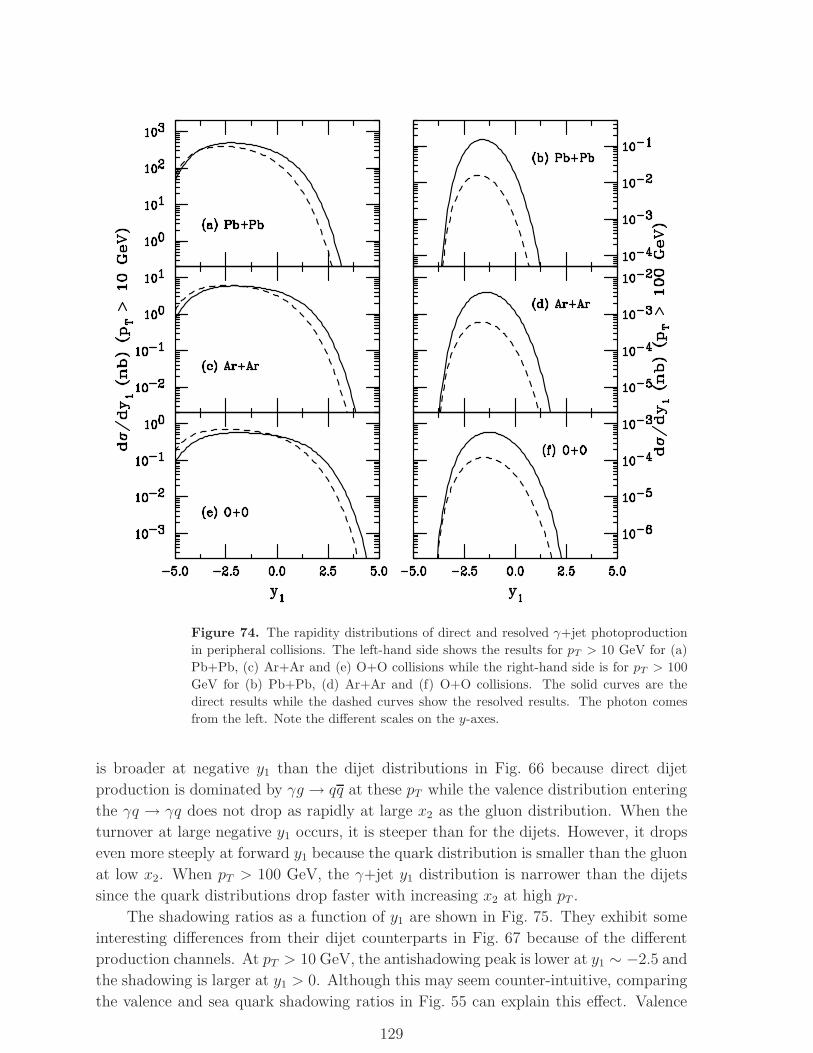
Figure 74. The rapidity distributions of direct and resolved γ+jet photoproduction
in peripheral collisions. The left-hand side shows the results for pT > 10 GeV for (a)
Pb+Pb, (c) Ar+Ar and (e) O+O collisions while the right-hand side is for pT > 100
GeV for (b) Pb+Pb, (d) Ar+Ar and (f) O+O collisions. The solid curves are the
direct results while the dashed curves show the resolved results. The photon comes
from the left. Note the different scales on the y-axes.
is broader at negative y1 than the dijet distributions in Fig. 66 because direct dijet
production is dominated by γg → qq at these pT while the valence distribution entering
the γq → γq does not drop as rapidly at large x2 as the gluon distribution. When the
turnover at large negative y1 occurs, it is steeper than for the dijets. However, it drops
even more steeply at forward y1 because the quark distribution is smaller than the gluon
at low x2. When pT > 100 GeV, the γ+jet y1 distribution is narrower than the dijets
since the quark distributions drop faster with increasing x2 at high pT .
The shadowing ratios as a function of y1 are shown in Fig. 75. They exhibit some
interesting differences from their dijet counterparts in Fig. 67 because of the different
production channels. At pT > 10 GeV, the antishadowing peak is lower at y1 ∼ −2.5 and
the shadowing is larger at y1 > 0. Although this may seem counter-intuitive, comparing
the valence and sea quark shadowing ratios in Fig. 55 can explain this effect. Valence
129
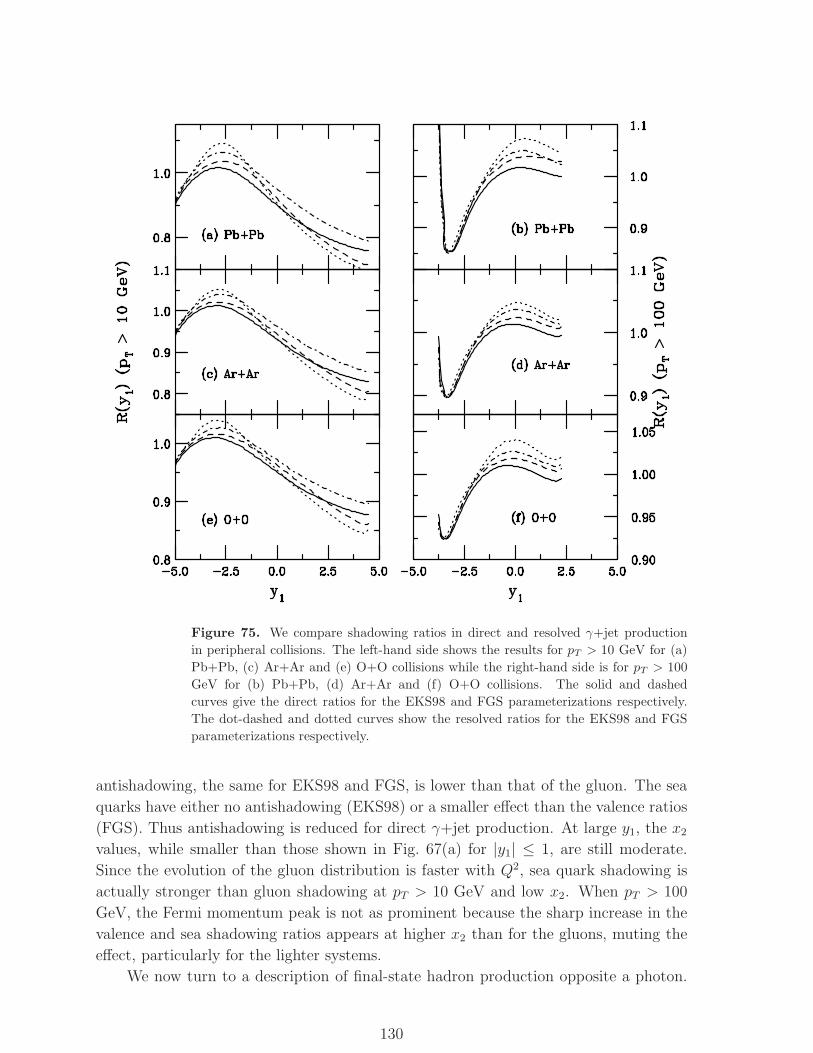
Figure 75. We compare shadowing ratios in direct and resolved γ+jet production
in peripheral collisions. The left-hand side shows the results for pT > 10 GeV for (a)
Pb+Pb, (c) Ar+Ar and (e) O+O collisions while the right-hand side is for pT > 100
GeV for (b) Pb+Pb, (d) Ar+Ar and (f) O+O collisions. The solid and dashed
curves give the direct ratios for the EKS98 and FGS parameterizations respectively.
The dot-dashed and dotted curves show the resolved ratios for the EKS98 and FGS
parameterizations respectively.
antishadowing, the same for EKS98 and FGS, is lower than that of the gluon. The sea
quarks have either no antishadowing (EKS98) or a smaller effect than the valence ratios
(FGS). Thus antishadowing is reduced for direct γ+jet production. At large y1, the x2
values, while smaller than those shown in Fig. 67(a) for |y1| ≤ 1, are still moderate.
Since the evolution of the gluon distribution is faster with Q2, sea quark shadowing is
actually stronger than gluon shadowing at pT > 10 GeV and low x2. When pT > 100
GeV, the Fermi momentum peak is not as prominent because the sharp increase in the
valence and sea shadowing ratios appears at higher x2 than for the gluons, muting the
effect, particularly for the lighter systems.
We now turn to a description of final-state hadron production opposite a photon.
130
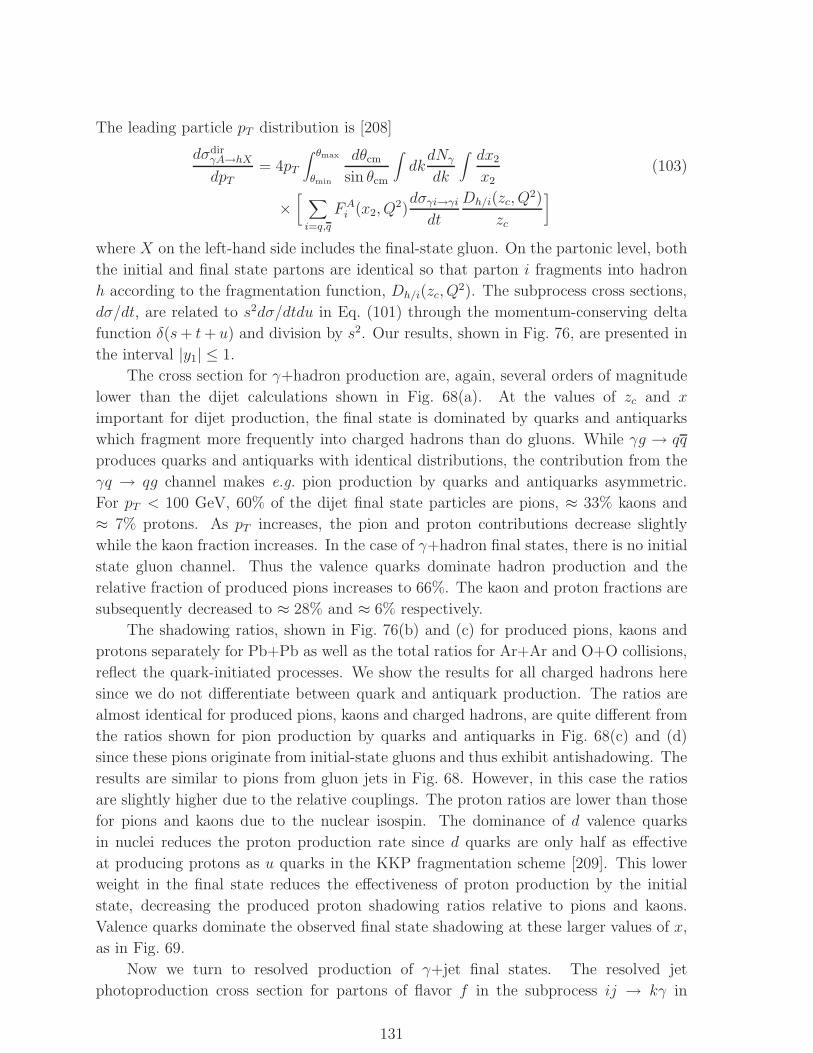
The leading particle pT distribution is [208]
dσdirγA→hX
dpT= 4pT
∫ θmax
θmin
dθcmsin θcm
∫dkdNγ
dk
∫ dx2
x2(103)
×[ ∑
i=q,q
FAi (x2, Q
2)dσγi→γidt
Dh/i(zc, Q2)
zc
]
where X on the left-hand side includes the final-state gluon. On the partonic level, both
the initial and final state partons are identical so that parton i fragments into hadron
h according to the fragmentation function, Dh/i(zc, Q2). The subprocess cross sections,
dσ/dt, are related to s2dσ/dtdu in Eq. (101) through the momentum-conserving delta
function δ(s+ t+ u) and division by s2. Our results, shown in Fig. 76, are presented in
the interval |y1| ≤ 1.
The cross section for γ+hadron production are, again, several orders of magnitude
lower than the dijet calculations shown in Fig. 68(a). At the values of zc and x
important for dijet production, the final state is dominated by quarks and antiquarks
which fragment more frequently into charged hadrons than do gluons. While γg → qq
produces quarks and antiquarks with identical distributions, the contribution from the
γq → qg channel makes e.g. pion production by quarks and antiquarks asymmetric.
For pT < 100 GeV, 60% of the dijet final state particles are pions, ≈ 33% kaons and
≈ 7% protons. As pT increases, the pion and proton contributions decrease slightly
while the kaon fraction increases. In the case of γ+hadron final states, there is no initial
state gluon channel. Thus the valence quarks dominate hadron production and the
relative fraction of produced pions increases to 66%. The kaon and proton fractions are
subsequently decreased to ≈ 28% and ≈ 6% respectively.
The shadowing ratios, shown in Fig. 76(b) and (c) for produced pions, kaons and
protons separately for Pb+Pb as well as the total ratios for Ar+Ar and O+O collisions,
reflect the quark-initiated processes. We show the results for all charged hadrons here
since we do not differentiate between quark and antiquark production. The ratios are
almost identical for produced pions, kaons and charged hadrons, are quite different from
the ratios shown for pion production by quarks and antiquarks in Fig. 68(c) and (d)
since these pions originate from initial-state gluons and thus exhibit antishadowing. The
results are similar to pions from gluon jets in Fig. 68. However, in this case the ratios
are slightly higher due to the relative couplings. The proton ratios are lower than those
for pions and kaons due to the nuclear isospin. The dominance of d valence quarks
in nuclei reduces the proton production rate since d quarks are only half as effective
at producing protons as u quarks in the KKP fragmentation scheme [209]. This lower
weight in the final state reduces the effectiveness of proton production by the initial
state, decreasing the produced proton shadowing ratios relative to pions and kaons.
Valence quarks dominate the observed final state shadowing at these larger values of x,
as in Fig. 69.
Now we turn to resolved production of γ+jet final states. The resolved jet
photoproduction cross section for partons of flavor f in the subprocess ij → kγ in
131
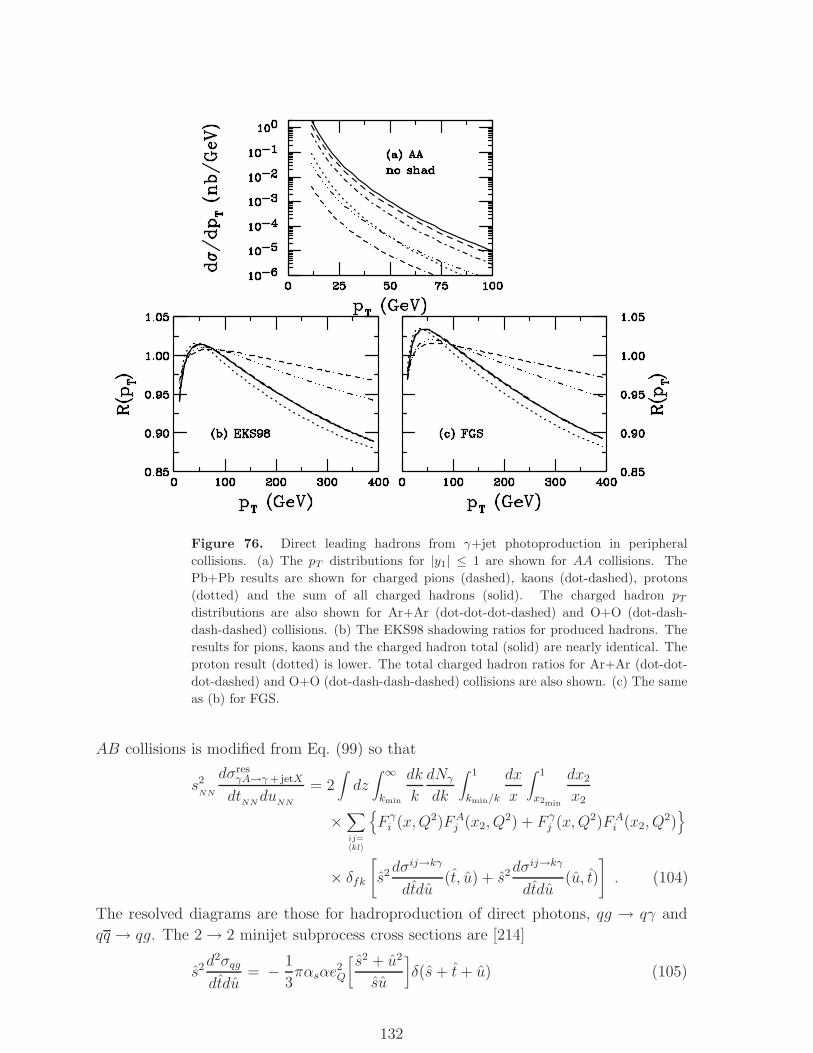
Figure 76. Direct leading hadrons from γ+jet photoproduction in peripheral
collisions. (a) The pT distributions for |y1| ≤ 1 are shown for AA collisions. The
Pb+Pb results are shown for charged pions (dashed), kaons (dot-dashed), protons
(dotted) and the sum of all charged hadrons (solid). The charged hadron pTdistributions are also shown for Ar+Ar (dot-dot-dot-dashed) and O+O (dot-dash-
dash-dashed) collisions. (b) The EKS98 shadowing ratios for produced hadrons. The
results for pions, kaons and the charged hadron total (solid) are nearly identical. The
proton result (dotted) is lower. The total charged hadron ratios for Ar+Ar (dot-dot-
dot-dashed) and O+O (dot-dash-dash-dashed) collisions are also shown. (c) The same
as (b) for FGS.
AB collisions is modified from Eq. (99) so that
s2NN
dσresγA→γ+ jetX
dtNNdu
NN
= 2∫dz∫ ∞
kmin
dk
k
dNγ
dk
∫ 1
kmin/k
dx
x
∫ 1
x2min
dx2
x2
×∑
ij=〈kl〉
{F γi (x,Q2)FA
j (x2, Q2) + F γ
j (x,Q2)FAi (x2, Q
2)}
× δfk
[s2dσ
ij→kγ
dtdu(t, u) + s2dσ
ij→kγ
dtdu(u, t)
]. (104)
The resolved diagrams are those for hadroproduction of direct photons, qg → qγ and
qq → qg. The 2 → 2 minijet subprocess cross sections are [214]
s2d2σqg
dtdu= − 1
3παsαe
2Q
[s2 + u2
su
]δ(s+ t+ u) (105)
132
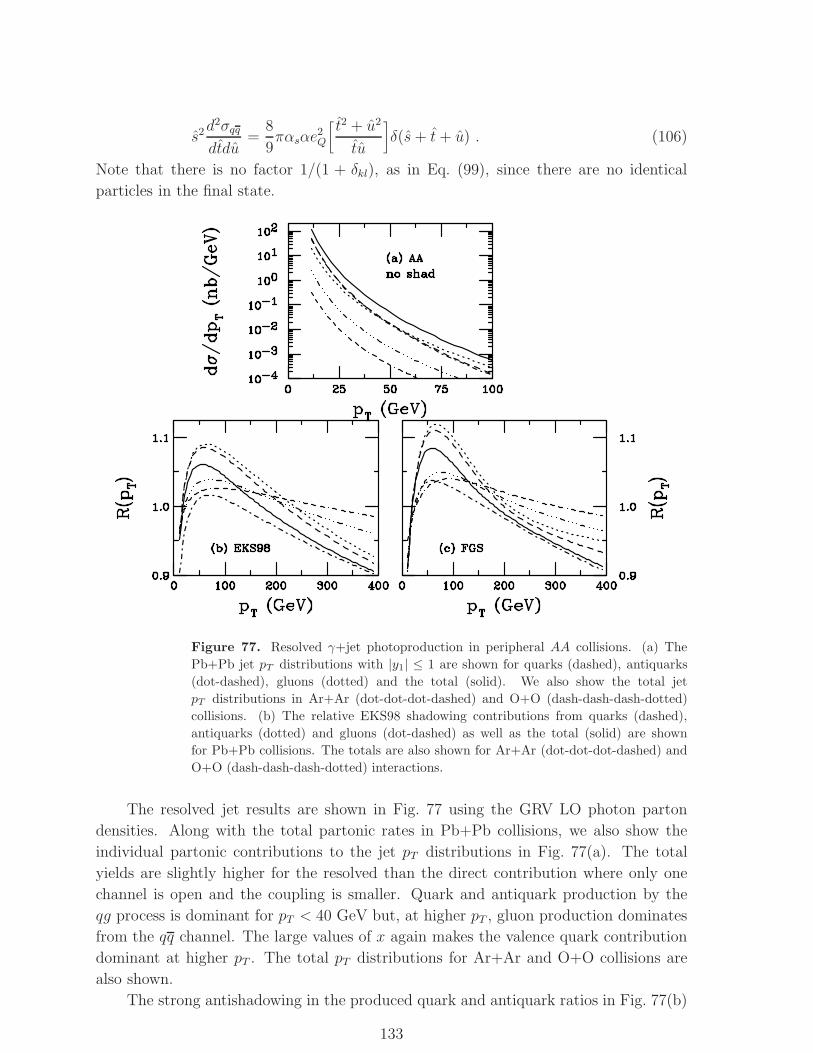
s2d2σqq
dtdu=
8
9παsαe
2Q
[t2 + u2
tu
]δ(s+ t+ u) . (106)
Note that there is no factor 1/(1 + δkl), as in Eq. (99), since there are no identical
particles in the final state.
Figure 77. Resolved γ+jet photoproduction in peripheral AA collisions. (a) The
Pb+Pb jet pT distributions with |y1| ≤ 1 are shown for quarks (dashed), antiquarks
(dot-dashed), gluons (dotted) and the total (solid). We also show the total jet
pT distributions in Ar+Ar (dot-dot-dot-dashed) and O+O (dash-dash-dash-dotted)
collisions. (b) The relative EKS98 shadowing contributions from quarks (dashed),
antiquarks (dotted) and gluons (dot-dashed) as well as the total (solid) are shown
for Pb+Pb collisions. The totals are also shown for Ar+Ar (dot-dot-dot-dashed) and
O+O (dash-dash-dash-dotted) interactions.
The resolved jet results are shown in Fig. 77 using the GRV LO photon parton
densities. Along with the total partonic rates in Pb+Pb collisions, we also show the
individual partonic contributions to the jet pT distributions in Fig. 77(a). The total
yields are slightly higher for the resolved than the direct contribution where only one
channel is open and the coupling is smaller. Quark and antiquark production by the
qg process is dominant for pT < 40 GeV but, at higher pT , gluon production dominates
from the qq channel. The large values of x again makes the valence quark contribution
dominant at higher pT . The total pT distributions for Ar+Ar and O+O collisions are
also shown.
The strong antishadowing in the produced quark and antiquark ratios in Fig. 77(b)
133
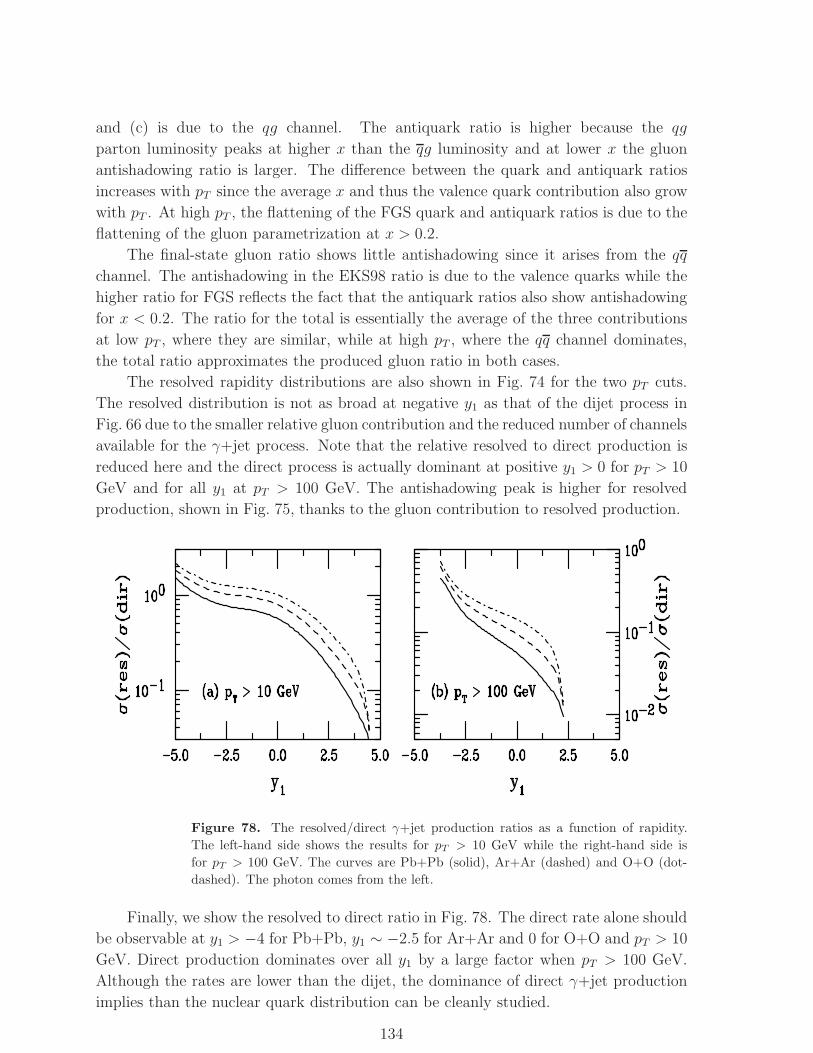
and (c) is due to the qg channel. The antiquark ratio is higher because the qg
parton luminosity peaks at higher x than the qg luminosity and at lower x the gluon
antishadowing ratio is larger. The difference between the quark and antiquark ratios
increases with pT since the average x and thus the valence quark contribution also grow
with pT . At high pT , the flattening of the FGS quark and antiquark ratios is due to the
flattening of the gluon parametrization at x > 0.2.
The final-state gluon ratio shows little antishadowing since it arises from the qq
channel. The antishadowing in the EKS98 ratio is due to the valence quarks while the
higher ratio for FGS reflects the fact that the antiquark ratios also show antishadowing
for x < 0.2. The ratio for the total is essentially the average of the three contributions
at low pT , where they are similar, while at high pT , where the qq channel dominates,
the total ratio approximates the produced gluon ratio in both cases.
The resolved rapidity distributions are also shown in Fig. 74 for the two pT cuts.
The resolved distribution is not as broad at negative y1 as that of the dijet process in
Fig. 66 due to the smaller relative gluon contribution and the reduced number of channels
available for the γ+jet process. Note that the relative resolved to direct production is
reduced here and the direct process is actually dominant at positive y1 > 0 for pT > 10
GeV and for all y1 at pT > 100 GeV. The antishadowing peak is higher for resolved
production, shown in Fig. 75, thanks to the gluon contribution to resolved production.
Figure 78. The resolved/direct γ+jet production ratios as a function of rapidity.
The left-hand side shows the results for pT > 10 GeV while the right-hand side is
for pT > 100 GeV. The curves are Pb+Pb (solid), Ar+Ar (dashed) and O+O (dot-
dashed). The photon comes from the left.
Finally, we show the resolved to direct ratio in Fig. 78. The direct rate alone should
be observable at y1 > −4 for Pb+Pb, y1 ∼ −2.5 for Ar+Ar and 0 for O+O and pT > 10
GeV. Direct production dominates over all y1 by a large factor when pT > 100 GeV.
Although the rates are lower than the dijet, the dominance of direct γ+jet production
implies than the nuclear quark distribution can be cleanly studied.
134

The leading particle pT distributions of jets from γ+jet production are
dσresγA→γ+hX
dpT= 4pT
∫ θmax
θmin
dθcmsin θcm
∫ ∞
kmin
dk
k
dNγ
dk
∫ 1
kmin/k
dx
x
∫ 1
x2min
dx2
x2
×∑
ij=〈kl〉
{F γi (x,Q2)FA
j (x2, Q2) + F γ
j (x,Q2)FAi (x2, Q
2)}
× δfk
[dσ
dt
ij→kγ
(t, u) +dσ
dt
ij→kγ
(u, t)
]Dh/k(zc, Q
2)
zc. (107)
The subprocess cross sections, dσ/dt, are related to s2dσ/dtdu in Eq. (104) through the
momentum-conserving delta function δ(s+ t+ u) and division by s2.
The resolved pT distributions for hadrons are shown in Fig. 79(a). Note that the
resolved cross section for leading hadron production is similar to direct production,
shown in Fig. 76(a). The same effect is seen for dijet production in Figs. 72 and 68.
The shadowing ratios are shown in Fig. 79. The difference between the shadowing
ratios for pions produced by quarks and antiquarks is rather large and reflects both
gluon antishadowing at low pT as well as the relative valence to sea contributions for
quark and antiquark production through q(q)g → q(q)γ. In the FGS calculations, the
antiquark ratio reflects the flattening of the antiquark and gluon ratios at x > 0.2. Since
pions produced by gluons come from the qq → γg channel alone, only a small effect is
seen, primarily in the EMC region. Now the total pion rates follow those for quark and
antiquark producing final-state pions than gluon.
Although our pT -dependent calculations have focused on the midrapidity region
of |y1| ≤ 1, we have shown that extending the rapidity coverage could lead to greater
sensitivity to the small x2 region and larger contributions from direct photoproduction,
especially at low pT .
Thus γ+jet production is a good way to measure the nuclear quark distribution
functions. Direct photoproduction is dominant at central rapidities for moderate values
of pT . Final-state hadron production is somewhat larger for direct production so that,
even if the rates are low, the results will be relatively clean.
4.5. Uncertainties
There are a number of uncertainties in our results. All our calculations are at leading
order so that there is some uncertainty in the total rate, see Refs. [141, 200]. Some
uncertainty also arises from the scale dependence, both in the parton densities and in
the fragmentation functions. The fragmentation functions at large zc also introduce
uncontrollable uncertainties in the rates. Hopefully more data will bring the parton
densities in the photon, proton and nucleus under better control before the LHC begins
operation. The data from RHIC also promises to bring the fragmentation functions
under better control in the near future.
While the photon flux is also an uncertainty, it can be determined experimentally.
The hadronic interaction probability near the minimum radius depends on the matter
distribution in the nucleus. Our calculations use Woods-Saxon distributions with
135
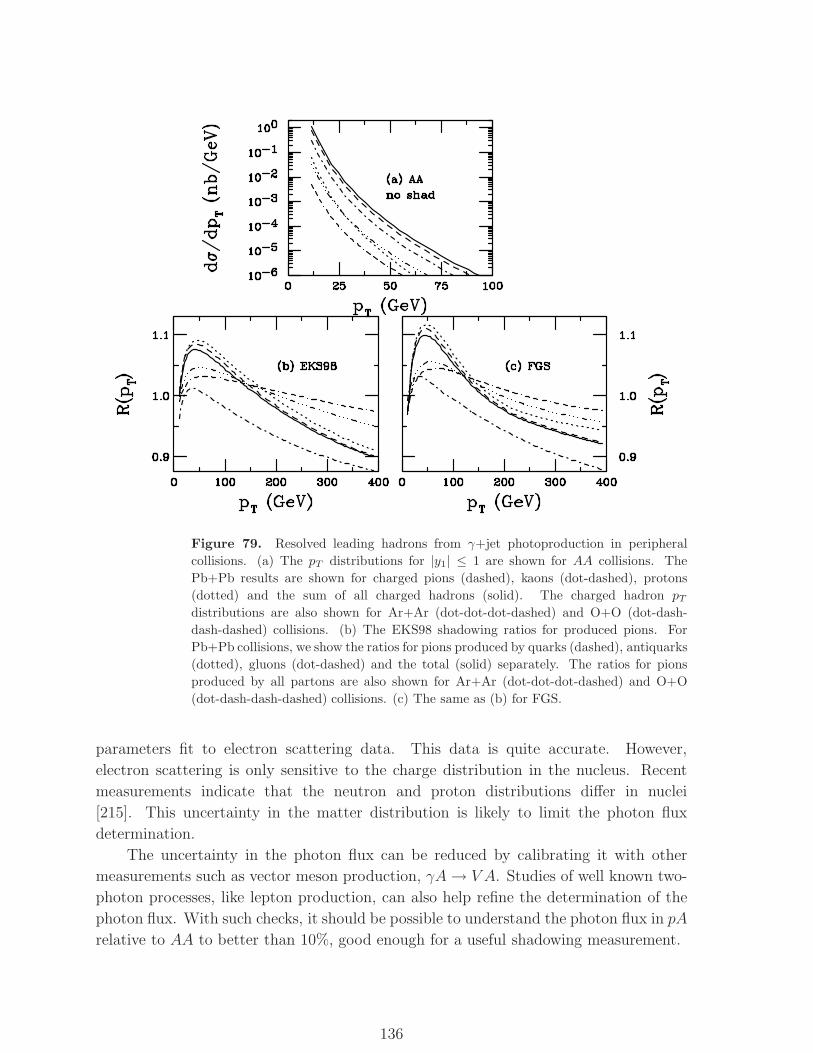
Figure 79. Resolved leading hadrons from γ+jet photoproduction in peripheral
collisions. (a) The pT distributions for |y1| ≤ 1 are shown for AA collisions. The
Pb+Pb results are shown for charged pions (dashed), kaons (dot-dashed), protons
(dotted) and the sum of all charged hadrons (solid). The charged hadron pTdistributions are also shown for Ar+Ar (dot-dot-dot-dashed) and O+O (dot-dash-
dash-dashed) collisions. (b) The EKS98 shadowing ratios for produced pions. For
Pb+Pb collisions, we show the ratios for pions produced by quarks (dashed), antiquarks
(dotted), gluons (dot-dashed) and the total (solid) separately. The ratios for pions
produced by all partons are also shown for Ar+Ar (dot-dot-dot-dashed) and O+O
(dot-dash-dash-dashed) collisions. (c) The same as (b) for FGS.
parameters fit to electron scattering data. This data is quite accurate. However,
electron scattering is only sensitive to the charge distribution in the nucleus. Recent
measurements indicate that the neutron and proton distributions differ in nuclei
[215]. This uncertainty in the matter distribution is likely to limit the photon flux
determination.
The uncertainty in the photon flux can be reduced by calibrating it with other
measurements such as vector meson production, γA→ V A. Studies of well known two-
photon processes, like lepton production, can also help refine the determination of the
photon flux. With such checks, it should be possible to understand the photon flux in pA
relative to AA to better than 10%, good enough for a useful shadowing measurement.
136
5. Small x physics in UPCs
5.1. Identification of the QCD black disc regime
Contributed by: L. Frankfurt and M. Strikman
5.1.1. The black disk regime of nuclear scattering A number of new, challenging QCD
phenomena are related to the rapid increase of the gluon densities with decreasing x. As
a result, the total inelastic cross section of the interaction of a small color singlet dipole
with the target, given by Eq. (7) for LO pQCD, rapidly increases with incident energy.
The increase in gluon density was directly observed in J/ψ photo/electroproduction at
HERA which found, as predicted by pQCD, σqqNin (s(qq)N , d ∼ 0.3 fm) ∝ s0.2(qq)N where
d ∼ 0.3 fm is a typical dipole size for J/ψ production. In addition, the proton structure
function, evaluated to NLO in a resummed series in αs ln(x0/x) where x0 is the starting
point for evolution in x, increases similar to NLO DGLAP evolution for the energies
studied so far [162]. Thus pQCD predicts that the hard cross section should increase
rapidly with energy.
The increase in σin must be reduced at sufficiently high energies to prevent the
elastic cross section, proportional to σ2tot/R
2A, from exceeding σtot [48, 152]. Quantitative
analyses show that the BDR should be reached in the ladder kinematics where the
rapidity interval between gluon rungs on the ladder is large (multi-Regge kinematics)
so that NLL calculations are sufficient in pQCD. The relatively rapid onset of the BDR
follows primarily from the large input hadron (nucleus) gluon distribution at the non-
perturbative starting scale for QCD evolution, a consequence of spontaneously broken
chiral symmetry and confinement. The predicted increase of the cross section with
energy leads to complete absorption of the qq components of the photon wavefunction
at small impact parameters. The components of the photon wavefunction with b > RA
produce a diffractive final state, calculable in the strongly-absorptive, small-coupling
QCD regime. The absolute values and forms of these amplitudes naturally follow from
the complete absorption in the BDR.
A variety of experimental observables with unambiguous predictions in the BDR
[44] will be discussed below. One example is the structure functions in the limit x→ 0:
F h2 (x,Q2) = cQ2 ln3(x0/x) where c should be identical for hadrons and nuclei [216].
Note that BDR contribution is parametrically larger at high Q2 than both the non-
perturbative QCD result and the regime where pQCD evolution is valid with F p2 ∝ Q.
The dominance of the BDR contribution explains why it is possible to evaluate the
structure functions in the BDR without a quantitative understanding of the non-
perturbative contributions at Q ∼ ΛQCD. At realistic energies, the universality of the
structure functions may only be achieved at small impact parameters.
Another BDR prediction is the increase of the photo-absorption cross section with
energy as c ln3(s(qq)N/s0) where c is calculable in QCD. Thus QCD predicts a stronger
energy dependence of the photo-absorption cross section than that of the Froissart bound
137
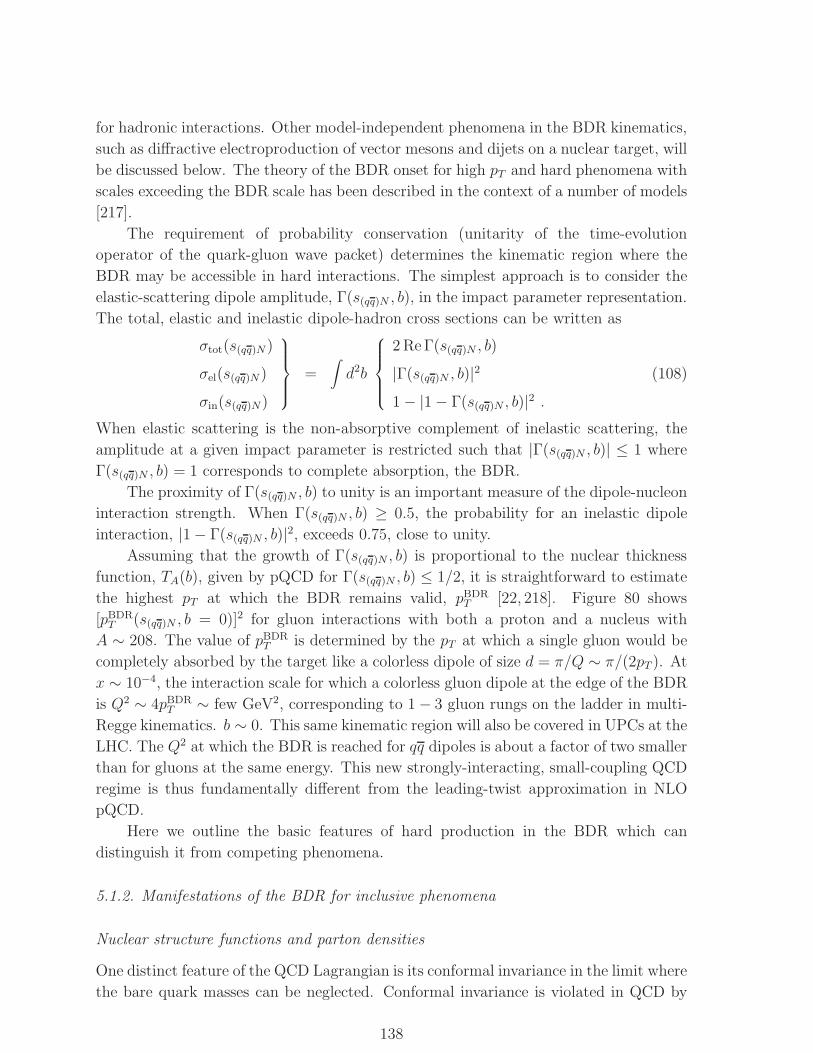
for hadronic interactions. Other model-independent phenomena in the BDR kinematics,
such as diffractive electroproduction of vector mesons and dijets on a nuclear target, will
be discussed below. The theory of the BDR onset for high pT and hard phenomena with
scales exceeding the BDR scale has been described in the context of a number of models
[217].
The requirement of probability conservation (unitarity of the time-evolution
operator of the quark-gluon wave packet) determines the kinematic region where the
BDR may be accessible in hard interactions. The simplest approach is to consider the
elastic-scattering dipole amplitude, Γ(s(qq)N , b), in the impact parameter representation.
The total, elastic and inelastic dipole-hadron cross sections can be written as
σtot(s(qq)N )
σel(s(qq)N )
σin(s(qq)N)
=
∫d2b
2 ReΓ(s(qq)N , b)
|Γ(s(qq)N , b)|2
1 − |1 − Γ(s(qq)N , b)|2 .(108)
When elastic scattering is the non-absorptive complement of inelastic scattering, the
amplitude at a given impact parameter is restricted such that |Γ(s(qq)N , b)| ≤ 1 where
Γ(s(qq)N , b) = 1 corresponds to complete absorption, the BDR.
The proximity of Γ(s(qq)N , b) to unity is an important measure of the dipole-nucleon
interaction strength. When Γ(s(qq)N , b) ≥ 0.5, the probability for an inelastic dipole
interaction, |1 − Γ(s(qq)N , b)|2, exceeds 0.75, close to unity.
Assuming that the growth of Γ(s(qq)N , b) is proportional to the nuclear thickness
function, TA(b), given by pQCD for Γ(s(qq)N , b) ≤ 1/2, it is straightforward to estimate
the highest pT at which the BDR remains valid, pBDRT [22, 218]. Figure 80 shows
[pBDRT (s(qq)N , b = 0)]2 for gluon interactions with both a proton and a nucleus with
A ∼ 208. The value of pBDRT is determined by the pT at which a single gluon would be
completely absorbed by the target like a colorless dipole of size d = π/Q ∼ π/(2pT ). At
x ∼ 10−4, the interaction scale for which a colorless gluon dipole at the edge of the BDR
is Q2 ∼ 4pBDRT ∼ few GeV2, corresponding to 1 − 3 gluon rungs on the ladder in multi-
Regge kinematics. b ∼ 0. This same kinematic region will also be covered in UPCs at the
LHC. The Q2 at which the BDR is reached for qq dipoles is about a factor of two smaller
than for gluons at the same energy. This new strongly-interacting, small-coupling QCD
regime is thus fundamentally different from the leading-twist approximation in NLO
pQCD.
Here we outline the basic features of hard production in the BDR which can
distinguish it from competing phenomena.
5.1.2. Manifestations of the BDR for inclusive phenomena
Nuclear structure functions and parton densities
One distinct feature of the QCD Lagrangian is its conformal invariance in the limit where
the bare quark masses can be neglected. Conformal invariance is violated in QCD by
138
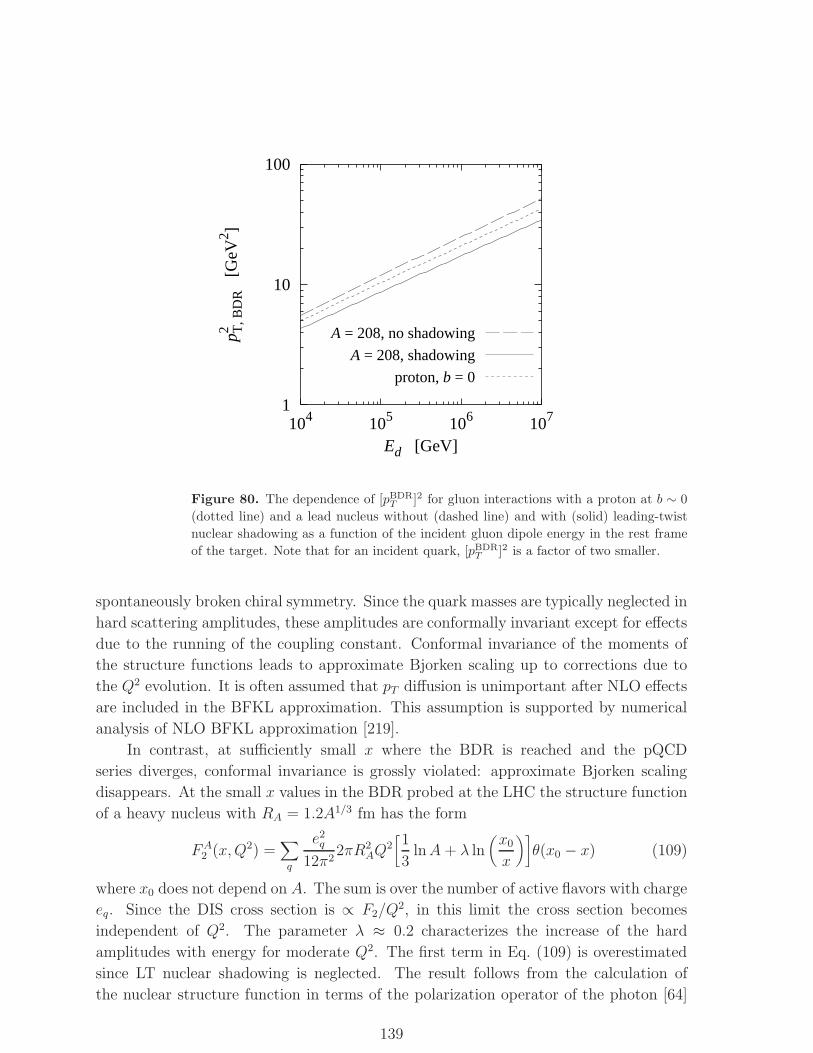
1
10
100
104 105 106 107
p2 T, B
DR
[G
eV2 ]
Ed [GeV]
A = 208, no shadowing
A = 208, shadowing
proton, b = 0
Figure 80. The dependence of [pBDRT ]2 for gluon interactions with a proton at b ∼ 0
(dotted line) and a lead nucleus without (dashed line) and with (solid) leading-twist
nuclear shadowing as a function of the incident gluon dipole energy in the rest frame
of the target. Note that for an incident quark, [pBDRT ]2 is a factor of two smaller.
spontaneously broken chiral symmetry. Since the quark masses are typically neglected in
hard scattering amplitudes, these amplitudes are conformally invariant except for effects
due to the running of the coupling constant. Conformal invariance of the moments of
the structure functions leads to approximate Bjorken scaling up to corrections due to
the Q2 evolution. It is often assumed that pT diffusion is unimportant after NLO effects
are included in the BFKL approximation. This assumption is supported by numerical
analysis of NLO BFKL approximation [219].
In contrast, at sufficiently small x where the BDR is reached and the pQCD
series diverges, conformal invariance is grossly violated: approximate Bjorken scaling
disappears. At the small x values in the BDR probed at the LHC the structure function
of a heavy nucleus with RA = 1.2A1/3 fm has the form
FA2 (x,Q2) =
∑
q
e2q12π2
2πR2AQ
2[1
3lnA + λ ln
(x0
x
)]θ(x0 − x) (109)
where x0 does not depend on A. The sum is over the number of active flavors with charge
eq. Since the DIS cross section is ∝ F2/Q2, in this limit the cross section becomes
independent of Q2. The parameter λ ≈ 0.2 characterizes the increase of the hard
amplitudes with energy for moderate Q2. The first term in Eq. (109) is overestimated
since LT nuclear shadowing is neglected. The result follows from the calculation of
the nuclear structure function in terms of the polarization operator of the photon [64]
139

modified to include color transparency. The structure function increase should change
at asymptotically large energies where the interaction radius significantly exceeds RA,
FA2 (x,Q2) =
∑
q
e2q12π2
2πR2AQ
2 ln(x0
x
)θ(x0 − x) . (110)
The nuclear gluon density in the BDR, where the LT approximation breaks down,
can be defined from the Higgs-hadron scattering cross section because the Higgs locally
couples to two gluons. In the kinematics where the gluon-dipole interaction is in the
BDR, at moderately small x, the gluon distribution is [152]
xgA(x,Q2) =1
12π22πR2
AQ2[1
3lnA + λ ln
(x0
x
)]θ(x0 − x) . (111)
Although the effect of color transparency was not taken into account in Ref. [152], it is
included in Eq. (111).
Nucleon structure functions and the total γN cross section
In a nucleon, the onset of the BDR is accompanied by a fast increase of the interaction
radius due to the steep decrease of nucleon density with impact parameter. As a result,
R2N(eff) = R2
N + c ln2(x0/x) , (112)
leading to
FN2 ∝ ln3
(x0
x
), σγN ∝ ln3
(sγNs0
). (113)
A similar phenomenon occurs only at extremely high energies in nuclei. The calculation
of c in Eq. (112) remains model dependent except at ultrahigh energies where RA and
RN are determined by pion exchange. Hence the total γN cross section should grow
faster with energy than the NN cross section. The same is true for nuclei. Since the
energy increase is faster for a nucleon target, the ratio σγAtot/AσγNtot , characterizing nuclear
shadowing, should decrease with energy. The fraction of the cross section due to heavy
flavor production should then increase, asymptotically reaching the SU(4)/SU(5) limit.
Inclusive jet and hadron production
Since partons with pT ≤ pBDRT cannot propagate through nuclei without inelastic
interactions, losing a significant fraction of their initial energy and broadening the pTdistribution [147], we expect leading-hadron suppression, similar to that observed in
d+Au interactions at RHIC [220]. The suppression strongly enhances scattering off the
nuclear edge, resulting in back-to-back correlations between high pT particles at central
and forward rapidities. To study the b dependence of this correlation, a centrality trigger
is necessary, along with the inclusive asymmetry observables defined in Ref. [147]. The
suppression of the correlation is small if the rapidity difference between the two jets is
large [147]. It is also possible to study similar effects for leading charm production since
pBDRT ≥ mc.
140
The rise of the dijet cross section is expected to slow for pT ≤ pBDRT . A similar
decrease should be observed for back-to-back pions. As shown in Ref. [31] and in
Section 4, such studies will be feasible for 5 × 10⁻⁵ ≤ x ≤ 10−2.
5.1.3. Diffractive phenomena
Inclusive diffraction
Diffraction in the BDR emerges from the complementary components of the photon
wavefunction that are not fully absorbed at b ≤ RA. Thus it directly reflects the photon
wavefunction at the BDR resolution scale. The diffractive cross section should constitute
about half the total cross section. The difference from this limit is due to nuclear edge
effects. Gribov’s orthogonality argument for the derivation of the total cross section can
be used to derive Eq. (65), the BDR expression for the real photon cross section as a
function of invariant mass M [44], qualitatively different from pQCD.
Dijet production dominates diffraction in the BDR. Corrections arise from three jet
production as in e+e− → qqg. Dijet production is also strongly suppressed within the
LT approximation where the cross section is proportional to 1/p8T . Within the BDR,
the jet cross section is proportional to A2/3 and decreases as 1/(−t) = 1/p2T , as shown
in Eq. (65).
Vector meson production
The same approach gives the vector meson production cross section in the BDR,
corresponding to diagonal vector meson dominance with a total cross section of 2πR2A,
dσγA→V Adt
=3ΓV→e+e−
αMV
(2πR2A)2
16π
4∣∣∣J1(
√−tRA)
∣∣∣2
−tR2A
(114)
where the first factor is equivalent to |CV |2 in Eq. (16). The vector meson cross section
in Eq. (114) decreases as 1/M4V with −t ∼ M2
V since ΓV→e+e− ∼ 1/MV while in the
DGLAP regime the cross section decreases more rapidly as M−8V . The different MV
dependencies are reminiscent of the change in the Q2 dependence of coherent vector
meson production from σL ∝ 1/Q6, σT ∝ 1/Q8 to σL ∝ 1/Q2, σT ∝ 1/Q4 in the BDR
[44]. The A dependence of the t-integrated cross section also changes from A4/3 to A2/3,
see Eq. (114).
As discussed in Section 2.5, it will be difficult to push measurements of the coherent
vector meson cross sections in AA collisions to sγN ≥ 2ENMV at y = 0 because
it is impossible to distinguish which nucleus emitted the photon. However, in pA
interactions, the γp contribution is much bigger than the γA, making identification
simpler, see Section 2.4.
There are two other ways to study the interaction of small dipoles up to WγN ∼ 1
TeV in the BDR. One is vector meson production in incoherent diffraction which
should change from σ ∝ A to σ ∝ A1/3. Another is high t vector meson production
141
in rapidity-gap events where a transition from the linear A dependence of color
transparency to the A1/3 dependence in the BDR is expected. The slope of the t
dependence of hard diffractive production by nucleons should rapidly increase with
energy, B = B0 + c ln2(1/x) in the BDR kinematics.
5.2. Testing saturation physics in ultraperipheral collisions
Contributed by: F. Gelis and U. A. Wiedemann
Parton saturation is a phenomenon generically expected in hadronic collisions at
sufficiently high center-of-mass energy. Within perturbative QCD, the linear evolution
equation derived by Balitsky, Fadin, Kuraev and Lipatov [221, 222] describes the growth
of the unintegrated gluon distribution in a hadron as it is boosted towards higher
rapidities. This BFKL evolution formalizes the picture that large-x partons in a hadronic
wavefunction are sources for small-x partons. In the BFKL evolution, these small-x
contributions are generated by splitting processes such as g → gg which radiate into
the phase space region newly opened up by the boost. This linear evolution leads to
untamed growth of the parton density with log x. It also leads to a power-like growth
of hadronic cross sections with√s, known to violate unitarity at ultra-high
√s.
As first noted by Gribov, Levin and Ryskin [223], at sufficiently high parton density,
nonlinear recombination processes such as gg → g cannot be neglected. These processes
tame further growth of the parton distributions: a saturation mechanism of some
kind must set in. Treating the partons as ordinary particles, it is possible to make
a crude estimate of the onset of saturation from a simple mean-free path argument.
The recombination cross section for a gluon with transverse momentum Q is
σ ∼ αs(Q2)
Q2(115)
while the number of gluons per unit transverse area is given by
ρ ∼ xg(x,Q2)
πr2h
, (116)
where rh is the radius of the hadron and x the momentum fraction of the gluons.
Saturation sets in when ρσ ∼ 1, or equivalently for:
Q2 = Q2s ∼ αs(Q
2s)ρ ∼ αs(Q
2s)xg(x,Q2
s)
πR2A
. (117)
The momentum scale that characterizes this new regime, Qs, is called the saturation
momentum [224]. Partons with transverse momentum Q > Qs are in a dilute regime;
those with Q < Qs are in the saturated regime. Most generally, Qs characterizes the
scale at which nonlinear QCD effects become important. In the high energy limit,
contributions from different nucleons in a nucleus act coherently. For large nuclei, one
thus expects Q2s ∝ αs(Q
2s)A
1/3. Another important parametric characterization of the
saturated region is obtained by estimating the number of partons occupying a small
disk of radius 1/Qs in the transverse plane. Combining Eqs. (116) and (117) shows that
the number is proportional to 1/αs. This is the parametrically large occupation number
142
of a classical field, supporting the idea that classical background field methods become
relevant for describing nuclear wavefunctions at small x.
Within the last two decades, the qualitative arguments given above have been
significantly substantiated. A more refined argument for the onset of saturation was
given in Ref. [225] where recombination is associated with a higher-twist correction
to the DGLAP equation. Early estimates of Qs in nucleus-nucleus collisions [226] do
not differ much from more modern ones [227]. Finally, over the last decade, nonlinear
equations have been obtained which follow the evolution of the partonic systems from
the dilute regime to the dense, saturated, regime. These take different, equivalent,
forms, generically referred to as the JIMWLK equation. The resulting calculational
framework is also referred to as the color glass condensate (CGC) formalism.
5.2.1. The JIMWLK equation In the original McLerran and Venugopalan model [41,
228, 229], the fast partons are frozen, Lorentz-contracted color sources flying along the
light-cone, constituting a color charge density ρ(xT ). Conversely, the low x partons
are described by classical gauge fields, Aµ(x), determined by solving the Yang-Mills
equations with the source given by the frozen partonic configuration. An average over
all acceptable configurations must be performed.
The weight of a given configuration is a functional Wx0[ρ] of the density ρ which
depends on the separation scale x0 between the modes which are described as frozen
sources and the modes which are described as dynamical fields. As one lowers this
separation scale, more and more modes are included among the frozen sources. Therefore
the functional Wx0evolves with x0 according to a renormalization group equation [230–
239].
The evolution equation for Wx0[ρ], the so-called JIMWLK equation, derived in
Refs. [230–239], is
∂Wx0[ρ]
∂ ln(1/x0)=
1
2
∫d2xTd
2yTδ
δρa(~xT )
[χab(~xT , ~yT )
δWx0[ρ]
δρb(~yT )
]. (118)
The kernel, χab(~xT , ~yT ), only depends on ρ via Wilson lines,
U(~xT ) ≡ P exp[−ig
∫ +∞
−∞dz−A+(z−, ~xT )
](119)
where P denotes path ordering along the x− axis and A+ is the classical color field of
the hadron moving close to the speed of light in the +z direction. The field A+ depends
implicitly on the frozen sources, i.e. on ρ(~xT ).
The JIMWLK equation can be rewritten as an infinite hierarchy of equations for ρ,
or equivalently U correlation functions. For example, the correlator Tr〈U †(~xT )U(~yT )〉of two Wilson lines has an evolution equation that involves a correlator of four Wilson
lines. If this 4-point correlator is assumed to be factorisable into the product of two
2-point functions, a closed equation for the 2-point function, the Balitsky-Kovchegov
143
(BK) [232, 234] equation, is obtained,
∂Tr〈U †(~xT )U(~yT )〉x0
∂ ln(1/x0)= − αs
2π2
∫d2zT (~xT − ~yT )2
(~xT − ~zT )2(~yT − ~zT )2(120)
×[NcTr〈U †(~xT )U(~yT )〉x0
− Tr〈U †(~xT )U(~zT )〉x0Tr〈U †(~zT )U(~yT )〉x0
].
The traces in Eq. (120) are performed over color indices.
When the color charge density is small, the Wilson line, U , can be expanded in
powers of ρ. Equation (120) then becomes a linear evolution equation for the correlator
〈ρ(~xT )ρ(~yT )〉x0or, equivalently, for the unintegrated gluon density, the BFKL equation.
The same is true of Eq. (118) because, in this limit, the kernel χab becomes quadratic
in ρ.
Similar to the BFKL or DGLAP evolution equations, the initial condition is a non-
perturbative input which can, in principle, be modeled, adjusting the parameters to fit
experimental data. A simple input is the McLerran and Venugopalan (MV) model with
a local Gaussian for the initial Wx0[ρ],
Wx0[ρ] = exp
[−∫d2xT
ρ(~xT )ρ(~xT )
µ2
]. (121)
Here, we stress that testing the predictions of the CGC requires testing both the
evolution with rapidity and the initial conditions.
The MV model requires an infrared cutoff at the scale ΛQCD
because assuming a local
Gaussian distribution ignores the fact that color neutralization occurs on distance scales
smaller than the nucleon size (∼ Λ−1QCD
): two color densities can only be uncorrelated
if they are transversely separated by at least the distance scale of color neutralization.
Note that the sensitivity to this infrared cutoff gradually disappears as one lowers the
separation scale x0 in the JIMWLK equation. Indeed, in the saturated regime, color
neutralization occurs on distance scales of the order of Q−1s (x0) [240], the physical origin
of the universality of the saturated regime.
5.2.2. Saturation in photon-nucleus collisions High parton density effects can be tested
in photo-nuclear UPCs. Quite generically, the cross section for the process AA→ FX,
where F denotes a specific produced final state and X unidentified debris from the
nucleus, is
σAA→FX(√s
NN) =
∫ +∞
kmin
dkdNγ
dkσγA→FX(sγN = 2k
√s
NN) . (122)
In this formula, sγN = 2k√S
NNis the square of the center-of-mass energy of the γN
system. The minimum photon energy for production of F , kmin, is determined from the
invariant mass squared, M2, of F ,
kmin =M2
2√s
NN
. (123)
In Eq. (122), gluon saturation effects are included in the γA cross section in the integral.
In the next subsection, we discuss the effects of gluon saturation on open QQ production
(detected as D or B mesons).
144
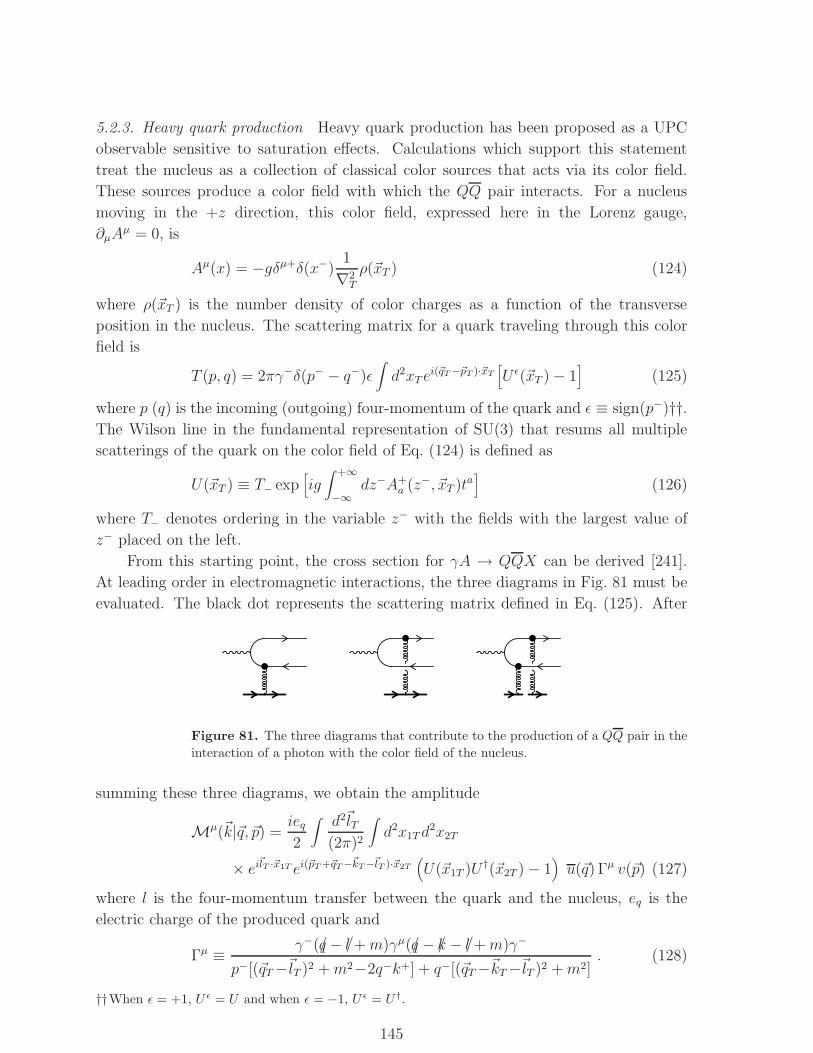
5.2.3. Heavy quark production Heavy quark production has been proposed as a UPC
observable sensitive to saturation effects. Calculations which support this statement
treat the nucleus as a collection of classical color sources that acts via its color field.
These sources produce a color field with which the QQ pair interacts. For a nucleus
moving in the +z direction, this color field, expressed here in the Lorenz gauge,
∂µAµ = 0, is
Aµ(x) = −gδµ+δ(x−)1
∇2T
ρ(~xT ) (124)
where ρ(~xT ) is the number density of color charges as a function of the transverse
position in the nucleus. The scattering matrix for a quark traveling through this color
field is
T (p, q) = 2πγ−δ(p− − q−)ǫ∫d2xT e
i(~qT−~pT )·~xT
[U ǫ(~xT ) − 1
](125)
where p (q) is the incoming (outgoing) four-momentum of the quark and ǫ ≡ sign(p−)††.The Wilson line in the fundamental representation of SU(3) that resums all multiple
scatterings of the quark on the color field of Eq. (124) is defined as
U(~xT ) ≡ T− exp[ig∫ +∞
−∞dz−A+
a (z−, ~xT )ta]
(126)
where T− denotes ordering in the variable z− with the fields with the largest value of
z− placed on the left.
From this starting point, the cross section for γA → QQX can be derived [241].
At leading order in electromagnetic interactions, the three diagrams in Fig. 81 must be
evaluated. The black dot represents the scattering matrix defined in Eq. (125). After
Figure 81. The three diagrams that contribute to the production of a QQ pair in the
interaction of a photon with the color field of the nucleus.
summing these three diagrams, we obtain the amplitude
Mµ(~k|~q, ~p) =ieq2
∫d2~lT(2π)2
∫d2x1Td
2x2T
× ei~lT ·~x1T ei(~pT +~qT−~kT−~lT )·~x2T
(U(~x1T )U †(~x2T ) − 1
)u(~q) Γµ v(~p) (127)
where l is the four-momentum transfer between the quark and the nucleus, eq is the
electric charge of the produced quark and
Γµ ≡ γ−(/q − /l +m)γµ(/q − /k − /l +m)γ−
p−[(~qT−~lT )2 +m2−2q−k+] + q−[(~qT−~kT−~lT )2 +m2]. (128)
††When ǫ = +1, U ǫ = U and when ǫ = −1, U ǫ = U †.
145
Here γ− is the − component of the Dirac matrices. In these formulas, k, q and p are
the four-momenta of the photon, quark and antiquark respectively. The cross section is
obtained from this amplitude by
dσγA→QQX =d3q
(2π)22q0
d3p
(2π)32p0
1
2k−2πδ(k− − p− − q−)
×⟨Mµ(~k|~q, ~p)Mν∗(~k|~q, ~p)
⟩
ρǫµ(k)ǫ
∗ν(k) , (129)
where ǫµ(k) is the polarization vector of the photon (all possible polarizations should in
principle be summed) and 〈 · · · 〉ρ denotes the average over all the possible configurations
of the distribution of color sources in the nucleus, ρ(~xT ), weighted by the functionalW [ρ]
defined in Section 5.2.
Inclusive cross section
After integrating over the phase space of the produced quark and antiquark, the total
cross section is [241, 242]
σγA→QQX =αe2Q2π2
∫dl2T
[πR2
AC(x, lT )
]
×[1 +
4(l2T −m2)
lT√l2T + 4m2
arcthlT√
l2T + 4m2
], (130)
with
C(x, lT ) ≡∫d2xT e
i~lT ·~xT
⟨U(~xT )U †(0)
⟩
ρ. (131)
Note that Eq. (130) depends on the modulus of |~lT |. The momentum fraction x is given
by x = kmin/k = 4m2/sγN , Eqs. (122) and (123) with M = 2m. We emphasize that the
x dependence of C(x, lT ) comes entirely from the x-evolution of the distribution W [ρ]
of the classical color sources in the nucleus. Therefore, the x dependence of this cross
section tests some predictions of the W [ρ] evolution equations, Eq. (118), or the simpler
BK equation for the evolution of the correlator⟨U(~xT )U †(0)
⟩
ρ, Eq. (120).
After manipulation of Eq. (129), σγA→QQX can alternatively be expressed in terms
of the dipole cross section [243]
σγA→QQX =∫ 1
0dz∫d2rT |Ψ(k|z, ~rT )|2 σdip(x,~rT ) . (132)
In this formula, the “photon wavefunction”, Ψ(k|z, ~rT ), denotes the QQ Fock component
of the virtual photon light-cone wavefunction that corresponds to a quark-antiquark
dipole of transverse size ~rT . The square of the wavefunction is
|Ψ(k|z, ~rT )|2 ≡ Nc ǫµ(k)ǫ∗ν(k)
64πk2−z(1 − z)
∫d2lT(2π)2
d2l′T(2π)2
ei(~lT−~l
′T
)·~rT
× Trd((/q +m)Γµ(/p−m)Γν′†
)(133)
146
where Trd indicates a trace over Dirac indices rather than a color trace. The longitudinal
momentum fraction, z, is defined as z = q−/k−. The dipole cross section, an important
quantity in saturation physics, can be defined in terms of a Wilson line correlator,
σdip(~rT ) = 2∫d2b [1 − S(~b, ~rT )] , (134)
with
S(~b, ~rT ) ≡ 1
Nc
Tr
⟨U(~b+
~rT2
)U †(~b− ~rT2
)
⟩
ρ
. (135)
The above expressions are valid for both γA and γp interactions. The only difference is
that the averages are performed over the color field of a nucleus or a proton respectively.
Several models of the dipole cross section have been used to fit the HERA γp data.
Golec-Biernat and Wusthoff used a very simple parametrization [244, 245],
σdip(x,~rT ) = σ0
[1 − e−
14Q2
s(x)r2T
], (136)
which shows good agreement with the data at x < 10−2 and moderate Q2. In this
formula, the scale Qs(x) has the x-dependent form
Q2s(x) = Q2
0
(x0
x
)λ. (137)
A fit of HERA F2 data suggests λ ≈ 0.29. The parameter Q0 is set to 1 GeV with
x0 ≈ 3 × 10⁻⁴ for a proton. In the nucleus Q20 must be scaled by A1/3. However,
this model fails at large Q2. The high Q2 behavior was improved in Ref. [246] where
the dipole cross section was parametrized to reproduce pQCD for small dipoles. Even
if these approaches are inspired by saturation physics, they do not derive the dipole
cross section from first principles. Recently, Iancu, Itakura and Munier [247] derived
an expression of the dipole cross section from the color glass condensate framework and
obtained a good fit of the HERA data with σ0, λ and Q0 ((x0)) as free parameters.
An equally good fit was obtained by Gotsman, Levin, Lublinsky and Maor who derived
the x dependence of the dipole cross section by numerically solving the BK equation,
including DGLAP corrections [248].
Diffractive cross section
Starting from the dipole cross section, Eq. (134), the elastic dipole cross section is [249]
σelasticdip (~rT ) =
∫d2b [1 − S(~b, ~rT )]2 . (138)
If diffractive QQ production is viewed as a sum of elastic dipole scatterings [250, 251],
σdiffγA→QQX
=∫d2b
∫ 1
0dz∫d2rT |Ψ(k|z, ~rT )|2
×[1 − 1
NcTr
⟨U(~b+
~rT2
)U †(~b− ~rT2
)
⟩
ρ
]2. (139)
Therefore, to simultaneously predict the inclusive and diffractive cross sections, a
description of the source distribution, W [ρ], that contains some information about the
transverse profile of the nucleus is needed. If only the inclusive cross section is calculated,
a model of the impact-parameter integrated total dipole cross section is sufficient.
147
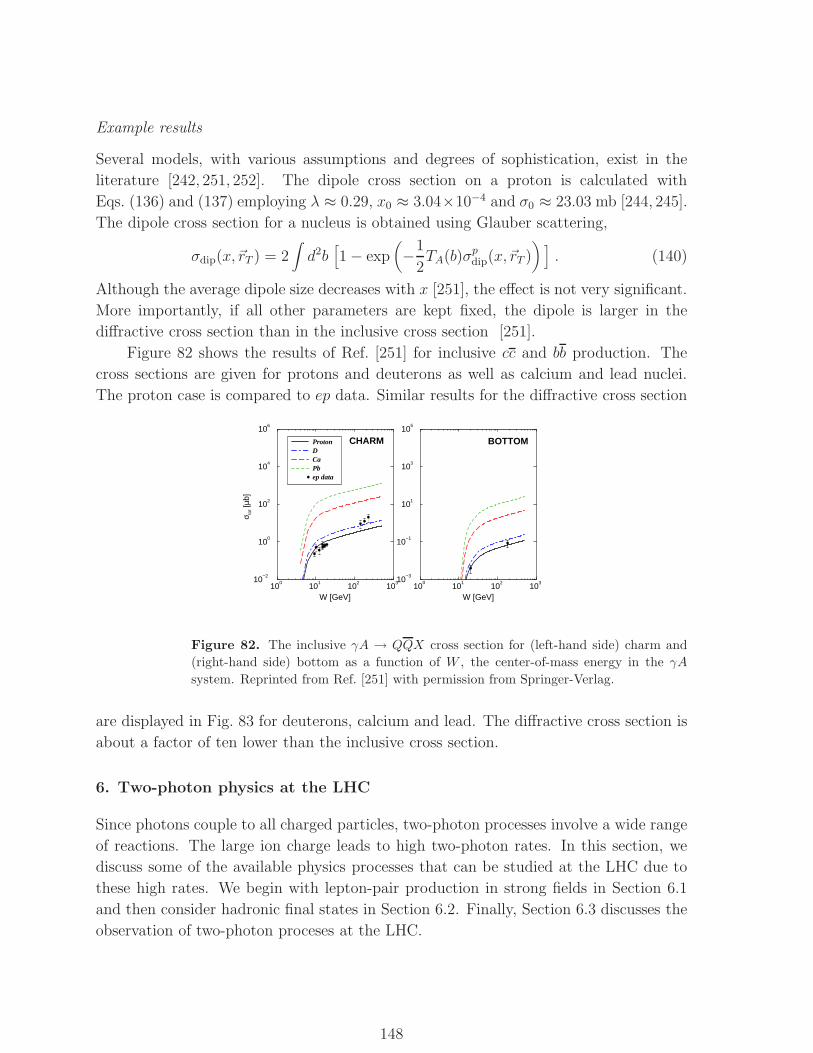
Example results
Several models, with various assumptions and degrees of sophistication, exist in the
literature [242, 251, 252]. The dipole cross section on a proton is calculated with
Eqs. (136) and (137) employing λ ≈ 0.29, x0 ≈ 3.04×10⁻⁴ and σ0 ≈ 23.03 mb [244, 245].
The dipole cross section for a nucleus is obtained using Glauber scattering,
σdip(x,~rT ) = 2∫d2b
[1 − exp
(−1
2TA(b)σpdip(x,~rT )
) ]. (140)
Although the average dipole size decreases with x [251], the effect is not very significant.
More importantly, if all other parameters are kept fixed, the dipole is larger in the
diffractive cross section than in the inclusive cross section [251].
Figure 82 shows the results of Ref. [251] for inclusive cc and bb production. The
cross sections are given for protons and deuterons as well as calcium and lead nuclei.
The proton case is compared to ep data. Similar results for the diffractive cross section
100
101
102 103
W [GeV]
10−2
100
102
104
106
σ tot [
µb]
ProtonDCaPbep data
100
101
102 103
W [GeV]
10−3
10−1
101
103
105
CHARM BOTTOM
Figure 82. The inclusive γA → QQX cross section for (left-hand side) charm and
(right-hand side) bottom as a function of W , the center-of-mass energy in the γA
system. Reprinted from Ref. [251] with permission from Springer-Verlag.
are displayed in Fig. 83 for deuterons, calcium and lead. The diffractive cross section is
about a factor of ten lower than the inclusive cross section.
6. Two-photon physics at the LHC
Since photons couple to all charged particles, two-photon processes involve a wide range
of reactions. The large ion charge leads to high two-photon rates. In this section, we
discuss some of the available physics processes that can be studied at the LHC due to
these high rates. We begin with lepton-pair production in strong fields in Section 6.1
and then consider hadronic final states in Section 6.2. Finally, Section 6.3 discusses the
observation of two-photon proceses at the LHC.
148
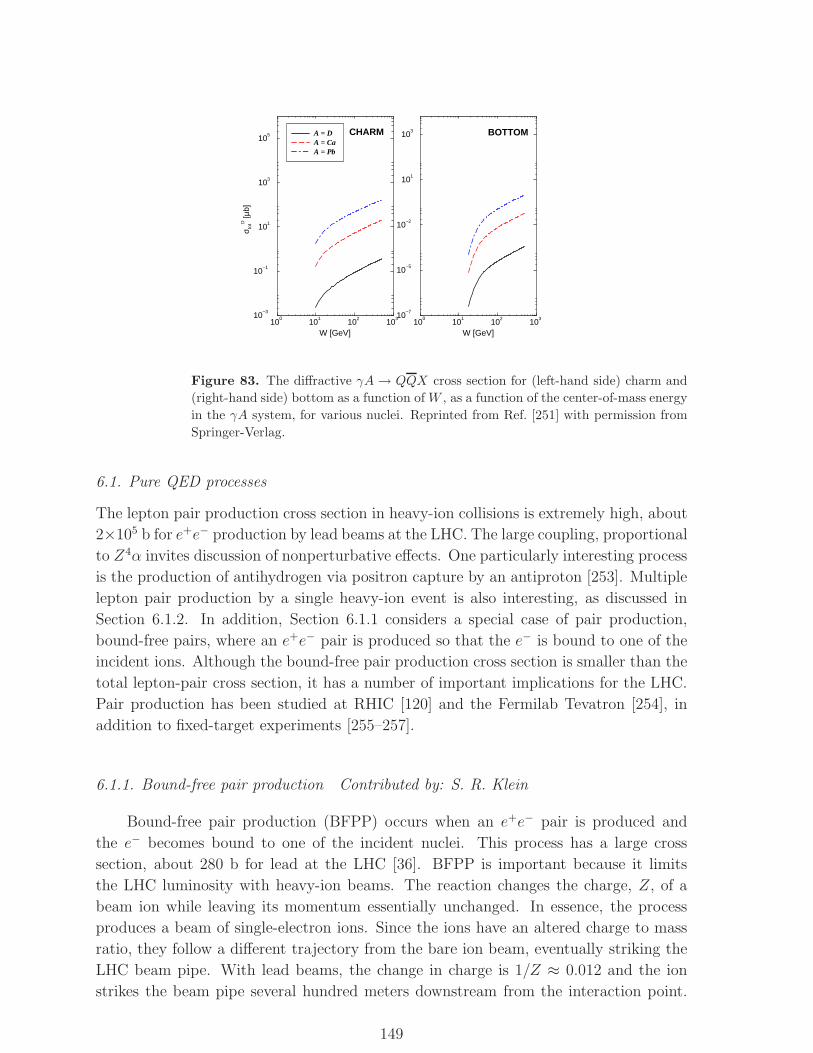
100
101
102 103
W [GeV]
10−3
10−1
101
103
105
σ totD
[µb]
A = DA = CaA = Pb
100
101
102 103
W [GeV]
10−7
10−5
10−2
101
103CHARM BOTTOM
Figure 83. The diffractive γA → QQX cross section for (left-hand side) charm and
(right-hand side) bottom as a function of W , as a function of the center-of-mass energy
in the γA system, for various nuclei. Reprinted from Ref. [251] with permission from
Springer-Verlag.
6.1. Pure QED processes
The lepton pair production cross section in heavy-ion collisions is extremely high, about
2×10⁵ b for e+e− production by lead beams at the LHC. The large coupling, proportional
to Z4α invites discussion of nonperturbative effects. One particularly interesting process
is the production of antihydrogen via positron capture by an antiproton [253]. Multiple
lepton pair production by a single heavy-ion event is also interesting, as discussed in
Section 6.1.2. In addition, Section 6.1.1 considers a special case of pair production,
bound-free pairs, where an e+e− pair is produced so that the e− is bound to one of the
incident ions. Although the bound-free pair production cross section is smaller than the
total lepton-pair cross section, it has a number of important implications for the LHC.
Pair production has been studied at RHIC [120] and the Fermilab Tevatron [254], in
addition to fixed-target experiments [255–257].
6.1.1. Bound-free pair production Contributed by: S. R. Klein
Bound-free pair production (BFPP) occurs when an e+e− pair is produced and
the e− becomes bound to one of the incident nuclei. This process has a large cross
section, about 280 b for lead at the LHC [36]. BFPP is important because it limits
the LHC luminosity with heavy-ion beams. The reaction changes the charge, Z, of a
beam ion while leaving its momentum essentially unchanged. In essence, the process
produces a beam of single-electron ions. Since the ions have an altered charge to mass
ratio, they follow a different trajectory from the bare ion beam, eventually striking the
LHC beam pipe. With lead beams, the change in charge is 1/Z ≈ 0.012 and the ion
strikes the beam pipe several hundred meters downstream from the interaction point.
149
At the maximum design luminosity for lead, 1027 cm−2s−1, the single-electron beam
carries about 280,000 particles/s, dumping about 25 Watts of power into a relatively
small section of the beam pipe, enough to overwhelm the LHC magnet cooling systems
and causing the struck magnet to quench [258–261]. It is necessary to keep the LHC
luminosity low enough to prevent this from happening.
Several different BFPP calculations have been made. One such calculation for
capture into a K-shell orbital [262],
σAB→Ae−+B+e+ = Z5AZ
2B
[a log(γLCM) + b′
], (141)
shows the scaling with beam species and energy. Here, ZA is the charge of nucleus A
that the electron is bound to, ZB is the charge of B, γLCM the Lorentz boost of a single
beam in the center-of-mass frame and a and b′ are constants fit to lower energy data.
This approach was used to obtain the 280 b cross section given above. Capture to higher
s orbitals decreases by a factor of ∼ 1/n3, a factor of 8 reduction for the L-shell. The
net effect of all the higher orbitals is to increase the cross section by about 20%. Some
earlier calculations have obtained BFPP cross section of ∼ 100 b but the value of 280 b
is also in agreement with other calculations [263]. In addition, BFPP was measured at
the CERN SPS for 158 GeV/nucleon lead beams on a number of fixed targets [264, 265].
The data are in reasonable agreement with the calculations of Ref. [262].
Bound-free pair production has been observed during the 2005 RHIC run with
copper beams [36]. Although the cross section for bound-free pair production of +28Cu
is small, only 150 mb, the change in Z/A due to electron capture is larger than for heavier
ions. The single-electron +28Cu ions struck the beam pipe about 136 m downstream from
the interaction point, producing hadronic showers in the beam pipe and accelerator
magnets. The ionization caused by the hadronic showers, with a rate of about 10 Hz,
consistent with theory predictions, was detected by small PIN diodes.
6.1.2. Strong field effects in lepton pair production: Coulomb corrections and multiple
pair production Contributed by: A. J. Baltz, K. Hencken, and G. Baur
In this section we discuss the strong photon-ion coupling constant and how the
nonperturbative QED effects arising from its strength might be observed in lepton pair
production at the LHC. While the role of higher-order QED in electromagnetic heavy-
ion reactions is interesting in itself, it is also useful as a simpler model for investigating
aspects of nonperturbative QCD. Though the primary heavy-ion program involves the
technically more challenging quantitative understanding of nonperturbative QCD, the
more tractable theoretical treatment of higher-order QED should be experimentally
verified. At present, both the experimental and theoretical state-of-the art of higher-
order QED is unsatisfactory in UPCs. As we discuss, although some theoretical
questions remain, more experimental data is greatly needed. Although there was
sufficient interest during the planning stages of RHIC [266], no definitive experimental
150
tests of higher-order QED have yet been performed. Here we review the theoretical and
experimental situation and discuss some experimental probes of nonperturbative QED
effects at the LHC.
Leading-order calculations of charged-particle induced lepton pair production date
back to the work of Landau and Lifshitz [267] and Racah [268]. The 1937 Racah
formula for the total cross section is remarkably accurate when compared with more
recent Monte Carlo calculations [269–271] of e+e− production. However, for lead
or gold beams, Zα ∼ 0.6 is not small. Higher-order effects may then be non-
negligible. In addition, strong-field QED effects are expected to be more pronounced
at small impact parameters which can be well defined in heavy-ion collisions, making
it possible to test this expectation. Calculations have suggested large nonperturbative
enhancements relative to perturbative results at low energies on one hand and, on the
other, significant reductions at ultrarelativistic energies. Neither effect has yet been
verified experimentally.
Coupled-channel calculations of e+e− production have been performed at low
kinetic energies, 1-2 GeV per nucleon [272–274]. A significant increase over perturbation
theory was found. An enhancement relative to perturbation theory was also obtained
in coupled-channel calculations of b = 0 fixed-target Pb+Pb interactions at 200
GeV/nucleon [275].
These calculated enhancements were obtained from large cancellations of positive
and negative time contributions to the pair creation probability, with some contributions
orders of magnitude larger than the signal. The coupled-channel basis is necessarily
incomplete. This limitation, combined with other approximations, may render the
method impractical. For example, a factor of 50 enhancement was found in a
calculation of bound-free pair production in central Pb+Pb fixed-target interactions at
1.2 GeV/nucleon (γL = 2.3) [272, 274]. When the basis was expanded to include a 70%
larger pertubative cross section [276], the higher-order result decreased the enhancement
to a factor of nine even though the basis increased.
There are two interesting higher-order strong field effects: Coulomb corrections and
multi-photon exchanges from either one or both ions. In this treatment, only one e+e−
pair is assumed to be present at any intermediate time step. Retarded propagators can
then be utilized to calculate higher-order Coulomb effects on the total cross section and
uncorrelated final electron or positron states [277–281].
The exact solution of the Dirac equation for an electron in the field of the two
nuclei has been studied in the limit γL → ∞. An all-order summation can be made in
the high-energy limit in the related problem of bound-free pair production [282]. The
summation can be done analytically for free pair production [283, 284]. After integration
over b, the total cross section is identical to the leading-order result [284, 285]. The
CERN SPS pair production data [286] also showed perturbative scaling [285]. These
data, obtained from 160 GeV/nucleon Pb and 200 GeV/nucleon S beams on C, Al, Pa,
and Au targets, are the only available ultrarelativistic e+e− data spanning a large part
of the total cross section. They showed that the cross sections scale as the product of the
151
squares of the projectile and target charges, (ZAZB)2 [286], in contrast to predictions of
e+e− photoproduction on a heavy target, which shows a negative (Coulomb) correction,
proportional to Z2, well described by Bethe-Maximon theory [287, 288].
Subsequently, it was argued [289–291] that a more careful regularization of the
propagator than that of Refs. [284, 285] was needed. Negative Coulomb corrections then
reappeared, in agreement with Bethe-Maximon theory. This result was confirmed by
numerical calculations with a properly regularized propagator. The exact semi-classical
total cross section for e+e− production with A ∼ 200 is reduced by 28% at the SPS, 17%
at RHIC and 11% at the LHC [292]. These calculations are in apparent disagreement
with the SPS data. However, the coupled-channel treatment of the same basic reaction
[275] finds an enhancement of the pair production probability at b ∼ 0. The difficulties
in the method have been previously noted.
At RHIC, the first experimental observation of e+e− pairs accompanied by nuclear
dissociation was made by STAR [120]. As discussed in Section 2.3.8 and Ref. [84],
this corresponds to pair production with 〈b〉 ∼ 20 fm. Comparison with perturbative
QED calculations set a limit on higher-order corrections of −0.5σQED < ∆σ < 0.2σQED,
at a 90% confidence level. Detailed leading-order QED calculations are carried out in
Ref. [293]. The electromagnetic excitation of both ions is included in the semi-classical
approach according to Ref. [84].
A comparison to calculations without dissociation in the STAR acceptance gives
an indication of the relative difference between the perturbative and higher-order
results. Within the STAR acceptance, the calculated exact result is 17% lower than
the perturbative one [292], ∆σ = −0.17σQED, not excluded by STAR. On the other
hand, the small impact parameter should enhance higher-order processes.
A sample numerical calculation has been performed using the same method for
e+e− production by Pb+Pb ions with cuts in a possible detector setup in the forward
region [126] at the LHC. For electron and positron energy E and angle θ such that
3 < E < 20 GeV and 0.00223 < θ < 0.00817 radians, the perturbative cross section
of 2.88 b without a form factor is reduced by 18%, to 2.36 b, in an exact numerical
calculation. If forward e+e− pairs are employed for luminosity measurements at LHC,
it seems necessary to consider the Coulomb corrections to the predicted cross sections.
Section 6.3.2 discusses µ+µ− pairs as a γγ luminosity monitor. While it is
straightforward to calculate the perturbative µ+µ− pair production rate in heavy-
ion collisions, the importance of Coulomb corrections is somewhat less clear than
for e+e−. Analytic arguments suggest that Coulomb corrections are small for µ+µ−
production [294, 295]. On the other hand, numerical calculations of the total µ+µ−
cross sections, employing the same method as the exact e+e− calculations for RHIC and
LHC mentioned previously, find larger relative reductions with respect to perturbation
theory, 22% for RHIC and 14% for LHC.
A second higher-order effect is multiple pair production in a single collision which
restores unitarity, violated at leading order if only single pair production is assumed. The
leading order single pair production probability is interpreted as the average number of
152
pairs produced in a single collision. Integration of this probability over impact parameter
gives the total multiple-pair production cross section. The matrix element for multiple-
pair production can be factorized into an antisymmetrized product of pair production
amplitudes. Calculating the total multiple-pair production probability, neglecting the
antisymmetrization of the amplitude, recovers the Poisson distribution [3, 296]. There
are also multi-particle corrections to single pair production which contribute up to 5%
of the probability [3]. Studies of multiple-pair production for ALICE [293] found that
about 10% of the produced pairs detected in the inner tracker come from multiple-pair
production.
Lighter ion runs at the same γL and with the same lepton pair acceptance could
provide experimental verification of the predicted Coulomb corrections, observable
through deviations from the predicted Z4 scaling for A = B, so far unobserved at RHIC
or the SPS. Asymmetric collisions, with ZA 6= ZB, could also help separate higher-order
corrections from multi-photon exchange with only one or with both ions.
6.2. Physics potential of two-photon and electroweak processes
Contributed by: K. Hencken, S. R. Klein, M. Strikman and R. Vogt
This section briefly describes some processes accessible through two-photon
interactions, including vector meson pair production and heavy flavor meson
spectroscopy. We also briefly discuss tagging two-photon processes through forward
proton scattering as a way to enhance searches for electroweak final states. Finally, we
mention the possibility of using γγ → e+e− as a luminosity monitor at colliders.
Double vector meson production, γγ → V V : Double vector meson production in
pA and AA collisions is hadronically forbidden for kinematics where both the rapidity
difference between one vector meson and the initial hadron and the rapidity difference
between the two vector mesons is large. The negative C-parity of the vector mesons
forbids the process to proceed via vacuum exchange. Accordingly, two-photon processes
are the dominant contribution. Studies of final states where one of the vector mesons
is heavy, such as J/ψρ0, can measure the two-gluon form factor of the vector meson for
the first time to determine the transverse size of the gluon in the vector meson. It is
expected that the t-dependence of γγ → J/ψV is very broad with more than 30% of
the events at pT ≥ 1 GeV/c. In the case when both pairs are heavy, e.g. J/ψJ/ψ, the
BFKL regime can be probed. On the other hand, if both mesons are light, e.g. ρ0ρ0 or
ρ0φ, the Gribov-Pomeranchuk factorization theorem can be tested in a novel way. For
a more extensive discussion and rate estimates in AA collisions, similar to those in pA,
see Ref. [18].
Heavy flavor meson spectroscopy: While single vector meson production is forbidden
in two-photon processes, it is possible to study heavy QQ pair production. The
γγ → QQ production rate is directly proportional to the two-photon decay width, Γγγ .
The two-photon luminosity is about three orders of magnitude larger than that at LEP.
Thus it may be possible to distinguish between quark and gluon-dominated resonances,
153
“glueballs”. For the production rates in AA collisions, see Refs. [3, 18, 297–299].
One important background to meson production in two-photon processes is vector
meson photoproduction followed by radiative decay. For example, in ultraperipheral
Pb+Pb collisions at the LHC, the J/ψ photoproduction rate followed by the decay
J/ψ → γηc is about 2.5 per minute, much higher than the γγ → ηc rate [17]. The
two channels have similar kinematics, complicating any measurement of the two-photon
coupling.
Two-photon tagging and electroweak processes: Tagging two-photon interactions
would enhance the detection capability of electroweak processes such as W+W− pairs,
H0 and tt final states. Detection of far-forward scattered protons has been routinely used
at pp and ep colliders to select diffractive events. It not only suppresses backgrounds,
allowing more efficient event selection, but also improves event reconstruction by
employing the measured proton momentum.
At the LHC, forward proton detectors can also be used to measure photoproduction
[29, 134]. The acceptance of the detectors recently proposed by TOTEM and ATLAS at
about ±220 m from the interaction point is determined primarily by the strong dipole
fields of the LHC beam line. Protons can be then detected if their fractional energy
loss, ξ, as a result of photon or Pomeron exchange, is significant. For high luminosity
running, the ξ acceptance at ±220 m is 0.01 < ξ < 0.1. Unfortunately, this acceptance
does not match the typical fractional energy loss of ions in UPCs. However, newly
proposed detectors at ≈ ±420 m from the interaction point will extend the acceptance
down to ξ ∼ 2×10⁻³ [32]. With such detectors, a fraction of two-photon interactions in
pA and AA collisions employing light ions such as Ar or Ca can be double tagged: both
the forward scattered proton and ion (or both ions) are detected. Of course, detectors
at both ±220 m and ±420 m can be used to tag diffractive scattering since larger values
of ξ are usually involved.
Thus forward proton detectors provide unique and powerful capabilities for tagging
UPCs at the LHC. This tagging would allow selection and measurement of electroweak
processes with small cross sections. For example, in a one month pPb run, 10
γγ → W+W− events are expected. These W+W− pairs are sensitive to the quartic
gauge couplings and would be characterized by a small pair pT . Single W bosons will
be produced at high pT in γA and γp interactions with much higher statistics, similar
to previous studies at HERA [300, 301]. In addition, photoproduction of tt pairs could
provide a measure of the top quark charge [177]. In all these examples, measuring the
forward proton improves background suppression as well as reconstruction of the event
kinematics. Forward proton measurements can also be used to extend and cross-check
other techniques, such as large rapidity gap signatures, which will be exclusively used
in heavy-ion collisions.
Coherent W+ photoproduction, γp → W+n, is a way to measure the W+
electromagnetic coupling [302]. Detection of a single neutron in the ZDCs without
additional hadrons could serve as a trigger. Coherent photoproduction was studied in
both pp and pA collisions, along with incoherent production in pp collisions, accompanied
154
by proton breakup. The coherent and incoherent pp production rates were found to be
comparable with a few W+ produced per year.
6.3. Photon-photon processes with ALICE
Contributed by: Yu. Kharlov and S. Sadovsky
6.3.1. e+e− pairs in the ALICE forward detectors Multiple e+e− pair production
in ultraperipheral heavy-ion collisions mainly affects the inner and forward ALICE
detectors, located a short radial distance away from the beam axis. These detectors are
the Inner Tracking System (ITS), the T0 and V0 detectors and the Forward Multiplicity
Detector (FMD), see Section 10.2 for details. The load of the T0 and V0 detectors is
of particular importance because these detectors provide the Level-0 ALICE trigger
signals.
A full simulation of an electron or position track from e+e− pair production
through the T0, V0 and FMD detectors in Pb+Pb collisions was performed. The
software package for ALICE simulation and reconstruction, aliroot [116], was used.
An event generator for e+e− pair production, epemgen [303], was incorporated into
aliroot. This generator simulates the lepton pT and y distributions according to
the five-dimensional differential cross section d5σ/dpT+dy+dpT−dy−dφ+− calculated in
Ref. [271].
Only the ITS, T0, V0, and FMD detectors and the beam pipe were taken into
account. Three magnetic fields, B = 0.2, 0.4 and 0.5 T, were simulated. The cross
sections and detection rates for at least one e± in the detectors in Pb+Pb collisions at
L = 106 kb−1s−1 are shown in Table 16.
The single electron cross sections rapidity distribution in multiple e+e− pair
production is very flat over a wide rapidity range, giving relatively large cross sections
even at forward rapidity. However, the rapidity acceptance is not the only factor
determining the cross sections in Table 16. They also strongly depend on the inner
radii of the detectors, representing an effective low pT cut. The left and right rapidity
coverage of the T0 detectors are very similar and the inner radii are the same, resulting
in nearly the same rates on the left and right-hand sides. On the other hand, while the
right V0 detector has larger η coverage, its larger inner radius reduces the cross section
so that the left V0 detector has a higher cross section. The right-hand FMD covers
twice the η range of the left-hand detector. Since the two detectors have the same inner
radii, the right-hand cross section is twice as large. The forward detector load due to
e+e− pair production is sufficiently high to be an important background, especially for
B = 0.2 T. The load should be compared to the maximum L0 trigger rate, ∼ 200 kHz.
6.3.2. Detection of γγ processes in ALICE
155
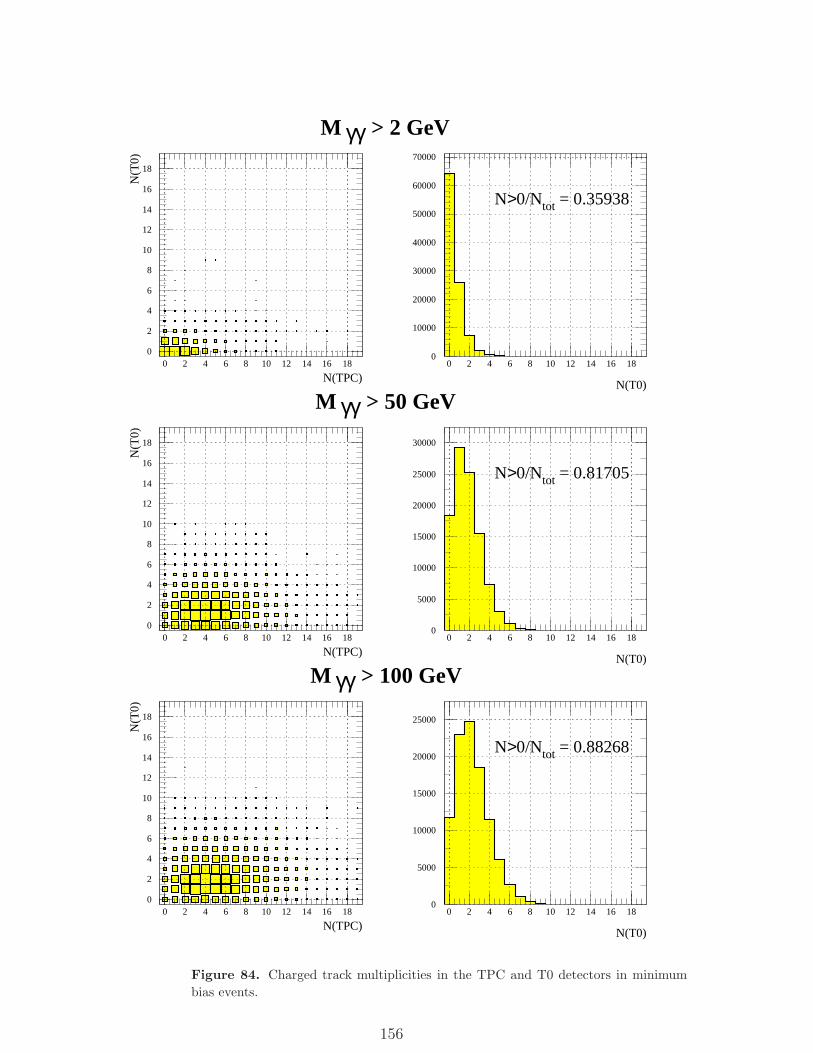
M γγ > 2 GeV
M γγ > 50 GeV
M γγ > 100 GeV
0
10000
20000
30000
40000
50000
60000
70000
0 2 4 6 8 10 12 14 16 18
N(T0)
N>0/Ntot = 0.35938
0
2
4
6
8
10
12
14
16
18
0 2 4 6 8 10 12 14 16 18
N(TPC)
N(T
0)
0
2
4
6
8
10
12
14
16
18
0 2 4 6 8 10 12 14 16 18
N(TPC)
N(T
0)
0
5000
10000
15000
20000
25000
30000
0 2 4 6 8 10 12 14 16 18
N(T0)
N>0/Ntot = 0.81705
0
2
4
6
8
10
12
14
16
18
0 2 4 6 8 10 12 14 16 18
N(TPC)
N(T
0)
0
5000
10000
15000
20000
25000
0 2 4 6 8 10 12 14 16 18
N(T0)
N>0/Ntot = 0.88268
Figure 84. Charged track multiplicities in the TPC and T0 detectors in minimum
bias events.
156
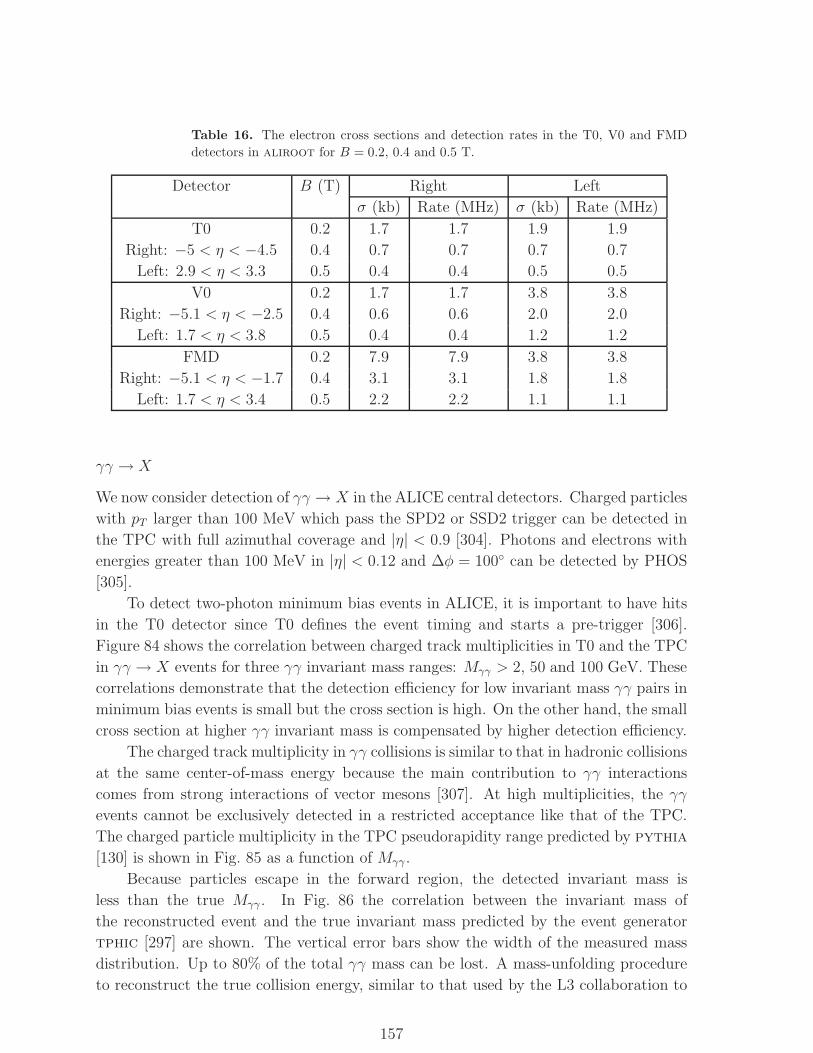
Table 16. The electron cross sections and detection rates in the T0, V0 and FMD
detectors in aliroot for B = 0.2, 0.4 and 0.5 T.
Detector B (T) Right Left
σ (kb) Rate (MHz) σ (kb) Rate (MHz)
T0 0.2 1.7 1.7 1.9 1.9
Right: −5 < η < −4.5 0.4 0.7 0.7 0.7 0.7
Left: 2.9 < η < 3.3 0.5 0.4 0.4 0.5 0.5
V0 0.2 1.7 1.7 3.8 3.8
Right: −5.1 < η < −2.5 0.4 0.6 0.6 2.0 2.0
Left: 1.7 < η < 3.8 0.5 0.4 0.4 1.2 1.2
FMD 0.2 7.9 7.9 3.8 3.8
Right: −5.1 < η < −1.7 0.4 3.1 3.1 1.8 1.8
Left: 1.7 < η < 3.4 0.5 2.2 2.2 1.1 1.1
γγ → X
We now consider detection of γγ → X in the ALICE central detectors. Charged particles
with pT larger than 100 MeV which pass the SPD2 or SSD2 trigger can be detected in
the TPC with full azimuthal coverage and |η| < 0.9 [304]. Photons and electrons with
energies greater than 100 MeV in |η| < 0.12 and ∆φ = 100◦ can be detected by PHOS
[305].
To detect two-photon minimum bias events in ALICE, it is important to have hits
in the T0 detector since T0 defines the event timing and starts a pre-trigger [306].
Figure 84 shows the correlation between charged track multiplicities in T0 and the TPC
in γγ → X events for three γγ invariant mass ranges: Mγγ > 2, 50 and 100 GeV. These
correlations demonstrate that the detection efficiency for low invariant mass γγ pairs in
minimum bias events is small but the cross section is high. On the other hand, the small
cross section at higher γγ invariant mass is compensated by higher detection efficiency.
The charged track multiplicity in γγ collisions is similar to that in hadronic collisions
at the same center-of-mass energy because the main contribution to γγ interactions
comes from strong interactions of vector mesons [307]. At high multiplicities, the γγ
events cannot be exclusively detected in a restricted acceptance like that of the TPC.
The charged particle multiplicity in the TPC pseudorapidity range predicted by pythia
[130] is shown in Fig. 85 as a function of Mγγ .
Because particles escape in the forward region, the detected invariant mass is
less than the true Mγγ . In Fig. 86 the correlation between the invariant mass of
the reconstructed event and the true invariant mass predicted by the event generator
tphic [297] are shown. The vertical error bars show the width of the measured mass
distribution. Up to 80% of the total γγ mass can be lost. A mass-unfolding procedure
to reconstruct the true collision energy, similar to that used by the L3 collaboration to
157
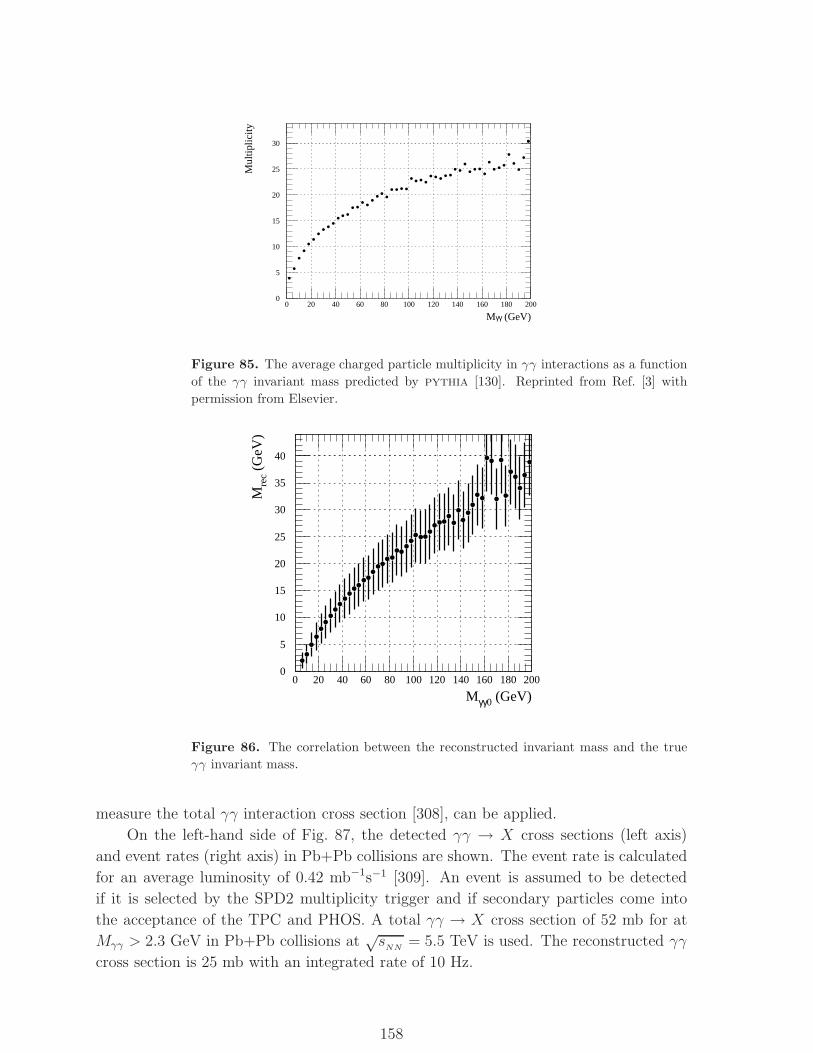
0
5
10
15
20
25
30
0 20 40 60 80 100 120 140 160 180 200
Mγγ (GeV)
Mul
tiplic
ity
Figure 85. The average charged particle multiplicity in γγ interactions as a function
of the γγ invariant mass predicted by pythia [130]. Reprinted from Ref. [3] with
permission from Elsevier.
0
5
10
15
20
25
30
35
40
0 20 40 60 80 100 120 140 160 180 200
Mγγ0 (GeV)
Mre
c (G
eV)
Figure 86. The correlation between the reconstructed invariant mass and the true
γγ invariant mass.
measure the total γγ interaction cross section [308], can be applied.
On the left-hand side of Fig. 87, the detected γγ → X cross sections (left axis)
and event rates (right axis) in Pb+Pb collisions are shown. The event rate is calculated
for an average luminosity of 0.42 mb−1s−1 [309]. An event is assumed to be detected
if it is selected by the SPD2 multiplicity trigger and if secondary particles come into
the acceptance of the TPC and PHOS. A total γγ → X cross section of 52 mb for at
Mγγ > 2.3 GeV in Pb+Pb collisions at√s
NN= 5.5 TeV is used. The reconstructed γγ
cross section is 25 mb with an integrated rate of 10 Hz.
158

10 2
10 3
10 4
10 5
10 6
0 20 40 60 80 100 120 140 160 180 200
10-4
10-3
10-2
10-1
1
Mγγ0 (GeV)
dσ/d
Mγγ
(nb
/GeV
)
dN/d
Mγγ
dt (
GeV
-1s-1
)
10
10 2
10 3
10 4
10 5
0 10 20 30 40 50 60
10-5
10-4
10-3
10-2
Mγγ0 (GeV)
dσ/d
Mγγ
(nb
/GeV
)
dN/d
Mγγ
dt (
GeV
-1s-1
)
Figure 87. The differential cross section (left axis) and event rate (right axis) for
reconstructed γγ invariant mass from γγ → X (left-hand side) and γγ → µ+µ−
(right-hand side) in Pb+Pb collisions.
γγ → µ+µ−
Muon pair production must be measured exclusively since both muons have to be
detected. Therefore the SPD2 trigger cannot select these events since at least three
charged particles are required in SPD2. An SSD2 trigger can select γγ → µ+µ−.
The right-hand side of Fig. 87 shows the cross section for events selected by an SSD2
multiplicity trigger. The Pb+Pb event rate for L = 0.42 mb−1s−1 is also shown. The
geometric efficiency is about 4%. The low efficiency is due to the dependence of the
lepton pair production cross section on scattering angle, θ, in the γγ center-of-mass
frame [310],dσγγ→l+l−
d cos θ∝ 1 + cos2 θ
1 − β2 cos2 θ.
These lepton pairs can be used as a γγ luminosity monitor since they are easy to detect
and simple to calculate. Since they are detected exclusively, the background is very
small [311, 312].
Quarkonium production
Two-photon collisions can be used to study C-even charmonium and bottomonium
states (ηc, χc0, χc2, ηb, χb0, χb2). The two-photon widths of C-even charmonia were
determined from γγ processes in e+e− collisions at LEP [313],, BELLE [314] and CLEO
[315]. The corresponding properties of the bottomonium states still remain unknown.
Predictions for the unknown quarkonia two-photon widths are given in Ref. [3], following
Refs. [316, 317]. The production cross sections are high enough for millions of ηc and χcstates to be produced in a 106 s Ca+Ca run while ∼ 1000 bottomonium states can be
produced. The production cross sections and rates are shown in Table 17.
159
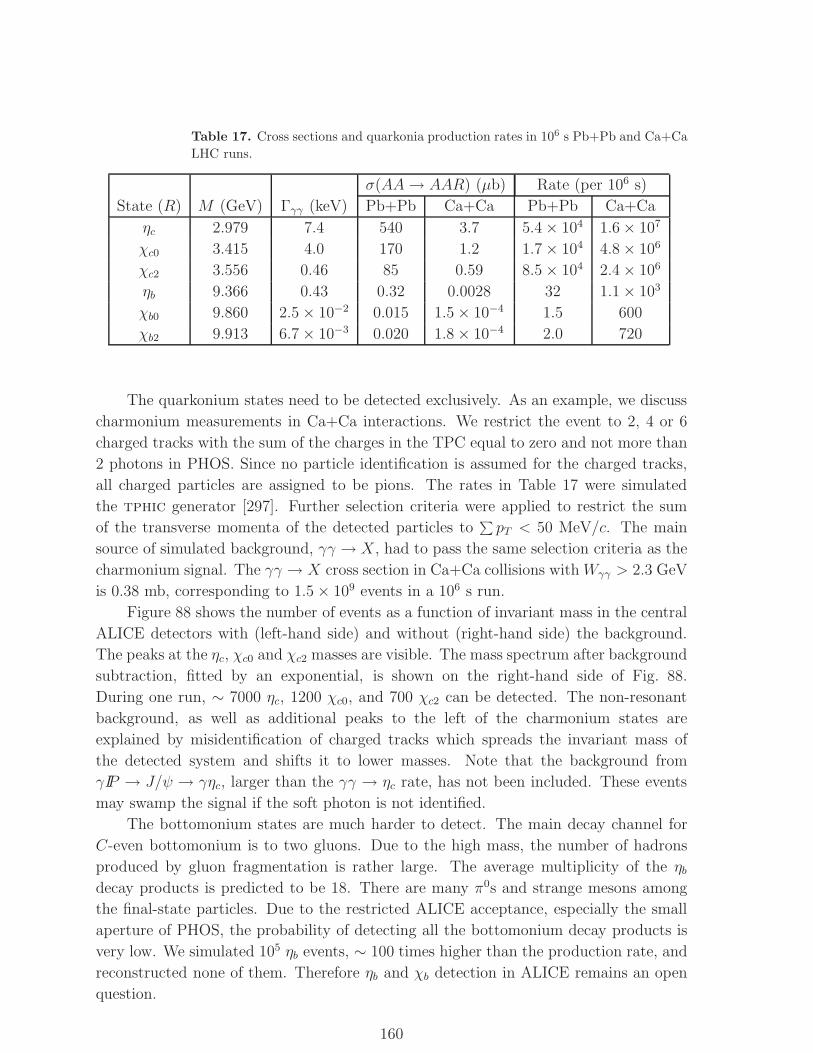
Table 17. Cross sections and quarkonia production rates in 106 s Pb+Pb and Ca+Ca
LHC runs.
σ(AA→ AAR) (µb) Rate (per 106 s)
State (R) M (GeV) Γγγ (keV) Pb+Pb Ca+Ca Pb+Pb Ca+Ca
ηc 2.979 7.4 540 3.7 5.4 × 10⁴ 1.6 × 10⁷
χc0 3.415 4.0 170 1.2 1.7 × 10⁴ 4.8 × 10⁶
χc2 3.556 0.46 85 0.59 8.5 × 10⁴ 2.4 × 10⁶
ηb 9.366 0.43 0.32 0.0028 32 1.1 × 10³
χb0 9.860 2.5 × 10⁻² 0.015 1.5 × 10⁻⁴ 1.5 600
χb2 9.913 6.7 × 10⁻³ 0.020 1.8 × 10⁻⁴ 2.0 720
The quarkonium states need to be detected exclusively. As an example, we discuss
charmonium measurements in Ca+Ca interactions. We restrict the event to 2, 4 or 6
charged tracks with the sum of the charges in the TPC equal to zero and not more than
2 photons in PHOS. Since no particle identification is assumed for the charged tracks,
all charged particles are assigned to be pions. The rates in Table 17 were simulated
the tphic generator [297]. Further selection criteria were applied to restrict the sum
of the transverse momenta of the detected particles to∑pT < 50 MeV/c. The main
source of simulated background, γγ → X, had to pass the same selection criteria as the
charmonium signal. The γγ → X cross section in Ca+Ca collisions with Wγγ > 2.3 GeV
is 0.38 mb, corresponding to 1.5 × 10⁹ events in a 106 s run.
Figure 88 shows the number of events as a function of invariant mass in the central
ALICE detectors with (left-hand side) and without (right-hand side) the background.
The peaks at the ηc, χc0 and χc2 masses are visible. The mass spectrum after background
subtraction, fitted by an exponential, is shown on the right-hand side of Fig. 88.
During one run, ∼ 7000 ηc, 1200 χc0, and 700 χc2 can be detected. The non-resonant
background, as well as additional peaks to the left of the charmonium states are
explained by misidentification of charged tracks which spreads the invariant mass of
the detected system and shifts it to lower masses. Note that the background from
γIP → J/ψ → γηc, larger than the γγ → ηc rate, has not been included. These events
may swamp the signal if the soft photon is not identified.
The bottomonium states are much harder to detect. The main decay channel for
C-even bottomonium is to two gluons. Due to the high mass, the number of hadrons
produced by gluon fragmentation is rather large. The average multiplicity of the ηbdecay products is predicted to be 18. There are many π0s and strange mesons among
the final-state particles. Due to the restricted ALICE acceptance, especially the small
aperture of PHOS, the probability of detecting all the bottomonium decay products is
very low. We simulated 105 ηb events, ∼ 100 times higher than the production rate, and
reconstructed none of them. Therefore ηb and χb detection in ALICE remains an open
question.
160
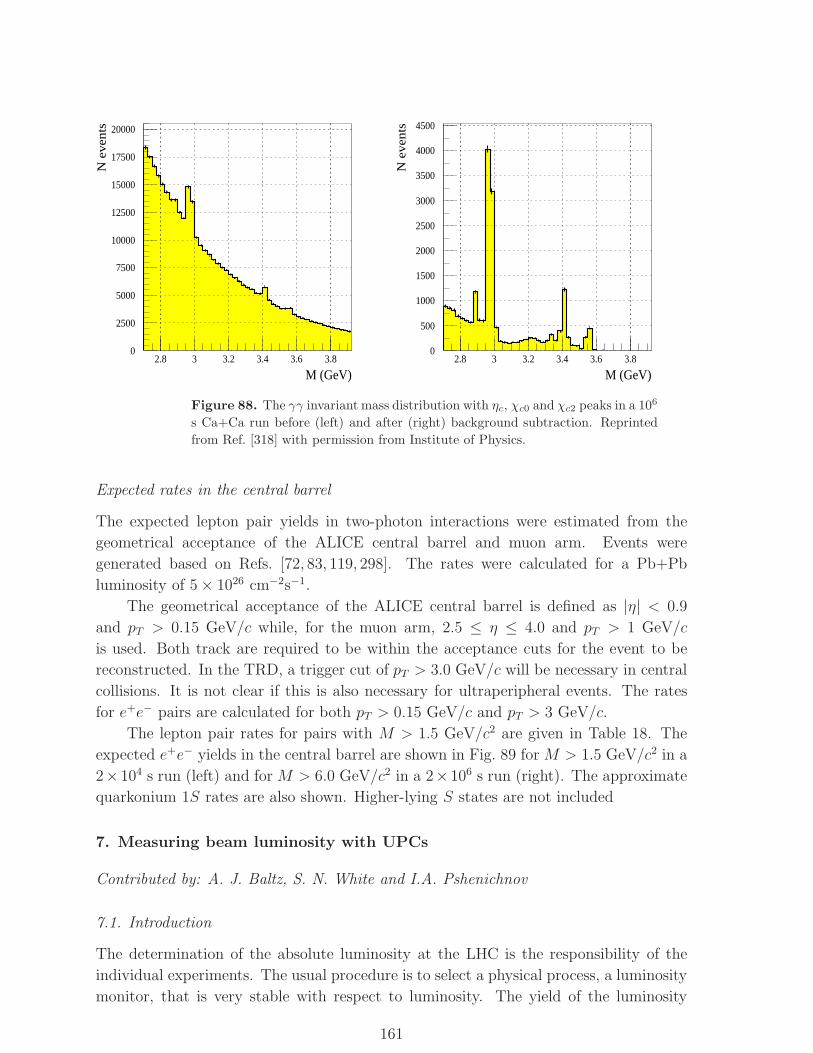
0
2500
5000
7500
10000
12500
15000
17500
20000
2.8 3 3.2 3.4 3.6 3.8
M (GeV)
N e
vent
s
0
500
1000
1500
2000
2500
3000
3500
4000
4500
2.8 3 3.2 3.4 3.6 3.8
M (GeV)
N e
vent
sFigure 88. The γγ invariant mass distribution with ηc, χc0 and χc2 peaks in a 106
s Ca+Ca run before (left) and after (right) background subtraction. Reprinted
from Ref. [318] with permission from Institute of Physics.
Expected rates in the central barrel
The expected lepton pair yields in two-photon interactions were estimated from the
geometrical acceptance of the ALICE central barrel and muon arm. Events were
generated based on Refs. [72, 83, 119, 298]. The rates were calculated for a Pb+Pb
luminosity of 5 × 1026 cm−2s−1.
The geometrical acceptance of the ALICE central barrel is defined as |η| < 0.9
and pT > 0.15 GeV/c while, for the muon arm, 2.5 ≤ η ≤ 4.0 and pT > 1 GeV/c
is used. Both track are required to be within the acceptance cuts for the event to be
reconstructed. In the TRD, a trigger cut of pT > 3.0 GeV/c will be necessary in central
collisions. It is not clear if this is also necessary for ultraperipheral events. The rates
for e+e− pairs are calculated for both pT > 0.15 GeV/c and pT > 3 GeV/c.
The lepton pair rates for pairs with M > 1.5 GeV/c2 are given in Table 18. The
expected e+e− yields in the central barrel are shown in Fig. 89 for M > 1.5 GeV/c2 in a
2×10⁴ s run (left) and for M > 6.0 GeV/c2 in a 2×10⁶ s run (right). The approximate
quarkonium 1S rates are also shown. Higher-lying S states are not included
7. Measuring beam luminosity with UPCs
Contributed by: A. J. Baltz, S. N. White and I.A. Pshenichnov
7.1. Introduction
The determination of the absolute luminosity at the LHC is the responsibility of the
individual experiments. The usual procedure is to select a physical process, a luminosity
monitor, that is very stable with respect to luminosity. The yield of the luminosity
161
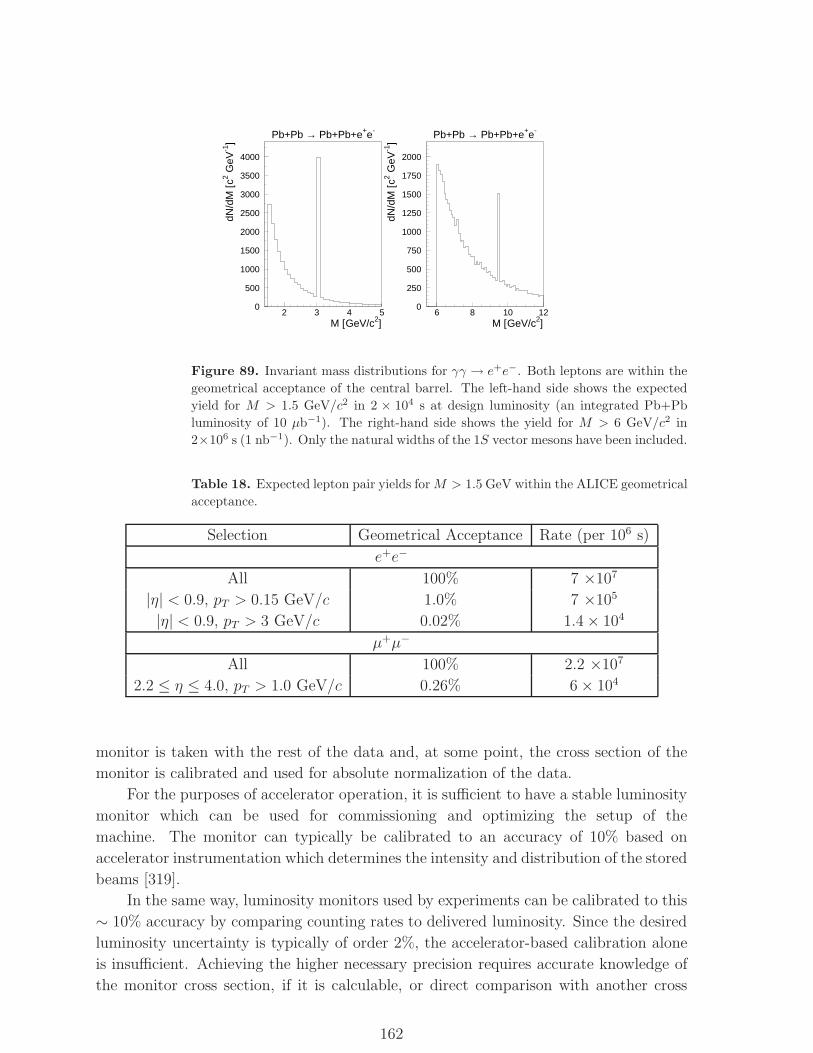
M [GeV/c2]
dN/d
M [c
2 GeV
-1]
Pb+Pb → Pb+Pb+e+e-
M [GeV/c2]
dN/d
M [c
2 GeV
-1]
Pb+Pb → Pb+Pb+e+e-
0
500
1000
1500
2000
2500
3000
3500
4000
2 3 4 50
250
500
750
1000
1250
1500
1750
2000
6 8 10 12
Figure 89. Invariant mass distributions for γγ → e+e−. Both leptons are within the
geometrical acceptance of the central barrel. The left-hand side shows the expected
yield for M > 1.5 GeV/c2 in 2 × 10⁴ s at design luminosity (an integrated Pb+Pb
luminosity of 10 µb−1). The right-hand side shows the yield for M > 6 GeV/c2 in
2×10⁶ s (1 nb−1). Only the natural widths of the 1S vector mesons have been included.
Table 18. Expected lepton pair yields forM > 1.5 GeV within the ALICE geometrical
acceptance.
Selection Geometrical Acceptance Rate (per 106 s)
e+e−
All 100% 7 ×10⁷
|η| < 0.9, pT > 0.15 GeV/c 1.0% 7 ×10⁵
|η| < 0.9, pT > 3 GeV/c 0.02% 1.4 × 10⁴
µ+µ−
All 100% 2.2 ×10⁷
2.2 ≤ η ≤ 4.0, pT > 1.0 GeV/c 0.26% 6 × 10⁴
monitor is taken with the rest of the data and, at some point, the cross section of the
monitor is calibrated and used for absolute normalization of the data.
For the purposes of accelerator operation, it is sufficient to have a stable luminosity
monitor which can be used for commissioning and optimizing the setup of the
machine. The monitor can typically be calibrated to an accuracy of 10% based on
accelerator instrumentation which determines the intensity and distribution of the stored
beams [319].
In the same way, luminosity monitors used by experiments can be calibrated to this
∼ 10% accuracy by comparing counting rates to delivered luminosity. Since the desired
luminosity uncertainty is typically of order 2%, the accelerator-based calibration alone
is insufficient. Achieving the higher necessary precision requires accurate knowledge of
the monitor cross section, if it is calculable, or direct comparison with another cross
162
section.
There are electromagnetic processes which can be calculated to the required
accuracy both for heavy-ion and proton beams at the LHC. Since lepton pair production
depends primarily on the ion charge and only weakly on its internal structure, it may
be a good ion monitor process. The new ion luminosity monitoring technique, described
in the following sections, is usable during normal beam conditions and is a by-product
of heavy-ion data taking.
Luminosity measurements in pp collisions are more problematic than in the Pb+Pb
scenario described below since there are no large cross sections which are both calculable
and free of detector modeling. Instead both ATLAS [94] and CMS/TOTEM [29] plan
to measure small angle pp elastic scattering during runs with special optics at relatively
low luminosity. Elastic scattering data can yield an absolute luminosity measurement
if it can be extended into the calculable pure Coulomb regime, as proposed by
ATLAS. Alternatively, TOTEM has proposed using a luminosity-independent method
for deriving the total cross section to normalize the elastic scattering data. In both
cases, the expected uncertainty in the luminosity determination is roughly the desired
2%.
In order to make effective use of the precision luminosity measurements in the elastic
scattering runs, a stable monitor of the relative luminosity which can be employed
both during the special runs and high luminosity runs is needed. It is critical that
this monitor be relatively insensitive to machine-related background processes since
the machine luminosities differ by a large factor. Although ATLAS has a system of
counters designed for this purpose (LUCID), both ATLAS and CMS can use the ZDCs
developed for heavy-ion runs in pp monitoring. The ZDCs are stable monitors but need
to be calibrated. The ZDC cross section is predicted to be ∼ 9% of the inelastic cross
section. Thus pp elastic scattering can then be used to calibrate the ZDC so that the
ZDCs can be used to calibrate the accelerator-based measurements and calculate the
luminosity in pp and heavy-ion runs.
7.2. Luminosity monitoring at RHIC and LHC
In spite of the significant differences between the four RHIC experiments, all experiments
incorporated an identical minimum bias interaction trigger which served as a standard
luminosity monitor. The Zero Degree Calorimeters, ZDCs, trigger events in which at
least one neutron is emitted in each beam direction. The calorimeters planned for LHC,
like those at RHIC, will be sensitive to beam neutrons with transverse momentum
pT ≤ 200 MeV/c. Measurements at SPS and RHIC confirmed that, over the full range
of centralities, hadronic interactions of Pb or Au ions always result in neutron emission
within the ZDC acceptance.
In addition to these collisions, the ZDC trigger is sensitive to ultraperipheral
interactions resulting in mutual electromagnetic dissociation (MED). The MED
calculation, used for absolute luminosity determination, is discussed below. At
163
RHIC, data taken with the ZDC trigger were analyzed to determine the fraction of
electromagnetic events based on event topology and particle multiplicity. The total cross
section, including both hadronic and electromagnetic contributions, was calculated to
5% accuracy with the ZDC trigger.
The RHIC ZDC cross section, σtot, is 10.8 b for Au+Au collisions at√s
NN= 130
GeV. A similar calculation predicts 14.8 b for Pb+Pb collisions at√s
NN= 5.5 TeV.
Further measurements at RHIC, which will improve the accuracy of the ZDC cross
section, are expected to reduce the uncertainty in the LHC prediction to ∼ 2%.
7.3. Mutual electromagnetic dissociation as a luminosity monitor
A method to measure and monitor beam luminosity in heavy-ion colliders was proposed
in Ref. [88]. According to this method, the rate of mutual electromagnetic dissociation
events, RMED, measured by the ZDCs provides the luminosity,
L =RMED
σMED, (142)
if the mutual electromagnetic dissociation cross section, σMED, is computed with
sufficient accuracy. Simultaneous forward-backward single neutron emission from each
beam is a clear signature of mutual electromagnetic dissociation which proceeds by
mutual virtual photon absorption. The excitation and subsequent decay of the Giant
Dipole Resonances (GDR) in both nuclei is responsible for the bulk of this process. In
heavy nuclei, such as gold or lead, single neutron emission, 1n, is the main mechanism
of GDR decay.
Measurements of neutron emission in mutual dissociation of gold nuclei recently
performed at RHIC give some confidence in the ZDC technique [320], including the
theoretical interpretation of the data necessary for the luminosity measurements [110].
Table 19, from Ref. [110], presents the measured ratios of the ZDC hadronic cross
section, σgeom, to the total ZDC cross section, σtot, including mutual electromagnetic
dissociation. This ratio agrees well with both Weizsacker-Williams calculations
employing measured photodissociation cross sections as input [88] and with reldis
calculations [109].
Figure 90 shows the energy spectrum obtained in one ZDC when the opposite ZDC
measures only one neutron. Requiring only one neutron in one of the ZDCs provides
“Coulomb” event selection. The total number of events in the spectrum of Fig. 90 after
background subtraction corresponds to the cross section σ(1nX|D) for the (1nX|D)
topology. Here 1n signifies one neutron, X denotes the undetected particles emitted
along with the single neutron and D denotes an arbitrary dissociation mode for the
other nucleus.
The decay topology (1nX|1nY ) corresponds to exactly one neutron in each ZDC
accompanied by undetected particles X and Y respectively and gives rise to the highest
peak in the energy spectrum shown in Fig. 90. The topology trigger with a single
neutron in each ZDC is about 35% of the total (1nX|D) topology, as shown in Table 19.
164
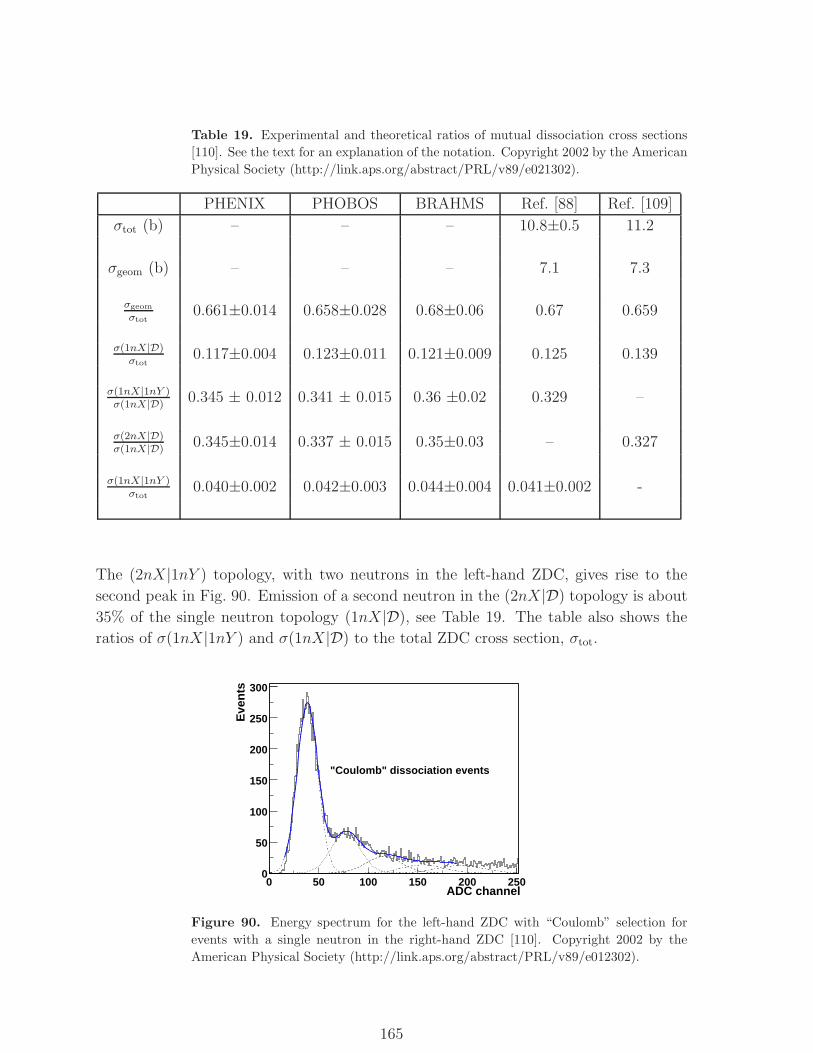
Table 19. Experimental and theoretical ratios of mutual dissociation cross sections
[110]. See the text for an explanation of the notation. Copyright 2002 by the American
Physical Society (http://link.aps.org/abstract/PRL/v89/e021302).
PHENIX PHOBOS BRAHMS Ref. [88] Ref. [109]
σtot (b) – – – 10.8±0.5 11.2
σgeom (b) – – – 7.1 7.3
σgeom
σtot0.661±0.014 0.658±0.028 0.68±0.06 0.67 0.659
σ(1nX|D)σtot
0.117±0.004 0.123±0.011 0.121±0.009 0.125 0.139
σ(1nX|1nY )σ(1nX|D)
0.345 ± 0.012 0.341 ± 0.015 0.36 ±0.02 0.329 –
σ(2nX|D)σ(1nX|D)
0.345±0.014 0.337 ± 0.015 0.35±0.03 – 0.327
σ(1nX|1nY )σtot
0.040±0.002 0.042±0.003 0.044±0.004 0.041±0.002 -
The (2nX|1nY ) topology, with two neutrons in the left-hand ZDC, gives rise to the
second peak in Fig. 90. Emission of a second neutron in the (2nX|D) topology is about
35% of the single neutron topology (1nX|D), see Table 19. The table also shows the
ratios of σ(1nX|1nY ) and σ(1nX|D) to the total ZDC cross section, σtot.
ADC channel0 50 100 150 200 250
Eve
nts
0
50
100
150
200
250
300
"Coulomb" dissociation events
Figure 90. Energy spectrum for the left-hand ZDC with “Coulomb” selection for
events with a single neutron in the right-hand ZDC [110]. Copyright 2002 by the
American Physical Society (http://link.aps.org/abstract/PRL/v89/e012302).
165
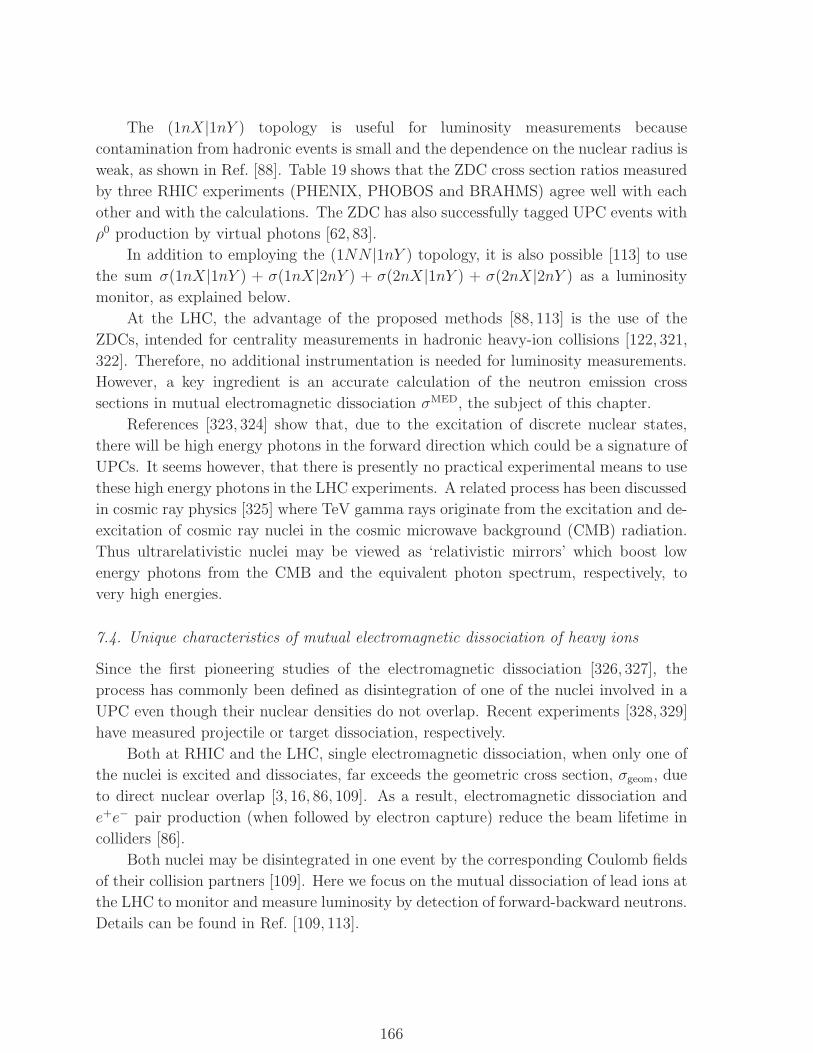
The (1nX|1nY ) topology is useful for luminosity measurements because
contamination from hadronic events is small and the dependence on the nuclear radius is
weak, as shown in Ref. [88]. Table 19 shows that the ZDC cross section ratios measured
by three RHIC experiments (PHENIX, PHOBOS and BRAHMS) agree well with each
other and with the calculations. The ZDC has also successfully tagged UPC events with
ρ0 production by virtual photons [62, 83].
In addition to employing the (1NN |1nY ) topology, it is also possible [113] to use
the sum σ(1nX|1nY ) + σ(1nX|2nY ) + σ(2nX|1nY ) + σ(2nX|2nY ) as a luminosity
monitor, as explained below.
At the LHC, the advantage of the proposed methods [88, 113] is the use of the
ZDCs, intended for centrality measurements in hadronic heavy-ion collisions [122, 321,
322]. Therefore, no additional instrumentation is needed for luminosity measurements.
However, a key ingredient is an accurate calculation of the neutron emission cross
sections in mutual electromagnetic dissociation σMED, the subject of this chapter.
References [323, 324] show that, due to the excitation of discrete nuclear states,
there will be high energy photons in the forward direction which could be a signature of
UPCs. It seems however, that there is presently no practical experimental means to use
these high energy photons in the LHC experiments. A related process has been discussed
in cosmic ray physics [325] where TeV gamma rays originate from the excitation and de-
excitation of cosmic ray nuclei in the cosmic microwave background (CMB) radiation.
Thus ultrarelativistic nuclei may be viewed as ‘relativistic mirrors’ which boost low
energy photons from the CMB and the equivalent photon spectrum, respectively, to
very high energies.
7.4. Unique characteristics of mutual electromagnetic dissociation of heavy ions
Since the first pioneering studies of the electromagnetic dissociation [326, 327], the
process has commonly been defined as disintegration of one of the nuclei involved in a
UPC even though their nuclear densities do not overlap. Recent experiments [328, 329]
have measured projectile or target dissociation, respectively.
Both at RHIC and the LHC, single electromagnetic dissociation, when only one of
the nuclei is excited and dissociates, far exceeds the geometric cross section, σgeom, due
to direct nuclear overlap [3, 16, 86, 109]. As a result, electromagnetic dissociation and
e+e− pair production (when followed by electron capture) reduce the beam lifetime in
colliders [86].
Both nuclei may be disintegrated in one event by the corresponding Coulomb fields
of their collision partners [109]. Here we focus on the mutual dissociation of lead ions at
the LHC to monitor and measure luminosity by detection of forward-backward neutrons.
Details can be found in Ref. [109, 113].
166

7.5. Leading order mutual electromagnetic Pb+Pb dissociation
The Weizsacker-Williams method [3, 16] treats the impact of the Lorentz-boosted
Coulomb field of nucleus A as the absorption of equivalent photons by nucleus B.
Figure 91 shows the leading and next-to-leading order processes contributing
to mutual electromagnetic dissociation, with each order treated independently (see
Refs. [84, 109] for details). The open and closed circles on the diagrams denote elastic
and inelastic vertices, respectively. Thus, at LO, a photon with energy E1 is exchanged
between A and B, leaving B in excited state B∗ after absorption of the photon. A photon
with energy E2 is exchanged between B∗ and A and absorbed by A, exciting it to A∗.
Both excited nuclei dissociate. There is no time ordering and, for calculational purposes,
the photon emission spectrum does not depend on whether the nuclei are excited or not.
The photon exchange between ground-state nuclei is the primary exchange while the
photon exchange between an excited nucleus and a ground-state nucleus is a secondary
photon exchange. There is a complementary diagram to NLO12, NLO21, where nucleus
B is excited by double photon absorption while A is excited by single photon absorption.
The cross section for dissociation of A and/or B to final states i and j (single and
mutual dissociation) respectively, is
σ(S,M)ED(i|j) = 2π
∞∫
bc
db b P iA(b)P j
B(b) (143)
where SED stands for dissociation of only one of the nuclei (single electromagnetic
dissociation) and MED is for mutual electromagnetic dissociation. When only one
nucleus is dissociated, the cross section includes only one probability factor, i.e.
either P iA(b) or P j
B(b) is unity. The lower limit of integration, bc, is a sharp cutoff,
approximately given by the sum of the nuclear radii, bc ≈ RA + RB, to separate
the nuclear and electromagnetic interaction domains. The choice of the lower limit
is discussed further in Sec. 7.7. In Eq. (143), probability for dissociation of B at impact
parameter b is defined as
P jB(b) = e−mB(b)
Emax∫
Emin
dE1d3NγA
dE1d2bσB(E1) fB(E1, j) (144)
where mB(b) is the mean number of photons absorbed by nucleus B,
mB(b) =
Emax∫
Emin
dE1
dN3γA
dE1d2bσB(E1) . (145)
Here dNγA/dE1d2b is the virtual photon spectra from nucleus A at b from Eq. (5),
σB(E1) and fB(E1, j) are the total photo-absorption cross section and the branching
ratio for dissociation into final state j due to absorption of a photon with energy E1
by B [109]. The expression for P iA(b) is obtained by exchanging subscripts and taking
j → i. The neutron emission threshold is used for Emin while Emax ≈ γL/RA,B. In the
case of a collider, the Lorentz factor of the heavy-ion beam is boosted to the rest frame
167
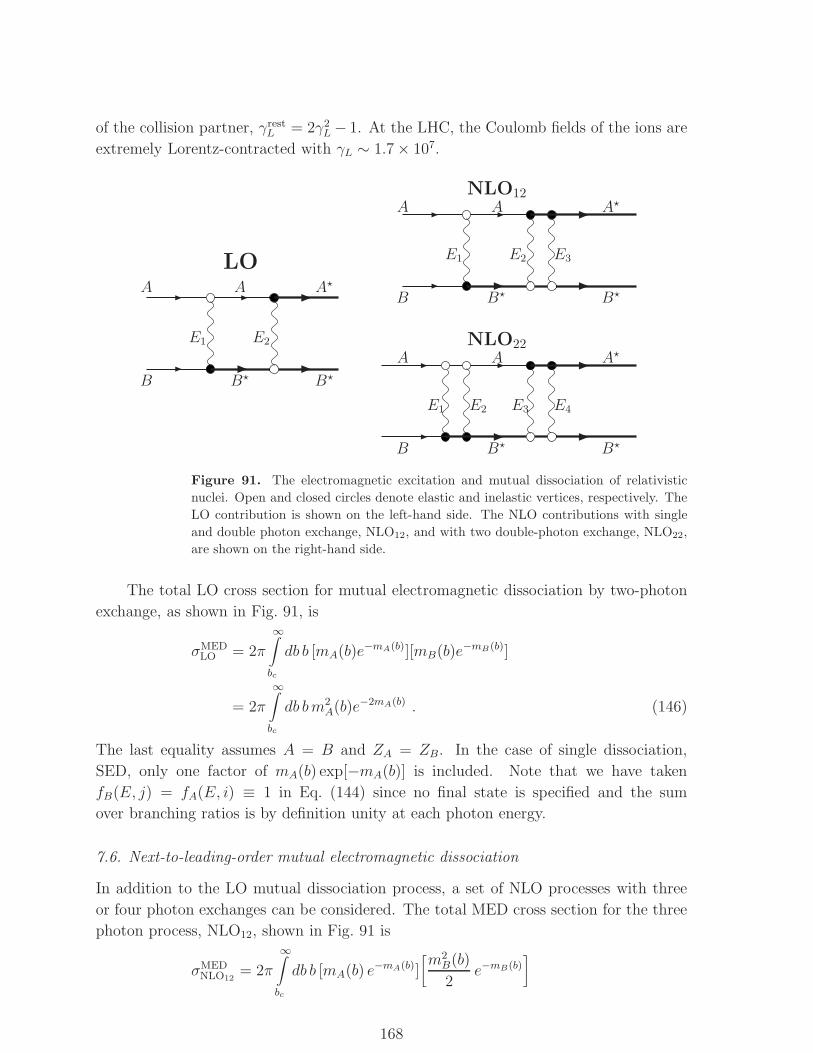
of the collision partner, γrestL = 2γ2
L− 1. At the LHC, the Coulomb fields of the ions are
extremely Lorentz-contracted with γL ∼ 1.7 × 10⁷.
LOA A
E1
B B⋆ B⋆
E2
A⋆
NLO12A A
E1
B B⋆ B⋆
E2 E3
A⋆
NLO22A A
E1 E2
B B⋆ B⋆
E3 E4
A⋆
Figure 91. The electromagnetic excitation and mutual dissociation of relativistic
nuclei. Open and closed circles denote elastic and inelastic vertices, respectively. The
LO contribution is shown on the left-hand side. The NLO contributions with single
and double photon exchange, NLO12, and with two double-photon exchange, NLO22,
are shown on the right-hand side.
The total LO cross section for mutual electromagnetic dissociation by two-photon
exchange, as shown in Fig. 91, is
σMEDLO = 2π
∞∫
bc
db b [mA(b)e−mA(b)][mB(b)e−mB(b)]
= 2π
∞∫
bc
db bm2A(b)e−2mA(b) . (146)
The last equality assumes A = B and ZA = ZB. In the case of single dissociation,
SED, only one factor of mA(b) exp[−mA(b)] is included. Note that we have taken
fB(E, j) = fA(E, i) ≡ 1 in Eq. (144) since no final state is specified and the sum
over branching ratios is by definition unity at each photon energy.
7.6. Next-to-leading-order mutual electromagnetic dissociation
In addition to the LO mutual dissociation process, a set of NLO processes with three
or four photon exchanges can be considered. The total MED cross section for the three
photon process, NLO12, shown in Fig. 91 is
σMEDNLO12
= 2π
∞∫
bc
db b [mA(b) e−mA(b)][m2B(b)
2e−mB(b)
]
168

= 2π
∞∫
bc
db bm3A(b)
2e−2mA(b) (147)
where again A = B is assumed in the last equality. The complementary process, NLO21,
with the excitation of B via double photon absorption is equally possible and has the
same cross section. Likewise the total SED cross section for breakup of one nucleus by
exchange of two photons is
σSEDNLO2
= 2π
∞∫
bc
db bm2A(b)
2e−mA(b) . (148)
The MED cross section for four photon exchange, denoted NLO22 in Fig. 91, is
σMEDNLO22
= 2π
∞∫
bc
db b[m2A(b)
2e−mA(b)
][m2B(b)
2e−mB(b)
]
= 2π
∞∫
bc
db bm4A(b)
4e−2mA(b) (149)
when A = B in the last equality. The SED cross section for exchange of three or more
photons is the sum over the series [mnA(b)/n!] for n ≥ 3,
σSEDNLO3+
= 2π
∞∫
bc
db b e−mA(b)∞∑
n=3
mnA(b)
n!. (150)
In MED, the exchange of at least three photons on one side is referred to as triple
excitation or NLOTR.
One can calculate the sum of all contributions to single and mutual electromagnetic
exchange using the prescription of Ref. [88]:
σS(M)EDtot = 2π
∞∫
bc
db b [1 − e−mA(b)]E (151)
where E = 1 for SED and 2 for MED. Since the collision probability for each ion without
photon exchange is equal to exp[−mA(b)], Eq. (151) is evident.
In a more detailed treatment, the character of the intermediate state would be
considered since a given photon energy E1 leads to a specific set of intermediate states.
The excitation cross sections of the intermediate states differ somewhat relative to the
unexcited nuclei introducing correlations between the photon energies which are not
considered here.
7.7. Hadronic nuclear dissociation in grazing collisions
At grazing impact parameters, b ∼ RA + RB, nuclei are partly transparent to each
other. Hadronic nucleon-nucleon collisions may be absent in peripheral events with
a weak overlap of diffuse nuclear surfaces while electromagnetic interactions may lead
to electromagnetic dissociation. Both hadronic and electromagnetic interactions may
occur in the same event. For example, a neutron-neutron collision in the density overlap
169
zone may lead to neutron ejection accompanied by photon emission and absorption in
electromagnetic interactions.
Therefore, a smooth transition from purely nuclear collisions at b < RA + RB to
electromagnetic collisions at b > RA + RB takes place. Such a transition region was
considered in the “soft-sphere” model of Ref. [330]. A similar approach was adopted in
Ref. [88], where the cross section for nuclear or electromagnetic dissociation alone or for
both together was written in an unexponentiated form as
σ = 2π∫ ∞
0db b
(Pnuc(b) + PED(b) −Pnuc(b)PED(b)
)(152)
where Pnuc(b) and PED(b) are the probabilities of nuclear and electromagnetic
dissociation at b. Including the limits of integration for each term separately, we have
σ = 2π∫ bnuc
c
0db bPnuc(b) + 2π
∫ ∞
bEDc
db bPED(b)
− 2π∫ bnuc
c
bEDc
db bPnuc(b)PED(b) . (153)
Here individual impact parameter cutoff values, bnucc and bED
c , were used for the nuclear
and electromagnetic interactions. However, the simpler expression,
σ = σnuc + σED = 2π∫ bc
0db bPnuc(b) + 2π
∫ ∞
bcdb bPED(b), (154)
is widely used with a single cutoff, bc, chosen so that bEDc < bc < bnuc
c . Using a single
cutoff allows the first and second terms of Eq. (153) to be simplified while the third term
is eliminated. Numerical results based on Eqs. (153) and (154) are similar, as shown for
the “sharp-cutoff” and “soft-sphere” models of Ref. [330]. In the case of heavy nuclei,
the difference between realistic values of bEDc , bnuc
c and bc is less than 1 fm. As a result, the
third term in Eq. (153) turns out to be small. Finally, the nuclear and electromagnetic
contributions can be studied separately using Eq. (154). This separation is important
for understanding nuclear and electromagnetic dissociation at ultrarelativistic colliders
where the nuclear and electromagnetic interaction products populate different, non-
overlapping rapidity regions. In the widely-used BCV parametrization [331], bc is
bc = RBCV(A1/3 +B1/3 −XBCV(A−1/3 +B−1/3)) . (155)
The parameters RBCV = 1.34 fm and XBCV = 0.75 are obtained by fitting Glauber-type
calculations of the total nuclear reaction cross Sections [331]. The fragment angular
distributions, very sensitive to bc, can be described by the BCV parametrization [332].
Even when the nuclear densities partly overlap and only a few nucleon-nucleon
collisions occur, intense hadron production is expected at LHC energies. These
secondary hadrons will be produced at midrapidity while neutrons from electromagnetic
dissociation are emitted close to beam rapidity. This difference can be used to
disentangle hadronic and electromagnetic dissociation.
170
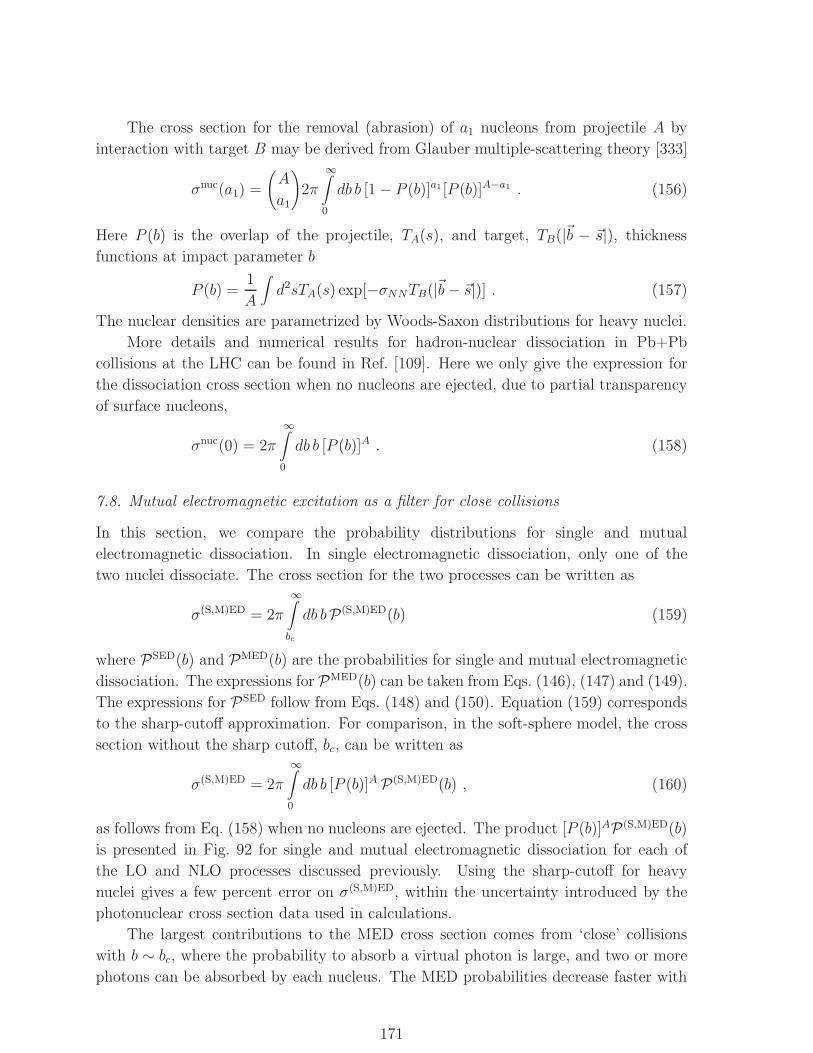
The cross section for the removal (abrasion) of a1 nucleons from projectile A by
interaction with target B may be derived from Glauber multiple-scattering theory [333]
σnuc(a1) =
(A
a1
)2π
∞∫
0
db b [1 − P (b)]a1 [P (b)]A−a1 . (156)
Here P (b) is the overlap of the projectile, TA(s), and target, TB(|~b − ~s|), thickness
functions at impact parameter b
P (b) =1
A
∫d2sTA(s) exp[−σNNTB(|~b− ~s|)] . (157)
The nuclear densities are parametrized by Woods-Saxon distributions for heavy nuclei.
More details and numerical results for hadron-nuclear dissociation in Pb+Pb
collisions at the LHC can be found in Ref. [109]. Here we only give the expression for
the dissociation cross section when no nucleons are ejected, due to partial transparency
of surface nucleons,
σnuc(0) = 2π
∞∫
0
db b [P (b)]A . (158)
7.8. Mutual electromagnetic excitation as a filter for close collisions
In this section, we compare the probability distributions for single and mutual
electromagnetic dissociation. In single electromagnetic dissociation, only one of the
two nuclei dissociate. The cross section for the two processes can be written as
σ(S,M)ED = 2π
∞∫
bc
db bP(S,M)ED(b) (159)
where PSED(b) and PMED(b) are the probabilities for single and mutual electromagnetic
dissociation. The expressions for PMED(b) can be taken from Eqs. (146), (147) and (149).
The expressions for PSED follow from Eqs. (148) and (150). Equation (159) corresponds
to the sharp-cutoff approximation. For comparison, in the soft-sphere model, the cross
section without the sharp cutoff, bc, can be written as
σ(S,M)ED = 2π
∞∫
0
db b [P (b)]A P(S,M)ED(b) , (160)
as follows from Eq. (158) when no nucleons are ejected. The product [P (b)]AP(S,M)ED(b)
is presented in Fig. 92 for single and mutual electromagnetic dissociation for each of
the LO and NLO processes discussed previously. Using the sharp-cutoff for heavy
nuclei gives a few percent error on σ(S,M)ED, within the uncertainty introduced by the
photonuclear cross section data used in calculations.
The largest contributions to the MED cross section comes from ‘close’ collisions
with b ∼ bc, where the probability to absorb a virtual photon is large, and two or more
photons can be absorbed by each nucleus. The MED probabilities decrease faster with
171
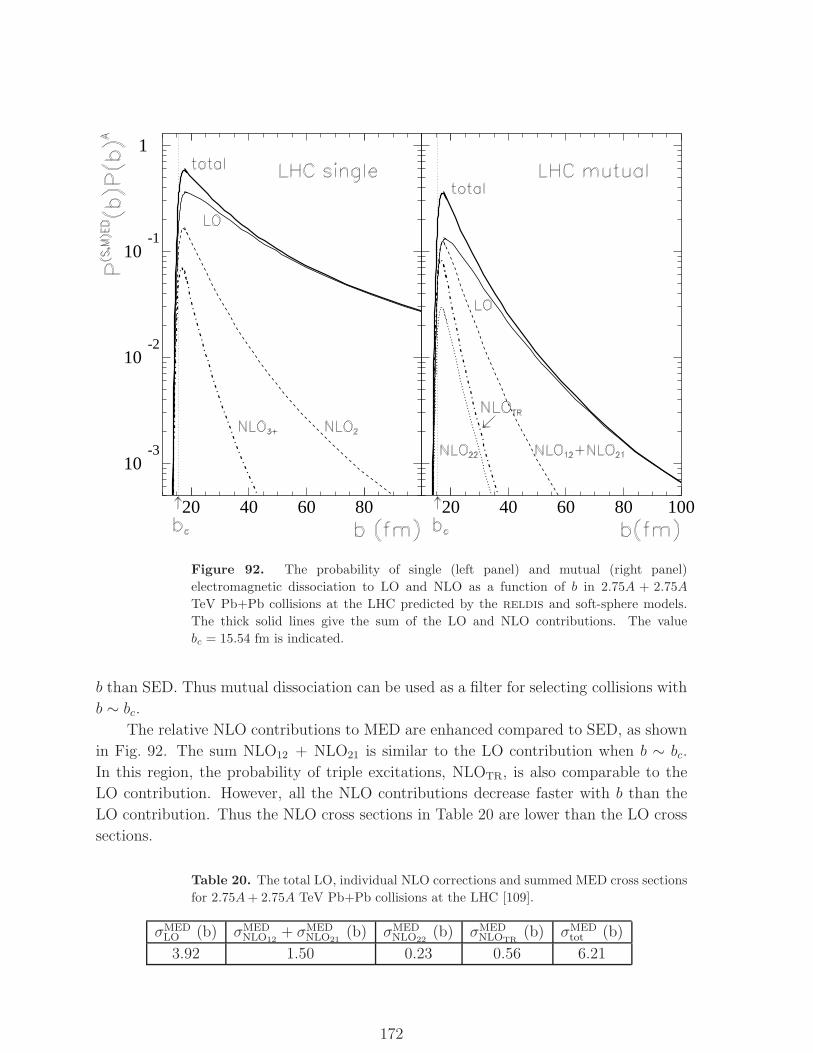
10-3
10-2
10-1
1
20 40 60 80 20 40 60 80 100
Figure 92. The probability of single (left panel) and mutual (right panel)
electromagnetic dissociation to LO and NLO as a function of b in 2.75A + 2.75A
TeV Pb+Pb collisions at the LHC predicted by the reldis and soft-sphere models.
The thick solid lines give the sum of the LO and NLO contributions. The value
bc = 15.54 fm is indicated.
b than SED. Thus mutual dissociation can be used as a filter for selecting collisions with
b ∼ bc.
The relative NLO contributions to MED are enhanced compared to SED, as shown
in Fig. 92. The sum NLO12 + NLO21 is similar to the LO contribution when b ∼ bc.
In this region, the probability of triple excitations, NLOTR, is also comparable to the
LO contribution. However, all the NLO contributions decrease faster with b than the
LO contribution. Thus the NLO cross sections in Table 20 are lower than the LO cross
sections.
Table 20. The total LO, individual NLO corrections and summed MED cross sections
for 2.75A+ 2.75A TeV Pb+Pb collisions at the LHC [109].
σMEDLO (b) σMED
NLO12+ σMED
NLO21(b) σMED
NLO22(b) σMED
NLOTR(b) σMED
tot (b)
3.92 1.50 0.23 0.56 6.21
172

The MED cross sections presented here were calculated using the modified reldis
code [109] employing a special simulation mode for MED events. Table 20 gives
the inclusive LO, NLO12, NLO22, NLOTR contributions and total cross sections with
f(E, i) = f(E, j) = 1 in σMED(i|j). The LO contribution is ∼ 63% of σMED(tot) at LHC
energies. The sum of the NLO contributions gives an additional ∼ 28%. Therefore, the
remaining contribution, ∼ 9% of the total MED cross section, is due to exotic triple
nuclear excitations with three or more photons absorbed by at least one nucleus.
Electromagnetic heavy-ion excitation is widely used to study nuclear structure,
as demonstrated by fixed-target experiments at intermediate energies [334, 335].
Experimental studies of MED at the LHC can provide valuable information about double
and triple nuclear excitations in electromagnetic interactions, particularly for multi-
phonon resonances. Triple excitation data is very important for triple giant resonance
excitations since there are currently no data on such extreme excitations. The first
theoretical predictions for the energies and widths of such states are given in Ref. [336].
The number of forward neutrons emitted in the dissociation process and detected
in the ZDCs can be used to study multiple excitations, even when the ZDC resolution
cannot determine the exact number of neutrons in one of the ZDCs or for poor statistics.
To demonstrate the utility of the dissociation process, we assume that the dissociation
channel of one of the nuclei in MED is unknown. Then the inclusive MED cross sections,
σMED(1nX|D), σMED(2nX|D) and σMED(3nX|D) for emission of one, two and three
neutrons, by one of the nuclei, respectively, can be considered. The X indicates that
neutron emission can be accompanied by some number of undetected particles. In the
notation of Section 7.3, D denotes an arbitrary dissociation mode for the other nucleus
so that f(E, i) ≡ 1.
Table 21. The MED cross sections for 2.75A + 2.75A TeV Pb+Pb collisions at the
LHC whereX and Y denote other particles emitted from the nucleus with the neutrons
and D is an arbitrary dissociation channel for the other nucleus (f(E, i) = 1). Results
are given at LO alone and with the sum of the NLO contributions included [109].
Final State σLO (mb) σLO + σNLO12+ σNLO21
+ σNLO22(mb)
(1nX|1nY ) 750 805
(1nX|D) 1698 2107
(2nX|D) 443 654
(3nX|D) 241 465
The LHC cross sections for several MED channels are given in Table 21. The specific
branching ratios for the final-state channels, f(E, 1nX), f(E, 2nX) and f(E, 3nX), are
calculating by simulating neutron emission from a lead nucleus following the absorption
of photons with energy E. The probability PA in Eq. (144) is modified by the branching
ratio in the integral over E while the factor exp[−mA(b)] remains the same for both nuclei
when A = B. If one final-state neutron is required for both nuclei, the cross section
173
σMED(1nX|1nY ) is reduced relative to σMED(1nX|D) since both branching ratios are
included in the probabilities.
The relative NLO contributions are very different for one, two and three neutron
emission. The NLO contribution to σMED(1nX|1nY ) is small, ∼ 7%. On the other
hand, the NLO correction to σMED(3nX|D) is almost a factor of two. This large
increase is because the NLO processes shown in Fig. 91 include nuclear excitation due
to double photon absorption, particularly double GDR excitation. Since the average
GDR energy for gold and lead nuclei is ∼ 13 − 14 MeV, double GDR introduces, on
average, 26 − 28 MeV excitation, above the three neutron emission threshold. Thus
the 1n and 2n emission cross sections have smaller NLO corrections than the 3n cross
sections. Measurements of the forward 3n emission rates in ALICE may detect multiple
GDR excitations in lead.
7.9. Reliability of the reldis predictions
The reliability of the reldis code was studied in Ref. [109] by examining its sensitivity
to variations in the input data and parameters. A good description of the existing SED
data on lead and gold nuclei at the CERN SPS Refs. [111, 328, 329, 337] was obtained. As
shown in Sec. 7.3, good agreement with the first RHIC data on mutual dissociation [110]
was also found.
The photonuclear cross sections for specific neutron emission channels (f(E, i) 6= 1,
f(E, j) 6= 1) were calculated by two different models of photonuclear reactions,
gnash [338] and reldis, see Table 22 and Ref. [109] for details. In addition, two
different values for the probability of direct neutron emission in the 1n channel, P dirn = 0
and 0.26, were used in the reldis code.
At the LHC, secondary nuclei are produced by electromagnetic dissociation of beam
nuclei induced by interactions with residual gas and collimator material. These nuclear
fragments diverge from the primary beam because of their scattering angle and their
different Z/A relative to the primary beam. Since these fragments do not fall within
the acceptance of the collimation system, they induce a significant heat load in the
superconducting magnets when they hit the magnet vacuum chamber. The yields of
specific nuclear fragments from SED, MED and fragmentation of beam nuclei were
calculated using reldis and abrasion-ablation models to estimate the heat load at the
LHC [339, 340].
The cross sections for one or two neutron emission are given in Table 22 for different
maximum values of the photon energy, Eγ ≤ Emax, the upper limit in the energy integrals
in Eqs. (144) and (145). Results are shown for the GDR region, Eγ ≤ 24 MeV, energies
up to the quasi-deuteron absorption region, Eγ ≤ 140 MeV, and the full range. In
addition to the specified one and two neutron emission channels, a cumulative value,
the Low Multiplicity Neutron (LMN) emission cross section,
σMED(LMN) = σMED(1nX|1nY ) + σMED(1nX|2nY )
+ σMED(2nX|1nY ) + σMED(2nX|2nY ) , (161)
174
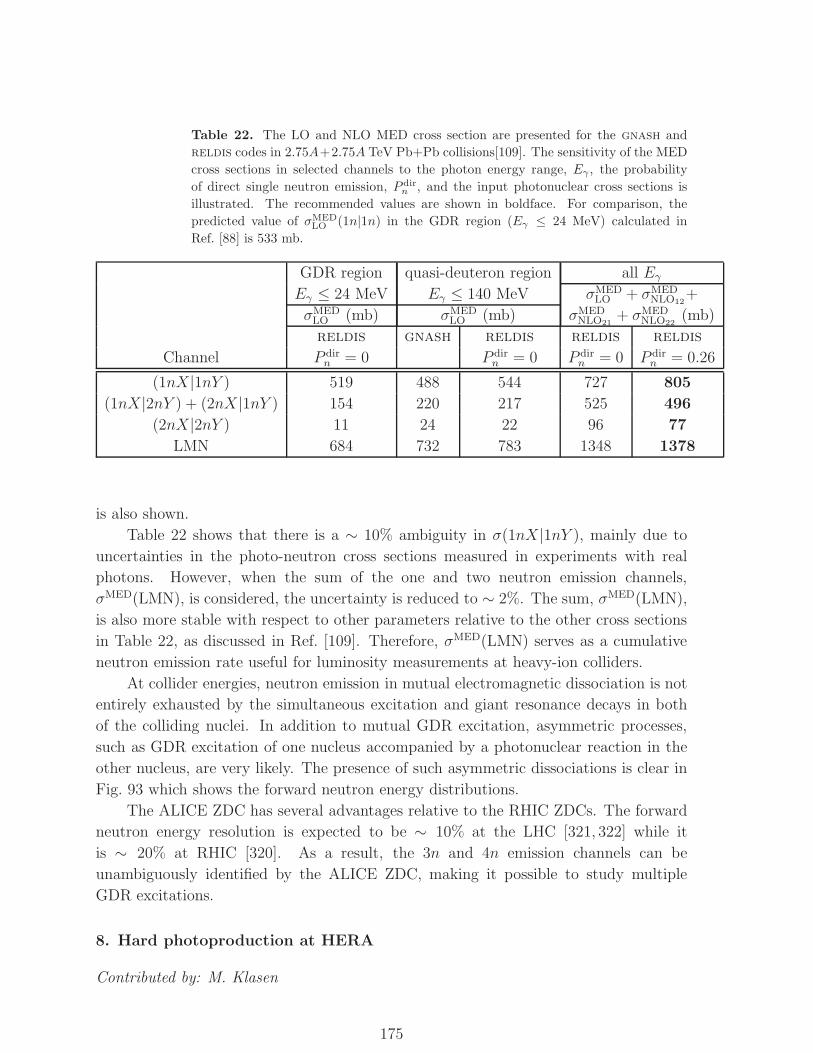
Table 22. The LO and NLO MED cross section are presented for the gnash and
reldis codes in 2.75A+2.75A TeV Pb+Pb collisions[109]. The sensitivity of the MED
cross sections in selected channels to the photon energy range, Eγ , the probability
of direct single neutron emission, P dirn , and the input photonuclear cross sections is
illustrated. The recommended values are shown in boldface. For comparison, the
predicted value of σMEDLO (1n|1n) in the GDR region (Eγ ≤ 24 MeV) calculated in
Ref. [88] is 533 mb.
GDR region quasi-deuteron region all EγEγ ≤ 24 MeV Eγ ≤ 140 MeV σMED
LO + σMEDNLO12
+
σMEDLO (mb) σMED
LO (mb) σMEDNLO21
+ σMEDNLO22
(mb)
reldis gnash reldis reldis reldis
Channel P dirn = 0 P dir
n = 0 P dirn = 0 P dir
n = 0.26
(1nX|1nY ) 519 488 544 727 805
(1nX|2nY ) + (2nX|1nY ) 154 220 217 525 496
(2nX|2nY ) 11 24 22 96 77
LMN 684 732 783 1348 1378
is also shown.
Table 22 shows that there is a ∼ 10% ambiguity in σ(1nX|1nY ), mainly due to
uncertainties in the photo-neutron cross sections measured in experiments with real
photons. However, when the sum of the one and two neutron emission channels,
σMED(LMN), is considered, the uncertainty is reduced to ∼ 2%. The sum, σMED(LMN),
is also more stable with respect to other parameters relative to the other cross sections
in Table 22, as discussed in Ref. [109]. Therefore, σMED(LMN) serves as a cumulative
neutron emission rate useful for luminosity measurements at heavy-ion colliders.
At collider energies, neutron emission in mutual electromagnetic dissociation is not
entirely exhausted by the simultaneous excitation and giant resonance decays in both
of the colliding nuclei. In addition to mutual GDR excitation, asymmetric processes,
such as GDR excitation of one nucleus accompanied by a photonuclear reaction in the
other nucleus, are very likely. The presence of such asymmetric dissociations is clear in
Fig. 93 which shows the forward neutron energy distributions.
The ALICE ZDC has several advantages relative to the RHIC ZDCs. The forward
neutron energy resolution is expected to be ∼ 10% at the LHC [321, 322] while it
is ∼ 20% at RHIC [320]. As a result, the 3n and 4n emission channels can be
unambiguously identified by the ALICE ZDC, making it possible to study multiple
GDR excitations.
8. Hard photoproduction at HERA
Contributed by: M. Klasen
175
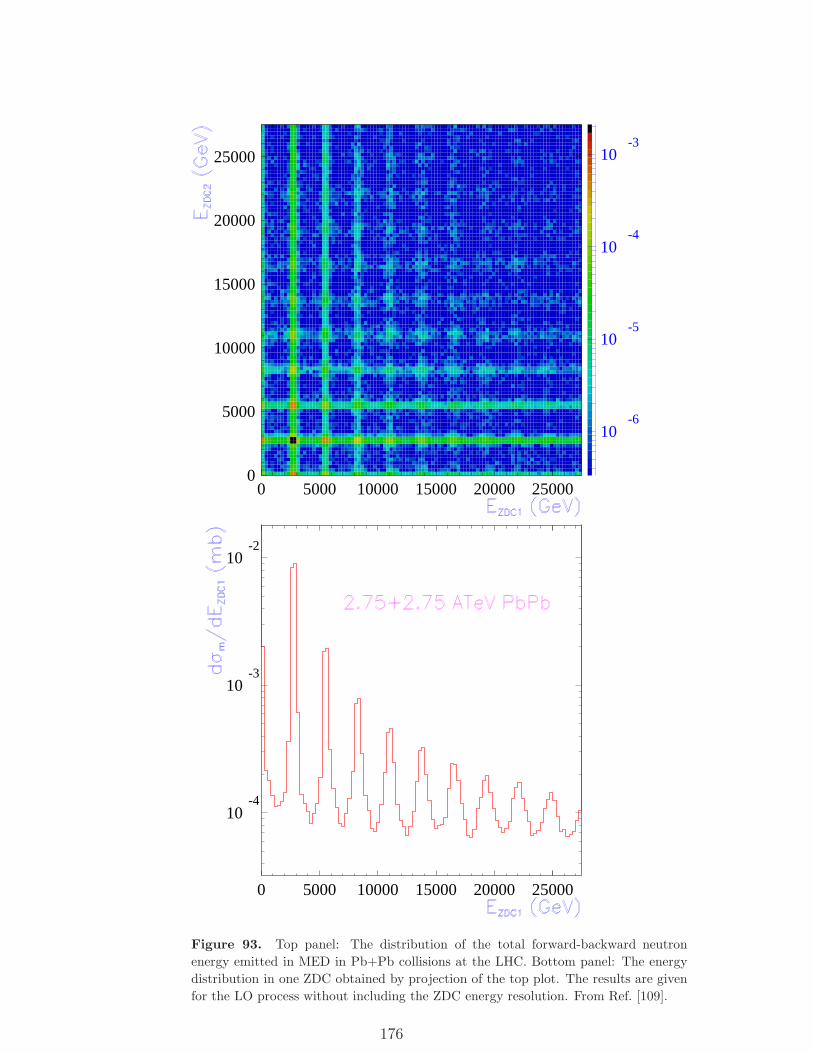
0
5000
10000
15000
20000
25000
0 5000 10000 15000 20000 25000
10-6
10-5
10-4
10-3
10-4
10-3
10-2
0 5000 10000 15000 20000 25000
Figure 93. Top panel: The distribution of the total forward-backward neutron
energy emitted in MED in Pb+Pb collisions at the LHC. Bottom panel: The energy
distribution in one ZDC obtained by projection of the top plot. The results are given
for the LO process without including the ZDC energy resolution. From Ref. [109].
176
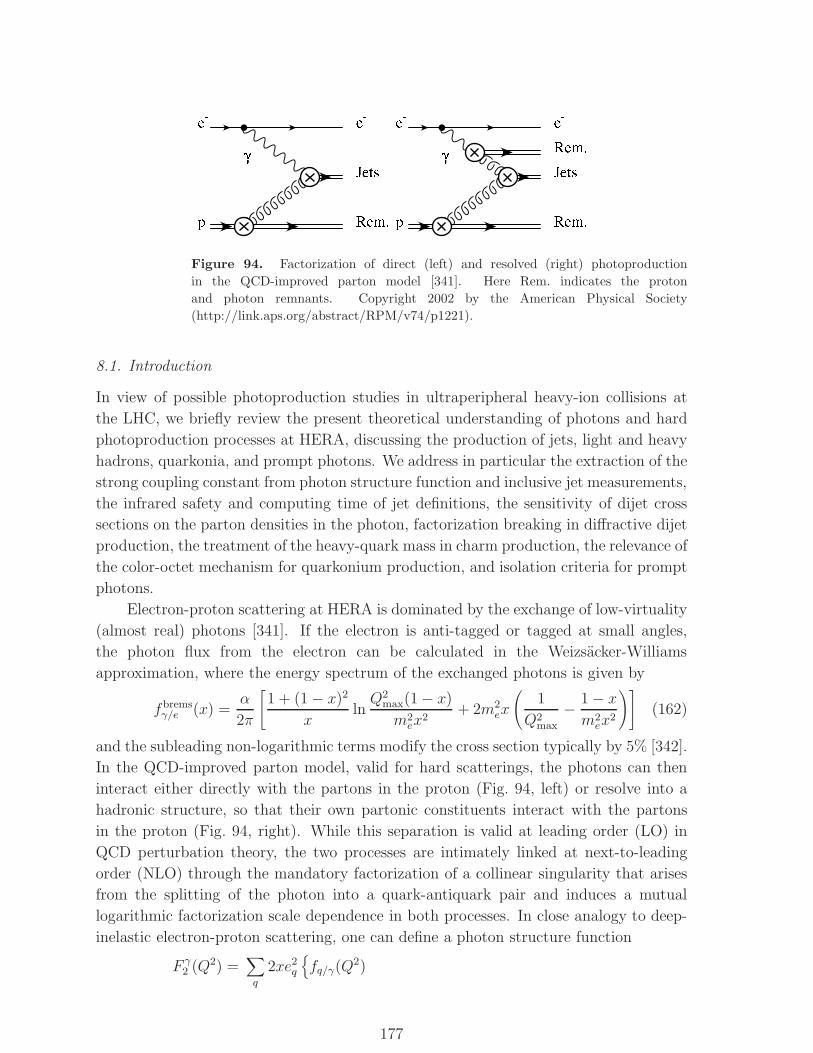
Figure 94. Factorization of direct (left) and resolved (right) photoproduction
in the QCD-improved parton model [341]. Here Rem. indicates the proton
and photon remnants. Copyright 2002 by the American Physical Society
(http://link.aps.org/abstract/RPM/v74/p1221).
8.1. Introduction
In view of possible photoproduction studies in ultraperipheral heavy-ion collisions at
the LHC, we briefly review the present theoretical understanding of photons and hard
photoproduction processes at HERA, discussing the production of jets, light and heavy
hadrons, quarkonia, and prompt photons. We address in particular the extraction of the
strong coupling constant from photon structure function and inclusive jet measurements,
the infrared safety and computing time of jet definitions, the sensitivity of dijet cross
sections on the parton densities in the photon, factorization breaking in diffractive dijet
production, the treatment of the heavy-quark mass in charm production, the relevance of
the color-octet mechanism for quarkonium production, and isolation criteria for prompt
photons.
Electron-proton scattering at HERA is dominated by the exchange of low-virtuality
(almost real) photons [341]. If the electron is anti-tagged or tagged at small angles,
the photon flux from the electron can be calculated in the Weizsacker-Williams
approximation, where the energy spectrum of the exchanged photons is given by
fbremsγ/e (x) =
α
2π
[1 + (1 − x)2
xlnQ2
max(1 − x)
m2ex
2+ 2m2
ex
(1
Q2max
− 1 − x
m2ex
2
)](162)
and the subleading non-logarithmic terms modify the cross section typically by 5% [342].
In the QCD-improved parton model, valid for hard scatterings, the photons can then
interact either directly with the partons in the proton (Fig. 94, left) or resolve into a
hadronic structure, so that their own partonic constituents interact with the partons
in the proton (Fig. 94, right). While this separation is valid at leading order (LO) in
QCD perturbation theory, the two processes are intimately linked at next-to-leading
order (NLO) through the mandatory factorization of a collinear singularity that arises
from the splitting of the photon into a quark-antiquark pair and induces a mutual
logarithmic factorization scale dependence in both processes. In close analogy to deep-
inelastic electron-proton scattering, one can define a photon structure function
F γ2 (Q2) =
∑
q
2xe2q{fq/γ(Q
2)
177
+αs(Q
2)
2π
[Cq ⊗ fq/γ(Q
2) + Cg ⊗ fg/γ(Q2)]+
α
2πe2qCγ
}(163)
that is related to the parton densities in the photon and has been measured in electron-
positron collisions at LEP. Even the strong coupling constant αs that appears in the
expression above can be determined rather precisely in fits to these data [343]. A
convenient modification of the MS factorization scheme consists in absorbing the point-
like Wilson coefficient
Cγ(x) = 2NC Cg(x) = 3[(x2 + (1 − x)2
)ln
1 − x
x+ 8x(1 − x) − 1
](164)
in the Altarelli-Parisi splitting function PDISγq←γ = PMS
q←γ − e2q Pq←q ⊗ Cγ [189].
8.2. Inclusive and diffractive jet production
While at LO hadronic jets are directly identified as final-state partons, their definition
becomes subtle at higher orders, when several partons (or hadrons) can be combined
to form a jet. According to the standardization of the 1990 Snowmass meeting,
particles i are added to a jet cone J with radius R, if they are a distance Ri =√(ηi − ηJ)2 + (φi − φJ)2 < R from the cone center. However, these broad combined
jets are difficult to find experimentally, so that several modifications (mid-points,
additional seeds, iterations) have been successively applied by the various experiments.
The deficiencies of the cone algorithm are remedied in the longitudinally invariant kT -
clustering algorithm, where one uses only the combination criterion Rij < 1 for any
pair of particles i and j. Unfortunately, this algorithm scales numerically with the
cubic power of the number, N , of particles involved. Only recently a faster version
has been developed making use of geometrical arguments and diagrammatic methods
known from computational science [344]. The publicly available FastJet code scales
only with N lnN and is now rapidly adopted, in particular for the LHC, where the
particle multiplicity is high.
Single (inclusive) jets benefit from high statistics and the presence of a single
(transverse) energy scale ET , which makes them easily accessible experimentally and
their prediction theoretically stable. The ET -distribution of the single-jet cross section
can then be used to determine e.g. the strong coupling constant from scaling violations,
as shown in Fig. 95. However, the single-jet cross section,
d2σ
dETdη=∑
a,b
∫ 1
xa,min
dxa xafa/A(xa,M2a ) xbfb/B(xb,M
2b )
4EAET2xaEA − ET eη
dσ
dt, (165)
includes a convolution over one of the longitudinal momentum fractions of the partons
so that parton densities cannot be uniquely determined.
In addition to the transverse energy ET and pseudorapidity η1 of the first jet, the
inclusive dijet cross section
d3σ
dE2Tdη1dη2
=∑
a,b
xafa/A(xa,M2a )xbfb/B(xb,M
2b )dσ
dt(166)
178
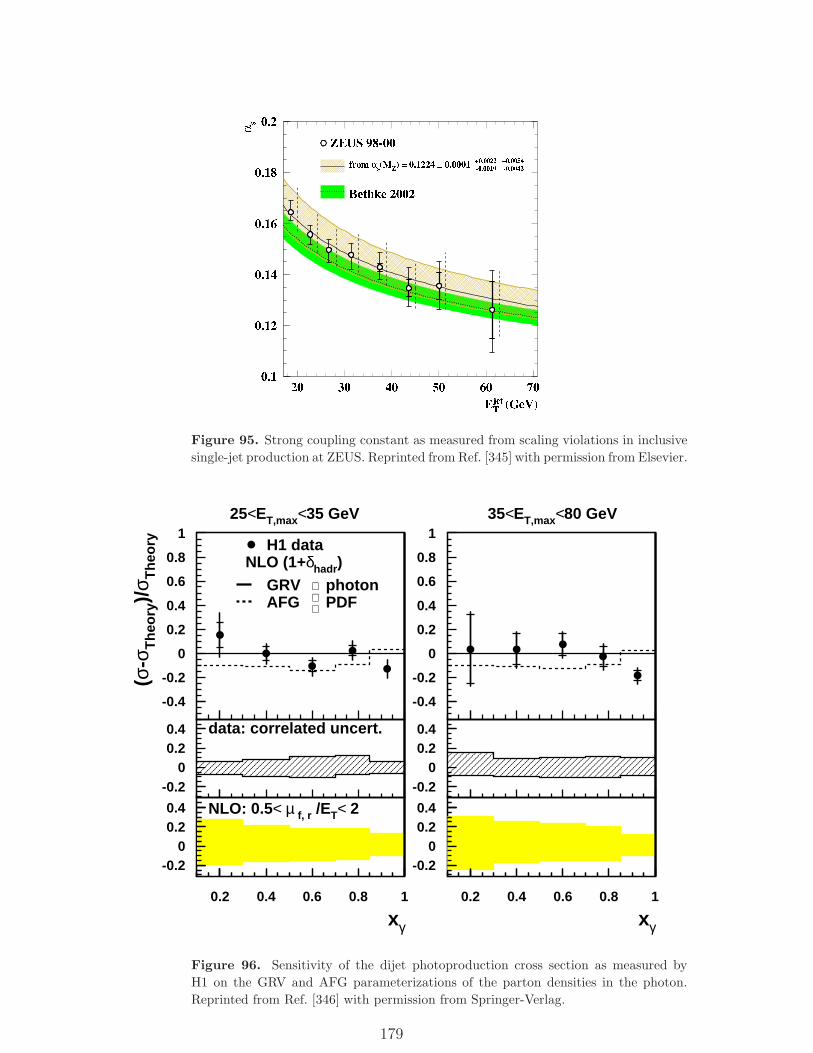
Figure 95. Strong coupling constant as measured from scaling violations in inclusive
single-jet production at ZEUS. Reprinted from Ref. [345] with permission from Elsevier.
-0.4
-0.2
0
0.2
0.4
0.6
0.8
1
(σ-σ
Th
eory
)/σ T
heo
ry
-0.4
-0.2
0
0.2
0.4
0.6
0.8
1
-0.20
0.20.4
-0.20
0.20.4
-0.20
0.20.4
0.2 0.4 0.6 0.8 1
xγ
-0.20
0.20.4
0.2 0.4 0.6 0.8 1
xγ
H1 dataNLO (1+δhadr)
GRVAFG
photonPDF
data: correlated uncert.
NLO: 0.5< µ f, r /ET< 2
25<ET,max<35 GeV 35<ET,max<80 GeV
Figure 96. Sensitivity of the dijet photoproduction cross section as measured by
H1 on the GRV and AFG parameterizations of the parton densities in the photon.
Reprinted from Ref. [346] with permission from Springer-Verlag.
179
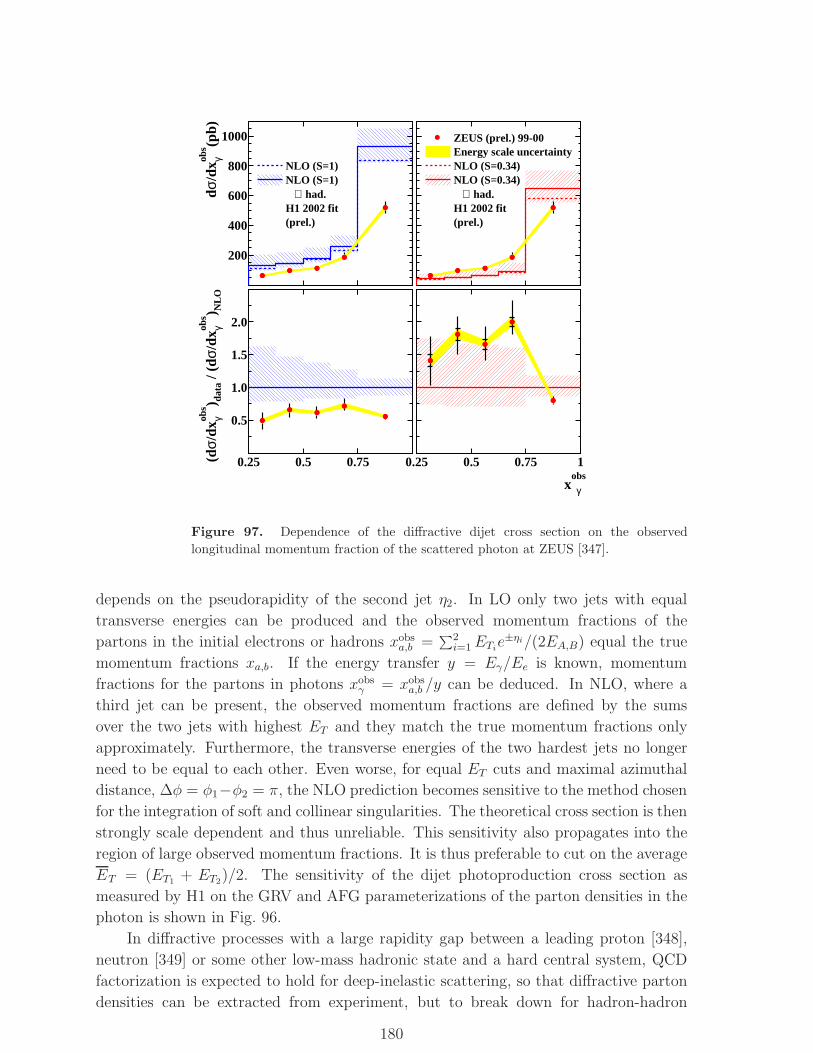
200
400
600
800
1000
NLO (S=1)NLO (S=1) ⊗ had.H1 2002 fit(prel.)
dσ/d
xobs
γ (
pb)
0.5
1.0
1.5
2.0
0.25 0.5 0.75(dσ/
dxob
s
γ )
data
/ (d
σ/dx
obs
γ )
NL
O
ZEUS (prel.) 99-00Energy scale uncertaintyNLO (S=0.34)NLO (S=0.34) ⊗ had.H1 2002 fit(prel.)
0.25 0.5 0.75 1
xobs
γ
Figure 97. Dependence of the diffractive dijet cross section on the observed
longitudinal momentum fraction of the scattered photon at ZEUS [347].
depends on the pseudorapidity of the second jet η2. In LO only two jets with equal
transverse energies can be produced and the observed momentum fractions of the
partons in the initial electrons or hadrons xobsa,b =
∑2i=1ETi
e±ηi/(2EA,B) equal the true
momentum fractions xa,b. If the energy transfer y = Eγ/Ee is known, momentum
fractions for the partons in photons xobsγ = xobs
a,b /y can be deduced. In NLO, where a
third jet can be present, the observed momentum fractions are defined by the sums
over the two jets with highest ET and they match the true momentum fractions only
approximately. Furthermore, the transverse energies of the two hardest jets no longer
need to be equal to each other. Even worse, for equal ET cuts and maximal azimuthal
distance, ∆φ = φ1−φ2 = π, the NLO prediction becomes sensitive to the method chosen
for the integration of soft and collinear singularities. The theoretical cross section is then
strongly scale dependent and thus unreliable. This sensitivity also propagates into the
region of large observed momentum fractions. It is thus preferable to cut on the average
ET = (ET1+ ET2
)/2. The sensitivity of the dijet photoproduction cross section as
measured by H1 on the GRV and AFG parameterizations of the parton densities in the
photon is shown in Fig. 96.
In diffractive processes with a large rapidity gap between a leading proton [348],
neutron [349] or some other low-mass hadronic state and a hard central system, QCD
factorization is expected to hold for deep-inelastic scattering, so that diffractive parton
densities can be extracted from experiment, but to break down for hadron-hadron
180
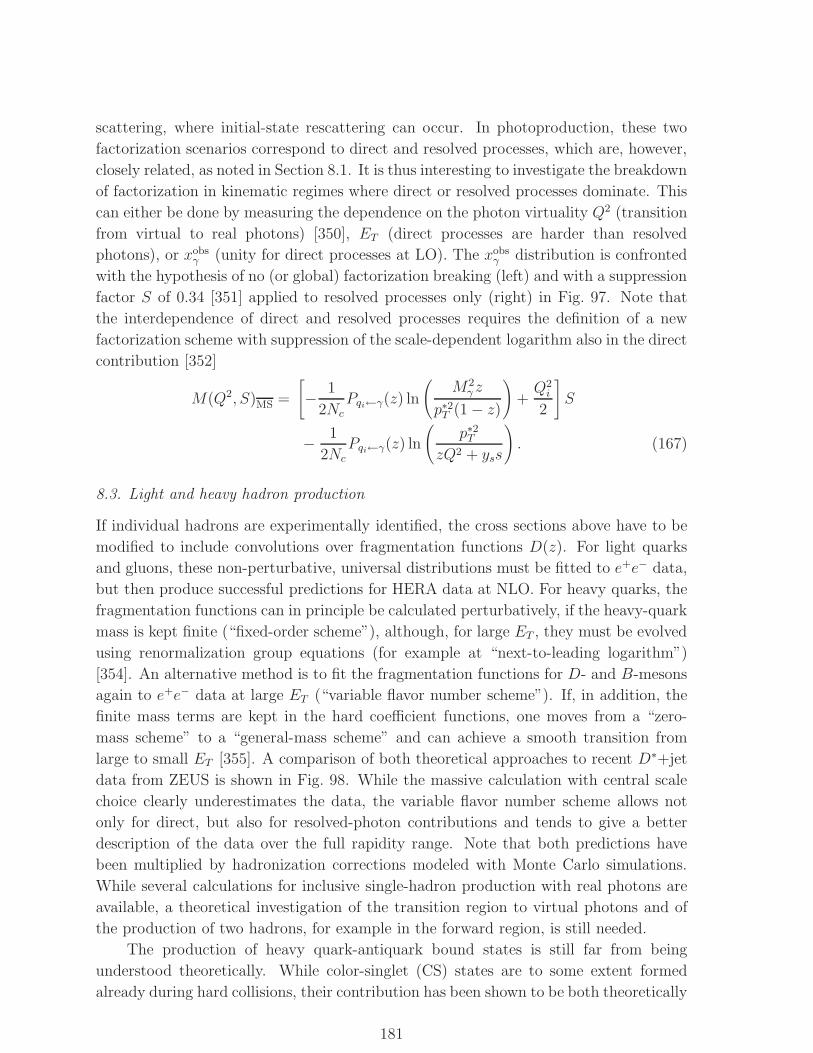
scattering, where initial-state rescattering can occur. In photoproduction, these two
factorization scenarios correspond to direct and resolved processes, which are, however,
closely related, as noted in Section 8.1. It is thus interesting to investigate the breakdown
of factorization in kinematic regimes where direct or resolved processes dominate. This
can either be done by measuring the dependence on the photon virtuality Q2 (transition
from virtual to real photons) [350], ET (direct processes are harder than resolved
photons), or xobsγ (unity for direct processes at LO). The xobs
γ distribution is confronted
with the hypothesis of no (or global) factorization breaking (left) and with a suppression
factor S of 0.34 [351] applied to resolved processes only (right) in Fig. 97. Note that
the interdependence of direct and resolved processes requires the definition of a new
factorization scheme with suppression of the scale-dependent logarithm also in the direct
contribution [352]
M(Q2, S)MS =
[− 1
2NcPqi←γ(z) ln
(M2
γ z
p∗2T (1 − z)
)+Q2i
2
]S
− 1
2NcPqi←γ(z) ln
(p∗2T
zQ2 + yss
). (167)
8.3. Light and heavy hadron production
If individual hadrons are experimentally identified, the cross sections above have to be
modified to include convolutions over fragmentation functions D(z). For light quarks
and gluons, these non-perturbative, universal distributions must be fitted to e+e− data,
but then produce successful predictions for HERA data at NLO. For heavy quarks, the
fragmentation functions can in principle be calculated perturbatively, if the heavy-quark
mass is kept finite (“fixed-order scheme”), although, for large ET , they must be evolved
using renormalization group equations (for example at “next-to-leading logarithm”)
[354]. An alternative method is to fit the fragmentation functions for D- and B-mesons
again to e+e− data at large ET (“variable flavor number scheme”). If, in addition, the
finite mass terms are kept in the hard coefficient functions, one moves from a “zero-
mass scheme” to a “general-mass scheme” and can achieve a smooth transition from
large to small ET [355]. A comparison of both theoretical approaches to recent D∗+jet
data from ZEUS is shown in Fig. 98. While the massive calculation with central scale
choice clearly underestimates the data, the variable flavor number scheme allows not
only for direct, but also for resolved-photon contributions and tends to give a better
description of the data over the full rapidity range. Note that both predictions have
been multiplied by hadronization corrections modeled with Monte Carlo simulations.
While several calculations for inclusive single-hadron production with real photons are
available, a theoretical investigation of the transition region to virtual photons and of
the production of two hadrons, for example in the forward region, is still needed.
The production of heavy quark-antiquark bound states is still far from being
understood theoretically. While color-singlet (CS) states are to some extent formed
already during hard collisions, their contribution has been shown to be both theoretically
181
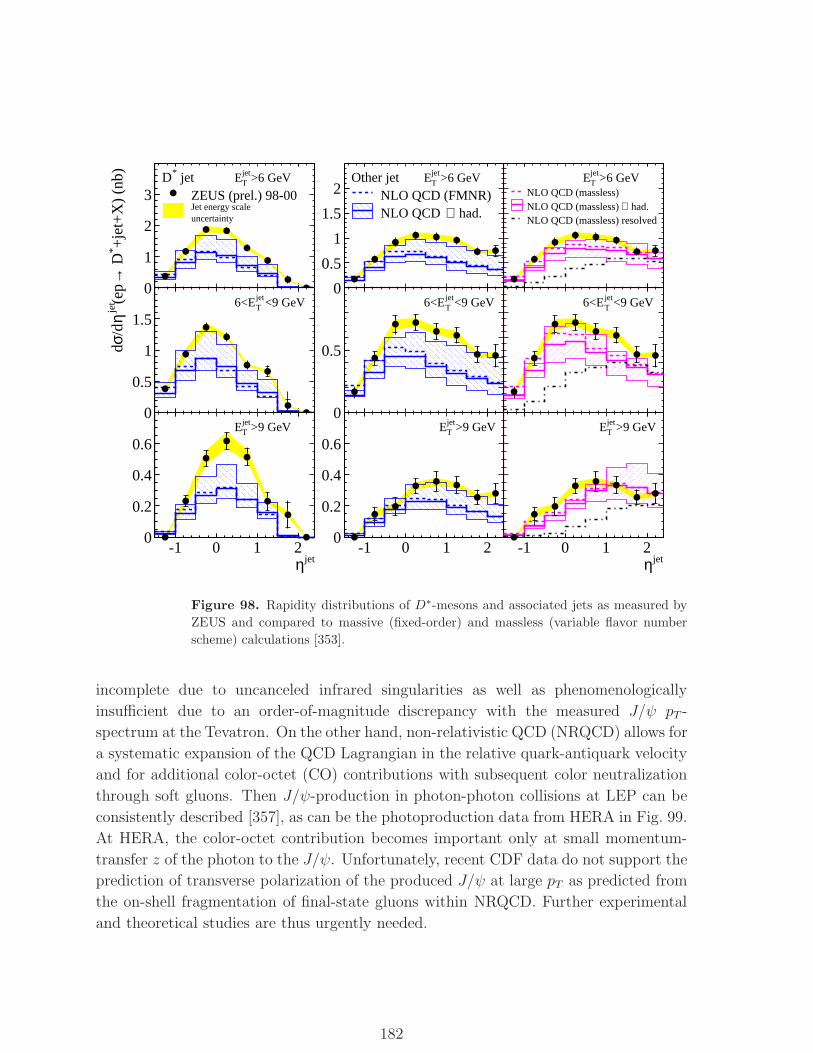
jet*D >6 GeVjetTE
ZEUS (prel.) 98-00Jet energy scaleuncertainty
<9 GeVjetT6<E
>9 GeVjetTE
Other jet >6 GeVjetTE
NLO QCD (FMNR) had.⊗NLO QCD
>6 GeVjetTE
NLO QCD (massless) had.⊗NLO QCD (massless)
NLO QCD (massless) resolved
<9 GeVjetT6<E <9 GeVjet
T6<E
>9 GeVjetTE >9 GeVjet
TE
jetη-1 0 1 2
+je
t+X
) (n
b)*
D→
(ep
jet
η/dσd
0
1
2
3
0
0.5
1
1.5
0
0.2
0.4
0.6
-1 0 1 2jetη
-1 0 1 2
0
0.5
1
1.5
2
0
0.5
0
0.2
0.4
0.6
Figure 98. Rapidity distributions of D∗-mesons and associated jets as measured by
ZEUS and compared to massive (fixed-order) and massless (variable flavor number
scheme) calculations [353].
incomplete due to uncanceled infrared singularities as well as phenomenologically
insufficient due to an order-of-magnitude discrepancy with the measured J/ψ pT -
spectrum at the Tevatron. On the other hand, non-relativistic QCD (NRQCD) allows for
a systematic expansion of the QCD Lagrangian in the relative quark-antiquark velocity
and for additional color-octet (CO) contributions with subsequent color neutralization
through soft gluons. Then J/ψ-production in photon-photon collisions at LEP can be
consistently described [357], as can be the photoproduction data from HERA in Fig. 99.
At HERA, the color-octet contribution becomes important only at small momentum-
transfer z of the photon to the J/ψ. Unfortunately, recent CDF data do not support the
prediction of transverse polarization of the produced J/ψ at large pT as predicted from
the on-shell fragmentation of final-state gluons within NRQCD. Further experimental
and theoretical studies are thus urgently needed.
182
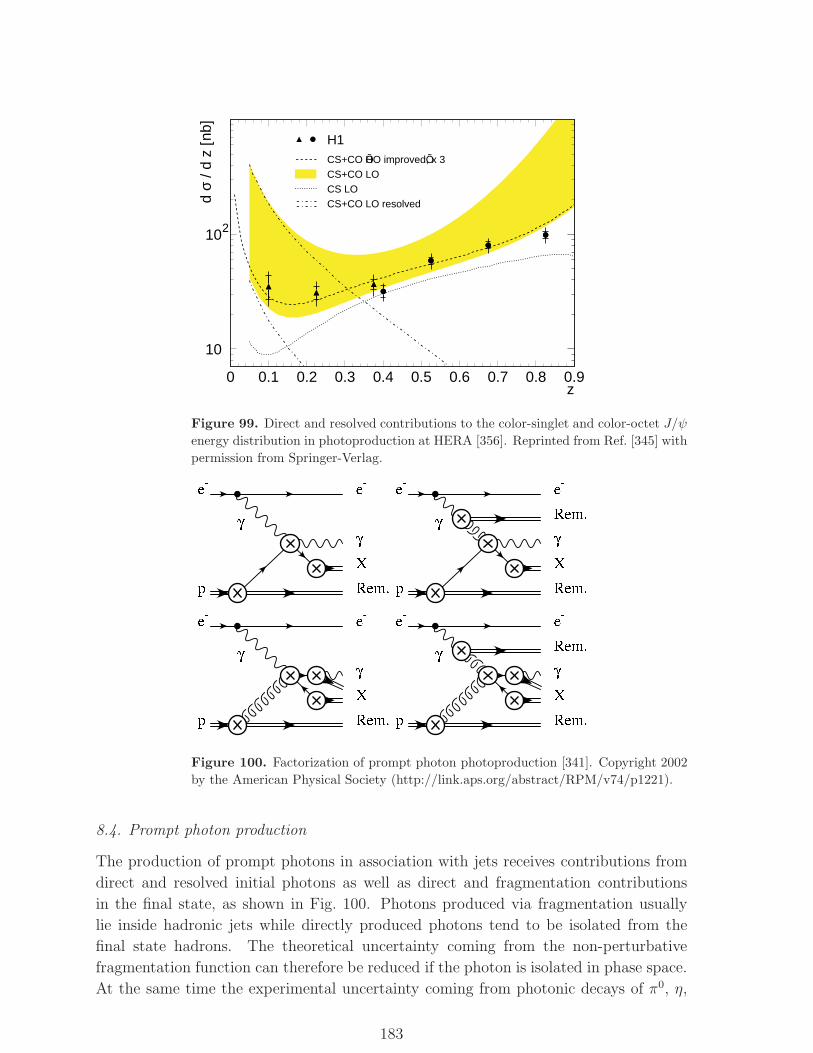
10
102
0 0.1 0.2 0.3 0.4 0.5 0.6 0.7 0.8 0.9z
d σ
/ d z
[nb]
H1CS+CO ÕHO improvedÕ, x 3CS+CO LOCS LOCS+CO LO resolved
Figure 99. Direct and resolved contributions to the color-singlet and color-octet J/ψ
energy distribution in photoproduction at HERA [356]. Reprinted from Ref. [345] with
permission from Springer-Verlag.
Figure 100. Factorization of prompt photon photoproduction [341]. Copyright 2002
by the American Physical Society (http://link.aps.org/abstract/RPM/v74/p1221).
8.4. Prompt photon production
The production of prompt photons in association with jets receives contributions from
direct and resolved initial photons as well as direct and fragmentation contributions
in the final state, as shown in Fig. 100. Photons produced via fragmentation usually
lie inside hadronic jets while directly produced photons tend to be isolated from the
final state hadrons. The theoretical uncertainty coming from the non-perturbative
fragmentation function can therefore be reduced if the photon is isolated in phase space.
At the same time the experimental uncertainty coming from photonic decays of π0, η,
183
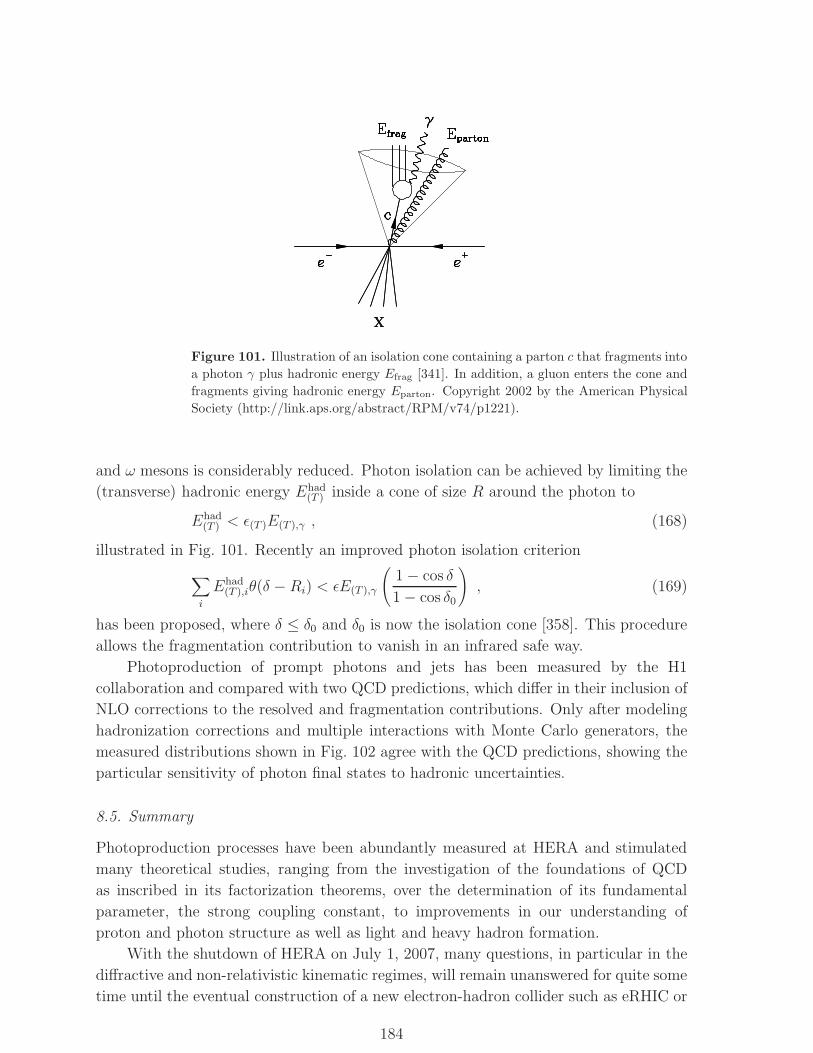
Figure 101. Illustration of an isolation cone containing a parton c that fragments into
a photon γ plus hadronic energy Efrag [341]. In addition, a gluon enters the cone and
fragments giving hadronic energy Eparton. Copyright 2002 by the American Physical
Society (http://link.aps.org/abstract/RPM/v74/p1221).
and ω mesons is considerably reduced. Photon isolation can be achieved by limiting the
(transverse) hadronic energy Ehad(T ) inside a cone of size R around the photon to
Ehad(T ) < ǫ(T )E(T ),γ , (168)
illustrated in Fig. 101. Recently an improved photon isolation criterion
∑
i
Ehad(T ),iθ(δ − Ri) < ǫE(T ),γ
(1 − cos δ
1 − cos δ0
), (169)
has been proposed, where δ ≤ δ0 and δ0 is now the isolation cone [358]. This procedure
allows the fragmentation contribution to vanish in an infrared safe way.
Photoproduction of prompt photons and jets has been measured by the H1
collaboration and compared with two QCD predictions, which differ in their inclusion of
NLO corrections to the resolved and fragmentation contributions. Only after modeling
hadronization corrections and multiple interactions with Monte Carlo generators, the
measured distributions shown in Fig. 102 agree with the QCD predictions, showing the
particular sensitivity of photon final states to hadronic uncertainties.
8.5. Summary
Photoproduction processes have been abundantly measured at HERA and stimulated
many theoretical studies, ranging from the investigation of the foundations of QCD
as inscribed in its factorization theorems, over the determination of its fundamental
parameter, the strong coupling constant, to improvements in our understanding of
proton and photon structure as well as light and heavy hadron formation.
With the shutdown of HERA on July 1, 2007, many questions, in particular in the
diffractive and non-relativistic kinematic regimes, will remain unanswered for quite some
time until the eventual construction of a new electron-hadron collider such as eRHIC or
184
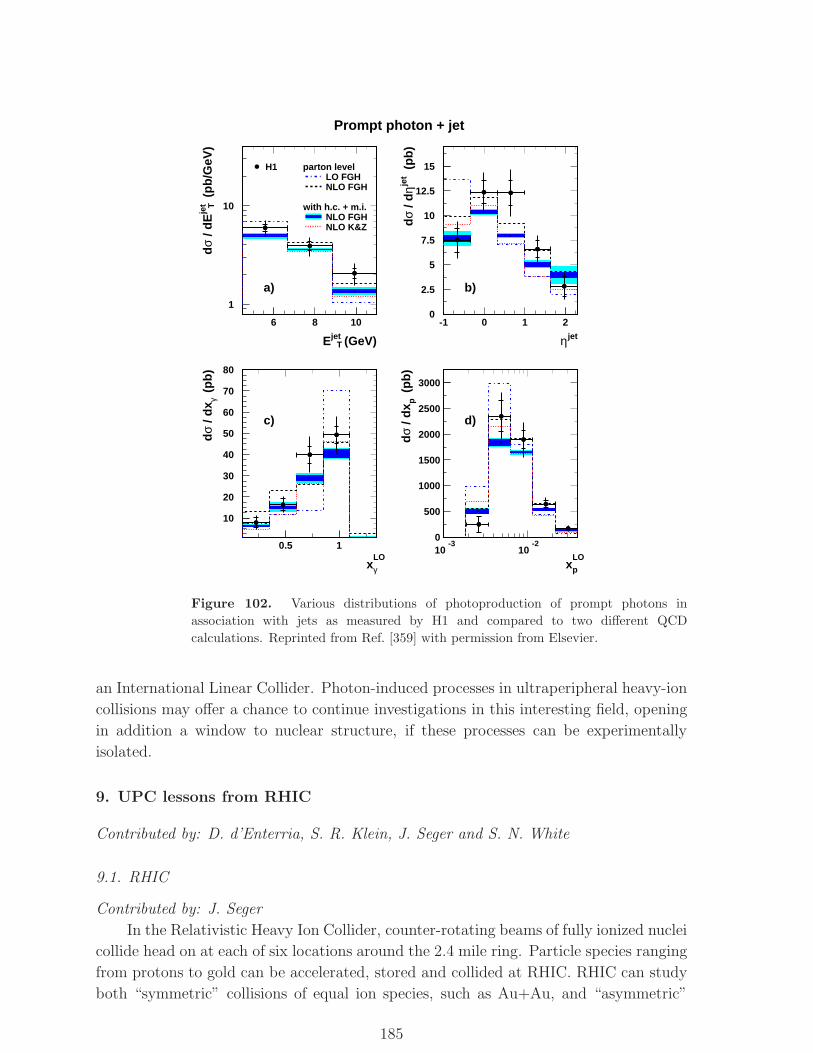
Prompt photon + jet
1
10
6 8 10
EjetT (GeV)
dσ
/ dE
jet T (
pb
/GeV
)
a)
H1 parton level LO FGH NLO FGH
with h.c. + m.i. NLO FGH NLO K&Z
0
2.5
5
7.5
10
12.5
15
-1 0 1 2
ηjet
dσ
/ dηje
t (p
b)
b)
10
20
30
40
50
60
70
80
0.5 1
xLO
γ
dσ
/ dx γ
(p
b)
c)
0
500
1000
1500
2000
2500
3000
10-3
10-2
xLO
p
dσ
/ dx p
(p
b)
d)
Figure 102. Various distributions of photoproduction of prompt photons in
association with jets as measured by H1 and compared to two different QCD
calculations. Reprinted from Ref. [359] with permission from Elsevier.
an International Linear Collider. Photon-induced processes in ultraperipheral heavy-ion
collisions may offer a chance to continue investigations in this interesting field, opening
in addition a window to nuclear structure, if these processes can be experimentally
isolated.
9. UPC lessons from RHIC
Contributed by: D. d’Enterria, S. R. Klein, J. Seger and S. N. White
9.1. RHIC
Contributed by: J. Seger
In the Relativistic Heavy Ion Collider, counter-rotating beams of fully ionized nuclei
collide head on at each of six locations around the 2.4 mile ring. Particle species ranging
from protons to gold can be accelerated, stored and collided at RHIC. RHIC can study
both “symmetric” collisions of equal ion species, such as Au+Au, and “asymmetric”
185
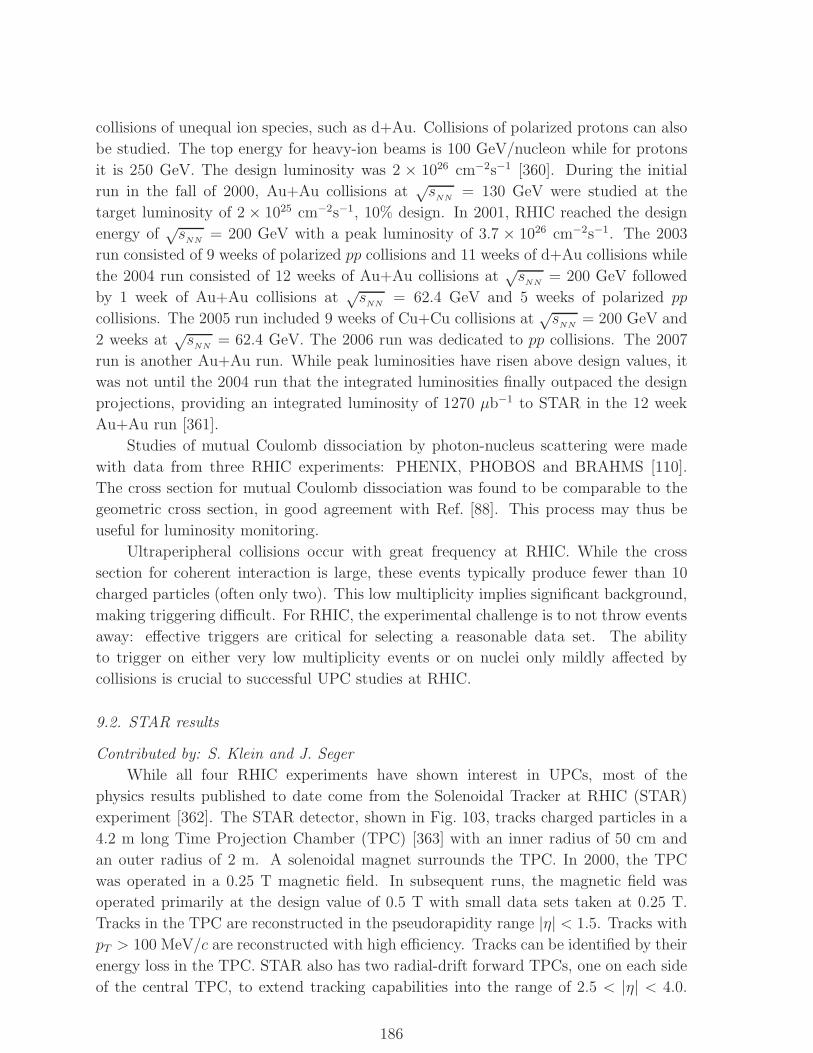
collisions of unequal ion species, such as d+Au. Collisions of polarized protons can also
be studied. The top energy for heavy-ion beams is 100 GeV/nucleon while for protons
it is 250 GeV. The design luminosity was 2 × 1026 cm−2s−1 [360]. During the initial
run in the fall of 2000, Au+Au collisions at√s
NN= 130 GeV were studied at the
target luminosity of 2 × 1025 cm−2s−1, 10% design. In 2001, RHIC reached the design
energy of√s
NN= 200 GeV with a peak luminosity of 3.7 × 1026 cm−2s−1. The 2003
run consisted of 9 weeks of polarized pp collisions and 11 weeks of d+Au collisions while
the 2004 run consisted of 12 weeks of Au+Au collisions at√s
NN= 200 GeV followed
by 1 week of Au+Au collisions at√s
NN= 62.4 GeV and 5 weeks of polarized pp
collisions. The 2005 run included 9 weeks of Cu+Cu collisions at√s
NN= 200 GeV and
2 weeks at√s
NN= 62.4 GeV. The 2006 run was dedicated to pp collisions. The 2007
run is another Au+Au run. While peak luminosities have risen above design values, it
was not until the 2004 run that the integrated luminosities finally outpaced the design
projections, providing an integrated luminosity of 1270 µb−1 to STAR in the 12 week
Au+Au run [361].
Studies of mutual Coulomb dissociation by photon-nucleus scattering were made
with data from three RHIC experiments: PHENIX, PHOBOS and BRAHMS [110].
The cross section for mutual Coulomb dissociation was found to be comparable to the
geometric cross section, in good agreement with Ref. [88]. This process may thus be
useful for luminosity monitoring.
Ultraperipheral collisions occur with great frequency at RHIC. While the cross
section for coherent interaction is large, these events typically produce fewer than 10
charged particles (often only two). This low multiplicity implies significant background,
making triggering difficult. For RHIC, the experimental challenge is to not throw events
away: effective triggers are critical for selecting a reasonable data set. The ability
to trigger on either very low multiplicity events or on nuclei only mildly affected by
collisions is crucial to successful UPC studies at RHIC.
9.2. STAR results
Contributed by: S. Klein and J. Seger
While all four RHIC experiments have shown interest in UPCs, most of the
physics results published to date come from the Solenoidal Tracker at RHIC (STAR)
experiment [362]. The STAR detector, shown in Fig. 103, tracks charged particles in a
4.2 m long Time Projection Chamber (TPC) [363] with an inner radius of 50 cm and
an outer radius of 2 m. A solenoidal magnet surrounds the TPC. In 2000, the TPC
was operated in a 0.25 T magnetic field. In subsequent runs, the magnetic field was
operated primarily at the design value of 0.5 T with small data sets taken at 0.25 T.
Tracks in the TPC are reconstructed in the pseudorapidity range |η| < 1.5. Tracks with
pT > 100 MeV/c are reconstructed with high efficiency. Tracks can be identified by their
energy loss in the TPC. STAR also has two radial-drift forward TPCs, one on each side
of the central TPC, to extend tracking capabilities into the range of 2.5 < |η| < 4.0.
186
Figure 103. A schematic view of the STAR detector at RHIC. Reprinted from
Ref. [364] with permission from Elsevier.
In addition, STAR is installing a barrel electromagnetic calorimeter covering |η| < 1,
and an endcap electromagnetic calorimeter on the west pole tip of the detector covering
1.086 < η < 2.
Each RHIC detector includes two ZDCs, located at z = ±18 m from the interaction
point to detect undeflected neutrons from nuclear breakup. These calorimeters are
sensitive to single neutrons and have an acceptance of close to 100% for neutrons from
nuclear breakup [110, 365].
Although each RHIC detector also includes beam-beam counters (BBCs), the
implementation differs between the experiments. For STAR, the BBCs are a hexagonal
scintillator array structure ±3.5 m from the interaction point. They detect charged
particles with 2 < |η| < 5 with full coverage in φ. Requiring coincidence between
the two BBCs can reduce background contributions from beam-gas events. The STAR
BBCs were partially implemented for the 2001 run and fully implemented for the 2003
run [366].
9.2.1. Triggers The primary STAR trigger detector is a cylindrical Central Trigger
Barrel (CTB) consisting of 240 scintillator slats surrounding the TPC. Each slat in the
CTB covers a pseudorapidity interval of ∆η = 0.5 and a range in azimuthal angle φ
of ∆φ = π/30. The scintillator is sensitive to charged particles with pT > 130 MeV/c
in the 0.25 T magnetic field. The acceptance for charged particles depends on where
the particles are produced. For a vertex at the center of the TPC, the trigger barrel
is sensitive only to charged particles with |η| < 1. The finite acceptance of the CTB
therefore limits its usefulness since many events of interest (such as e+e− pairs) produce
tracks at high |η|.Some ultraperipheral events with zero tracks reaching the CTB can be extracted
from the STAR minimum-bias data. The STAR minimum-bias trigger requires
coincident neutron signals in the East and West ZDCs. It therefore triggers only on
the subset of ultraperipheral events that include mutual nuclear excitation. STAR
187
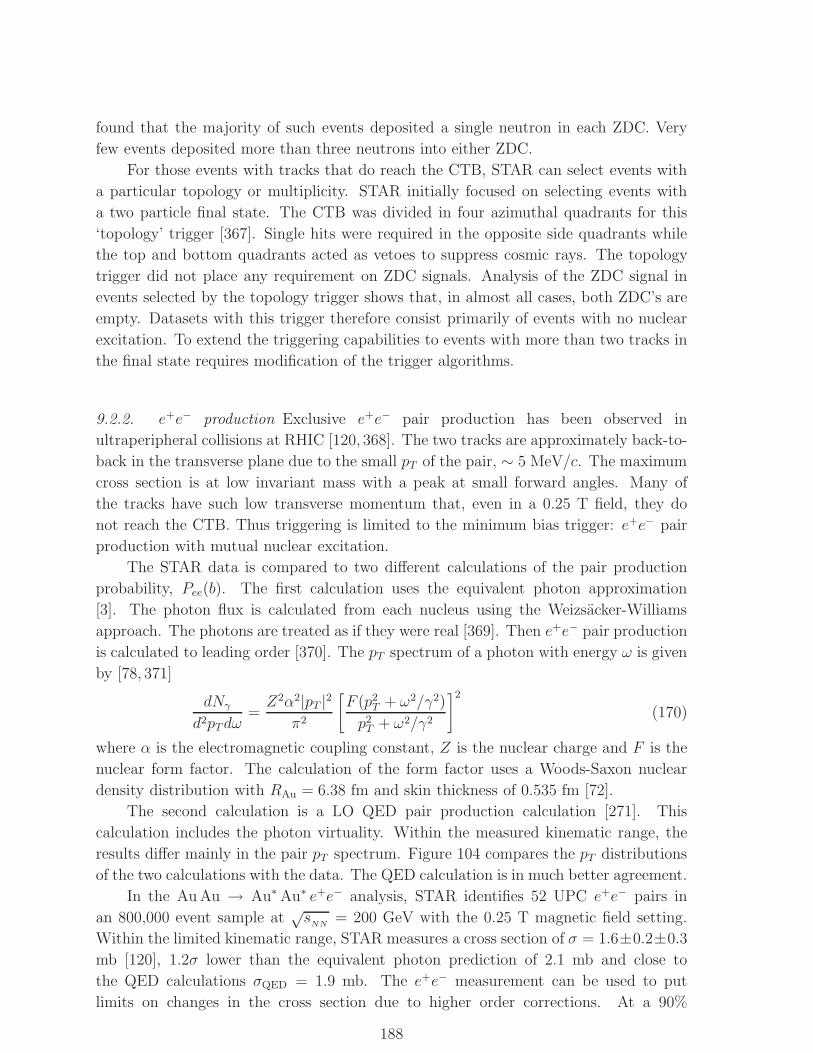
found that the majority of such events deposited a single neutron in each ZDC. Very
few events deposited more than three neutrons into either ZDC.
For those events with tracks that do reach the CTB, STAR can select events with
a particular topology or multiplicity. STAR initially focused on selecting events with
a two particle final state. The CTB was divided in four azimuthal quadrants for this
‘topology’ trigger [367]. Single hits were required in the opposite side quadrants while
the top and bottom quadrants acted as vetoes to suppress cosmic rays. The topology
trigger did not place any requirement on ZDC signals. Analysis of the ZDC signal in
events selected by the topology trigger shows that, in almost all cases, both ZDC’s are
empty. Datasets with this trigger therefore consist primarily of events with no nuclear
excitation. To extend the triggering capabilities to events with more than two tracks in
the final state requires modification of the trigger algorithms.
9.2.2. e+e− production Exclusive e+e− pair production has been observed in
ultraperipheral collisions at RHIC [120, 368]. The two tracks are approximately back-to-
back in the transverse plane due to the small pT of the pair, ∼ 5 MeV/c. The maximum
cross section is at low invariant mass with a peak at small forward angles. Many of
the tracks have such low transverse momentum that, even in a 0.25 T field, they do
not reach the CTB. Thus triggering is limited to the minimum bias trigger: e+e− pair
production with mutual nuclear excitation.
The STAR data is compared to two different calculations of the pair production
probability, Pee(b). The first calculation uses the equivalent photon approximation
[3]. The photon flux is calculated from each nucleus using the Weizsacker-Williams
approach. The photons are treated as if they were real [369]. Then e+e− pair production
is calculated to leading order [370]. The pT spectrum of a photon with energy ω is given
by [78, 371]
dNγ
d2pTdω=Z2α2|pT |2
π2
[F (p2
T + ω2/γ2)
p2T + ω2/γ2
]2
(170)
where α is the electromagnetic coupling constant, Z is the nuclear charge and F is the
nuclear form factor. The calculation of the form factor uses a Woods-Saxon nuclear
density distribution with RAu = 6.38 fm and skin thickness of 0.535 fm [72].
The second calculation is a LO QED pair production calculation [271]. This
calculation includes the photon virtuality. Within the measured kinematic range, the
results differ mainly in the pair pT spectrum. Figure 104 compares the pT distributions
of the two calculations with the data. The QED calculation is in much better agreement.
In the Au Au → Au∗Au∗ e+e− analysis, STAR identifies 52 UPC e+e− pairs in
an 800,000 event sample at√s
NN= 200 GeV with the 0.25 T magnetic field setting.
Within the limited kinematic range, STAR measures a cross section of σ = 1.6±0.2±0.3
mb [120], 1.2σ lower than the equivalent photon prediction of 2.1 mb and close to
the QED calculations σQED = 1.9 mb. The e+e− measurement can be used to put
limits on changes in the cross section due to higher order corrections. At a 90%
188
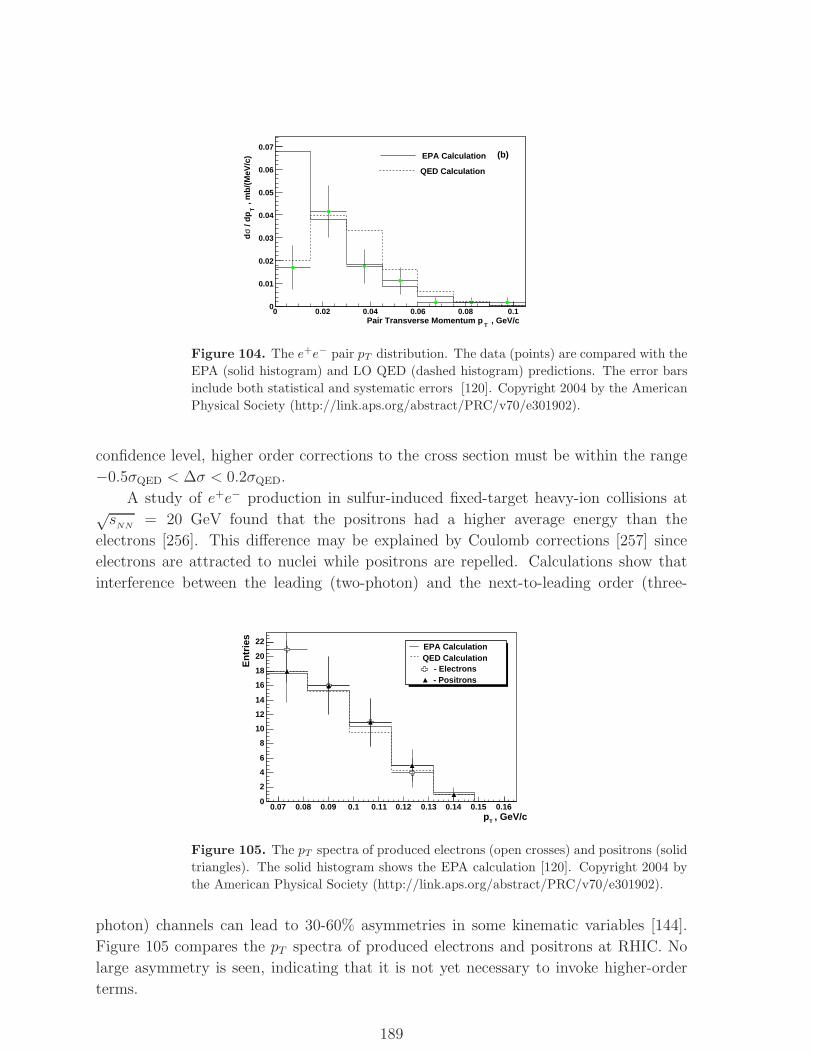
0 0.02 0.04 0.06 0.08 0.10
0.01
0.02
0.03
0.04
0.05
0.06
0.07
, mb
/(M
eV/c
)T
/ d
pσ
d
, GeV/cT
Pair Transverse Momentum p
EPA Calculation (b)
QED Calculation
Figure 104. The e+e− pair pT distribution. The data (points) are compared with the
EPA (solid histogram) and LO QED (dashed histogram) predictions. The error bars
include both statistical and systematic errors [120]. Copyright 2004 by the American
Physical Society (http://link.aps.org/abstract/PRC/v70/e301902).
confidence level, higher order corrections to the cross section must be within the range
−0.5σQED < ∆σ < 0.2σQED.
A study of e+e− production in sulfur-induced fixed-target heavy-ion collisions at√s
NN= 20 GeV found that the positrons had a higher average energy than the
electrons [256]. This difference may be explained by Coulomb corrections [257] since
electrons are attracted to nuclei while positrons are repelled. Calculations show that
interference between the leading (two-photon) and the next-to-leading order (three-
0.07 0.08 0.09 0.1 0.11 0.12 0.13 0.14 0.15 0.160
2
4
6
8
10
12
14
16
18
20
22EPA CalculationQED Calculation
- Electrons- Positrons
, GeV/cpT
En
trie
s
Figure 105. The pT spectra of produced electrons (open crosses) and positrons (solid
triangles). The solid histogram shows the EPA calculation [120]. Copyright 2004 by
the American Physical Society (http://link.aps.org/abstract/PRC/v70/e301902).
photon) channels can lead to 30-60% asymmetries in some kinematic variables [144].
Figure 105 compares the pT spectra of produced electrons and positrons at RHIC. No
large asymmetry is seen, indicating that it is not yet necessary to invoke higher-order
terms.
189
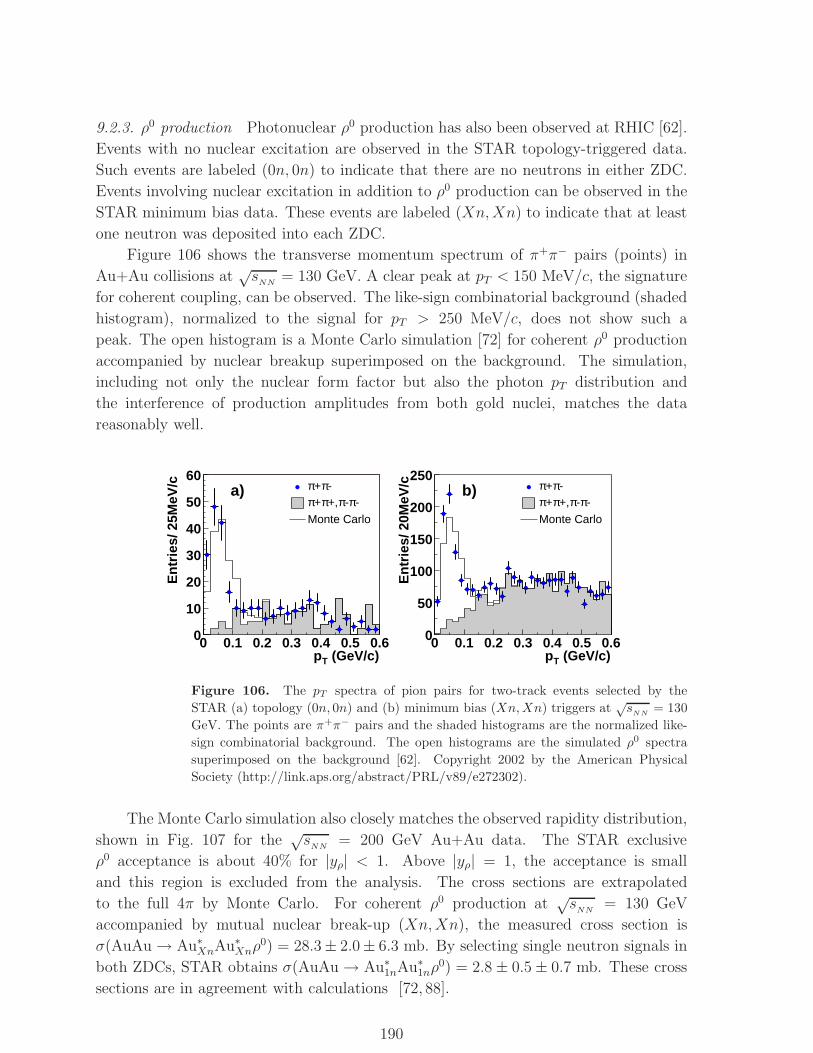
9.2.3. ρ0 production Photonuclear ρ0 production has also been observed at RHIC [62].
Events with no nuclear excitation are observed in the STAR topology-triggered data.
Such events are labeled (0n, 0n) to indicate that there are no neutrons in either ZDC.
Events involving nuclear excitation in addition to ρ0 production can be observed in the
STAR minimum bias data. These events are labeled (Xn,Xn) to indicate that at least
one neutron was deposited into each ZDC.
Figure 106 shows the transverse momentum spectrum of π+π− pairs (points) in
Au+Au collisions at√s
NN= 130 GeV. A clear peak at pT < 150 MeV/c, the signature
for coherent coupling, can be observed. The like-sign combinatorial background (shaded
histogram), normalized to the signal for pT > 250 MeV/c, does not show such a
peak. The open histogram is a Monte Carlo simulation [72] for coherent ρ0 production
accompanied by nuclear breakup superimposed on the background. The simulation,
including not only the nuclear form factor but also the photon pT distribution and
the interference of production amplitudes from both gold nuclei, matches the data
reasonably well.
(GeV/c)Tp0 0.1 0.2 0.3 0.4 0.5 0.6
En
trie
s/ 2
5MeV
/c
0
10
20
30
40
50
60a) -π+π
-π-π+,π+πMonte Carlo
(GeV/c)Tp0 0.1 0.2 0.3 0.4 0.5 0.6
En
trie
s/ 2
0MeV
/c
0
50
100
150
200
250b) -π+π
-π-π+,π+πMonte Carlo
Figure 106. The pT spectra of pion pairs for two-track events selected by the
STAR (a) topology (0n, 0n) and (b) minimum bias (Xn,Xn) triggers at√s
NN= 130
GeV. The points are π+π− pairs and the shaded histograms are the normalized like-
sign combinatorial background. The open histograms are the simulated ρ0 spectra
superimposed on the background [62]. Copyright 2002 by the American Physical
Society (http://link.aps.org/abstract/PRL/v89/e272302).
The Monte Carlo simulation also closely matches the observed rapidity distribution,
shown in Fig. 107 for the√s
NN= 200 GeV Au+Au data. The STAR exclusive
ρ0 acceptance is about 40% for |yρ| < 1. Above |yρ| = 1, the acceptance is small
and this region is excluded from the analysis. The cross sections are extrapolated
to the full 4π by Monte Carlo. For coherent ρ0 production at√s
NN= 130 GeV
accompanied by mutual nuclear break-up (Xn,Xn), the measured cross section is
σ(AuAu → Au∗XnAu∗Xnρ0) = 28.3± 2.0± 6.3 mb. By selecting single neutron signals in
both ZDCs, STAR obtains σ(AuAu → Au∗1nAu∗1nρ0) = 2.8 ± 0.5 ± 0.7 mb. These cross
sections are in agreement with calculations [72, 88].
190
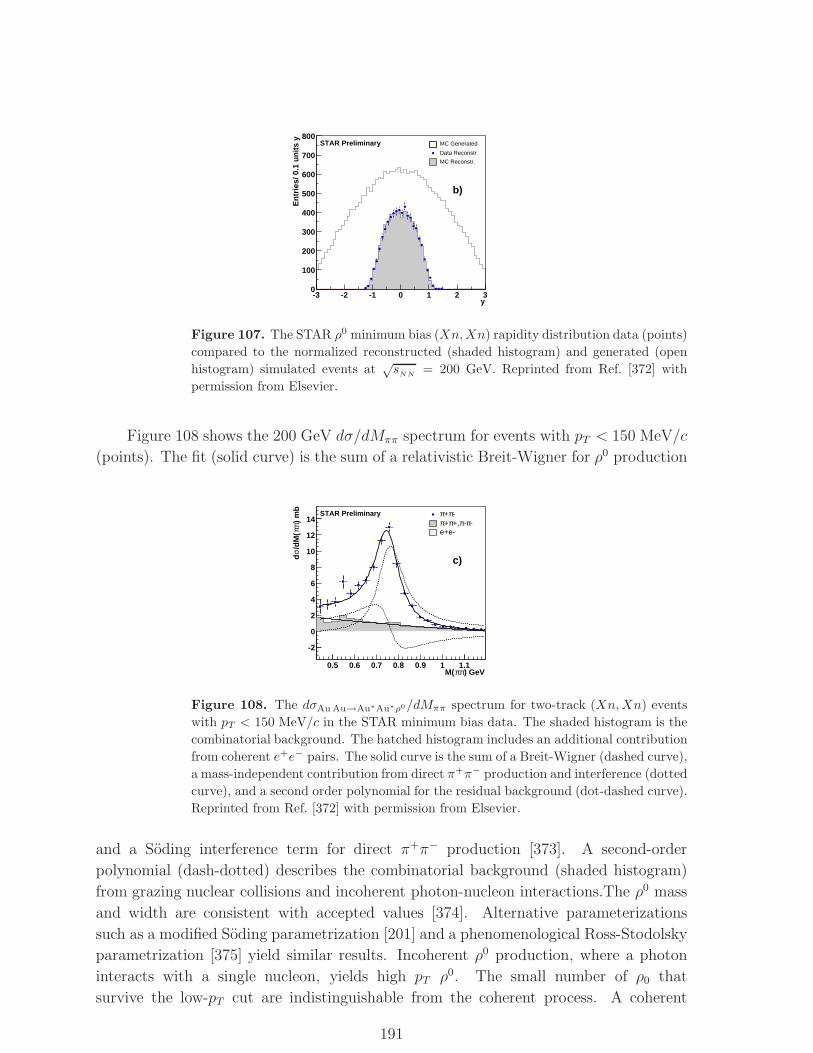
y-3 -2 -1 0 1 2 3
En
trie
s/ 0
.1 u
nit
s y
0
100
200
300
400
500
600
700
800MC Generated
Data Reconstr.
MC Reconstr.
b)
STAR Preliminary
Figure 107. The STAR ρ0 minimum bias (Xn,Xn) rapidity distribution data (points)
compared to the normalized reconstructed (shaded histogram) and generated (open
histogram) simulated events at√s
NN= 200 GeV. Reprinted from Ref. [372] with
permission from Elsevier.
Figure 108 shows the 200 GeV dσ/dMππ spectrum for events with pT < 150 MeV/c
(points). The fit (solid curve) is the sum of a relativistic Breit-Wigner for ρ0 production
) GeVππM(0.5 0.6 0.7 0.8 0.9 1 1.1
) m
bππ
/dM
(σ
d
-2
0
2
4
6
8
10
12
14-π+π
-π-π+,π+πe+e-
c)
STAR Preliminary
Figure 108. The dσAu Au→Au∗Au∗ρ0/dMππ spectrum for two-track (Xn,Xn) events
with pT < 150 MeV/c in the STAR minimum bias data. The shaded histogram is the
combinatorial background. The hatched histogram includes an additional contribution
from coherent e+e− pairs. The solid curve is the sum of a Breit-Wigner (dashed curve),
a mass-independent contribution from direct π+π− production and interference (dotted
curve), and a second order polynomial for the residual background (dot-dashed curve).
Reprinted from Ref. [372] with permission from Elsevier.
and a Soding interference term for direct π+π− production [373]. A second-order
polynomial (dash-dotted) describes the combinatorial background (shaded histogram)
from grazing nuclear collisions and incoherent photon-nucleon interactions.The ρ0 mass
and width are consistent with accepted values [374]. Alternative parameterizations
such as a modified Soding parametrization [201] and a phenomenological Ross-Stodolsky
parametrization [375] yield similar results. Incoherent ρ0 production, where a photon
interacts with a single nucleon, yields high pT ρ0. The small number of ρ0 that
survive the low-pT cut are indistinguishable from the coherent process. A coherent
191
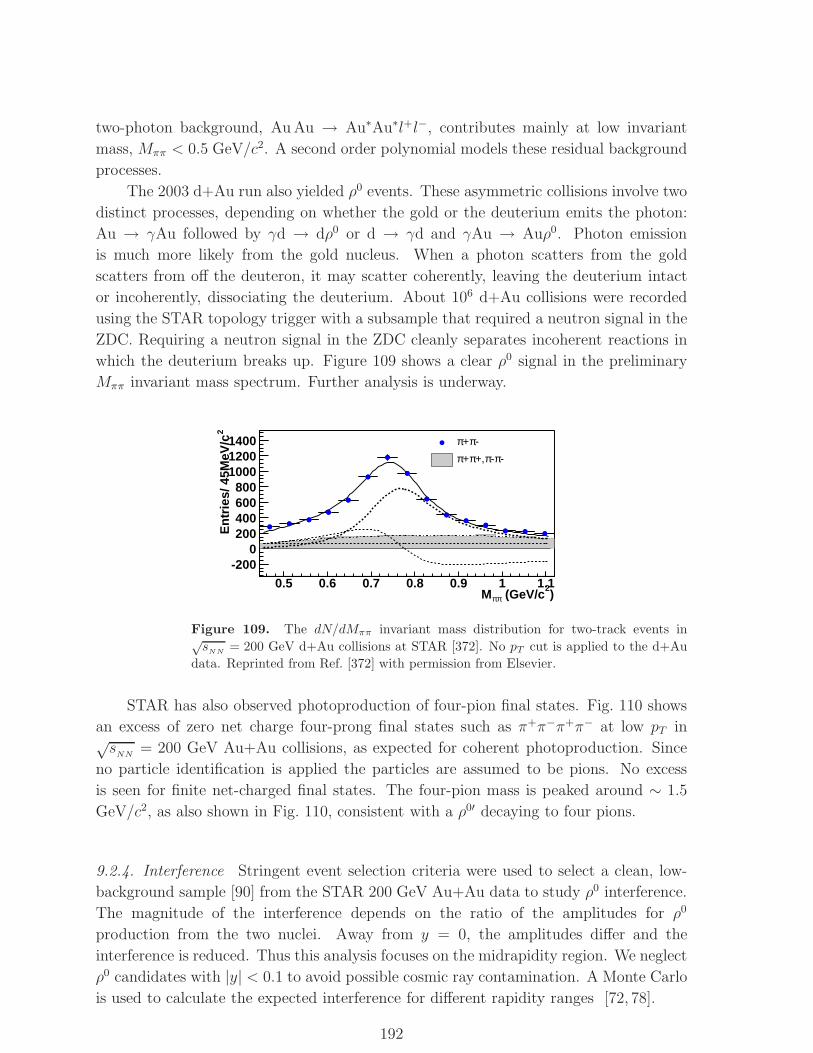
two-photon background, Au Au → Au∗Au∗l+l−, contributes mainly at low invariant
mass, Mππ < 0.5 GeV/c2. A second order polynomial models these residual background
processes.
The 2003 d+Au run also yielded ρ0 events. These asymmetric collisions involve two
distinct processes, depending on whether the gold or the deuterium emits the photon:
Au → γAu followed by γd → dρ0 or d → γd and γAu → Auρ0. Photon emission
is much more likely from the gold nucleus. When a photon scatters from the gold
scatters from off the deuteron, it may scatter coherently, leaving the deuterium intact
or incoherently, dissociating the deuterium. About 106 d+Au collisions were recorded
using the STAR topology trigger with a subsample that required a neutron signal in the
ZDC. Requiring a neutron signal in the ZDC cleanly separates incoherent reactions in
which the deuterium breaks up. Figure 109 shows a clear ρ0 signal in the preliminary
Mππ invariant mass spectrum. Further analysis is underway.
)2
(GeV/cππM0.5 0.6 0.7 0.8 0.9 1 1.1
2E
ntr
ies/
45M
eV/c
-2000
200400600800
100012001400 -π+π
-π-π+,π+π
Figure 109. The dN/dMππ invariant mass distribution for two-track events in√s
NN= 200 GeV d+Au collisions at STAR [372]. No pT cut is applied to the d+Au
data. Reprinted from Ref. [372] with permission from Elsevier.
STAR has also observed photoproduction of four-pion final states. Fig. 110 shows
an excess of zero net charge four-prong final states such as π+π−π+π− at low pT in√s
NN= 200 GeV Au+Au collisions, as expected for coherent photoproduction. Since
no particle identification is applied the particles are assumed to be pions. No excess
is seen for finite net-charged final states. The four-pion mass is peaked around ∼ 1.5
GeV/c2, as also shown in Fig. 110, consistent with a ρ0′ decaying to four pions.
9.2.4. Interference Stringent event selection criteria were used to select a clean, low-
background sample [90] from the STAR 200 GeV Au+Au data to study ρ0 interference.
The magnitude of the interference depends on the ratio of the amplitudes for ρ0
production from the two nuclei. Away from y = 0, the amplitudes differ and the
interference is reduced. Thus this analysis focuses on the midrapidity region. We neglect
ρ0 candidates with |y| < 0.1 to avoid possible cosmic ray contamination. A Monte Carlo
is used to calculate the expected interference for different rapidity ranges [72, 78].
192
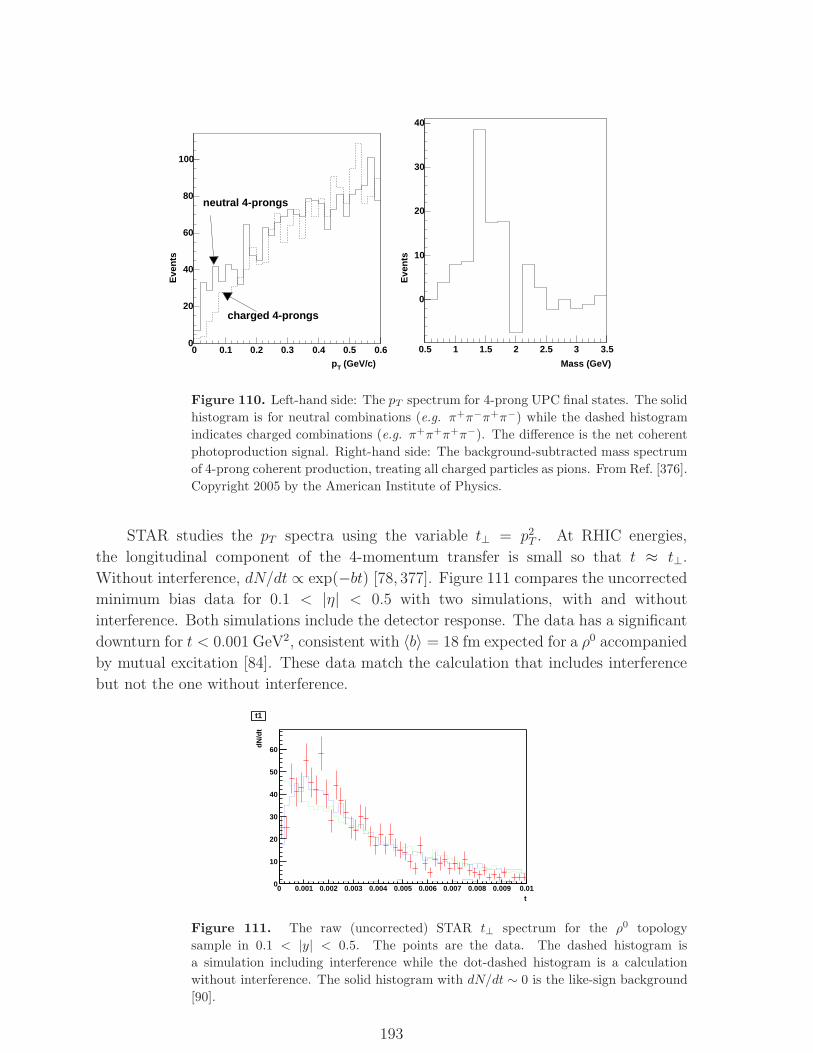
(GeV/c)Tp0 0.1 0.2 0.3 0.4 0.5
Eve
nts
0.60
20
40
60
80
100
neutral 4-prongs
charged 4-prongs
Mass (GeV)
0.5 1 1.5 2 2.5 3 3.5
0
10
20
30
Eve
nts
40
Figure 110. Left-hand side: The pT spectrum for 4-prong UPC final states. The solid
histogram is for neutral combinations (e.g. π+π−π+π−) while the dashed histogram
indicates charged combinations (e.g. π+π+π+π−). The difference is the net coherent
photoproduction signal. Right-hand side: The background-subtracted mass spectrum
of 4-prong coherent production, treating all charged particles as pions. From Ref. [376].
Copyright 2005 by the American Institute of Physics.
STAR studies the pT spectra using the variable t⊥ = p2T . At RHIC energies,
the longitudinal component of the 4-momentum transfer is small so that t ≈ t⊥.
Without interference, dN/dt ∝ exp(−bt) [78, 377]. Figure 111 compares the uncorrected
minimum bias data for 0.1 < |η| < 0.5 with two simulations, with and without
interference. Both simulations include the detector response. The data has a significant
downturn for t < 0.001 GeV2, consistent with 〈b〉 = 18 fm expected for a ρ0 accompanied
by mutual excitation [84]. These data match the calculation that includes interference
but not the one without interference.
t0 0.001 0.002 0.003 0.004 0.005 0.006 0.007 0.008 0.009 0.01
dN
/dt
0
10
20
30
40
50
60
t1t1
Figure 111. The raw (uncorrected) STAR t⊥ spectrum for the ρ0 topology
sample in 0.1 < |y| < 0.5. The points are the data. The dashed histogram is
a simulation including interference while the dot-dashed histogram is a calculation
without interference. The solid histogram with dN/dt ∼ 0 is the like-sign background
[90].
193
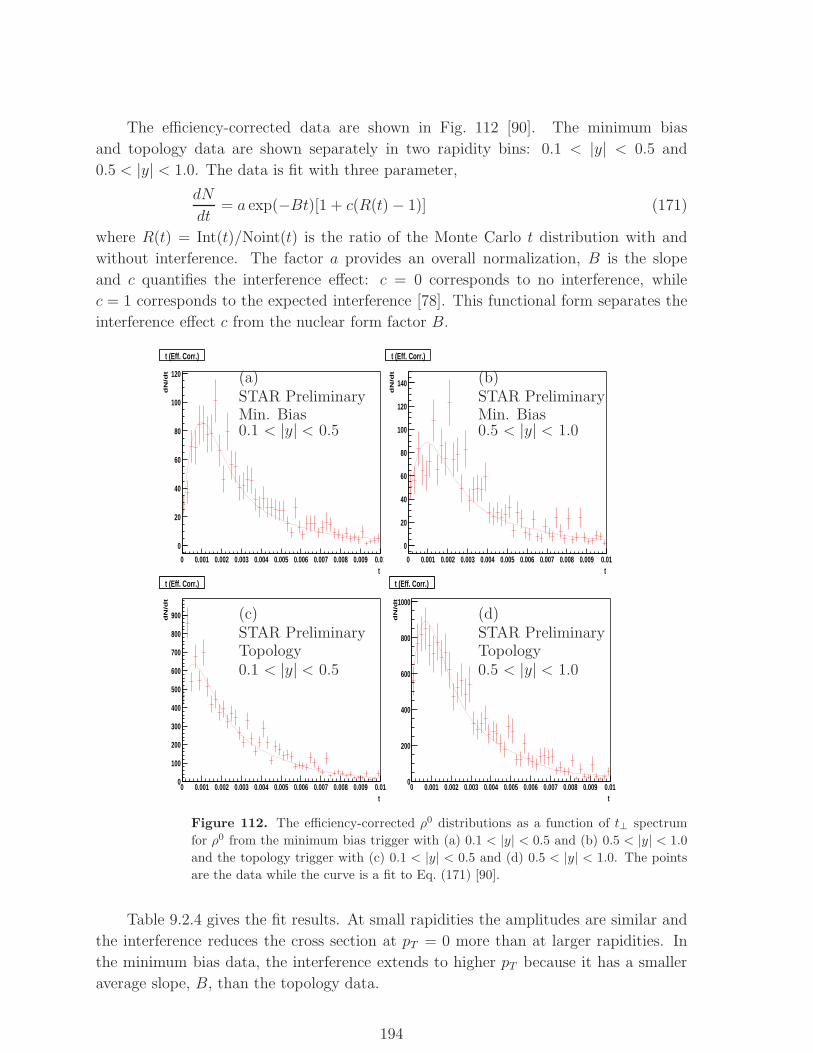
The efficiency-corrected data are shown in Fig. 112 [90]. The minimum bias
and topology data are shown separately in two rapidity bins: 0.1 < |y| < 0.5 and
0.5 < |y| < 1.0. The data is fit with three parameter,
dN
dt= a exp(−Bt)[1 + c(R(t) − 1)] (171)
where R(t) = Int(t)/Noint(t) is the ratio of the Monte Carlo t distribution with and
without interference. The factor a provides an overall normalization, B is the slope
and c quantifies the interference effect: c = 0 corresponds to no interference, while
c = 1 corresponds to the expected interference [78]. This functional form separates the
interference effect c from the nuclear form factor B.
t0 0.001 0.002 0.003 0.004 0.005 0.006 0.007 0.008 0.009 0.01
dN
/dt
0
20
40
60
80
100
120
t (Eff. Corr.)t (Eff. Corr.)
t0 0.001 0.002 0.003 0.004 0.005 0.006 0.007 0.008 0.009 0.01
dN
/dt
0
20
40
60
80
100
120
140
t (Eff. Corr.)t (Eff. Corr.)
t0 0.001 0.002 0.003 0.004 0.005 0.006 0.007 0.008 0.009 0.01
dN
/dt
0
100
200
300
400
500
600
700
800
900
t (Eff. Corr.)t (Eff. Corr.)
t0 0.001 0.002 0.003 0.004 0.005 0.006 0.007 0.008 0.009 0.01
dN
/dt
0
200
400
600
800
1000
t (Eff. Corr.)t (Eff. Corr.)
(a)STAR PreliminaryMin. Bias0.1 < |y| < 0.5
(c)STAR PreliminaryTopology0.1 < |y| < 0.5
(b)STAR PreliminaryMin. Bias0.5 < |y| < 1.0
(d)STAR PreliminaryTopology0.5 < |y| < 1.0
Figure 112. The efficiency-corrected ρ0 distributions as a function of t⊥ spectrum
for ρ0 from the minimum bias trigger with (a) 0.1 < |y| < 0.5 and (b) 0.5 < |y| < 1.0
and the topology trigger with (c) 0.1 < |y| < 0.5 and (d) 0.5 < |y| < 1.0. The points
are the data while the curve is a fit to Eq. (171) [90].
Table 9.2.4 gives the fit results. At small rapidities the amplitudes are similar and
the interference reduces the cross section at pT = 0 more than at larger rapidities. In
the minimum bias data, the interference extends to higher pT because it has a smaller
average slope, B, than the topology data.
194
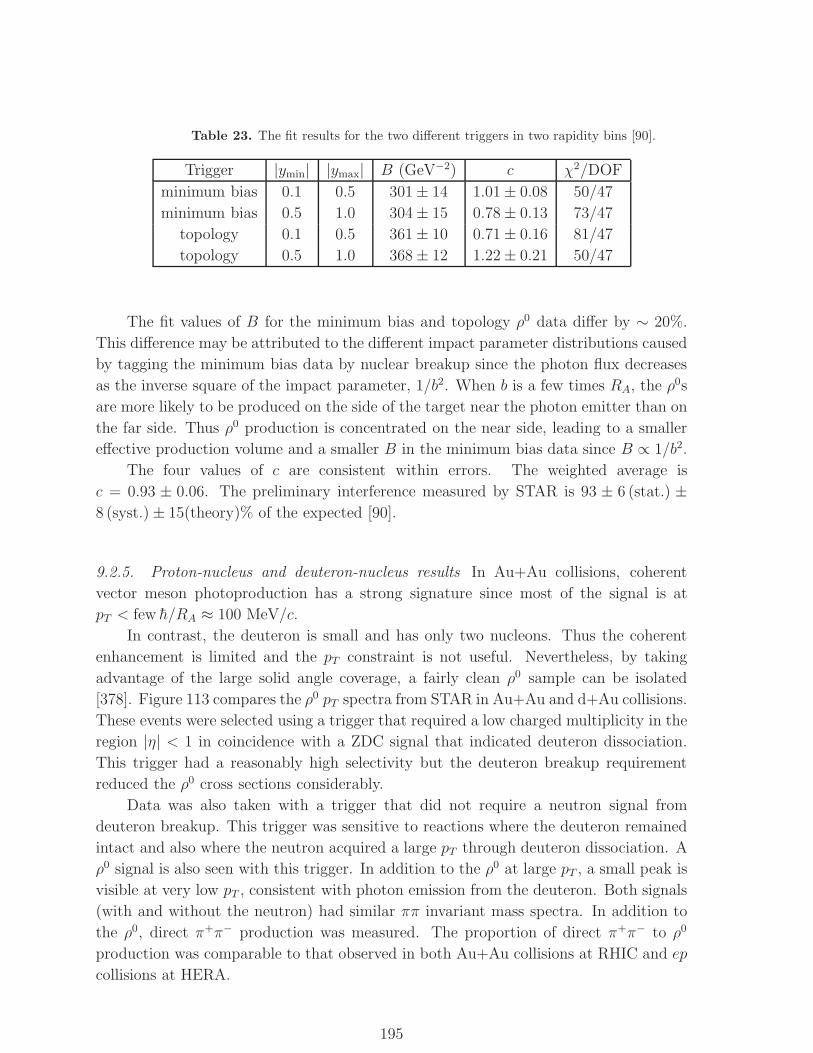
Table 23. The fit results for the two different triggers in two rapidity bins [90].
Trigger |ymin| |ymax| B (GeV−2) c χ2/DOF
minimum bias 0.1 0.5 301 ± 14 1.01 ± 0.08 50/47
minimum bias 0.5 1.0 304 ± 15 0.78 ± 0.13 73/47
topology 0.1 0.5 361 ± 10 0.71 ± 0.16 81/47
topology 0.5 1.0 368 ± 12 1.22 ± 0.21 50/47
The fit values of B for the minimum bias and topology ρ0 data differ by ∼ 20%.
This difference may be attributed to the different impact parameter distributions caused
by tagging the minimum bias data by nuclear breakup since the photon flux decreases
as the inverse square of the impact parameter, 1/b2. When b is a few times RA, the ρ0s
are more likely to be produced on the side of the target near the photon emitter than on
the far side. Thus ρ0 production is concentrated on the near side, leading to a smaller
effective production volume and a smaller B in the minimum bias data since B ∝ 1/b2.
The four values of c are consistent within errors. The weighted average is
c = 0.93 ± 0.06. The preliminary interference measured by STAR is 93 ± 6 (stat.) ±8 (syst.) ± 15(theory)% of the expected [90].
9.2.5. Proton-nucleus and deuteron-nucleus results In Au+Au collisions, coherent
vector meson photoproduction has a strong signature since most of the signal is at
pT < few h/RA ≈ 100 MeV/c.
In contrast, the deuteron is small and has only two nucleons. Thus the coherent
enhancement is limited and the pT constraint is not useful. Nevertheless, by taking
advantage of the large solid angle coverage, a fairly clean ρ0 sample can be isolated
[378]. Figure 113 compares the ρ0 pT spectra from STAR in Au+Au and d+Au collisions.
These events were selected using a trigger that required a low charged multiplicity in the
region |η| < 1 in coincidence with a ZDC signal that indicated deuteron dissociation.
This trigger had a reasonably high selectivity but the deuteron breakup requirement
reduced the ρ0 cross sections considerably.
Data was also taken with a trigger that did not require a neutron signal from
deuteron breakup. This trigger was sensitive to reactions where the deuteron remained
intact and also where the neutron acquired a large pT through deuteron dissociation. A
ρ0 signal is also seen with this trigger. In addition to the ρ0 at large pT , a small peak is
visible at very low pT , consistent with photon emission from the deuteron. Both signals
(with and without the neutron) had similar ππ invariant mass spectra. In addition to
the ρ0, direct π+π− production was measured. The proportion of direct π+π− to ρ0
production was comparable to that observed in both Au+Au collisions at RHIC and ep
collisions at HERA.
195
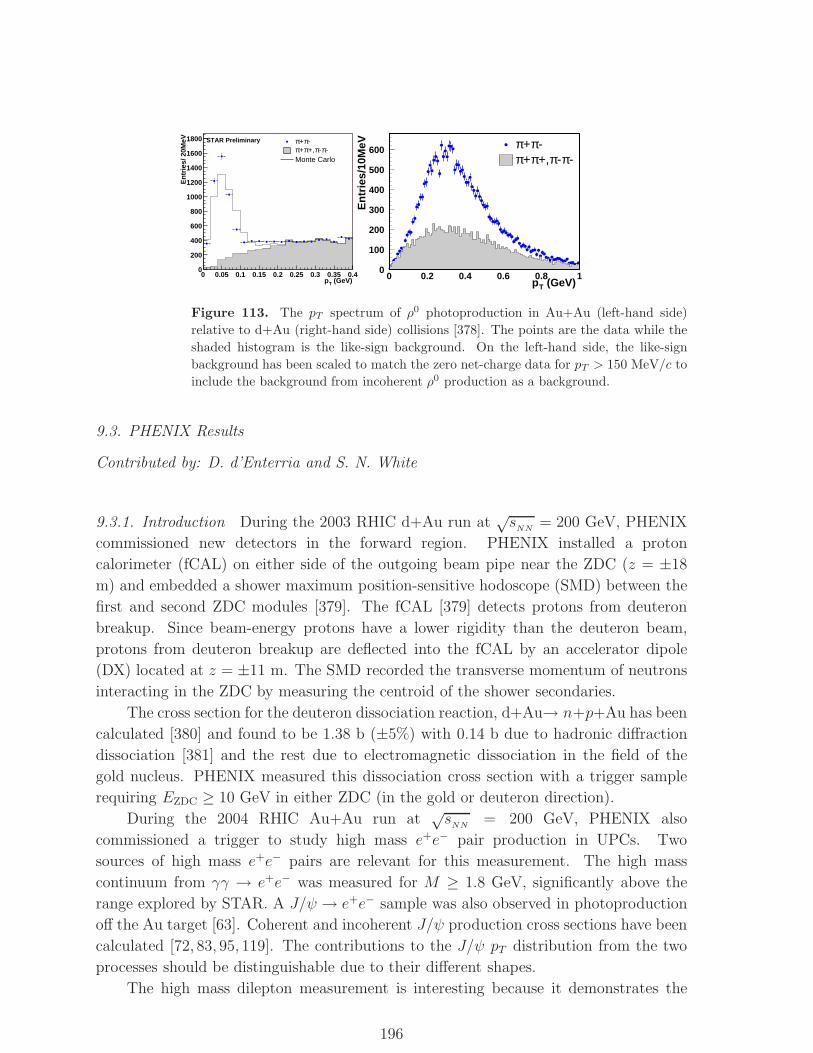
(GeV)Tp0 0.05 0.1 0.15 0.2 0.25 0.3 0.35 0.4
En
trie
s/ 2
0MeV
0
200
400
600
800
1000
1200
1400
1600
1800 -π+π-π-π+,π+π
Monte Carlo
STAR Preliminary
(GeV)Tp0 0.2 0.4 0.6 0.8 1
En
trie
s/10
MeV
0
100
200
300
400
500
600 -π+π-π-π+,π+π
Figure 113. The pT spectrum of ρ0 photoproduction in Au+Au (left-hand side)
relative to d+Au (right-hand side) collisions [378]. The points are the data while the
shaded histogram is the like-sign background. On the left-hand side, the like-sign
background has been scaled to match the zero net-charge data for pT > 150 MeV/c to
include the background from incoherent ρ0 production as a background.
9.3. PHENIX Results
Contributed by: D. d’Enterria and S. N. White
9.3.1. Introduction During the 2003 RHIC d+Au run at√s
NN= 200 GeV, PHENIX
commissioned new detectors in the forward region. PHENIX installed a proton
calorimeter (fCAL) on either side of the outgoing beam pipe near the ZDC (z = ±18
m) and embedded a shower maximum position-sensitive hodoscope (SMD) between the
first and second ZDC modules [379]. The fCAL [379] detects protons from deuteron
breakup. Since beam-energy protons have a lower rigidity than the deuteron beam,
protons from deuteron breakup are deflected into the fCAL by an accelerator dipole
(DX) located at z = ±11 m. The SMD recorded the transverse momentum of neutrons
interacting in the ZDC by measuring the centroid of the shower secondaries.
The cross section for the deuteron dissociation reaction, d+Au→ n+p+Au has been
calculated [380] and found to be 1.38 b (±5%) with 0.14 b due to hadronic diffraction
dissociation [381] and the rest due to electromagnetic dissociation in the field of the
gold nucleus. PHENIX measured this dissociation cross section with a trigger sample
requiring EZDC ≥ 10 GeV in either ZDC (in the gold or deuteron direction).
During the 2004 RHIC Au+Au run at√s
NN= 200 GeV, PHENIX also
commissioned a trigger to study high mass e+e− pair production in UPCs. Two
sources of high mass e+e− pairs are relevant for this measurement. The high mass
continuum from γγ → e+e− was measured for M ≥ 1.8 GeV, significantly above the
range explored by STAR. A J/ψ → e+e− sample was also observed in photoproduction
off the Au target [63]. Coherent and incoherent J/ψ production cross sections have been
calculated [72, 83, 95, 119]. The contributions to the J/ψ pT distribution from the two
processes should be distinguishable due to their different shapes.
The high mass dilepton measurement is interesting because it demonstrates the
196
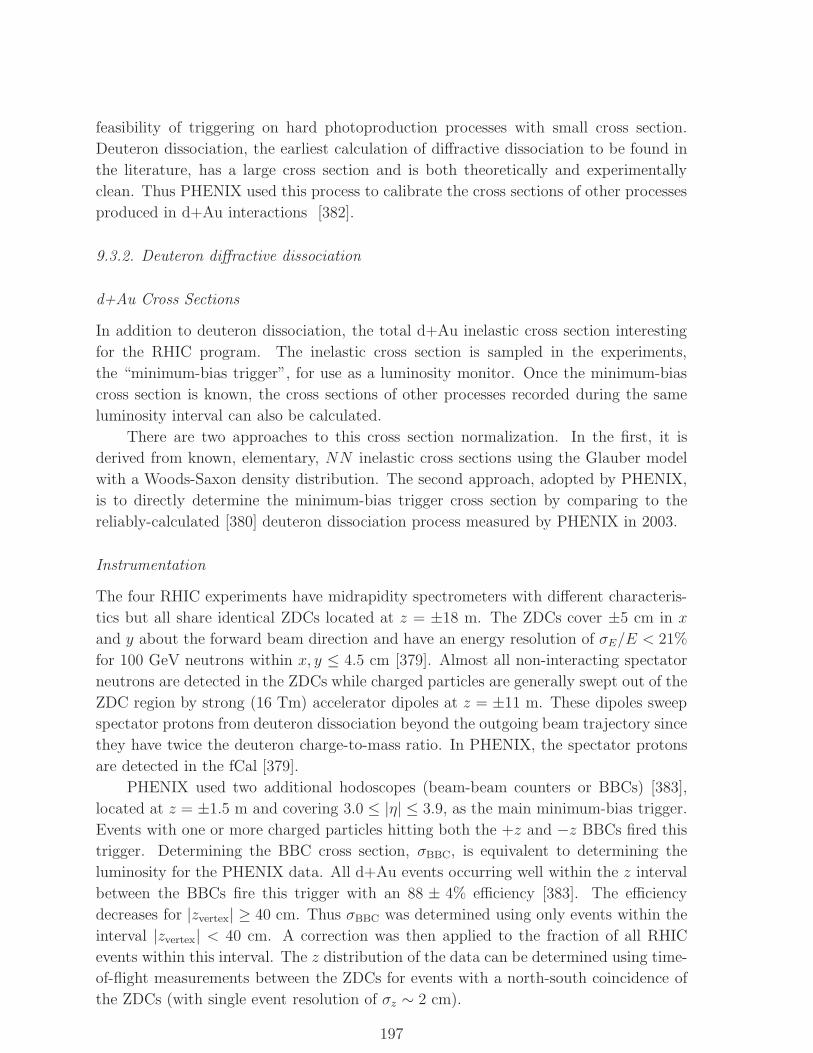
feasibility of triggering on hard photoproduction processes with small cross section.
Deuteron dissociation, the earliest calculation of diffractive dissociation to be found in
the literature, has a large cross section and is both theoretically and experimentally
clean. Thus PHENIX used this process to calibrate the cross sections of other processes
produced in d+Au interactions [382].
9.3.2. Deuteron diffractive dissociation
d+Au Cross Sections
In addition to deuteron dissociation, the total d+Au inelastic cross section interesting
for the RHIC program. The inelastic cross section is sampled in the experiments,
the “minimum-bias trigger”, for use as a luminosity monitor. Once the minimum-bias
cross section is known, the cross sections of other processes recorded during the same
luminosity interval can also be calculated.
There are two approaches to this cross section normalization. In the first, it is
derived from known, elementary, NN inelastic cross sections using the Glauber model
with a Woods-Saxon density distribution. The second approach, adopted by PHENIX,
is to directly determine the minimum-bias trigger cross section by comparing to the
reliably-calculated [380] deuteron dissociation process measured by PHENIX in 2003.
Instrumentation
The four RHIC experiments have midrapidity spectrometers with different characteris-
tics but all share identical ZDCs located at z = ±18 m. The ZDCs cover ±5 cm in x
and y about the forward beam direction and have an energy resolution of σE/E < 21%
for 100 GeV neutrons within x, y ≤ 4.5 cm [379]. Almost all non-interacting spectator
neutrons are detected in the ZDCs while charged particles are generally swept out of the
ZDC region by strong (16 Tm) accelerator dipoles at z = ±11 m. These dipoles sweep
spectator protons from deuteron dissociation beyond the outgoing beam trajectory since
they have twice the deuteron charge-to-mass ratio. In PHENIX, the spectator protons
are detected in the fCal [379].
PHENIX used two additional hodoscopes (beam-beam counters or BBCs) [383],
located at z = ±1.5 m and covering 3.0 ≤ |η| ≤ 3.9, as the main minimum-bias trigger.
Events with one or more charged particles hitting both the +z and −z BBCs fired this
trigger. Determining the BBC cross section, σBBC, is equivalent to determining the
luminosity for the PHENIX data. All d+Au events occurring well within the z interval
between the BBCs fire this trigger with an 88 ± 4% efficiency [383]. The efficiency
decreases for |zvertex| ≥ 40 cm. Thus σBBC was determined using only events within the
interval |zvertex| < 40 cm. A correction was then applied to the fraction of all RHIC
events within this interval. The z distribution of the data can be determined using time-
of-flight measurements between the ZDCs for events with a north-south coincidence of
the ZDCs (with single event resolution of σz ∼ 2 cm).
197
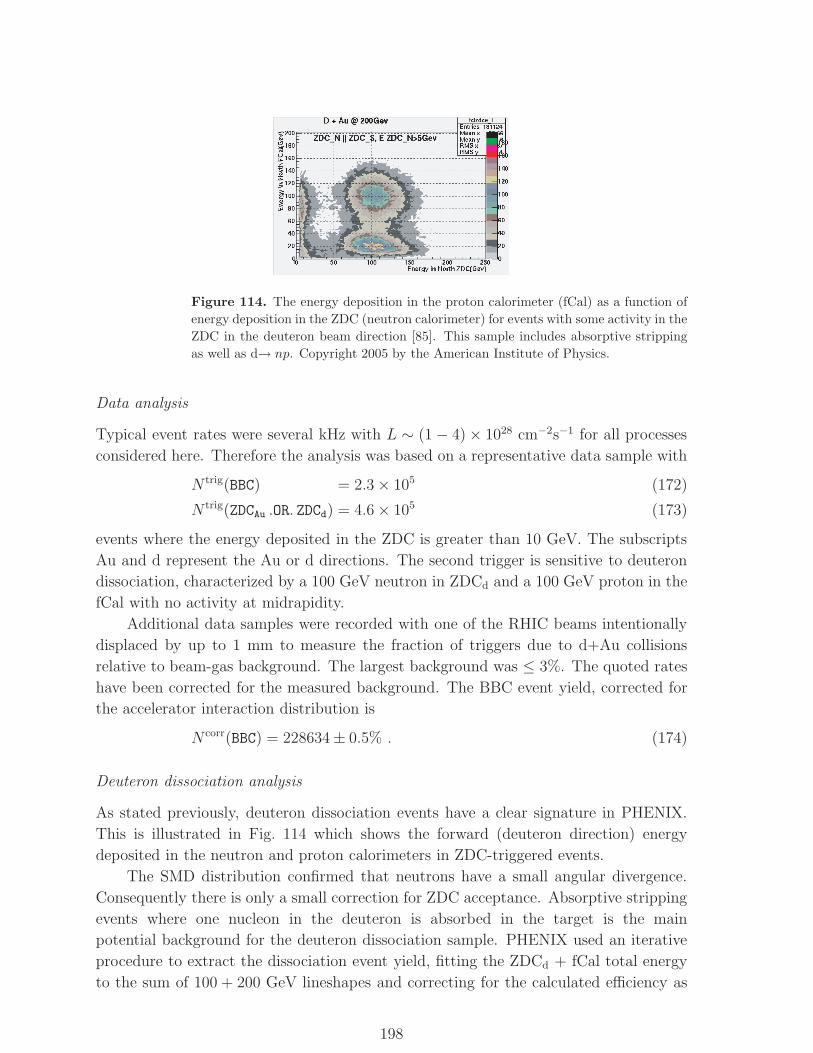
Figure 114. The energy deposition in the proton calorimeter (fCal) as a function of
energy deposition in the ZDC (neutron calorimeter) for events with some activity in the
ZDC in the deuteron beam direction [85]. This sample includes absorptive stripping
as well as d→ np. Copyright 2005 by the American Institute of Physics.
Data analysis
Typical event rates were several kHz with L ∼ (1 − 4) × 1028 cm−2s−1 for all processes
considered here. Therefore the analysis was based on a representative data sample with
N trig(BBC) = 2.3 × 10⁵ (172)
N trig(ZDCAu .OR. ZDCd) = 4.6 × 10⁵ (173)
events where the energy deposited in the ZDC is greater than 10 GeV. The subscripts
Au and d represent the Au or d directions. The second trigger is sensitive to deuteron
dissociation, characterized by a 100 GeV neutron in ZDCd and a 100 GeV proton in the
fCal with no activity at midrapidity.
Additional data samples were recorded with one of the RHIC beams intentionally
displaced by up to 1 mm to measure the fraction of triggers due to d+Au collisions
relative to beam-gas background. The largest background was ≤ 3%. The quoted rates
have been corrected for the measured background. The BBC event yield, corrected for
the accelerator interaction distribution is
N corr(BBC) = 228634 ± 0.5% . (174)
Deuteron dissociation analysis
As stated previously, deuteron dissociation events have a clear signature in PHENIX.
This is illustrated in Fig. 114 which shows the forward (deuteron direction) energy
deposited in the neutron and proton calorimeters in ZDC-triggered events.
The SMD distribution confirmed that neutrons have a small angular divergence.
Consequently there is only a small correction for ZDC acceptance. Absorptive stripping
events where one nucleon in the deuteron is absorbed in the target is the main
potential background for the deuteron dissociation sample. PHENIX used an iterative
procedure to extract the dissociation event yield, fitting the ZDCd + fCal total energy
to the sum of 100 + 200 GeV lineshapes and correcting for the calculated efficiency as
198
successive cuts on activity in other detectors were applied. The first two iterations yield
N(d → n+p) = 157149 and 156951 events, showing that the procedure is clearly stable.
The final result is :
σBBC =N corr(BBC)
N(d → np)σd→np =
228634
1587611.38 (±0.5%) b
= 1.99 (±1.6% ± 5.0%) b , (175)
the quantity needed for the luminosity normalization. In order to compare with Glauber
calculations in the literature, a correction was applied for the 88% BBC detector
efficiency to obtain the inelastic d+Au cross section,
σdAuinel =
σBBC
0.88= 2.26 ± 1.6% ± 5.0% ± 4.5% b . (176)
The last two errors reflect the theoretical uncertainty on σd→np and the BBC efficiency
uncertainty. A similar analysis yields the ZDCAu cross section for E > 10 GeV, also
used as a minimum bias trigger,
σZDCAu= 2.06 ± 1.7% ± 5.0% b . (177)
9.3.3. J/ψ and high mass e+e− photoproduction Ultraperipheral electromagnetic
interactions of nuclei can be calculated using the equivalent photon approximation with
b ≥ 2RA. As long as the photon squared momentum transfer is restricted to Q2 < 1/R2A,
the photon spectrum is dominated by coherent emission with a Z2 enhancement in
the equivalent γA luminosity. Because the coupling strength, Z2α, is close to unity,
additional low energy photon exchanges occur with high probability, particularly at
b ∼ 2RA [84]. These low energy photons excite collective nuclear resonances, such as the
GDR, very effectively. The excited nuclei return to their ground state predominantly by
the emission of one or two neutrons. Neutron tagging is particularly useful for triggering
UPC events and, when combined with a rapidity gap requirement on the side of the
photon-emitting nucleus, is a powerful trigger selection criteria in heavy-ion collisions.
The fraction of J/ψ events with at least one neutron tag is calculated to be 60%.
Several calculations can be found in the literature [72, 83, 119] and an event
generator, starlight, is used at RHIC to simulate both coherent vector meson
production and γγ → e+e−. Recently [95] a calculation of incoherent γ Au → J/ψX
production was also presented. This calculation considers the same coherent photon
flux but instead of quasi-elastic J/ψ production off the entire nucleus it considers the
corresponding production off individual target nucleons. Signatures of the incoherent
process are a broader J/ψ pT distribution and a higher neutron multiplicity due
to interactions of the recoiling nucleon within the nucleus, see the discussion in
Section 2.3.7.
Trigger selection
PHENIX has excellent capabilities for electron identification since it includes a high
resolution electromagnetic calorimeter (EMCal) and Ring Imaging Cerenkov (RICH)
199
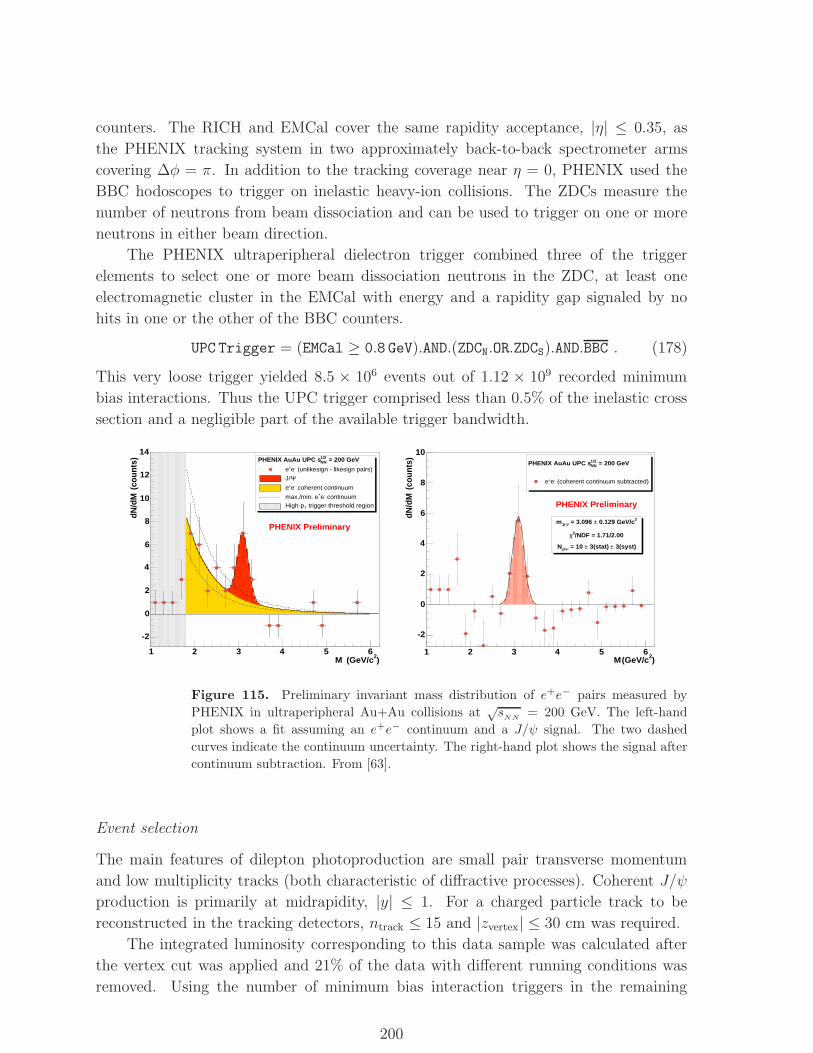
counters. The RICH and EMCal cover the same rapidity acceptance, |η| ≤ 0.35, as
the PHENIX tracking system in two approximately back-to-back spectrometer arms
covering ∆φ = π. In addition to the tracking coverage near η = 0, PHENIX used the
BBC hodoscopes to trigger on inelastic heavy-ion collisions. The ZDCs measure the
number of neutrons from beam dissociation and can be used to trigger on one or more
neutrons in either beam direction.
The PHENIX ultraperipheral dielectron trigger combined three of the trigger
elements to select one or more beam dissociation neutrons in the ZDC, at least one
electromagnetic cluster in the EMCal with energy and a rapidity gap signaled by no
hits in one or the other of the BBC counters.
UPC Trigger = (EMCal ≥ 0.8 GeV).AND.(ZDCN.OR.ZDCS).AND.BBC . (178)
This very loose trigger yielded 8.5 × 10⁶ events out of 1.12 × 10⁹ recorded minimum
bias interactions. Thus the UPC trigger comprised less than 0.5% of the inelastic cross
section and a negligible part of the available trigger bandwidth.
)2 (GeV/cM1 2 3 4 5 6
(cou
nts)
dN/d
M
-2
0
2
4
6
8
10
12
14 = 200 GeV1/2
NNPHENIX AuAu UPC s
(unlikesign - likesign pairs)-e+e
ΨJ/
coherent continuum-e+e
continuum-e+max./min. e trigger threshold regionTHigh-p
PHENIX Preliminary
)2 (GeV/cM1 2 3 4 5 6
(cou
nts)
dN/d
M
-2
0
2
4
6
8
10 = 200 GeV1/2
NNPHENIX AuAu UPC s
(coherent continuum subtracted)-e+e
2 0.129 GeV/c± = 3.096 ΨJ/m
/NDF = 1.71/2.002χ
3(syst)± 3(stat) ± = 10 ΨJ/N
PHENIX Preliminary
Figure 115. Preliminary invariant mass distribution of e+e− pairs measured by
PHENIX in ultraperipheral Au+Au collisions at√s
NN= 200 GeV. The left-hand
plot shows a fit assuming an e+e− continuum and a J/ψ signal. The two dashed
curves indicate the continuum uncertainty. The right-hand plot shows the signal after
continuum subtraction. From [63].
Event selection
The main features of dilepton photoproduction are small pair transverse momentum
and low multiplicity tracks (both characteristic of diffractive processes). Coherent J/ψ
production is primarily at midrapidity, |y| ≤ 1. For a charged particle track to be
reconstructed in the tracking detectors, ntrack ≤ 15 and |zvertex| ≤ 30 cm was required.
The integrated luminosity corresponding to this data sample was calculated after
the vertex cut was applied and 21% of the data with different running conditions was
removed. Using the number of minimum bias interaction triggers in the remaining
200
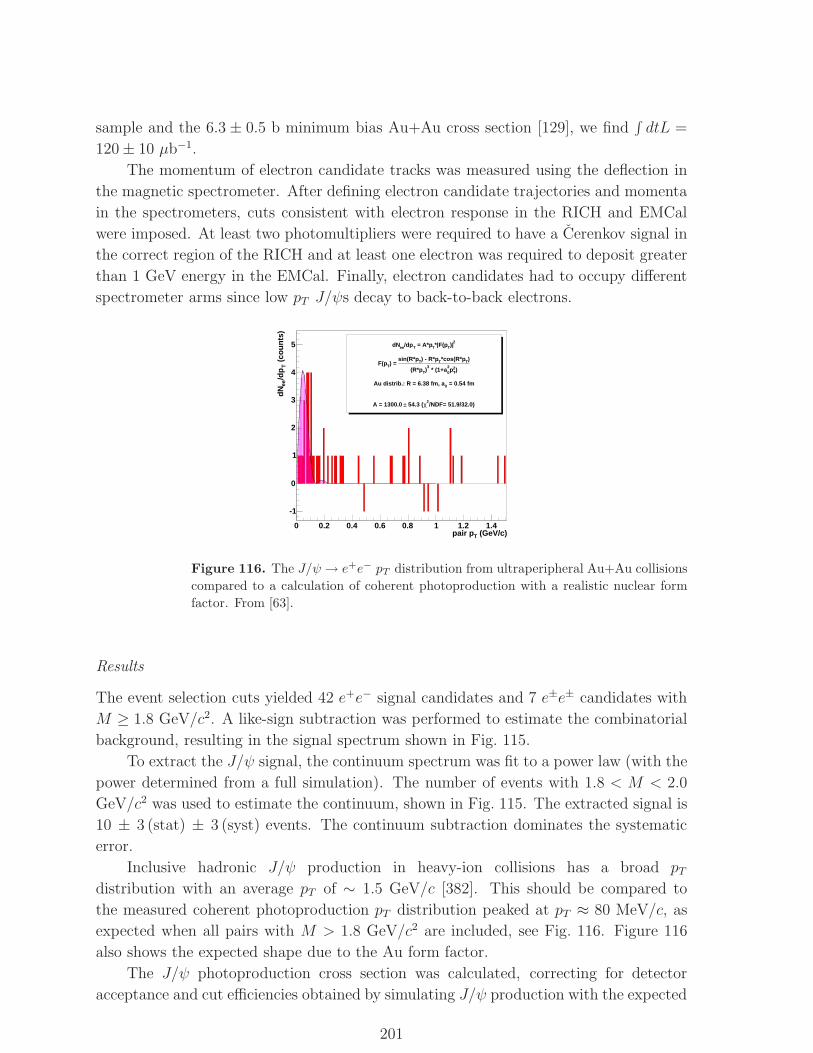
sample and the 6.3 ± 0.5 b minimum bias Au+Au cross section [129], we find∫dtL =
120 ± 10 µb−1.
The momentum of electron candidate tracks was measured using the deflection in
the magnetic spectrometer. After defining electron candidate trajectories and momenta
in the spectrometers, cuts consistent with electron response in the RICH and EMCal
were imposed. At least two photomultipliers were required to have a Cerenkov signal in
the correct region of the RICH and at least one electron was required to deposit greater
than 1 GeV energy in the EMCal. Finally, electron candidates had to occupy different
spectrometer arms since low pT J/ψs decay to back-to-back electrons.
(GeV/c)Tpair p0 0.2 0.4 0.6 0.8 1 1.2 1.4
(co
un
ts)
T/d
pee
dN
-1
0
1
2
3
4
5 2)|T*|F(pT = A*pT/dpeedN
)2Tp
2
0 * (1+a3
)T(R*p
)T*cos(R*pT) - R*pTsin(R*p) = TF(p
= 0.54 fm0Au distrib.: R = 6.38 fm, a
/NDF= 51.9/32.0)2χ 54.3 (±A = 1300.0
Figure 116. The J/ψ → e+e− pT distribution from ultraperipheral Au+Au collisions
compared to a calculation of coherent photoproduction with a realistic nuclear form
factor. From [63].
Results
The event selection cuts yielded 42 e+e− signal candidates and 7 e±e± candidates with
M ≥ 1.8 GeV/c2. A like-sign subtraction was performed to estimate the combinatorial
background, resulting in the signal spectrum shown in Fig. 115.
To extract the J/ψ signal, the continuum spectrum was fit to a power law (with the
power determined from a full simulation). The number of events with 1.8 < M < 2.0
GeV/c2 was used to estimate the continuum, shown in Fig. 115. The extracted signal is
10 ± 3 (stat) ± 3 (syst) events. The continuum subtraction dominates the systematic
error.
Inclusive hadronic J/ψ production in heavy-ion collisions has a broad pTdistribution with an average pT of ∼ 1.5 GeV/c [382]. This should be compared to
the measured coherent photoproduction pT distribution peaked at pT ≈ 80 MeV/c, as
expected when all pairs with M > 1.8 GeV/c2 are included, see Fig. 116. Figure 116
also shows the expected shape due to the Au form factor.
The J/ψ photoproduction cross section was calculated, correcting for detector
acceptance and cut efficiencies obtained by simulating J/ψ production with the expected
201
pT distribution. The geometrical acceptance and efficiencies reduce the J/ψ yield in
|y| ≤ 0.5 by 5.0 % and 56.4 % respectively. The preliminary cross section at y = 0 is
BdσJ/ψdy
= 48 ± 14 (stat) ± 16 (syst)µb , (179)
in good agreement with the 58 µb starlight [72, 83, 119] prediction. In future Au+Au
runs, PHENIX will see a 10-fold increase in event yield, making detailed studies of both
coherent and quasi-elastic J/ψ photoproduction possible. PHENIX will also commission
a second trigger, sensitive to J/ψ → µ+µ− at large rapidity where the quasi-elastic
signal will dominate [95]. Nevertheless, the present low-statistics measurement clearly
demonstrates the feasibility of small cross section diffractive measurements in heavy-ion
collisions at RHIC and the LHC.
10. LHC detector overview of UPC potential
10.1. Introduction
Contributed by: P. Yepes
The ALICE, ATLAS and CMS collaborations plan to take data at the LHC with
heavy-ion beams. ALICE was specifically designed for heavy-ion physics and intends to
address both soft and hard physics. CMS and ATLAS were designed for hard physics
and initially focused on proton-proton collisions. However their potential for heavy-ion
physics was soon pointed out. In this chapter, a brief description of each detector is
presented with special emphasis on those features most relevant for UPCs.
Table 24 shows the main features of the LHC detectors. All three detectors have
complete azimuthal tracking coverage over different rapidity regions. ALICE is limited
to |η| <∼ 1 while ATLAS and CMS extend their coverage to |η| < 2.4. The latter
two detectors have tracking systems that can be read out at every beam crossing.
The ALICE TPC provides excellent resolution, ∆pT/pT = 1.5%, for low momentum
particles, 0.05 < pT < 2 GeV/c. However, ALICE can only be read out with a rate on
the order of kHz. The ATLAS (CMS) momentum resolution is ∆pT/pT ≈ 3% (< 2%).
ATLAS can reconstruct low momentum particles down to pT = 0.5 GeV/c, while CMS
measures tracks as low as pT = 0.2 GeV/c [384, 385].
ALICE is equipped with a muon spectrometer with full azimuthal acceptance in the
rapidity range −4 < η < −2.5. ATLAS has large acceptance, |η| < 2.4 for muons with
pT > 4.5 GeV/c. In CMS, muons with pT > 3.5 GeV/c will be detected in the central
region, |η| < 1, while the forward muon detector, 1 < |η| < 2.4, has muon acceptance
for pT > 1.5 GeV/c.
ALICE is best designed for particle identification. It can separate pions from kaons
in the range 0.1 < p < 3 GeV/c, kaons from protons over 0.2 < p < 5 GeV/c, and
electrons from π0’s for 0.1 < p < 25 GeV/c. Studies in CMS indicate good low pTcapabilities using the three layers of the silicon pixel tracker to achieve π, K and p
separation within 0.4 < pT < 1 GeV/c [384, 385]. In addition, a conservative range
over which electrons can be separated from neutral pions is 2 < pT < 20 GeV/c.
202
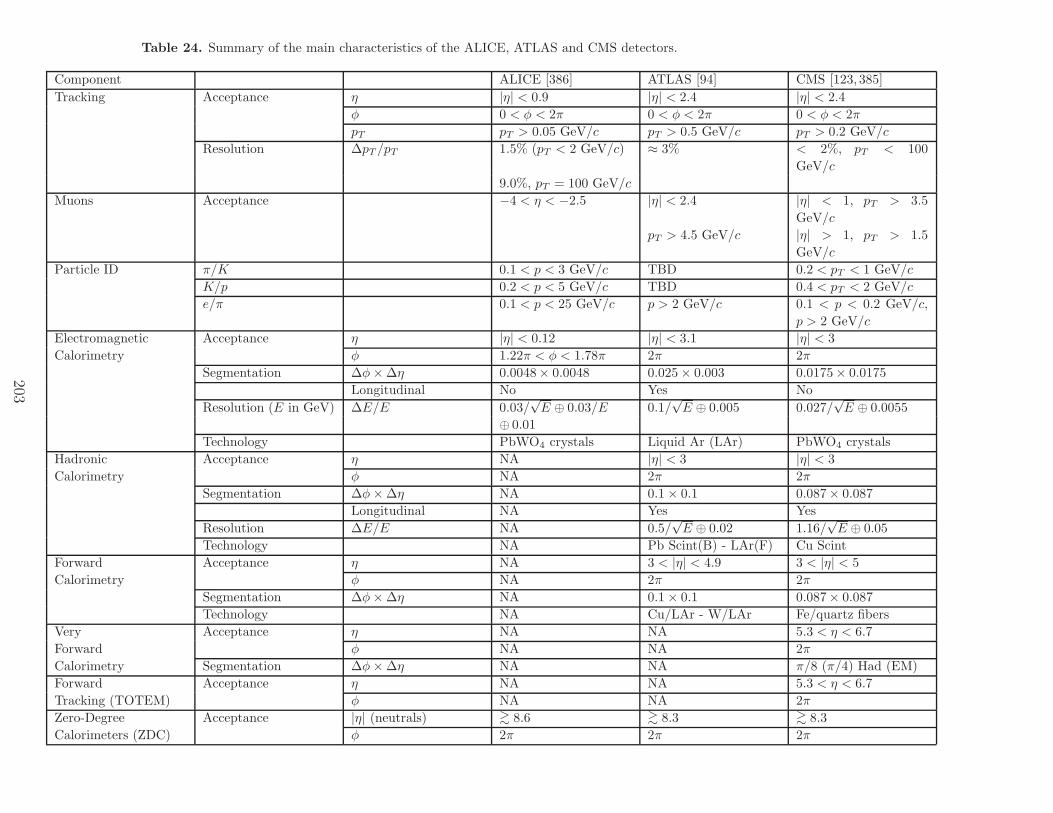
Table 24. Summary of the main characteristics of the ALICE, ATLAS and CMS detectors.
Component ALICE [386] ATLAS [94] CMS [123, 385]
Tracking Acceptance η |η| < 0.9 |η| < 2.4 |η| < 2.4
φ 0 < φ < 2π 0 < φ < 2π 0 < φ < 2π
pT pT > 0.05 GeV/c pT > 0.5 GeV/c pT > 0.2 GeV/c
Resolution ∆pT /pT 1.5% (pT < 2 GeV/c) ≈ 3% < 2%, pT < 100
GeV/c
9.0%, pT = 100 GeV/c
Muons Acceptance −4 < η < −2.5 |η| < 2.4 |η| < 1, pT > 3.5
GeV/c
pT > 4.5 GeV/c |η| > 1, pT > 1.5
GeV/c
Particle ID π/K 0.1 < p < 3 GeV/c TBD 0.2 < pT < 1 GeV/c
K/p 0.2 < p < 5 GeV/c TBD 0.4 < pT < 2 GeV/c
e/π 0.1 < p < 25 GeV/c p > 2 GeV/c 0.1 < p < 0.2 GeV/c,
p > 2 GeV/c
Electromagnetic Acceptance η |η| < 0.12 |η| < 3.1 |η| < 3
Calorimetry φ 1.22π < φ < 1.78π 2π 2π
Segmentation ∆φ× ∆η 0.0048× 0.0048 0.025 × 0.003 0.0175× 0.0175
Longitudinal No Yes No
Resolution (E in GeV) ∆E/E 0.03/√E ⊕ 0.03/E 0.1/
√E ⊕ 0.005 0.027/
√E ⊕ 0.0055
⊕ 0.01
Technology PbWO4 crystals Liquid Ar (LAr) PbWO4 crystals
Hadronic Acceptance η NA |η| < 3 |η| < 3
Calorimetry φ NA 2π 2π
Segmentation ∆φ× ∆η NA 0.1 × 0.1 0.087× 0.087
Longitudinal NA Yes Yes
Resolution ∆E/E NA 0.5/√E ⊕ 0.02 1.16/
√E ⊕ 0.05
Technology NA Pb Scint(B) - LAr(F) Cu Scint
Forward Acceptance η NA 3 < |η| < 4.9 3 < |η| < 5
Calorimetry φ NA 2π 2π
Segmentation ∆φ× ∆η NA 0.1 × 0.1 0.087× 0.087
Technology NA Cu/LAr - W/LAr Fe/quartz fibers
Very Acceptance η NA NA 5.3 < η < 6.7
Forward φ NA NA 2π
Calorimetry Segmentation ∆φ× ∆η NA NA π/8 (π/4) Had (EM)
Forward Acceptance η NA NA 5.3 < η < 6.7
Tracking (TOTEM) φ NA NA 2π
Zero-Degree Acceptance |η| (neutrals) >∼ 8.6 >∼ 8.3 >∼ 8.3
Calorimeters (ZDC) φ 2π 2π 2π
203
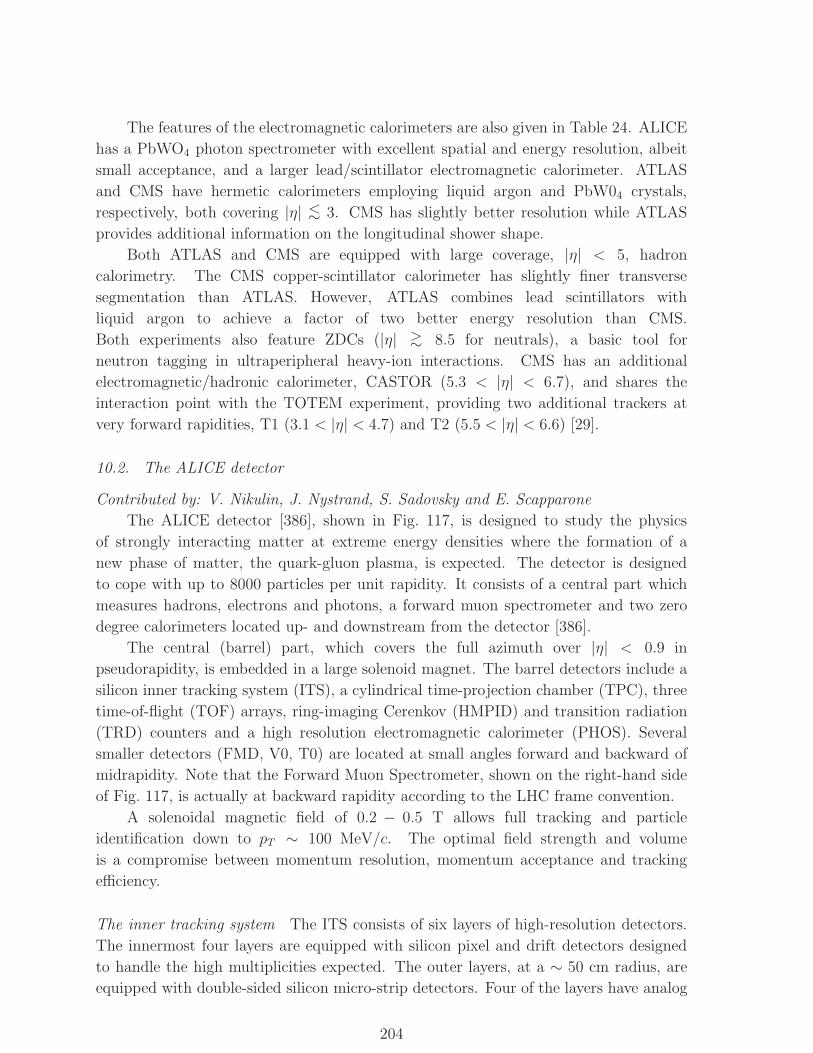
The features of the electromagnetic calorimeters are also given in Table 24. ALICE
has a PbWO4 photon spectrometer with excellent spatial and energy resolution, albeit
small acceptance, and a larger lead/scintillator electromagnetic calorimeter. ATLAS
and CMS have hermetic calorimeters employing liquid argon and PbW04 crystals,
respectively, both covering |η| <∼ 3. CMS has slightly better resolution while ATLAS
provides additional information on the longitudinal shower shape.
Both ATLAS and CMS are equipped with large coverage, |η| < 5, hadron
calorimetry. The CMS copper-scintillator calorimeter has slightly finer transverse
segmentation than ATLAS. However, ATLAS combines lead scintillators with
liquid argon to achieve a factor of two better energy resolution than CMS.
Both experiments also feature ZDCs (|η| >∼ 8.5 for neutrals), a basic tool for
neutron tagging in ultraperipheral heavy-ion interactions. CMS has an additional
electromagnetic/hadronic calorimeter, CASTOR (5.3 < |η| < 6.7), and shares the
interaction point with the TOTEM experiment, providing two additional trackers at
very forward rapidities, T1 (3.1 < |η| < 4.7) and T2 (5.5 < |η| < 6.6) [29].
10.2. The ALICE detector
Contributed by: V. Nikulin, J. Nystrand, S. Sadovsky and E. Scapparone
The ALICE detector [386], shown in Fig. 117, is designed to study the physics
of strongly interacting matter at extreme energy densities where the formation of a
new phase of matter, the quark-gluon plasma, is expected. The detector is designed
to cope with up to 8000 particles per unit rapidity. It consists of a central part which
measures hadrons, electrons and photons, a forward muon spectrometer and two zero
degree calorimeters located up- and downstream from the detector [386].
The central (barrel) part, which covers the full azimuth over |η| < 0.9 in
pseudorapidity, is embedded in a large solenoid magnet. The barrel detectors include a
silicon inner tracking system (ITS), a cylindrical time-projection chamber (TPC), three
time-of-flight (TOF) arrays, ring-imaging Cerenkov (HMPID) and transition radiation
(TRD) counters and a high resolution electromagnetic calorimeter (PHOS). Several
smaller detectors (FMD, V0, T0) are located at small angles forward and backward of
midrapidity. Note that the Forward Muon Spectrometer, shown on the right-hand side
of Fig. 117, is actually at backward rapidity according to the LHC frame convention.
A solenoidal magnetic field of 0.2 − 0.5 T allows full tracking and particle
identification down to pT ∼ 100 MeV/c. The optimal field strength and volume
is a compromise between momentum resolution, momentum acceptance and tracking
efficiency.
The inner tracking system The ITS consists of six layers of high-resolution detectors.
The innermost four layers are equipped with silicon pixel and drift detectors designed
to handle the high multiplicities expected. The outer layers, at a ∼ 50 cm radius, are
equipped with double-sided silicon micro-strip detectors. Four of the layers have analog
204
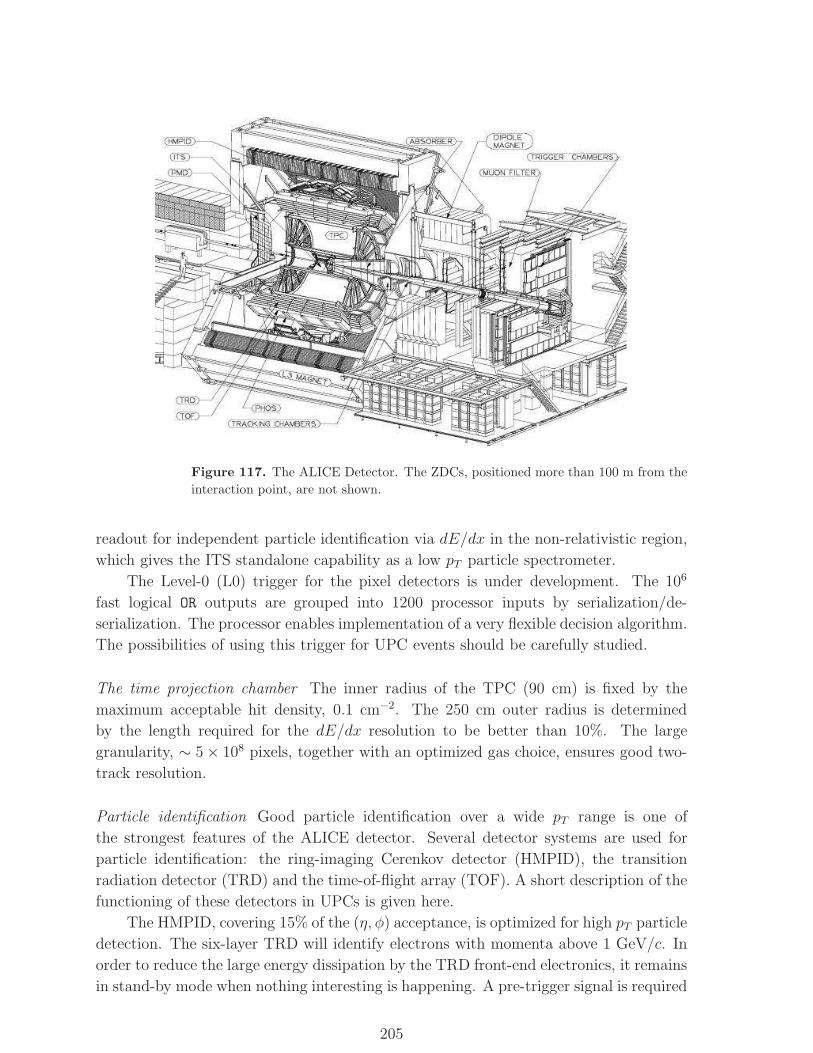
Figure 117. The ALICE Detector. The ZDCs, positioned more than 100 m from the
interaction point, are not shown.
readout for independent particle identification via dE/dx in the non-relativistic region,
which gives the ITS standalone capability as a low pT particle spectrometer.
The Level-0 (L0) trigger for the pixel detectors is under development. The 106
fast logical OR outputs are grouped into 1200 processor inputs by serialization/de-
serialization. The processor enables implementation of a very flexible decision algorithm.
The possibilities of using this trigger for UPC events should be carefully studied.
The time projection chamber The inner radius of the TPC (90 cm) is fixed by the
maximum acceptable hit density, 0.1 cm−2. The 250 cm outer radius is determined
by the length required for the dE/dx resolution to be better than 10%. The large
granularity, ∼ 5 × 108 pixels, together with an optimized gas choice, ensures good two-
track resolution.
Particle identification Good particle identification over a wide pT range is one of
the strongest features of the ALICE detector. Several detector systems are used for
particle identification: the ring-imaging Cerenkov detector (HMPID), the transition
radiation detector (TRD) and the time-of-flight array (TOF). A short description of the
functioning of these detectors in UPCs is given here.
The HMPID, covering 15% of the (η, φ) acceptance, is optimized for high pT particle
detection. The six-layer TRD will identify electrons with momenta above 1 GeV/c. In
order to reduce the large energy dissipation by the TRD front-end electronics, it remains
in stand-by mode when nothing interesting is happening. A pre-trigger signal is required
205
to wake up the electronics within 100 ns of the interaction. In hadronic interactions,
the fast logical OR of the small angle T0 detector is used as a pre-trigger. Since the T0
detectors are only useful in a high-multiplicity environment and cannot be employed in
UPCs, the OR from the TOF can be used as an alternate TRD pre-trigger.
The large TOF detector covers a cylindrical surface with polar angle acceptance of
45◦ < θ < 135◦. The TOF consists of 90 modules with 18 φ sectors and 5 z segments.
The TOF modules are made up of multi-gap resistive plate chambers (MRPCs) with
an intrinsic timing resolution of ∼ 100 ps. The 5 longitudinal segments have different
numbers of strips, according to their position. There are 1674 MRPC strips in the TOF,
each with 96 pads, for a total of ∼ 1.6 × 10⁵ readout pads. The TOF L0 trigger can
provide the total hit multiplicity. A more sophisticated Level-1 (L1) trigger could be
applied.
Photon detectors The photon spectrometer (PHOS) is intended to measure direct
photons and high pT neutral mesons. PHOS is a single arm, high-resolution
electromagnetic calorimeter, positioned 4.6 m below the interaction vertex. It covers 8
m2, ∼ 10% of the barrel solid angle, with ∼ 17, 000 channels of scintillating PbWO4
crystals. Thus PHOS could be used as veto counter to select events with “abnormally”
low multiplicity.
The electromagnetic calorimeter (EMCAL) will be an ALICE upgrade. It will be
a medium-resolution scintillation sandwich calorimeter. While the EMCAL is primarily
for jet studies, the L0 EMCAL trigger could probably be adapted to UPC needs.
Additional studies are required.
The photon multiplicity detector (PMD) is a pre-shower detector that measures
the (η, φ) distribution of the photons in the region, 1.8 < η < 2.6. The PMD consists
of two identical planes of proportional honeycomb chambers with a 3 interaction length
thick lead converter in between the chambers.
Small angle detectors ALICE has a number of smaller detector systems (ZDC, FMD,
V0, and T0) positioned at small angles for triggering. Two ZDCs are located in
the accelerator tunnels 100 m away from the interaction point. Their pseudorapidity
acceptance is 8.6 < |η|. They measure the spectator nucleons (both neutrons and
protons) in the collision.
The other small detectors are located asymmetrically with respect to the interaction
point. The right-hand arrays are at negative rapidity while the left-hand detectors
are at positive rapidity. The forward multiplicity detector (FMD) is a silicon strip
ring counter with about 25000 channels. It measures charge particle production in the
pseudorapidity ranges −3.4 < η < −1.7 (right) and 1.7 < η < 5.1 (left). The T0 (beam-
beam) detector, 12 Cerenkov radiators coupled to photomultiplier tubes, is located at
2.9 < η < 3.3 (left) and −5.0 < η < −4.5 (right). It produces fast signals with good
timing resolution, σ ∼ 50 ps, allowing online reconstruction of the main vertex. The V0
detector, 72 plastic scintillators grouped in five rings, covers −3.8 < η < −1.7 (right)
206
and 2.8 < η < 5.1 (left). It provides a minimum bias trigger for the central detectors
and can be used for centrality determination in AA collisions and to validate the trigger
signal in the muon spectrometer in pp collisions.
Forward muon spectrometer The forward muon spectrometer, covering the backward
region −4.0 < η < −2.5 in the LHC reference frame, will study quarkonium decays
to dimuons. The expected mass resolution is ∼ 100 MeV at 10 GeV, sufficient to
distinguish between the Υ S states. The muon spectrometer consists of a composite
absorber with high-Z (small angles) and low-Z (near the front) materials, located 90
cm behind the interaction point; a large dipole magnet with a 3 T m field integral; 10
planes of thin, high-granularity tracking chambers with ∼ 100 µm spatial resolution; a
1.2 m iron muon filter; and four trigger chambers for the L0 trigger. The muon filter sits
between the tracking and trigger chambers to reduce the trigger chamber background.
Trigger and data acquisition The ALICE trigger is especially important because the
very large event size causes severe data acquisition and storage problems. ALICE
features a complex and flexible trigger. Several detectors provide input to the different
trigger levels to select signals such as centrality, high pT electrons, muons, or photons.
Several trigger levels are foreseen.
• Level-0 (L0): This is the fast, minimum-bias interaction trigger, issued after ∼ 0.8
µs, used as strobe for some electronics. It includes various decisions from the T0
and the muon spectrometer as well as from other auxiliary sub-detectors such as the
cosmic telescope. Recently, L0 triggers were developed for the ITS, PHOS and TOF
detectors. The T0 decision is used as a TRD pre-trigger for hadronic interactions.
• Level-1 (L1): This trigger, with a latency of ∼ 6.5 µs, receives additional
information from the ZDC, PHOS, TRD, FMD and PMD.
• Level-2 (L2): Relatively slow detector decisions are included with a delay of ∼ 88
µs so that it is possible to veto events where a second high multiplicity event occurs
just before or soon after the trigger of interest (TPC past-future protection).
• High Level Trigger (HLT): The HLT is an on-line computing farm with
several hundred commodity processors providing further event selection and event
compression.
Most UPC events are characterized by very low multiplicity. Unfortunately, the low
multiplicity background tends to be rather large. Therefore, L0 background suppression
is necessary. UPC events with nuclear dissociation can be selected by combining low
multiplicity with nuclear break-up using the ZDCs, greatly suppressing the background.
However, the ALICE ZDCs are located too far from the main detector to be used at
L0. Thus UPC events need to be triggered by the central barrel and/or the muon
spectrometer.
UPC events are normally rejected by the standard ALICE L0 trigger. However,
recent developments employing the ITS pixel trigger are quite encouraging. The trigger
207
could apply pT cuts to the L0 signal, rejecting the low pT background due to e+e− pair
production, σtot ∼ 200 kb [387], to study UPCs in the barrel. Detailed studies of this
option are underway. The EMCAL, currently under construction, will be used as an
additional dijet trigger.
The muon spectrometer trigger could be successfully used to detect UPCs with
final-state muons. The PHOS can be used to efficiently veto high multiplicity events at
L0, considerably reducing the UPC background for muon events.
The offline analysis, including ZDC information and reconstruction of the parent
particle pT distributions, could select events of interest. Further studies are presented
in section 6.3.
Barrel trigger strategies The ‘elastic’ and ‘inelastic’ UPC classes require different
triggers. The identification of exclusive vector meson production is based on
reconstruction of the entire event (the two tracks from the decay) and identifying
coherent production through the low lepton pair pT . On the other hand, γ-parton
interactions must be identified by a rapidity gap between the photon-emitting nucleus
and the produced particles.
The very different topology of ultraperipheral interactions relative to central
nucleus-nucleus collisions leads to different trigger requirements. In the case of hadronic
interactions, the forward detectors trigger large multiplicity events. This is not possible
for UPCs since they are characterized by voids of produced particles, rapidity gaps,
several units wide. To detect ultraperipheral events, it is necessary to have a low-level
trigger sensitive to the production of a few charged particles around midrapidity [318].
In ALICE, the fast response, large pseudorapidity coverage, |η| < 1, and high
segmentation, of the TOF make it well suited for a L0 trigger in the central region.
Since the T0 detectors are not used in UPCs, the fast OR TOF signal can be used as a
pre-trigger for the TRD. The pad signals from each of the 90 modules are included in
the TOF L0 trigger. They can provide information on event multiplicity and topology,
important for the development of a UPC trigger. Hits in several TOF pads are required
for the pre-trigger.
A possible trigger scheme for exclusive ρ0, J/ψ and Υ photoproduction is described
below.
• L0: The TOF L0 multiplicity coupled with a suitable topology cut can provide a
trigger for exclusive events with exactly two charged tracks in the central barrel.
The forward detectors are available at L0 and can identify the presence of one more
more rapidity gaps. For example, if only the V0 detectors (V0L, 2.8 < η < 5.1, and
V0R, −1.7 > η > 3.8) are available at L0, then if there is no signal in V0L but a
signal in V0R, there is a rapidity gap of at least −1.7 > η > 3.8. Thus the ALICE
trigger logic unit can carry the information on track multiplicity as well as rapidity
gap.
• L1: The main trigger cut for J/ψ → e+e− and Υ → e+e− decays at this level will
208
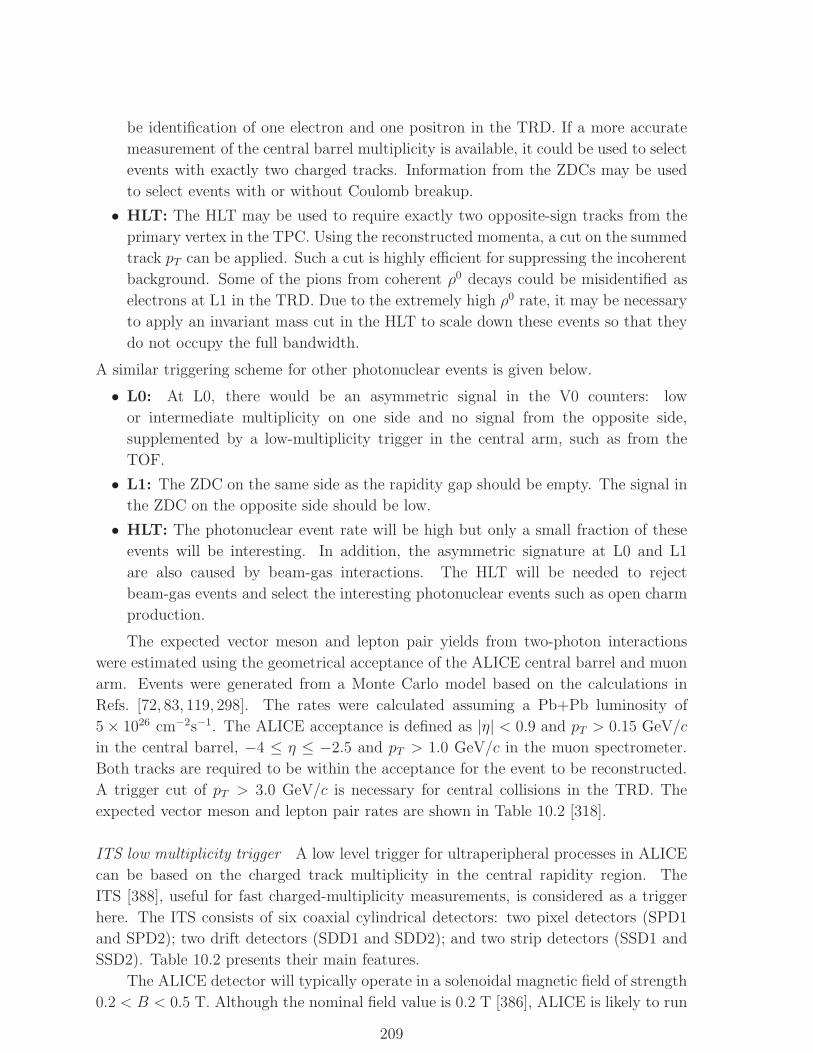
be identification of one electron and one positron in the TRD. If a more accurate
measurement of the central barrel multiplicity is available, it could be used to select
events with exactly two charged tracks. Information from the ZDCs may be used
to select events with or without Coulomb breakup.
• HLT: The HLT may be used to require exactly two opposite-sign tracks from the
primary vertex in the TPC. Using the reconstructed momenta, a cut on the summed
track pT can be applied. Such a cut is highly efficient for suppressing the incoherent
background. Some of the pions from coherent ρ0 decays could be misidentified as
electrons at L1 in the TRD. Due to the extremely high ρ0 rate, it may be necessary
to apply an invariant mass cut in the HLT to scale down these events so that they
do not occupy the full bandwidth.
A similar triggering scheme for other photonuclear events is given below.
• L0: At L0, there would be an asymmetric signal in the V0 counters: low
or intermediate multiplicity on one side and no signal from the opposite side,
supplemented by a low-multiplicity trigger in the central arm, such as from the
TOF.
• L1: The ZDC on the same side as the rapidity gap should be empty. The signal in
the ZDC on the opposite side should be low.
• HLT: The photonuclear event rate will be high but only a small fraction of these
events will be interesting. In addition, the asymmetric signature at L0 and L1
are also caused by beam-gas interactions. The HLT will be needed to reject
beam-gas events and select the interesting photonuclear events such as open charm
production.
The expected vector meson and lepton pair yields from two-photon interactions
were estimated using the geometrical acceptance of the ALICE central barrel and muon
arm. Events were generated from a Monte Carlo model based on the calculations in
Refs. [72, 83, 119, 298]. The rates were calculated assuming a Pb+Pb luminosity of
5 × 1026 cm−2s−1. The ALICE acceptance is defined as |η| < 0.9 and pT > 0.15 GeV/c
in the central barrel, −4 ≤ η ≤ −2.5 and pT > 1.0 GeV/c in the muon spectrometer.
Both tracks are required to be within the acceptance for the event to be reconstructed.
A trigger cut of pT > 3.0 GeV/c is necessary for central collisions in the TRD. The
expected vector meson and lepton pair rates are shown in Table 10.2 [318].
ITS low multiplicity trigger A low level trigger for ultraperipheral processes in ALICE
can be based on the charged track multiplicity in the central rapidity region. The
ITS [388], useful for fast charged-multiplicity measurements, is considered as a trigger
here. The ITS consists of six coaxial cylindrical detectors: two pixel detectors (SPD1
and SPD2); two drift detectors (SDD1 and SDD2); and two strip detectors (SSD1 and
SSD2). Table 10.2 presents their main features.
The ALICE detector will typically operate in a solenoidal magnetic field of strength
0.2 < B < 0.5 T. Although the nominal field value is 0.2 T [386], ALICE is likely to run
209
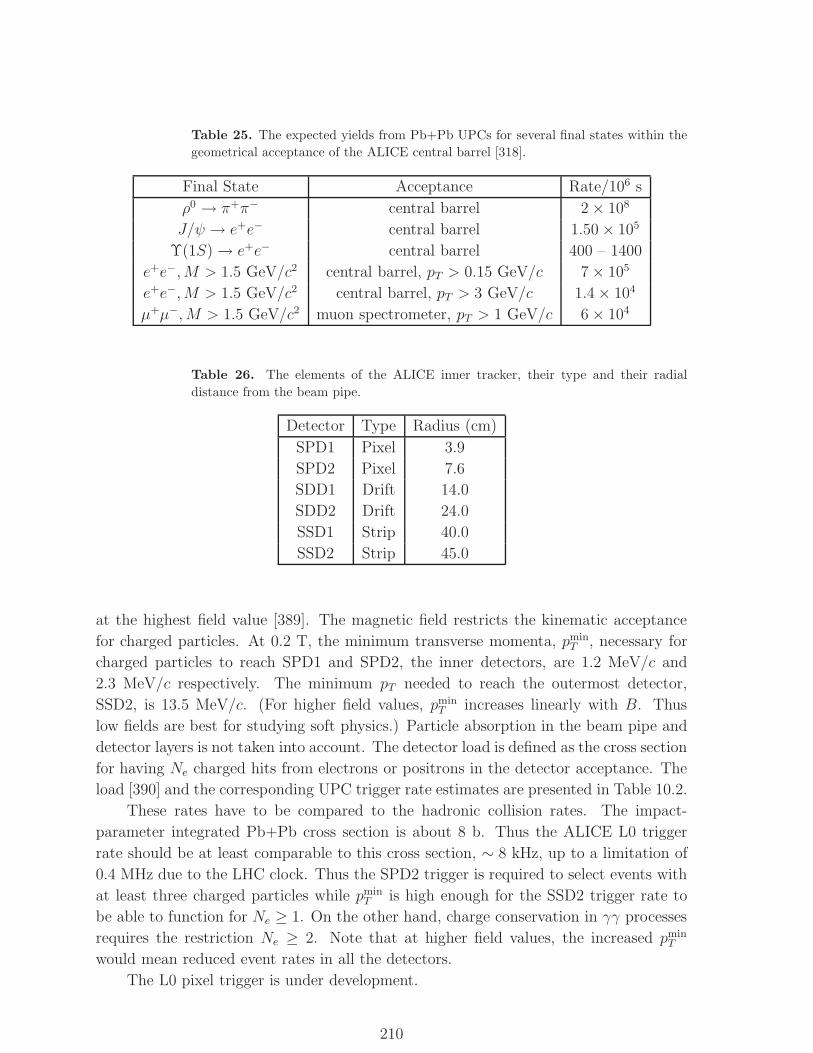
Table 25. The expected yields from Pb+Pb UPCs for several final states within the
geometrical acceptance of the ALICE central barrel [318].
Final State Acceptance Rate/106 s
ρ0 → π+π− central barrel 2 × 10⁸
J/ψ → e+e− central barrel 1.50 × 10⁵
Υ(1S) → e+e− central barrel 400 – 1400
e+e−,M > 1.5 GeV/c2 central barrel, pT > 0.15 GeV/c 7 × 10⁵
e+e−,M > 1.5 GeV/c2 central barrel, pT > 3 GeV/c 1.4 × 10⁴
µ+µ−,M > 1.5 GeV/c2 muon spectrometer, pT > 1 GeV/c 6 × 10⁴
Table 26. The elements of the ALICE inner tracker, their type and their radial
distance from the beam pipe.
Detector Type Radius (cm)
SPD1 Pixel 3.9
SPD2 Pixel 7.6
SDD1 Drift 14.0
SDD2 Drift 24.0
SSD1 Strip 40.0
SSD2 Strip 45.0
at the highest field value [389]. The magnetic field restricts the kinematic acceptance
for charged particles. At 0.2 T, the minimum transverse momenta, pminT , necessary for
charged particles to reach SPD1 and SPD2, the inner detectors, are 1.2 MeV/c and
2.3 MeV/c respectively. The minimum pT needed to reach the outermost detector,
SSD2, is 13.5 MeV/c. (For higher field values, pminT increases linearly with B. Thus
low fields are best for studying soft physics.) Particle absorption in the beam pipe and
detector layers is not taken into account. The detector load is defined as the cross section
for having Ne charged hits from electrons or positrons in the detector acceptance. The
load [390] and the corresponding UPC trigger rate estimates are presented in Table 10.2.
These rates have to be compared to the hadronic collision rates. The impact-
parameter integrated Pb+Pb cross section is about 8 b. Thus the ALICE L0 trigger
rate should be at least comparable to this cross section, ∼ 8 kHz, up to a limitation of
0.4 MHz due to the LHC clock. Thus the SPD2 trigger is required to select events with
at least three charged particles while pminT is high enough for the SSD2 trigger rate to
be able to function for Ne ≥ 1. On the other hand, charge conservation in γγ processes
requires the restriction Ne ≥ 2. Note that at higher field values, the increased pminT
would mean reduced event rates in all the detectors.
The L0 pixel trigger is under development.
210
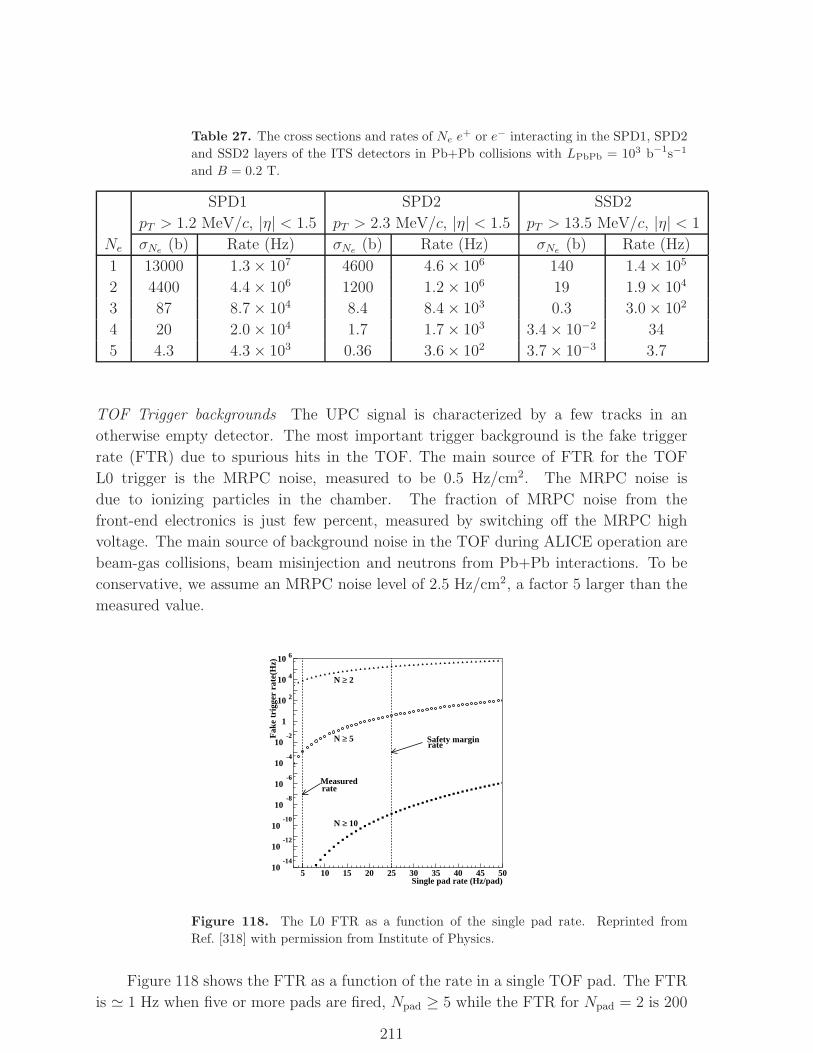
Table 27. The cross sections and rates of Ne e+ or e− interacting in the SPD1, SPD2
and SSD2 layers of the ITS detectors in Pb+Pb collisions with LPbPb = 103 b−1s−1
and B = 0.2 T.
SPD1 SPD2 SSD2
pT > 1.2 MeV/c, |η| < 1.5 pT > 2.3 MeV/c, |η| < 1.5 pT > 13.5 MeV/c, |η| < 1
Ne σNe (b) Rate (Hz) σNe (b) Rate (Hz) σNe (b) Rate (Hz)
1 13000 1.3 × 10⁷ 4600 4.6 × 10⁶ 140 1.4 × 10⁵
2 4400 4.4 × 10⁶ 1200 1.2 × 10⁶ 19 1.9 × 10⁴
3 87 8.7 × 10⁴ 8.4 8.4 × 10³ 0.3 3.0 × 10²
4 20 2.0 × 10⁴ 1.7 1.7 × 10³ 3.4 × 10⁻² 34
5 4.3 4.3 × 10³ 0.36 3.6 × 10² 3.7 × 10⁻³ 3.7
TOF Trigger backgrounds The UPC signal is characterized by a few tracks in an
otherwise empty detector. The most important trigger background is the fake trigger
rate (FTR) due to spurious hits in the TOF. The main source of FTR for the TOF
L0 trigger is the MRPC noise, measured to be 0.5 Hz/cm2. The MRPC noise is
due to ionizing particles in the chamber. The fraction of MRPC noise from the
front-end electronics is just few percent, measured by switching off the MRPC high
voltage. The main source of background noise in the TOF during ALICE operation are
beam-gas collisions, beam misinjection and neutrons from Pb+Pb interactions. To be
conservative, we assume an MRPC noise level of 2.5 Hz/cm2, a factor 5 larger than the
measured value.
10-14
10-12
10-10
10-8
10-6
10-4
10-2
1
10 2
10 4
10 6
5 10 15 20 25 30 35 40 45 50Single pad rate (Hz/pad)
Fak
e tr
igge
r ra
te(H
z)
N ≥ 2
N ≥ 5
N ≥ 10
Safety marginrate
Measuredrate
Figure 118. The L0 FTR as a function of the single pad rate. Reprinted from
Ref. [318] with permission from Institute of Physics.
Figure 118 shows the FTR as a function of the rate in a single TOF pad. The FTR
is ≃ 1 Hz when five or more pads are fired, Npad ≥ 5 while the FTR for Npad = 2 is 200
211
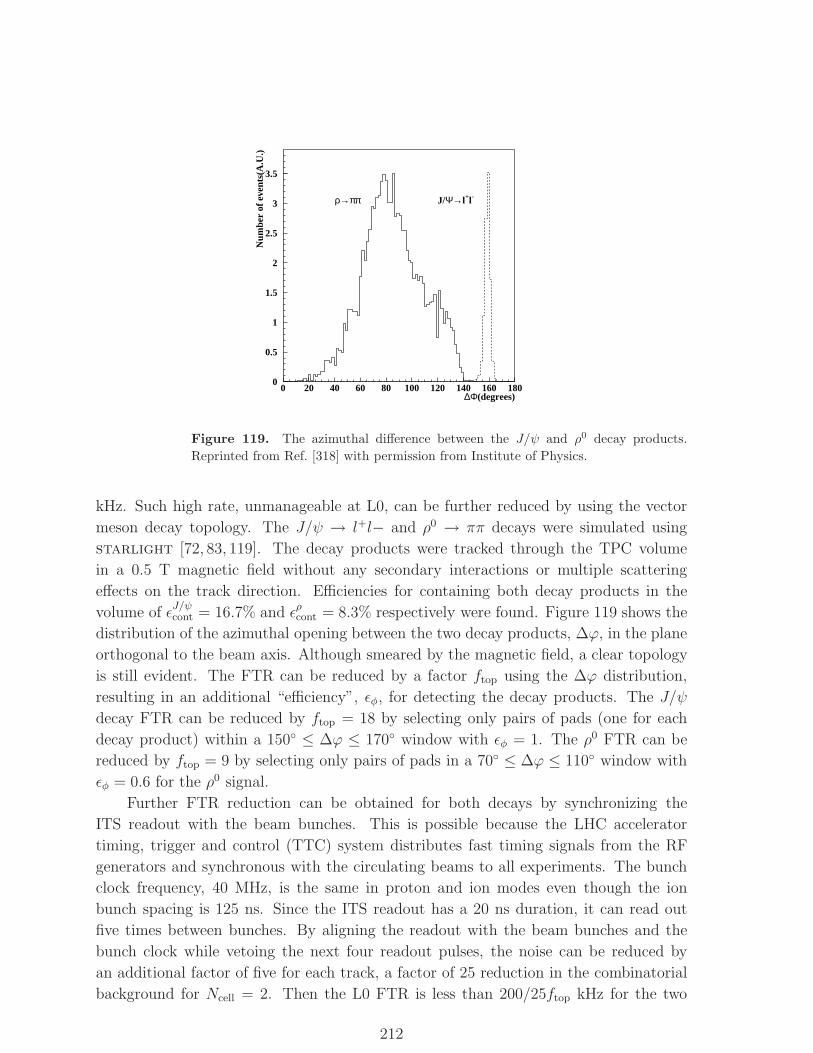
0
0.5
1
1.5
2
2.5
3
3.5
0 20 40 60 80 100 120 140 160 180∆Φ(degrees)
Num
ber
of e
vent
s(A
.U.)
J/Ψ→l+l-ρ→ππ
Figure 119. The azimuthal difference between the J/ψ and ρ0 decay products.
Reprinted from Ref. [318] with permission from Institute of Physics.
kHz. Such high rate, unmanageable at L0, can be further reduced by using the vector
meson decay topology. The J/ψ → l+l− and ρ0 → ππ decays were simulated using
starlight [72, 83, 119]. The decay products were tracked through the TPC volume
in a 0.5 T magnetic field without any secondary interactions or multiple scattering
effects on the track direction. Efficiencies for containing both decay products in the
volume of ǫJ/ψcont = 16.7% and ǫρcont = 8.3% respectively were found. Figure 119 shows the
distribution of the azimuthal opening between the two decay products, ∆ϕ, in the plane
orthogonal to the beam axis. Although smeared by the magnetic field, a clear topology
is still evident. The FTR can be reduced by a factor ftop using the ∆ϕ distribution,
resulting in an additional “efficiency”, ǫφ, for detecting the decay products. The J/ψ
decay FTR can be reduced by ftop = 18 by selecting only pairs of pads (one for each
decay product) within a 150◦ ≤ ∆ϕ ≤ 170◦ window with ǫφ = 1. The ρ0 FTR can be
reduced by ftop = 9 by selecting only pairs of pads in a 70◦ ≤ ∆ϕ ≤ 110◦ window with
ǫφ = 0.6 for the ρ0 signal.
Further FTR reduction can be obtained for both decays by synchronizing the
ITS readout with the beam bunches. This is possible because the LHC accelerator
timing, trigger and control (TTC) system distributes fast timing signals from the RF
generators and synchronous with the circulating beams to all experiments. The bunch
clock frequency, 40 MHz, is the same in proton and ion modes even though the ion
bunch spacing is 125 ns. Since the ITS readout has a 20 ns duration, it can read out
five times between bunches. By aligning the readout with the beam bunches and the
bunch clock while vetoing the next four readout pulses, the noise can be reduced by
an additional factor of five for each track, a factor of 25 reduction in the combinatorial
background for Ncell = 2. Then the L0 FTR is less than 200/25ftop kHz for the two
212
vector meson decays so that
J/ψ FTR < 440 Hz (180)
ρ0 FTR < 880 Hz . (181)
This L0 FTR should be compared to the J/ψ and ρ0 signal rates,
J/ψ Rate = LPbPbB(J/ψ → l+l−) σJ/ψ ǫJ/ψcont
= 0.5 mb−1 Hz × 0.12 × 32 mb × 0.167 = 0.32 Hz (182)
ρ0 Rate = LPbPb σρ ǫρcont ǫφ
= 0.5 mb−1 Hz × 5200 mb × 0.083 × 0.6 = 120 Hz . (183)
Note that the J/ψ → l+l− branching ratio in the J/ψ rate is the sum of the branching
ratios in the electron and muon decay channels.
Thus the TOF can tag vector meson decays at L0. Detailed studies of varies
ultraperipheral processes are underway.
TPC trigger backgrounds Experience from RHIC shows that coherent events can be
identified with good signal to background ratios when the entire event is reconstructed
and a cut is applied on the summed transverse momentum of the event. The incoherent
background can be estimated by reconstructing events with two same-sign tracks, e.g.
π+π+ or π−π− for ρ0 → π+π− [62]. The main heavy vector meson background will
most likely be lepton pairs produced in two-photon interactions. Since these pairs are
produced coherently, they are not rejected by a pair pT cut [72, 83, 119].
The following TPC background sources have been investigated: peripheral AA
interactions; incoherent γA interactions and cosmic ray muons. These same sources
were also considered in a STAR study [298].
The trigger contribution from cosmic ray muons was not negligible in STAR since
the scintillator counters used in the central trigger barrel surrounded the TPC and
covered a large area. Measurements from L3+Cosmics, which also used scintillators
surrounding a large volume (the L3 magnet), observed a cosmic ray muon rate five
times lower than that calculated for STAR because L3 is about 100 m underground. In
STAR, the cosmic ray trigger rate was reduced by a topology cut on the zenith angle.
If a silicon pixel detector is used for triggering, the area susceptible to cosmic ray muon
triggers is greatly reduced since at least one of the tracks will point to the vertex.
Peripheral AA interactions have been studied using 5000 events with 13 < b < 20
fm generated by FRITIOF 7.02 [391]. The inelastic Pb+Pb cross section for this range
is 2.1 b, corresponding to about 25% of the 8 b total inelastic cross section. Of these
5000 events, 435 (9%) had between one and five charged tracks in the TPC. A subset
of these, 97 events (2% of the original 5000) had two charged tracks in the TPC. The
cross section for exactly two charged tracks in the TPC is then 0.02 × 2.1 b = 40 mb,
an order of magnitude lower than the ρ0 photoproduction cross section. In addition,
the summed pT distribution for two charged tracks is peaked at higher values in the
background events than in the signal events.
213
Incoherent photonuclear interactions might be an important background at the
trigger level, and at the analysis level for inclusive events. Direct γ-parton interactions
are only a small fraction of the total γA cross section. The bulk of the vector meson
cross section can be described by generalized vector meson dominance, see Section 2.3.1.
Since the virtual photon energy spectrum has a peak much lower than the beam energy,
these interactions resemble interactions between the beam nucleus and a hadron nearly
at rest. However, these photonuclear events have a much broader pT distribution than
that of coherent ρ0 and J/ψ production.
The total photonuclear cross section can be calculated by integrating over the
virtual photon energy spectrum,
σtotγA = 2
∫ ∞
kmin
dkdNγ
dkσγA(k) . (184)
The factor of two arises because each nucleus can act as both photon emitter and target.
With a minimum photon energy cutoff of kmin = 10 GeV in the rest frame of the target
nucleus and assuming that σγPb(k) is independent of photon energy, σγPb = 15 mb [392],
σtotγA = 44 b. The DTUNUC 2.2 event generator [392] was used to simulate 50000 γPb
events. Of these, 1595 (3%) left one to five charged tracks in the TPC, a cross section
of 44 b × 0.03 = 1.4 b, larger than the peripheral AA cross section fulfilling the same
criteria.
Thus the TPC backgrounds appear to be under control and we conclude that ρ0
and J/ψ photoproduction can be triggered on without being swamped by background.
10.3. The ATLAS detector
Contributed by: S. N. White
The ATLAS detector is designed to study 14 TeV pp collisions. The physics
pursued by the collaboration is vast and includes Higgs boson and SUSY searches
and other scenarios beyond the Standard Model. To achieve these goals at a full
machine luminosity of 1034 cm−2s−1, the calorimeter is designed to be as hermetic as
possible and has extremely fine segmentation. The detector, shown in Fig. 120, is a
combination of three subsystems: the inner tracking system, the electromagnetic and
hadronic calorimeters and a full coverage muon detector. The inner tracker is composed
of a finely-segmented silicon pixel detector; a semiconductor tracker (SCT) and the
transition radiation tracker (TRT). The segmentation is optimized for pp collisions at
design luminosity.
The ATLAS calorimeters are divided into electromagnetic and hadronic sections
and cover |η| < 4.9. The EM calorimeter is an accordion liquid argon device, finely
segmented longitudinally (lines of constant η) and transversely (in φ) over |η| < 3.1.
The ATLAS electromagnetic calorimeter has three longitudinally-segmented
sections. The first is closest to the beam pipe while the third is furthest away. The
first longitudinally-segmented section has granularity ∆η × ∆φ = 0.003 × 0.1 in the
barrel and is slightly coarser in the endcaps. Note that ∆φ is larger in the first
214
longitudinally-segmented section because the showers spread more in φ here. The
second longitudinally-segmented section is composed of ∆η × ∆φ = 0.025 × 0.025 cells
while the last segmented section has ∆η × ∆φ = 0.05 × 0.05 cells. In addition, a
finely segmented, ∆η × ∆φ = 0.025 × 0.1, pre-sampler system is placed in front of
the electromagnetic calorimeter. The overall energy resolution of the electromagnetic
calorimeter is 10%/E1/2 + 0.5%. The calorimeter also has good pointing resolution,
60/E1/2 mrad, for photons and better than 200 ps timing resolution for showers with
E > 20 GeV.
The hadronic calorimeter is also segmented longitudinally and transversely. The
barrel calorimeter is a lead scintillator tile structure with a granularity of ∆η × ∆φ =
0.1 × 0.1. In the endcaps, liquid argon technology is used for radiation hardness.
The granularity in the endcaps is the same as in the barrel. The energy resolution
is 50%/E1/2 + 2% for pions.
The very forward region, up to |η| < 4.9, is covered by the Forward Calorimeter,
an axial-drift liquid argon calorimeter [393]. The ATLAS muon spectrometer is located
behind the calorimeters, shielded from hadronic showers. The spectrometer uses several
tracking devices and a toroidal magnet system. Most of the volume is covered by
monitored drift tubes. In the forward region, where the rate is high, cathode strip
chambers are used. The standalone muon momentum resolution is ∼ 2% for muons
with 10 < pT < 100 GeV/c. The performance of each subsystem is summarized in
Ref. [94].
10.4. The CMS detector
Contributed by: D. d’Enterria and P. Yepes
The CMS detector is designed to identify and precisely measure muons, electrons,
photons and jets over a large energy and rapidity range. A detailed description of
detector elements can be found in the Technical Design Reports [123, 394–397]. An
overall view of one quadrant of the detector is shown in Fig. 121. The central element of
CMS is the magnet, a 13 m long, 6 m diameter, high-field solenoid with an internal radius
of ∼ 3 m, providing a uniform 4 T magnetic field. The tracking system, electromagnetic,
and hadronic calorimeters are positioned inside the magnet, while the muon detector is
outside. The tracker covers the pseudorapidity region |η| < 2.4 while the electromagnetic
and hadronic calorimeters cover |η| < 3 and |η| < 5 respectively. The complete CMS
geometry is included in the detailed geant-4 based simulation package, CMSSW [123].
Tracker Starting from the beam axis, the tracker (|η| < 2.4) is composed of two
different types of detectors: pixel layers and silicon strip counters. The pixel detector
is composed of 3 barrel layers which are located at 4.5 cm, 7.5 cm and 10 cm from the
beam axis and 2 endcap disks in each of the forward and backward directions with a
possibility of a third set of disks to be added later. The barrel layers, covering rapidities
215
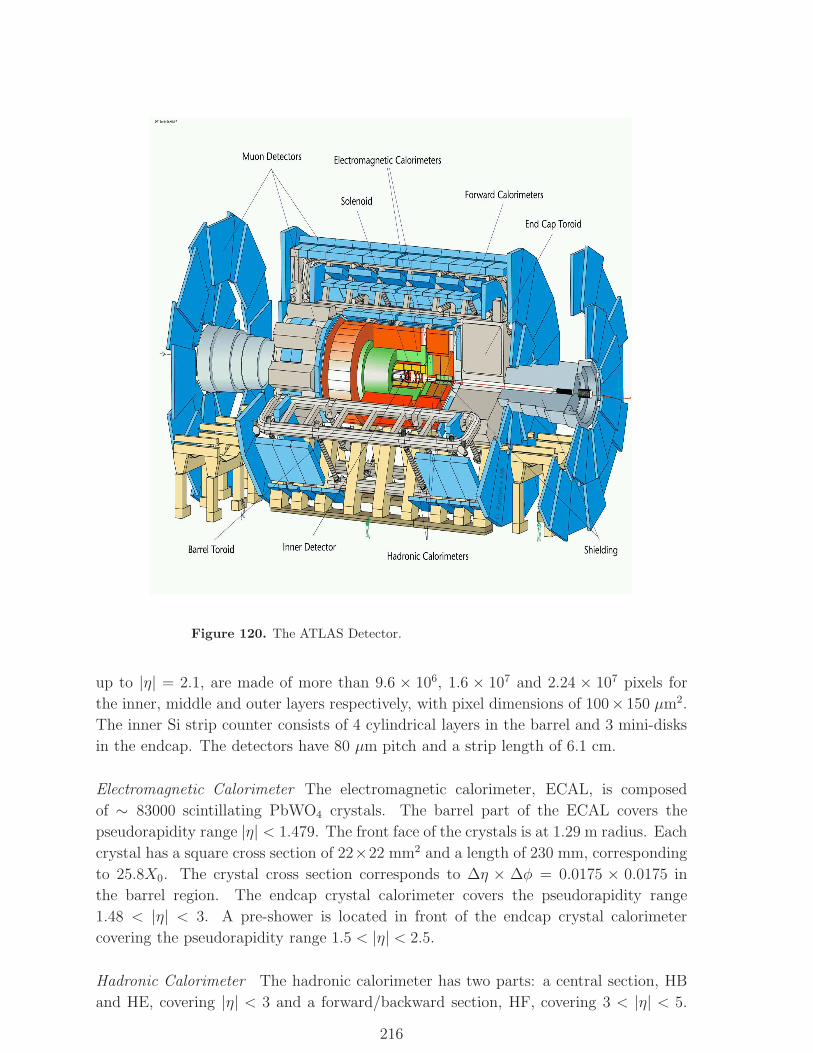
Figure 120. The ATLAS Detector.
up to |η| = 2.1, are made of more than 9.6 × 10⁶, 1.6 × 10⁷ and 2.24 × 107 pixels for
the inner, middle and outer layers respectively, with pixel dimensions of 100× 150 µm2.
The inner Si strip counter consists of 4 cylindrical layers in the barrel and 3 mini-disks
in the endcap. The detectors have 80 µm pitch and a strip length of 6.1 cm.
Electromagnetic Calorimeter The electromagnetic calorimeter, ECAL, is composed
of ∼ 83000 scintillating PbWO4 crystals. The barrel part of the ECAL covers the
pseudorapidity range |η| < 1.479. The front face of the crystals is at 1.29 m radius. Each
crystal has a square cross section of 22×22 mm2 and a length of 230 mm, corresponding
to 25.8X0. The crystal cross section corresponds to ∆η × ∆φ = 0.0175 × 0.0175 in
the barrel region. The endcap crystal calorimeter covers the pseudorapidity range
1.48 < |η| < 3. A pre-shower is located in front of the endcap crystal calorimeter
covering the pseudorapidity range 1.5 < |η| < 2.5.
Hadronic Calorimeter The hadronic calorimeter has two parts: a central section, HB
and HE, covering |η| < 3 and a forward/backward section, HF, covering 3 < |η| < 5.
216
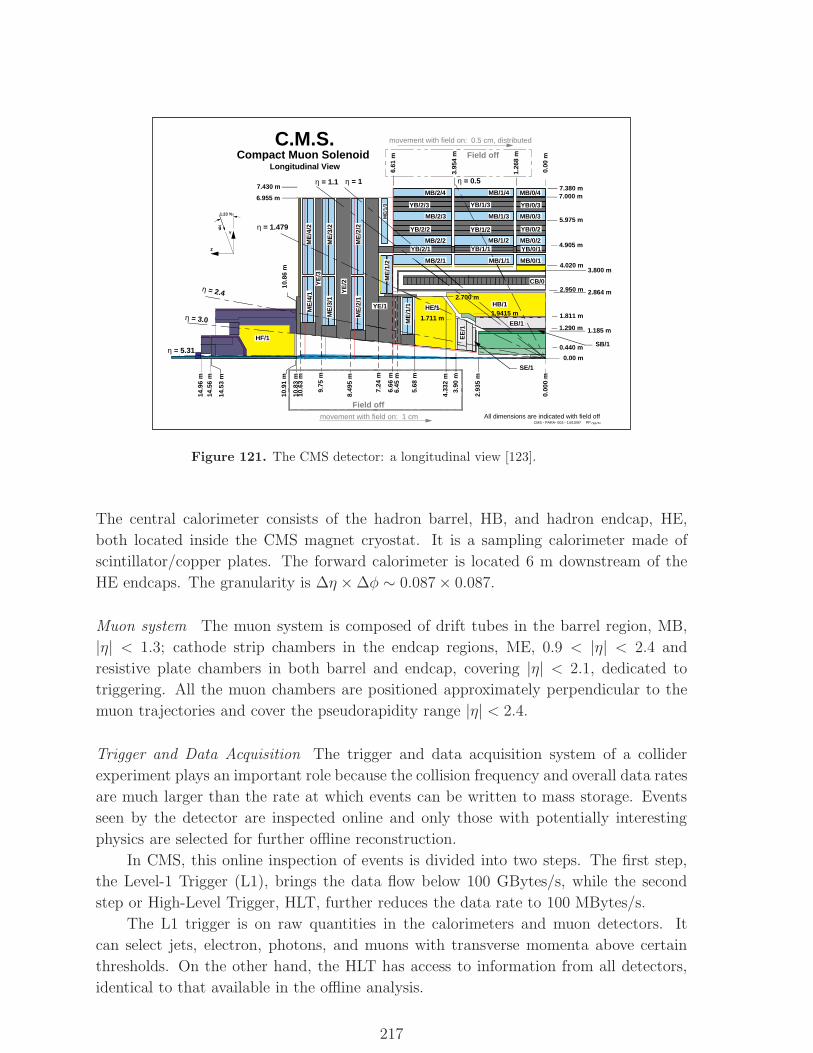
1.26
8 m
3.95
4 m
6.61
m
5.68
m
6.66
m
7.24
m
8.49
5 m
9.75
m
10.6
3 m
10.8
3 m
6.45
m
10.8
6 m
10.9
1 m
14.5
3 m
14.5
6 m
14.9
6 m
4.905 m
1.811 m
HF/1
ME
/1/3
YE/1
ME
/3/2
ME
/4/2
ME
/2/2
ME
/2/1
ME
/3/1
ME
/4/1
ME
/1/1 HE/1
EB/1
ME
/1/2
HB/1
YE
/3
YE
/2
EE
/1
CB/0
SE/1
SB/1
movement with field on: 0.5 cm, distributedC.M.S.Compact Muon Solenoid
Longitudinal View
CMS - PARA- 003 - 14/10/97 PP
Y
Z
1.23 %
g
η = 5.31
4.33
2 m
movement with field on: 1 cm
3.90
m
1.711 m1.9415 m
Field off
Field off
All dimensions are indicated with field off
0.00
m
η = 3.0
η = 2.4
η = 1.479
η = 1 η = 0.5η = 1.1
0.440 m
6.955 m
2.864 m2.700 m
3.800 m
7.380 m7.000 m
5.975 m
4.020 m
7.430 m
0.00 m
1.185 m1.290 m
0.00
0 m
2.93
5 m
2.950 m
MB/2/1
MB/2/2
MB/2/3
MB/2/4
YB/2/1
YB/2/2
YB/2/3
MB/1/1
MB/1/2
MB/1/3
MB/1/4
YB/1/1
YB/1/2
YB/1/3
MB/0/1
MB/0/2
MB/0/3
MB/0/4
YB/0/1
YB/0/2
YB/0/3
/pg/hr
Figure 121. The CMS detector: a longitudinal view [123].
The central calorimeter consists of the hadron barrel, HB, and hadron endcap, HE,
both located inside the CMS magnet cryostat. It is a sampling calorimeter made of
scintillator/copper plates. The forward calorimeter is located 6 m downstream of the
HE endcaps. The granularity is ∆η × ∆φ ∼ 0.087 × 0.087.
Muon system The muon system is composed of drift tubes in the barrel region, MB,
|η| < 1.3; cathode strip chambers in the endcap regions, ME, 0.9 < |η| < 2.4 and
resistive plate chambers in both barrel and endcap, covering |η| < 2.1, dedicated to
triggering. All the muon chambers are positioned approximately perpendicular to the
muon trajectories and cover the pseudorapidity range |η| < 2.4.
Trigger and Data Acquisition The trigger and data acquisition system of a collider
experiment plays an important role because the collision frequency and overall data rates
are much larger than the rate at which events can be written to mass storage. Events
seen by the detector are inspected online and only those with potentially interesting
physics are selected for further offline reconstruction.
In CMS, this online inspection of events is divided into two steps. The first step,
the Level-1 Trigger (L1), brings the data flow below 100 GBytes/s, while the second
step or High-Level Trigger, HLT, further reduces the data rate to 100 MBytes/s.
The L1 trigger is on raw quantities in the calorimeters and muon detectors. It
can select jets, electron, photons, and muons with transverse momenta above certain
thresholds. On the other hand, the HLT has access to information from all detectors,
identical to that available in the offline analysis.
217
Triggering in UPCs, characterized by very low particle multiplicities depositing a
relatively small amount of energy in the central part of the detector, is done by requiring
a neutron signal in one of the ZDCs in combination with at least one large rapidity gap
between the produced system and the beam rapidity. Such a trigger will select UPCs
with nuclear breakup. Even if the rates are high due to backgrounds, they can be
reduced in the HLT where the full event information is available for detailed analysis,
see Section 2.7.3.
11. Conclusions
Ultraperipheral collisions at the LHC can provide a new means of studying small x
physics, continuing along the road pioneered at HERA in the last decade. The rates
and collision energies for many inclusive and diffractive hard phenomena will be high
enough to extend the HERA studies to a factor of ten lower x and, for the first time,
explore hard phenomena at small x with nuclei in the same x range as the proton.
This larger reach in x will explore a kinematic range where nonlinear effects should be
much larger than at HERA and the leading-twist approximation should break down.
It would then be possible to test various theoretical predictions for the new high gluon
density QCD regime such as parton saturation and the physics of the black disk regime.
Except for measurements of the parton distributions, none of the information accessible
in UPCs will be available from the other studies at the LHC. UPC photons allow smaller
virtualities to be probed than hadronic collisions so that larger nonlinear effects on the
parton distributions could be measured at the same x. In addition, photons are cleaner
probes than hadrons, simplifying the interpretation of UPC data compared to parton-
parton interactions in hadron collisions.
UPC studies require good particle tracking over a large solid angle combined, for
many analyses, with good particle identification and selective triggers able to select few-
particle final states with specified topologies. All of the LHC detectors are well suited to
this task with large usable solid angles and various forms of particle identification. As
amply demonstrated at RHIC, triggering is a bigger challenge. However, the particle-
physics style, multi-level triggers seem up to this challenge. Triggers and analyses for
several key benchmark processes were presented here, showing that the detectors are
able to collect and analyze UPC events.
Acknowledgments
We thank C. Bertulani, D. Brandt, U. Dreyer, J. M. Jowett, V. Serbo, D. Trautmann and
C. Weiss for helpful discussions. This work was supported in part by the US Department
of Energy, Contract Numbers DE-AC02-05CH11231 (S. R. Klein and R. Vogt); W-
7405-Eng-48 (R. Vogt); DE-FG02-93ER40771 (M. Strikman); DE-AC02-98CH10886
(A. J. Baltz and S. N. White); and DE-FG03-93ER40772 (P. Yepes). The work of
R. Vogt was also supported in part by the National Science Foundation Grant NSF PHY-
218
0555660. D. d’Enterria acknowledges support by the 6th EU Framework Programme
contract MEIF-CT-2005-025073. V. Nikulin and M. Zhalov would like to express their
acknowledgment for support by CERN-INTAS grant no 05-103-7484 .
References
[1] Fermi E 1924 Nuovo Cimento 2 143, translated by Gallinaro M and White S N 2001, in
proceedings of the Workshop on Electromagnetic Probes of Fundamental Physics, Erice, Sicily,
2001 Preprint hep-th/0205086; Fermi E 1924 Z. Physik 29 315
[2] von Weizsacker C 1934 Z. Physik 88 612; Williams E J 1934 Phys. Rev. 45 729
[3] Baur G, Hencken K, Trautmann D, Sadovsky S and Kharlov Yu 2002 Phys. Rep. 364 359
[4] Bertulani C A and Baur G 1988 Phys. Rep. 163 299
[5] Khoze V A, Martin A D, and Ryskin M G 2002 Eur. Phys. J C 23 311
[6] Holt R et al. 2002 Preprint BNL-68933
[7] Deshpande A et al. 2005 Ann. Rev. Nucl. Part. Sci. 55 165
[8] Jackson J D 1975 Classical Electrodynamics 2nd Ed., John Wiley & Sons, New York
[9] Cahn R N and Jackson J D 1990 Phys. Rev. D 42 3690
[10] Baur G and Ferreira Filho L G 1990 Nucl. Phys. A 518 786
[11] Bruning et al 2004 Preprint CERN-2004-003-V1
[12] Jowett J M and Carli C 2006 EPAC06 550 Preprint CERN-LHC-PROJECT-REPORT-928
[13] Brandt D, Eggert K, and Morsch A 1994 Preprint CERN AT/94-05(DI)
[14] Ohnemus J, Walsh T F, and Zerwas P M 1994 Phys. Lett. B 328 369
[15] Drees M, J. Ellis J, and Zeppenfeld D 1989 Phys. Lett. B 223 454
[16] Krauss F, Greiner M and Soff G 1997 Prog. Nucl. Part. Phys. 39 503
[17] Bertulani C, Klein S R and Nystrand J 2005 Ann. Rev. Nucl. Part. Sci. 55 271
[18] Ageev A et al. 2002 J. Phys. G 28 R117
[19] Baur G et al 2002 Preprint hep-ex/0201034
[20] Marciano W and White S 2003 Electromagnetic Probes of Fundamental Physics World Scientific,
Singapore
[21] Butterworth J M and Wing M 2005 Rept. Prog. Phys. 68 2773
[22] Frankfurt L, Strikman M and Weiss C 2005 Ann. Rev. Nucl. Part. Sci. 55 403
[23] Brodsky S J, Frankfurt L, Gunion J F, Mueller A H and Strikman M 1994 Phys. Rev. D 50 3134
[24] Collins J C, Frankfurt L and Strikman M 1997 Phys. Rev. D 56 2982
[25] Blaettel B, Baym G, Frankfurt L and Strikman M 1993 Phys. Rev. Lett. 70 896
[26] Frankfurt L, Miller G A and Strikman M 1993 Phys. Lett. B 304 1
[27] Frankfurt L, Radyushkin A and Strikman M 1997 Phys. Rev. D 55 98
[28] Arneodo M, Bialas A, Krasny M W, Sloan T and Strikman M 1996 Preprint hep-ph/9610423
[29] Albrow M et al. [CMS and TOTEM Collaborations] 2006 Preprint CERN/LHCC 2006-039/G-124
[30] d’Enterria D 2007 Eur. Phys. J. A 31 816
[31] Strikman M, Vogt R and White S 2006 Phys. Rev. Lett. 96 082001
[32] Albrow A G et al. 2005 Preprint CERN-LHCC-2005-025, LHCC-I-015
[33] Frankfurt L, McDermott M F and Strikman M 1999 JHEP 9902 002
[34] Martin A D, Ryskin M G and Teubner T 1999 Phys. Lett. B 454 339
[35] Alexopoulos T et al. 2003 Preprint H1-04-03-609
[36] Jowett J M, Bruce R, Gilardoni S S, Drees A, Fischer W, Tepikian S and Klein S 2006 Preprint
CERN-AB-2006-046
[37] Beole S et al. [ALICE Collaboration], Preprint CERN-LHCC-98-19
[38] Aitala E M et al. [E791 Collaboration], 2001 Phys. Rev. Lett. 86 4773
[39] Sokoloff M D et al. 1986 Phys. Rev. Lett. 57 3003
[40] Frankfurt L and Strikman M 1999 Eur. Phys. J. A 5 293
219

[41] McLerran L D and Venugopalan R 1994 Phys. Rev. D 50 2225
[42] Mueller A H 1988 Nucl. Phys. B 307 34
[43] Kovchegov Y V 1997 Phys. Rev. D 55 5445
[44] Frankfurt L, Guzey V, McDermott M and Strikman M 2001 Phys. Rev. Lett. 87 192301
[45] Frankfurt L and Strikman M 1989 Phys. Rev. Lett. 63 1914; [Erratum ibid 1990 64 815]
[46] Ryskin M G 1993 Z. Phys. C 57 89
[47] Low F E 1975 Phys. Rev. D 12 163
[48] Frankfurt L, Koepf W and Strikman M 1996 Phys. Rev. D 54 3194; 1998 57 512
[49] Frankfurt L, Guzey V and Strikman M 2001 J. Phys. G 27 R23
[50] Radyushkin A V 2001 Preprint hep-ph/0101225
[51] Freund A and McDermott M 2002 Phys. Rev. D 65 074008 and references therein
[52] Gribov V N 1969 Sov. Phys. JETP 29 483 [Zh. Eksp. Tor. Fiz. 56 892]
[53] Gribov V N 1969 Sov. J. Nucl. Phys. 9 369; 1970 Sov. Phys. JETP 30 709
[54] Collins J C 1998 Phys. Rev. D 57 3051 [Erratum-ibid. 2000 D 61 019902]
[55] Adloff C et al. [H1 Collaboration] 2001 Eur. Phys. J. C 20 29
[56] Aktas A et al. [H1 Collaboration] 2006 Preprint hep-ex/0606004
[57] Aktas A et al. [H1 Collaboration] 2006 Preprint hep-ex/0606003
[58] Frankfurt L, Guzey V and Strikman M 2005 Phys. Rev. D 71 054001
[59] Feinberg E L and Pomeranchuk I 1956 Suppl. Nuovo Cimento III 562
[60] Frankfurt L, Guzey V and Strikman M 2003 Preprint hep-ph/0303022v1
[61] Frankfurt L and Strikman M 2002 Phys. Rev. D 66 031502
[62] Adler C et al. [STAR Collaboration] 2002 Phys. Rev. Lett. 89 272302
[63] d’Enterria D 2006 Preprint nucl-ex/0601001
[64] Gribov V N 1969 Zh. Eksp. Teor. Fiz. 57 1306
[65] Brodsky S J and Pumplin J 1969 Phys. Rev. 182 1794
[66] Donnachie A and Shaw G 1978 Electromagnetic Interactions Of Hadrons vol 2 (Plenum Press)
p 169
[67] Fraas H, Read B and Schildknecht D 1975 Nucl. Phys. B 86 346; Ditsas P and Shaw G 1976
Nucl. Phys. B 113 246
[68] Bauer T H, Spital R D, Yennie D R and Pipkin F M 1978 Rev. Mod. Phys. 50 261 [Erratum-ibid.
1979 51 407]
[69] Pautz A and Shaw G 1988 Phys. Rev. C 57 2648
[70] Frankfurt L, Strikman M and Zhalov M 2003 Acta Phys. Polon. B 34 3215
[71] Alvensleben H et al. 1970 Nucl. Phys. B 18 333; McClellan G et al. 1971 Phys. Rev. D 4 2683
[72] Klein S and Nystrand J 1999 Phys. Rev. C 60 014903
[73] Drell S and Trefil J S 1966 Phys. Rev. Lett. 16 552 [Erratum-ibid. 1966 16 832]
[74] Klein S R and Nystrand J 2004 Phys. Rev. Lett. 92 142003
[75] Klein SR and Nystrand J 2003 Preprint hep-ph/0310223
[76] Frankfurt L, Strikman M and Zhalov M 2002 Phys. Lett. B 537 51
[77] Frankfurt L, Strikman M and Zhalov M 2003 Phys. Rev. C 67 034901
[78] Klein S R and Nystrand J 2000 Phys. Rev. Lett. 84 2330
[79] Ryskin M G, Roberts R G, Martin A D and Levin E M 1997 Z. Phys. C 76 231
[80] Frankfurt L, Guzey V, Strikman M and Zhalov M 2003 JHEP 0308 043
[81] Frankfurt L, Strikman M and Zhalov M 2002 Phys. Lett. B 540 220
[82] Drees M and Zeppenfeld D 1989 Phys. Rev. D 39 2536
[83] Baltz A J, Klein S R and Nystrand J 2002 Phys. Rev. Lett. 89 012301
[84] Baur G, Hencken K, Aste A, Trautmann D and Klein S R 2003 Nucl. Phys. A 729 787
[85] White S N 2005 AIP Conf. Proc. 792 527, Preprint nucl-ex/0507023
[86] Baltz A J, Rhoades-Brown M J and Weneser J 1996 Phys. Rev. E 54 4233
[87] Veyssiere A et al. 1970 Nucl. Phys. A 159 561
[88] Baltz A J, Chasman C and White S N 1998 Nucl. Instrum. Meth. A 417 1
220
[89] Hencken K, Baur G and Trautmann D 2006 Phys. Rev. Lett. 96 012303
[90] Klein S R [STAR Collaboration] 2004 Preprint nucl-ex/0402007
[91] Klein S R [STAR Collaboration] 2003 Preprint nucl-ex/0310020
[92] Klein S R and Nystrand J 2003 Phys. Lett. A 308 323
[93] Frankfurt L, Strikman M and Zhalov M Preprint hep-ph/0612072
[94] Individual Detector TDRs can be found at http://atlasinfo.cern.ch/ATLAS/internal/tdr.html
[95] Strikman M, Tverswkoy M and Zhalov M 2005 Phys. Lett. B 626 72
[96] Aktas A et al [H1 Collaboration] 2006 Eur. Phys. J. C 48 715; 749; Preprint hep-ex/0610076
[97] Nikulin V and Zhalov M 2003 Preprint ALICE-INT-2003-043
[98] Rogers T, Guzey V, Strikman M and Zu X 2004 Phys. Rev. D 69 074011
[99] Donnachie S, Dosch G, Nachtmann O and Landshoff P 2002 Camb. Monogr. Part. Phys. Nucl.
Phys. Cosmol. 19 1
[100] Dersch U et al. [SELEX Collaboration] 2000 Nucl. Phys. B 579 277
[101] Lipkin H 1975 Phys. Rev. D 11 1827
[102] Donnachie A and Landshoff P V 2000 Phys. Lett. B 478 146
[103] Olsson J 2006 Preprint hep-ex/0610077
[104] Derrick M et al. [ZEUS Collaboration] 1995 Z. Phys. C 69 39
[105] Strikman M, Tverskoy M G and Zhalov M B 1999 Phys. Lett. B 459 37
[106] Adams M R et al. [E665 Collaboration] 1995 Phys. Rev. Lett. 74 5198 [Erratum-ibid. 1998 80
2020]
[107] Frankfurt L, Gerland L, Strikman M and Zhalov M 2003 Phys. Rev. C 68 044602
[108] Vidovic M, Greiner M and Soff G 1993 Phys. Rev. C 48 2011
[109] Pshenichnov I A, Bondorf J P, Mishustin I N, Ventura A and Masetti S 2001 Phys. Rev. C 64
024903
[110] Chiu M, Denisov A, Garcia E, Katzy J and White S 2002 Phys. Rev. Lett. 89 012302
[111] Golubeva M B et al. 2005 Phys. Rev. C 71 024905
[112] Pshenichnov I 2003 Preprint nucl-th/0306016
[113] Pshenichnov I A, Bondorf J P, Kurepin A B, Mishustin I N, Ventura A 2002 Preprint ALICE-
INT-2002-07
[114] http://agenda.cern.ch/fullAgenda.php?ida=a021989
[115] ALICE Collaboration 1999 Preprint CERN LHCC 99-22, ALICE TDR 5; 2000 Preprint CERN
LHCC 2000-046, Addendum 1 to ALICE TDR 5
[116] AliRoot http://www1.cern.ch/ALICE/Projects/offline/aliroot/Welcome.html
[117] Aktas A et al. [H1 Collaboration] 2006 Phys. Lett. B 638 422
[118] Frankfurt L, Strikman M and Zhalov 2006 Phys. Lett. B 640 162
[119] Nystrand J 2005 Nucl. Phys. A 752 470c
[120] Adams J et al. [STAR Collaboration] 2004 Phys. Rev. C 70 031902
[121] Vogt R 2003 Heavy Ion Phys. 18 11
[122] Grachov O A et al. 2006 Preprint nucl-ex/0608052
[123] CMS Collaboration 2006 “CMS Physics Technical Design Report: Detector performance and
software” Preprint CERN-LHCC-2006-001
[124] Goncalves V P and Machado M V T 2006 Preprint hep-ph/0601131
[125] d’Enterria D 2004 J. Phys. G 30 S767
[126] Bocian D and Piotrzkowski K 2004 Acta Phys. Polon. B 35 2417
[127] Krasny M W, Chwastowski J and Slowikowski K 2006 Preprint hep-ex/0610052
[128] Yao W M et al. [Particle Data Group] 2006 J. Phys. G 33 1
[129] Adler S S et al. [PHENIX Collaboration] 2003 Phys. Rev. Lett. 91 072301
[130] Sjostrand T 1994 Computer Phys. Commun. 82 74
[131] Ballintijn M, Loizides C and Roland G Preprint CMS AN-2006/099
[132] d’Enterria D and Hees A 2006 Preprint CMS AN-2006/107
[133] d’Enterria D 2007 Preprint hep-ex/0703024
221
[134] Piotrzkowski K 2001 Phys. Rev. D 63 071502
[135] Good M and Walker W 1960 Phys. Rev. D 120 1857
[136] Frankfurt L, Miller G A and Strikman M 1993 Phys. Rev. Lett. 71 2859
[137] Kaidalov A B, Khoze V A, Martin A D and Ryskin M G 2003 Acta Phys. Polon. B 34 3163
[138] Abramovski V A, Gribov V N and Kancheli O V 1973 Yad. Fiz. 18 595
[139] Frankfurt L and Strikman M 1996 Phys. Lett. B 382 6
[140] Frankfurt L, Guzey V and Strikman M 2004 Phys. Lett. B 586 41
[141] Klein S R, Nystrand J and Vogt R 2002 Phys. Rev. C 66 044906
[142] Derrick M et al. [ZEUS Collaboration] 1995 Phys. Lett. B 356 129
[143] Frankfurt L and Strikman M 1996 Proc. Workshop on Future Physics at HERA (Hamburg) 949
Preprint hep-ph/9609456
[144] Brodsky S J and Gillespie J 1968 Phys. Rev. 173 1011
[145] Diehl M 1995 Z. Phys. C 66 181
[146] Goulianos K [CDF Collaboration] 2002 Acta Phys. Polon. B 33 3467
[147] Frankfurt L and Strikman M 2006 Preprint nucl-th/0603049
[148] Bjorken J D 1992 Phys. Rev. D 47 101
[149] Mueller A H and Tang W K 1992 Phys. Lett. B 284 123
[150] Del Duca V and Tang W K 1993 Phys. Lett. B 312 225
[151] Abe F et al. [CDF Collaboration] 1998 Phys. Rev. Lett. 81 5278
[152] Abramowicz H, Frankfurt L and Strikman M 1994 Proc. SLAC Summer Inst. p 539; 1997 Surv.
High Energy Phys. 11 51
[153] Forshaw J R and Ryskin M G 1995 Z. Phys. C 68 137
[154] Bartels J et al. 1996 Phys. Lett. B 375 301
[155] Derrick M et al. [ZEUS Collaboration] 1996 Phys. Lett. B 369 55
[156] Adloff C et al. [H1 Collaboration] 2002 Eur. Phys. J. C 24 517
[157] Chekanov S et al. [ZEUS Collaboration] 2003 Eur. Phys. J. C 26 389
[158] Aktas A et al. [H1 Collaboration] 2003 Phys. Lett. B 568 205
[159] Kuraev E A, Lipatov L N, and Fadin V S 1976 Sov. Phys. JETP 44 443; 1977 45 199; Balitsky
I I and Lipatov L N 1978 Sov. J. Nucl. Phys. 28 822
[160] Lipatov L N 1989 private communication
[161] Colferai D 2000 Preprint hep-ph/0008309
[162] Salam G P 2005 Preprint hep-ph/0501097
[163] Pumplin J, Stump D R, Huston J, Lai H L, Nadolsky P and Tung W K 2002 JHEP 0207 012
[164] Erhan S and Schlein P E 2000 Phys. Lett. B 481 177
[165] Levy A 2005 Nucl. Phys. Proc. Suppl. 146 92
[166] Ashman J et al. [EMC Collaboration] 1991 Z. Phys. C 52 1
[167] Mandelstam S 1963 Nuovo Cim. 30 1148
[168] Gribov V N 2003 The Theory of Complex Angular Momenta: Gribov Lectures on Theoretical
Physics (Cambridge: Cambridge Univ. Press)
[169] Bartels J, Lipatov L and Vacca G 2005 Nucl. Phys. B 706 391
[170] Blok B and Frankfurt L 2006 Preprint hep-ph/0611062
[171] Blaettel B, Baym G, Frankfurt L L, Heiselberg H and Strikman M 1993 Phys. Rev. D 47 2761
[172] Klein S R and Nystrand J 2000 Phys. Rev. Lett. 84 2330
[173] Witten E 1997 Nucl. Phys. B 120 189
[174] Sjostrand T, Storrow J K and Vogt A 1996 J. Phys. G 22 893
[175] Frixione S, Nason P and Ridolfi G 1995 Nucl. Phys. B 454 3
[176] Fritzsch H and Streng K H 1978 Phys. Lett. B 72 385
[177] Klein S R, Nystrand J and Vogt R 2001 Eur. Phys. J. C 21 563
[178] Emel’yanov V, Khodinov A, Klein S R and Vogt R 1997 Phys. Rev. C 56 2726
[179] Emel’yanov V, Khodinov A, Klein S R and Vogt R 1998 Phys. Rev. Lett. 81 1801
[180] Emel’yanov V, A. Khodinov, Klein S R and Vogt R 1999 Phys. Rev. C 59 1860
222
[181] Emel’yanov V, Khodinov A, Klein S R and Vogt R 2000 Phys. Rev. C 61 044904
[182] Vogt R 2001 Phys. Rev. C 64 044901
[183] Martin A D, Roberts R G, Stirling W J and Thorne R S 1998 Phys. Lett. B 443 301
[184] Eskola K J, Kolhinen V J and Ruuskanen P V 1998 Nucl. Phys. B 535 351
[185] Eskola K J, Kolhinen V J and Salgado C A 1999 Eur. Phys. J. C 9 61
[186] Gluck M, Reya E and Vogt A 1992 Z. Phys. C 53 127
[187] Lai H L et al. 2000 Eur. Phys. J. C 12 375
[188] Gluck M, Reya E and Vogt A 1992 Phys. Rev. D 46 1973
[189] Gluck M, Reya E and Vogt A 1992 Phys. Rev. D 45 3986
[190] Drees M and Grassie K 1985 Z. Phys. C 28 451
[191] Abramowicz H, Charchula K and Levy A 1991 Phys. Lett. B 269 458
[192] Hagiwara K, Tanaka M, Watanabe I and Izubuchi T 1995 Phys. Rev. D 51 3197
[193] Schuler G A and Sjostrand T 1995 Z. Phys. C 68 607
[194] Schuler G A and Sjostrand T 1996 Phys. Lett. B 376 193
[195] Plothow-Besch H 2000 Preprint W5051 PDFLIB, 2000.04.17, CERN-ETT/TT
[196] Bartel W et al. [JADE Collaboration] 1984 Z. Phys. C 24 231
[197] Jones L M and Wyld H W 1978 Phys. Rev. D 17 759
[198] Smith J and van Neerven W L 1992 Nucl. Phys. B 374 36
[199] Brock R et al. [CTEQ Collaboration] 1995 Rev. Mod. Phys. 67 157
[200] Vogt R 2003 Heavy Ion Phys. 17 75
[201] Breitweg J et al. [ZEUS Collaboration] 1998 Eur. Phys. J. C 2 247
[202] Adler C et al. [STAR Collaboration] 2003 Phys. Rev. Lett. 90 082302
[203] Chiu M et al. [PHENIX Collaboration] 2003 Nucl. Phys. A 715 761
[204] Blyth S L et al. 2007 J. Phys. G 34 271
[205] Eskola K J and Wang X N 1995 Int. J. Mod. Phys. A 10 3071
[206] Eskola K J, Kajantie K and Lindfors J 1989 Nucl. Phys. B 323 37
[207] Eskola K J and Kajantie K 1997 Z. Phys. C 75 515
[208] Field R D 1989 Applications Of Perturbative QCD (Redwood City: Addison-Wesley)
[209] Kniehl B A, Kramer G and Potter B 2000 Nucl. Phys. B 582 514
[210] Kniehl B A, Kramer G and Potter B 2001 Nucl. Phys. B 597 337
[211] Zhang X F, Fai G I and Levai P 2002 Phys. Rev. Lett. 89 272301
[212] Gyulassy M, Levai P and Vitev I 2002 Phys. Lett. B 538 282
[213] Vitev I, Gyulassy M and Levai P 2003 Heavy Ion Phys. 17 237
[214] Owens J F 1987 Rev. Mod. Phys. 59 465
[215] Trzcinska A, Jastrzebski J, Lubinski P, Hartmann F J, Schmidt R von Egidy T and Klos B 2001
Phys. Rev. Lett. 87 082501
[216] Frankfurt L, Strikman M and Zhalov M 2005 Phys. Lett. B 616 59
[217] Weigert H 2007 Nucl. Phys. A 783 165; McLerran L 2006 Int. J. Mod. Phys. A 21 694
[218] Frankfurt L, Strikman M and Weiss C 2004 Phys. Rev. D 69 114010
[219] Ciafaloni M 2005 Nucl. Phys. Proc. Suppl. 146 129
[220] Arsene I et al. [BRAHMS Collaboration] 2004 Phys. Rev. Lett. 93 242303
[221] Kuraev E A, Lipatov L N and Fadin V S 1977 Sov. Phys. JETP 45 199
[222] Balitsky I and Lipatov L N 1978 Sov. J. Nucl. Phys. 28 822
[223] Gribov L V, Levin E M and Ryskin M G 1983 Phys. Rept. 100 1
[224] Mueller A H 1999 Nucl. Phys. B 558 285
[225] Mueller A H and Qiu J-W 1986 Nucl. Phys. B 268 427
[226] Blaizot J-P and Mueller A H 1987 Nucl. Phys. B 289 847
[227] Mueller A H 2003 Nucl. Phys. A 715 20
[228] McLerran L D and Venugopalan R 1994 Phys. Rev. D 49 2233
[229] McLerran L D and Venugopalan R 1994 Phys. Rev. D 49 3352
[230] Jalilian-Marian J, Kovner A, Leonidov A and Weigert H 1997 Nucl. Phys. B 504 415
223
[231] Jalilian-Marian J, Kovner A, Leonidov A and Weigert H 1999 Phys. Rev. D 59 014014
[232] Balitsky I 1996 Nucl. Phys. B 463 99
[233] Kovchegov Yu V 1996 Phys. Rev. D 54 5463
[234] Kovchegov Yu V 2000 Phys. Rev. D 61 074018
[235] Jalilian-Marian J, Kovner A, McLerran L D and Weigert H 1997 Phys. Rev. D 55 5414
[236] Iancu E, Leonidov A and McLerran L D 2001 Nucl. Phys. A 692 583
[237] Iancu E, Leonidov A and McLerran L D 2001 Phys. Lett. B 510 133
[238] Weigert H 2002 Nucl. Phys. A 703 823
[239] Ferreiro E, Iancu E, Leonidov A and McLerran L D 2002 Nucl. Phys. A 703 489
[240] Iancu E, Itakura K and McLerran L D 2003 Nucl. Phys. A 724 181
[241] Gelis F and Peshier A 2002 Nucl. Phys. A 697 879
[242] Goncalves V P and Machado M V T 2006 Preprint hep-ph/0601131
[243] Gelis F and Jalilian-Marian J 2003 Phys. Rev. D 67 074019
[244] Golec-Biernat K and Wusthoff M 1999 Phys. Rev. D 59 014017
[245] Golec-Biernat K and Wusthoff M 1999 Phys. Rev. D 60 114023
[246] Bartels J, Golec-Biernat K and Kowalski H 2002 Phys. Rev. D 66 014001
[247] Iancu E, Itakura K and Munier S 2003 Preprint hep-ph/0310338
[248] Gotsman E, Levin E, Lublinsky M and Maor U 2003 Eur. Phys. J. C 27 411
[249] Mueller A H 1998 Eur. Phys. J. A 1 19
[250] Gelis F and Peshier A 2002 Nucl. Phys. A 707 175
[251] Goncalves V P and Machado M V T 2003 Eur. Phys. J. C 30 387
[252] Goncalves V P and Machado M V T 2003 Eur. Phys. J. C 31 371
[253] Baur G et al. 1996 Phys. Lett. B 368 251
[254] Abulencia A et al. [CDF Collaboration] 2007 Phys. Rev. Lett. 98 112001
[255] Belkacem C et al. 1997 Phys. Rev. A 56 2806
[256] Vane C R et al. 1992 Phys. Rev. Lett. 69 1911
[257] Vane C R et al. 1994 Phys. Rev. A 50 2313
[258] Brandt D 2000 Preprint LHC-Project-Report 450
[259] Klein S R 2001 Nucl. Instrum. Meth. A 459 51
[260] Jowett J M, Jeanneret J B and Schindl K 2003 PAC 03 Portland, OR, USA p 1682 Preprint
LHC-Project-Report 642
[261] Jowett J M, Bruce R and Gilardoni S 2005 PAC 05 Knoxville, TN, USA p 1306
[262] Meier H et al. 2001 Phys. Rev. A 63 032713
[263] Agger C and Sorensen A H 1997 Phys. Rev. A 55 402
[264] Grafstrom P et al. 1999 PAC 99
[265] Krause F et al. 1998 Phys. Rev. Lett. 80 1190
[266] Fatyga M, Rhoades-Brown M J and Tannenbaum M J 1990 Preprint BNL-52247
[267] Landau L D and Lifschitz E M 1934 Phys. Z. Sowjetunion 6 244
[268] Racah G 1937 Nuovo Cimento 14 93
[269] Bottcher C and Strayer M R 1989 Phys. Rev. D 39 1330
[270] Hencken K, Trautmann D, and Baur G 1999 Phys. Rev. C 59 841
[271] Alscher A, Hencken K, Trautmann D and Baur G 1997 Phys. Rev. A 55 396
[272] Rumrich K, Momberger K, Soff G, Greiner W, Grun N and Scheid W 1991 Phys. Rev. Lett. 66
2613
[273] Momberger K, Grun N, and Scheid W 1991 Z. Phys. D 18 133
[274] Rumrich K, Soff G and Greiner W 1993 Phys. Rev. A 47 215
[275] Thiel J, Hoffstadt J, Grun N, and Scheid Q 1995 Z. Phys. D 34 21
[276] Baltz A J, Rhoades-Brown M J, and Weneser J 1996 Phys. Rev. A 50 4842
[277] Baur G 1990 Phys. Rev. A 42 5736
[278] Best C, Greiner W and Soff G 1992 Phys. Rev. A 46 261
[279] Hencken K, Trautmann D and Baur G 1995 Phys. Rev. A 51 998
224
[280] Baltz A J, Gelis F, McLerran L D and Peshier A 2001 Nucl. Phys. A 695 395
[281] Aste A, Baur G, Hencken K, Trautmann D and Scharf G 2002 Eur. Phys. J. C 23 545
[282] Baltz A J 1997 Phys. Rev. Lett. 78 1231
[283] Segev B and Wells J C 1998 Phys. Rev. A 57 1849
[284] Baltz A J and McLerran L D 1998 Phys. Rev. C 58 1679
[285] Segev B and Wells J C 1999 Phys. Rev. C 59 2753
[286] Vane C R, Datz S, Deveney D F, Dittner P F, Krause H F, Schuch R, Gao H, and Hutton R
1997 Phys. Rev A 56 3682
[287] Bethe H A and Maximon L C 1954 Phys. Rev. 93 768
[288] Davies H, Bethe H A and Maximon L C 1954 Phys. Rev. 93 788
[289] Ivanov D Y, Schiller A, and Serbo V G 1999 Phys. Lett. B 454 155
[290] Lee R N and Milstein A I 2000 Phys. Rev. A 61 032103
[291] Lee R N and Milstein A I 2001 Phys. Rev. A 64 032106
[292] Baltz A J 2005 Phys. Rev. C 71 024901 [Erratum-ibid. C 71 039901]
[293] Hencken K, Baur G and Trautmann D 2004 Phys. Rev. C 69 054902
[294] Hencken K, Kuraev E A and Serbo V G 2006 Acta Phys. Polon. B 37 969
[295] Hencken K, Kuraev E A and Serbo V G 2006 Phys. Rev. C 75 034903
[296] Baur G, Hencken K, and D. Trautmann 1998 J. Phys. G 24 1657
[297] Hencken K et al. 1996 Preprint IHEP-96-38
[298] Nystrand J and Klein S [STAR Collaboration] 1998 Preprint nucl-ex/9811007
[299] Vidovic M, Greiner M and Soff G 1995 J. Phys. G 21 545
[300] Baur U, Zeppenfeld D 1989 Nucl. Phys. B 325 253
[301] Diener K P, Schwanenberger C and Spira M 2002 Eur. Phys. J. C 25 405
[302] Baltz A et al. 2007 Preprint hep-ph/0702212
[303] Hencken K, Kharlov Yu and Sadovsky S 2002 Preprint ALICE-INT-2002-27
[304] Dellacasa G et al. 2000 Preprint CERN/LHCC 2000-001
[305] Dellacasa G et al. 1999 Preprint CERN/LHCC 99-4
[306] Grigoriev V et al 2001 Preprint ALICE-INT-2001-38
[307] Schuler G and Sjostrand T 1977 Z. Phys. C 73 677
[308] Acciarri M et al. [L3 collaboration] 2001 Phys. Lett. B 519 33
[309] Morsch A 2001 Preprint ALICE-INT-2001-10
[310] Barklow T 1990 Preprint SLAC-PUB-5364
[311] Shamov A G and Telnov V I, talk by Maslennikov A 1998 Proceedings of the Lund Workshop on
Photon Interactions and Photon Structure, Lund, Sweden
[312] Budnev V M et al. 1972 Phys. Lett. B 39 526
[313] Abdallah J et al. [DELPHI Collaboration] 2003 Eur. Phys. J. C 31 481
[314] Nakazawa H et al. [BELLE Collaboration] 2005 Phys. Lett. B 615 39
[315] Dobbs S et al. [CLEO Collaboration] 2006 Phys. Rev. D 73 071101
[316] Kwong W et al. 1988 Phys. Rev. D 37 3210
[317] Bodwin G T et al. 1995 Nucl. Phys. 42 306
[318] Alessandro B et al. [ALICE Collaboration] 2006 J. Phys. G 32 1295
[319] Adler SS et al. [PHENIX Collaboration] 2003 Phys. Rev. Lett. 91 241803
[320] Adler C, Strobele H, Denisov A, Garcia E, Murray M and White S 2001 Nucl. Inst. Meth. A 461
337
[321] ALICE Collaboration 1999 Preprint ALICE TDR3, CERN/LHCC 99-5
[322] Oppedisano C 2002 Preprint ALICE-INT-2002-08.
[323] Korotkikh V L and Chikin K A 2002 Eur. Phys. J. A 14 199
[324] Kharlov Yu V and Korotkikh V L 2004 Eur. Phys. J. A 21 437
[325] Anchordoqui L A, Beacom J F, Goldberg H, Palomares-Ruiz S and Weiler T J 2007 Phys. Rev.
Lett. 98 121101
[326] Heckman H H and Lindstrom P J 1976 Phys. Rev. Lett. 37 56
225
[327] Olson D L, Berman B L, Greiner D E, Heckman H H, Lindstrom P J, Westfall G D and Crawford H
J 1981 Phys. Rev. C 24 1529
[328] Scheidenberger C et al. 2002 Phys. Rev. Lett. 88 042301
[329] Hill J C, Petridis A, Fadem B and Wohn F K 1999 Nucl. Phys. A 661 313
[330] Aumann T, Bertulani C A and Summerer K 1995 Phys. Rev. C 51 416
[331] Benesh C J, Cook B C and Vary J P 1989 Phys. Rev. C 40 1198
[332] Grunschloss A et al. 1999 Phys. Rev. C 60 051601
[333] Hufner J, Schafer K and Schurmann B 1975 Phys. Rev. C 12 1888
[334] Emling H 1994 Prog. Part. Nucl. Phys. 33 729
[335] Aumann T, Bortignon P F, Emling H 1998 Ann. Rev. Nucl. Part. Sci. 48 351
[336] de Passos E J, Hussein M S, Canto L F and Carlson B V 2002 Phys. Rev. C 65 034326
[337] Dekhissi H et al. 2000 Nucl. Phys. A 662 207
[338] Young P G, Arthur E D, Chadwick M B 1998 Nuclear Reaction Data and Nuclear Reactors, ed
A Gandini and G Reffo, vol i (World Scientific, Singapore) p 227
[339] Assmann R W, Braun H H, Ferrari A, Jeanneret J B, Jowett J M and Pshenichnov I A 2004
Preprint LHC-Project-Report-766
[340] Jowett J M, Braun H H, Gresham M I, Mahner E, Nicholson A N, Shaposhnikova E and
Pshenichnov I A 2004 Preprint LHC-Project-Report-772
[341] For an extensive theoretical review of hard photoproduction, see e.g. Klasen M 2002 Rev. Mod.
Phys. 74 1221
[342] Kessler P 1975 Acta Phys. Austr. 41 141
[343] Albino S, Klasen M and Soldner-Rembold S 2002 Phys. Rev. Lett. 89 122004
[344] Cacciari M and Salam G 2006 Phys. Lett. B 641 57
[345] Chekanov S et al. [ZEUS Collaboration] 2003 Phys. Lett. B 560 7
[346] Adloff C et al. [H1 Collaboration] 2002 Eur. Phys. J C 25 13
[347] Chekanov S et al. [ZEUS Collaboration] 2004 Proceedings of the 32nd International Conference
on High-Energy Physics, vol. 2, http://www.ihep.ac.cn/data/ichep04/c paper/6-0249.pdf
[348] Klasen M and Kramer G 2004 Eur. Phys. J. C 38 93
[349] Klasen M and Kramer G 2006 Preprint hep-ph/0608235
[350] Klasen M and Kramer G 2004 Phys. Rev. Lett. 93 232002
[351] Kaidalov A, Khoze V, Martin A and Ryskin M 2003 Phys. Lett. B 567 61
[352] Klasen M and Kramer G 2005 J. Phys. G 31 1391
[353] Chekanov S et al. [ZEUS Collaboration] 2004 Proceedings of the 32nd International Conference
on High-Energy Physics, vol. 2, http://www.ihep.ac.cn/data/ichep04/c paper/11-0333.pdf
[354] Cacciari M, Frixione S and Nason P (2001) JHEP 0103 6
[355] Kniehl B, Kramer G, Schienbein I and Spiesberger H 2005 Phys. Rev. D 71 014018
[356] Adloff C et al. [H1 Collaboration] 2002 Eur. Phys. J C 25 25
[357] Klasen M, Kniehl B, Mihaila L and Steinhauser M 2002 Phys. Rev. Lett. 89 032001
[358] Frixione S 1998 Phys. Lett. B 429 369
[359] Aktas A et al. [H1 Collaboration] 2005 Eur. Phys. J C 38 437
[360] Harrison M, Ludlam T and Ozaki S 2003 Nucl. Instrum. Meth. A 499 235
[361] http://www.agsrhichome.bnl.gov/AP/RHIC2004
[362] Ackermann K H et al. 1999 Nucl. Phys. A 61 681c
[363] Wieman H et al. 1997 IEEE Trans. Nucl. Sci. 44 671
[364] Ackermann K H et al. 2003 Nucl. Instrum. Meth. A 499 624
[365] Adler C et al. 2001 Nucl. Instrum. Meth. A 470 488
[366] Surrow B [STAR Collaboration], Preprint hep-ex/0205090.
[367] Bieser F S et al. 2003 Nucl. Instrum. Meth. A 499 766
[368] Morozov V 2003 Ph.D. Thesis UC Berkeley
[369] Baur G and Ferreira Filho L G 1991 Phys. Lett. B 254 30
[370] Budnev V M, Ginzburg I F, Meledin G V and Serbo V G 1974 Phys. Rept. 15 181
226

[371] Vidovic M, Greiner M, Best C and Soff G 1993 Phys. Rev. C 47 2308
[372] Meissner F and Morozov V B [STAR Collaboration] 2004 Nucl. Phys. B Proc. Suppl. 126 59
[373] Soding P 1966 Phys. Lett. 19 702
[374] Groom D E et al. 2000 Eur. Phys. J C 15 1
[375] Ross M and Stodolsky L 1966 Phys. Rev. 149 1172
[376] Klein S 2005 AIP Conf. Proc. 792 532, Preprint nucl-ex/0506013
[377] Alvensleben H et al. 1970 Phys. Rev. Lett. 24 792
[378] Timoshenko S 2005 Preprint nucl-ex/0501010
[379] Armstrong T A et al. 1998 Nucl. Instr. Meth. A 406 227
[380] Klein S and Vogt R 2003 Phys. Rev. C 68 017902
[381] Glauber R J 1955 Phys. Rev. 99 1515
[382] Adler S S et al.[PHENIX Collaboration] 2006 Phys. Rev. Lett. 96 012304
[383] Adler S S et al [PHENIX Collaboration] 2003 Phys. Rev. Lett. 91 072303
[384] Sikler F [CMS Collaboration] 2007 Preprint physics/0702193
[385] CMS Collaboration 2007 “CMS Physics TDR: High Density QCD with Heavy-Ions”, Preprint
CERN-LHCC-2007-009, CMS TDR 8.2-Add1, to appear in J. Phys. G
[386] Carminati F et al. [ALICE Collaboration] 2004 J. Phys. G 30 1517
[387] Alscher A, Hencken K, Trautmann D and Baur G 1997 Phys. Rev. A 55 396
[388] Dellacasa G et al. 1999 Preprint CERN/LHCC 99-12
[389] Dellacasa G et al. [ALICE Collaboration] 2000 Prerpint CERN-OPEN-2000-183
[390] Hencken K, Kharlov Y, Sadovsky S. 2002 Preprint ALICE-INT-2002-11
[391] Pi H 1992 Comput. Phys. Commun. 71 173
[392] Engel R, Ranft J and Roesler S 1997 Phys. Rev. D 55 6957
[393] ATLAS Collaboration 1999 Preprint CERN/LHCC 99-14.
[394] CMS Collaboration 1997 Preprint CERN/LHCC 97-31
[395] CMS Collaboration 1997 Preprint CERN/LHCC 97-32
[396] CMS Collaboration 1997 Preprint CERN/LHCC 97-33
[397] CMS Collaboration 1998 Preprint CERN/LHCC 98-6
227
Related Documents