Food and Applied Bioscience Journal, 2020, 8(3): 48-57 © 2020 Agro-Industry, Chiang Mai University 48 The physical, chemical and sensory properties of original and low sodium soy sauces Nana Manosubsak and Yaowapa Lorjaroenphon* Abstract Soy sauce is a popular worldwide condiment, especially in Asia. It, however, contains a high content of sodium which leads to an increase in the risks of hypertension and cardiovascular disease. Nowadays, low sodium soy sauce is commercially available for health−conscious consumers; nevertheless, it is not completely substituting the original one. The objective of this study was to compare the physical, chemical and sensory properties between original and low sodium soy sauces of Japanese and Thai condiments. The results elucidated that low sodium Thai soy sauce had the highest L* value than others (P≤0.05), while a* and b* were not significantly different among all samples. The lightness value was in accordance with the protein content of soy sauce. The total nitrogen content of low sodium Thai soy sauce was about three times lower than other samples. Low sodium Japanese soy sauce was also lower in protein content than its original recipe (P≤0.05). The flavor profiles of all samples were assessed by descriptive analysis (n = 15) and there were 17 attributes including seven aromas by nose (alcohol, brothy, molasses, beany, malty, fermented, briny), five tastes (salty, umami, sour, sweet, bitter) and five aromas by mouth (brown sugar, autolyzed, beany, briny, fermented). Among all flavor characters, the sourness intensity of low sodium Japanese soy sauce was higher than that of other sauces (P≤0.05). Moreover, the acceptability of four samples was evaluated by a 9−point hedonic test (n = 50). The low sodium Japanese soy sauce was rated lower liking scores in terms of overall, color and aroma (P≤0.05). Just About Right test additionally indicated that at least 60% of consumers perceived too much salty in original Japanese and Thai soy sauces, while the highest percentage frequency distribution of low sodium soy sauces was found to be just right. The manufacturer could use the physical, chemical, and sensory properties information of this study to develop premium quality soy sauce which increases purchase intent. It will be the solution to fulfill consumers’ expectations that the alternative condiment is not only healthy but also scrumptious. Keywords: Flavor, taste, sodium, soy sauce, salt Department of Food Science and Technology, Faculty of Agro−Industry, Kasetsart University, Bangkok, 10900, Thailand. *Corresponding author E−mail: [email protected] Received: 27 February 2020, Accepted: 3 September 2020

Welcome message from author
This document is posted to help you gain knowledge. Please leave a comment to let me know what you think about it! Share it to your friends and learn new things together.
Transcript
Food and Applied Bioscience Journal, 2020, 8(3): 48-57
© 2020 Agro-Industry, Chiang Mai University
48
The physical, chemical and sensory properties of original and low sodium soy sauces Nana Manosubsak and Yaowapa Lorjaroenphon*
Abstract Soy sauce is a popular worldwide condiment, especially in Asia. It, however, contains a high content of sodium which leads to an increase in the risks of hypertension and cardiovascular disease. Nowadays, low sodium soy sauce is commercially available for health−conscious consumers; nevertheless, it is not completely substituting the original one. The objective of this study was to compare the physical, chemical and sensory properties between original and low sodium soy sauces of Japanese and Thai condiments. The results elucidated that low sodium Thai soy sauce had the highest L* value than others (P≤0.05), while a* and b* were not significantly different among all samples. The lightness value was in accordance with the protein content of soy sauce. The total nitrogen content of low sodium Thai soy sauce was about three times lower than other samples. Low sodium Japanese soy sauce was also lower in protein content than its original recipe (P≤0.05). The flavor profiles of all samples were assessed by descriptive analysis (n = 15) and there were 17 attributes including seven aromas by nose (alcohol, brothy, molasses, beany, malty, fermented, briny), five tastes (salty, umami, sour, sweet, bitter) and five aromas by mouth (brown sugar, autolyzed, beany, briny, fermented). Among all flavor characters, the sourness intensity of low sodium Japanese soy sauce was higher than that of other sauces (P≤0.05). Moreover, the acceptability of four samples was evaluated by a 9−point hedonic test (n = 50). The low sodium Japanese soy sauce was rated lower liking scores in terms of overall, color and aroma (P≤0.05). Just About Right test additionally indicated that at least 60% of consumers perceived too much salty in original Japanese and Thai soy sauces, while the highest percentage frequency distribution of low sodium soy sauces was found to be just right. The manufacturer could use the physical, chemical, and sensory properties information of this study to develop premium quality soy sauce which increases purchase intent. It will be the solution to fulfill consumers’ expectations that the alternative condiment is not only healthy but also scrumptious. Keywords: Flavor, taste, sodium, soy sauce, salt
Department of Food Science and Technology, Faculty of Agro−Industry, Kasetsart University, Bangkok, 10900, Thailand. *Corresponding author E−mail: [email protected] Received: 27 February 2020, Accepted: 3 September 2020
Food and Applied Bioscience Journal, 2020, 8(3): 48-57
© 2020 Agro-Industry, Chiang Mai University
49
1. Introduction Soy sauce is one of the most important condiments in the world. It makes lots of food
palatable because of strong umami and salty tastes. Its aroma which contributed by sotolon and methional (Kaneko et al., 2012) is also an appetizing attribute for consumers. Japanese soy sauce is made from soybean and wheat in an equal ratio, while Chinese soy sauce is made from the only soybean. The process of soy sauce is divided into three main steps including fermentation (koji), brining (moromi) and refining. The manufacturer adds sodium chloride (NaCl) in the moromi step until it reaches 16-18% in final products. Thus, soy sauce is classified into high sodium condiments (Tan et al., 2016). Unfortunately, a lot of sodium intake could increase the risk of hypertension and cardiovascular disease. Therefore, the World Health Organization (WHO) has recommended less than five grams of NaCl or two grams of sodium intake per day in adults (Massilia et al., 2019). Food industries realize the importance of salt reduction and have developed low sodium soy sauce which contains 9−13% of NaCl or about 40% reduction. Although potassium chloride (KCl) is used to partially replace NaCl either in commercial or in lab−scale soy sauce production, replacing more than 10% of KCl causes bitter taste (Segawa et al., 2014). Besides, all consumers consider that fish sauce made with 40% of KCl is unacceptable because of the bitterness (Sanceda et al., 2003). The Kikkoman patent recommends adding γ−aminobutyric acid (GABA) in low sodium Japanese soy sauce as a bitterness masking agent (Yamakoshi et al., 2008). The patent also invents the electrodialysis technique to remove NaCl from soy sauce. This method, however, has some limitations such as high cost, difficult maintenance and loss of some nutrients (e.g. amino acids, peptides, alcohols) (Fidaleo et al., 2012). Lack of those components may change the soy sauce flavor profile which affects consumer acceptability. The flavor profile of soy sauce consists of aroma, taste and flavor attributes such as ethanol note, roasted soybean note, umami, saltiness, pungent and pickle (Jeong et al., 2004; Imamura, 2016). However, the flavor profile of soy sauce is changed accordingly to various kinds of food carrier (Cherdchu and Chambers, 2014). Not only flavor profile, but also color and protein content are considered as a premium quality index by one of the world’s leading soy sauce company (Kikkoman Sales USA, Inc., 2012). Therefore, this study aimed to compare physical, chemical and sensory properties between original and low sodium soy sauces. The results of this study including color value, protein as total nitrogen content, flavor profile, and consumer acceptability could improve the quality of low sodium soy sauce to be a superior choice for the health−conscious consumer.
Food and Applied Bioscience Journal, 2020, 8(3): 48-57
© 2020 Agro-Industry, Chiang Mai University
50
2. Materials and Methods 2.1 Food samples and chemicals
The original Japanese and Thai soy sauces which contain high sodium content (HJ and HT, respectively), low sodium Japanese (LJ) and low sodium Thai (LT) soy sauces as well as food and/or pharmaceutical references of the sensory evaluation were purchased from the local supermarket in Bangkok, Thailand. Boric acid, bromocresol green indicator, copper sulfate and potassium sulfate were obtained from Ajax (Amsterdam, Netherlands). The other chemical compounds (analytical grade) were methyl red indicator (Panreac; Barcelona, Spain), sulfuric acid (Lab Scan; Bangkok, Thailand), hydrochloric acid (Merck; New York; USA) and sodium hydroxide pellets (Fisher; Loughborough, UK). All chemical compounds are analytical grade. 2.2 Color measurement
Soy sauce color was analyzed by colorimeter (Hunter Lab Color Space; Tsuen Wan, Hong Kong) with L*a*b* (CIELAB) system in 10 mm cuvette. 2.3 Protein analysis
Total nitrogen was determined by Kjeldahl methods (Association of Analytical Chemists (AOAC), 2000). The Percentage of nitrogen was multiplied by factor 6.25 to obtain protein content. 2.4 Sensory evaluation
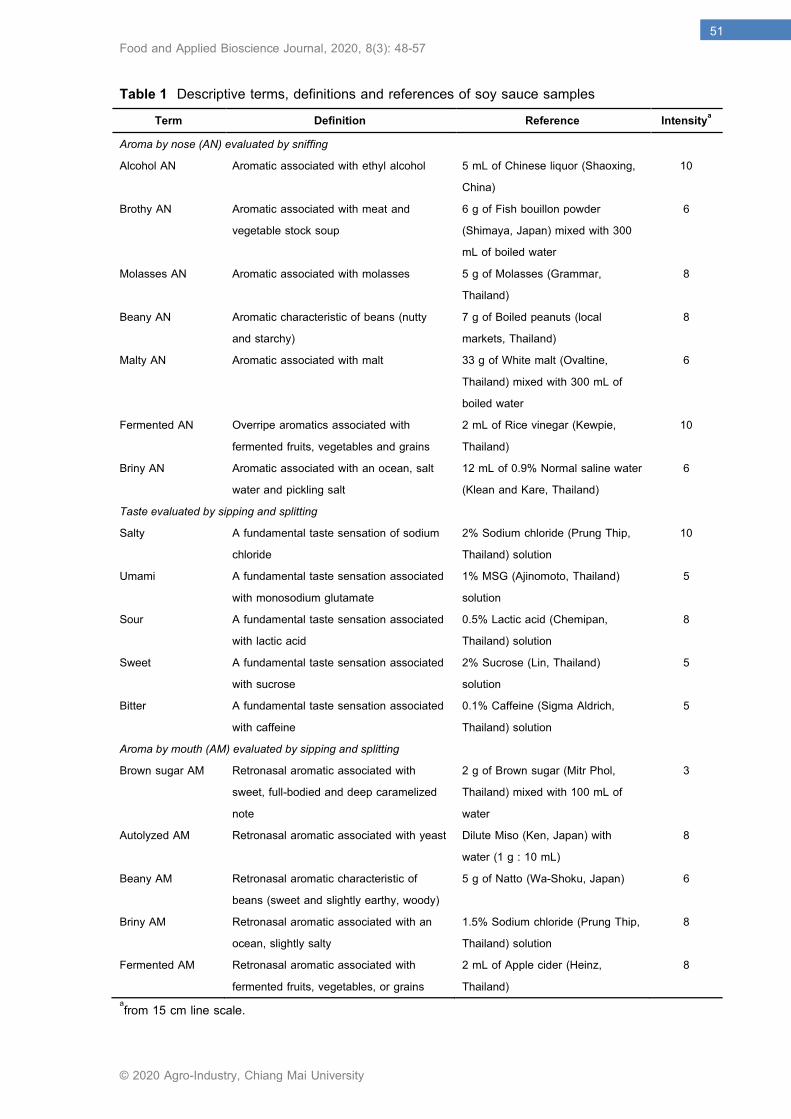
The panel for descriptive analysis and consumer tests were screened from the volunteer who was willing to participate in the sensory test, healthy, and non−allergenic to any foods. In addition, they consumed soy sauce at least three times a week. Descriptive analysis was evaluated by 15 panelists (food science students, 25-30 years, 13 females and 2 males) who were selected and trained according to the literature (Meilgaard et al., 2007). They developed flavor terms including aromas by nose, aromas by mouth and tastes as well as the definition and the references (Table 1). The intensity of reference was rated by using 15 cm line scale (0 = none, 15 = extreme). The panelist evaluated the soy sauce samples after practicing for one month. Five milliliters of the sample were prepared in 1−oz. white plastic cup and labeled with random three−digit code. Soy sauce sample was monadic served with balance serving order to the panel in an individual booth. The flavor profile was illustrated as a radar chart.
Food and Applied Bioscience Journal, 2020, 8(3): 48-57
© 2020 Agro-Industry, Chiang Mai University
51
Table 1 Descriptive terms, definitions and references of soy sauce samples Term Definition Reference Intensitya
Aroma by nose (AN) evaluated by sniffing Alcohol AN Aromatic associated with ethyl alcohol 5 mL of Chinese liquor (Shaoxing,
China) 10
Brothy AN Aromatic associated with meat and vegetable stock soup
6 g of Fish bouillon powder (Shimaya, Japan) mixed with 300 mL of boiled water
6
Molasses AN Aromatic associated with molasses 5 g of Molasses (Grammar, Thailand)
8
Beany AN Aromatic characteristic of beans (nutty and starchy)
7 g of Boiled peanuts (local markets, Thailand)
8
Malty AN Aromatic associated with malt 33 g of White malt (Ovaltine, Thailand) mixed with 300 mL of boiled water
6
Fermented AN Overripe aromatics associated with fermented fruits, vegetables and grains
2 mL of Rice vinegar (Kewpie, Thailand)
10
Briny AN Aromatic associated with an ocean, salt water and pickling salt
12 mL of 0.9% Normal saline water (Klean and Kare, Thailand)
6
Taste evaluated by sipping and splitting Salty A fundamental taste sensation of sodium
chloride 2% Sodium chloride (Prung Thip, Thailand) solution
10
Umami A fundamental taste sensation associated with monosodium glutamate
1% MSG (Ajinomoto, Thailand) solution
5
Sour A fundamental taste sensation associated with lactic acid
0.5% Lactic acid (Chemipan, Thailand) solution
8
Sweet A fundamental taste sensation associated with sucrose
2% Sucrose (Lin, Thailand) solution
5
Bitter A fundamental taste sensation associated with caffeine
0.1% Caffeine (Sigma Aldrich, Thailand) solution
5
Aroma by mouth (AM) evaluated by sipping and splitting Brown sugar AM Retronasal aromatic associated with
sweet, full-bodied and deep caramelized note
2 g of Brown sugar (Mitr Phol, Thailand) mixed with 100 mL of water
3
Autolyzed AM Retronasal aromatic associated with yeast Dilute Miso (Ken, Japan) with water (1 g : 10 mL)
8
Beany AM Retronasal aromatic characteristic of beans (sweet and slightly earthy, woody)
5 g of Natto (Wa-Shoku, Japan) 6
Briny AM Retronasal aromatic associated with an ocean, slightly salty
1.5% Sodium chloride (Prung Thip, Thailand) solution
8
Fermented AM Retronasal aromatic associated with fermented fruits, vegetables, or grains
2 mL of Apple cider (Heinz, Thailand)
8
afrom 15 cm line scale.
Food and Applied Bioscience Journal, 2020, 8(3): 48-57
© 2020 Agro-Industry, Chiang Mai University
52
Acceptability of overall, color, aroma, taste and aftertaste was further evaluated by 50 consumers (20-30 years, 37 females and 13 males) using a 9−point hedonic scale. Saltiness just about right (JAR) was also determined by a 5−point category scale (too much weak, a little too weak, just about right, a little too strong, and too much strong). All soy sauce samples (5 mL) were served in 1−oz. white plastic cup coded with random three−digit numbers and the boiled skinless chicken breast was used as a carrier for these two consumer tests. 2.5 Statistical analysis The physical and chemical properties were determined in triplicate and the experiment was accomplished using a completely randomized design (CRD). Descriptive and hedonic tests were arranged in a randomized complete block design (RCBD) (panelist as a block). The results were statistically analyzed by ANOVA to find a significant difference using SPSS (IBM, version 19; Chicago, USA) and Duncan’s multiple range test was used to separate the mean 3. Results and Discussion
Low sodium Japanese (LJ) and Thai (LT) soy sauce samples in this study were claimed 40% and 43% salt reduction, respectively. Sodium chloride (NaCl) in these two soy sauces were partially replaced by potassium chloride (KCl). LJ and LT together with original Japanese (HJ) and Thai (HT) soy sauces had clear reddish−brown color. This color was a result of the Maillard reaction between the amino acid and reducing sugar during fermentation, aging and pasteurization. Development of browning could be investigated from intermediates or final products of Maillard reaction. Khamprakhon and Muangthai (2009) used 5−hydroxymethyl−2−furfuraldehyde (HMF) as a browning index in soy sauce. It is usually converted to melanoidin, the main color pigment in soy sauce, which is directly determined by visual appearance or CIE Lab scale.
Among four soy sauce samples, the LT was the most brightness when observed with naked eyes. This result was supported by L* values (Table 2). The L* of LT was lowest while the values of a* and b* were not significantly different (P≤0.05). This might be due to the loss of melanoidin and amino acids during the removal of NaCl in the production process using membrane technology. Kikkoman has been proposed an electrodialysis for NaCl depletion (Yamakoshi et al., 2008). This method differs from other membrane techniques in that the separation principle is based on the electrical charge instead of the particle size. Thus, the amino acids and peptides can pass through the membrane. Moreover, the decrease of amino acid, peptide and protein which showed in Table 2 resulted in retarded color development
Food and Applied Bioscience Journal, 2020, 8(3): 48-57
© 2020 Agro-Industry, Chiang Mai University
53
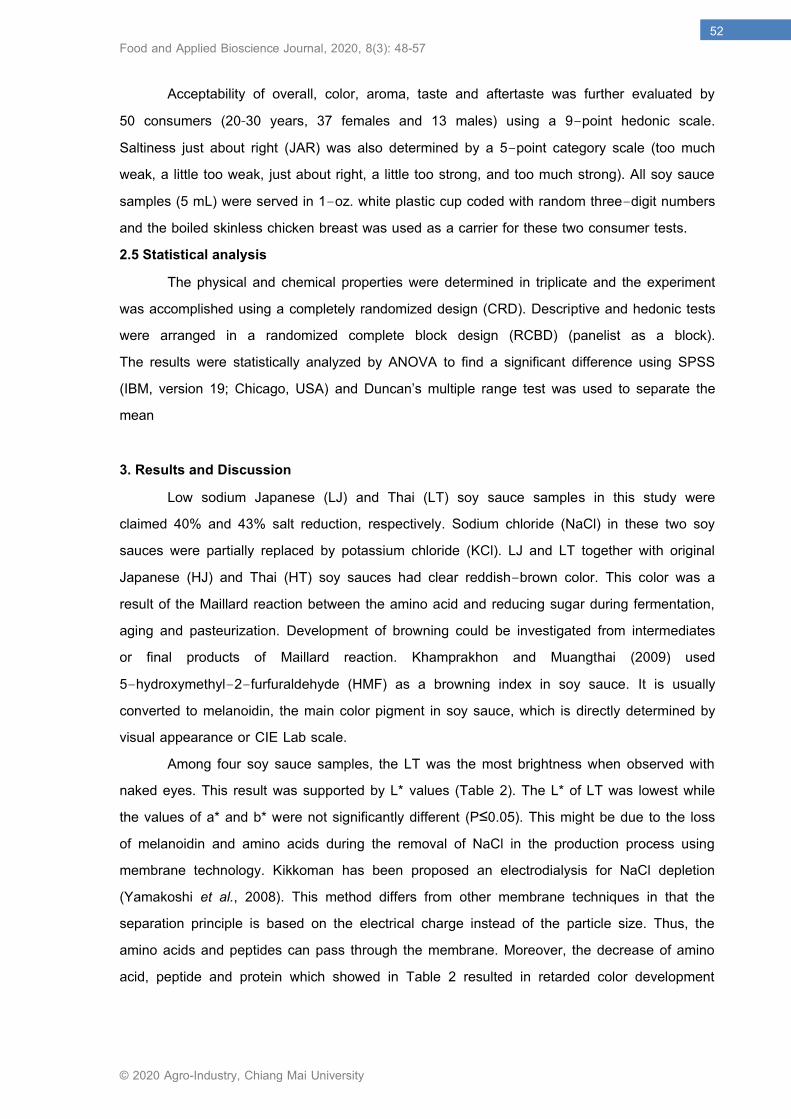
during the pasteurization process. Yokotsuka (1986) reported that soy sauce color was mostly evolved in the refining step. Table 2 Color values and protein contents of soy sauce samples
Soy sauce Color values Protein
(% w/w) L* a* b* Original Japanese (HJ) 20.50 ± 0.49b 0.01 ± 0.05a -0.75 ± 0.06a 9.95 ± 0.20a Low-sodium Japanese (LJ) 21.13 ± 0.75ab 0.01 ± 0.13a -0.55 ± 0.01a 9.69 ± 0.06b Original Thai (HT) 19.26 ± 0.26b -0.08 ± 0.09a -0.71 ± 0.25a 8.93 ± 0.17c Low-sodium Thai (LT) 22.07 ± 1.41a -0.03 ± 0.02a -0.47 ± 0.12a 3.17 ± 0.12d Means follow by different letters are significantly different (P≤0.05) according to Duncan’s multiple comparison test.
Protein contents of low sodium soy sauces (LJ, LT) were lower than those of original samples (HJ, HT) (P≤0.05). Unexpectedly, LT had threefold protein lower than others which is an accordance with L* color values (Table 2). Although LT contained extremely low protein content, it fulfills the Thai Food and Drug Administration (FDA) regulation requirement. The protein content of Thai soy sauce must not less than 1.5% (w/w) (Thai FDA, 2000). On the other hand, LJ protein was higher than HT protein (P≤0.05) and above WHO specification. Soy sauce protein of the WHO standard is 5.6% (w/w) (Ensminger et al., 1994). Total nitrogen of soy sauce consisted of 40−50% of amino acids, 40-50% of peptides, 10-15% of ammonia and less than 1% of protein according to the study of Chicester et al. (1988). Lower protein content which calculated from total nitrogen may change the soy sauce flavor profile.
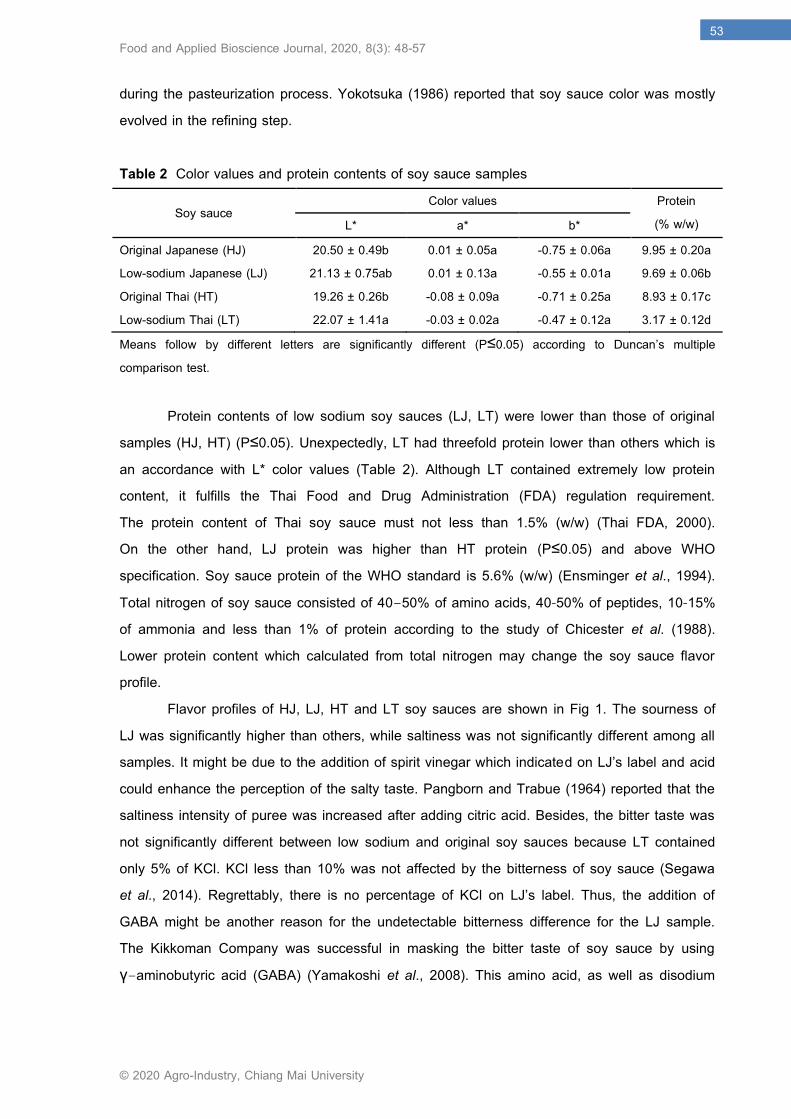
Flavor profiles of HJ, LJ, HT and LT soy sauces are shown in Fig 1. The sourness of LJ was significantly higher than others, while saltiness was not significantly different among all samples. It might be due to the addition of spirit vinegar which indicated on LJ’s label and acid could enhance the perception of the salty taste. Pangborn and Trabue (1964) reported that the saltiness intensity of puree was increased after adding citric acid. Besides, the bitter taste was not significantly different between low sodium and original soy sauces because LT contained only 5% of KCl. KCl less than 10% was not affected by the bitterness of soy sauce (Segawa et al., 2014). Regrettably, there is no percentage of KCl on LJ’s label. Thus, the addition of GABA might be another reason for the undetectable bitterness difference for the LJ sample. The Kikkoman Company was successful in masking the bitter taste of soy sauce by using γ−aminobutyric acid (GABA) (Yamakoshi et al., 2008). This amino acid, as well as disodium
Food and Applied Bioscience Journal, 2020, 8(3): 48-57
© 2020 Agro-Industry, Chiang Mai University
54
5'−ribonucleotide which labeled as one ingredient of LT, could also enhance the umami taste of low sodium soy sauces which resulted in no significant difference of umami intensity (Fig 1).
Fig 1 Flavor profiles of soy sauce samples *Indicate significant difference (P≤0.05) using Duncan’s multiple comparison test.
LJ was less overall acceptability than others because of color and aroma (Table 3). Many panelists who were familiar with Thai soy sauce mentioned that LJ was a little too dark and more pungent. However, the liking score of taste was not significantly different between the samples even though the trained panel could detect the difference of sourness (Fig 1). This might be due to the carrier effect. The Boiled skinless chicken breast was used as a carrier for consumer tests, while soy sauce samples were taste without any carriers in descriptive tests. Cherdchu and Chambers (2014) elucidated that the more complex of the carrier, the more variable of the flavor profile. Furthermore, no significant of taste liking score might due to the balance of saltiness and umami. The descriptive of soy sauce showed no significant difference in these two tastes (Fig 1). The appropriate proportion between salty and umami tastes is an important factor for high-quality soy sauce (Kuramitsu et al., 2014). For just about right saltiness score, the low sodium soy sauces had a tendency to be just right while the original soy sauces were rated to be too much salty which might be the results of the testing procedure. The soy sauce samples were served as table sauce instead of cooking sauce. Cherdchu and Chambers (2014) stated that the carrier decreases the intensity of saltiness of soy sauce.
0
2
4
6
8
10
12
alcohol ANbrothy AN
molasses AN
beany AN
malty AN
fermented AN
Briny AN
saltyumamisour*
sweet
bitter
brown sugar…
autolysed AM
beany AM
briny AMfermented AM
Original Japanese (HJ)
Low-sodium Japanese (LJ)
Original Thai (HT)
Low-sodium Thai (LT)
Food and Applied Bioscience Journal, 2020, 8(3): 48-57
© 2020 Agro-Industry, Chiang Mai University
55
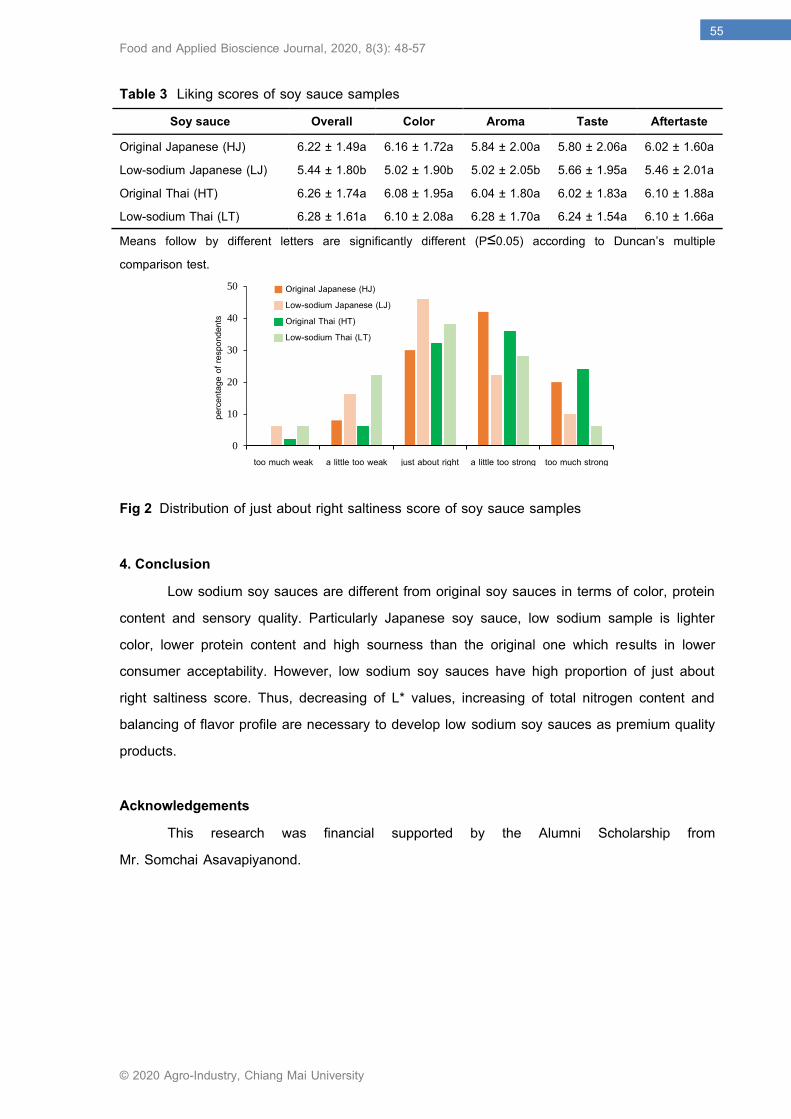
Table 3 Liking scores of soy sauce samples Soy sauce Overall Color Aroma Taste Aftertaste
Original Japanese (HJ) 6.22 ± 1.49a 6.16 ± 1.72a 5.84 ± 2.00a 5.80 ± 2.06a 6.02 ± 1.60a Low-sodium Japanese (LJ) 5.44 ± 1.80b 5.02 ± 1.90b 5.02 ± 2.05b 5.66 ± 1.95a 5.46 ± 2.01a Original Thai (HT) 6.26 ± 1.74a 6.08 ± 1.95a 6.04 ± 1.80a 6.02 ± 1.83a 6.10 ± 1.88a Low-sodium Thai (LT) 6.28 ± 1.61a 6.10 ± 2.08a 6.28 ± 1.70a 6.24 ± 1.54a 6.10 ± 1.66a Means follow by different letters are significantly different (P≤0.05) according to Duncan’s multiple comparison test.
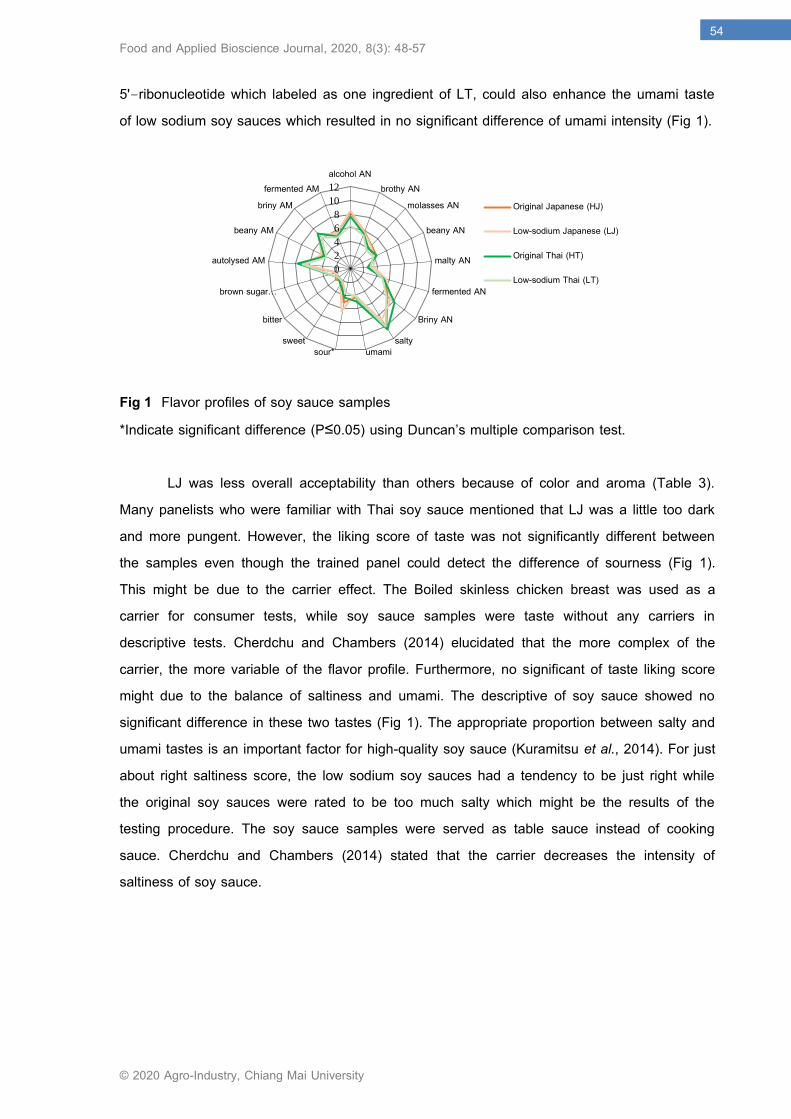
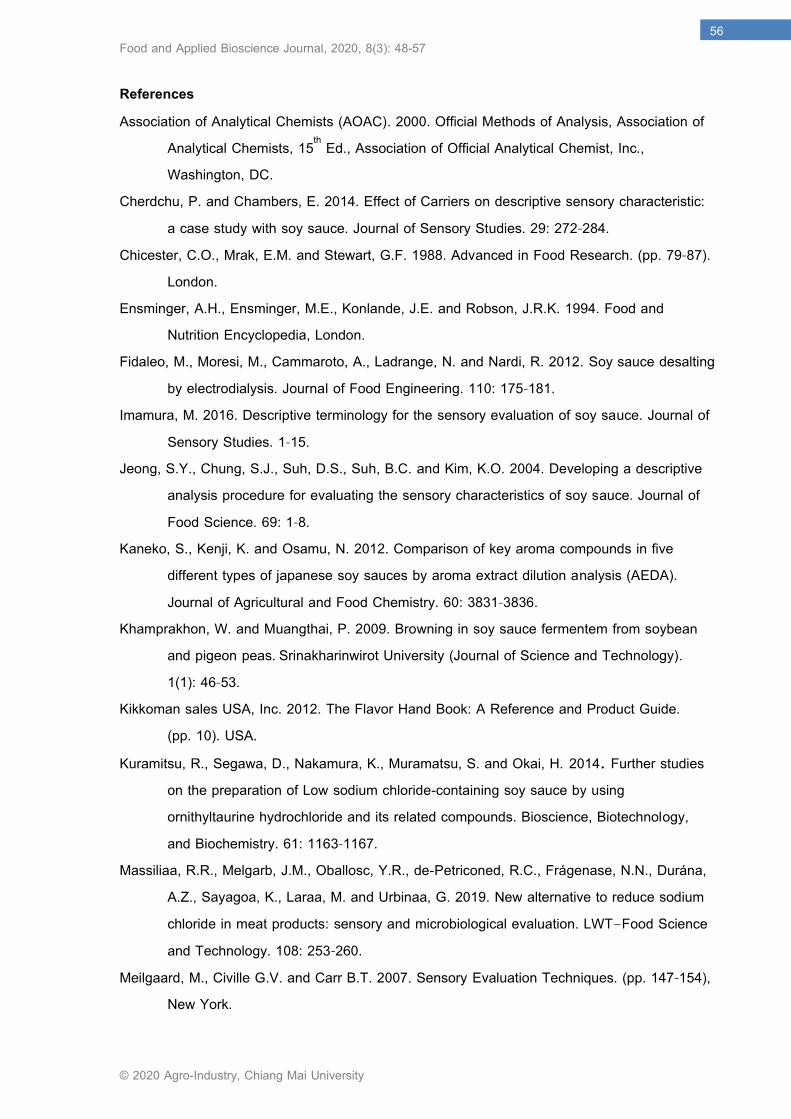
Fig 2 Distribution of just about right saltiness score of soy sauce samples 4. Conclusion Low sodium soy sauces are different from original soy sauces in terms of color, protein content and sensory quality. Particularly Japanese soy sauce, low sodium sample is lighter color, lower protein content and high sourness than the original one which results in lower consumer acceptability. However, low sodium soy sauces have high proportion of just about right saltiness score. Thus, decreasing of L* values, increasing of total nitrogen content and balancing of flavor profile are necessary to develop low sodium soy sauces as premium quality products. Acknowledgements This research was financial supported by the Alumni Scholarship from Mr. Somchai Asavapiyanond.
0
10
20
30
40
50
too much weak a little too weak just about right a little too strong too much strong
perce
ntage
of r
espo
nden
ts
Original Japanese (HJ)Low-sodium Japanese (LJ)Original Thai (HT)Low-sodium Thai (LT)
Food and Applied Bioscience Journal, 2020, 8(3): 48-57
© 2020 Agro-Industry, Chiang Mai University
56
References Association of Analytical Chemists (AOAC). 2000. Official Methods of Analysis, Association of
Analytical Chemists, 15th Ed., Association of Official Analytical Chemist, Inc., Washington, DC.
Cherdchu, P. and Chambers, E. 2014. Effect of Carriers on descriptive sensory characteristic: a case study with soy sauce. Journal of Sensory Studies. 29: 272-284.
Chicester, C.O., Mrak, E.M. and Stewart, G.F. 1988. Advanced in Food Research. (pp. 79-87). London.
Ensminger, A.H., Ensminger, M.E., Konlande, J.E. and Robson, J.R.K. 1994. Food and Nutrition Encyclopedia, London.
Fidaleo, M., Moresi, M., Cammaroto, A., Ladrange, N. and Nardi, R. 2012. Soy sauce desalting by electrodialysis. Journal of Food Engineering. 110: 175-181.
Imamura, M. 2016. Descriptive terminology for the sensory evaluation of soy sauce. Journal of Sensory Studies. 1-15.
Jeong, S.Y., Chung, S.J., Suh, D.S., Suh, B.C. and Kim, K.O. 2004. Developing a descriptive analysis procedure for evaluating the sensory characteristics of soy sauce. Journal of Food Science. 69: 1-8.
Kaneko, S., Kenji, K. and Osamu, N. 2012. Comparison of key aroma compounds in five different types of japanese soy sauces by aroma extract dilution analysis (AEDA). Journal of Agricultural and Food Chemistry. 60: 3831-3836.
Khamprakhon, W. and Muangthai, P. 2009. Browning in soy sauce fermentem from soybean and pigeon peas. Srinakharinwirot University (Journal of Science and Technology). 1(1): 46-53.
Kikkoman sales USA, Inc. 2012. The Flavor Hand Book: A Reference and Product Guide. (pp. 10). USA.
Kuramitsu, R., Segawa, D., Nakamura, K., Muramatsu, S. and Okai, H. 2014. Further studies on the preparation of Low sodium chloride-containing soy sauce by using ornithyltaurine hydrochloride and its related compounds. Bioscience, Biotechnology, and Biochemistry. 61: 1163-1167.
Massiliaa, R.R., Melgarb, J.M., Oballosc, Y.R., de-Petriconed, R.C., Frágenase, N.N., Durána, A.Z., Sayagoa, K., Laraa, M. and Urbinaa, G. 2019. New alternative to reduce sodium chloride in meat products: sensory and microbiological evaluation. LWT−Food Science and Technology. 108: 253-260.
Meilgaard, M., Civille G.V. and Carr B.T. 2007. Sensory Evaluation Techniques. (pp. 147-154), New York.
Food and Applied Bioscience Journal, 2020, 8(3): 48-57
© 2020 Agro-Industry, Chiang Mai University
57
Pangborn, R.M. and Trabue, I.M. 1964. Taste interrelationships of sucrose, sodium chloride, and citric acid in lima bean puree. Journal of Food Science. 29: 490-498.
Sanceda, N., Suzuki, E. and Kurata, T. 2003. Quality and sensory acceptance of fish sauce partially substituting sodium chloride or natural salt with potassium chloride during the fermentation process. International Journal of Food Science and Technology. 38: 435-443.
Segawa, D, Nakamura, K., Kuramitsu, R., Muramatsu, S., Sano, Y., Uzuka, Y., Tamura, M. and Okai, H. 2014. Preparation of low Sodium chloride containing soy sauce using amino acid based saltiness enhancers. Bioscience, Biotechnology, and Biochemistry. 59: 35-39.
Tan, W.L, Azlan, A. and Noh, M.F.M. 2016. Sodium and potassium contents in selected salts and sauces. International Food Research Journal. 23: 2181-2186.
Thai FDA. Seasoning and Sauces. http://elib.fda.moph.go.th/elib/cgibin/opacexe.exe?lang=0&op=dsp&wa=A49CE26&bid=33972&qst=@1329&db=Jindex&pat=%A1%AE%CB%C1%D2%C2+%CD%D7%E8%B9%E6+%C2%D2+2546&cat=gen&skin=u&lpp=20&catop=&scid=zzz2000, (December 27, 2019).
Yamakoshi, J, Matsumoto, K., Saito, M., Aota, H., Nakahara, T., Fukada, S., Oguma, T. and Fujii, N. 2008. Patent Application Publication. 1-6.
Yokotsuka, T. 1986. Aroma and flavor of Japanese soy sauce. Advances in Food Research, 10: 75-134.
Related Documents