The Physical and Genetic Mapping of the Mucin Genes Located on Chromosomes 7 and 11 by Alexander Stuart Hill A thesis submitted for the degree of Doctor of Philosophy University of London MRC Human Biochemical Genetics Unit Department of Biology University College London March, 1997

Welcome message from author
This document is posted to help you gain knowledge. Please leave a comment to let me know what you think about it! Share it to your friends and learn new things together.
Transcript
The Physical and Genetic Mapping of the Mucin Genes
Located on Chromosomes 7 and 11
by
Alexander Stuart Hill
A thesis submitted for the degree of Doctor of Philosophy
University of London
MRC Human Biochemical Genetics Unit
Department of Biology
University College London
March, 1997

ProQuest Number: 10046191
All rights reserved
INFORMATION TO ALL USERS The quality of this reproduction is dependent upon the quality of the copy submitted.
In the unlikely event that the author did not send a complete manuscript and there are missing pages, these will be noted. Also, if material had to be removed,
a note will indicate the deletion.
uest.
ProQuest 10046191
Published by ProQuest LLC(2016). Copyright of the Dissertation is held by the Author.
All rights reserved.This work is protected against unauthorized copying under Title 17, United States Code.
Microform Edition © ProQuest LLC.
ProQuest LLC 789 East Eisenhower Parkway
P.O. Box 1346 Ann Arbor, Ml 48106-1346
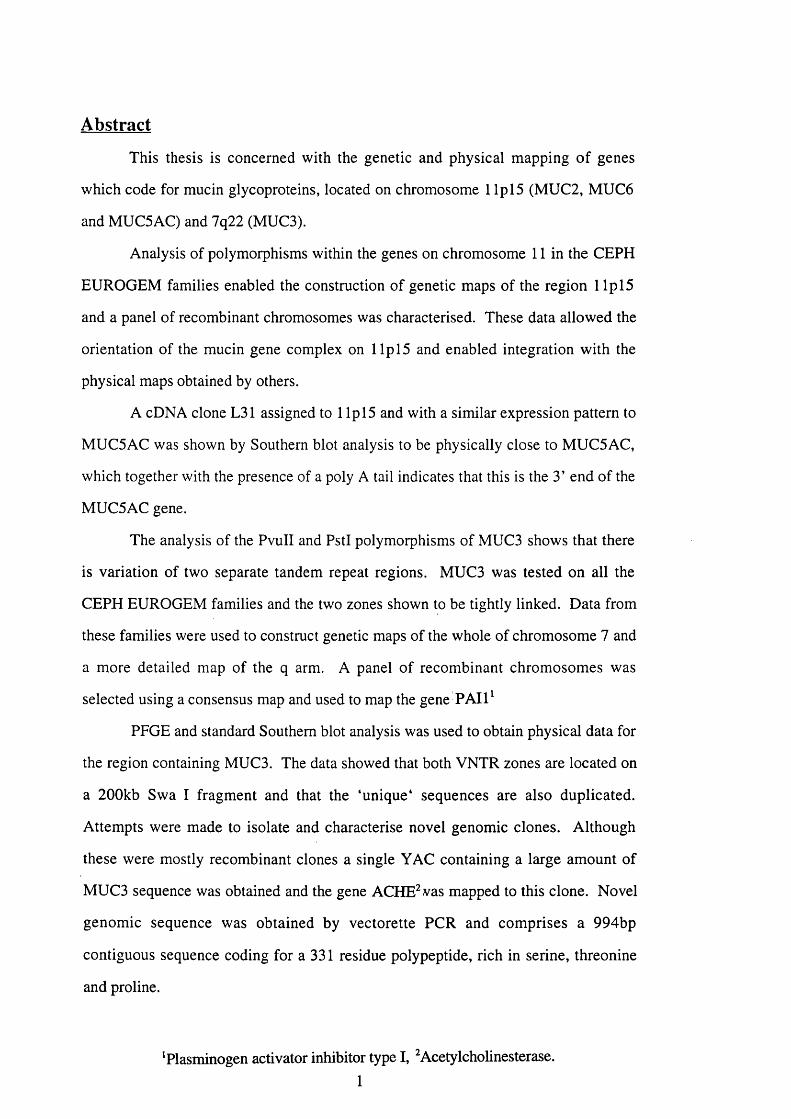
Abstract
This thesis is concerned with the genetic and physical mapping of genes
which code for mucin glycoproteins, located on chromosome 1 Ip 15 (MUC2, MUC6
and MUC5AC) and 7q22 (MUC3).
Analysis of polymorphisms within the genes on chromosome 11 in the CEPH
EUROGEM families enabled the construction of genetic maps of the region l i p 15
and a panel of recombinant chromosomes was characterised. These data allowed the
orientation of the mucin gene complex on l lp l5 and enabled integration with the
physical maps obtained by others.
A cDNA clone L31 assigned to 1 Ip 15 and with a similar expression pattern to
MUC5AC was shown by Southern blot analysis to be physically close to MUC5AC,
which together with the presence of a poly A tail indicates that this is the 3’ end of the
MUC5AC gene.
The analysis of the PvuII and PstI polymorphisms of MUC3 shows that there
is variation of two separate tandem repeat regions. MUC3 was tested on all the
CEPH EUROGEM families and the two zones shown to be tightly linked. Data from
these families were used to construct genetic maps of the whole of chromosome 7 and
a more detailed map of the q arm. A panel of recombinant chromosomes was
selected using a consensus map and used to map the gene PAH
PFGE and standard Southern blot analysis was used to obtain physical data for
the region containing MUC3. The data showed that both VNTR zones are located on
a 200kb Swa I fragment and that the ‘unique* sequences are also duplicated.
Attempts were made to isolate and characterise novel genomic clones. Although
these were mostly recombinant clones a single Y AC containing a large amount of
MUC3 sequence was obtained and the gene ACHE^vas mapped to this clone. Novel
genomic sequence was obtained by vectorette PCR and comprises a 994bp
contiguous sequence coding for a 331 residue polypeptide, rich in serine, threonine
and proline.
^Plasminogen activator inhibitor type I, ^Acetylcholinesterase.
1

Table of contents
Abstract 1
Table of contents 2
List of Figures 7
List of Tables 13
Abbreviations 14
Acknowledgements 17
1. Introduction 19
1.1. GENETIC VARIATION IN HUMANS 19
1.2. HUMAN GENE MAPPING 22
1.2.1. LINKAGE ANALYSIS 22
1.2.2. SOMATIC CELL HYBRIDS 27
1 .2 .3 ./V S /rU HYBRIDISATION 28
1.2.4. CLONING 29
1.2.4.1. cDNA clones 30
1.2.4.2. Genomic clones 30
1.2.4.3. Other vectors used in the manipulation and sequencing o f cloned DNA 32
1.2.5. THE POLYMERASE CHAIN REACTION (PCR) 32
1.2.6. RESTRICTION ENZYME ANALYSIS OF DNA 35
1.2.7. SEQUENCING 38
1.3. MUCINS 40
1.4. THE HUMAN MUCIN GENES 43
1.4.1. CHROMOSOME 1Q21 MUCI 44
1.4.2. CHROMOSOME 11PI5.5: MUC2, MUC5 AND MUC6 46
1.4.2.1.M UC2 46
1.4.2.2. MUC5 48
1.4.2.3. MUC6 49
1.4.3. CHROMOSOME 7Q22: MUC3 50
1.4.4. CHROMOSOME 3Q29: MUC4 50
1.4.5. CHROMOSOME 4Q13-Q21: MUC7 51
1.5. MUCINS AND MUCIN-LIKE GLYCOPROTEINS IN OTHER SPECIES 52
1.5.1. RAT MUCINS 52
1.5.2. MOUSE MUCINS 55
1.5.3. FROG MUCINS 56
1.5.4. PORCINE MUCINS 57
1.5.5. BOVINE MUCINS 58
1.5.6. CANINE MUCINS 58
1.6. AIMS OF THE PROJECT 59
2. Materials and methods_____________________________________ 60
2.1. MAINTENANCE OF K562 (ERYTHRO-LEUKAEMIA) CELL LINE 60
2.2. PREPARATION OF GENOMIC DNA AND PURIFICATION OF CLONED DNA 60
2 .2 .1. STOCK SOLUTIONS 60
2.2.2. PREPARATION OF PLASMID DNA 61
2.2.2.1. Transformation of bacterial cells 61
1.2.12. Bulk plasmid preparation 62
2.2.3. PREPARATION OF HUMAN GENOMIC DNA IN SOLUTION 63
2.2.4. PREPARATION OF HUMAN GENOMIC DNA IN LMP AGAROSE BLOCKS 64
2.2.5. PREPARATION OF YEAST ARTIFICIAL CHROMOSOME (YAC) DNA IN
SOLUTION 65
2.2.6. PREPARATION OF YAC DNA IN LMP AGAROSE BLOCKS 66
2.3. GENERAL DNA METHODS 67
2.3.1. COMMONLY USED BUFFERS 67
2.3.2. DETERMINATION OF DNA CONCENTRATION 67
2.3.2.1. Spectrophotometry 67
2.3.2.2. Comparison with known standards 67
2.3.3. RESTRICTION ENZYME DIGESTS OF GENOMIC AND CLONED DNA 68

2.3.3.1. Digestion of DNA in solution 68
2.3.3.2. Digestion of DNA in LMP agarose 68
2.3.4. STANDARD AGAROSE GEL ELECTROPHORESIS. 69
2.3.4.1. Estimation of the size of a DNA fragment 69
2.3.5. GEL PURIFICATION METHODS 70
2.3.5.1. Centrifugation through glass wool 70
2.3.5.2. Ethanol precipitation of DNA 71
2.4. SOUTHERN BLOT ANALYSIS OF MUCIN GENES 71
2.4.1. PREPARATION OF FILTERS. 71
2.4.2. PREPARATION AND 32P LABELLING OF PROBE DNA. 72
2.4.3. HYBRIDISATION AND WASHING DOWN OF FILTERS 72
2.4.4. AUTORADIOGRAPHY. 73
2.5. PULSED FIELD GEL ELECTROPHORESIS (PFGE) 73
2.5.1. SOUTHERN BLOTTING OF PULSED FIELD GEL 74
2.6. POLYMERASE CHAIN REACTION (PCR) 74
2.6.1. OLIGONUCLEOTIDE PRIMERS 75
2.6.2. PREPARATION OF NUCLEOTIDE STOCKS 77
2.6.3. REACTION CONDITIONS FOR PCR AMPLIFICATION FROM GENOMIC AND
CLONED DNA 77
2.6.3.1. Stock solutions: 77
2.6.3.2. Standard PCR 77
2.6.3.3. Standard hot start PCR 78
2.6.3.4. Long hot start PCR 78
2.6.3.5. Touchdown hot start PCR 79
2.6.3.6. Vectorette PCR 79
2.6.3.6.1. Construction of vectorette libraries 79
2.6.3.6.2. PCR of vectorette library 80
2.6.3.7. Detection of minisatellite repeats polymorphism PCR 80
2.6.4. DETECTION OF PCR PRODUCTS BY AGAROSE GEL ELECTROPHORESIS 81
2.7. SEQUENCING OF VECTORETTE PCR PRODUCTS 81
2.7.1. BIOTINYLATED SEQUENCING 81

2.7.2. CYCLE SEQUENCING 83
2.7.3. SEQUENCING GEL 84
2.8. FLUORESCENT IN SITU HYBRIDISATION (FISH) 85
2.8.1. STOCK SOLUTIONS 86
2.8.2. PREPARATION OF CELLS FROM BLOOD 86
2.8.3. SLIDE PREPARATION 87
2.8.4. PREHYBRIDISATION 87
2.8.5. PROBE PREPARATION USING COMPETITION WITH COT-1-DNA AND
HYBRIDISATION 88
2.8.6. POST HYBRIDISATION WASHES 88
2.8.7. SIGNAL DETECTION 89
2.9. COMPUTER RESOURCES 90
3. The mucin gene family on chromosome llp l5 .5 : results and
discussion____________________________________________________ 91
3.1. FAMILIES ANALYSED 91
3.2. SEARCH FOR AND ANALYSIS OF POLYMORPHISMS OF THE MUCIN GENES
ON CHROMOSOME 11P15.5 91
3.3. LINKAGE ANALYSIS 102
3.4. CHARACTERISATION OF A PUTATIVE C TERMINAL M UC5AC CLONE. 108
3.5. DISCUSSION 111
4. Genetic and physical mapping of MUC3 located on chromosome
7q22; results and discussion.__________________________________ 121
4.1. RESULTS 122
4.1.1. ANALYSIS OF THE MUC3 POLYMORPHISMS AND TWO-POINT LINKAGE
ANALYSIS 122
4.1.2. GENETIC MAPPING OF CHROMOSOME 7 127
4.1.2.1. Mapping of the gene PA Il using a panel o f chromosomes with defined
meiotic breakpoints 131
4.1.3. PHYSICAL MAPPING AND CLONING OF MUC3 136
4.1.3.1. Southern blot analysis o f MUC3 136
4.1.3.2. Sizing o f the polymorphic bands detected with SIB 124 on DNA digested
with PvuIL 137
4.1.3.3. Southern blot analysis of MUC3 ‘unique’ sequences. 140
4.1.3.4. Pulsed field gel electrophoresis (PFGE) of genomic DNA 145
4.1.3.5. Cloning MUC3 151
4.1.3.6. Isolation and analysis o f genomic clones 151
4.1.3.7. Isolation of YAC clones 156
4.1.3.8. Initial characterisation of the YAC clones 156
4.1.3.9. Further characterisation of YAC YW SS3840 157
4.1.3.10. Cosmid clones 165
4.1.4. SEQUENCING 170
4.2. DISCUSSION 176
5. General Discussion________________________________________ 189
Appendix I 193
Appendix II 196
Appendix III 212
Appendix IV 218
Appendix V 222
Appendix VI 223
References 225

List of figures
Figure Page
1.1. Diagrammatic representation of the vectorette PCR process. 34
1.2. D iagram m atic representation of the structure o f the m ucin 41
carbohydrate side chains, taken from (Hounsell et al. 1982).
3. 1. Autoradiograph of a Southern blot of DNA from CEPH family 884 93
digested with Hinfl and probed with SMUC41 (MUC2).
3. 2. Autoradiographs of two Southern blots of DNA from CEPH family 94
1416 digested with PvuII and TaqI probed with MUC6.
3. 3. Autoradiographs of three Southern blots of DNA from CEPH family 96
1424 digested with PvuII, MspI and TaqI probed with JER58
(MUC5AC).
3. 4. Autoradiographs of two Southern blots of DNA from CEPH family 97
1424 digested with Pst I and H infl probed with JER58.
3 .5 . Two histograms showing the allele size distributions of MUC6 (A) 99
and MUC2 (B).
3. 6. Autoradiographs of two Southern blots of DNA from CEPH families 101
1331 and 1333 digested with Hinf I and probed with SMUC41
(MUC2).
3. 7. Autoradiograph of a Southern blot of DNA from CEPH family 1413 104
digested with Msp I and probed with pEJ6.6 (HRAS).
3. 8. Autoradiograph of a Southern blot of DNA from CEPH family 1413 105
digested with Pst I and probed with probe 2.1 (D1 IS 150).
3. 9. An example of the results obtained with the ALE system showing 106
the electrophoretic analysis of the D11S2071 microsatellite using
DNA samples from members of CEPH family 1424.
3. 10. A diagrammatic representation of the eleven most informative 107
meiotic breakpoints in the region of chromosome 1 lp l5 .
3. 11. Autoradiograph of a southern blot of four individual human genomic 110
DNA samples digested with EcoR I and four with Sea I probed with
L31 and JER58 (MUC5AC) cDNAs.
3.12. A diagrammatic representation of the map of the mucin genes in the 112
region of chromosome 1 lp l5 .5 as determined by PFGE (adapted
from (Pigny et al. 1996)).
3. 13. Sequence alignments of the predicted peptide sequences of carboxyl 115
terminal of MUC2 and the cDNA clones L 31 and NP3a.
4. 1. Autoradiographs of two Southern blots of DNA from a CEPH 123
family digested with PvuII and PstI probed with SIB 124 (MUC3)
(taken from (Fox et al. 1992)).
4. 2. Autoradiographs of two Southern blots of DNA from the CEPH 124
family 1341 digested with Pvu II and Pst I probed with SIB 124
(MUC3).
4. 3. A diagram m atic representation of the fram ew ork map o f 128
chromosome 7 based on the order predicted by the computer
program CRI-MAP supported at odds of greater than 1000:1.
4. 4. A diagrammatic representation of a higher resolution genetic map of 130
the q arm of chromosome 7 supported at odds of greater than
1000:1.
4. 5. An example of the results obtained with the ALE system showing 132
the electrophoretic analysis of the PAIl microsatellite using DNA
samples from members of CEPH family 1347.
4. 6. Output from the program CROSSFIND using the consensus order of 133
markers on chromosome 7, taken from the report of the Second
International Chromosome 7 Workshop (Tsui et al. 1995), showing
a selection chromosomes with defined meiotic breakpoints.
4. 7. Output from the program CROSSFIND using the consensus order of 135
markers on chromosome 7,taken from the report of the Second
International Chromosome 7 Workshop (Tsui, Donis-Keller et al.
1995), showing a selection chromosomes with defined meiotic
breakpoints in the region 7q22.

4. 8. Autoradiograph of a Southern blot of DNA from 7 individuals 138
digested with Pvu II and probed with SIB 124 (MUC3).
4. 9. Autoradiographs of southern blots of DNA from members of the 141
CEPH family 1420 digested with PvuII and probed with SIB 124 and
clone 23 and DNA from members o f the CEPH family 13293
digested with PstI and probed with SIB 124 and SIB 172U.
4. 10. Autoradiograph of Southern blots of DNA from a single individual 142
digested with Pst I, Pvu II and Hind III probed with cDNA clones
from MUC3 (SIB 124, Clone 20 and SIB172U).
4. 11. A utoradiograph of a Southern blot of a pulsed field gel 146
electrophoresis of K562 DNA digested with Sma I, Sfi I, BssH II,
Nae I, Not I, Sac II, Nru I, and Mlu I restriction enzymes probed
with SIB 124.
4. 12. Autoradiograph of a Southern blot of pulsed field gel electrophoresis 149
of K562 DNA digested with Not I and Swa I probed with SIB 124
and SIB172U.
4. 13. Autoradiograph of a Southern blot of pulsed field gel electrophoresis 150
of DNA from 5 individuals digested with Swa I probed with
SIB 124.
4. 14. A diagrammatic representation of the restriction map of the genomic 152
clone GM3.
10
4. 15. Reverse transcriptase (RT) PCR of cDNA samples prepared from 154
colon (CO), small intestine (SI), M614 (M6), MZPC-4 (MZ),
SKPC-3 (SK), MCF-7 (MC), caco 2 (CA) and HT29-MTX (HT).
With primers MUC31S and MUC3F2A.
4. 16. Medium length hot start PCR of genomic (G) and genomic clone 155
GM3 (M) DNA with MUC323S and MUC31A primers.
4. 17. A metaphase spread showing fluorescent in situ hybridisation of the 158
YAC clone ICRF900A07107.
4. 18. A metaphase spread showing fluorescent in situ hybridisation of the 159
YAC clone YWSS3840.
4. 19. Three metaphase spreads A, B, and C showing fluorescent in situ 160
hybridisation of the YAC clones YW SS2050 (spread A),
YW SS2717 (spread B) and YW SS2782 (spread C). The
chromosomes are counter stained red with PI
4. 20. Standard hot start PCR of genomic (G) and YWSS3840 (Y) DNA 161
with prim ers for MUC3; 1. M UC323A and M UC323S, 2.
MUC3INA and MUC3INS and 3. MUC3FP1A and MUC3FP1S.
4 .2 1 . Autoradiograph of a PFGE Southern blot o f K562 (G) and 163
YWSS3840 (Y) DNA digested with Pvu II, Not I, Sma I and Swa I
probed with SIB 124 (MUC3).
11
4. 22. Standard hot start PCR of genomic (G) and YAC YWSS3840 (Y) 164
DNA samples with primers for; 1. ACHE (ROMP ID No. 6033 and
6034), 2. PAIl (ROMP ID No. 6031 and 6032) and 3. EPO (ROMP
ID No. 6029 and 6030).
4. 23. An example of an autoradiograph off a colony blot probed with 166
SIB 124 from the total genomic cosmid library (Cachon-Gonzalez
1991) at the secondary screening stage.
4. 24. Three metaphase spreads A and B showing fluorescent in situ 168
hybridisation of the cosmid clones MUC3C2 (spread A) and
MUC3C6 (spread B).
4. 25. Standard hot start PCR of genomic (G), genomic MUC3 clone GM3 169
(M), ACRE cosmids A- (A) and p l8D -l (P) with primers for; 1.
ACRE (RGMP ID No. 6033 and 6034), 2. MUC3 (MUC323A and
MUC323S) and 3. MUC3 (MUC3FP1A and MUC3FP1S).
4. 26. Diagrammatic representation of the composite vectorette and 171
SIB 172 sequence showing the direction and position of primers used
for vectorette PCR and sequencing.
4. 27. Vectorette PCR products VECl (VI), VEC3 (V3) and VEC4 (V4). 172
4. 28. Composite sequence of V ECl, VEC3, VEC4 and SIB 172. 173
4. 29 Diagrammatic representation of the speculative model of MUC3. 182
12

4 .30 . Sequence alignments of the sequences SIB 172, SIB219, SIB223, 186
SIB221, SIB217, SIB236, SIB227, SIB209, SIB235 and the
vectorette sequence.
13

List of tables
Table Page
2. 1. Table showing the sequence, locus, melting temperature and 76
application of the primers used during the course of the research
described in this thesis.
4. 1. Table showing the pairwise lod scores at maximum likelihood 126
recombination fractions 0 in males (M) and female (F) for MUC3
with a selection of chromosome 7 markers which have been
localised to regions of chromosome 7 using physical methods.
4 .2 . Table showing the sizes of the MUC3 alleles detected with SIB 124 139
on genomic DNA digested with PvuII from seven individuals.
4. 3, Table showing the sizes of fragments detected using the cDNA 143
probes SIB 124, clone 20 and SIB172U on genomic DNA digested
with PstI, PvuII and Hindlll from a single individual.
4. 4. Table showing the size of fragments detected using the cDNA probe 147
on PFGE blots of genomic DNA digested with Notl, BssHII, Nael,
Smal, Sfil, SacII, Nrul and Mlu I from the cell line K562.
14
Abbreviations
ACHE Acetylcholinesterase gene
ALE Automated laser fluorescence
BAG Bacterial artificial chromosome
BrDU 5-bromo deoxyuridine
BSA Bovine serum albumin
CCD Charged couple device
CEPH Centre d'Etude du Polymorphisme Humain
CHEF Clamped homogeneous electric field
C0L1A2 Collagen, type I, alpha 2 gene
C0L2A1 Collagen, type II, alpha 1 gene
CRI-MAP Multipoint analysis computer package
DAPI 4, 6-diamino-2-phenyl-indol
DGGE Denaturing gradient gel electrophoresis
EPO Erythropoietin gene
ERV3 Endogenous retroviral sequence 3
EUROGEM European genome mapping initiative
PCS Foetal calf serum
FIGE Field inversion gel electrophoresis
FIM Frog integumentary mucin
FISH Fluorescent in situ hybridisation
FITC Fluorescein isothiocyanate
Gal Galactose
GalNAc N-acetylgalactosamine
GDB Genome database
GlcNAc N-acetylglucosamine
15
HBB Haemoglobin, beta gene
HBGU Human biochemical genetics unit
HGMP Human genome mapping project
HMFG Human milk fat globule
HRAS Harvey rat sarcoma viral oncogene homolog
ICRF Imperial cancer research fund
IL6 Interleukin 6 gene
INS Insulin gene
LMP Low melting point
lod Log of the odds
MET Met proto-oncogene (hepatocyte growth factor receptor)
MRC Medical research council
M U C I-7 The human mucin genes
MVR Minisatellite variant repeats
NIH National institute for health
OFAGE Orthogonal field-alternating gel electrophoresis
PAIl Plasminogen activator inhibitor, type I gene
PEM Polymorphic epithelial mucin
PFGE Pulsed field gel electrophoresis
PGM Phosphoglucomutase
PI Propidium iodide
PMSF Phenylmethylsulfonylfluoride
PUM Peanut lectin binding urinary protein
RFLP Restriction fragment length polymorphism
RT Reverse transcriptase
SDS Sodium dodecyl sulphate
SSCA Single stranded conformation analysis
TCRB T-cell receptor, beta cluster
TCRG T-cell receptor, gamma cluster
16
TEMED NNN'N'-Tetramethylethylenediamine
TH Tyrosine hydroxylase gene
TRITC Tetramethylrhodamine isothiocyanate
UVP Universal vectorette primer
VNTR Variable number of tandem repeats
vWF von Willebrand factor
YAC Yeast artificial chromosome
17

Acknowledgements
I would like to thank my supervisor. Dr. Dallas Swallow, for her advice,
support and encouragement during my time in the MRC Human Biochemical
Genetics Unit.
I would also like to express my appreciation of the friendship and help I
received from all my colleagues in the Galton laboratory. In particular I thank the
colleagues whose collaborative work I have included: Wendy Pratt for help with the
Southern blots and the sequencing; Lynne Vinall for sizing of the major MUC3
alleles; Yangxi Wang for help with the RT-PCR; Margaret Fox for introducing me to,
and assistance with, fluorescent in situ hybridisation; and John Attwood for his
invaluable help in the construction of the genetic maps of chromosomes 7 and 11.
I also wish to acknowledge the collaboration of: Dr. Jim Gum who provided
many of the clones used and sequence data, without which much of this work would
not have been possible; Dr. Jean-Pierre Aubert and Nicole Porchet for providing
clones for MUC5, used in the work described in chapter 3, and physical mapping data
of the region 1 Ip 15; Dr. T heda Lesuffleur for providing the clone L31 used in the
work described in chapter 3; Dr. Stephen Scherer and Dr. Eric Green who isolated the
YAC clones from chromosome 7, the characterisation of which is described in
chapter 4 and Dr. Soreq and Dr. Getman who supplied the cosmid clones containing
ACHE used in the work also described in chapter 4.
I acknowledge CEPH and EUROGEM for the family DNAs and the MRC
Human Genome Mapping Project for providing the studentship as well as other
support.
18

1. Introduction
This thesis is concerned with the physical and genetic mapping of human
mucin genes. The introduction is divided into two sections; the first part deals with
genetic polymorphism and the various techniques used for mapping and in the second
part mucin glycoproteins and the genes which correspond to specific mucins in
humans and other organisms are considered.
1.1. Genetic variation in humans
The classical definition of a polymorphism is a variable characteristic for
which the frequency of the variant allele in the population is greater than that
produced by random mutations. This is commonly accepted to be when a variant
allele is detected at a frequency of at least 1 in 50 for a population of unrelated
individuals. Prior to gene cloning it was already clear that polymorphisms could be
detected in many proteins and that distinct allele products could be separated by
electrophoresis on the basis of their surface charge differences as in the case of
phosphoglucomutase (PGM) for example (Spencer et a i 1964). The basis of most of
these polymorphisms is variation in the coding region of the gene, which lead to
amino acid substitutions which may or may not have functional consequences. There
are an even larger number of polymorphisms in non coding DNA most of which have
no functional significance.
The recent advances in techniques for analysing DNA has led to a rapid
increase in the number of polymorphisms which can be used as markers and for other
genetical purposes such as the construction of maps. The first type o f DNA
polymorphism detected was the restriction fragment length polymorphism (RFLP).
These polymorphisms are usually caused by small scale changes in the DNA such as
base substitutions and deletions which cause changes in the recognition sequences of
19
restriction enzymes resulting in restriction fragments of altered size (Jeffreys 1979;
Cooper et al. 1984). The nature of this type of polymorphism means that there are
usually only two alleles which in turn means that the maximum heterozygosit/is only
50% and is often less. The likelihood of detecting an RFLP at a given locus is quite
low: it has been estimated that the mean heterozygosity of human DNA is about
0.001 per nucleotide and many mutations will not result in the alteration of a
restriction site (Jeffreys 1979). Furthermore it is often impractical to screen with an
exhaustive selection of enzymes.
More recently a number of other techniques have been developed to detect
point mutations. One such method, single stranded conformation analysis (SSCA),
relies on the fact that single stranded DNA will take up various conformations
dependent on its sequence (Orita et al. 1989). These different conformations may
have different electrophoretic mobilities. A second method, denaturing gradient gel
electrophoresis (DGGE), is also dependent on differences in electrophoretic mobility
of DNA of the same size but slightly different sequence (Myers et al. 1985). In this
case the DNA is left double stranded and is run on an acrylamide gel which contains a
gradient of a denaturing chemical such as formamide. As the DNA moves through
the gel it will start to melt at a particular point in the gradient and there will be a sharp
reduction in electrophoretic mobility. This melting is determined by the sequence of
the regions with the lowest melting points. These techniques have been particularly
useful for identifying disease causing mutations and have occasionally been very
useful for revealing additional heterozygosity (Johnson et al. 1992; Harvey et al.
1995).
The discovery of hypervariable regions, often referred to as 'minisatellites’, in
human DNA gave a significant boost to the genetic analysis in humans (Jeffreys et al.
1985). A number of these loci were found close to genes such as HRAS* and
COL2Al^ (Capon et al. 1983; Stoker et al. 1985). These hypervariable regions are
composed of tandem repeats of short sequences and the different alleles are the result
^Heterozygosity = 1 - ^(population frequencies of the alleles)^. Allele frequency = IN/2N, where Nj is the number of i alleles and N is the total number of alleles.
* Harvey rat sarcoma viral oncogene homolog, ^Collagen, type U, alpha 1.20
of variation of the number of these tandem repeats (VNTR). The number of alleles
detected for minisatellites ranges from 6 to 80 (Sykes et al. 1985; Balazs et al. 1986).
The repeat units of one set of minisatellites contain core sequences which are
conserved over a number of loci scattered throughout the genome and can be detected
with a probe for this sequence at low stringency (Jeffreys et al. 1985). This approach
can be used in order to produce a pattern of bands which is specific for an individual
i.e. a 'genetic fingerprint' but this is not useful for linkage. However the use of probes
which are specific for a particular minisatellite locus where the allelic relationships
can be determined are useful for linkage studies (Nakamura et al. 1987; Wong et al.
1987).
There is also a further source of variation within these loci, namely small
sequence differences between the repeats (Jeffreys et al. 1990). These minisatellite
variant repeats (MVRs) are nucleotide substitutions (and other changes) distributed
along the minisatellite. Sequence analysis of the locus 5' to insulin has shown up to 9
MVRs per VNTR allele. The variable distribution of these MVRs and their ability to
be analysed using PCR based techniques means that the informativeness of a locus is
greatly enhanced (Jeffreys et al. 1991). Analysis of the allelic variation of these loci
has revealed a remarkably high mutation rate of up to 15% per gamete (Vergnaud et
al. 1991).
The precise mechanism involved in producing these mutations is not yet fully
understood but the lack of recombination in closely linked flanking markers suggests
that it is unlikely to be due to unequal crossing over between homologous
chromosomes during meiosis (Wolff et al. 1988; Wolff et al. 1989; Vergnaud, Mariat
et al. 1991). Detailed analysis of the structure of mutant minisatellite alleles and the
non reciprocal nature of the exchange of repeats indicates that processes such as
slippage during replication, gene conversion and unequal sister chromatid exchanges
are involved (Jeffreys, Neumann et al. 1990; Armour et al. 1993; Berg et al. 1993;
Desmarais et al. 1993; Buard et al. 1994; Jeffreys et al. 1994). Further analysis of the
distribution of MVRs showed that in some loci there was a certain polarity i.e. the
21
MVRs of each different type are clustered together at one end, although this is not
true in all cases and may suggest different processes are involved in generating and
maintaining these polymorphisms (Neil et a l 1993; Armour et al. 1996).
Since the discovery of minisatellites other types of VNTR have been
described such as di, tri and tetra nucleotide repeats (Weber et al. 1989; Edwards et
al. 1991). These have proved very useful as they can often be typed using PCR based
techniques, which enables large numbers of samples to be screened relatively easily
and quickly. These sites have proved very useful as sequence tagged sites (STS) for
the human genome mapping project.
The advances in both the different types of DNA polymorphisms and the
techniques for analysing them have had a dramatic effect on the mapping of the
human genome especially with respect to linkage analysis.
1.2. Human gene mapping
Some of the first genes mapped were X linked because of the ease of
interpreting the segregation in families. This includes the Xg blood group (Mann et
al. 1962). The first genes were mapped to the autosomes using somatic cell hybrids
together with linkage analysis and analysis of cytogenetic abnormalities. Once the
first cDNAs had been cloned regional assignm ents were made by in situ
hybridisation. Further refinements to these techniques and the recent advances in
molecular genetics has led to the generation of information ranging from maps of
whole chromosomes to the structure and sequence of individual genes. These and
associated techniques will be discussed in this section.
1.2.1. Linkage analysis
Linkage analysis is used to measure the extent of non independent segregation
of loci in families. In order to detect linkage the loci must show a detectable variation
which is inherited and at least one of the parents must be doubly heterozygous for
22
each pair of loci to be tested. If we consider the simplest case of two loci on the same
chromosome that are close to each other and suppose that one locus has the alleles A
and a and the other locus has the alleles B and b, then if the parent has the alleles AB
on one chromosome and ab on the homologous chromosome the offspring will inherit
either AB or ab from that parent. If the loci were on different chromosomes (not
linked) then there would be equal numbers of AB, ab, Ab, aB offspring.
However in practice even when loci are linked some offspring with the
genotype Ab or aB may be detected due to exchange of genetic material by
recombination at meiosis. Meiotic recombination happens at a relatively low rate,
somewhere between 0 and 3 recombinations per chromosome. This means that many
of the chromosomes inherited by the offspring will be a mixture of each of the
parent’s pair of homologous chromosomes. The position on the homologous
chromosomes where recombination occurs is variable, though it appears not to be
entirely random. So although most individuals will have recombinations between
different loci, in the population as a whole there does seem to be localised clustering
or 'hot spots' of recombination. However for linkage analysis it is assumed that
recombination is a random process.
Although the phenomenon of recombination means that two loci on the same
chromosome separated by a large distance will almost inevitably be separated by a
recombination and thus not appear to be linked, information about the distance
between linked loci can be obtained. For example, if one again considers the simplest
case of two loci on the same chromosome, then the further apart the loci are the
greater the chance that a recombination will take place between them. Therefore in a
population the number of recombinants compared to non recombinants for two
particular loci is related to their physical separation. The term recombination fraction
describes the proportion of the total number of offspring that are recombinants and is
a measure of genetic distance.
The detection of linkage and the measurement of recombination fractions
between loci is easier in organisms such as mice as opposed to humans because the
23
mating can be controlled so that the family is fully informative for the loci being
tested. Also they tend to have large families and short generation times which
enables statistically significant results to be obtained from a few families in a short
space of time.
The inability to carry out crosses between humans means that the population
must be searched in order to find families which are informative for the loci being
tested. In addition the small size of human families means that the results from a
number of families need to be pooled in order to get a statistically significant measure
of the recombination fraction between loci. These problems are further complicated
by the long generation time which means that it is unlikely that an investigator would
be to be able to observe more than three generations.
The data obtained from three generation families is extremely useful as the
phase of loci can be deduced i.e. which alleles for the loci co-segregate from
grandparent to parent. This means that the amount of recombination in the children
can be directly determined. However three generation families which are informative
for the loci being tested are often either not available or are too few to give
statistically significant data. Indeed often only two generations are available for
study and because the phase of these families is not known the amount of
recombination in the children cannot be directly measured. However various
statistical methods have been devised in order to determine the recombination in
families indirectly.
The most commonly used statistical method is that of lod scores which
enables the data from two and three generation families to be combined (Morton
1955). This method not only detects linkage but also gives a measure of the
recombination fraction. The lod score is a measure of the likelihood that you would
obtain the offspring observed if the loci are linked compared with the loci not being
linked at a given recombination fraction and can be calculated using the equation:
Z(0)=loglO [L(0)/L(l/2)] where Z=the lod score, 0= the recombination fraction and
24
L=the likelihood. Usually the lod scores for a range of values of 0 are calculated and
the highest value of Z (Zmax) taken to be the lod score for the particular loci at the
corresponding recombination fraction. The main advantage of lod scores is that the
data from different families can be combined by simple addition of the Z values.
Traditionally the Z values were obtained using tables devised by Maynard-Smith,
Penrose and Smith, although these only dealt with families with up to 7 children
(M aynard-Smith et al. 1961). The development of computer programs such as
HANDLINK (written in this laboratory by J. Attwood) has enabled families of any
size to be analysed. A lod score of 3 is often accepted as the minimum value at which
two loci are considered to be linked i.e. there is a 1 in 1000 chance that they are not
linked. Although under certain circumstances, such as if there is physical data to link
the loci, then a lod score of less than 3 will be acceptable. Conversely if a genome
wide search for linkage is undertaken then there is a chance that false linkages with
lod scores of 3 will be detected and some researchers suggest that a minimum lod
score of 4 is more appropriate in this instance.
So far I have only considered the case of two loci. However the information
obtained from linkage analysis can be used to predict the order of multiple loci on a
chromosome i.e. multipoint analysis. Again because of the ability to perform
controlled mating in mice for example, multi locus maps can be constructed relatively
easily by examining the recombination patterns of the offspring. The situation in
humans is complicated because, often when considering a number of loci, not all will
be informative in the family. Indeed the more loci considered the greater the
likelihood of uninformative loci in any particular family. This means that to obtain a
reliable order for the loci under test, data from a large number of families needs to be
combined, and even then the deduced order will only be the one with the highest
probability based on that particular data set within a given set of parameters. The
complexity of the calculations involved meant that the manual construction of large
scale maps of chromosomes was not practical and it was only the advent of computers
which made this a realistic possibility.
25
The process of linkage and multipoint analysis has been greatly enhanced by
the availability of resources such as DNA from the 60 large families collected by the
Centre d'Etude du Polymorphisme Humain (CEPH) and the development of powerful
computer programs such as CRI-MAP (Donis-Keller et al. 1987). CRI-MAP is in
fact a collection of programs for the manipulation and analysis of family data, which
can be selected from the various options presented in the main menu. The main
purpose of CRI-MAP is the construction of multi locus genetic maps using the
multipoint analysis program 'build'. The program first orders the loci being tested in
order of their informativeness i.e. the most informative meioses. The two most
informative loci are then used as the basis for the map. It then tries to insert the next
most informative locus by creating three new orders with the locus in one of the three
possible positions in each order. The maximum log likelihood is then calculated for
each order by varying the distances between all the loci. If one order with the locus
has a log likelihood of greater than a predetermined threshold, usually three,
compared to the other orders then this order is chosen and used for the next locus. If
none of the orders has a log likelihood of greater than three compared to the others
then the locus is left out and the program moves onto the next locus. This process is
repeated until all the chosen loci have been tested. Then using the option 'flips' the
local support of groups of markers in the order from the build output can be checked.
This is done by comparing all the different permutations of groups of up to 5 markers
to see if an alternative to the original order of this group is more likely i.e. increases
the overall likelihood of the whole order. The option 'twopoint' allows you to
calculate LOD scores for pairs of loci. The option 'chrompic' is able to create
diagrams of the chromosomes which show the parental origin of the allele and thus
the meiotic breakpoints. The ability to identify specific meiotic breakpoints in
individuals is very useful as it enables the rapid positioning of loci within a pre
existing order without having to rebuild the whole map again.
26

Genetic maps have now been generated for all the 22 human autosomes and
the X chromosome. Much of this work has been carried out by dedicated centres
such as GENETHON, EUROGEM and the CEPH consortium.
1.2.2. Somatic cell hybrids
Somatic cell hybrids have proved to be a useful tool for the localisation of loci
to specific chromosomes and even to particular regions on the chromosome.
These hybrid cells are produced by fusion of human cells with permanent
rodent cell lines. This mapping technique exploits the fact that there is loss of whole
human chromosomes or fragments of chromosomes from the fused human/rodent
hybrid cell lines (Ruddle 1973). In the early studies the presence or absence of a
specific human gene product was correlated with the presence of absence of a
chromosome. More recently however Southern hybridisation and PGR techniques
have been used in order to determine the presence or absence of genes by testing the
DNA directly.
Hybrid cells are produced by mixing the human cells with the rodent cells in
the presence of polyethylene glycol or Sendai virus to enhance the fusion process.
Various selection techniques are used in which only the hybrid cell line can survive,
one of the most popular being the HAT selection system (Littlefield 1964). When the
fused cells divide human chromosomes are lost. After several rounds of division the
cells stabilise and stop losing human chromosomes and clones can be isolated. Each
clone used to establish a cell line contains a different selection of human
chromosomes. In order to assign a locus to a single chromosome a panel of cell lines
is usually studied and the presence or absence of a particular locus in the various cell
lines can then be correlated with the presence or absence of a chromosome
throughout the same panel. However a number of single human chromosome hybrids
are also available which often avoids the testing of an extended panel of hybrids.
Hybrids which contain translocated chromosomes and X-ray induced
chromosome fragments are useful in increasing the resolution of the localisation of
27
loci (Burgerhout et al. 1973). The presence or absence of a particular locus in
hybrids which contain a fragment of a chromosome characterised by defined
breakpoints can be used to provide a regional assignment for that locus, though the
interpretation of results from these hybrids can sometimes be difficult because the
rearrangements which take place are quite complex. The results obtained from
hybrids containing X-ray irradiated chromosomes can be used to give a measure of
the distance between syntenic loci (loci that are on the same chromosome but are not
linked) because the frequency with which loci are separated is proportional to the
distance between them. The data can then be used in much the same way as
recombination fractions to determine an order of loci along the chromosome. Indeed
a recent map containing 6000 genes was constructed using radiation hybrids (Schuler
et al. 1996).
Somatic cell hybrids have to some extent been superseded by the development
of In situ hybridisation which will be discussed in the next section. However this
technique still provides a relatively cheap and in conjunction with PCR rapid method
of mapping loci, and is sometimes preferable for mapping cDNAs.
1.23. In situ hybridisation
The major application of In situ hybridisation for mapping purposes is the use
of DNA probes to localise homologous sequences with respect to the banding patterns
produced by the chromosome staining procedures. The classic chromosome stain
used was Giemsa. A reproducible pattern of light and dark bands along metaphase
chromosomes can be seen when viewed with a high power visible light microscope
and is commonly referred to as G banding (Seabright 1971). The combination of the
number and thickness of the bands produced is specific for each of the chromosomes.
This can be used to distinguish each pair of homologous chromosomes from the
others and divides the chromosome into defined regions. More recently however the
DAPl (4, 6-diamino-2-phenyl-indol) stain has been used which is fluorescent and is
visualised using a UV light source. The banding patterns are also useful in
28

identifying translocations and the presence of extra chromosomes. In addition to
hybridisation to metaphase chromosomes, interphase nuclei and stretched chromatin
are also used for particular applications.
The first probes used were radioactively labelled but these days they are
usually fluorescently labelled. One detection method uses avidin conjugated with a
fluorescent dye, usually FITC (fluorescein isothiocyanate), to detect the biotinylated
probe, although some workers use degoxygenin and others use probes directly
labelled with fluorescent dyes. The use of fluorescent dyes has meant that by using a
different colour such as TRITC (tetramethylrhodamine isothiocyanate) two or more
probes can be used simultaneously. Multiple probes labelled with different dyes can
be used for measuring the physical distance between two loci and determining the
order of loci directly on the chromatin (Trask et a i 1989). The chromosomes and
probes can then be visualised using a UV illuminated microscope, although more
recently confocal laser microscopes and CCD (charged couple devices) cameras have
enabled the data to be fed directly into computers for image analysis. One of the
most useful aspects is the ability to depict the chromosomes in one colour and the
signal from the probe or probes in other distinct colours. Until recently it was only
possible to visualise different probes with two different colours. However with the
developm ent o f cooled CCD cameras, which are more sensitive, and more
sophisticated image analysis programs different probes can be distinguished on the
basis of the proportions of the two colours with which each probe has been labelled.
The computer will then display the signal from each probe as a different 'false' colour.
In situ hybridisation has not only been extremely useful for mapping
applications in terms of chromosomal localisation of loci, it is also a useful tool for
checking the integrity of clones, especially YACs, which seem to suffer from
relatively high levels of chimerism.
1.2.4. Cloning
29

The size of the human genome has been estimated to be around 3x10^ base
pairs (bp) and the genes are thought to occupy approximately 5% (Fields et al. 1994).
It also been estimated that there are between 50 000 and 100 000 genes, so in order to
study and manipulate genes and other regions of interest it is extremely useful to be
able to isolate specific sequences from the rest of the genome. The usual approach is
cloning where fragments of DNA are inserted into a vector which enables the DNA to
be taken up by a host organism, usually bacteria. The bacteria will then replicate the
recombinant vector as it divides and large amounts of the desired DNA fragment can
be recovered from a culture of the transformed bacteria. Clones are usually isolated
by screening libraries comprised of a large number of different clones that as a whole
represent the entire sequence of the DNA used in its construction.
1.2.4.1. cDNA clones
Complementary DNAs (cDNAs) corresponding to the exon sequences of
genes are frequently isolated from expression libraries using antiserum raised against
the gene of interest. Alternatively they can be screened by colony or plaque
hybridisation with a radioactive DNA/RNA probes or antibodies. When choosing a
library the expression pattern of the gene should be considered because screening a
library of a tissue with a high level of expression will increase the chances of
isolating a clone containing the desired sequence. The positions of intron/exon
boundaries can be determined by comparison of cDNA sequences and genomic
sequences.
1.2.4.2. Genomic clones
Genomic clones are important in the study of the genetic structure of a gene as
they contain not only the coding regions but the noncoding regions such as introns
and promoter regions. The classical method of obtaining genomic clones is the
30

screening of libraries with cDNA clones. Libraries of genomic clones are also useful
for the positional cloning of genes by chromosome walking.
The two most commonly used vectors for construction of genomic libraries
during the time frame of this project were cosmids and YACs (yeast artificial
chromosomes), which are useful because of their relatively large insert size of
approximately 50kb and up to 1Mb respectively. However in the last few years the
reliability of Y AC clones has come into question. This is due to the discovery of a
relatively large proportion of clones in the libraries being representative of
recombinant events between quite unrelated sequences; indeed some Y AC libraries
have been estimated to be as much as 40 to 60% chimera's. The use of FISH to
identify chimeric clones has alleviated this problem to a certain extent but is not
suitable for identifying deletions or duplications of sequences. These limitations have
led to the development of new vectors such as PI and BACs (bacteria artificial
chromosomes) which have a capacity of about lOOkb.
A useful genomic DNA library would probably contain a range of random
overlapping fragments with a size of greater than about 20kb, Such libraries may be
constructed from total genomic DNA or from selected regions such as single human
chromosomes sorted using FACS (fluorescent automated chromosome sorting)
machines. The larger the insert size, the fewer the number of clones which need to be
screened in order to obtain the desired sequence coverage. The cloning of large
amounts of flanking sequence is especially useful for identifying control regions such
as promoters and for chromosome walking applications. The standard method of
producing these fragments for cosmid libraries is to do a partial digest using Sau3A.
In the case of YACs the process is similar except that the restriction enzymes used cut
less frequently i.e. Notl or Smal. The large size of inserts has made it possible to
create gridded arrays of libraries in microtitre well plates where each well contains a
single clone. This can then be screened by either making gridded filters which can be
hybridised with radioactively labelled probes or PCR of pools of clones organised in
such a way that the well position of the positive clones can be identified.
31
1.2.4.3. Other vectors used in the manipulation and sequencing of cloned
DNA
Once clones which contain the sequences of interest have been obtained they
are often subcloned into plasmid based vectors which can be more easily cultured and
the sequence of interest recovered. Plasmid based vectors such as the pUC series are
often used for applications such as making probes for hybridisation and detailed
restriction mapping. These are double stranded, have a multiple cloning site and can
easily be propagated in E.coli. There is also class of vectors called phagemids which
have two origins of replication; one derived from Col E l and the other from the fl
phage. Normally the Col E l origin is used for plasmid replication, however in the
presence of phage fl infection the other origin is used and the plasmid is replicated as
single stranded DNA. One of the most popular phagemid clones is the pBluescript
series which also has T7 and T3 phage promoters either side of the multiple cloning
site which allow expression in either orientation. The M l Bmp series of vectors based
on M13 filamentous coliphage have routinely been used for sequencing because the
DNA is single stranded which means there is no interference from the complementary
strand. These vectors are still popular when large amounts of DNA are to be
sequenced but recent advances in sequencing has enabled high quality sequence to be
obtained from double stranded DNA with relative ease.
1.2.5. The polymerase chain reaction (PCR)
Recently the polymerase chain reaction (PCR) has allowed the development
of techniques which enable specific sequences to be amplified and has increased the
repertoire of approaches to gene characterisation and sequencing. The main
advantages of PCR are the speed and ease with which specific fragments of DNA can
be amplified. However there are limitations, of which the most important is the
requirement of fairly detailed sequence information.
32
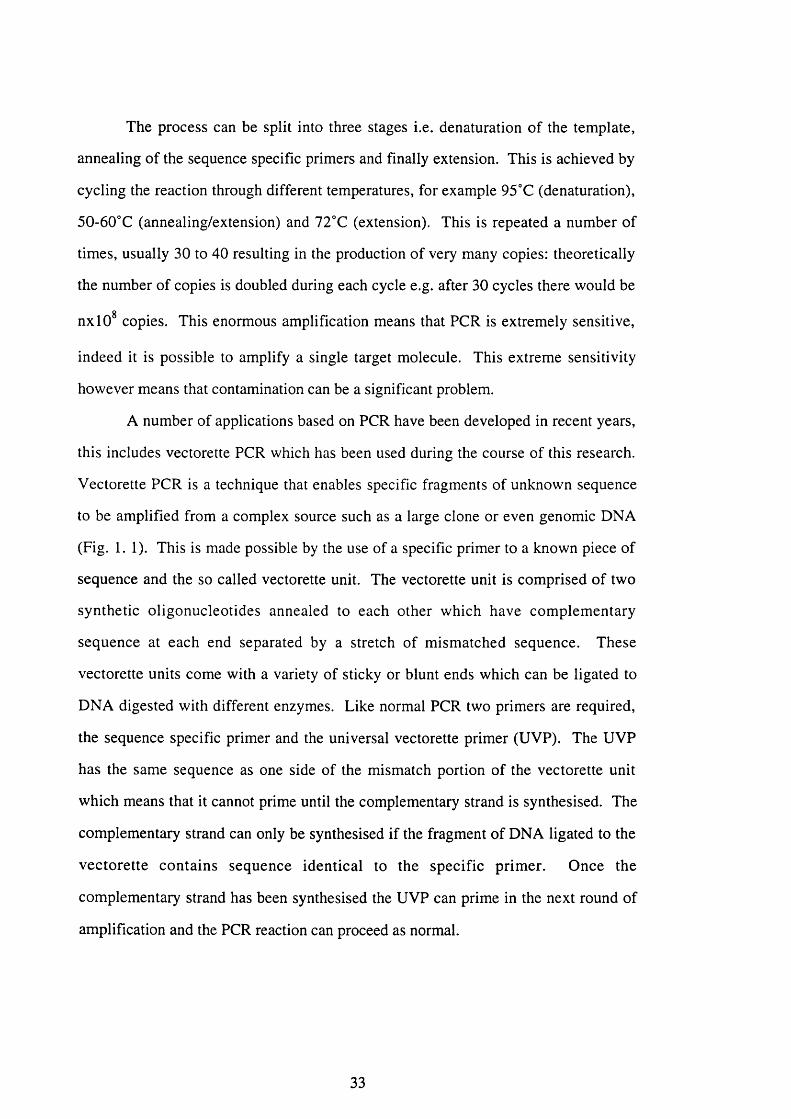
The process can be split into three stages i.e. dénaturation of the template,
annealing of the sequence specific primers and finally extension. This is achieved by
cycling the reaction through different temperatures, for example 95“C (dénaturation),
50-60°C (annealing/extension) and 72°C (extension). This is repeated a number of
times, usually 30 to 40 resulting in the production of very many copies: theoretically
the number of copies is doubled during each cycle e.g. after 30 cycles there would be
nxlO^ copies. This enormous amplification means that PCR is extremely sensitive,
indeed it is possible to amplify a single target molecule. This extreme sensitivity
however means that contamination can be a significant problem.
A number of applications based on PCR have been developed in recent years,
this includes vectorette PCR which has been used during the course of this research.
Vectorette PCR is a technique that enables specific fragments of unknown sequence
to be amplified from a complex source such as a large clone or even genomic DNA
(Fig. 1.1). This is made possible by the use of a specific primer to a known piece of
sequence and the so called vectorette unit. The vectorette unit is comprised of two
synthetic oligonucleotides annealed to each other which have complementary
sequence at each end separated by a stretch of mismatched sequence. These
vectorette units come with a variety of sticky or blunt ends which can be ligated to
DNA digested with different enzymes. Like normal PCR two primers are required,
the sequence specific primer and the universal vectorette primer (UVP). The UVP
has the same sequence as one side of the mismatch portion of the vectorette unit
which means that it cannot prime until the complementary strand is synthesised. The
complementary strand can only be synthesised if the fragment of DNA ligated to the
vectorette contains sequence identical to the specific prim er. Once the
complementary strand has been synthesised the UVP can prime in the next round of
amplification and the PCR reaction can proceed as normal.
33
STEfr 1. ligi^ion o f v « c io r € tt« ijnit to Ol^A (qenom io Of o4or*i(j) d tg est& j w th a so ita t le r e r tr ic tc nenzyfftt.
ST AOE 2 . Dirir^g ?he first round of omplficjticfl wily Ihc spcolfw primer (r^d jrro v ) ts jbit to oriic^l, Thtf s /rrfh « is< -; tho coffifrfemantary s lra M 1o e re (id» of ihe ta rg e t Du A and tfie b ja ted s tra n d of the v e o to ra tta iwii^dluj the finsntalc^i region
ST aOE S In th? M cond rovng of arnpAfioation the v e c to re tte prin ter wt«ch has dent»cal sev jen ce to tt-e m sm atch fé? ;io n can m neat to the corrp lw nentary s tra n d pruned by ‘Jte specific prim er and the re v e r s e strand is synthesised
f
Figure 1.1.
ST AGE 4 O irin j fub fagu en t ari^ibiication c/cAas a specafic p ro d jc t is amplir’teiJ n the o s w l v a y .
Diagrammatic representation of the vectorette PCR process. The complementary
strands are depicted in red and black. The mismatch strand of the vectorette unit is
depicted in green. The specific primer is represented as a red arrow and the universal
vectorette primer is represented as a black arrow.
34

1.2.6. Restriction enzyme analysis of DNA
Restriction enzymes are used to cut DNA at specific sites into different sized
fragments which are separated on agarose or acrylamide gels. The fragments
produced by different restriction enzymes cover a range of sizes from a few hundred
bases to a few megabases. The length and sequence specificity of the restriction site
determine the frequency with which the DNA will be cleaved. For example BamHI
which has the recognition sequence GGATCC would on average cut a random piece
o f DNA every 4000 nucleotides. However in practice the size of fragments is
extremely variable: in the case of the phage X genome, of 48.5kb in size, there are
only 5 sites which is a reflection of the GC content being somewhat less than 50%.
The less frequently cutting enzymes tend to have longer recognition sequences and
some such as Notl only have G and C in the recognition sequence and produce
fragments of around 500bp to 1Mb when human genomic DNA is digested.
Restriction enzymes which produce fragments of 50kb or more are often referred to
as rare cutters. Restriction enzymes such as Notl are useful for identifying potential
CpG islands because the recognition sequence is composed of G s and C's. CpG
islands are regions in the genome that are relatively undermethylated and have a high
GC content with a higher proportion of CpG than the rest of the genome. These
regions are often associated with the 5' ends of genes (Craig et al. 1994)).
Some restriction enzymes are sensitive to méthylation of the DNA which
results in either increased or decreased efficiency of cleavage. The méthylation of
DNA can result in partial digestion of the DNA which can be useful for map
construction and can show the relative positions of two or more restriction sites for
the same enzyme. However if the partial digestion is a problem then the use of
different cell lines which will have different méthylation patterns can help. K562 as
chosen in this project as it is considered in general to be relatively undermethylated
(Guyonnet-Duperat 1993). Isoschizomers are useful pairs of enzymes which
35

recognise the same restriction site but in which the action of one is not affected by
méthylation.
Because the size of fragments produced by the various restriction enzymes
ranges from tens of bases to a number of megabases, different electrophoresis
conditions are used i.e. standard agarose or acrylamide electrophoresis and pulsed
field gel electrophoresis (PFGE).
Standard electrophoresis uses a gel comprised of buffer and agarose or
acrylamide to act as a molecular sieve through which molecules, in this case DNA
fragments, migrate at different rates depending on size, when an electric field is
applied. In general the larger the fragment the slower it will move through the gel.
The concentration of the gel is also important as the DNA can move more easily
through lower percentage gels, with low percentage gels more suitable for the
resolution of larger fragments. For example the most commonly used concentrations
of agarose gels ranges from approximately 0.8% to 3% and the range of sizes which
can be realistically resolved using standard agarose gel electrophoresis is
approximately 200bp to 40 OOObp. Below 200bp acrylamide gels are used as they can
separate fragments that differ in size by a single nucleotide.
Under standard electrophoresis conditions the agarose gel matrix seems
unable to resolve fragments above approximately 50kb with the result that these large
fragments appear to co-migrate through the gel. However separation of DNA up to a
number of megabases can be obtained using pulsed field gel electrophoresis (PFGE).
Essentially this technique relies on alternating the direction of the electric field across
the gel. The current theory is that when the direction of the field is changed the DNA
must reorientate in order to move in a new direction through the gel and the larger the
fragment the longer the reorientation time. However there is no definitive model
which describes accurately the processes involved and the interactions that occur
between the DNA and gel matrix during PFGE. Indeed the precise nature of the gel
itself is not yet fully understood. However a number of systems have been developed
to exploit this phenomenon. The simplest is field inversion gel electrophoresis
36
(FIGE) in which the standard two electrode configuration is used (Carle et al. 1986).
The direction of the electric field is periodically inverted with the time in the desired
direction for migration of the DNA being longer. However the resolution range of
this technique is still fairly limited with an upper limit of about 700kb. If the
alternating electric fields are at an angle to the net direction of migration a larger
range of sizes could be resolved (up to many megabases). One of the most popular
systems is contour clamped homogeneous electric fields (CHEF) (Chu et al. 1986).
The electrodes are arranged hexagonally to create an electric field which is very even
across the gel at an angle of 120°. The direction is then switched from one side to the
other for equal lengths of time so that although the DNA zig zags down the gel, the
net result is a fairly straight run in contrast with other systems such as orthogonal
field-alternating gel electrophoresis (OFAGE) (Carle etal. 1984).
In order to identify individual restriction fragments in genomic DNA so called
Southern blots of these gels can be hybridised with specific probes ranging in size
from a few tens of bases to hundreds of kilobases. The DNA is immobilised onto a
solid support of either nitrocellulose, or more commonly now, robust nylon
membrane. The DNA can be transferred onto the membrane by a number of methods
i.e. capillary blotting, electroblotting or vacuum blotting. Once the DNA has been
fixed to the support it can be hybridised with a radioactively labelled probe which
will detect all the fragments with homologous sequence. The size of the fragments
can be determined by comparison with a molecular size standard.
The construction of all restriction maps is in principle the same. The DNA is
cut with a number of different enzymes and the sizes of the fragments detected
determined. This will show the distance between pairs of the same restriction sites.
Then double digests are done where the DNA is digested with two different enzymes
to show were there is a restriction site for one enzyme within a fragment produced by
another enzyme. The relative order of the fragments can then be determined by
constructing a model which fits all the data, the model can then be added to or
changed as new data becomes available. The position within the map of specific
37
sequences of interest and their orientation can be determined by Southern analysis.
The construction of detailed restriction maps for cloned DNA is more straightforward
than for genomic DNA because all the fragments produced by a particular enzyme
will be seen, not just those with homologous sequence to a probe used on a Southern
blot. The scale of a particular restriction map is dependent on the enzymes used and
the source of DNA. Fairly detailed maps of single genes tend to be constructed by
the digestion of clones with four and six cutters. However by using restriction
enzymes, such as Notl, and PFGE the approximate physical distances between loci
and their order over a region of a few megabases can be determined.
1.2.7. Sequencing
There are a number of techniques which have been developed in order to
determine the precise nucleotide sequence of DNA but the most commonly used
techniques are based on the chain termination method developed by Sanger (Sanger et
al. 1977). The basis of this technique is the use of 2', 3'-dideoxyribonucleoside
triphosphates (ddNTPs). When these ddNTPs are incorporated into the strand being
synthesised they are unable to form phosphodiester bonds which results in
termination of synthesis of that particular strand. By adding a small amount of a
specific ddNTP to a reaction containing all four deoxyribonucleoside triphosphates
(dNTPs) the ddNTP will be incorporated in a random manner. This will create a
range of different sized fragments all of which have the particular ddNTP at their 3'
end. The use of a specific primer ensures that synthesis will start at the same place
each time.
In order to sequence a piece of DNA four reactions must be done where each
reaction contains one of the four ddNTPs. The products are detected by either
incorporating a radioactively labelled dNTP, using fluorescently labelled ddNTPs or
dNTPs or by labelling the sequencing primer. The products are then run in four
adjacent lanes on an acrylamide gel to separate the fragments. Each lane on the gel
will show the relative positions of the dNTPs in the template, which correspond to the
38

specific ddNTP used in that particular reaction. Comparison of the four lanes enables
the sequence to be determined by noting in which of the four lanes the next largest
fragment is found.
Two of the most significant developments in sequencing over the last few
years is the development of fluorescent labels which has enabled the automation of
sequencing and cycle sequencing. Several systems for fluorescent automated
sequencing have been developed. One system utilises four differently coloured labels
in which each colour corresponds to one of the four bases, meaning that all four
reactions can be run in the same, lane which counteracts differences between the
speed of migration which can vary across the gel.
Cycle sequencing is based on PCR although the enzyme used is not Taq but a
thermostable version of Sequenase v 2. The main advantage is that comparatively
small amounts of DNA are required for the reaction e.g. traditional sequencing
usually required 1 to 2 |ig of template where as cycle sequencing needs as little as
0.1 |ig of template.
39
1.3. Mucins
Mucins are a major component of the visco-elastic mucus gels coating the
epithelium of a variety of tissues. They are high molecular weight glycoproteins of
which 50% to 80% is composed of carbohydrate side chains. The mucus secreted by
particular tissues is usually comprised of a number of different mucins. The physical
and chemical properties of the mucus gel are probably determined by the mucin
composition. The function of these mucus gels are thought to include lubrication,
protection from proteolysis, maintenance of tissue hydration and to act as a barrier to
potentially harmful chemicals and organisms (Allen 1984; Rose 1992).
The analysis of mucin glycoproteins using classical biochemical techniques
has proved rather difficult due to; the large size of the molecules, the relatively high
level of glycosylation and the heterogeneity of mucins. Much of the information
about the primary structure of mucins has come from peptide sequences inferred from
the sequence of cDNA clones corresponding to a number of mucin genes.
These glycoproteins are thought to be comprised o f highly glycosylated
regions, that are resistant to proteolysis, and relatively unglycosylated regions which
alternate along the molecule (Sheehan et al. 1991). Analysis of the amino acid
content of these molecules showed a high proportion of threonine, serine, proline,
alanine and glycine. These regions have a high proportion of hydroxyl amino acids
such as threonine and serine which are able to form 0-glycosidic linkages and may
correspond to the highly glycosylated regions of the mature protein (Van Klinken et
al. 1995). Secondly there are the so-called cysteine rich domains and it has been
suggested that some of these cysteine rich domains are involved in the polymerisation
of mucin molecules.
One area where the traditional biochemical techniques have provided a
significant amount of information is the investigation of the structure o f the
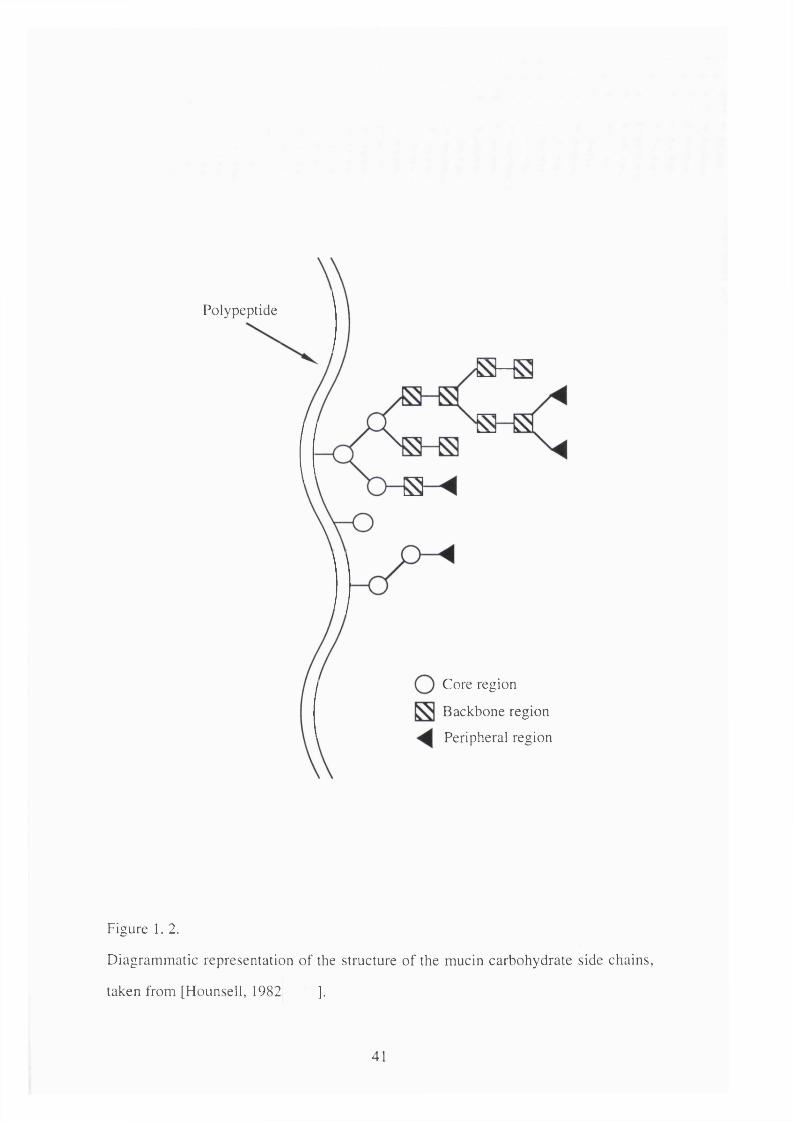
carbohydrate side chains. These polysaccharides can be considered in terms of three
domains i.e. 'peripheral', 'backbone' and 'core' regions (Hounsell,j et al. 1982)
(Fig. 1. 2).
40
Polypeptide
Core region
Backbone region
Peripheral region
Figure 1, 2.
Diagrammatic representation of the structure of the mucin carbohydrate side chains,
taken from [Hounsell, 1982 ].
41
The core regions are characterised by the a ttachm ent o f N-
acetylgalactosamine (GalNAc) to the oxygen of serine and threonine to form the O-
glycosidic linkages. Further elongation can occur with the addition of galactose (Gal)
and/or N-acetylglucosamine (GlcNAc) which result in four possible types of core
structure. The backbone consists of alternating Gal and GlcNAc residues. This can
be extended by the addition of Gal-GlcNAc units. These units can be divided into
two groups on the basis of the linkage between the Gal and GlcNAc i.e. type 1,
Galpl-3GlcNAc and type 2, Galpl-4GlcNAc.
The peripheral regions which have antigen activities analogous to the blood
group antigen H, A, B, Lewis a and Lewis b are the best characterised. The blood
group H antigen is formed by the addition of a fucose by a specific a l -
2fucosyltransferase to the terminal Gal of type 1 or 2 backbone structures or to the
Gal of the core residues. The blood group A and B antigens are formed by the
addition of GalNAc or a Gal to the H antigen. The expression of the H, A and B
antigens is regulated by the secretor gene which encodes one of two a 1-
2fucosyltransferases. Approximately 75% of the population have a functional
secretor gene which means that glycoproteins in the epithelia and secretions of these
individuals will express the H, A and B antigens found on their erythrocytes; these
people are termed secretors. Those who do not possess a functional secretor gene and
thus have a low level of al-2fucosyltransferase in epithelial cells do not express the
blood group antigens on their secreted glycoproteins. This is because the H antigen
which is required by the A and B glycosyltransferases cannot be made in these cells.
The Lewis^ antigen is formed by the attachment of a fucose to the penultimate
GlcNAc residue of a type 1 backbone structure by the Lewis enzyme. The Lewis*’
antigen is formed by the addition of two fucose residues to a type 2 backbone by the
H and Lewis enzymes. Other terminal modifications include the addition of sialic
acid residues.
42

The reason for the high level of glycosylation is not clearly understood but the
addition of these polysaccharide side chains results in extension of the molecule and
this may be important in the formation of the mucus gel matrix. Also the
glycosylation makes the molecule very hydrophilic which would obviously be vital as
mucus gels contain a large proportion of water. The diversity of these side chains
indicates that there is a possibility of interactions between micro-organisms and the
mucus gel which may play a role in colonisation of mucosae. Indeed there is some
evidence for this, for example a number of micro-organisms which include H. pylori
appear able to bind the Lewis^ structure (Essery et al. 1994).
1.4. The human mucin genes
These genes were defined by partial cDNAs isolated using polyclonal and
monoclonal antibodies raised against deglycosylated mucins to screen libraries
produced from various tissues. A number of separate gene loci which encode mucin
glycoproteins have been distinguished on the basis of their chromosomal location and
pattern of tissue expression. The mucin genes have been assigned the symbol MUC
followed by a number which relates to the order in which they were cloned. These
genes are expressed at different levels in different tissues. In most cases sequencing
of these cDNAs has revealed the presence of tandem repeats of sequence. Usually
the tandem repeats correspond to a fixed number of codons which leads to repetition
of the peptide sequence. Southern blot analysis of DNA, digested with a variety of
enzymes, using mucin cDNA probes detects a high level of polymorphism. Evidence
suggests that this polymorphism is mainly due to the occurrence of variable numbers
of tandem repeats similar to those found in the non coding "minisatellite" regions of
human DNA (Jeffreys, Wilson et al. 1985). VNTR polymorphisms have so far been
described in M UCl (Swallow et a l 1987), MUC2 (Toribara et al. 1991) and
proposed for MUC3 (Fox, Lahbib et al. 1992), MUC4 (Porchet et al. 1991), MUC6
(Toribara et al. 1993) and MUC7 (Bobek et al. 1996). In the following section which
43

describes the various mucin genes and their products, the genes which map to
chromosome 11 are considered together, because of their close proximity and
probable relationships.
1.4.1. Chromosome lq21 M UCl
M UCl is expressed in the mammary glands and many other tissues. Full
length cDNA clones have heen obtained and the gene structure is known (Gendler et a l 1990;
Lan et a l 1990). Historically this protein has had a number of different names e.g. PUM,
peanut lectin binding urinary protein, (Karlsson et a l 1983), PEM, polymorphic
epithelial mucin, (Gendler et a l 1988), episialin, formerly MAM6, (Ligtenberg et a l
1990). This mucin carries a number of antigenic determinants recognised by
monoclonal antibodies raised against tumour associated antigens e.g. G al to 3,
HMFG (human milk fat globule) 1 and 2 (Swallow et a l 1986), NCRC-11 (Price et
a l 1987). Like many of the other mucin genes subsequently identified M UCl shows
a high level of variation and even before the gene had been cloned polymorphism of
the M U C l glycoprotein had been detected using SDS polyacrylam ide gel
electrophoresis and radio-iodinated lectins (Karlssonj et al. 1983) or with a
number of antibodies which included Cal (Swallow; et al. 1986).
The cloning of M UCl and the isolation of a partial cDNA containing tandem
repeat sequence enabled the genetic basis of the polymorphism detected with C al to
be determined and was shown to be due to variation in the number of tandem repeats
(Swallow' et al. 1987).I
The M UCl polypeptide, deduced from the cDNA, is composed o f three
regions; an amino terminus consisting of a putative signal peptide and degenerate
tandem repeats, a tandem repeat region composed of 60bp repeat units encoding a 20
amino acid repetitive peptide rich in proline, serine and threonine with the consensus
sequence GSTAPPAHGVTSAPDTRPAP, the carboxyl terminus consisting of
44
degenerate tandem repeats and a unique sequence containing a transmembrane anchor
(Ligtenberg et al. 1992).
M UCl also has a genetic polymorphism due to a G/A substitution in exon 2I
which results in different splice variants (Ligtenbergj et al. 1990). The proteins
encoded by these variants have differences in the signal sequences and in the extreme
amino terminal regions of the "mature" proteins. Another polymorphism of M UCl
has been identified in the non repetitive region 3' to the tandem repeats and is the
result o f variable numbers of CA repeats in intron 6 (Pratt et al. 1996). It is
interesting to note that the common alleles of all these polymorphisms are associated
which suggests that the M UCl VNTR polymorphism is not due to the unequal
crossing over between homologous chromosomes.
The M UCl gene has been mapped to chromosome lq21 (Swallow et al. 1987;
Middleton-Price et al. 1988). Although the presence of a transmembrane anchor on
the M UCl glycoprotein and its wide pattern of tissue expression distinguishes it from
mucins as originally defined, the glycoprotein is present in secretions, this probably
results from proteolytic cleavage (Hilkens et al. 1988).
Although epitopes of MUCl glycoproteins can act as 'tumour markers' there is
now abundant evidence to show that the MUCl gene is widely expressed in healthy
tissues. Indeed it was first detected as a normally occurring urinary component in the
early studies from this laboratory (Karlsson, Swallow et al. 1983). Nevertheless the
over-expression of M UCl epitopes in cancer has considerable diagnostic applications
(Balague et al. 1995; Weiss et al. 1996). Indeed other changes in M UCl expression
have been noted such as the alternative splicing of M UCl mRNA which leads to the
loss of the tandem repeats in breast cancer, although the functional significance if any
is unknown (Wreschner et al. 1994). These observations have led to a search for a
role for M UCl and attempts to understand its significance in health and disease. To
this end a M UCl transgenic mouse strain has been developed (Peat et al. 1992). The
preliminary results from a M u d knockout mouse are rather curious as the mice
appear to be as healthy as those with a normally functioning M u d gene (Gendler et
45

al. 1994). This would seem to imply that M u d is not vital in the development of the
mouse. However if, as has been suggested, mucins are involved in defence then it
would be interesting to determine if the lack of the M u d glycoprotein makes them
more susceptible to damage from external agents.
1.4.2. Chromosome llp l5 .5 : MUC2, MUC5 and MUC6
So far four mucin genes have been localised to chromosome l i p 15. The
MUC2 gene was the first to be localised to this region using somatic cell hybrids,
linkage analysis and m situ hybridisation using the cDNA SMUC41 isolated from an
intestinal library (Griffiths 6/ at. 1990). Soon after, three clones; JER58, JER47 and
JER57 were isolated from a tracheobroncial library and were mapped to the same
chromosome band, although JER47 also hybridised to a minor BamHI fragment
which maps to chromosome 13 (Nguyen et al. 1990). Since these clones might have
come from the same gene they were provisionally given a single symbol MUC5 by
the human gene mapping nomenclature committee although more recently they have
been shown to correspond to two genes (see below). MUC6 was the mucin gene to
be most recently localised to chromosome l ip 15 by in situ hybridisation using a
cDNA isolated from a stomach library (Toribara, Roberton et al. 1993).
1.4.2.1. MUC2
MUC2 is expressed in the intestine (Gum et al. 1989) but has also been
reported to be expressed in the bronchus (Jany et al. 1991). The full length cDNA
sequence of MUC2 has been determined (Toribara, Gum et al. 1991; Gum et al.
1994). The gene contains two sets of tandem repeats. The largest region towards the
3' end is comprised of perfect 69bp repeats which vary in number between different
alleles. The tandem repeats span a region of approximately 7kb in the common
alleles and these repeat units encode a 23 amino acid repetitive motif rich in serine,
th r e o n in e an d p r o l in e w ith th e c o n s e n s u s s e q u e n c e
PTTTPITTTTTVTPTPTPTGTQT. The smaller 5' region consists o f 48bp repeats
46

interrupted by 21-24bp segments and there is no evidence of variation in the number
of repeats. This sequence of "imperfect" repeats is separated from the larger tandem
repeat array by region of unique sequence.
The MUC2 mucin contains regions at the amino and carboxyl termini which
are cysteine rich. These cysteine rich regions are composed of repetitive elements
which show some similarity to the cysteine rich D domains in von Willebrand factorI
which have been implicated in protein/protein interactions (Curb et al. 1994).
A cysteine rich region at the carboxyl terminus of both MUC2 and von Willebrand
factor has been also been identified which is similar to the cystine knot region found
in the Norrie protein (Meitinger gr al. 1993). It is thought that this region is able to
dimerise through the formation of intermolecular disulphide bridges (Sheehan,
et al. 1991; Gum et al. 1994). However, some of the cysteine rich
domains found in mucins such as the frog integumentary mucins (FIM) have some
similarity to other protein motifs such as the P domains found in FIM-A. 1 and FIM-
C .l which are similar to the trefoil motif (Hauser et al. 1992). These domains are not
thought to be involved in the formation of intermolecular disulphide bridges but
instead it has been suggested that they may be involved in noncovalent protein,
protein interactions. Whether these structures are present in mature mucins is not
known but if they are it may be that they are involved in interactions with cell surface
receptors although what functional significance this would have is unknown.
MUC2 appears to be the predominant mucin secreted in the intestine (Tytgat
et al. 1994). The mucin seems to be synthesised as a precursor which is subsequently
glycosylated and secreted as a glycoprotein. Two dimensional electrophoresis and
pulse chase experiments indicate that the MUC2 peptide does indeed form a
disulphide bond stabilised dimer (Asker et al. 1995). However it has not been
determined whether the dimérisation is head to tail like vWF or the extent to which
further polymerisation occurs.
DNA Polymorphisms of MUC2 have been detected with Hinfl, Sau3A, TaqI
and Hae III (Gum et al. 1989; Griffiths, et al. 1990). A simple but
47

variable pattern of bands was detected with Hinfl and is due to VNTR polymorphism
(Griffiths, Mathews et al. 1990). The more complex pattern of bands detected with
TaqI is due to sequence polymorphisms resulting in the presence or absence of certain
TaqI sites within the large 3' tandem repeat region (Toribara, Gum et al. 1991). The
complex patterns observed with Sau3A and Hae III are reminiscent of the TaqI
polymorphism and are probably also due to polymorphic restriction sites within the
repeats.
Prior to the start of this project The Hinfl polymorphism had been analysed
for linkage and MUC2 has been shown to be linked with INS'TH^ HR AS and HBB^
which are also located on chromosome 1 Ip 15 (Griffiths, Mathews et al. 1990)
1.4.2.2. MUC5
The MUC5 locus is a region which codes for two or more tracheobronchial
mucins. The series of cDNA clones initially identified from a tracheobronchial
lambda gt 11 library which mapped to 1 Ip 15.5 and were tentatively divided into three
clone families on the basis of partial sequence information. These families were
provisionally called MUC5A, B, and C. MUC5B cDNA clones are composed of
degenerate 87bp tandem repeats (Dufosse et al. 1993). This encodes a peptide rich in
serine, threonine and proline without tandem repeats which has alternating
hydrophilic and hydrophobic domains. The repetitive structure has been destroyed by
numerous insertions and deletions at the DNA level. At the outset of this project we
were supplied with the MUC5B clone, JER57 and also clones for MUC5A (JER47)
and MUC5C (JER58). We were surprised to observe that the MUC5A and C clones
recognised the same bands on Southern blots. When clones from MUC5A and C
were hybridised to DNA digested with restriction enzymes which cut within CpG
islands they detected the same set o f fragments (Guyonnet-Duperat et al. 1995).
However when MUC5B was tested a different set of fragments was detected with
these enzymes. CpG islands are often associated with the 5' promoter regions of
genes (Craig and Bickmore 1994). These results indicated that MUC5B was under the
‘Insulin, Tyrosine hydroxylase, ^Haemoglobin beta.48

control of a distinct promoter from the other mucin genes located on chromosome
l i p 15 (Guyonnet-Duperat et al. 1995). Also the expression patterns of
MUC5B are very different from MUC5A/C, in particular MUC5A/C is highly
expressed in the stomach (Lesuffleur et al. 1994). It is interesting to note that in these
experiments a MUC2 cDNA clone hybridised to different fragments than those
detected for MUC5AC and B, again indicating a different promoter sequence.
When a number of MUC5A and C clones were completely sequenced both
were found to contain similar stretches of tandem repeats and JER47 had cysteine
rich sequences either side of the repeats. The tandem repeats are comprised of 24bp
repeat units which encode 8 amino acid tandem repeats with a consensus sequence of
TTSTTSAP rich in serine and threonine. When the cDNA clone JER47 was
sequenced and translated in the open reading frame the peptide contained a 130
amino acid cysteine rich domain (Guyonnet-Duperat et al. 1995). In JER47
this sequence was duplicated and interspersed with regions of tandem repeat. These
results suggest that the MUC5A and C clone correspond to a single gene (MUC5AC)
and that the corresponding glycoprotein contains more than one region of 8 amino
acid tandem repeats interspersed with cysteine rich regions. These cysteine rich
sequences show some homology to a cysteine rich domain at the carboxyl terminal of
MUC2, particularly in the conservation of the position and number of cysteine
residues.
Preliminary work in the Lille laboratory demonstrated polymorphisms with
Xba I, H indlll and BamHI for MUC5AC although the basis of these polymorphisms
has not been determined (Guyonnet-Duperat et al. 1995). Further analysis of
these polymorphisms was shared between the Lille laboratory and this laboratory.
1.4.2.3. MUC6
A partial cDNA clone containing tandemly repeated sequence was isolated
from a stomach X gtll library using antibodies raised against deglycosylated gastric
49

mucins (Toribaraj et al. 1993). MUC6 differs from the other genes in that
the transcript contains an extremely long repeat unit of 507bp, encoding 169 amino
acids rich in threonine, serine and proline and is more than twice the size of any other
mucin repeat unit reported so far. A DNA polymorphism was reported with TaqI and
was suggested to be due to VNTR. Northern blot analysis shows different expression
patterns from either MUC2 or MUC5AC. This together with sequence differences in
the repeat regions, seem to indicate that MUC6 is a new mucin.
1.43. Chromosome 7q22: MUC3
Partial cDNA clones corresponding to the MUC3 gene were isolated from a
human small intestine Xgtl 1 library (Gum et aL 1990). Four clones were identified,
two of which, SIB 124 and SIB 139, are comprised of 51 bp tandem repeats which
encode a 17 amino acid repetitive peptide rich in serine and threonine with the
consensus sequence HSTPSFTSSITTTETTS. SIB 139 was shown to hybridise to
mRNA from the small intestine, colonic tumours and the cell line LS174T. Southern
blot analysis, using SIB 124, of DNA digested with various restriction enzymes
detects a number of polymorphisms which may be due to VNTR (Fox et al.
1992). DNA digested with PvuII and PstI shows a pattern of two similar sets of
bands. This suggests that MUC3 covers a large region of DNA which contains two
large zones of tandem repeats separated by unique sequence. The gene was localised
by In situ hybridisation using the repeat probe SIB 124 to chromosome 7q22 (Fox,
e ta l. 1992).
1.4.4. Chromosome 3q29: MUC4
MUC4 is expressed at high levels in the trachea and bronchus. A partial
cDNA clone (JER64) corresponding to the MUC4 gene was isolated from a
tracheobronchial A.gtl 1 library using antiserum raised against deglycosylated tracheal
mucins (Porchet et al. 1991). This cDNA clone contains a 48bp tandem repeat that
50
en co d es a 16 am ino acid repeat w ith the con sen su s sequence
TSSVSTGHATSLPVTD consisting of approximately 50% hydroxyl amino acids.
Polymorphism was detected with PstI, EcoRI and TaqI which is due to VNTR (Gross
et al. 1992). The gene was localised to chromosome 3q29 by in situ hybridisation
(Grossi et al. 1992).
1.4.5. Chromosome 4ql3-q21: MUC7
Two types of salivary mucin have been identified, high molecular weight and
low molecular weight forms, designated M Gl and MG2 respectively (Edgerton et al.
1993). A partial cDNA clone (MG2-6-1) was isolated using anti-MG2 to screen a
human submandibular Xgtl 1 library (Reddy et al. 1993). The sequence obtained
from the clone showed no homology with any of the other mucin genes so far
identified. This gene has been designated MUC7.
This gene is expressed in the human sublingual and submandibular glands
(Bobek et al. 1993). The clone MG2-6-1 was used to screen a human submandibular
cDNA library and a number of clones were obtained, although non of them contained
the 5' sequence of the gene. PCR using a specific antisense primer and a universal
primer was used to obtain the 5' end. A number of genomic clones of MUC7 were
isolated and the genomic structure of the gene determined (Bobek! et al. 1996).
The gene is comprised of three exons and two introns; exon 1 is lOObp, exon 2 is
68bp and exon 3 is 2.2kb in length.
The deduced peptide sequence from the complete cDNA sequence gives a
polypeptide backbone comprised of three regions: non repetitive amino and carboxyl
terminal domains and a central tandem repeat region of 23 amino acid repeats with
the consensus sequence LPLFVCICALSACFSFSEGRERD encoded by a 69bp
tandem repeat. The peptide repeat is rich in cysteine residues but it is not known
whether these are involved in inter or intra chain disulphide bridges.
51

A probe for MUC7 was hybridised to genomic DNA of two individuals
digested with the restriction enzymes BamHI and H indi. The results suggest that
there may be VNTR variation of MUC7 although the basis of this variation is not yet
confirmed. This gene has been localised to chromosome 4ql3-q21 using fluorescent
in situ hybridisation. Very recently the large salivary mucin (M Gl) has been shown
to be MUC5B (Troxler et al. 1995; Nielsen et al. 1996).
The genes which code for the mucin glycoproteins are dispersed throughout
the genome although there appears to be a mucin gene complex on chromosome
l lp l5 . Evidence for a large genetic region on chromosome 7 which is subdivided
into two polymorphic zones suggested the possible presence of more than one gene in
the region 7q22.
1.5. Mucins and mucin-like glycoproteins in other species
Genes coding for mucins identified in other species include those for; at least
two rat intestinal mucins which are the homologues of MUC2 and possibly MUC3
and a submandibular mucin (Gum et al. 1991; Xu e/ al. 1992), the mouse M u d and
Muc5ac genes (Spicer et al. 1991), frog integumentary mucins (FIM) (Hoffmann et
al. 1993), porcine submaxillary mucin and gastric mucin (Timpte et al. 1988; Turner
et al. 1995), bovine submaxillary mucin (Bhargava et al. 1990) and canine
tracheobronchial mucin (Shankar et al. 1992). These will be briefly described in the
following section.
1.5.1. Rat mucins
Rat Muc2 clones from the amino terminal, central region and carboxyl
terminal have been isolated by a number of groups.
The clones 1-1, 8-1 and 21-1 were isolated from a XZAPII rat intestinal library
using a 5' non tandem repeat probe from MUC2. The combined sequence of these
52
clones encode a 1513 residue peptide in which the first 1391 residues are rich in
cysteine whilst the remaining 122 amino acids are comprised of irregular tandem
repeats rich in serine, threonine and proline (Ohmori et al. 1994). The non-repetitive
region shows 80% identity with the amino terminal region of MUC2 and the
repetitive region approximately 38%. This evidence suggests that this is the amino
terminal of the rat Muc2.
V RIA was isolated from a XZAPII rat jejunum library using antiserum raised
against deglycosylated rat intestinal mucin (Hansson et al. 1994). The sequence of
this clone encodes a peptide which has 7 cysteine residues in the first 53 amino acids
and the following 182 residues are rich in serine, threonine and proline. There is no
tandem repeat structure although certain motifs such a TTT are present which are
repeated 13 times. The cysteine rich region shows 59% similarity with the region
between the degenerate tandem repeats and tandem repeat region of MUC2.
The clone MLP 2677 which corresponds to the carboxyl terminal of Muc2
was isolated using a 0.5kb H indlll fragment from a PCR product obtained with
primers designed from the amino acid sequence of an 118kDa glycopeptide from rat
intestine (Xu, Huan et al. 1992). This clone encodes an 837 residue peptide which
contains 4.5 tandem repeats at the N terminal of 11 to 12 amino acids rich in serine,
threonine and proline, while the remaining 767 amino acids are rich in cysteine
residues (Huan et al. 1992). Probes from MLP and MUC2 recognise the same 9.0kb
fragment when hybridised to Northern blots of rat and human RNA (Xu et al. 1992).
A probe from MLP also mapped to rat chromosome 1 which contains a region
syntenic with the region of human chromosome 11 which contains MUC2 (Klinga-
Levan et al. 1996). These results all suggest that this clone is the carboxyl terminal of
a rat MUC2 homologue Muc2.
Muc2 appears to be expressed in the intestine and colon of the rat in a pattern
similar to that of MUC2 (Xu et al. 1992). It is also interesting to note that there are
similarities in the biosynthesis of rat Muc2 and human MUC2. Tytgat and colleagues
showed that the rat colonic mucin (RCM) could be immunoprecipitated using a
53

specific anti human MUC2 indicating this is the rat homologue (Tytgat; et al.
1994). The mucins of both species have similar characteristics in SDS PAGE
experiments and in respect of their relative mobility, composition and buoyant
density. The precursor also appears to dimerise before glycosylation like MUC2
(Tytgat; et al. 1994). A protein polymorphism of the precursor (Tytgaf
et al. 1994) was also observed which may indicate genetic polymorphism as in MUC2
(Griffiths et al. 1990).
The partial cDNA clone RMUC176 was isolated by screening a rat jejunum
library using antiserum raised against deglycosylated intestinal mucin (Gum et
al. 1991). This clone consisted of 18bp tandem repeats which code for a 6 amino acid
repeat with the consensus sequence TTTPDV. A 9kb fragment is detected with this
cDNA clone on Northern blots of RNA from small intestine and colon, which is
consistent with this being an intestinal mucin. The partial cDNA clone M2-798 was
isolated from a rat intestinal XZAPII library and detects the same fragment as
RMUC176 but detects something different to MLP on Northern blots of rat RNA
(Khatri et al. 1993). The sequence of M2-798 encodes a peptide which consists of
tandem repeats with the same consensus sequence as that encoded by RMUC176
followed by a unique sequence of 82 amino acids. These results indicate that
RMUC176 and M2-798 are from the same rat intestinal mucin gene but are not rat
Muc2. RMUC176 has been mapped to rat chromosome 12 which appears to have a
region syntenic with human chromosome 7q22 indicating that these two clones
correspond to Muc3 the rat homologue of human MUC3 (Klinga-Levan; it al.
1996).
At least one other rat mucin gene has also been cloned by Tsuda and
colleagues from a rat airway cDNA library screened with SMUC41 (Tsuda et al.
1993). Although this mucin was isolated using a human MUC2 probe the sequence
of the tandem repeats, TTTTIITI, and overall lack of homology indicates that this is
not part of the rat Muc2 gene. This gene is expressed in rat trachea (after exposure to
S02/Sendai virus or endotoxin) and intestine.
54
Although the gene for rat M u d has not yet been cloned a probe from the
repetitive region of mouse Muc 1 was used to localise a homologous sequence on rat
chromosome 2. This suggests the presence of a rat homologue to both human M UCl
and mouse M u d as rat chromosome 2 contains a region syntenic with human
chromosome lq21 (Klinga-Levan, et al. 1996).
1.5.2. Mouse mucins
At least two mouse mucin genes have been cloned which are probable
homologues of human M UCl and MUC5AC. The M u d gene has been cloned by
two groups. Spicer and colleagues obtained the complete cDNA for mouse M u d
(Spicer et al. 1991), whilst Vos and colleagues isolated a number of genomic
clones by screening a ^gtlO library with a cDNA clone containing the majority of the
non repetitive region of MUCl (Vos et al. 1991). The genetic structure of the M u d
gene has been determined and it is comprised of 7 exons, of which exon 2 contains 16
tandem repeats (Vos et al. 1991). Interestingly the tandem repeat of M u d does
not appear to be polymorphic, and there appears to much greater more variation
between individual M u d repeats than in human M UCl. The peptide sequence
predicted from the full length cDNA has a relatively high percentage of threonine,
serine and proline which is characteristic of mucins. A number of regions show a
high level of conservation between the deduced peptide sequences of human M UCl
and mouse M u d . The transmembrane region (90%) and the cytoplasmic tail (87%)
are both highly conserved. Two regions which are not well conserved are the extra
cellular region and the tandem repeats. The lack of conservation of the tandem
repeats has been observed in the rat and other species and may indicate that the
precise sequence is not functionally important (Spicer et al. 1991). However
one aspect that does appear to be conserved is the high proportion of hydroxyl
residues able to form 0-glycosidic linkages.
55

At the nucleotide level the promoter sequence is also generally well conserved
(Vos, de et al. 1991). Studies of the expression of M u d show that, like M U Cl, it is
expressed on the epithelial surface of a wide variety of organs e.g. stomach, pancreas,
lung, trachea, kidney and salivary glands (Braga et al. 1992). It is interesting to note
that these immunohistological results were obtained using an antibody specific to an
epitope in the cytoplasmic region of M UCl which together with the high level of
conservation implies that the peptide sequence of this region is important in
maintaining function. Indeed this region of M UCl appears to be well conserved
throughout mammals (Pemberton et al. 1992).
Partial clones for a mouse gastric mucin were isolated by screening a stomach
cDNA library with chicken antibodies raised against deglycosylated mouse gastric
mucin (MGM) (Shekels et al 1995). The tandem repeat region is comprised of 48bp
repeats w hich code for a 16 amino acid repeat w ith the sequence
QTSSPNTGKTSTISTT. This repeat sequence shares no significant similarity with
any other mucin so far identified however the non repeat region shows 75 to 80 %
identity with MUC5AC. There is also a lower level of similarity with MUC2 and one
of the rat intestinal mucins. When this gene was mapped it was localised to the
region of mouse chromosome 7 homologous with human chromosome 1 Ip 15. These
results indicate that this gene may be the mouse homologue of human MUC5AC.
1.53. Frog mucins
Three types of frog integumetary mucin (FIM) have so far been described i.e.
FIM-A. 1, FIM -B.l and FIM-C.l (Hoffmann and Hauser 1993). FIM-A.I is secreted
by the mucous glands of Xenopus laevis skin (Hauser et al. 1990). The peptide
sequence predicted from the cDNA contains four cysteine rich domains which show
homology to porcine pancreatic spasmolytic polypeptide (Hoffmann 1988). These
four P' domains are separated by threonine and proline rich repeats (VPTTPETTT)
with two P domains at the C terminus and the other two at the N terminus. Each
repeat has 9 residues which can potentially be O glycosylated. Variation of the size
56

of proteins from different individuals detected on polyacrylamide gels may be due to
polymorphism of the gene, possibly due to VNTR (Hauserj et al. 1990).
The second set of FIM glycoproteins, B .l, are characterised by the peptide
repeat sequence GESTPAPSETT (Probst et al. 1992). The C terminal domain is
cysteine rich and is homologous with von Willebrand factor (Probst et al. 1990).
There also appears to be a large number of mRNA transcripts of different
sizes within a single individual for both the FIM-A.l and B .l genes. Southern blot
analysis indicates that there is only one copy of each of these genes, which suggests
that the variation observed is due to alternative splicing. There is also variation
between different individuals which may in part be due to variation in the numbers of
tandem repeats.
A third set of FIM glycoproteins have been identified and called C .l which
are characterised by the repeat peptide sequence TTTKATTT (Hauser and Hoffmann
1992). The mRNA is polydisperse and may be due to alternative splicing. There is
also genetic variation due to differences in the length of the threonine rich repetitive
region, this VNTR variation is also reflected in the protein (Hauser and Hoffmann
1992).
1.5.4. Porcine mucins
Genes for two porcine mucins have been identified, porcine submaxillary
gland apomucin and a gastric mucin (Timpte et al. 1988; Turner et
al. 1995). The gene corresponding to the submaxillary gland apomucin contains
243bp tandem repeats which code for a 81 amino acid repeat which shows no
significant homology to any other tandem repeats (Timpte et al. 1988). The
3' end of the gene codes for a cysteine rich domain which shows homology to FIM-
B .l and von-Willebrand factor (Eckhardt et al. 1991).
The pig gastric mucin gene contains a region of 48bp tandem repeats which
code for a 16bp amino acid repeat (Turnerj r et al. 1995). A cDNA which
contains both tandem repeat and non repetitive sequence was isolated. The non
57
repetitive sequence codes for a peptide which contains 5 cysteine residues with an
identical arrangement to that found in MUC2.
1.5.5. Bovine mucins
A bovine submaxillary mucin like protein has also been identified and theI
complete cDNA sequence obtained (Bhargava st al. 1990). No tandem
repeat structure was identified in either the DNA sequence or the deduced peptide
sequence. However there are three repeats of an II amino acid motif, two of which
are followed by a 5 amino acid repeat and the carboxyl terminal is rich in cysteine
residues.
1.5.6. Canine mucins
Two cDNA sequences for canine tracheobronchial mucin have been
published, one complete sequence and one partial sequence coding for the C terminus
o f a mucin (Shankar et al. 1992; Verma et al. 1993) respectively. The partial
sequence contains no tandem repeats but codes for a cysteine rich peptide (Shankar,
et al. 1992). No significant homology was found with any other mucins.
The complete cDNA of a canine tracheobronchial mucin codes for a 1118
amino acid peptide which is rich in threonine, serine and proline (Verma and
Davidson 1993). There are no tandem repeats at either the nucleotide level or the
protein level although there are repeated peptide motifs i.e. TPTPTP which is
repeated 13 times and TTTTPV which is repeated 19 times. The C terminal contains
a cysteine rich domain like many other mucins. The amino acid sequence also
showed significant homology to MUC2.
58

1.6. Aims of the project
At the outset of this project a number of partial cDNA clones had been
identified which corresponded to the mucin genes MUC2, MUC3, MUC5 and MUC6
on chromosomes 7 and 11 but little was known about their structure and relationship
to one another. Thus overall aim of this project was to use physical and genetical
techniques to investigate the structural features of the chromosomal regions
containing the mucin genes and the genes themselves, specifically:
1. Testing and searching for polymorphisms in the mucin genes on
chromosome 1 Ip 15 i.e. MUC2, MUC5 and MUC6 .
2. Linkage analysis to investigate the genetic relationship between the
mucin genes on chromosome 1 Ip 15 and to integrate these genes into a map covering
the whole chromosomal region.
3. Testing the polymorphism identified in MUC3 for linkage analysis to
integrate this gene into a map of chromosome 7 particularly the region q22 and
identify flanking genes.
4. Investigation of the physical structure of the MUC3 gene locus by
techniques such as Southern analysis.
5 The isolation and characterisation of large genomic clones, such as
YACs and cosmids, containing MUC3.
59
2. Materials and m ethods
2.1. Maintenance of K562 (erythro-leukaemia) cell line
The K562 cell line was cultured in Ix RPMI 1640 (Gibco-BRL) diluted using sterile
distilled deionised water supplemented with 10 % foetal calf serum, with the addition
of 2mM glutam ate, 60 pg/ml streptomycin and 100 jig/ml penicillin (final
concentrations). The cells were grown in a moist 5% CO2 atmosphere.
2.2. Preparation of genomic DNA and purification of cloned
DNA
2.2.1. Stock solutions
The following solutions were required in the preparation and purification
protocols.
L broth: 1% Tryptone (Difco), 0.5% Yeast Extract (Difco) and 0.5%
NaCl; to make agar the broth was supplemented with 1.5%
agar noble (Difco) and addition of 0.2 % glucose unless
selection was being applied.
Superbroth: Prepared by combining two stock solutions A and B in the ratio
9:1 respectively, both stock solutions were autoclaved and
stored separately prior to use. Stock solution A comprised
120g tryptone (Difco), 40g yeast extract (Difco) and 50ml
glycerol dissolved in 9000ml water. Stock solution B
comprised 125g K2HPO4 and 38g KH2PO4 dissolved in 100ml
water.
60
PBS (Ix): 150mM NaCl, lOmM NaH^PO^ pH7.0.
SD medium: 7g/l Bacto yeast nitrogen base without amino acids, 20g/l
glucose, 55mg/l adenine, 55mg/1 tyrosine, 55ml/l 20%
casamino acids.
YRB: 1.2M sorbitol, lOmM Tris-HCl pH7.5, 20mM EDTA.
YLB: 1% SDS, lOOmM EDTA, lOmM Tris.
2.2.2. Preparation of plasmid DNA
Glycerol stocks of bacterial strains were prepared by mixing overnight culture
with 100% glycerol in the ratio 2:1, mixing thoroughly and storing at -70°C.
2.2.2.I. Transformation of bacterial cells
Bacterial cells were made competent for transformation by using 1ml of a
liquid culture grown overnight to inoculate 10ml of L-broth in a conical flask and
incubating in an orbital shaker at 37°C for 90 minutes. The cells were pelleted by
centrifugation at 1200 g for 5 minutes at 4°C. The pellet was resuspended in 5 ml
ice-cold lOOmM MgCl2 and then centrifuged as previously described. The pellet
was resuspended in 5 ml lOOmM CaCl2 (ice-cold) and incubated on ice at 4°C for
more than half an hour, after which time the cells were centrifuged as described
previously and the pellet was resuspended in 0.5 ml lOOmM CaCl2 (ice-cold) and
stored on ice until required. Approximately 20ng of plasmid DNA was mixed with
the freshly prepared competent Epicurian Coli SURE cells (STRATAGENE) and
incubated at 37°C for 90 minutes. The mixture was heat pulsed at 37°C for 5 minutes
and then 250 |il of L-broth was added. The mixture was incubated at 37°C for a
further 45 minutes. The mixture was then spread on a L-agar plate supplemented
with 50|ig/|il ampicillin to select for the presence of the plasmid. The plate was
61

incubated overnight at 37°C and a single colony was picked and used to prepare
glycerol stocks as described in section
2 2 2 2 . Bulk plasmid preparation
A single colony of bacteria containing the plasmid was used to seed a culture
that was initially grown in 5 mis L-broth or superbroth supplemented with 100 pg/ml
ampicillin during the day at 37°C in an orbital shaker. This was used to seed an
overnight culture in 250 mis L-broth or superbroth with ampicillin supplement to
select for the bacteria carrying the plasmid. The plasmid DNA was then purified
using the PROMEGA maxi prep kit. The cells were initially pelleted at 14000 x g for
10 mins at 4°C and the culture medium discarded. The pellet was resuspended in
15mls resuspension solution (50mM Tris-HCl pH7.5, lOmM EDTA, lOOpg/ml
RNase A). A further 15mls of cell lysis solution was added (200mM NaOH, 1%
SDS) and mixed by inverting. The solution was neutralised with ISmls of
neutralising solution (1.32M potassium acetate pH4.8). The protein was pelleted by
centrifugation at 14 000 x g for 15 mins at 4°C. Separation of the supernatant from
the protein pellet was done using filter paper (Whatman #1). The DNA in the
supernatant was precipitated by the addition of 0 .6 volumes of 1 0 0 % isopropanol.
The DNA was then pelleted by centrifugation at 14 000 x g for 15 mins at 4°C and the
supernatant discarded. The pellet was resuspended in 2mls of TE buffer. The DNA
was purified using the columns supplied by PROMEGA. lOmls of W izard
Maxipreps DNA Purification resin was added to the DNA. The DNA/resin solution
was added to the Wizard Maxicolumn and any remaining DNA/resin solution washed
out and added to the column with 13mis of column wash solution (200mM NaCl,
20mM Tris-HCl ph7.5, 5mM EDTA diluted with 1.36 volumes of 95% ethanol). The
liquid was drawn through the column by the application of a vacuum. The resin was
washed with a further 12mls of column wash solution followed by a final wash with
62
5mls 80% ethanol. The resin was dried by leaving the vacuum on for 10 to 15 mins
after the ethanol wash had been drawn through the column. The DNA was eluted
from the column first by the addition of 1.5mls of water prewarmed to 65-70°C and
and being left for one min followed by centrifugation at 1100 x g for 5 mins.
2.23. Preparation of human genomic DNA in solution
Genomic DNA was prepared from blood samples and pellets from cell lines
using the Puregene kit (Flowgen), or obtained from CEPH (Centre d'Etude du
Polymorphisme Humain).
To prepare blood from whole blood 3mls was added to 9mls of RBC Lysis
Solution in a 15ml tube and incubated at room temperature for 10 mins. The unlysed
white cells were then pelleted by centrifugation at 2 0 0 0 g for 10 mins and all but 100
to 200|il of supernatant discarded. For cultured cells 10 to 20 million cells were
pelleted by centrifugation at 500g for 3 mins and again all but 100 to 200|il of
supernatant discarded. All the following steps were the same for both blood cell and
cultured cells. The pellet was resuspended by vortexing and 3mis of Cell Lysis
Solution added. The cells were lysed by pipetting and if clumps of cells were still
visible the n the solution was incubated at 37°C. 15pl of RNase A Solution was
added to the sample mixed by inverting 25 times and then the solution was incubated
at 37“C for 10 mins. The solution was cooled to room temperature and 1ml of Protein
Precipitation Solution added. After vortexing for 20 secs the protein was pelleted by
centrifugation 200g for 10 mins. The supernatant was removed and added to 3mis of
100% propan-2-ol in a fresh 15ml tube and mixed by inverting 50 times. The DNA
was pelleted by centrifugation at 2000g for 3 mins and the supernatant discarded.
The pellet was then washed with 3mis of 70% ethanol followed by centrifugation at
2000g for 1 min after which the ethanol was removed and the pellet air dried. The
63

pellet was resuspended in 250|il of DNA Hydration Solution overnight at room
temperature.
2.2.4. Preparation of human genomic DNA in LMP agarose blocks
Cells of the K562 cell line were harvested the day after they were last fed.
The cells were pelleted by spinning at 400 x g for 5 minutes and washed three times
in PBS cooled on ice. The cells were counted prior to the final spin so that they could
be resuspended in the appropriate volume of PBS to give 1x10^ cells per 40|il.
The agarose blocks are formed using the mould provided with the PFGE
apparatus (BIORAD). The mould was cleaned by scrubbing with detergent, rinsing
with distilled water and then wiped over with ethanol prior to use. Low melting point
(LMP) agarose (BRL, ultraPURE) was added to Ix PBS to a final concentration of
1.2% and kept at molten at 42°C. Equal volumes of the cell suspension and LMP
agarose PBS solution were mixed together at 42°C and 80|xl aliquots were dispensed
into each slot in the mould. The moulds were then placed on ice for at least 20
minutes to allow the LMP agarose to set.
The solidified blocks (between 50 and 100 per 50ml tube) were then placed in
50ml of proteinase K solution comprised of 500mM EDTA pH8.0, 1% sodium
lauroyl sarcosine and 2mg/ml proteinase K (Boeringer Mannheim). The blocks were
incubated at 55°C for 48 hours with occasional inverting. After the proteinase K
digestion the blocks were treated with PMSF (phenylm ethylsulfonylfluoride,
SIGMA) to stop the reaction.
The following steps were carried out at 4°C to make the blocks firmer and
easier to handle. The blocks were washed three times in TE buffer were the volume
of buffer used was at least 50 x the volume of one block x the number of blocks for
30 minutes each wash. A tea strainer was used to collect the blocks when the
solutions were changed. The blocks were then placed in a solution comprised of
0.04mg/ml PMSF in TE buffer and incubated at 55°C for 30 minutes, this was
64

repeated using fresh PMSF solution. A lOOOx (40mg/ml) PMSF stock solution was
prepared by dissolving 250mg, in 6.25ml of propan-2-ol (PMSF is extremely toxic
and was always handled in a fume hood). This solution was heated to 55°C and
added to the TE buffer just prior to use as PMSF degrades rapidly in aqueous
solutions and must be made fresh. Aqueous solutions containing PMSF were stored
at room temperature for 2 to 3 days and then disposed of in the normal way.
The blocks were then washed twice for 30 minutes in TE buffer on a rocker.
These blocks were then either used immediately or stored in 500mM EDTA at 4°C.
2.2.5. Preparation of Yeast artificial chromosome (YAC) DNA in
solution
YAC clone DNA in solution was obtained using the Puregene kit (Flowgen).
The yeast clones were streak purified and a single colony used to inoculate 5mis of
SD medium and the culture was incubated overnight at 30°C. The culture was
transferred to a 15ml centrifuge tube and the cells were pelleted by centrifugation at
2000g for 3 mins and the supernatant discarded. The pellet was resuspended in
1.5mls of Cell Suspension Solution to which 7.5|il of 20unit/pl lyticase (SIGMA) was
added to digest the cell wall. The solution was incubated at 37°C for 30 mins with
occasional inverting after which the spheroplasts were pelleted by centrifugation at
2000g for 3 mins. The cells were lysed by the addition of 1.5mls of Cell Lysis
Solution and gentle pipetting up and down. 0.5mls of Protein Precipitation Solution
was added to the cell lysate and the solution vortexed for 20 seconds. The protein
was pelleted by centrifugation at 2 0 0 0 g for 10 mins and the supernatant transferred to
a fresh 15ml tube containing I.5mls of 100% propan-2-ol. The sample was mixed by
inverting 50 times and the DNA pelleted by centrifugation at 2000g for 3 mins. The
supernatant was discarded and the pellet washed with 70% ethanol by inverting the
tube several times. The pellet was centrifuged at 2000g for 1 min and the ethanol
discarded. 250)il of DNA Hydration Solution and 7.5|Xl of RNaseA Solution was
65

added to the pellet and the sampled mixed by vortexing for 1 sec and incubated at
37°C for 15 mins. The DNA was then allowed to rehydrate at 4“C overnight.
2.2.6. Preparation of YAC DNA in LMP agarose blocks
The yeast clones were streak purified and a single colony used to inoculate
lOmls of SD medium and the culture was incubated overnight at 30°C. The cell were
pelleted by centrifugation at 180 x g for 10 mins. After the supernatant had been
discarded the pellet was resuspended in 0.5mls of YRB and 71000 volumes of 14mM
p-mercaptoethanol. Then Ip l of 20units/|il lyticase (SIGMA) was added and the
solution was incubated at 37°C for 1 hour. An equal volume of 1.2% LMP agarose
(BRL ultraPURE) in YRB kept at 37°C was added. After gentle mixing of the
solutions SOjil aliquots were poured into the slots of a mould (BIORAD). The mould
was kept on ice for at least 20 mins to allow the agarose to set. When set the blocks
were placed in 5mis of YLB in a 25ml universal tube .(up to 10 blocks per universal)
and kept at room temperature for 1 hour. The YLB was replaced with lOmls of fresh
YLB and incubated at 45 to 55°C overnight. Finally the blocks were washed in TE
for 30 mins and stored at room temperature in lOmls of fresh YLB.
66

2.3. General DNA methods
All water used for DNA work was sterilised, and purified by reverse osmosis
(MilliRO) and deionised unless otherwise stated
23.1. Commonly used buffers
TBE (Ix) 86 mM Tris, 1.9 mM EDTA, 90 mM borate buffer pH 8.4.
SSC (Ix) 0.15 M NaCl, 1.5 mM sodium citrate pH 7.0.
TE (10 mM) 10 mM Tris-HCl, 1 mM EDTA pH 8.0.
These buffers were made using water purified by reverse osmosis.
23.2. Determination of DNA concentration
The two methods used routinely are described below.
2.3.2.1. Spectrophotometry
The absorbance of the sample at 259nm was determined and the purity
evaluated by scanning between the wavelengths 200-300nm. The conversion of
absorbance into concentration was calculated using the following definitions, 1 OD
unit is equivalent to a concentration of 50 jig/ml double stranded DNA, 40 |ig/ml
RNA or 33 jig/ml single stranded DNA.
2.3.2.2. Comparison with known standards
After electrophoresis of the standard DNA solution (for example lambda
H indlll digest (BRL)) along side the test DNA, a band of equivalent fluorescence /
strength to the test was chosen. The concentration was then calculated as the product
o f the amount of standard loaded and the fragment size of the chosen band divided by
the size of the intact marker genome (in this case 49kb).
67

2 3 3 . Restriction enzyme digests of genomic and cloned DNA
2 3 3 .L Digestion of DNA in solution
The reaction conditions used were those recommended by the manufacturer of
the particular restriction enzyme used (BRL, PROMEGA, Boeringer-Mannheim, or
NEB). For single enzyme digests the lOx buffer supplied with the enzyme was added
to a final concentration of Ix. However for digests with more than one enzyme either
a commercial buffer compatible with all the enzymes at a concentration of Ix was
used or KGB buffer (2x, 200mM potassium glutamate, 50mM Tris-acetate pH7.5,
20mM magnesium acetate, lOOpg/ml BSA fraction V, ImM P-mercaptoethanol) was
used at concentrations of 2x, 1.5x, Ix or 0.5x depending on the combination of
enzymes used (Sambrook et al. 1989). Typically lOjig of genomic or lOOng of
cloned DNA was digested and run on a Maxi-gel for southern blotting. The reaction
was incubated for 3 hours at the recommended temperature i.e. 25°C, 37°C or 50“C.
2.3.3.2. Digestion of DNA in LMP agarose
Each SOpl block was first washed twice in lOmls of TE for 10 mins each
wash. A whole SOpl block was used for each digestion and a typical reaction
comprised; one agarose block, Ix buffer containing; 125pg/|il BSA (Gibco BRL), 10
units restriction enzyme all in a final volume of 200|xl. The reaction was then
incubated at the specified temperature overnight. Double digests were performed
sequentially; after the first reaction the block was washed twice in 10ml of TE for 30
mins each wash. The reaction for the second enzyme was then carried out as
described above. The reaction was stopped by the addition of 1ml of 500mM EDTA.
68
23.4. Standard agarose gel electrophoresis.
Agarose (Sigma or Flowgen) gels were routinely prepared at concentrations
varying between 0.8% and 2% in Ix TBE buffer. For 'mini'-gel electrophoresis, gels
were cast in a 6 x 4 cm tank (Uniscience, Flowgen or Anachem) using 50ml of
agarose dissolved by heating in IxTBE, supplemented with 5 ng/ml ethidium bromide
(Sigma) just before pouring. Sample wells were formed using the comb supplied by
the tank manufacturers. Gels were submerged in buffer and samples mixed with 1/10
the volume of loading buffer (comprised of 40% sucrose, 0.25% bromophenol blue
and 0.25% xylene cyanol (Kodak)) loaded into the wells. Electrophoresis was carried
out with voltage limiting at 70 V for half an hour or 50 V for 1 hour. For 'midi'-gels,
11 cm X 14 cm, the gel was prepared as above except the volume used was 100ml.
Electrophoresis was carried out at 5 V/cm, using tanks obtained from BRL. For
'Maxi'-gels, 25x22 cm, the gel is prepared as above except the volume used was
300ml and electrophoresis was carried out at 14 V/cm. The DNA was visualised
using UV light.
2.3.4.1. Estimation of the size of a DNA fragment
The size of a piece of DNA was estimated in comparison to the size markers
run on the same gel. The distance migrated from the well by each fragment of known
size was measured and a standard curve of log size (bp) distance (mm) plotted. The
molecular size markers used in this project were:
1 kilobase ladder (BRL) which consists of fragments of sizes, in bp; 12216,
11198, 10180, 9162, 8144, 7126, 6108, 5090, 4072, 3054, 2036, 1636, 1018, 517,
506, 396, 344, 298, 220, 201, 154, 134
X H indlll (BRL) which consists of fragments of sizes, in bp; 23130, 9416,
6557, 4361,2322,2027, 564, 125
Raoul (Appligene) which consists of fragments of sizes, in bp; 48502, 18520,
14980, 10620, 9007, 7378, 5634, 4360, 3988, 3609, 2938, 2319, 1810, 1416,1255,
69
1050, 903, 754, 6 8 6 , 554, 375, 234. All bands (except 10620) can be visualised on
autoradiographs by probing Southern blots with pUC18 or pBR322.
5kb ladder (BIORAD) consists of ligated pBR328 partially digested with
EcoRI to produce a range of DNA fragments from 4.9kb to approximately lOOkb
increasing in steps 4.9kb.
Lambda Ladder (BIORAD) consists of successively longer concatamers of X
cl857 Sam7, and is available in 0.8 % LMP agarose, increasing from 48.5kb in steps
of 48.5kb to approximately lOOOkb
Yeast chrom osom al (BIORAD) consists of Saccharomyces cerevisiae
chromosomal DNA, in 0.8 % low melting point agarose, with the approximate sizes
in kb; 2200, 1600, 1125, 1020, 945, 850, 800, 770, 700, 630, 580, 460, 370, 290, 245
23.5. Gel purification methods
Various methods exist to purify specific DNA fragm ents from other
fragments. The starting point for most of these techniques is a gel purification step,
where the sample containing the fragment of interest is subjected to electrophoresis in
an agarose gel. The band of interest can then be purified in a variety of ways. The
methods used during the course of this work are described below.
2.3.5.1. Centrifugation through glass wool
This technique was the simplest of the purification techniques used and was
based on the method of (He et al. 1992). The band containing the fragment to be
purified was cut out of a standard agarose gel. The piece of agarose was placed on
some siliconised glass wool in a 0.5ml Eppendorf tube which has a hole in the
bottom. This assembly was placed in a 1.5ml Eppendorf tube and centrifuged at 12
000 X g in a microfuge for 1 to 2 mins. The DNA solution in the 1.5ml Eppendorf
was further purified by ethanol precipitation for use in oligolabeling reactions.
70

23.5 .2 . Ethanol precipitation o f DNA
Ethanol precipitation of DNA was performed by addition of 2 and a half
volumes of 100% ethanol, with the addition of 1/10 volume of 3M Na acetate pH 4.8
and the DNA was allowed to precipitate at either -20°C or -70°C for more than 15
minutes. The tube was centrifuged for 20 minutes to pellet the DNA. If salt had been
added to the precipitation the pellet was washed with 70% and then 95% ethanol.
The pellet was then freeze-dried for 5 to 10 mins and dissolved in TE or water at the
desired concentration.
2.4. Southern blot analysis of mucin genes
The following sections describe the methods used to obtain restriction map
data and to detect restriction fragment length polymorphisms (RFLPs) by standard
electrophoresis and conventional southern blotting techniques.
2.4.1. Preparation of filters.
Filters of DNA digested with PvuII, PstI and H indlll were prepared from
maxi-gels run under standard electrophoresis conditions as described in section 2.3.4.
The gel was then depurinated in 250mM HCl (400mls) for 30 mins each wash at
room temperature. This was followed by the dénaturation in 500mM NaOH, 1.5M
NaCl for 30 mins. Finally the gel was neutralised in 500mM Tris-HCl pH6.5, 3M
NaCl for 30 mins each wash. The DNA was then transferred onto Hybond N+
membrane (Amersham) which was laid on top of the gel, which was itself on a wick
of 3MM paper soaked in 20 x SSC. A stack of absorbent paper was placed on top of
the filter and a glass plate was used as a weight. The gel was left to capillary blot
overnight. Filters were baked at 80°C for 2 hours to fix the DNA onto the filter.
Genomic DNA obtained from the CEPH families and digested with a number
o f different restriction enzymes had previously been subjected to agarose gel
71

electrophoresis and Southern blotting as part of the service provided by the
EUROGEM (European genome mapping initiative) consortium. Southern blots of
the CEPH family DNAs digested with PvuII, Hinfl, PstI, Hae III, TaqI, H indlll,
EcoRI, Seal and MspI were made available during the course of this research.
2.4.2. Preparation and 32P labelling of probe DNA.
Probe DNA was labelled using the random primed labelling kit (Amersham)
following the manufacturers instructions. Briefly, 20-50ng of DNA to be labelled
was boiled for 5 minutes to denature the DNA (and melt the low melting point
agarose, where used) and snap cooled on ice. The DNA was then mixed with 5 |il
primers mix and 10 pi nucleotide and buffer mix. The total volume was made up to
44 pi. 4 pi of 32p dCTP was then added and 2 pi Klenow polymerase. The reaction
was left to proceed at room temperature for between 5 hours and overnight. The
unincorporated nucleotide was removed from the mix by using a 'spun' column
(Sephadex G-50 (Pharmacia) in TE, prepared in a 1 ml syringe, centrifuged at 400 x g
for 3 minutes). The labelled probe was used if the incorporation was judged to be
above 60%.
2.43. Hybridisation and washing down of filters
EUROGEM filters and other filters were all treated in the same way. Filters
were prehybridised in 6 x SSC, 0.5 % SDS, and 5 x Denhardts solution at 65°C for
between 1 hour and overnight (100 x Denhardts comprised 2% (w/v) BSA (ICN), 2%
w/v Ficoll 400 (Pharmacia) and 2% w/v polyvinylpyrolidone). The probe and herring
sperm DNA (added to a final concentration of 0.02 mg/ml) were denatured for 5
minutes by boiling and then added directly to fresh hybridisation solution or a known
volume of the prehybridisation solution. Hybridisation in all cases took place
overnight at 65°C.
72
The hybridisation solution was removed and either disposed of or stored for
re-use within 1 week. Filters were then washed twice in 2 x SSC at 65°C for 15
minutes each wash. The filters were then washed in 2 x SSC, 0.1% SDS at 65 °C for
30 minutes and finally 0.1 x SSC at 65°C for 10 minutes.
2.4.4. Autoradiography.
Filters were drained of excess liquid and wrapped in cling film and then
placed in a cassette (Fuji) with intensifying screens (FG8 , Fuji) and Super HR-G film
(Fuji). Registration marks were made using Glo juice (IBI) to allow alignment of the
filter and any bands on the resulting autoradiograph. Film was placed on top and
below the filter to allow multiple exposures and sealed in the light tight cassette
(Fuji). Autoradiography was carried out for between 1 day and 2 weeks at -70°C.
The autoradiograph was developed by immersion in Phenisol (Ilford) for up to 5
minutes, a stop solution of acidulated water and fixing in Hypam fixer (Ilford) for 4
minutes (all solutions made up as recommended by the manufacturers) or using the
Compact X2 automatic developer (X-OGRAPH).
2.5. Pulsed field gel electrophoresis (PFGE)
PFGE was used to separate fragments of DNA ranging in size from 5kb to
2Mb. The apparatus used was the CHEF-DR II pulsed field electrophoresis system
(BIORAD).
The agarose (BIORAD; standard low -m j gels used were at a concentration of
1% in lOOmls IxTBE and were cast using a 14cm x 12.7cm casting stand (BIORAD).
Samples were loaded in either one of two ways;
1. Wells were formed using a comb with teeth 10mm x 2mm and a slice of the
agarose block containing DNA placed against the face of the well in the direction of
migration. If the DNA sample was in solution then it was loaded in the normal way
73
but the recirculating pump was not switched on until 1 -2 hours after electrophoresis
had started.
2. Alternatively the agarose slice could be placed on to the tooth of the comb
prior to casting the gel and the molten agarose poured around it.
For electrophoresis the gel was placed in the centre of the hexagonal array of
electrodes in the gel tank and submerged in IxTBE. The gel tank was placed in a 4°C
room in order to maintain a constant temperature. Two sets of electrophoresis
conditions were routinely used;
For separations of fragments from 50kb to 2Mb, the pulse time was increased
in a linear way from 10 seconds to 250 seconds over the course of the run (ramped),
150 volts and a run time of 40 hours.
For separations of fragments from 5kb to 200kb, pulse time 1-20 secs ramped,
150 volts and a run time of 2 0 hours.
2.5.1. Southern blotting of pulsed field gel
The DNA was visualised by staining the gel with a 0.4jig/ml solution of
ethidium bromide. The gel was then depurinated in 250mM HCl (400mls) twice for
20 mins each wash at room temperature. This was followed by the dénaturation in
500mM NaOH, 1.5M NaCl twice for 40mins each wash. Finally the gel was
neutralised in 500mM Tris-HCl pH6.5, 3M NaCl twice for 40 mins each wash. The
DNA was then transferred onto Hybond N+ (Amersham) in the manner described in
section 2.4.1. The preparation o f probes, hybridisation and subsequent
autoradiography was also the same as that described in sections 2.4.2. to 2.4.4.
2.6. Polymerase chain reaction (PCR)
This technique which specifically amplifies DNA between two defined
oligonucleotide primers was originally described by (Saiki et al. 1988).
74

2.6.1. Oligonucleotide primers
Fragments of genomic DNA were amplified using oligonucleotide primers
designed from sequences available on the EMBL database or from published primer
sequences. Care was taken in the choice of sequence that it did not form hairpin
loops, hybridise to the other primer in the pair and that neither primer recognised
repetitive sequence elements in the human genome. The sequence was also compared
to all known sequences on the GenBank and EMBL databases using the program
BLASTA in the GCG package of programs using the HGMP-resource centre.
Primers for PCR were made on an ABI 391 PCR-MATE, synthesised by the HGMP-
resource centre or obtained from OSWELL. Details of the primers used in this
project are shown in Table 2. 1.
75
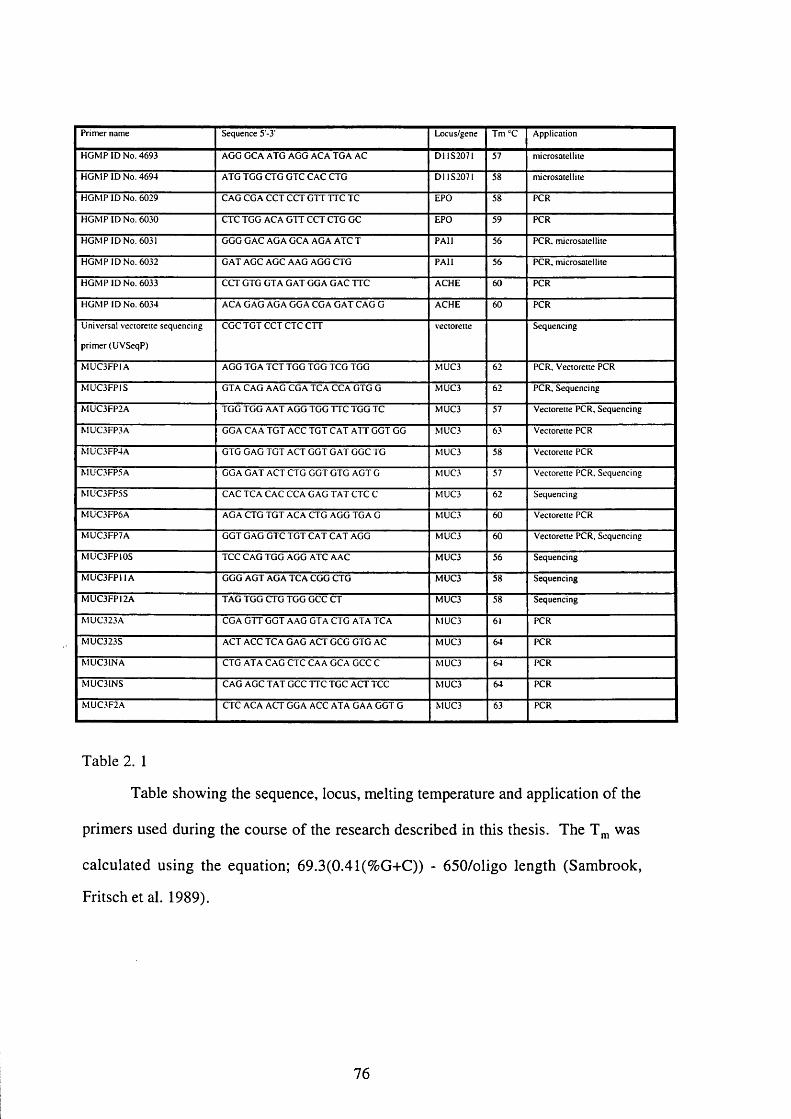
Primer name Sequence 5 -3' Locus/gene Tm Application
HGMP ID No. 4693 AGG GCA ATG AGG ACA TGA AC DU 82071 57 microsatellite
HGMP ID No. 4694 ATG TGG CTG GTC GAG GTG D IIS207I 58 microsatellite
HGMP ID No. 6029 GAG GGA GGT GGT GTT TTG TG EPO 58 PGR
HGMP ID No. 6030 GTG TGG AGA GTT GGT GTG GG EPO 59 PGR
HGMP ID No. 6031 GGG GAG AGA GGA AGA ATG T PAH 56 PGR. microsatellite
HGMP ID No. 6032 GAT AGG AGG AAG AGG GTG PAH 56 PGR. microsatellite
HGMP ID No. 6033 GGT GTG GTA GAT GGA GAG TTG AGHE 60 PGR
HGMP ID No. 6034 AGA GAG AGA GGA GGA GAT GAG G AGHE 60 PGR
Universal vectorette sequencing
primer (UVSeqP)
GGG TGT GGT GTG GTT vectorette Sequencing
MUC3FPIA AGG TGA TGT TGG TGG TGG TGG MUG3 62 PGR. Vectorette PGR
MÜC3FPIS GTA GAG AAG GGA TGA GGA GTG G MUG3 62 PGR. Sequencing
MUC3FP2A TGG TGG AAT AGG TGG TTG TGG TG MUG3 57 Vectorette PGR. Sequencing
MUC3FP3A GGA GAA TGT AGG TGT GAT ATT GGT GG MUG3 63 Vectorette PGR
MUC3FP4A GTG GAG TGT ACT GGT GAT GGG TG MÜG3 58 Vectorette PGR
&IUC3FP5A GGA GAT ACT GTG GGT GTG AGT G MÜG3 57 Vectorette PGR. Sequencing
MUC3FP5S GAG TGA GAG GGA GAG TAT GTG G MUG3 62 Sequencing
MUC3FP6A AGA GTG TGT AGA GTG AGG TGA G MÜG3 60 Vectorette PGR
MUC3FP7A GGT GAG GTG TGT GAT GAT AGG MUG3 60 Vectorette PGR, Sequencing
MÜC3FP10S TGG GAG TGG AGG ATG AAG MUG3 56 Sequencing
MUC3FPI1A GGG AGT AGA TGA GGG GTG MUG3 58 Sequencing
MUC3FPI2A TAG TGG GTG TGG GGG GT MUG3 58 Sequencing
MUC323A GGA GTT GGT AAG GTA GTG ATA TGA MUG3 61 PGR
MUC323S AGT AGG TGA GAG AGT GGG GTG AG MUG3 64 PGR
MUC3INA GTG ATA GAG GTG GAA GGA GGG G MÜG3 64 PGR
MUC31NS GAG AGG TAT GGG TTG TGG AGT TGG MUG3 64 PGR
MUC3F2A GTG AGA AGT GGA AGG ATA GAA GGT G MÜG3 63 PGR
Table 2. 1
Table showing the sequence, locus, melting temperature and application of the
primers used during the course of the research described in this thesis. The T^ was
calculated using the equation; 69.3(0.41(%G+C)) - 650/oligo length (Sambrook,
F ritschetal. 1989).
76
2.6.2. Preparation of nucleotide stocks
Solid dATP, dCTP, dGTP and dTTP were obtained from Boeringer
Mannheim. Solutions of 15mM nucleotide were prepared by dissolving the solid in
water and adjusting the pH of the resulting solution using unbuffered 500mM Tris
until it was pH 7. This stock solution was stored in aliquots at -20°C. Before use
aliquots were further diluted in water to 2mM and stored as working stocks.
2.63. Reaction conditions for PCR amplification from genomic and
cloned DNA
2.6.3.1. Stock solutions:
Advanced Biotechnologies (lOx) buffer 1: 500 mM KCl, 100 mM Tris-HCl
pH 8.3 and 15mM MgCl2.
PROMEGA ( lOx) buffer: 500 mM KCl, 100 mM Tris-HCl
pH 8 .8 , 15mM MgCl2 and 1%
Triton X-100.
2.6.3.2. Standard PCR
The reaction conditions used were those recommended by the company who
supply the Taq polymerase enzyme used (either PROM EGA or Advanced
Biotechnologies). In each case the commercial buffer which contained magnesium
was used. The lOx buffer solution supplied by the manufacturer of the Taq
polymerase used was added to a final working concentration of Ix. Nucleotides were
at a final concentration of 200 |iM and oligonucleotide primers at approximately 50
pmoles per 100 |il reaction volume. For PCR from genomic DNA approximately 200
ng of DNA was added and for cloned DNA approximately Ing was added to each
reaction. This mixture was then vortexed and centrifuged briefly and paraffin oil
layer on top of the reaction mixture. Following dénaturation of this mixture at 95°C
77

for 5 minutes, 2 units of Taq polymerase were added through the paraffin oil. The
subsequent 30 cycles of amplification consisted of dénaturation for 20 seconds at
94°C, annealing for 20 seconds at a temperature specific to the primers (see Table 2.
I) and elongation for 20 or 40 seconds at 70°C, depending on the length of the
product. These reactions were performed using either a Hybaid Thermal Cycler or a
Hybaid OmniGene.
2.6.3.3. Standard hot start PCR
The reaction conditions used are those recommended by the supplier of the
Ampliwax PCR gem 100 (PERKIN ELMER) and Taq polymerase (PROMEGA).
The reaction was prepared as two layers with a combined volume of lOOjil separated
by a layer of wax. The lower layer comprised 500)iM nucleotides, 50pmol of each
primer, Ixbuffer and water to a volume of 40|il. A single Ampliwax ball was added
to each tube and the contents heated to 78“C for 5 minutes and then cooled to room
temperature to allow the wax to solidify and form an impermeable barrier. The upper
reaction mix comprised 1 to 2 units of Taq polymerase, Ix buffer, DNA sample and
water to a volume of 60pl. The reaction was then denatured for 1 minute at 94°C.
The subsequent 30 cycles of amplification consisted of denaturing for 1 min at 94°C,
annealing for 30 secs at the specific temperature for the primer pair and elongation for
30 secs to 1 min. The reactions were performed using the PERKIN ELMER DNA
Thermal Cycler.
2.6.3.4. Long hot start PCR
The reaction was prepared in the same manner as that described in section
2.6 .3.3. The reaction was then denatured for 1 min at 93°C. The subsequent 17
cycles of am plification consisted of dénaturation for 1 min at 93°C and
78
annealing/elongation for 5-20 mins at the specific temperature for the primer pair.
This was followed by a further 18 cycles of amplification consisting of dénaturation
for 1 min at 93 °C and annealing/elongation for 20 mins with an increment of 15 secs
per cycle. Finally the reaction was held at 72°C for 10 mins. The reactions were
performed using the PERKIN ELMER DNA Thermal Cycler.
2.6.B.5. Touchdown hot start PCR
The reaction was prepared in the same manner as described in section 2.6.3.3.
The reaction was then denatured for 1 min at 94 °C. The subsequent 10 cycles of
amplification consisted of dénaturation for 1 min at 94“C, annealing for 30 secs at
70°C and elongation for 3 mins, for the first 10 cycles the annealing temperature was
reduced by 1°C each cycle from 70°C to 60°C. The remaining 20 cycles consisted of
dénaturation at 94°C for 1 min, annealing at 60“C for 30 secs and elongation at 72“C
for 3mins. The reactions were performed using the PERKIN ELMER DNA Thermal
Cycler.
2.6.3.6. Vectorette PCR
The following section describe the use of vectorette PCR, described in section
1.2.5., to obtain specific fragments of DNA containing unknown sequence .
2.6.3.6.I. Construction of vectorette libraries
Five different types of vectorettes are provided in the Vectorette starter pack S
(GENOSYS), which can be ligated to DNA digested with a range of different
restriction enzymes. The five different vectorettes are:
EcoRI vectorette I
H indlll vectorette I
BamHI vectorette I (also compatible with Bglll, Bell, XhoIII, Sau3A and Mbol).
Clal vectorette I (also compatible with Acyl, Asul, Hpall, TaqI).
79
Blunt end vectorette I (compatible with all blunt ends e.g. PvuII, Smal, etc).
Five vectorette libraries were constructed using genomic DNA from a single
individual. The restriction enzymes EcoRI, Hindlll, BamHI, Clal and Alul were used
to digest DNA for each library. The digestion reaction comprised Ix buffer, Ipg of
DNA, 10 to 20 units of enzyme in 50|il and incubated at 37°C for 2 to 3 hours. After
digestion 5pl of the appropriate vectorette units (0.6 pmol/pl) was added, together
with Ipl of T4 DNA ligase (lunit/pl), Ipl of ATP (lOOmM) and l|il DTT (lOOmM)
to the reaction. The reaction was subsequently cycled 3 times between 20°C for 60
mins and 37°C for 20 mins.
2.6.3.6.2. PCR of vectorette library
The PCR was carried out using the touchdown hot start method, described in
section 2.6.3.5., using Ijil of the library per lOOpl reaction. If necessary the reaction
was repeated using a nested specific primer and 1 pi of a '/,ooo dilution of the first PCR
product to obtain a specific product.
2 .6 3 .1. Detection of minisatellite repeats polymorphism PCR
This section describes the detection of a minisatellite repeat polymorphism in
the locus D11S2071 and the gene PAIl using fluorescently labelled PCR products.
Primers labelled with fluorescein were obtained from the HGMP resource centre or
labelled using a 5' oligolabeling kit (Vistra fluorescence).
The reaction conditions used were those recommended by the company who
supply the Taq polymerase enzyme used (Advanced Biotechnologies). In each case
the commercial buffer which contained magnesium was used at the recommended
concentration. The reaction mix comprised Ix buffer solution supplied by the
manufacturer, 200 pM nucleotides, 20% glycerol, oligonucleotide prim ers at
80
approximately 1 Op mois per lOpl reaction volume and 0.25 units of Taq polymerase.
The reaction was carried out in a 96 well OmniPlate and for PCR from genomic DNA
approximately 40 ng of DNA was added to each lOpl reaction. In order to improve
heat transfer and prevent evaporation 40|il of paraffin oil was added to each reaction.
Following dénaturation of this mixture at 94°C for 2.5 mins the reactions underwent
35 cycles of amplification which consisted of dénaturation for 1 min at 94°C,
annealing for 1 min at 54°C and elongation for SOsecs at 72°C. Once the 35 cycles
were complete the reaction was held at 72“C for 3 mins. These reactions were
performed using a Hybaid Omni-gene apparatus.
Analysis of the PCR products was carried out using either the ALP DNA
Sequencer (LKB Pharmacia) or the Prism 310 (PERKIN ELMER).
2.6.4. Detection of PCR products by agarose gel electrophoresis
PCR products were detected by running 5 to lOpl of the reaction on a 2%
agarose minigel stained with ethidium bromide and visualised under UV light.
2.7. Sequencing of vectorette PCR products
Vectorette PCR products were sequenced using two methods, ‘biotinylated
sequencing’ and ‘cycle sequencing’, both methods are described below.
2.7.1. Biotinylated sequencing
The Biotinylated specific primer B-MUC3FP2A was obtained from OSWELL
and the biotinylated universal vectorette primer (B-UVP) was obtained from
GENEOSYS. The touchdown hot start PCR reaction was repeated using one of the
biotinylated primers at a concentration of 0.5pmol per lOOpl reaction.
81

In order to produce a single stranded template free of unused nucleotides and
primers M-280 streptavadin coated magnetic beads (Dynal) were used. The beads
were prepared by placing 30pl of the solution containing the beads into a 1.5ml
Eppendorf tube and washing twice with lOOpl of TES buffer (lOmM Tris-HCl pH8.0,
ImM EOT A and lOOmM NaCl). The beads were separated from the wash buffer
using the magnetic separating stand (Dynal).
The washed beads were then resuspended in 95 pi of PCR product and left at
room temperature for 15 mins with occasional agitation. Using the magnetic
separator the supernatant was removed and discarded. The beads were then
resuspended in 8 pi of lOOmM NaOH and left at room temperature for a further 10
mins. the beads were again separated from the supernatant which was transferred to a
fresh tube and neutralised with 4pl of 200mM HCl and Ipl of IM Tris-HCl pH 7.5.
The beads were then washed in 50pl of lOOmM NaOH followed by lOOpl TES buffer
and finally lOOpl of water The beads were resuspended in 6 pl of water.
The sequencing method is based on the protocol supplied with the Sequenase
Version 2.0 sequencing kit (Amersham). For the sequencing prim er annealing
reaction Ipl of primer solution (0.5pmol/pl) and 2pi of sequenase buffer (200mM
Tris-HCl pH7.5, lOOmM MgCl2 and 250mM NaCl) was added to the resuspended
beads or 7pl of the neutralised supernatant. The reaction was then placed in a beaker
of water at 65°C and allowed to cool to room temperature.
Following the primer annealing step 5.5pl of a sequencing mix (kept on ice)
was added to the reaction and incubated at 18°C for 5 mins. The sequencing mix
comprised 1.6pl water, Ipl DTT (lOOmM), 0.4pl labelling mix (7.5pM dGTP, 7.5pM
dCTP and 7.5pM dTTP), 0.5pl a dATP (Amersham), 1.75pl enzyme dilution
82
buffer (lOmM Tris-HCl pH7.5, 5mM DTT and 0.5mg/ml) and 0.25|ii Sequenase
version 2.0 enzyme (13 units/pl) per sequencing reaction.
The termination reactions are carried out in four separate tubes each of which
contains 2.5|il of one of the four termination mixtures (SOpM dATP, SOpM dCTP,
80|iM dGTP, 80|iM dTTP 50mM NaCl and 8 jiM of one of the four ddNTFs). 3)11 of
the sequencing reaction was then added to the termination mixtures and incubated for
5 mins at 37°C.
For the DNA bound to the beads the reaction was stopped by separating the
termination mix from the beads and then resuspending the beads in 4pl of stop
solution (95% formamide, 20mM EDTA, 0.05% bromophenol blue and 0.05% xylene
cyanol FF). The solution was then heated to 85°C for 2 mins and the supernatant
separated from the beads and stored in fresh tubes. For DNA in solution 4 |il of stop
solution is added to the termination reaction.
2.7.2. Cycle sequencing
This method is based on the protocol supplied by the manufacturers of the
Thermo Sequenase cycle sequencing kit (Amersham). The template was prepared
using Reagent Pack for use with Sequenase PCR product sequencing (Amersham)
under the conditions specified by the manufacturer.
The sequencing reactions was carried out in two steps, the labelling step and
then the chain termination reactions.
The design of the primer is important in the labelling step because only three
of the four dNTPs is used so that extension will only proceed for a few nucleotides. It
is therefore important to design the primer in such a way that at least 2 or 3 a ^^P
labelled dATPs (Amersham) will be incorporated before the extension is terminated.
Each sequencing reaction comprised Ipl of sequencing primer (0.5pmol/pl), Ip l of
83
PCR product prepared in the manner described above, 2|il reaction buffer (260mM
Tris-HCl pH9.5 and 65mM MgClz), 0.25pl a ^3? dATP (10 pCi/|il), Ipl of each of
two of the remaining three 3pM dNTPs and 9.25pl of water to a final volume of
17.5pl. The reaction was overlaid with 15pl of paraffin and then cycled 50 times
between 95 °C for 15 secs and 60°C for 30 secs.
The termination reaction is carried out in four separate tubes each of which
contains 4pl of one of the four termination mixes which are comprised of; 150pM
dATP, 150pM dCTP, 150pM 7-deaza-dGTP, 150pM dTTP and 1.5pM of either
ddATP, ddCTP, ddGTP or ddTTP. 3.5pl of the labelling mix was added to the
termination mixes and the reaction overlaid with lOpl of paraffin and cycled 50 times
between 95°C for 30 secs and 60 to 72°C for 60 secs. The reaction is stopped by the
addition of 4pl of stop solution (95% formamide, 20mM EDTA, 0.05% bromophenol
blue and 0.05% xylene cyanol FF).
2.73. Sequencing Gel
The products from both sequencing methods described above were run on
acrylamide gels using apparatus supplied by BIORAD with 50cm wedge spacers
(0.4mm to 1.2mm). Gels were prepared using a 6 % acrylamide solution (19:1 Bis
acrylamide, 7M URFA and 1 x TBF) supplied by Severn Biotech, and the acrylamide
was polymerised by the addition of '/500 volume of IM ammonium peroxodisulphate
(APS) and '/500 volume of NNN'N'-Tetramethylethylenediamine (TFMFD). The
samples were denatured at 85“C for 2 mins and 2 to 3pi then loaded into wells formed
by placing a sharks tooth comb (BIORAD) with the tips of the teeth in contact with
the top of the set gel. Electrophoresis was carried out for 4 to 8 hours at 2500V
whilst the current was varied in order to maintain the gel at 50 to 55“C. The gel was
84

then transferred to 3MM paper covered with cling film and dried using a model 583
gel drier (BIORAD). When the gel was completely dry the cling film was removed
and placed in a light tight cassette (Fuji) with a piece of photographic film (KODAK,
Biomax BMR) next to the gel. Autoradiography was carried out for between 1 day
and 1 week at room temperature. The film was developed using the Compact X2
automatic developer (X-OGRAPH).
2,8. Fluorescent in situ hybridisation (FISH)
The initial characterisation of Y AC and cosmid clones isolated during the
course o f this project was carried out using FISH to metaphase chromosomes
conducted as described previously (Pinkel et al. 1986; Gharib et al. 1993).
85
2.8.1. Stock solutions
Iscoves:
Proteinase K buffer (lOx):
SSPE (20x):
Antifade:
Iscoves medium (Sigma), Ix glutamine (Gibco-
Life Technologies), Ix penicillin (Gibco-Life
Technologies)
200mM Tris-HCl pH7.4, 20mM CaCl.
3M NaCl, 200mM NaH^PO^.bHzO, 20mM
EDTA adjusted to pH7.4 with NaOH.
1ml Vectorsheild antifade (Vector Labs), l |i l of
lOmg/ml propidium iodide (PI, Sigma), 10pi of
0.2mg/pl 4,6-diamidino-2-phenlindole (DAPI,
Sigma)
2.8.2. Préparation of cells from blood
A culture was set up which comprised of 16mls Iscoves, 2mls fetal calf serum
(PCS), 0.3ml phytohaemagglutinin (Gibco-Life Technologies), 1ml whole blood and
incubated for 72 hours at 37°C in 5% CO? in a moist atmosphere. Then 200pl of
30mg/ml thymidine was added and the culture incubated for a further 17 hours. The
thymidine 'block' was removed by pelleting the cells at 179 x g for 5 mins and
removing all but 0.5ml of the supernatant. The cells were then resuspended in the
0.5mls remaining and 5mls of Iscoves, 10% PCS. The cells were again pelleted and
the supernatant discarded. The cells were resuspended in 5mis of Iscoves, 10% PCS
and then 50pl of 1 mg/ml 5-bromo deoxyuridine (BrDU) was added this was then
incubated for 4 hours and 35 mins. 25 mins before harvesting of the cells 50pl of
lOpg/ml colcemid (Gibco-Life Technologies) was added. The cells were then
pelleted and the supernatant discarded and the cells resuspended in 8 mis of
prewarmed 75mM KCl and incubated for 8 mins. The cells were again pelleted and
86
7.5mls of supernatant removed. The cells were resuspended in the remaining 0.5mls
then a fix solution (3:1 methanol:acetic acid) was added the solution left at 4°C for 30
mins. The fix solution was changed until there was no brown tinge to the cell
suspension and then left overnight at 4“C.
2.83. Slide preparation
The slides were prepared by cleaning with methanol to which a few drops of
concentrated HCl had been added. The cells were pelleted once again and the
supernatant discarded. Enough fix solution was then added to produce a 'cloudy' cell
suspension. The slide was then removed from the methanol wash and wiped with a
lint free cloth so that it was still damp. Then using a Pasteur pipette a single drop of
the cell suspension was allowed to fall from a height of a 30 to 50 cm onto the slide
held at an angle of approximately 30 degrees. The slide was then dried using a fan
and when dry flooded with 1ml of 70% acetic acid and left for a few seconds after
which the acetic acid was poured of and the slide left to dry. The slides were then
dehydrated in an ethanol series consisting of 70%, 90% and then 100% for 3 mins
each. The slides could then be stored at -20“C until required.
2.8.4. Prehybridisation
The cells on the slides were treated with 200|il of a solution which comprised
lOOjig/ml RNAse (Sigma) in 2 x SSC pH7.0 under a cover slip and incubated in a
moist atmosphere at 37“C for 1 hour. The cover slips were discarded and the slides
washed four times in 2 x SSC in a coplin jar followed by dehydration in a an ethanol
series consisting of 70% ethanol for 3 mins, 90% for 3mins, 100% for 5mins and then
left to air dry. A coplin ja r containing 50mls of Ix proteinase K buffer was
prewarmed to 37°C and the slides were incubated in this solution for 10 mins. The
slides were transferred to the proteinase K solution comprised of 0.035|ig/ml of
87

proteinase K (Boeringer Mannheim) in Ix proteinase K buffer and incubated for 7
mins at 37°C. The slides were washed for 5 mins in PBS and given a postfix
treatment of 0.05M MgCl2.6 H2 0 , 1% formaldehyde in PBS for 10 mins. Another
wash in PBS for 5 mins was followed by dehydration in an ethanol series. The slides
were then denatured with lOOpl of 70% formamide in 2 x SSC under a coverslip at
75°C for 5 mins. The coverslip was removed and the slides placed in ice cold 70%
ethanol for 3mins and then passed through 90% and 100% ethanol for 3 mins each
and finally left to air dry
2.8.5. Probe preparation using competition with COT-l-DNA and
hybridisation
Ipg of whole clone was biotinylated by nick translation using the kit supplied
by BRL. The probe was purified using a G-25 medium grade Sephadex column
(Pharmacia) and eluted in a volume of 1ml. For each hybridisation 200ng of probe
was combined with lOpg of Cot-l-D N A (Im g/m l), 50pg herring sperm DNA
(lOmg/ml), '/|o volume of 3M NH4 acetate and two volumes of 100% ethanol this was
then incubated at -70“C for 30 mins. The DNA was pelleted by spinning in a
microcentrifuge at 13 000 rpm for 5 mins and the pellet freeze dried for 10 to 15
mins. The pellet was then resuspended in lOjil of 50% formamide, 10% dextran
sulphate in 2 x SSPE pH7.0. The probe was denatured at 75°C for 5 mins followed
by incubation at 37“C for 30 mins to preanneal repetitive components in the probe,
the preannealing was stopped by placing the probe on ice. This hybridisation mix
was then placed on the slide and covered with a circular coverslip and the edges
sealed with cow gum and incubated overnight at 37“C in a sealed moist environment.
2.8.6. Post hybridisation washes
88

The cover slip was discarded and the slides washed three times in a solution of
50% formamide in 2 x SSC at 42°C for 5 mins each wash. The slides were then
washed five times in 2 x SSC at 42°C for 2 mins each wash. If the probe was a
cosmid then a more stringent wash was used which comprises three washes in 50%
formamide in 2 x SSC at 45°C for 5 mins each wash followed by two washes at 45°C
in 2 X SSC for 2.5 mins each wash and finally two washes at 60°C in 0.1 x SSC for
2.5 mins each wash.
2.8.7. Signal detection
The slides were washed in 0.05% Tween 20 (SIGMA) in 4 x SSC for 5 mins.
Preincubation of the slides was carried out in 5% milk powder (Marvel) in 4 x SSC
for 20 mins. The slides were then incubated with lOOpl of 5|ig/m l avidin-FITC
(Vector labs), 5% Marvel in 4 x SSC under a coverslip for 20 mins the slides were
protected from the light for all further steps. The coverslip was discarded and the
slides washed three times in 0.05% Tween 20 in 4 x SSC for 5mins each wash. The
slides were then incubated with 100|il of 5|ig biotinylated anti-avidin (Vector labs),
5% Marvel in 4 x SSC for 20 mins. The slides were again washed with Tween 20 in
4 X SSC. The slides were then incubated with the avidin-FITC mix once again for a
further 20 mins which was followed by two washes with PBS for 5 mins each wash.
The slides were finally dehydrated with an ethanol series and 15|il o f antifade
solution under a coverslip placed over the chromosomes.
The propidium iodide(PI) and diaminophenolindole (DAPI) in the antifade
solution counterstained the chromosomes to produce R-banding and the images were
collected by confocal laser microscopy (BIORAD MRC 600).
89
2.9. Computer resources
Linkage analysis was carried out on marker data generated in this lab and
marker data from a copy of the CEPH database stored on the hard disc of a DEC
Station 5000/25 (Digital) in this laboratory. The analysis was conducted using the
CRI-MAP (Donis-Keller, Green et al. 1987) package running on a SPARC station 10
(SUN Microsystems) in this laboratory. Nucleic acid and protein sequences were
analysed using various computer packages, such as the GCG suite, at the UK HGMP
resource centre (Cambridge) available via the internet.
90

3. The mucin g e n e family on c h ro m o s o m e
11p15.5: results and discussion
The main emphasis of this work was the genetic mapping of the family of
mucin genes on chromosome l lp l5 . This work was done in collaboration with
Wendy Pratt who probed many of the southern blot filters. Whilst this work was in
progress our collaborators in Lille undertook the task of producing a physical map
using PFGE.
3.1, Families analysed
All the families used in this study were from the CEPH series. Southern blots
of the CEPH family DNA samples digested with various enzymes were prepared and
provided by the EU funded EUROGEM consortium. The CEPH families are
comprised of a number of distinct populations located in Utah and France and one
family from Venezuela and an Amish family. The initial MUC2 data used in this
study was provided by D. Matthews (MRC HGBU) and had previously been
submitted to CEPH (and was thus on version 7.0 of the database). Some of the
families used to obtain the original MUC2 the data were not included in the
EUROGEM panel of CEPH families and not all of the EUROGEM families were
tested at the time.
22. Search for and analysis of polymorphisms of the mucin
genes on chromosome 11p15.5
Each of the genes was analysed using probes corresponding to the main
tandem repeat region of that gene.
Polymorphisms of MUC2 and MUC6 had previously been described (Gum,
Byrd et al. 1989; Griffiths, Mathews et al. 1990; Toribara, Roberton et al. 1993).
Both genes show evidence of VNTR polymorphism described in sections 1.4.2.1 and
91
1.4.2.3. The original MUC2 data was obtained by probing southern blots of DNA
from 37 CEPH families digested with Hinfl probed with SMUC41 (MUC2). Hinfl
was the enzyme of choice for the analysis of MUC2 because most other enzymes
showed more complicated patterns which are harder to interpret, as described in
section 1.4.2.1. While this work was in progress the EUROGEM filters of the CEPH
family DNA samples digested with Hinfl became available and were probed with
SMUC41 (Fig. 3. 1). This was done to fill in gaps in the data and improve the
informativeness since the resolution of the fragments on the EUROGEM filters is
better than on the original Southern blots.
The original paper on MUC6 described a polymorphism with Taql. However
in this study Southern blots of CEPH family DNA digested with PvuII became
available first and thus these were tested with the MUC6 probe. This revealed a
variable allele length polymorphism presumably due to the reported VNTR
polymorphism (Fig. 3. 2). This interpretation of the polymorphism was subsequently
supported by comparison of the pattern of relative mobilities detected with PvuII and
Taql (Fig 3. 2). Hinfl was not suitable as a restriction site for this analysis as a cut
site for this enzyme is present within each of the tandem repeats.
92

VOU)
FF MF F Cl C2 C3 C4 C5 C6 C l C8 C9 CIO C il M FM MM
Figure 3. 1.
Autoradiograph of a Southern blot of DNA from CEPH family 884 digested with Hinf I and probed with
SMUC41 (MUC2). The sizes of the two alleles shown are 6.5 and 6.95 kilobases. Key: FF=father of the father,
MF=mother of the father, F=father, C l, C2, C3, e.t.c.=children, M=mother, FM=father of the mother and
MM=mother of the mother.

FF MF F C l 02 03 S 04 05 07 06 08 09 OlO M FM MM
Pvu II
T aq l
kb18.515.0
9.0
,18.5115.0
9.0
7.4
Figure 3. 2.
Autoradiographs of two Southern blots of DNA from OEPH family 1416 digested
with Pvu II and Taq I probed with MU06. Key: S=size marker lane and the sizes in
kilobases are shown on the right hand side, FF=father of the father, MF=mother of
the father, F=father, 01, 02, 03, e.t.c.=children, M=mother, FM=father of the mother
and MM=mother of the mother. A 2 kb fragment is also detected with Taql (data not
shown) and in some individuals a 2.2 kb fragment is seen.
94
The search for polymorphism in the genes MUC5B and MUC5AC was split
between our collaborators in Lille and this lab respectively. A number o f enzymes
were tested in an attempt to identify polymorphism of M UC5AC, which included
Seal EcoRI, Taql, M spI and PvuH. Large invariant bans of 20 to 30kb were detected
with EcoRI and Seal (Fig. 3. 11). Taql, M spI and PvuII produced complex patterns
with considerable person to person variation and are reminiscent of the M UC2 Taql
polymorphism previously described in section 1.4.2.1 and are probably not due to
straightforward VNTR (Fig. 3 .3 ) . Although Hinfl and PstI showed simpler patterns
comprising of one or two bands in each individual (Fig. 3. 4), PvuII was used to type
the ΠP H families because it was more informative. The pattern of fragments
detected with PvuH consists of two sets variable fragments, which do not appear to be
obviously associated, together with a number of constant smaller fragments (Fig 3 .3 ).
The variable fragments were treated as separate polymorphisms for ease of analysis.
Two-point linkage analysis using the 'two-point' option of CRI-MAP showed that the
two polymorphic zones are tightly linked with a LOD score of 49.07 at 0= 0 .
95

kb
7.4
5.6
PvuIIFF MF F C l C2 C3
» # # # #
Msp IFF MF F C l C 2 C 3
Taq IFF MF F C 1 C 2 C 3
2.9
2.3
1.4
1.3
Figure 3. 3.
Autoradiographs of three Southern blots of DNA from CEPH family 1424 digested
with Pvu II, Msp I and Taq I probed with JER58 (MUC5AC). The variable alleles
detected with Pvu II range in size from 6.5 to 7.5 kilobases (upper set) and 2.3 to 2.5
kilobases (lower set), were as with Msp I they range from 2.7 to 3.3 kilobases (upper
set) and 1.3 to 1.4 kilobases (lower set). Key: FF=father of the father, MF=mother of
the father, F=father, Cl, C2, C3, e.t.c.=children, M=mother, FM=father of the mother
and MM=mother of the mother.
96
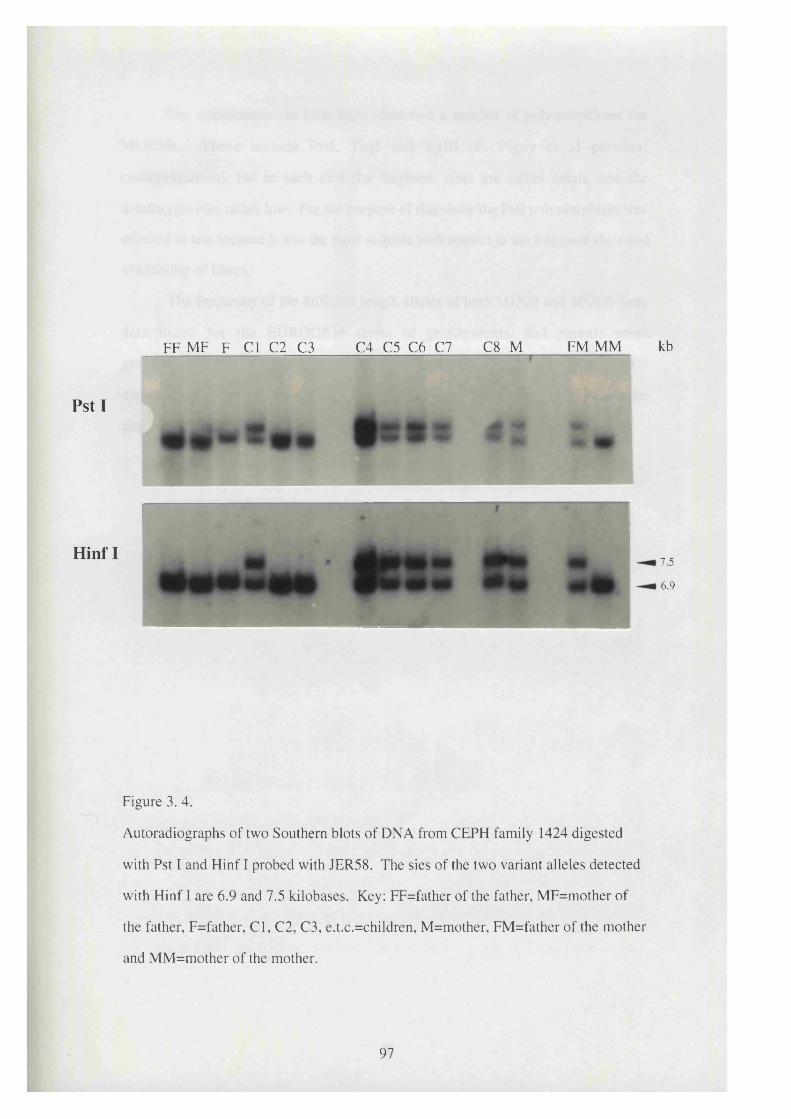
FF MF F Cl C2 C3 C4 €5 06 C l C8 M FM MM kb
PstI
H infl7.5
6.9
Figure 3. 4.
Autoradiographs of two Southern blots of DNA from CEPH family 1424 digested
with Pst I and Hinf I probed with JER58. The sies of the two variant alleles detected
with Hinf I are 6.9 and 7.5 kilobases. Key: FF=father of the father, MF=mother of
the father, F=father, C l, C2, C3, e.t.c.=children, M=mother, FM=father of the mother
and MM=mother of the mother.
97
Our collaborators in Lille have identified a number of polymorphisms for
MUC5B. These include PstI, Taql and B glll (P. Pigny et al personal
communication), but in each case the fragment sizes are rather small, and the
heterozygosities rather low. For the purpose of this study the PstI polymorphism was
selected to test because it was the most suitable with respect to the fragment sizes and
availability of filters.
The frequency of the different length alleles of both MUC2 and MUC6 were
determined for the EUROGEM series of grandparents, and parents when
grandparents were unavailable (Fig. 3. 5). The distribution observed for MUC6
appears to be unimodal (Fig. 3. 5 A) and possibly bimodal for MUC2 although the
peak for the smaller sizes is considerably smaller than the main peak (Fig. 3. 5 B).
98

« 80
B
60 1
^ 40
MUC2 data others 0MUC2 data France
MUC2 data Utah
Allele size/kb
Z 20
MUC6 data others □ MUC6 data France ■ MUC6 data Utah
85 9 9.5 10 10.5 11 11.5 12 12.5 13 13.5
Allele size/kb
Figure 3. 5.Two histograms showing the allele size distributions of MUC2 (A) and MUC6 (B).
The y axis shows the number of alleles which fall into the arbitrary size range of the
categories which span 0.5 kilobases on the x axis.
99
Heterozygosities were calculated for both MUC2, MUC6 and MUC5AC by
dividing the number of observed heterozygous individuals by the total number of
individuals. MUC2 has a heterozygosity of 0.64, MUC6 of 0.70, a value of 0.60 was
obtained for the larger set of polymorphic fragments of MUC5 AC and 0.36 for the
smaller set. It is interesting to note that no new mutations were detected in the 40
CEPH EUROGEM families for MUC6 or MUC5AC, whereas 3 had been previously
observed in families 1333, 1331 and 1413 probed with SMUC41 (MUC2) (D.
Matthews unpublished). Two of these MUC2 mutations were clearly evident in the
new analysis (Fig. 3. 6 ). In the case of family 1333 a large mutant allele can be seen
in the mother which is not present in either of the grandparents. The mutant band is
approximately twice the size of the grandparents i.e. l l . lk b compared with 6.7kb.
This may indicate a duplication of the tandem repeat region in this family member.
The mutation in child C l 1 of family 1331 appears to be the lack of a paternal allele.
The most likely explanation is that the paternal allele has lost tandem repeats and is
either the same or nearly the same size as the allele inherited from the mother. The
third mutation originally detected, consisting of a faint extra band, was not seen in
this analysis. One possibility is that there was a population of cells which contained
the mutant allele which was not represented in the DNA sample used for on the
EUROGEM Southern blot, or that there was contamination of the original sample.
100

Family 1333FF MF F C l C2 C3 C4 C5 C6 C l C8 C9 M FM MM S kb
#H8.5
H 5.0
»9.0
>7.4
»5.6
Family 1331FF MF F Cl C2 C3 C4 C5 C6 C l C8 C9 CIO C il M FM MM
Figure 3. 6 .
Autoradiographs of two Southern blots of DNA from CEPH families 1331 and 1333
digested with Hinf I and probed with SMUC41 (MUC2). The large mutant allele can
clearly be seen in the mother (M) of family 1333 and has been inherited by children
C l, C2, C5, C l and C9. The mutation in child Cl 1 of family 1331 can be seen as the
apparent lack of a paternal allele. Key: S=size marker lane and sizes are in kilobases,
FF=father of the father, MF=mother of the father, F=father, C l, C2, C3,
e.t.c.=children, M=mother, FM=father of the mother and MM=mother of the mother.
101

3.3. Linkage analysis
Initially MUC5AC and MUC6 were analysed together with other markers on
chromosome 11 from the CEPH database version 7.0, which included the MUC2 data
generated previously in the MRC HBGU. Two point lod scores for each of the MUG
genes with all the other markers on this version of the database were obtained using
the 'twopoint' option of the CRI-MAP computer program (Appendix I). All the
markers which had a lod score of greater than 3 with MUC5AC, MUC6 or MUC2
were then used to generate a genetic map of chromosome 11 using the 'build' option
of CRI-MAP. This map contained both MUC6 and MUC2 and was supported at odds
of greater than 1000 to 1 when adjacent groups of 5 markers in the map were
permuted using the 'flips 5' option of CRI-MAP. Using the 'chrompic' option of CRI-
MAP all the putative recombinant chromosomes could be identified. A single
recombination between MUC6 and MUC2 in individual 1424-03 was identified
which had enabled CRI-MAP to orientate these genes with respect to the other
markers in the map i.e. MUC6 goes with HRAS (towards the telomere) and MUC2
goes with D1 IS 1000 and the other more centromeric markers. MUC5AC, however,
was not informative for this family and could not be unambiguously inserted into this
map but was shown to be in the same region as MUC6 and MUC2. In an attempt to
make MUC5AC informative for this family a number of other enzymes were tested,
TaqI, MspI, Hinfl, Hae III, PstI and EcoRI. Although these enzymes all detected
polymorphism with the JER58 tandem repeat probe the critical parent was
homozygous in each case and was therefore not informative. Two enzymes, PstI and
Hinfl appeared to detect the same polymorphism suggesting that both enzymes were
detecting the same VNTR variation (Fig. 3.4).
The 'chrompic option' of CRI-MAP was used to identify all the chromosomes
with apparent recombinations in this region. A total of 24 recombinations in 20
families were identified (Appendix II). Because of the existence of errors within the
CEPH database and the incomplete nature of some of the data the families which
102

showed these recombinations were tested further in an attempt to provide support and
increase precision for this region of the map. To this end the EUROGEM filters were
reprobed with pEJ6 .6 (HRAS) (Fig. 3. 7). The families were also tested for some
additional markers. D11S150, detected with probe 2.1 (Brookes et al. 1989), was
selected because it had been localised to this region by PFGE and D11S2071 was
used because it is the most telomeric marker reported (Redeker et al. 1994) (Fig. 3. 8
and 3. 9).
There were clearly problems with the original HRAS data in two families
(1413 and 23) and the new results did not support recombinations in these families.
Of the remaining recombinant chromosomes 11 were well supported with at least two
informative markers on either side of the breakpoint. The results for D11S2071
agreed with HRAS in every case where both loci were informative and supported the
recombination between HRAS and MUC6 in individual 1413-03. D11S150, where
informative, segregates with MUC2 (Fig. 3. 10).
103
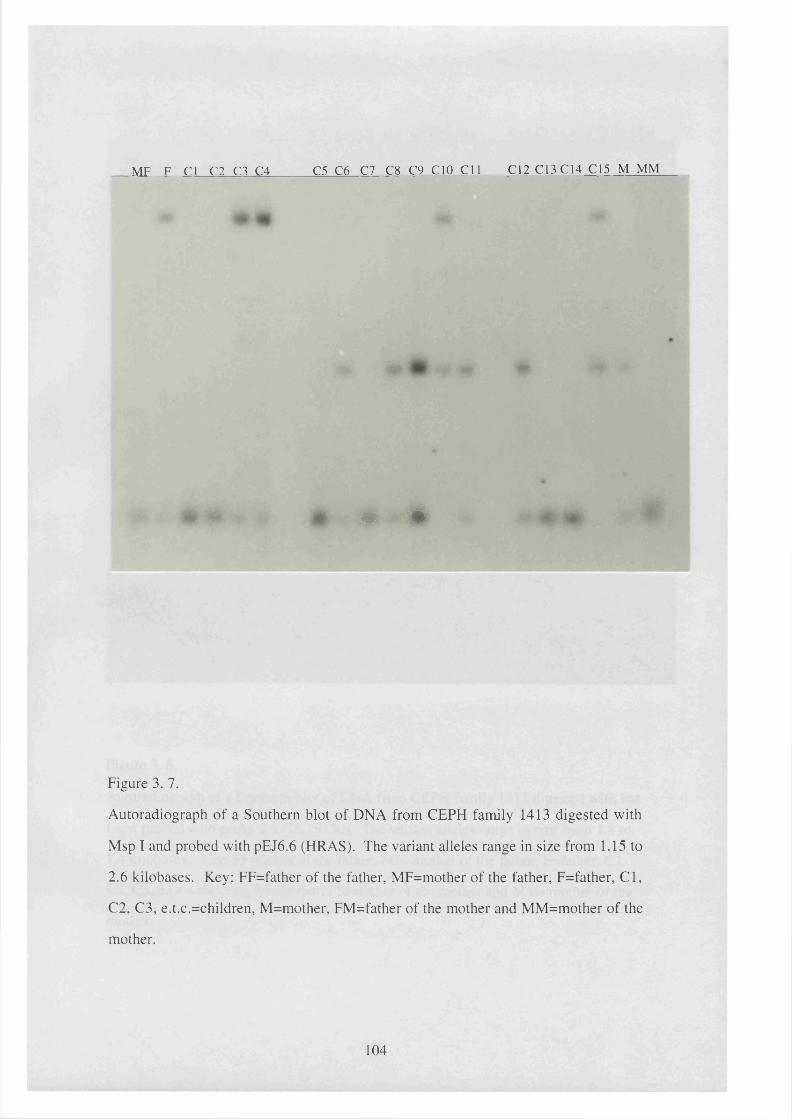
M F F C l C2 C3 C4 C5 C 6 Cl C8 C9 CIO C i l C 1 2 C 1 3 C 1 4 C15 M M M
m m
Figure 3.7.
Autoradiograph of a Southern blot of DNA from CEPH family 1413 digested with
Msp I and probed with pEJ6.6 (HRAS). The variant alleles range in size from 1.15 to
2.6 kilobases. Key: FF=father of the father, MF=mother of the father, F=father, C l,
C2, C3, e.t.c.=children, M=mother, FM=father of the mother and MM=mother of the
mother.
104
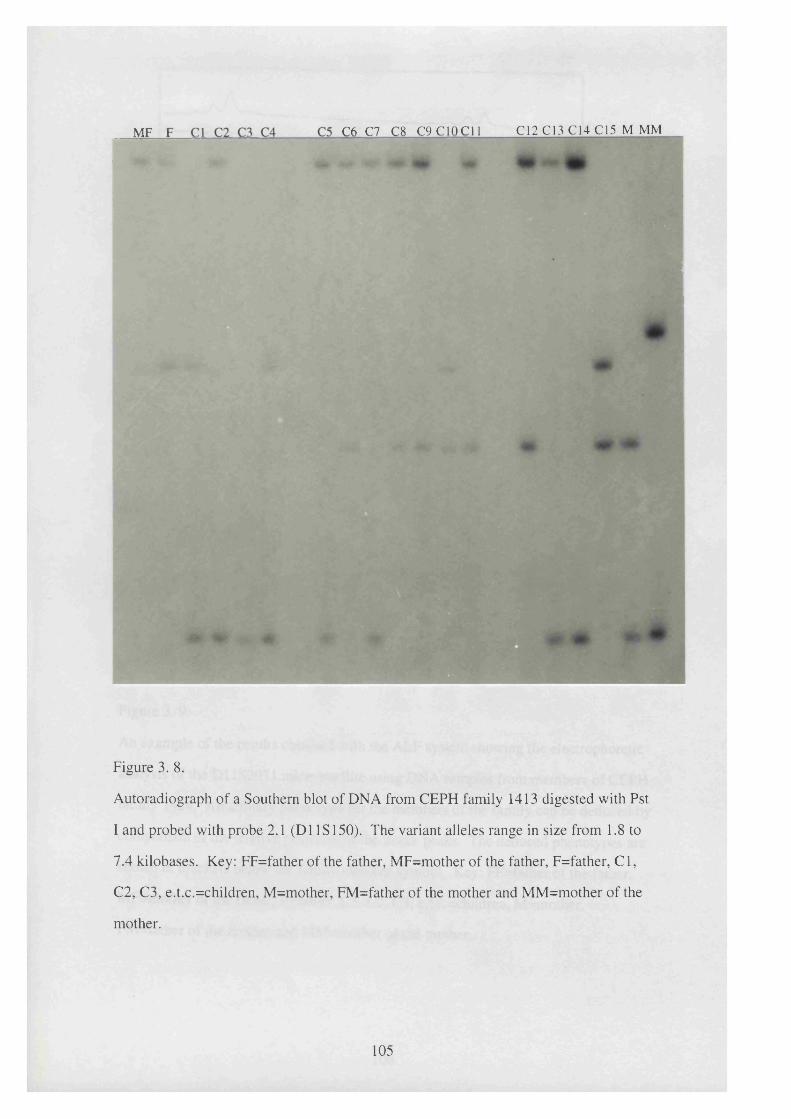
MF F C6 Cl C8 C9C10C11 C12 C13 C14 C15 M MM
Figure 3.8.
Autoradiograph of a Southern blot of DNA from CEPH family 1413 digested with Pst
I and probed with probe 2.1 (D11S150). The variant alleles range in size from 1.8 to
7.4 kilobases. Key: FF=father of the father, MF=mother of the father, F=father, C l,
C2, C3, e.t.c.=children, M=mother, FM=father of the mother and MM=mother of the
mother.
105

(2 .4 )
(4 .6 )
C2( 1. 2 )
( 1. 2 )
C4 (4 .6 )
(4 .6 )
C6(1 .4 )
(4 .6 )
C8 (4. 6)
MF(5 .6 )
PM(1 .4 )
MM( 1. 2 )
Figure 3. 9.
An example of the results obtained with the ALP system showing the electrophoretic
analysis of the D11S2071 microsatellite using DNA samples from members of CEPH
family 1424. An arbitary phenotype for the members of the family can be deduced by
comparison of the relative positions of the major peaks. The deduced phenotypes are
shown in brackets below the family member symbol. Key; FF=father of the father,
MF=mother of the father, F=father, C l, C2, C3, e.t.c.=children, M=mother,
FM=father of the mother and MM=mother of the mother.
106
Figure 3. 10.
A diagrammatic representation of the eleven most informative meiotic breakpoints in
the region of chromosome 1 lp l5 . Each recombination is supported by at least two
informative markers either side of the breakpoint. The genes are shown in order and the
parental and grandparental origin of each chromosomal region indicated as is the CEPH
family number and individual number. The possible positions of MUC5AC and
D1 IS 150 are shown and the individual results for these markers are given below the
main diagram.
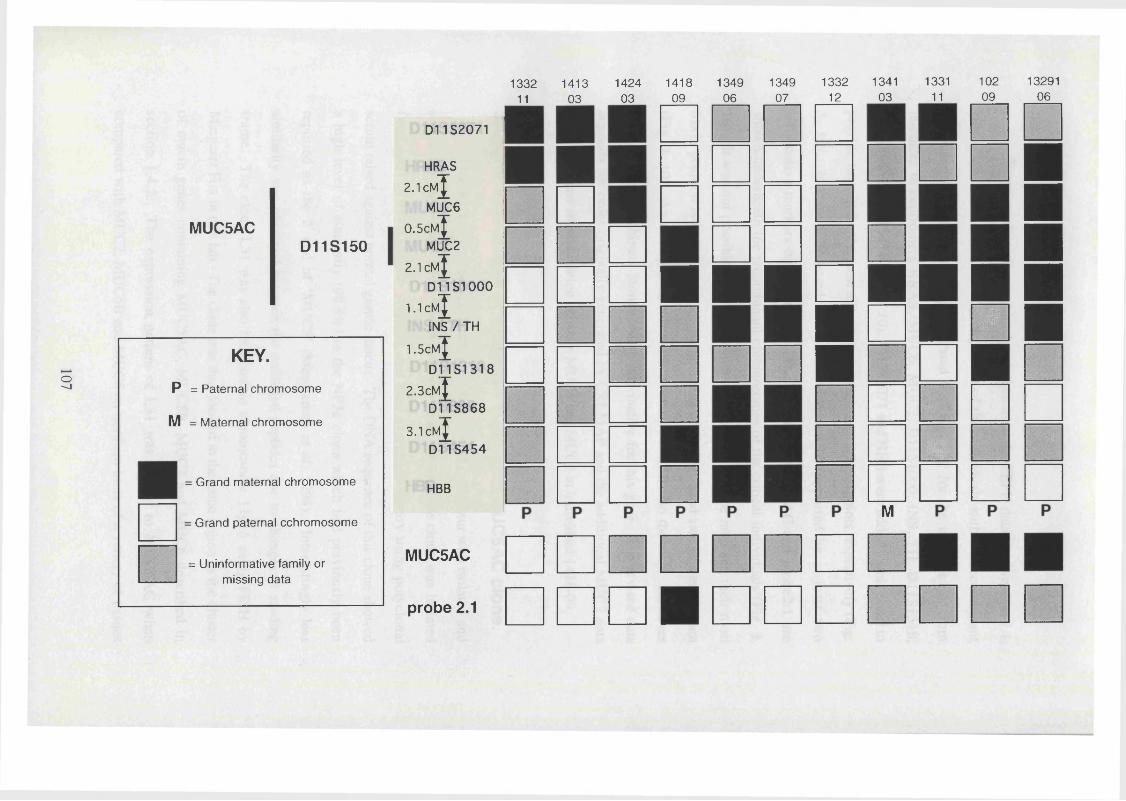
s
MUC5ACD11S150
KEY.
P = Paternal chromosome
M = Maternai chromosome
Grand maternai chromosome
Grand paternal cchromosome
= Uninformative family or missing data
D11S2071
HRAS
Z.IcmJMUC6
O.ScmJMUC2
2.1 cmJD l l 8 1 0 0 0
1.1 cmJINS / TH
I.ScmJD 11S1318
2 .3 cmJ
D11S868
3.1 cmJ
D11S454
HBB
MUC5AC
probe 2.1
133211
141303
142403
141809
134906
134907
133212
134103
" - i
M
133111
1
10209
1329106
■■ ■ ' j■4 ^
% fA
These results were combined with data from the CEPH data base version 7.1.
Haplotypes were constructed by inspection of the individuals with the recombinant
chromosomes using the order generated by CRI-MAP for the markers i.e. from
telomere to centromere HRAS, MUC6 , MUC2, D1 IS 1000, INS, TH, D11S1318,
D11S868 and D11S454 (Fig. 3. 10). D11S2071 and HBB were added to this order to
provide support for the most telomeric and centromeric breakpoints respectively (Fig.
3. 10). It should be noted that each breakpoint is supported by at least two
informative markers on either side. The results for MUC5AC and probe2.1 are
shown underneath the recombinant chromosomes of the critical individuals (Fig. 3.
10). It was not possible to insert them unambiguously into the map and their most
likely position is indicated by the vertical bars on the left hand side of the diagram
(Fig. 3. 10). An attempt was also made to insert MUC5B into the map. However
none of the recombinant families were informative for this gene. The revised data
supports the order originally generated by CRI-MAP and the additional MUC2 data
reveals another recombination between MUC6 and MUC2 in individual 1418-09.
3.4. Characterisation of a putative 0 terminal MUC5AC clone.
This work was done in collaboration with Theda Lesuffleur who isolated and
sequenced the partial cDNA L31 (Lesuffleur et al. 1995). The clone was isolated
from a HT29 MTX (mucus secreting cell line) expression library using polyclonal
serum raised against normal gastric mucus. The DNA sequence of this clone showed
a high level of similarity (98.6%) to the NP3a clone which had previously been
reported as the 3' end of ‘MUC5’ (Meerzaman et al. 1994). Interestingly less
similarity was observed between the predicted peptides due to changes in reading
frame. The clone L31 was also localised to chromosome l lp lS using FISH by
Margaret Fox in this lab. The clone was thus located to the same region as the cluster
of mucin genes containing MUC5AC, MUC5B, MUC2 and MUC6 described in
section 1.4.2. The expression pattern of L31 was similar to MUC5AC when
compared with MUC2, MUC5B and MUC6 on northern blots of a variety of tissues
108
(Lesuffleur, Roche et al. 1995). These results suggested that the L31 clone maybe
part of the non tandem repeat sequence of MUC5AC.
Thus I attempted to use Southern blot analysis of human genomic DNA to
pursue this further. Southern blots of DNA from 4 individuals digested with Seal and
EcoRI probed with both L31 and JER58 (MUC5AC). These enzymes were chosen
because they did not cut within the L31 sequence and because JER58 detects large
single fragments with these enzymes. L31 detected a single Seal fragment of 9.5kb
and when the same filter was probed with JER58 a single fragment of greater than
18kb was detected (Fig. 3. 11). However on DNA digested with EcoRI a single
fragment of approximately 20kb was detected with both L31 and JER58 (Fig. 3. 11)
The Lille group had detected evidence of polymorphism with JER58 using
DNA digested with H indlll and Xba I (Pigny et al. 1995). Both enzymes detect two
large alleles in some individuals which were not detected in the samples we tested,
run under the standard electrophoretic conditions used initially in the laboratory or by
EUROGEM. The Lille group supplied us with two individuals who were
heterozygous when probed with JER58 for both Hindlll and Xba I to use as a control.
A DNA sample from one of these individuals digested with H indlll was run using the
phosphate buffer system recommended by the Lille group together with DNA from
individuals of unknown genotype and Southern blots of these gels were probed with
L31 and then JER58. Unfortunately the separation was not as good as that achieved
by the group in Lille and L31 is a poor probe, although it did seem that L 31 detected
the same two alleles as JER58 (results not shown). These results were not conclusive
and further experiments are needed.
The results from Southern blots probed with JER58 and L31 indicates that
they are physically very close (18-30kb). These results together with the evidence of
the expression studies suggest that L31 is part of the MUC5AC gene and may
correspond to the 3' end as indicated by the presence of a poly A tail in the cDNA
clone.
109
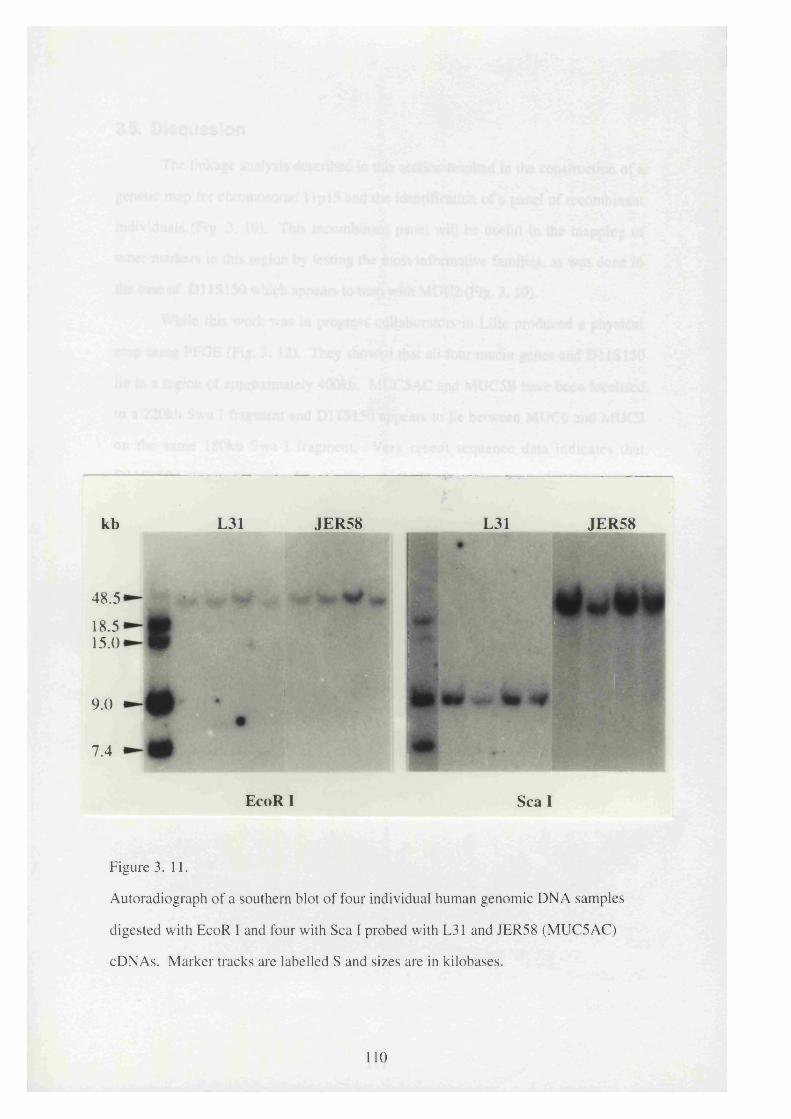
kb
48.5
18.515.0
9.0
7.4
L31 JER58
7^'
L31 JER58
5
EcoR I Sea I
Figure 3.11.
Autoradiograph of a southern blot of four individual human genomic DNA samples
digested with EcoR I and four with Sea I probed with L31 and JER58 (MUC5AC)
cDNAs. Marker tracks are labelled S and sizes are in kilobases.
110

3.5. Discussion
The linkage analysis described in this section resulted in the construction of a
genetic map for chromosome 1 Ip 15 and the identification of a panel of recombinant
individuals (Fig. 3. 10). This recombinant panel will be useful in the mapping of
other markers in this region by testing the most informative families, as was done in
the case of D11S150 which appears to map with MUC2 (Fig. 3. 10).
While this work was in progress collaborators in Lille produced a physical
map using PFGE (Fig. 3. 12). They showed that all four mucin genes and D1 IS 150
lie in a region of approximately 400kb. MUC5AC and MUC5B have been localised
to a 220kb Swa I fragment and D l l 8150 appears to lie between MUC6 and MUC2
on the same ISOkb Swa I fragment. Very recent sequence data indicates that
D1 IS 150 is located in one of the introns of MUC2 (Pratt unpublished). The genetic
map presented here is in agreement with the order of the genes deduced from the
PFGE data i.e. MUC6 is at one end of the cluster followed by D11S150, MUC2,
MUC5AC and then MUC5B, although the MUC5 genes could not be placed
unambiguously in the linkage map. Evidence for the orientation of the gene cluster
with respect to other genes on chromosome 11 and thus the telomere and centromere
came from a few large PFGE fragments i.e. HRAS localised to the same 750kb Clal
fragment as M UC6 and MUC2. This agrees with the orientation of M UC6 and
MUC2 in the linkage map, in which MUC6 goes with HRAS (towards the telomere)
and MUC2 goes with genes which lie towards the centromere.
I l l

Figure 3. 12.
A diagrammatic representation of the map of the mucin genes in the region of
chromosome 1 lpl5.5 as determined by PFGE (adapted from [Pigny, 1996 #210]).

HRAS IGF2
500K B 400kb 1200kb- I
Mlu 1 Sac II
BssH II
M lu I
Pac I N ot I Sw a I Sac II
N ot I Sac II
BssH II
to
Sac II B ssH II C la l Sw a I
Sac II Sac II Sac II BssH II B ssH II C la I
BssH II N ot I N ot I Pac I
Sac II B ssH II
N ot ISac II Sw a I
M lu I
60 kb
180 kb 2 2 0 kbM U C 6 tandem repeats
D 1 1 S 150 tandem repeats
M U C 2 tandem repeats
M U C 5A C tandem repeats
M U C 5B com plete gene

Neither of the families which had recombinations between MUC6 and
D11S150/MUC2 were informative for MUC5AC. Indeed no recombinations were
identified between MUC5AC and MUC6 or D11S150/MUC2. It is perhaps
somewhat surprising that two recombinations were identified between MUC6 and
D11S150/MUC2 considering the close proximity of these two genes, indeed the
PFGE data suggests that the distance between D11S150 and MUC6 may only be
60kb. This suggests that the observed level of recombination between MUC6 and
MUC2 is quite high. Indeed it appears that this region is relatively recombination
rich although as can be seen in Figure 3 .10 there does not seem to be a particular hot
spot but rather the recombinations are scattered along this region of chromosome 1 1 .
It is interesting to note that of the 11 well supported recombinations in this region
only 1 is on the maternal side which contrasts with the observation that there is more
recombination in the female genome compared to the male (Haldane 1922). This
relative increase in the amount of recombination in the telomeric regions of males
compared with females was observed when sex specific chiasmata density maps of
mouse chromosome 2 were compared (Povey et al. 1992). Another example comes
from a chiasmata density and interference map of human chromosome 9 in males
which again shows obvious clustering of meiotic breakpoints at the terminal regions
(Povey, Smith et al. 1992). Unfortunately chiasmata data for human female are not
available so direct comparisons are not possible. Male bias at the telomeres has also
been reported for a number of other chromosomes such as chromosome 21 (Blouin et
al. 1995). The increase in the availability of genetic mapping data and the publication
of sex specific maps will enable more detailed studies of this phenomenon.
The mucin clones used for the analysis of the polymorphisms and linkage
analysis were amongst the first isolated and are mostly partial cDNA clones
comprised of tandem repeats. A considerable amount of effort has been devoted to the
cloning of the complete cDNA sequences of the chromosome 11 mucin genes and
more recently clones such as L31 containing ‘unique’ sequences have been isolated
(Lesuffleur, Roche et al. 1995). Prior to the cloning of L31 a very similar clone NP3a
113
had been identified and characterised by D. Meerzaman et al which they claimed
represents the 3' end of ‘MUC5’ (Meerzaman, Charles et al. 1994). The NP3a clone
was isolated using degenerate primers based on the peptide sequence of that reported
by Rose et al (Rose et al. 1989). The C terminal of this peptide contains a sequence of
14 amino acids which is also present in a 22 amino acid sequence deduced from the
unique’ sequences shared by some of the MUC5AC clones (Aubert et al. 1991).
NP3a also contains a stop codon that is followed by a putative poly adénylation signal
16 nucleotides upstream of the poly (A) tail of 18 nucleotides which suggests that it
corresponds to the 3' end of the gene.
Analysis of the peptide sequence encoded by NP3a shows some similarity to
MUC2, vWF, bovine and porcine submaxillary mucin and rat mucin like protein
especially in the conservation of the number and position of the cysteines and it
mapped to chromosome 11. The clone L31 shows a high level of identity to NP3a at
the nucleotide level i.e. 98.6% (Appendix III). However there is less identity at the
level of the peptide due to shifts in the reading frame caused by the small number of
nucleotide differences (Fig. 3. 13). However the peptide sequence of L31 shows
some similarity to the carboxyl terminal of MUC2, especially in the conservation of
the number and position of the cysteine residues. It is interesting to note that there is
also some similarity to the cystine knot found in the Norrie disease protein
(Meitinger, Meindl et al. 1993). When the number and positions of the cysteines in
the peptide sequences of MUC2, NP3a and L31 are compared there appears to be
better agreement between L31 and MUC2 (Fig. 3. 13). In particular one of the
cysteines in the cystine knot like region is present in both L31 and MUC2 but not in
NP3a (fig 3. 13).
114

Figure 3. 13.
Sequence alignments of the predicted peptide sequences of carboxyl terminal of MUC2
and the cDNA clones L 31 and NP3a.. The conserved cysteine residues have been
underlined. The sequence in italics is were NP3a goes out of reading frame with
respect to L31.
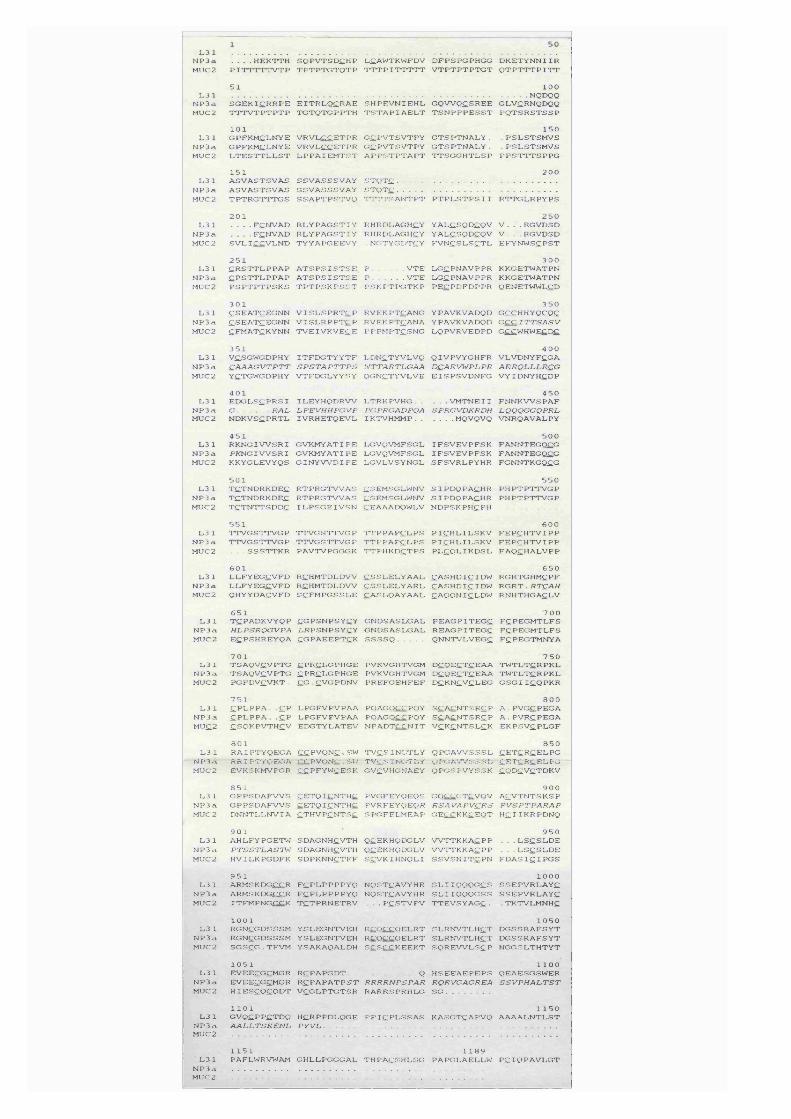
L 3 1 N P 3 a M U C 2
. . . . H E K T T H S Q P V T S D S IH P L £A W T K W F D V D F P S P G P H G G D K E T Y N N I I R P I T T T T T V T P T P T P T G T O T P T T T P I T T T T T V T P T P T P T G T O T P T T T P I T T
5 1 1 0 0L 3 1 NQ DQ Q
N P 3 a S G E K I ^ R R P E E I T R L Q £ R A E S H P E V N I E H l , G Q W Q ^ S R E E G L V £ R N Q D Q QM U C 2 T T T V T P T P T P T G T Q T G P P T H T S T A P I A E L T T S N P P P E S S T P Q T S R S T S S P
1 0 1 1 5 0L 3 1 G P F K M C L N Y E V R V L C C E T P R G ^ P V T S V T P Y G T S P T N A L Y . . P S L S T S M V S
N P 3 a G P F K M E L .N Y E V R V L C C E T P R G C P V T S V T P Y G T S P T N A L Y . . P S L S T S M V SM U C 2 L T E S T T L L S T L P P A I E M T S T A P P S T P T A P T T T S G G H T L S P P P S T T T S P P G
1 5 1 2 0 0L 3 1 A S V A S T S V A S S S V A S S S V A Y S T V T Ç ................................................................................................
N P 3 a A S V A S T S V A S S S V A S S S V A Y S T Q T C ................................................................................................M U C 2 T P T R G T T T G S S S A P T P S T V y T T T T S A W T P T P T P L S T P S I I R T T G L R P Y P S
201L 3 1 . . . . F C N V A D R L Y P A G S T I Y R H R D L A G H C Y Y A L C S Q P C Q V
N P 3 a . . . . F C N V A D R L Y P A G S T I Y R H R D L A G H C Y Y A L C S Q D C Q VM U C 2 S V L I C C V L N D T Y Y A P G E E V Y NC^TYGDTCY F V N C S L S C T L
2 5 0V . . . R G V D S D V . . . R G V D S D E F Y N W S C P S T
2 5 1L 3 1 C R S T T L P P A P A T S P S I S T S E P .................... V T E
N P 3 a C P S T T L P P A P A T S P S I S T S E P .................... V T EM U C 2 P S P T P T P S K S T P T P S K P .S .S T P .S K P T P G T K P
3 0 1L 3 1 C S E A T Ç E G N N V I S L S P R T C P R V E K P T C A N G
N P 3 a C S E A T Ç E G N N V I S L R P P T C P R V E K P T C A N AM U C 2 C F M A T C K Y N N T V E I V K V E C E P P P M P T C -S N G
L G C P N A V P P Rl g c p n a v p p r
P E C P D F D P P R
Y P A V K V A D Q DY P A V K V A D Q DL Q P V R V E D P D
3 0 0K K G E T W A T P NK K G E T W A T P NQ EN ET W W L C D
3 5 0GC£HHYQCQCC C C IT T S A S VG CCW H W ECDC
3 5 1L 3 1 VC-SG W G D PH Y I T F D C T Y Y T F L D N C T Y V L V Q Q I V P V Y G H F R
N P 3 a C A A A G V TPT T S P S T A P T T P S WTTARTL.GAA DQARVWPhPRM U C 2 Y C T G W G D P H Y V T F D G L Y Y S Y O G N C T Y V L V E E I S P S V D N F G
4 0 0V L V D N Y F C G AARRQLLLRCGV Y I D N Y H C D P
4 0 1L 3 1 E D G L S C P R S I I L E Y H O D R W L T R K P V H G ..................... V M T N E I I
N P 3 a G F A L L.PEVHHPGVP PGPRGADPQA SPRGVDKRDHM U C 2 N D K V S C P R T L IV R H E T Q E V L IK T V H M M P .........................MQVQVQ
4 5 0F N N K W S P A FEQQQGGQPREV N R Q A V A L P Y
4 5 1 5 0 0L 3 1 R K N G X W S R I G V K M Y A T IP E L C V y V M F S G L I F S V E V P F S K F A N N T E G O C G
N P 3 a P K N G I W S R I G V K M Y A T IP E L C V Q V M F S G L I F S V E V P F S K F A N N T E G O C GM U C 2 K K Y G L E V Y Q S G I N Y W D I P E L G V L V S Y N G L S F S V R L P Y H R F G N N T K G Q C G
5 0 1 5 5 0L 3 1 T C T N D R K D E C R T P R G T W A S C S E M S G L W N V S I P D Q P A C H R P H P T P T T V G P
N P 3 a T C T N D R K D E C R T P R G T W A .S C S E M S G L W N V .S I P D Q P A C H R P H P T P T T V G PM U C 2 T C T N T T S D D C I L P S G E I V S N C E A A A D Q W L V N D P S K P H C P H .................................
5 5 1L 3 1 T T V G S T T V G P T T V G S T T V G P T T P P A P C L P S
N P 3 a T T V G S T T V G P T T V G S T T V G P T T P P A P C L P SM U C 2 . . . S S S T T K R P A V T V P G G G K T T P H K D C T P S
6 0 1L 3 1 L L F Y E G C V F D R C H M T D L D W C S S L E L Y A A L
N P 3 a L L F Y E G C V F D R C H M T D L D W C S S L E L Y A R LM U C 2 Q H Y Y D A C V F D S C E M P C S S L E C A S L Q A Y A A L
P I C H L I L S K VP I C H L I L S K VP L C Q L I K D S L
c a s h D i e I D W C A S H D I C I D W C A Q Q N IC D D W
6 0 0F E P C H T V I P PF E P C H T V I P Pf a q c h a l v p p
6 5 0r g r t g h m c p f
R G R T . RTQAHr n h t h g a c l v
6 5 1 7 0 0L 3 1 T C P A D K V Y Q P C G P S N P S Y C Y C N D S A S L G A L P E A G P I T E G C F C P E G M T L F S
N P 3 a HEPSRQGVPA L F P S N P S Y C Y C N D S A S L G A L R E A G P I T E G C F C P E G M T L F SM U C 2 E C P S H R E Y Q A C G P A E E P T C K S S S S Q Q N N T V L V E G C F C P E G T M N Y A
7 0 1 7 5 0L 3 1 T S A Q V C V P T G C P R C D G P H G E P V K V G H T V G M Q C Q E C T C E A A T W T L T C R P K L
N P 3 a T S A Q V C V P T G C P R C L G P H G E P V K V G H T V G M D C Q E C T C E A A T W T L T C R P K LM U C 2 P G F D V C V K T . C G .C V G P D N V P R E F G E H F E F D C K N C V C L E G G S G I I C Q P K R
7 5 1 3 0 0L 3 1 C P D P P A . . C P L P G F V P V P A A P O A G O C C P O Y S C A C N T S R C P A . P V G C P E G A
N P 3 a C P L P P A . .C P L P G F V P V P A A PO AG O CC PO Y S C A C N T S R C P A . P V R C P E G AM U C 2 C S Q K P V T H C V E D G T Y L A T E V N P A D T C C N I T V C K C N T S L C K E K P S V C P D G F
8 0 1 8 5 0L 3 1 R A I P T Y Q E G A C C P V Q N C ^ S W T V C S I N G T L Y Q P G A W S S S L C E T C R C E L P G
N P 3 a R R I P T Y Q E G A C C P V O N C . SW T V C S I N C iT L Y Q P G A W .S .S .S L C E T C R C E L P GM U C 2 E V K S K M V P G R C C P F Y W C E .SK G V C V H G M A E Y Q P G S P V Y S S K C Q D C V C T D K V
8 5 1 9 0 0L 3 1 G P P S D A F W S C E T Q I C N T H C P V G F E Y Q E Q S G O C C G T C V O V A Ç V T N T S K S P
N P 3 a G P P S D A F W S C E T Q I C N T H C P V R F E Y Q E Q F R SAVAPVQ RS P V SPT PA R A PM U C 2 D N N T L L N V I A C T H V P C N T .S C S P G F E L M E A P C E C C K K C E O T H C H K R P D N Q
9 0 1 9 5 0L 3 1 A H L F Y P G E T W S D A G N H C V T H Q C E K H Q D G L V W T T K K A C P P - . . L S C S L D E
N P 3 a P T S S T L A S W S D A G N H C V T H Q C E K H Q D G L V W T T K K A C P P . . . L S C S L D EM U C 2 H V I L K P G D F K S D P K N N C T F F S C V K I H N Q L I S S V S N I T C P N F D A S I C I P G S
9 5 1 1 0 0 0L 3 1 A R M SK D C C C R F C P D P P P P Y Q N Q S T C A V Y H R S L I I Q Q Q C C S S .S E P V R L A Y C
N P 3 a A R M SK D C C C R F C P D P P P P Y Q N Q S T C A V Y H R S L I I Q Q Q C S S S S E P V R L A Y CM U C 2 IT F M P N G C C K T C T P R N E T R V . . . P C S T V P V T T E V S Y A G C - . T K T V L M N H C
1 0 0 1 1 0 5 0L 3 1 R G N C G D S S S M Y .S L E G N T V E H RCOC C O E L R T S L R N V T L H C T D C S S R A F S Y T
N P 3 a R G N C G D S S S M Y .S L E G N T V E H R C O C C O E L R T S L R N V T L H C T D C S S R A F S Y TM U C 2 S G .S C G .T F V M Y S A K A Q A L D H S C S C C K E E K T S Q R E W L .S C P N G G S L T H T Y T
1 0 5 1 1 1 0 0L 3 1 E V E E C G C M G R R C P A P G D T ..............................................Q H S E E A E P E P S Q E A E S G S W E R
N P 3 a E V E E C G C M G R R C P A P A T P S T RRRRN PSPAR RQRVGAGREA SSV PH AL.TSTM U C 2 H I E S C Q C Q D T V C C L P T G T S R R A R R S P R H L C S C ...........................
1 1 0 1 1 1 5 0L 3 1 G V Q C P P C T D Q H C R P P D L Q G E P P I C P L S S A S K A .S C T C A P V Q A A A A L N T L S T
N P 3 a AAELTSKENE P Y V E ..............................................................................................................................................M U C 2 ....................................................................................................................................................................................................
1 1 5 1 1 1 8 9L 3 1 PAFLW RV W AM G H L L P G G G A L T H P A C -S H L S G P A P G L A E L L W P C I Q P A V L G T
N P 3 a .......................................................................................................................................................M U C 2 .......................................................................................................................................................

The relationship between clones NP3a and L31 is not clear. There are a
number of possible explanations for the differences between these clones i.e. genetic
polymorphism, the existence of more than one very similar gene or repeated exons.
The number of differences and the changes in reading frame makes it seem unlikely
that the differences between these two sequences are due to polymorphism. The high
level of similarity between L31 and NP3a indicates that there would be cross
hybridisation so that if there were two genes, probes made from either clone
would detect both genes. However a single EcoRI fragment of 20+kb is detected
with both L 31 and JER58 which suggests that the 3' ends and all the tandem repeat
sequences of both genes would have to be located within a region of about 2 0 kb
which seems unlikely (Fig. 3.11) although it is conceivable that two fragments might
comigrate. If L31 does detect the same Hindlll polymorphism as JER58 this makes
that possibility less likely. L31 also detects an 8 kb Seal fragment (Fig. 3. 11)
suggesting that both the L 31 and NP3a sequences would have to be located within
less than 8 kb of each other. It is interesting to note that the position and number of
the cysteine residues are better conserved between the predicted peptide sequence of
L31 and MUC2 than NP3a and MUC2 (Fig. 3. 13). When the peptide sequences of
other mucin genes such as MUC2 were compared with their homologues in other
species the conservation of the non repetitive sequences especially with respect to the
cysteine residues was extremely high (Gum, Hicks et al. 1994). This indicates that
the number and position of the cysteine residues is important for the function of the
glycoprotein. All these observations together suggest another possible explanation
for the differences between L31 and NP3a, namely that mistakes were made during
the sequencing of the NP3a clone.
The restriction fragment length polymorphisms detected with tandem repeat
probes for MUC2, MUC6 and MUC5AC and a wide variety of enzymes appear to be
mainly due to variation in the number of tandem repeats.
Polymorphism of MUC2 detected with TaqI has been well characterised by
our collaborators in San Francisco and is discussed in section 1.4.2.1. The
116
polymorphism detected with TaqI is interesting as it shows not only is there VNTR
variation but also polymorphic restriction sites located within the tandem repeats
themselves which produces complex patterns. This may have some relevance to the
interpretation of complex polymorphisms detected with TaqI, MspI and PvuII for
MUC5AC, although the structure of the gene is somewhat different in that there are
regions of tandem repeats separated by so called unique sequences which also appear
to be repeated as described in section 1.4.2.2. The patterns detected with TaqI, MspI
and PvuII suggest that there may in fact be two major polymorphic regions within the
MUC5AC gene and comparison of the relative mobilities is suggestive of VNTR
variation. Figure 3. 3 shows the correspondence of the relative mobilities of the
smaller set of fragments. The relationship between the patterns of the larger set of
fragments detected with the different enzymes is more complex and may indicate
further polymorphism arising from polymorphic restriction sites. Evidence for
VNTR variation of the larger fragments is provided by the simple patterns detected
with the enzymes PstI and Hinfl which both show similar relative of mobilities (Fig.
3. 4). Further work carried out in this laboratory indicates that Hinfl is cutting
outside the large set of tandem repeats while PstI cuts outside all the tandem repeat
regions.
The similarity between the relative mobilities of the polymorphic fragments
detected with the MUC6 probe on DNA digested with TaqI and PvuII suggest that the
polymorphism is due to VNTR variation of a single region of tandem repeats with
the restriction sites located in flanking regions.
A feature of the three mucin genes is their hypervariability which is illustrated
by the large number of alleles. However due to the limits of resolution of the
Southern blots it is not possible to determine the exact number of distinct alleles,
although in the case of MUC2 and MUC6 it is possible to place the alleles in a
number of size categories. Thus the number of distinct alleles of MUC2 is probably
more than 9 and for MUC6 more than 11. It would seem likely that the
hypervariability is a direct consequence of a high mutation rate. Thus it is interesting
117

that two MUC2 mutations were detected in the EUROGEM series of CEPH families
which corresponds to approximately 400 offspring (Fig. 3. 6 ). Given the small
sample size it is not significant that no mutations were observed with MUC6 or
MUC5AC. Indeed the two mutations observed with MUC2 is comparable to the
number observed with some minisatellites (Jeffreys et al. 1988).
The heterozygosities calculated for MUC2 (0.64), MUC6 (0.70) and
MUC5AC (0.60 for the upper set of bands and 0.36 for the lower set) are fairly high
although not as high as those observed for most minisatellites (Vergnaud, Mariat et
al. 1991).
The 40 CEPH EUROGEM families are comprised of geographically distinct
populations mostly from France and Utah and the allele distributions shown in figure
3. 5 may obscure differences in the distribution of alleles between different
populations (Fig. 3 .5 ). When the distributions for the largest sub population (from
Utah) were compared to the overall patterns, for both MUC2 and MUC6 , they where
broadly in agreement. This indicates that there is probably no significant difference
in the allele distributions between the various populations comprising the EUROGEM
series.
Interestingly the allele length distribution of MUC2 appears to show a
bimodal distribution whereas the distribution of MUC6 allele sizes appears to be
approximately unimodal (Fig. 3. 5) although a trimodal distribution has been reported
in a Portuguese population (F. Carvalho and L. David personal communication). The
bimodal and trimodal distributions may indicate large scale mutations such as
duplications of portions of DNA including tandem repeat sequences. Possible
mechanisms for the duplication of large regions of DNA are through unequal crossing
over during meiosis or sister chromatid exchange. These mechanisms may be
responsible for the germ line mutation observed in the mother of family 1333 and
inherited by a number of her offspring (Fig. 3. 6 ). The mutant allele appears to be
approximately twice the size of the alleles present in both the maternal grandparents.
If this mutant allele is due to unequal crossing over during meiosis then one would
118
expect markers flanking MUC2 to be recombined. Unfortunately without data for the
great-grandparents or the mothers siblings it is not possible to determine whether the
flanking markers are recombined. Interestingly the cluster of smaller alleles of
MUC2, shown in figure 3. 5 A, are approximately half the size of the main peak.
Possibly the larger alleles arose after duplication of one of the smaller alleles.
The relative lack of recombination between markers flanking minisatellites
and analysis of MVRs indicate that processes such as slippage and sister chromatid
exchange are responsible for the generation and maintenance of VNTR
polymorphisms, as discussed in section 1.1. Indeed the specific example of the
analysis of two polymorphisms in MUCl flanking the major tandem repeat region
also suggests that unequal crossing over during meiosis may not be a major cause of
VNTR variation in mucin genes, discussed in section 1.4.1. The large size
differences between the mucin gene alleles suggests that unequal gene conversion or
sister chromatid exchange is perhaps more likely than slippage. Interestingly the
mutation in child C l 1 of family 1331 also supports the notion that unequal
recombination is not involved as no recombination is detected between the flanking
markers (Appendix 11).
Thus it would seem that although there is a relatively high level of meiotic
recombination in this region of chromosome 11 other processes such as unequal
exchange between sister chromatids or unequal gene conversion maybe responsible
for the maintenance of the VNTR polymorphisms in the mucin genes and possibly for
the duplication of genes.
The conservation of repetitive sequences between different mucin genes is
very poor even though the unique sequences appear well conserved (Pemberton,
TaylorPapadimitriou et al. 1992). However one fairly common feature of the peptide
sequences predicted from the repetitive DNA is the presence of hydroxyl amino acids
which could be potential O-glycosylation sites. This indicates that the role of the
repeat sequences is to provide a backbone to which the large numbers of carbohydrate
side chains associated with mucins, are attached.
119

It is clear that particular regions are conserved between different mucin genes
in the same organism and homologous mucin genes in different organisms, especially
the cysteine rich regions which suggests that they are important in the function of
these molecules. This is perhaps not surprising as it has been speculated that the
cysteine rich regions of mucins may be involved in crosslinking of mucin
glycoproteins to produce the mucus gel and/or as receptor binding motifs which
recognise peptides expressed on the cell surface (Meitinger, Meindl et al. 1993).
120
4. Genetic and physical mapping of MUC3 located
on chromosome 7q22: results and discussion.
The mucin gene MUC3 was localised to chromosome 7q22 by in situ
hybridisation using the tandem repeat probe SIB 124 (Fox, Lahbib et al. 1992) prior to
the outset of this project. Polymorphism had also been detected by Southern blot
analysis, (Fig. 4. 1) as previously reported (Fox, Lahbib et al. 1992). The first two
sections of these results, 4.1.1 and 4.1.2, deal with the analysis of MUC3
polymorphisms and the genetic analysis of chromosome 7 with particular interest in
the chromosomal region around MUC3. The remaining sections, 4.1.3 and 4.1.4, are
concerned with the physical characterisation of the chromosomal region which
contains MUC3 and the attempts made to investigate the physical structure and
sequence of MUC3 itself.
121

4.1. Results
4.1.1. Analysis of the MUC3 polymorphisms and two-point linkage
analysis
When Southern blots of DNA digested with PvuII and PstI were probed with
the cDNA clone SIB 124, which is comprised of tandem repeat sequence, a restriction
fragment length polymorphism was detected which produces a distinctive pattern of
bands (Fig. 4. 2), The patterns in each case comprise two sets of bands with one set
of fragments larger than 18.5kb and the other set of fragments smaller than 15kb. All
40 CEPH families in the EUROGEM series were tested with PvuII and all the parents
together with 6 complete families were tested with Pstl. Each set of PvuII bands
shows independent allelic variation and there was no apparent association between
the two polymorphic regions in either case i.e. the variation seen in one set of
fragments is not dependent on that seen in the other set. A similar situation was
observed with Pstl. This suggests that the polymorphic regions of DNA are
physically separated in the genome and do not arise from common restriction sites.
The high level of variation together with the broad similarity of the patterns
observed with both PvuII and Pstl initially indicated that the polymorphism is simply
due to variation in the number of tandem repeats (VNTR) in the two zones (Fig. 4. 2).
However the analysis of unrelated individuals shows differences between the relative
mobilities of the bands detected with PvuII and Pstl for the smaller set of fragments.
This can clearly be seen in family 1341 in figure 4. 2 were the smaller set of bands
detected with PvuII appear to be homozygous in the children; C l, C3, C5, C6 and the
mother, MM, but are heterozygous with Pstl while the pattern in the father, F, appears
to be heterozygous with both PvuII and Pstl.
122
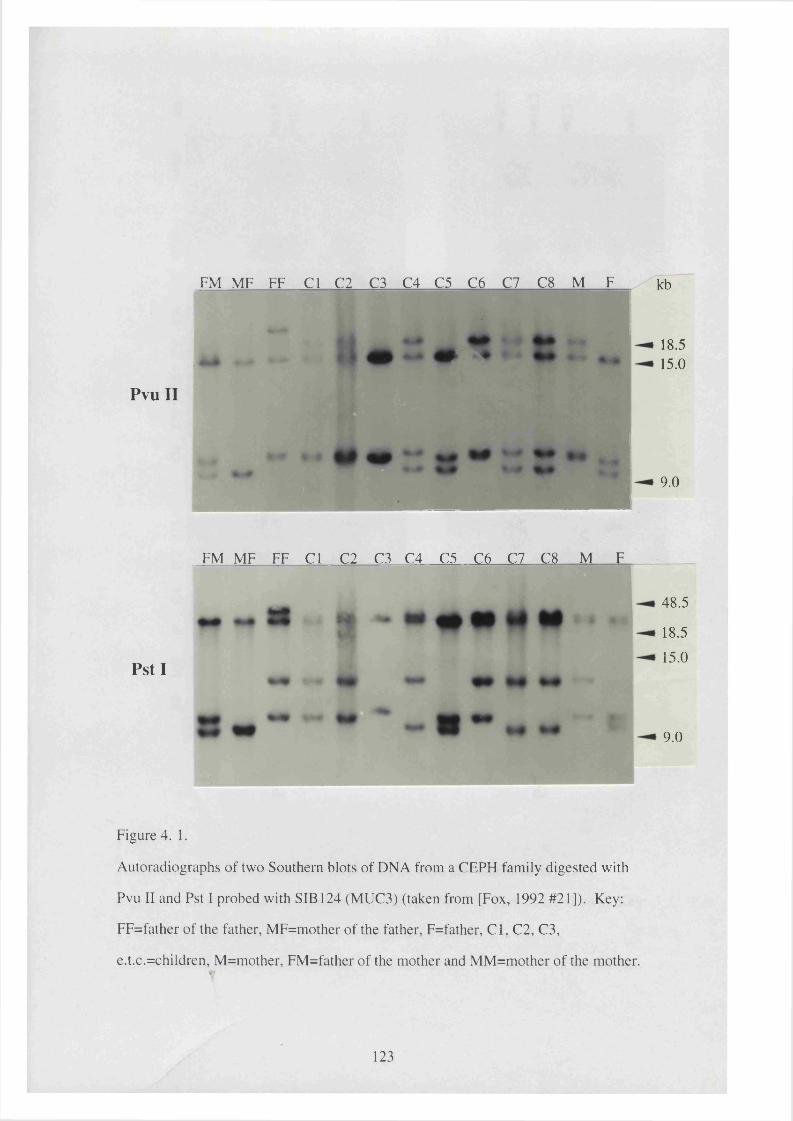
FM MF FF Cl C2 C3 C4 C5 C6 C7 C8 M F
Pvu II
kb
18.515.0
9.0
FM MF FF Cl C2 C3 C4 C5 C6 C7 C8 M F
Pst I
48.5
18.5
15.0
9.0
Figure 4. 1.
Autoradiographs of two Southern blots of DNA from a CEPH family digested with
Pvu II and Pst I probed with SIB 124 (MUC3) (taken from [Fox, 1992 #21]). Key:
FF=father of the father, MF=mother of the father, F=father, C l, C2, C3,
e.t.c.=children, M=mother, FM=father of the mother and MM=mother of the mother.
123
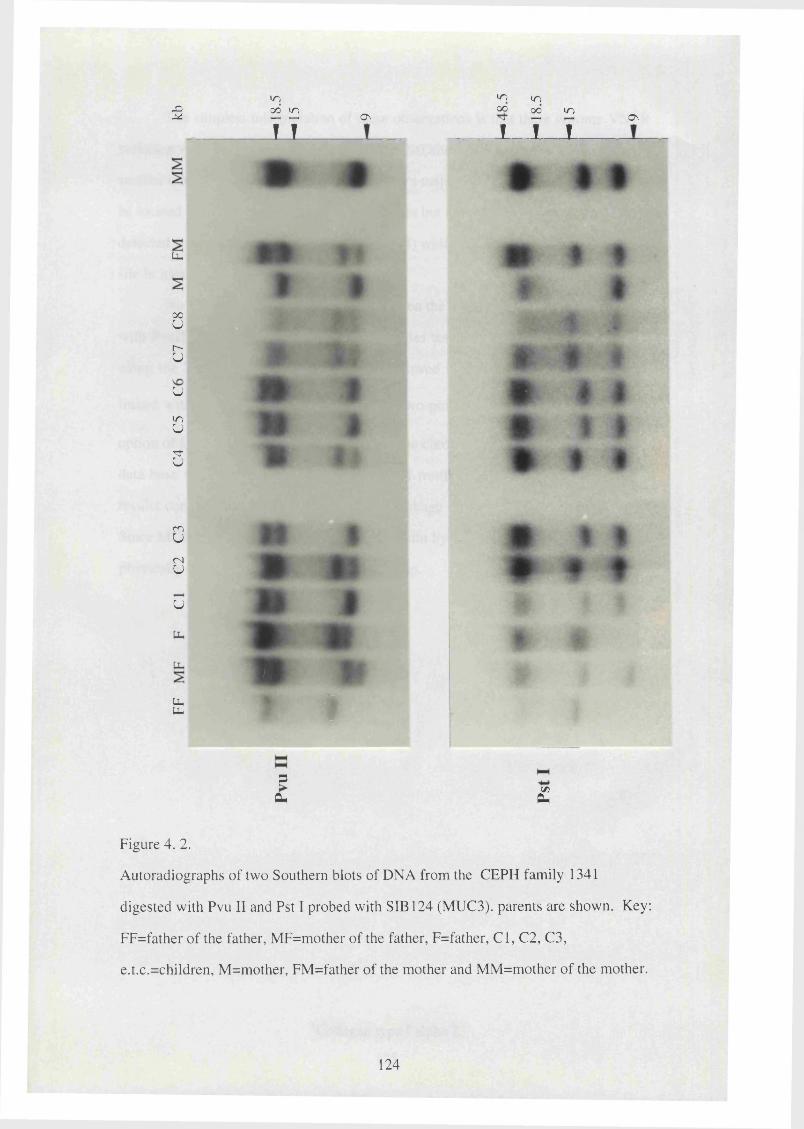
a1000 lo
1 1ON
lo looo 00 mN #—4 H
-T T TON
tu
00Ur -U
U
VIU
S
mU(Nu
u
UhUh f3
PL, £
Figure 4. 2.
Autoradiographs of two Southern blots of DNA from the CEPH family 1341
digested with Pvu II and Pst I probed with SIB 124 (MUC3). parents are shown. Key:
FF=father of the father, MF=mother of the father, F=father, C l, C2, C3,
e.t.c.=children, M=mother, FM=father of the mother and MM=mother of the mother.
124
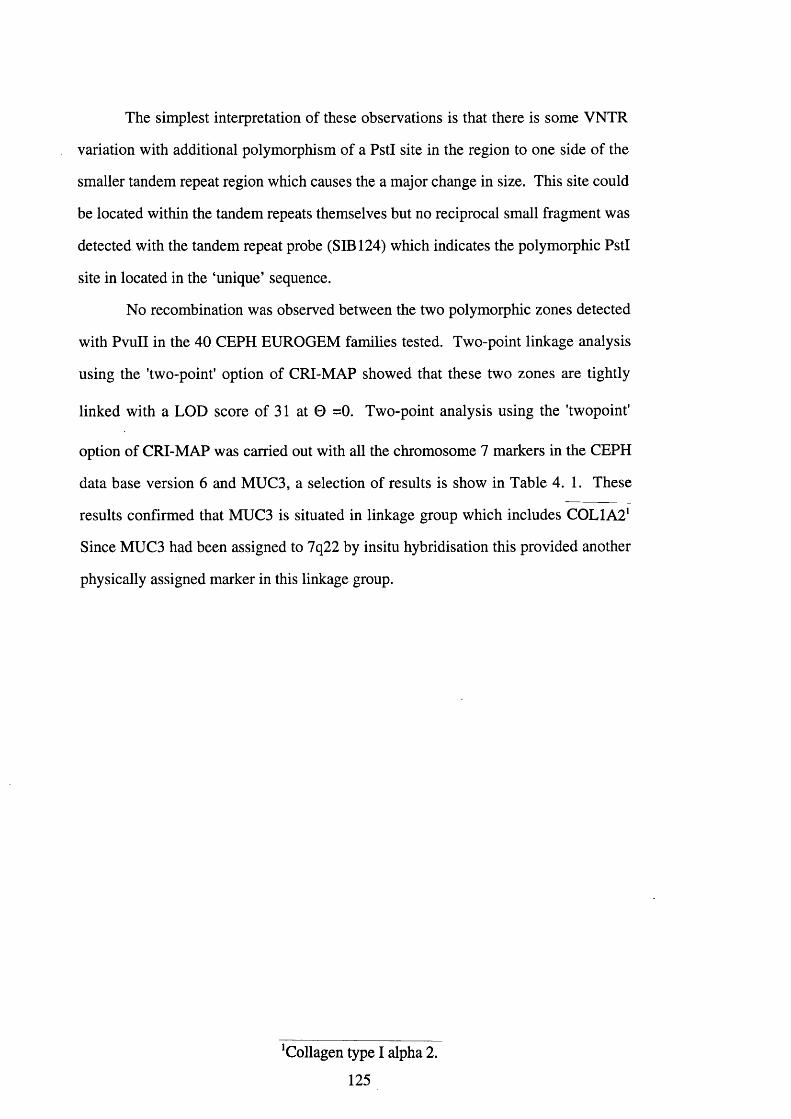
The simplest interpretation of these observations is that there is some VNTR
variation with additional polymorphism of a Pstl site in the region to one side of the
smaller tandem repeat region which causes the a major change in size. This site could
be located within the tandem repeats themselves but no reciprocal small fragment was
detected with the tandem repeat probe (SIB 124) which indicates the polymorphic Pstl
site in located in the ‘unique’ sequence.
No recombination was observed between the two polymorphic zones detected
with PvuII in the 40 CEPH EUROGEM families tested. Two-point linkage analysis
using the 'two-point' option of CRI-MAP showed that these two zones are tightly
linked with a LCD score of 31 at 0 =0. Two-point analysis using the 'twopoint'
option of CRI-MAP was carried out with all the chromosome 7 markers in the CEPH
data base version 6 and MUC3, a selection of results is show in Table 4. 1. These
results confirmed that MUC3 is situated in linkage group which includes C0L1A2^
Since MUC3 had been assigned to 7q22 by insitu hybridisation this provided another
physically assigned marker in this linkage group.
‘Collagen type I alpha 2.
125

Gene locus Location 0 F 0 M lod score
D7S64 7q21-q22 0 .1 2 0.05 2 1 .8
COL1A2 7q21.3-q22 0.11 0 .0 0 2 1 .6
D7S82 7pter-q22 0.04 0.03 27.6
D7S78 7q21.3-q31 0.18 0.03 11.3
D7S13 7q22.3-q31.2 0.08 0.06 16.5
D7S8 7q31 0.21 0 .1 0 10.3
Table 4. 1.
Table showing the pairwise led scores at maximum likelihood recombination
fractions 0 in males (M) and female (F) for MUC3 with a selection of chromosome 7
markers which have been localised to regions of chromosome 7 using physical
methods.
126

4.1.2. Genetic mapping of chromosome 7
When this work was started the most recent genetic maps available of
chromosome 7 were from GENETHON and NIH/CEPH collaborative map (1992;
Weissenbach et al. 1992). The GENETHON map did not contain any genes and
although the NIH/CEPH map had a number of genes the markers were of the less
informative RFLP type. Also neither of these maps shared any markers or contained
MUC3. Thus it was of some interest to try and integrate genes and other markers
from these maps together with MUC3 and possibly identify loci close enough for
long range PFGE mapping.
A genetic map of chromosome 7 was built using the multipoint analysis
options of CRI-MAP. The 'build' option of this program was used to generate the
map. The 'automatic build' used all the markers in the CEPH database version 6 in
order of their informativeness. Unfortunately the program crashed before all the
markers had been tested because the map exceeded the capacity of the computer that
was available at this time. However the partial map constructed provided an excellent
starting point. The map presented here was constructed using a combination of the
preliminary output from the automatically constructed map together with a selection
of markers which were shown to have a high probability of being located near MUC3
i.e. a two point lod score of at least 3 and a small 0 value (Appendix IV). The final
combined map was checked using an option called 'flips 5' which showed that the
map was supported at odds of a 1000 to 1 when groups of 5 markers were permuted
(F%s4.3y
This map included the genes MUC3, IL6 TCRG^lERVS^lTCRB'^and a large
number of markers from both the previously published GENETHON and NIH/CEPH
collaborative maps (1992; Weissenbach, Gyapay et al. 1992). This data was
published in abstract form (Hill et al. 1994) and the map included in the report of The
First International Workshop on Human Chromosome 7 Mapping 1993 (Grzeschik et
al. 1994).
* Interleukin 6 , ^ -ce ll receptor gamma cluster, ^Endogenous retroviral sequence 3,'^T-
cell receptor beta cluster.127

P hysical loca lisation o f se lected loci
FE M A L E M A P T otal length 3 4 2 .7 cM
M A L E M A P T otal length 2 2 4 .2 cM
11.22
1 .23
D 7S 531D 7S 21D 7 S 5 1 7D 7S 481D 7 S 5 1 3D 7S 75D 7 S 5 0 3D 7 S 4 9 3IL 6D 7 S 5 2 9D 7 S 6 2D 7 S 5 2 6D 7 S 4 9 7T C R GD 7S 485D 7S 521D 7 S 5 1 9D 7 S 5 0 6D 7 S 4 9 9D 7S.502E R V 3D 7S 398D 7 S 5 2 4D 7S 15D 7 S 5 2 7D 7S 491D 7 S 5 5 4M U C 3D 7 S 4 9 6D 7 S 5 2 3D 7 S 4 8 6D 7 S 4 8 0D 7 S 97D 7 S 487D 7 S 5 1 2D 7 S 5 0 0D 7 S 5 0 9TC R BD 7 S 4 9 8D 7 S 4 5 0D 7 S 5 0 5D 7 S 4 8 3D 7S 68D 7 S 22D 7S 468D 7 S 1 0 4
Figure 4. 3.
A diagrammatic representation of the framework map of chromosome 7 based on the
order predicted by the computer program CRI-MAP supported at odds of greater than
1000:1. An ideogram of chromosome 7 is shown alongside the gene order and the
physical localisation of a selection of genes is indicated as known in October 1993.
128

This map was used as the basis for constructing a more detailed map of
chromosome 7q using data from a more recent version of the CEPH data base,
version 7 (Fig 4 .4 ). The section of the total chromosome 7 map from ERV3 (which
maps to the centromere) to TCRB located near the q arm telomere was used as the
initial order for the 7q map. The program CRI-MAP Then attempted to insert all the
new markers from the CEPH database version 7 which had a lod score of greater than
3 with MUC3. This second map was subsequently used at the second International
Chromosome 7 Workshop together with maps of chromosome 7 from other workers
to obtain a consensus order for 77 markers along the entire length of the chromosome
(Tsui, Donis-Keller et al. 1995).
The map of the q arm of chromosome 7 indicated that the two closest genes
genetically are COL1A2 and MET' however the genetic distances between COL1A2
and MUC3 (6 .6 cM) and between MET and MUC3 (21.7 cM) which are quite large
and indicates that these two genes are not suitable for physical mapping. By the
second International Workshop it was evident from the physical data that there were
problems with the physical mapping of this region of chromosome 7 (Tsui, Donis-
Keller et al. 1995). The region appears to be fairly gene rich and contains the genes
EPO^PAIl and ACHE but is not covered by any contig maps and no YAC clones had
been isolated (Watkins et a l 1986; Klinger et al. 1987; Getman et a l 1992). It was
therefore of some interest to try an establish the genetic and physical locations of
these genes with respect to MUC3.
'Met proto-oncogene (hepatocyte growth factor receptor), ^Erythropoietin.
129
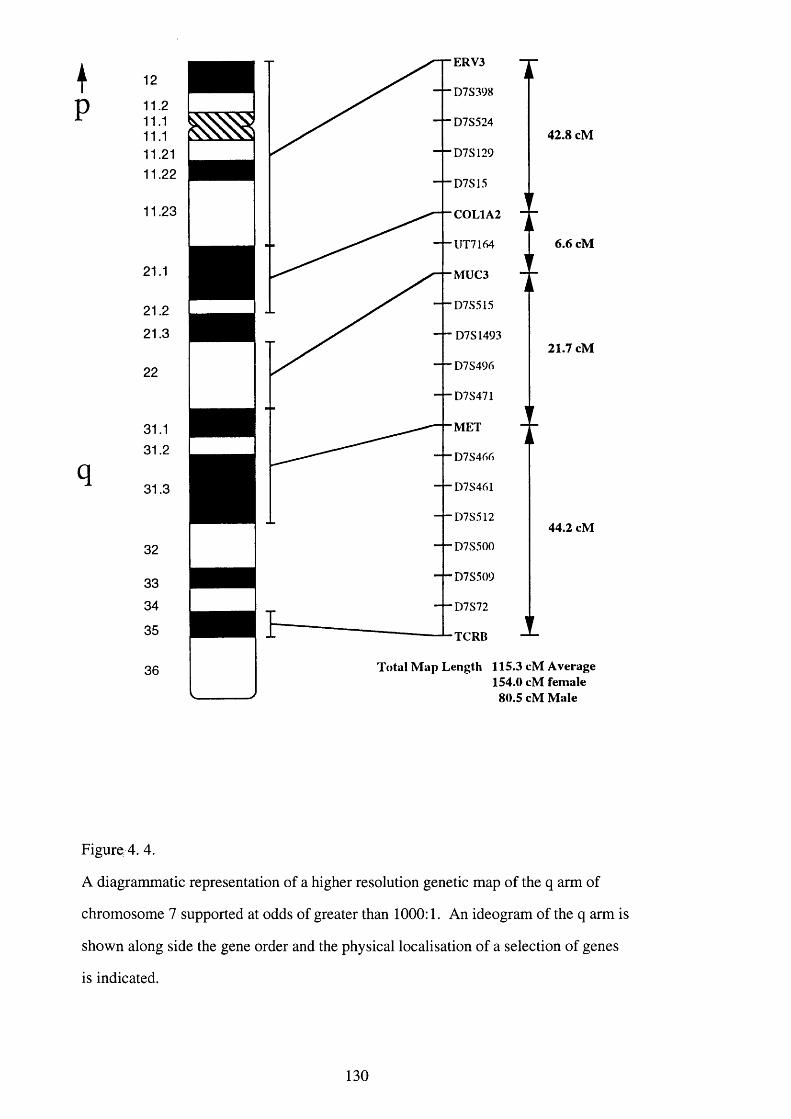
tp
12
11.211.111.1
11.23
21.1
22
31.3
32
33
34
35
36
ERV3
- - D 7 S 3 9 8
D 7 S 1 2 9
D 7 S 1 5
C O L 1 A 2
U T 7 1 6 4
M U C 3
D 7 S 5 1 5
D 7 S 1 4 9 3
D 7 S 4 9 6
D 7 S 4 7 1
M E T
D 7S 461
D 7 S 5 1 2
D 7 S 5 0 0
D 7 S 5 0 9
D 7 S 7 2
T C R B
42.8 cM
6.6 cM
21.7 cM
44.2 cM
Total Map Length 115.3 cM Average 154.0 cM female 80.5 cM Maie
Figure 4. 4.
A diagrammatic representation of a higher resolution genetic map of the q arm of
chromosome 7 supported at odds of greater than 1000:1. An ideogram of the q arm is
shown along side the gene order and the physical localisation of a selection of genes
is indicated.
130
4.1.2.1. Mapping of the gene PAIl using a panel of chromosomes with
defined meiotic breakpoints
PA Il was selected for genetic mapping since a dinucleotide repeat
polymorphism had already been identified with the primers HGMP ID No. 6031 and
6032 (GDB accession ID; GDB:512834). In order to analyse this polymorphism
using an automated sequencing system the primer 6031 was fluorescently labelled
using the kit supplied by Vistra and PGR was carried out on DNA samples from the
members of the desired families (Fig. 4. 5).
A panel of chromosomes with defined meiotic breakpoints was constructed
using the program ‘CROSSFIND’ (Attwood et al. 1996). The program utilises the
'chrompic' output of CRI-MAP produced using information from the CEPH data base
V.7. The order of the loci used was based on the consensus order published in the
report of the second International Chromosome 7 Workshop (Tsui, Donis-Keller et al.
1995). The conditions use to construct the initial diagram were, fam_like_tol=0.3,
fem ale and male m ap_tol=20, m in_density=3.0, m in_score=250, and
puk_score_factor=0.5 (Fig. 4. 6 ). The fam_like_tol is the minimum likelihood for the
predicted phase relationships between loci in any particular phase unknown family
that the program will accept and is calculated by CRI-MAP when the 'chrompic file is
created. The female and male_map_tol values are the minimum allowable distance in
cM between double recombinants. The min_density is the minimum number of
informative loci per lOcM. The min_score is the minimum allowable value of a
calculation which measures the support for a particular breakpoint. This value is
calculated by assigning an overall value to the 10 adjacent markers either side. For
example if the marker next to the breakpoint is informative then it scores highly.
However the further from the breakpoint the informative loci are the lower they score.
The maximum 'score' is 500 with the values heavily weighted in favour of the three
loci closest to the breakpoint. The puk_score_factor is the number by which the
program multiplies the individual 'score' values assigned to loci for which the phase is
not known.
131

(2 ,4 )
( 1. 2 )
( 1. 2 )
C4(1 .4 )
C5(3 .4 )
C7(3 .4 )
C8(3 .4 )
C9( 1. 2 )
FF(2 .3 )
MF(1 .4 )
FM(1 .3 )
Figure 4. 5.
An example of the results obtained with the ALP system showing the electrophoretic
analysis of the PAIl microsatellite using DNA samples from members of CEPH
family 1347. An arbitrary phenotype for the members of the family can be deduced
by comparison of the relative positions of the major peaks. The deduced phenotype is
shown in brackets below the family member symbol. Key: FF=father of the father,
MF=mother of the father, F=father, C l, C2, C3, e.t.c.=children, M=mother,
FM=father of the mother and MM=mother of the mother.
132
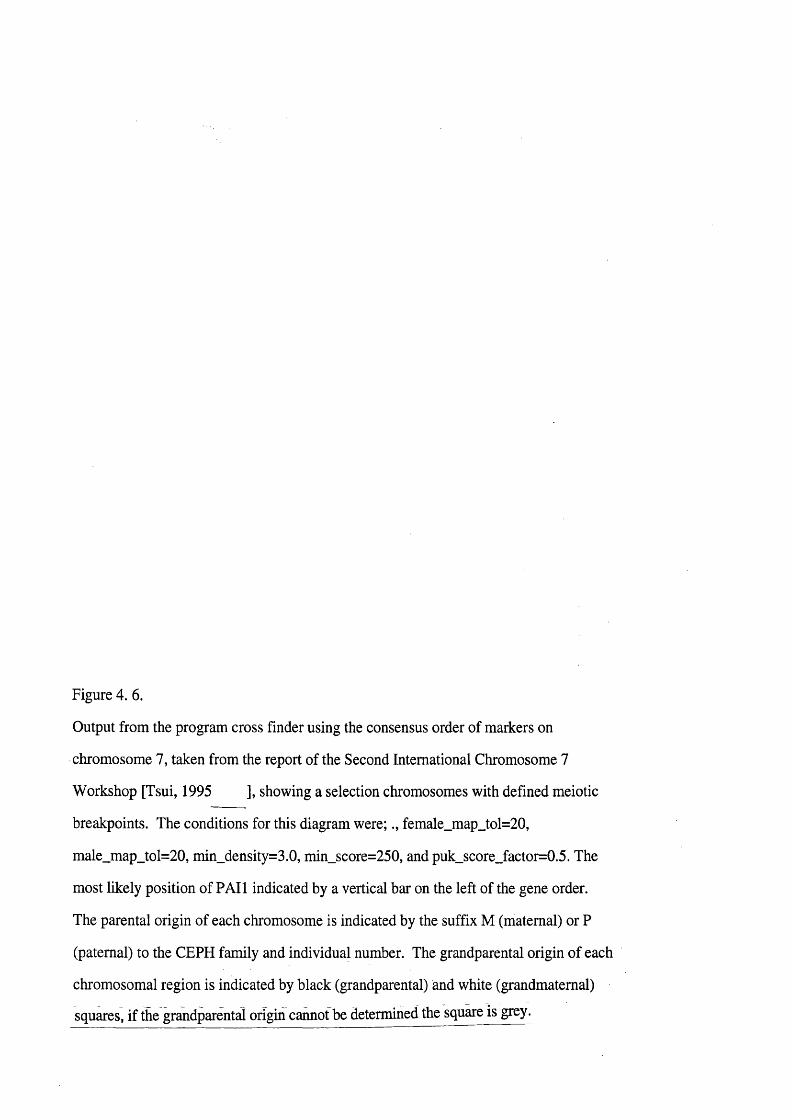
Figure 4. 6.
Output from the program cross finder using the consensus order of markers on
chromosome 7, taken from the report of the Second International Chromosome 7
Workshop [Tsui, 1995 ], showing a selection chromosomes with defined meiotic
breakpoints. The conditions for this diagram were;female_map_tol=20,
male_map_tol=20, min_density=3.0, min_score=250, andpuk_score_factor=0.5. The
most likely position of PAIl indicated by a vertical bar on the left of the gene order.
The parental origin of each chromosome is indicated by the suffix M (maternal) or P
(paternal) to the CEPH family and individual number. The grandparental origin of each
chromosomal region is indicated by black (grandparental) and white (grandmaternal)
squares, if the grandparental origin cannot be determined the square is grey.
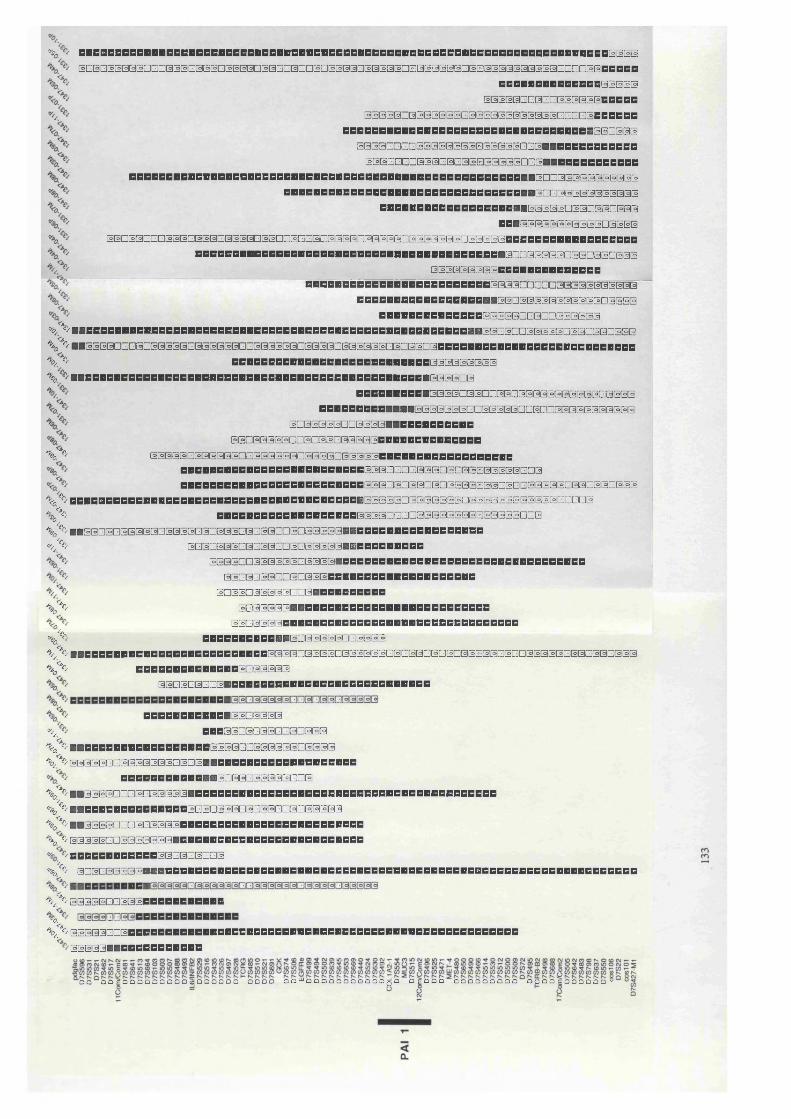
% DBeBBBBBBBBBBBBHODBBBDBBBBBBBSBBCaBBBBBBBDDBBCBBBeDeBBBBBBBBBBBBBBBBBBBBSSSSBG S aBBB BSG aaSBBG SBSaSBSBaSBG G SaasaSSBBaBSBSBO ElBSSBBBaBESBBBBSBBSSaG aG ËBBBBBB
BBBBBBBBBBBBBBGGGGG@@aa@GG0aaBSS@G@BBBBB
BBBBBGBSSSSBSnBBBBHHSHSaBBaGGGBBBBBBBBBBBBBBBBBBBBBBBBBBBBBBBBBBBBBBBBBGBGBGB
SSBSGGGGHSaSSSSBBSBSaSGGBBBBBBBBBBBBBBaBaGGGGaaaGaGBBBaaaaaGGBBBBBBBBBBBBBB
BBBBBBBBBBBBBBBBBBBBBBBBBBBBBBBBBBBBBBBBBBBBBBBBBBBBBBBBGGBaBBBGGGBGBBBBBBBBBBBBBBBBBBBBBBBBBBBBBBBBBBB0GGBaBBSB00B00
BBBBBBBBBBBBBBBBBBBBaaaaaGBBGaaGaaaBBBB@@0a@@@@B0G@SS@
@@aS@GGG@@@G@@@GBa@@G@BGG@GG@G@S@Sa@@@@aaQSaQB@aGaB@@BBBBBBBBBBBBBBBBBBBBBBBBBBBBBBBBBBBBBBBBBBBBBBBBBBBBBBBBBBBBBBGGaaaBBaaBGaaGaaa
0G0GBG0BSBBBBBBBBBBBBBBBBMBBBBBBBBBBBBBBBBBBBBBBlllBaâaâaQBBBBBBBBBB"
BBBBBBBBBBBBBBBBBBBBBGBBBBBBBBBBBGBBBBBBBBBBBBBBBBBBBBBSBGGBGGBBBBBBVi
'’'^^/'^^BBBBBBBBBBBBBBBBBBBBBBBBBBBBBBBBBBBBBBBBBBBBBBBBBBBBBBBBBBGBGGBBBBBGBBGBBGBBB\"^BBBBBBGGGBGBBBBBGBBBBBBaQBBBBBBGBBBBGBBBBBBaBaBBGaBBBBBBBBBBBBBBBBBBBBBBBBBBB \ BBBBBBBBBBBBBBBBBBBBBBBBBBBBBBBBBBBB% BBBBBBBBBBBBBBBBBBBBBBBBBBBBBBBBBBBBBBBBBBBBBBBBBBBBBGB
BBBBBBBBBBBBBBGBBGGSBGBBBBBBBBBBQGBBBB BBBBBBBBBBBBBBBBBBBBGGBBBBBGGBGGBBBBBBBBBBB
BGBBBBBGGBBBBBBBBBBBBBBBB BBGBBBBBGGBGBBGBBBBBBBBBBBBBBBBBBB
\ BBBBBGBBBBBBGGBBBBBBGBBBBGBBBBBBBBBBBBBBBBBBBBBBBBBBBBBBBBBBBBBBBBBBBBBBBBBBBGGGGBBBGBQBBGBBBBBGGB BBBBBBBBBBBBBBBBBBBBBBBBBBBBGBGBBGBGBBBBGBBGBGGBBBBBGBBGBBGBBB
^'^BBBBBBBBBBBBBBBBBBBBBBBBBBBBBBBBBBBBBBBBBBBBBGBBBBBBBGBBBBBBBBBBBBGGGGB % % BBBBBBBBBBBBBBBBBBBBBBBGGGGBBBBBBBBGBBBBBGGB%^BBBBGBGBBBBBGBBBBGBGBBBGBGBBGGBGBBBBBBBBBBBBBBBBBBBBBBBB %% BGBGBBBGBGBBGGBGBBBBBBBBBBBBBBBB
GGBBGGBBBBBBGBBBBBBBBBBBBBBBBBBBBBBBBBBBBBBBBBBBBBB BBGBGBBGGBGBBBBBBBBBBBBBBBBBBBBBBB
BGBBGBBBBBGGBBBBBBBBBBB % % BGBBBBBBBBBBBBBBBBBBBBBBBBBBBBBBBB
BBGBBBBBBBBBBBBBBBBBBBBBBBBBBBBBBBBBBBB %% BBBBBBBBBBBBBGBBBBBGGBBBB'^^BBBBBBBBBBBBBBBBBBBBBBBBBBBBBBBGBBBBGBBBBBBGBGBBGBGBGBBGBBGBGGBBBBBGBBGBBGBBB % % BBBBBBBBBBBBBBBGBBBBB
GGGBGBGGBBBBBBBBBBBBBBBBBBBBBBBBBBBBB
BBBBBBBBBBBBBBGBBBB% BBBBBGBGBBGGBGBBB '^BBBBBBBBBBBBBBBBBBBBBBBGGBBBBBBGBBBa %%BBaaBGGBBBBBBBGBGBBBBBBBBBBBBBBBBBBBBBB
BBBBBBBBBBBBBBGBBGBBBBBGGB %^BBBBBBGGGBGBBBBBBBBBBBBBBBBBBBBBBBBBBBBBBBBBBBBBBBBBBBBBBB %^BBBBBBBBBBBBBBBBBGBGBBBGBGBBGGBGBBBBB %^BBBBBBGGGBGBBBBBBBBBBBBBBBBBBBBBBBBBBBBB %/^^BBBBBGGBBBBBBBBBBBBBBBBBBBBBBBBBBBBBBBBB
BBBBBBBBBBBBBBGBGBGGB %% SGBGBBBBBBBBBBBBBBBBBBBBBBBBBBBBBBBBBBBBBBBBBBBBBBBBBBBBBBBBBBBBBBBBBBBBBBBB
\ y BBBBBGGBBBBBBBBBBBBBB
%\ ^aaBBGGGBBBBBBBBBBBBBBBBBBBBBBBBBBBBBBBBBBBBBBBBBBBBBBBBBBBBBB BBBBBBBBBBBBBBBBBB
O O O O E O O O O O O O C a O & O C l O O O C l O D Q O Q Q ^ Q Q Q Q Q Q Q D Q D O ^ Q O g Q Q Q Q Q D Q D Û Û Q C l O U O O E O O O O O O "
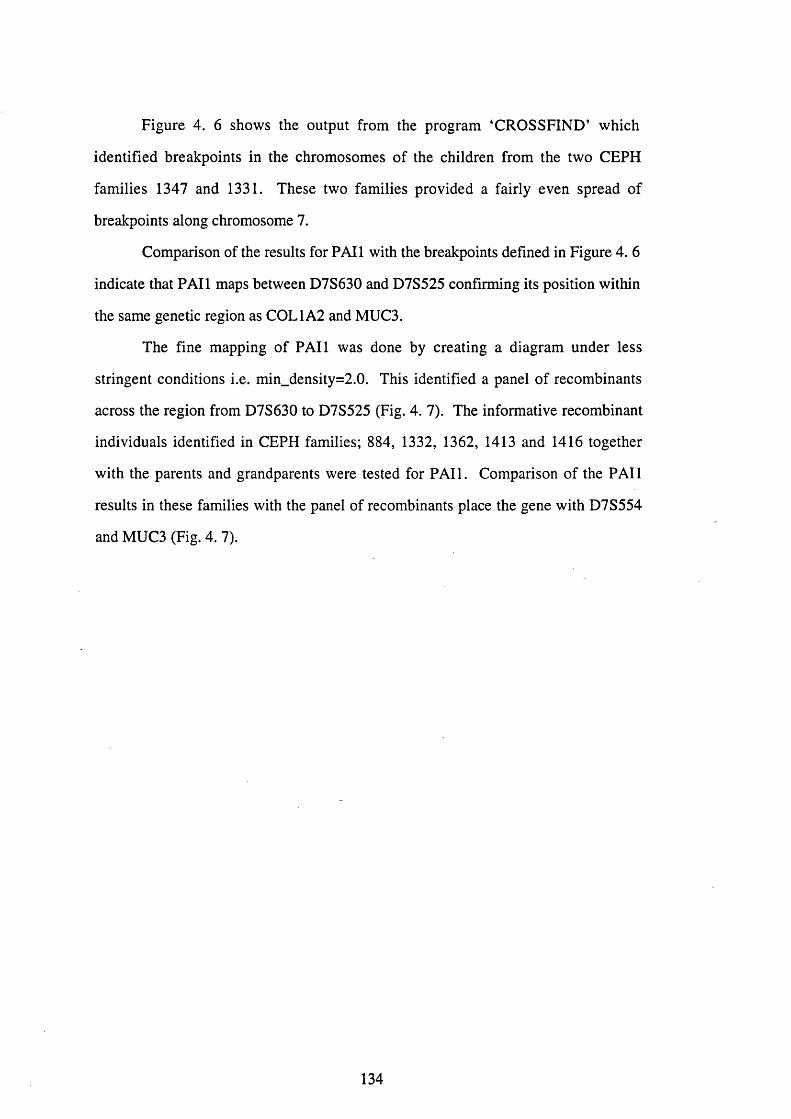
Figure 4. 6 shows the output from the program ‘CROSSFIND’ which
identified breakpoints in the chromosomes of the children from the two CEPH
families 1347 and 1331. These two families provided a fairly even spread of
breakpoints along chromosome 7.
Comparison of the results for PAIl with the breakpoints defined in Figure 4. 6
indicate that PAIl maps between D7S630 and D7S525 confirming its position within
the same genetic region as C0L1A2 and MUC3.
The fine mapping of PA Il was done by creating a diagram under less
stringent conditions i.e. min_density=2.0. This identified a panel of recombinants
across the region from D7S630 to D7S525 (Fig. 4. 7). The informative recombinant
individuals identified in CEPH families; 884, 1332, 1362, 1413 and 1416 together
with the parents and grandparents were tested for PA Il. Comparison of the PAIl
results in these families with the panel of recombinants place the gene with D7S554
and MUC3 (Fig. 4. 7).
134

Figure 4. 7.
Output from the program cross finder using the consensus order of markers on
chromosome 7,taken from the report of the Second International Chromosome 7
Workshop [Tsui, 1995 ], showing a selection chromosomes with defined meiotic
breakpoints in the region 7q22. The most likely position of PAIl within the consensus
order is indicated together with the results from the ALP analysis. The conditions for
this diagram were; fam_like_tol=0.3, female_map_tol=20, male_map_tol=20,
min_density=2.0, min_score=250, and puk_score_factor=0.5. PAIl has been placed in
its most likely position (between D7S554 and MUC3) and the individual results for this
marker are shown. The parental origin of each chromosome is indicated by the suffix
M (maternal) or P (paternal) to the CEPH family number and individual number. The
grandparental origin of each chromosomal region is indicated by black (grandparental)
and white (grandmaternal) squares, if the grandparental origin cannot be determined the
square is grey.
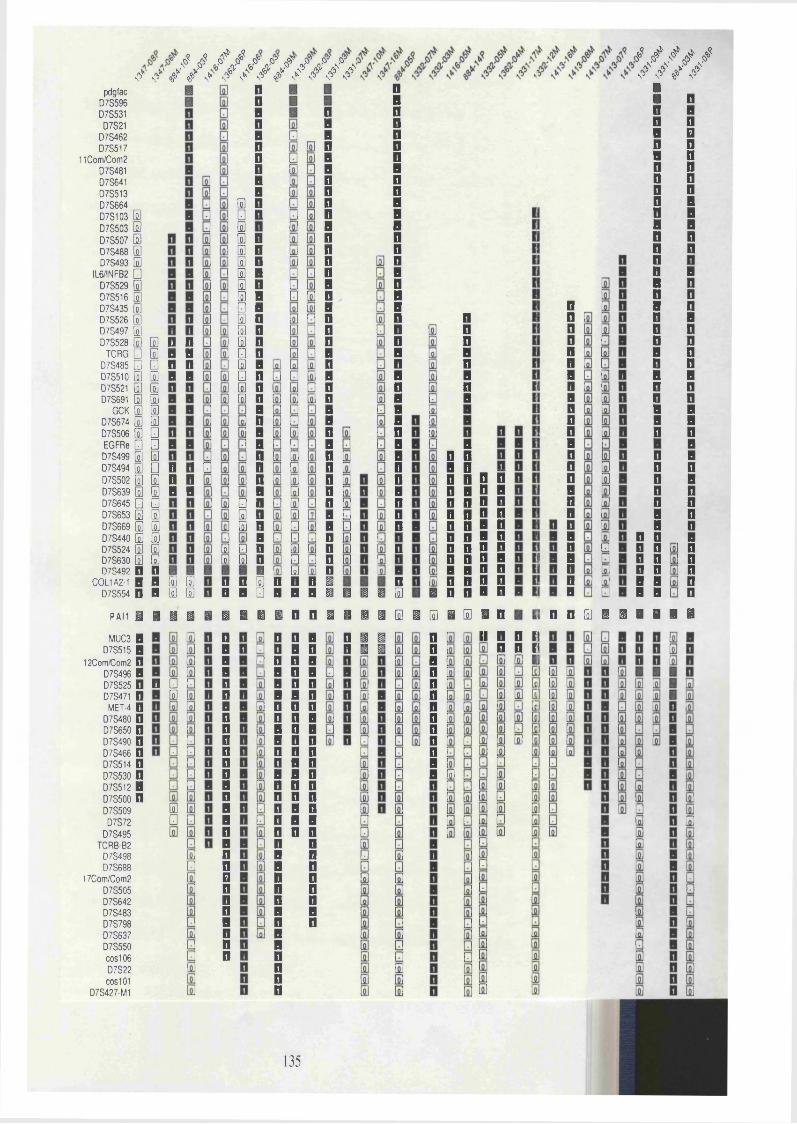
\pdglac
D7S596 D7S531
D7S21 D7S462 D7S517
1lCom/Com2 D7S481 D7S641 D7S513 D7S664 D7S103 Ë D7S503 Ë D7S507 E D7S488 E D7S493 E
IL6/INFB2 E D7S529 E D7S516 E D7S435 E D7S526 E D7S497 E D7S528 E
TCRG [ D7S485 E D7S510 E D7S521 E D7S891 E
GCK E D7S674 E D7S506 E EGFRe E D7S499 E D7S494 E D7S502 E] D7S639 E] E] D7S645 □ □ D7S653 E] E] D7S669 E] E] D7S440 E] E) D7S524 E] E) D7S630 El E] D7S492 D n
C0L1A2-1 H B D7S554 n B
. • . • / / / / / / M m V///
E]E]□E]EE§
Ig
PAH i
MUC3 B D7S515 H
12Com/Com2 f l D7S496 B D7S525 n D7S471 n
MET-4 n D7S480 n D7S650 n D7S490 n D7S466 n D7S514 n D7S530 n D7S512 B D7S500 n D7S509 D7S72
D7S495 TCRB-B2
D7S498 D7S688
17Gom/Com2 D7S505 D7S642 D7S483 D7S798 D7S637 D7S550 COS106 D7S22 coslOI
D7S427-M1
B B B B B B B B
B B EB B B B
E E E E
IE E E§E □ E B Ey yE
□ E E
E E EEB B B B
BBBflBflflBBBBB
:BBBBBnflBBBBBBBBBBBBBBBBB
Ig
EÜS
B B B B B B8 B B B B B B B B B B B B B B fl B B B B B B B BaB B B B B B B B
B B B B B B B
aBaBBBaBBBBBaBBBBBaBBBBBBBB
!Bf■
s
iBB B fl B
I I I !i l l !B B B B B
B □E
E□
BBBBBBBBaBBBBBBBBBBBBBBBBaB
a aB B B B B B B B
I !IlB B B B
BBBBBBBBBaBaBBB
a : :
B B BBBBBBBBBBBBBBB
BBBBBBBB
B B B B B B B fl B B
S a
i i i i i B i l B B B B i i E i E i E B B
BBaaBaBBBBBBBBBaBBBBa
iBBBBBBaaBBBBBBB
IBB8BaBi
sBaBB
II
BBaBBBBBaB
:BBBBBBBBBBBBaBBBBBBBBBaaBB
B B E i B B i l B
135
B B BB B B
4.13. Physical mapping and cloning of MUC3
Two major approaches were taken towards understanding the structure of the
MUC3 gene. Southern blot analysis using standard and pulsed field gel
electrophoresis were used to obtain information concerning the size and disposition of
the genomic sequences corresponding to the various cDNA isolated in California. In
parallel attempts were also made to obtain large genomic clones such as Y AGs and
cosmids.
4.1.3.1. Southern blot analysis of MUC3
In order to obtain physical mapping data about the genetic structure Southern
blots of genomic DNA digested with a number of restriction enzymes run under
standard and pulsed field gel electrophoresis (PFGE) conditions were probed with
cDNA clones isolated in California by Dr Jim Gum. Those that have been used in
this project are described below.
1. SIB 124 was isolated by screening a human small intestine lambda gt
11 library with antibodies to human intestinal mucin (Gum, Hicks et al. 1990). This
clone contains 7 copies of the 5 Ibp tandem repeat.
2. Clones 20 and 23 were obtained by screening the small intestinal
library with a cDNA 'Puck' which had been isolated previously from this library by
screening with antibodies to deglycosylated pancreatic cancer cell mucin (cell line
SW 1990).
Clone 23 has an insert of 1079bp and contains 1054bp of ‘unique’ sequence 3’
to 25bp of a tandem repeat. Clone 20 has an insert size of 2000bp but does not
contain any tandem repeats. There is a 99bp overlap between the 3’ end of clone 23
and the 5’ end of clone 20 sequence which indicates that these two fragments are
from the same transcript and that both clones are located 3' to one of the tandem
repeat regions. Clone 20 also contains 3' untranslated sequence which suggests that
this is the 3' end of MUC3.
136
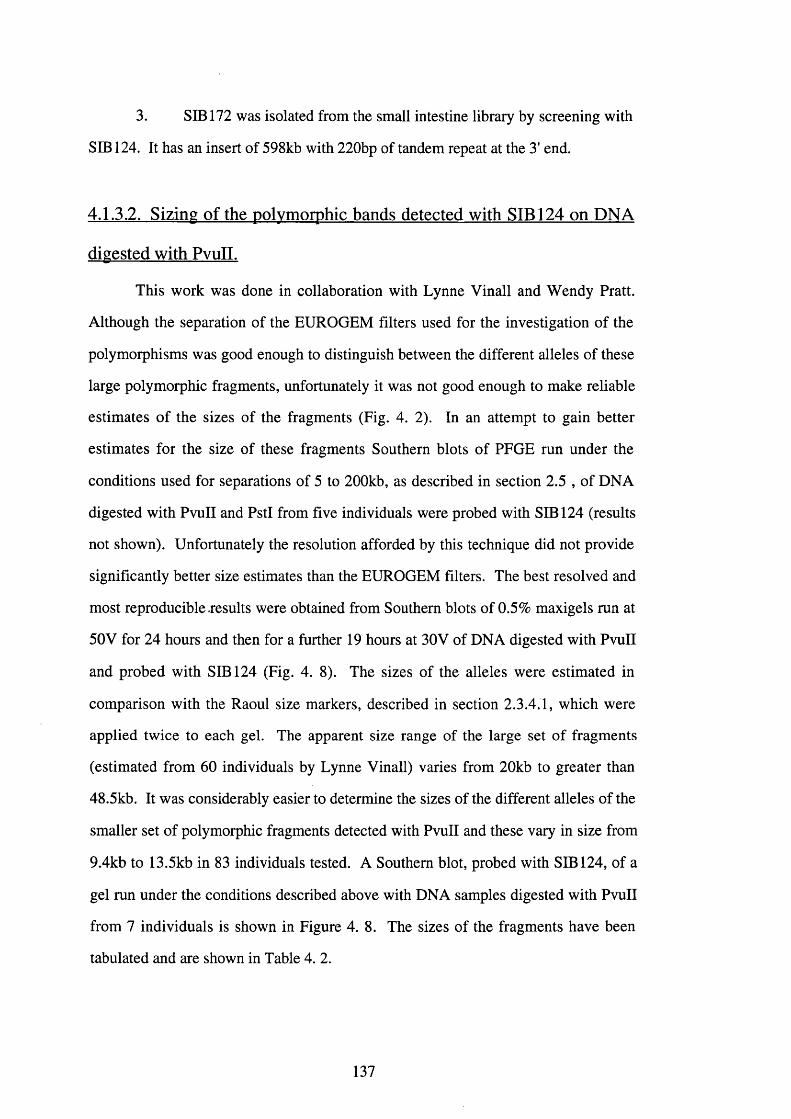
3. SIB 172 was isolated from the small intestine library by screening with
SIB 124. It has an insert of 598kb with 220bp of tandem repeat at the 3' end.
4.1.3.2. Sizing of the polymorphic bands detected with SIB 124 on DNA
digested with PvuII.
This work was done in collaboration with Lynne Vinall and Wendy Pratt.
Although the separation of the EUROGEM filters used for the investigation of the
polymorphisms was good enough to distinguish between the different alleles of these
large polymorphic fragments, unfortunately it was not good enough to make reliable
estimates of the sizes of the fragments (Fig. 4. 2). In an attempt to gain better
estimates for the size of these fragments Southern blots of PFGE run under the
conditions used for separations of 5 to 200kb, as described in section 2.5 , of DNA
digested with PvuII and Pstl from five individuals were probed with SIB 124 (results
not shown). Unfortunately the resolution afforded by this technique did not provide
significantly better size estimates than the EUROGEM filters. The best resolved and
most reproducible .results were obtained from Southern blots of 0.5% maxigels run at
50V for 24 hours and then for a further 19 hours at 30V of DNA digested with PvuII
and probed with SIB 124 (Fig. 4. 8 ). The sizes of the alleles were estimated in
comparison with the Raoul size markers, described in section 2.3.4.1, which were
applied twice to each gel. The apparent size range of the large set of fragments
(estimated from 60 individuals by Lynne Vinall) varies from 20kb to greater than
48.5kb. It was considerably easier to determine the sizes of the different alleles of the
smaller set of polymorphic fragments detected with PvuII and these vary in size from
9.4kb to 13.5kb in 83 individuals tested. A Southern blot, probed with SIB 124, of a
gel run under the conditions described above with DNA samples digested with PvuII
from 7 individuals is shown in Figure 4. 8 . The sizes of the fragments have been
tabulated and are shown in Table 4. 2.
137
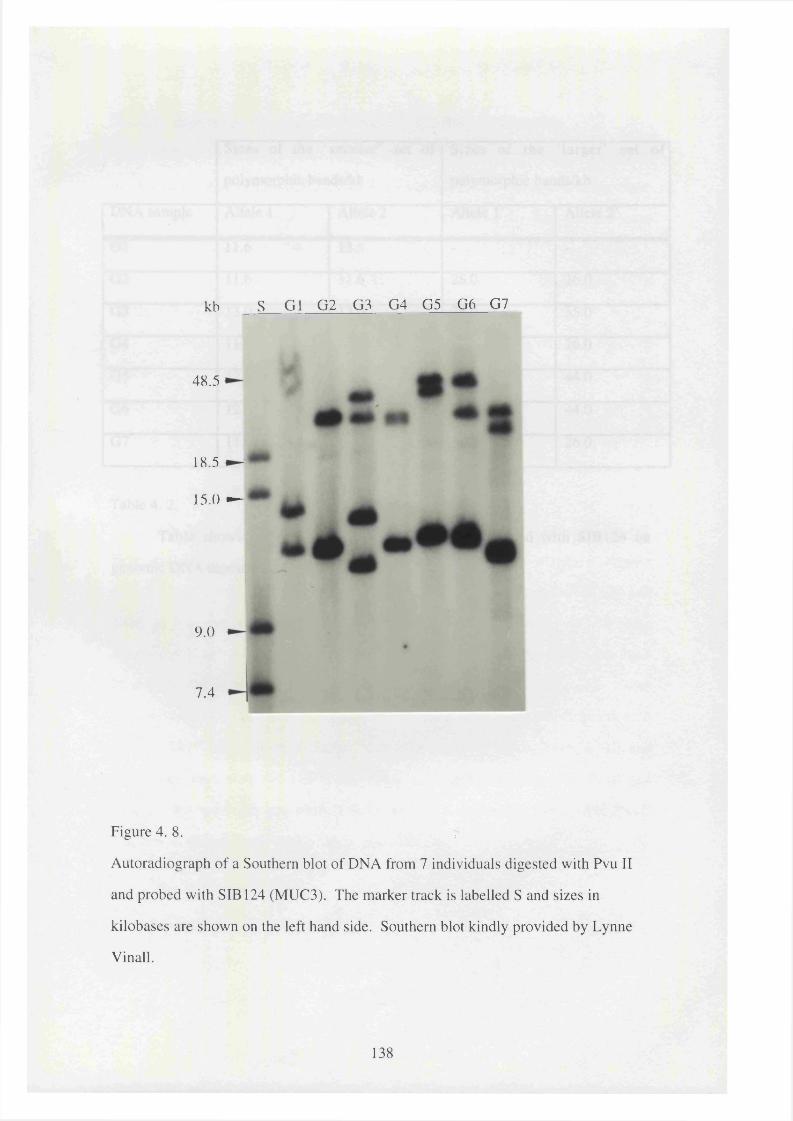
kb S G1 0 2 0 3 0 4 0 5 0 6 07
48.5
18.5
15.0 —
9.0
7.4
Figure 4 .8 . ?
Autoradiograph of a Southern blot of DNA from 7 individuals digested with Pvu II
and probed with SIB 124 (MUC3). The marker track is labelled S and sizes in
kilobases are shown on the left hand side. Southern blot kindly provided by Lynne
Vinall.
138
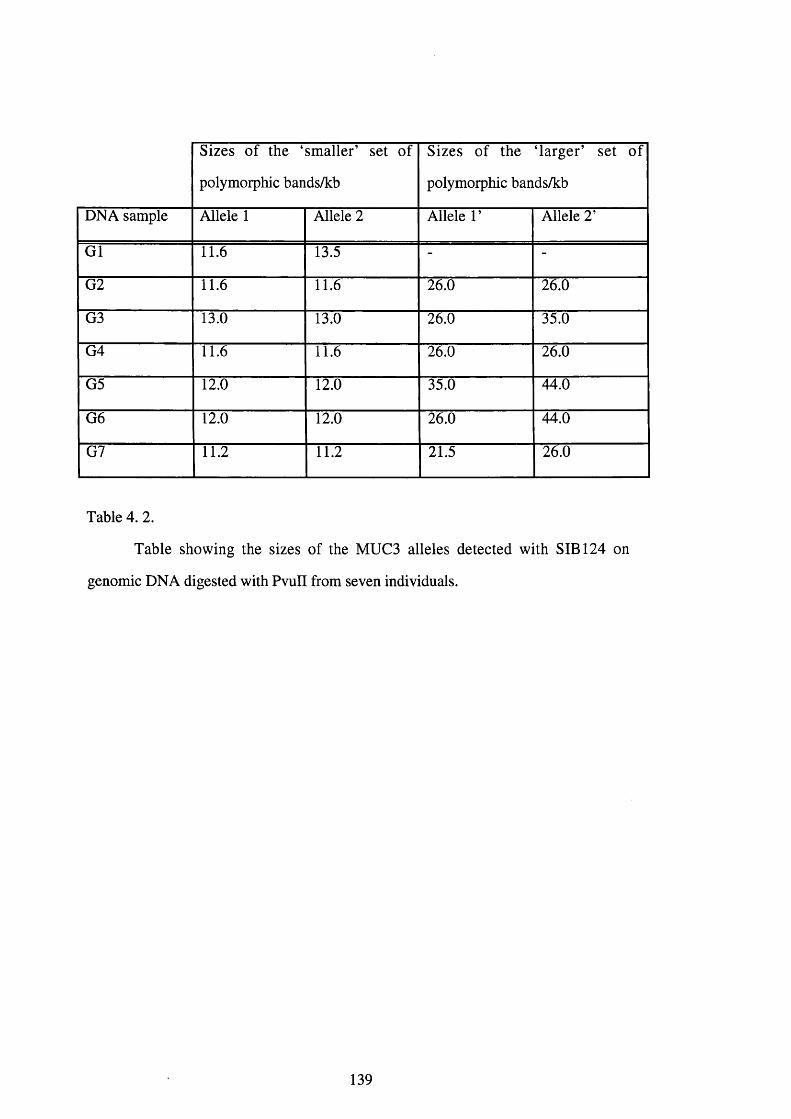
Sizes of the ‘sm aller’ set of
polymorphic bands/kb
Sizes of the ‘larger’ set o f
polymorphic bands/kb
DNA sample Allele 1 Allele 2 Allele 1’ Allele 2’
G1 11.6 13.5 - -
G2 11.6 11.6 26.0 26.0
G3 13.0 13.0 26.0 35.0
G4 11.6 11.6 26.0 26.0
G5 12.0 12.0 35.0 44.0
G6 12.0 12.0 26.0 44.0
G7 11.2 11.2 21.5 26.0
Table 4. 2.
Table showing the sizes of the MUC3 alleles detected with SIB 124 on
genomic DNA digested with PvuII from seven individuals.
139

4.I.3.3. Southern blot analysis o f MUC3 * unique' sequences.
W hen the Southern blots were probed with clone 23 it detected the same
polymorphic fragments as SIB 124 with PvuII and SIB172U (a fragment of the clone
SIB 172 which does not contain any tandem repeat sequence) detected the same
polymorphic fragments as SIB 124 with Pstl. Clone 23 and SIB172U also detected a
number of smaller bands (Fig. 4. 9). Clone 20 also detected the large bands very
faintly as well as the smaller bands.
In order to investigate these bands further Southern blots of DNA digested
with PvuII, Pstl and H indlll from 5 individuals, run on 1% agarose gels at 35V for 22
hours, were probed with clone 20, SIB172U and SIB 124 (Fig. 4. 10). The SIB 124
probing was done last to avoid artefacts arising from the filters not being Stripped
completely. The results from a representative individual have been tabulated and are
shown in Table 4 .3 .
The probes SIB 124, clone 20 and SIB172U all detect the same 20+kb and
9+kb with Pstl table 4 .3 . These large fragments probably correspond to the two sets
of polymorphic bands detected with PvuII and Pstl described earlier. SIB 124 and
clone 20 also detect the same 20+kb and 9+kb fragment with PvuII and the same
20+kb and 12+kb fragment with Hindlll. SIB172U however only detects the 9+kb
fragment obtained with PvuII and the 20+kb fragment obtained with Hindlll. Clone
20 detects a 3.4kb and 2.9kb fragment with Pstl and a l.Skb and 1.6kb fragment with
PvuII. SIB 172 also detects a number of smaller bands i.e. 2.8kb, 2.6kb, 1.5kb, and
l .lk b fragments with Pstl and 2.3kb, l.Skb and 1.2kb fragments with PvuII and
6.2kb, 2.0kb and 1.3kb fragments with Hindlll. It is noteworthy that a l.Skb PvuII
fragment is detected with both clone 20 and SIB172U.
140

Pvu IISIB124 clone 23 kb
Pst ISIB124 SIB172U
' 4 - •kb
« 48.5« 18.5« 15
12.9
12.3
- « 1.4
Figure 4. 9.
Autoradiographs of Southern blots of DNA from members of the CEPH families
1420 digerted with PvuII and probed with SIB 124 and clone 23 and DNA from
family 13293 digested with Pstl and probed with SIB 124 and SIB172U. The sizes in
kilobases are shown on the right hand side.
141

P s tl Pvu II
SIB 124 a « i» 2 U SIB172U SIB 124 C lone20 S IB I72UrI
Hind IIISIB 124 a o n e 2 0 SIBI72U
2()+I
I2 + I
6.21
2.01
13\
I»/;
Figure 4. 10.
Autoradiograph of Southern blots of DNA from a single individual digested with Pst
I, Pvu II and Hind III probed with cDNA clones from MUC3 (SIB 124, Clone 20 and
SIB 172U). The estimated sizes are in kilo bases.
142

Pstl PvuII Hindlll
SIB 124 clone 20 SIB172U SIB 124 clone 20 SIB172U SIB 124 clone 20 SIB172U
2 0 + 2 0 + 2 0 + 2 0 + 2 0 + 2 0 + 2 0 + 2 0 +
9+ 9+ 9+ 9+ 9+ 9+ 12+ 12+
3.4 2.3 6 .2
2.9 1.8 1.8 2 .0
:18* 1.6 1.3
2 .6 * 1.2
1.5*
1.1
Table 4. 3.
Table showing the sizes of fragments detected using the cDNA probes
SIB 124, clone 20 and SIB172U on genomic DNA digested with Pstl, PvuII and
Hindlll from a single individual.
143
These results indicate that the two major fragments which contain tandem
repeats also contain sequences similar to both the 3' clone 20 and the 5' SIB 172. This
suggests that there may be duplication of the sequences present in both clone 2 0 and
SIB 172 associated with the tandem repeat regions. Because of the possibility of
multiple copies of so called 'unique' sequences it is difficult to determine the precise
physical relationships of the smaller fragments. However the results for SIB172U
indicate that there is a PvuII and H indlll site between one of the SIB172U like
sequences and one of the tandem repeat regions. The l.Skb PvuII fragment which is
detected with both clone 20 and SIB172U suggests that one of the clone 20 like
sequences is contiguous with one of the SEB172U like sequences. It should also be
noted that the small fragments detected with SIB172U on DNA digested with PstI,
which have been asterisked in Table 4 .3 , show some person to person variation
which may be related to the proposed polymorphic PstI site detected with SIB 124.
144

4.1.3.4. Pulsed field gel electrophoresis (PFGE) o f genomic DNA
PFGE was used in an attempt to gain physical mapping information about the
chromosomal region containing the MUC3 locus. The first step was to determine the
conditions required for separations of the desired size ranges. Two size markers were
used for this, one was a lambda ladder of concatamers increasing progressively by
48.5kb and the other was a Saccharomyces cerevisiae genome with markers from
245kb to 2200kb described in section 2.3.4.1.
DNA from the erythroid cell line K562 was used because it is said to show a
relatively lower level of DNA méthylation than other cell lines (Guyonnet-Duperat
1993).
Southern blots of DNA digested with Smal, Sfil, BssHII, Nael, Notl, SacII,
N rul and M lul were probed with SIB 124 (Fig. 4. 11). The results from these
experiments have been tabulated and are shown below (Table 4. 4).
The probe SIB 124 detected large single fragments with both Notl and BssHII
of 370kb and 355kb respectively. Although a 50kb fragment was detected with Nael
it seems unlikely that it contains the whole MUC3 locus as the sum of the fragments
containing tandem repeats detected with PvuII and PstI would be significantly larger
than 50kb. This also does not take into account the 'unique' sequences. The band is
in fact quite wide and it may be that there are in fact two bands which are very similar
in size and would thus not be separated under these conditions or that one of the
fragments has run of the gel.
A pattern of two bands is detected with Smal (80kb and 45kb) and Sfil (160kb
and 85kb). These bands may correspond to two fragments each containing one of the
two sets of tandem repeats as proposed for PvuII and PstI.
145

♦
é m
#Sma I Sfil BssHD Nael Notl Sac D Nrul Mlul
12200
H 600
11125
-^700. ^ 3 0-^580- ^ 6 0^ 3 7 0^ 2 9 0^ 2 4 5- ^ 145.5^ 9 7
- ^ 48.5
Figure 4.11.
Autoradiograph of a Southern blot of a pulsed field gel electrophoresis of K562 DNA
digested with Sma I, Sfi I, BssH II, Nae I, Not I, Sac II, Nru I, and Mlu I restriction
enzymes probed with SIB 124. The size markers are shown on the right hand side and
are in kilobases.
146
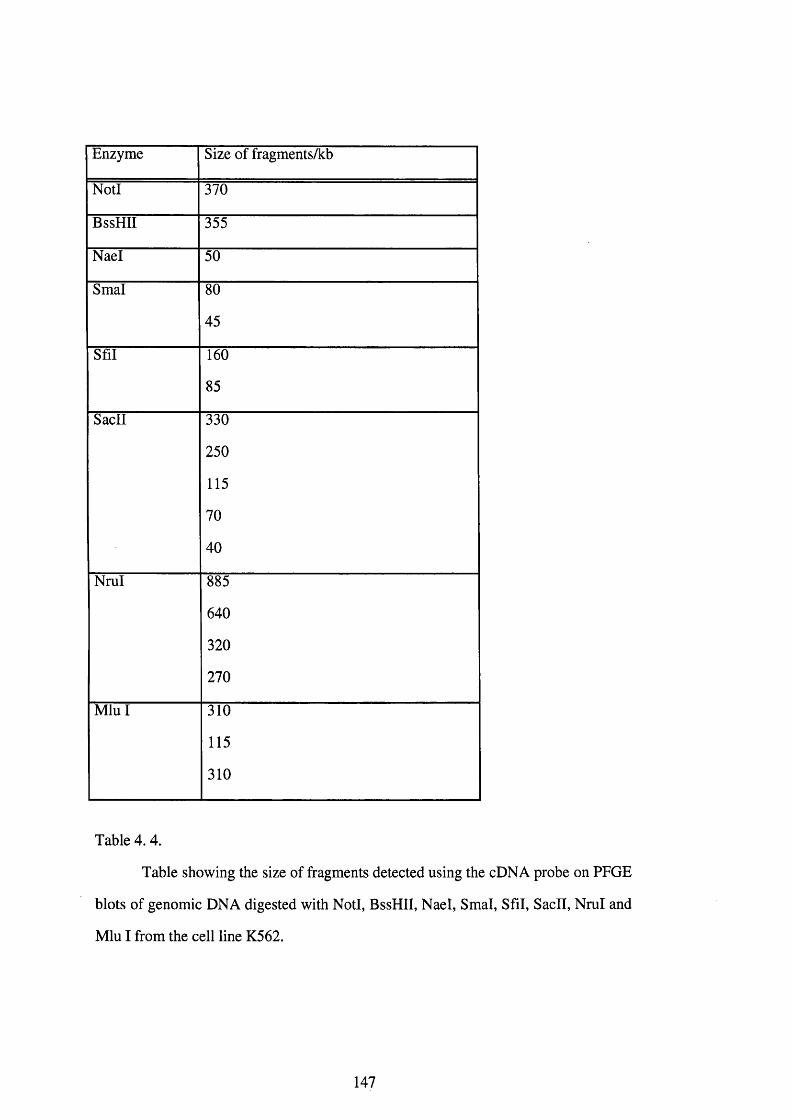
Enzyme Size of fragments/kb
Notl 370
BssHII 355
Nael 50
Smal 80
45
Sfil 160
85
SacII 330
250
115
70
40
Nrul 885
640
320
270
M lu l 310
115
310
Table 4. 4.
Table showing the size of fragments detected using the cDNA probe on PFGE
blots of genomic DNA digested with Notl, BssHII, Nael, Smal, Sfil, SacII, Nrul and
Mlu I from the cell line K562.
147
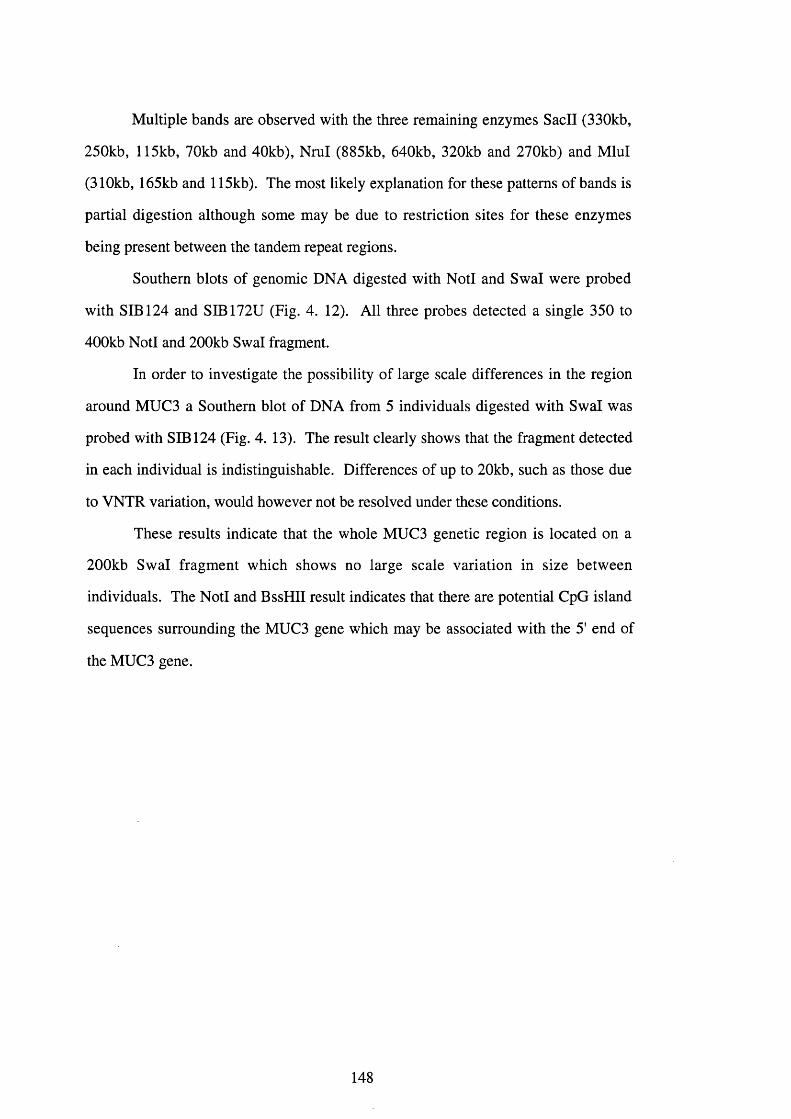
Multiple bands are observed with the three remaining enzymes SacII (330kb,
250kb, 115kb, 70kb and 40kb), Nrul (885kb, 640kb, 320kb and 270kb) and Mlul
(310kb, 165kb and 115kb). The most likely explanation for these patterns of bands is
partial digestion although some may be due to restriction sites for these enzymes
being present between the tandem repeat regions.
Southern blots of genomic DNA digested with Notl and Swal were probed
with SIB 124 and SIB172U (Fig. 4. 12). All three probes detected a single 350 to
400kb Notl and 200kb Swal fragment.
In order to investigate the possibility of large scale differences in the region
around MUC3 a Southern blot of DNA from 5 individuals digested with Swal was
probed with SIB 124 (Fig. 4. 13). The result clearly shows that the fragment detected
in each individual is indistinguishable. Differences of up to 20kb, such as those due
to VNTR variation, would however not be resolved under these conditions.
These results indicate that the whole MUC3 genetic region is located on a
200kb Swal fragment which shows no large scale variation in size between
individuals. The Notl and BssHII result indicates that there are potential CpG island
sequences surrounding the MUC3 gene which may be associated with the 5' end of
the MUC3 gene.
148

SIB124 SIB172U
290245
I
Figure 4. 12.
Autoradiograph of a Southern blot of pulsed field gel electrophoresis of K562 DNA
digested with Not I and Swa I probed with SIB 124 and SIB172U. The size markers
are shown on the left hand side and are in kilobases.
149
kb G1 G2 G3 G4 G5
Ié
300250200150100
50
Figure 4. 13.
Autoradiograph of a Southern blot of pulsed field gel electrophoresis of DNA from 5
individuals digested with Swa I probed with SIB 124. Size markers are in kilo bases.
150

4.1.3.5. Cloning MUC3
The isolation of large genomic clones such as YACs and cosmids would
greatly aid the elucidation of the genomic structure of MUC3. To this end a number
of Y AC and cosmid libraries were screened by ourselves and our collaborators in an
attempt to isolate large genomic clones containing MUC3.
4.1.3.6. Isolation and analysis of genomic clones
GM3 was isolated in California by Dr Jim Gum by screening a human
genomic library in XFIXII with SIB 124. This clone has an insert of approximately
20kb and contains the sequences in both clones 20 and 23 at one end of the insert.
Comparison of the cDNA and genomic clone sequences indicates that there are at
least two introns located at the 3' end of MUC3 (Fig. 4. 14). Clone 20 contains
478bp of sequence 5' to the first 'small' intron, the whole 184bp of the next exon and
1243bp of sequence 3' to the second intron. This is comprised of 139bp of translated
sequence and 1104bp of untranslated sequence. The first 'small' intron has been
completely sequenced and is 106bp long but only a small amount of the second intron
at the 5' and 3' ends has been sequenced.
151
Figure 4. 14.
A diagrammatic representation of the restriction map of the genomic clone GM3. The
approximate position of various primers is indicated together with the position of Pst I
and Pvu II sites identified by sequencing.
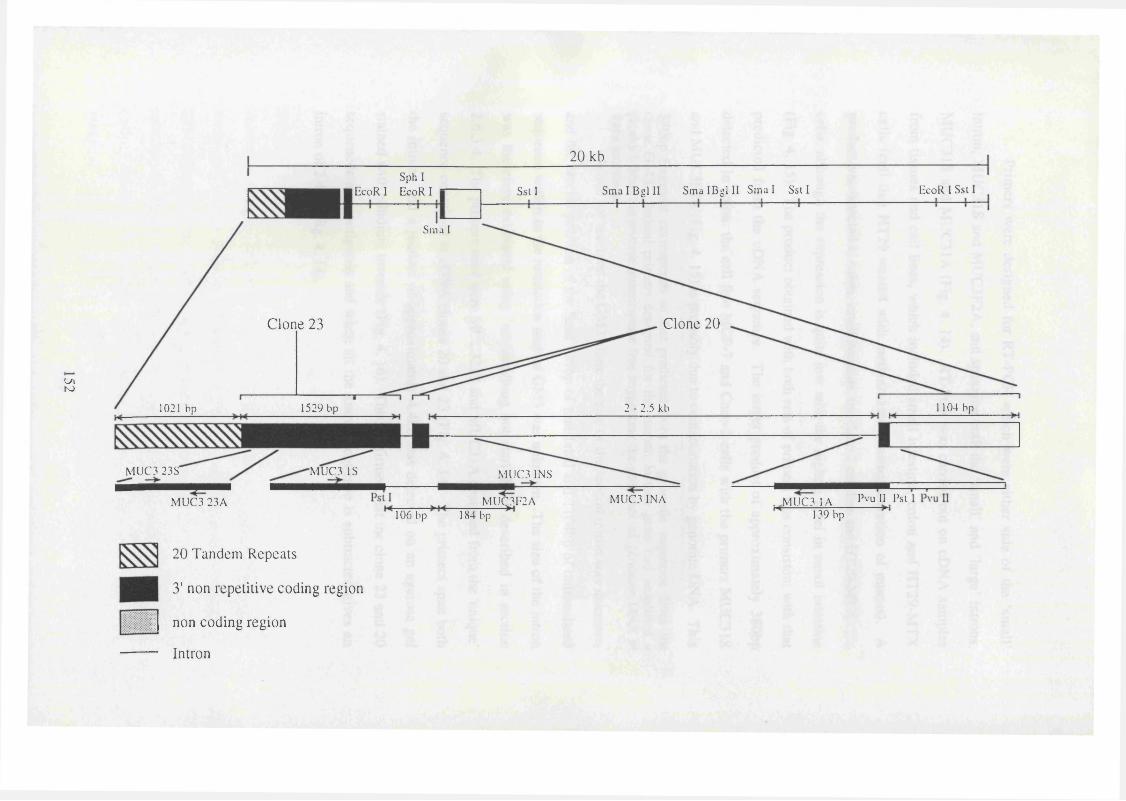
20 kb
LAK)
Sph IS m a l B g l l l S m a l B g l l l S m a l S s i l EcoR I Sst IEcoR 1 EcoR I Sst I
Sma I
Clone 20Clone 23
104 bp1529 bp 2 - 2 . 5 kh1021 bp
M U C 3 23S‘ ■MUC3 IS M U C 3 INS
Pvu II PstM U C 3 INAM U Q 3F 2AM U C 3 2 3A .M UC3 lA139 bp106 bp 184 bp
20 Tandem Repeats
3' non repetitive coding region
I non coding region
Intron

Primers were designed for RT-PCR which were either side of the ‘small’
intron, MUC31S and MUC3F2A, and spanning both the ‘small’ and ‘large’ introns,
MUC31S and MUC31A (Fig. 4. 14). RT-PCR was carried out on cDNA samples
from tissues and cell lines, which included small intestine, colon and HT29-MTX
cells (cell line HT29 treated with methotrexate causing secretion of mucus). A
product was detected in colon, small intestine, the Caco 2 cell line and HT29-MTX
cells, although the expression is quite low with the highest level in small intestine
(Fig. 4. 15). The product obtained with both sets of primers was consistent with that
predicted from the cDNA sequence. The larger product of approximately 380bp
detected in colon, the cell line MCF-7 and Caco-2 cells with the primers MUC31S
and MUC3F2A (Fig. 4. 15) is probably due to contamination by genomic DNA. This
380bp fragment corresponds to that predicted from the genomic sequence from the clone GM3. Indeed primers designed for the human lactase gene had amplified a product from the reverse transcriptase free suggesting the presence of genomic DNA in trace amounts.
When we received the GM3 clone the size of the second intron was unknown
and the precise position of the final 139bp of translated and 1104bp of untranslated
sequence within in the restriction map of GM3 was unknown. The size of the intron
was therefore estimated using 'medium/long hot start' PCR described in section
2.6.3.4. The primers used were MUC323S and MUC31A designed from the 'unique'
sequence contained in cDNA clones 20 and 23 (Fig. 4. 14). The primers span both
the introns and a product of approximately 4.4kb was detected on an agarose gel
stained with ethidium bromide (Fig. 4. 16). This confirmed that the clone 23 and 20
sequences are contiguous and when all the known sequence is subtracted gives an
intron of 2.4kb (Fig. 4. 14).
153

bp
CO SI M6 MZ SK MC CA HT
506,517396344298220
Figure 4. 15.
Reverse transcriptase (RT) PCR of cDNA samples prepared from colon (CO), small
intestine (SI), M614 normal stomach (M6 ), MZPC-4 pancreas cancer cell line (MZ), )
SKPC-3 pancreas cancer cell line (SK), MCF-7 breast cancer cell line (MC), Caco 2 ^
colon cancer cell line (CA) and HT29-MTX colon cancer cell line treated with
methatrexate (HT). With primers MUC31S and MUC3F2A. Size markers (S) are in
basepairs.
154
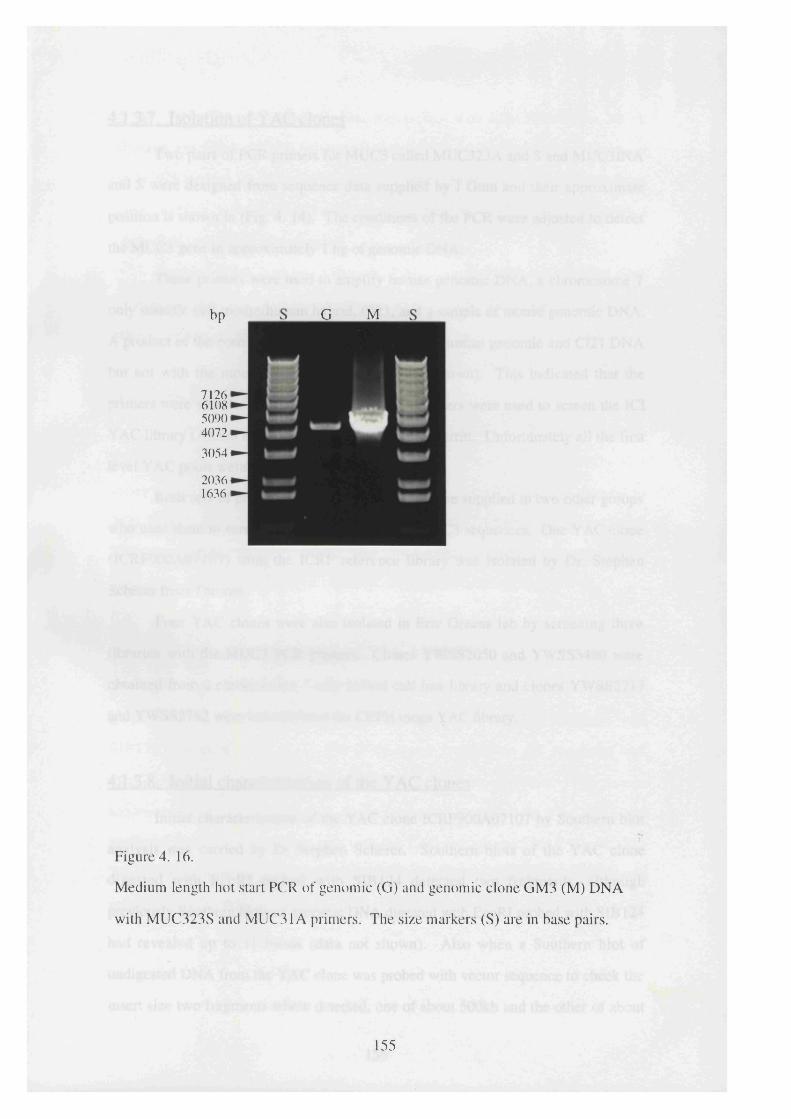
bp G M
7126 i 610Si 5090, 4072'3054
2036 1636 i
Figure 4. 16.
Medium length hot start PCR of genomic (G) and genomic clone GM3 (M) DNA
with MUC323S and MUC31A primers. The size markers (S) are in base pairs.
155

4.1.3.7. Isolation of Y AC clones
Two pairs of PCR primers for MUC3 called MUC323A and S and MUC3INA
and S were designed from sequence data supplied by J Gum and their approximate
position is shown in (Fig. 4. 14). The conditions of the PCR were adjusted to detect
the MUC3 gene in approximately 1 ng of genomic DNA.
These primers were used to amplify human genomic DNA, a chromosome 7
only somatic cell mouse/human hybrid, C121, and a sample of mouse genomic DNA.
A product of the correct size was detected with both human genomic and C121 DNA
but not with the mouse genomic DNA (data not shown). This indicated that the
primers were specific for chromosome 7. These primers were used to screen the ICI
Y AC library (Anand et al. 1989) supplied by Dr B. Carritt. Unfortunately all the first
level Y AC pools were negative.
Both sets of primers and the SIB 124 probe were supplied to two other groups
who used them to screen their Y AC libraries for MUC3 sequences. One YAC clone
(ICRF900A07107) from the ICRF reference library was isolated by Dr. Stephen
Scherer from Toronto.
Four YAC clones were also isolated in Eric Greens lab by screening three
libraries with the MUC3 PCR primers. Clones YW SS2050 and YW SS3480 were
obtained from a chromosome 7 only hybrid cell line library and clones YWSS2717
and YWSS2782 were isolated from the CEPH mega YAC library.
4.1.3.8. Initial characterisation of the YAC clones
Initial characterisation of the YAC clone ICRF900A07107 by Southern blot
analysis was carried by Dr Stephen Scherer. Southern blots of the YAC clone
digested w ith EcoRI probed w ith SIB 124 detected two fragm ents, although
previously Southern blots of genomic DNA digested with EcoRI probed with SIB 124
had revealed up to 11 bands (data not shown). Also when a Southern blot of
undigested DNA from the YAC clone was probed with vector sequence to check the
insert size two fragments where detected, one of about 500kb and the other of about
156

360kb. When the same Southern blot was probed with SIB 124 only the 500kb
fragment was detected. This indicates that there may be a mixture of two clones or
the MUC3 tandem repeat containing clone is unstable and recombines down from
500kb to 360kb. Also the EcoRI results indicated that the YAC clone only contains a
fragment of the tandem repeat region.
Samples of DNA prepared from the YAC clone ICRF900A07107 were used
for fluorescent in situ hybridisation (FISH) experiments. The strongest signal was
detected on chromosome Ip, a faint signal on chromosome 7q22 and a number of
faint signals on a variety of other chromosomes (Fig. 4. 17). The results of these
experiments indicate that the YAC is highly chimaeric.
Before any further work was done with the clones YWSS2050, YWSS3480,
YWSS2717 and YWSS2782 were tested using FISH. The clone YWSS3840 give a
strong signal on chromosome 7q22 (Fig. 4. 18), whereas YWSS2050 mapped to
7q22-31, YWSS2717 mapped to 4q32-33 and YWSS2782 mapped to 3p l4 and
13q22-31 (Fig. 4. 19). Thus YWSS3840 was the only promising clone for further
investigation of MUC3.
4.1.3.9. Further characterisation of YAC YWSS384Q
Three pairs of primers were tested on a sample of DNA from YWSS3840 and
genomic DNA. The primer pairs used were: MUC3FP1A and S designed from
SIB 172 sequence, MUC323A and S designed from clone 23 sequence and
MUC3INA and S designed from and GM3 large intron sequence. The primer
sequences are shown in Table 2. 1. These primers all amplified the YAC DNA and
produced the same size product with both the YAC and genomic DNA (Fig. 4. 20).
These results indicate that MUC3 sequences 5' and 3' to the tandem repeats are
present in YWSS3840.
157
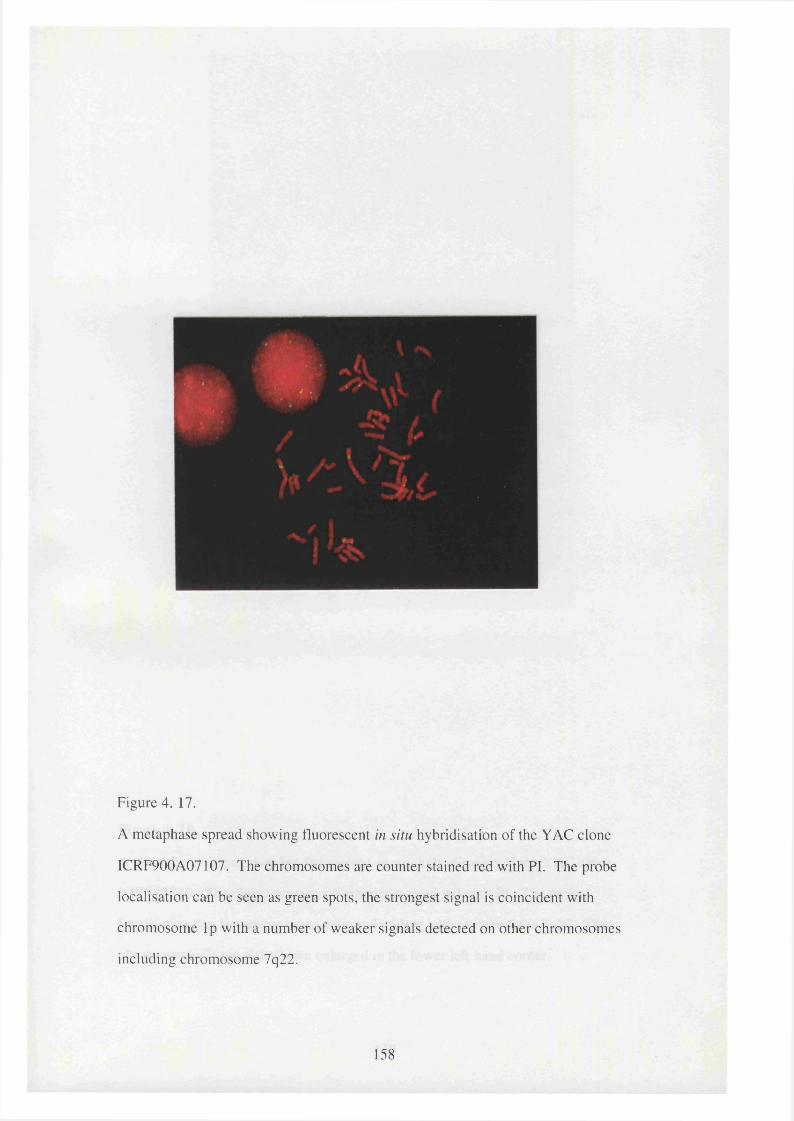
Figure 4. 17.
A metaphase spread showing fluorescent in situ hybridisation of the YAC clone
ICRF900A07107. The chromosomes are counter stained red with PI. The probe
localisation can be seen as green spots, the strongest signal is coincident with
chromosome Ip with a number of weaker signals detected on other chromosomes
including chromosome 7q22.
158
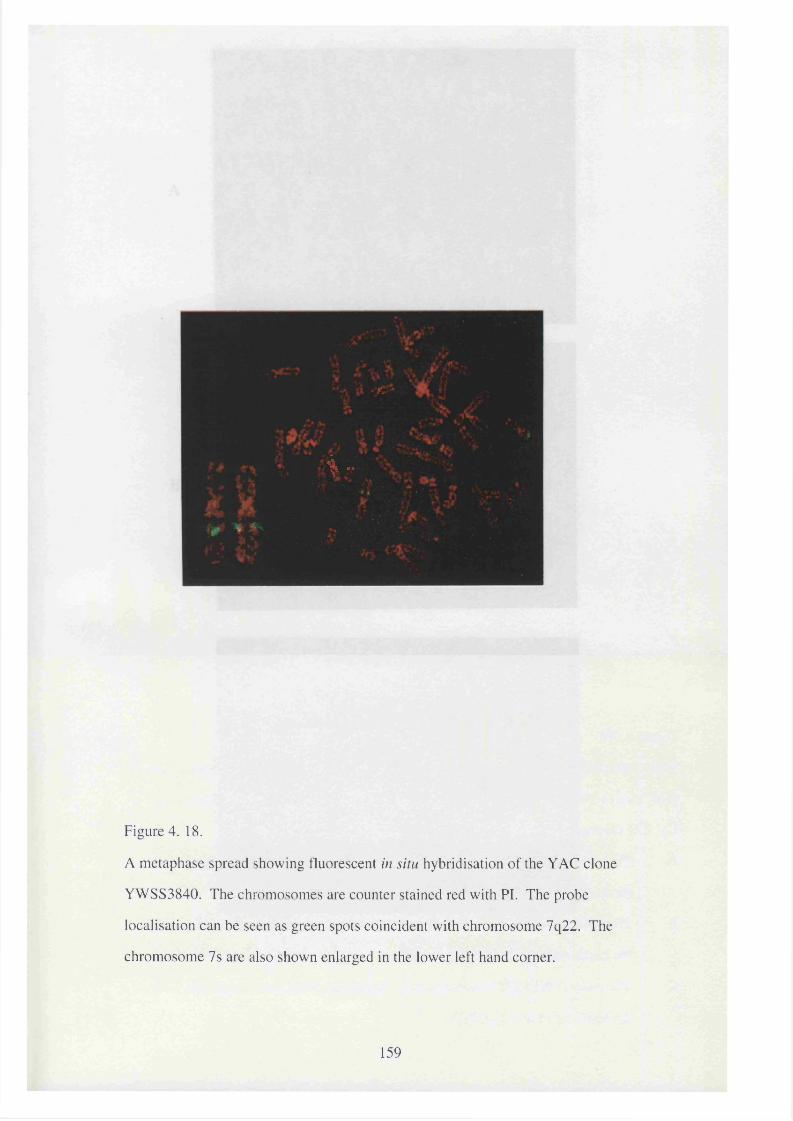
-
- K ..
Figure 4. 18.
A metaphase spread showing fluorescent in situ hybridisation of the YAC clone
YWSS3840. The chromosomes are counter stained red with PI. The probe
localisation can be seen as green spots coincident with chromosome 7q22. The
chromosome 7s are also shown enlarged in the lower left hand corner.
159

Figure 4. 19.
Three metaphase spreads A, B, and C showing fluorescent in situ hybridisation of the
YAC clones YWSS2050 (spread A), YWSS2717 (spread B) and YWSS2782 (spread
C). The chromosomes are counter stained red with PI
A. The probe YWSS2050 localisation can be seen as green spots coincident with
the border of bands 7q22 and q31.
B. The probe YWSS2717 localisation can be seen as green spots coincident with
the bands 4q32-33.
C. The probe YWSS2782 localisation can be seen as green spots coincident with
the bands 3pl4 and 13q22-31.
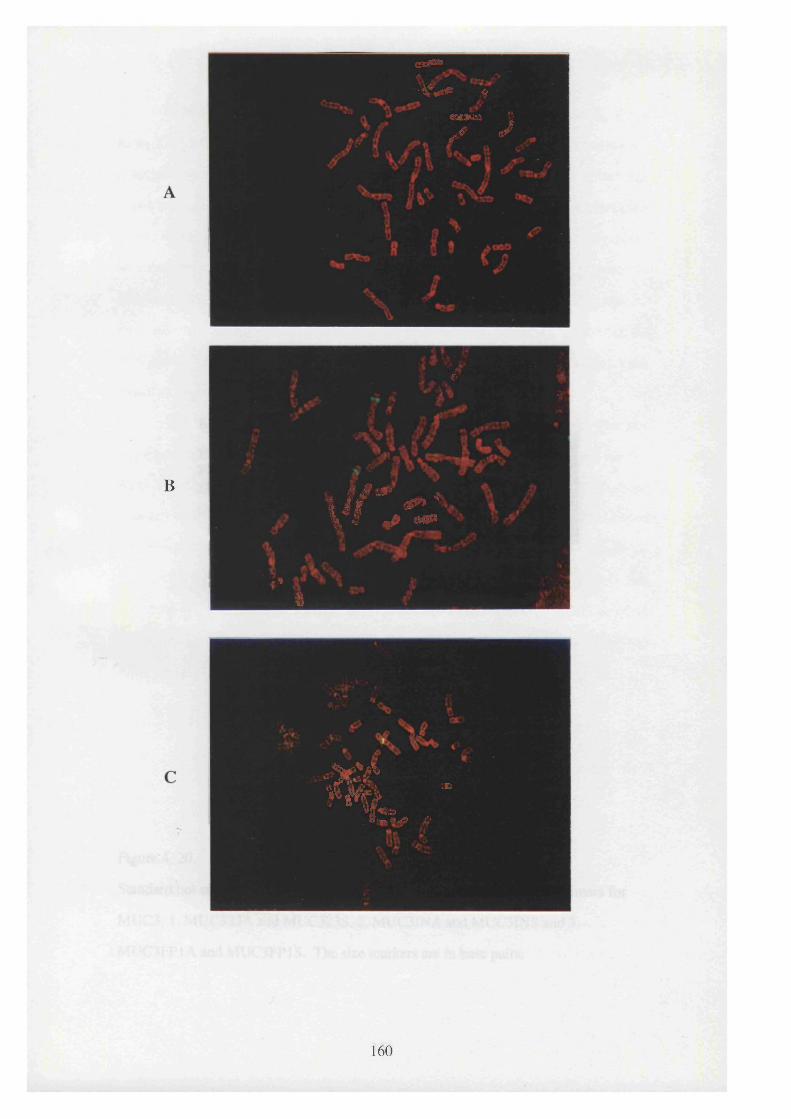
dSOl
A w V
; r j
f'
B
W y z :
hÎ5
% ■H ». IUJ> Z'
160
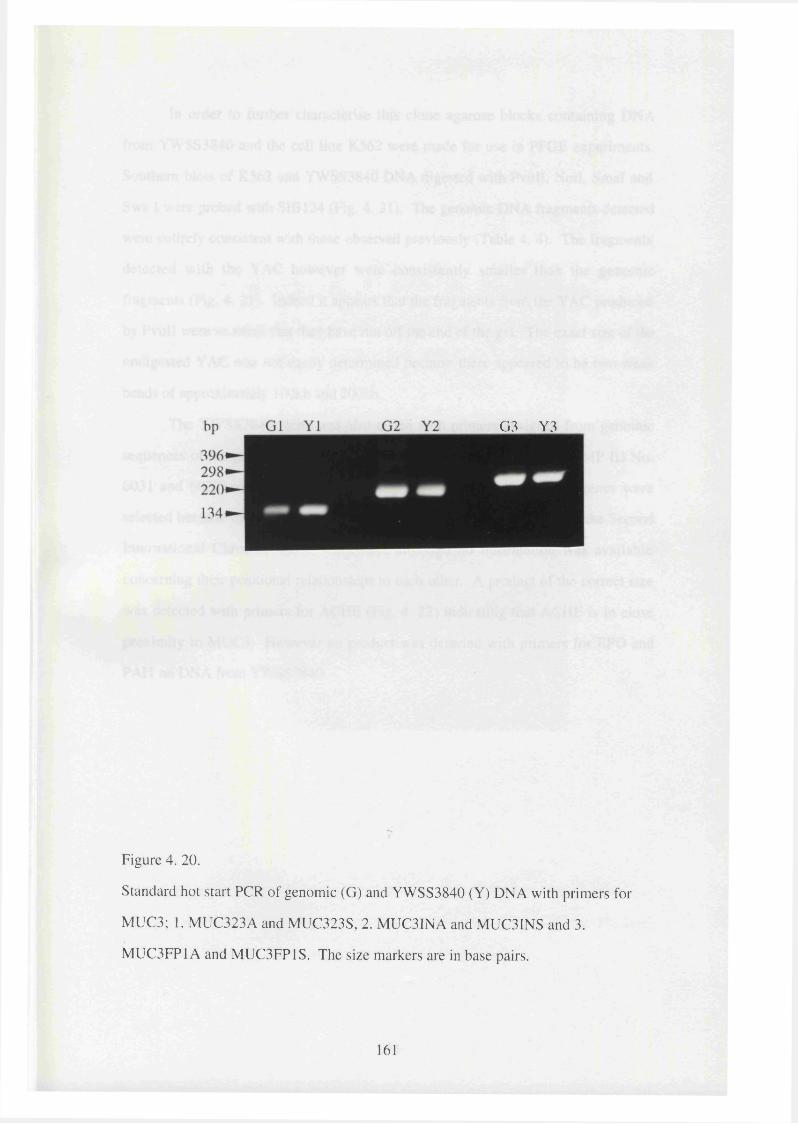
G3 Y3
Figure 4. 20.
Standard hot start PCR of genomic (G) and YWSS3840 (Y) DNA with primers for
MUC3; 1. MUC323A and MUC323S, 2. MUC3INA and MUC3INS and 3.
MUC3FP1A and MUC3FP1S. The size markers are in base pairs.
161

In order to further characterise this clone agarose blocks containing DNA
from YWSS3840 and the cell line K562 were made for use in PFGE experiments.
Southern blots of K562 and YWSS3840 DNA digested with PvuII, Notl, Smal and
Swa I were probed with SIB 124 (Fig. 4. 21). The genomic DNA fragments detected
were entirely consistent with those observed previously (Table 4. 4). The fragments
detected with the YAC however were consistently smaller than the genomic
fragments (Fig. 4. 21). Indeed it appears that the fragments from the YAC produced
by PvuII were so small that they have run off the end of the gel. The exact size of the
undigested YAC was not easily determined because there appeared to be two weak
bands of approximately lOOkb and 200kb.
The YWSS3840 clone was also tested with primers designed from genomic
sequences of the genes EPO (HGMP ID No. 6029 and 6030), PA Il (HGMP ID No.
6031 and 6032) and ACHE (HGMP ID No. 6033 and 6034), These genes were
selected because they were shown to map to the same region as MUC3 at the Second
International Chromosome 7 Workshop, although no information was available
concerning their positional relationships to each other. A product of the correct size
was detected with primers for ACHE (Fig. 4. 22) indicating that ACHE is in close
proximity to MUC3. However no product was detected with primers for EPO and
PA Il on DNA from YWSS3840.
162

kb
Pvu II N ot I S m a I S w îJ UndigestedI-------------- 1 I----------- 1 I---------- 1 I------------1 I
Y G Y G Y G Y G Y
400
200
Figure 4. 21.
Autoradiograph of a PFGE Southern blot of K562 (G) and YWSS3840 (Y) DNA
digested with Pvu II, Not I, Sma I and Swa I probed with SIB 124 (MUC3). The size
markers are shown on the left hand side and are in kilobases.
163
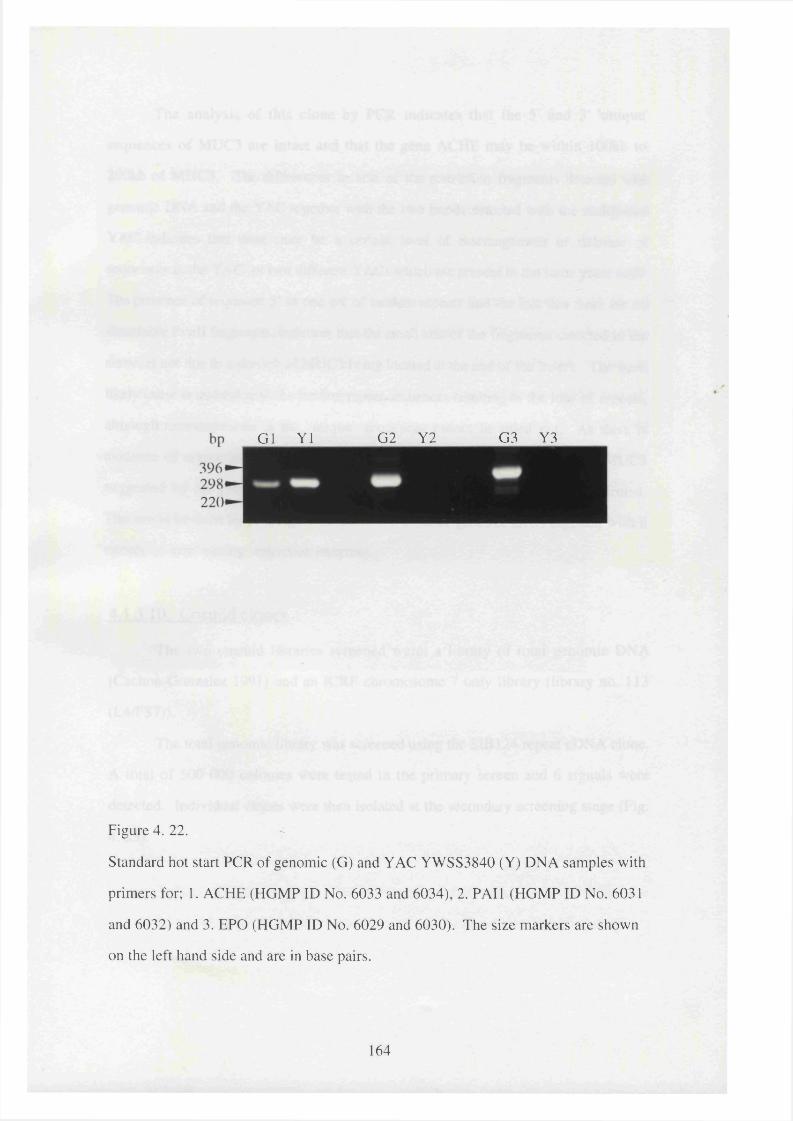
G1 Y1 G2 Y2 G3 Y3
Figure 4. 22. y
Standard hot start PCR of genomic (G) and YAC YWSS3840 (Y) DNA samples with
primers for; 1. ACHE (HGMP ID No. 6033 and 6034), 2. PAH (HGMP ID No. 6031
and 6032) and 3. EPO (HGMP ID No. 6029 and 6030). The size markers are shown
on the left hand side and are in base pairs.
164
The analysis of this clone by PCR indicates that the 5' and 3' 'unique'
sequences of MUC3 are intact and that the gene ACHE may be within lOOkb to
200kb of MUC3. The differences in size of the restriction fragments detected with
genomic DNA and the YAC together with the two bands detected with the undigested
YAC indicates that there may be a certain level of rearrangement or deletion of
sequences in the YAC, or two different YACs which are present in the same yeast cells.
The presence of sequence 5’ to one set of tandem repeats and the fact that there are no
detectable PvuII fragments, indicates that the small size of the fragments detected in the
clone, is not due to a portion of MUC3 being located at the end of the insert. The most
likely cause is instability in the tandem repeat sequences resulting in the loss of repeats,
although rearrangements in the 'unique' sequences cannot be ruled out. As there is
evidence of rearrangement in YWSS3840 the close proximity of ACHE to MUC3
suggested by the presence of ACHE sequences in the YAC needs to be confirmed.
This could be done by probing PFGE Southern blots of genomic DNA digested with a
variety of 'rare' cutting restriction enzymes.
4.1.3.10. Cosmid clones
The two cosmid libraries screened were; a library of total genomic DNA
(Cachon-Gonzalez 1991) and an ICRF chromosome 7 only library (library no. 113
(L4/FS7)).
The total genomic library was screened using the SIB 124 repeat cDNA clone.
A total of 500 000 colonies were tested in the primary screen and 6 signals were
detected. Individual clones were then isolated at the secondary screening stage (Fig.
4. 23).
165
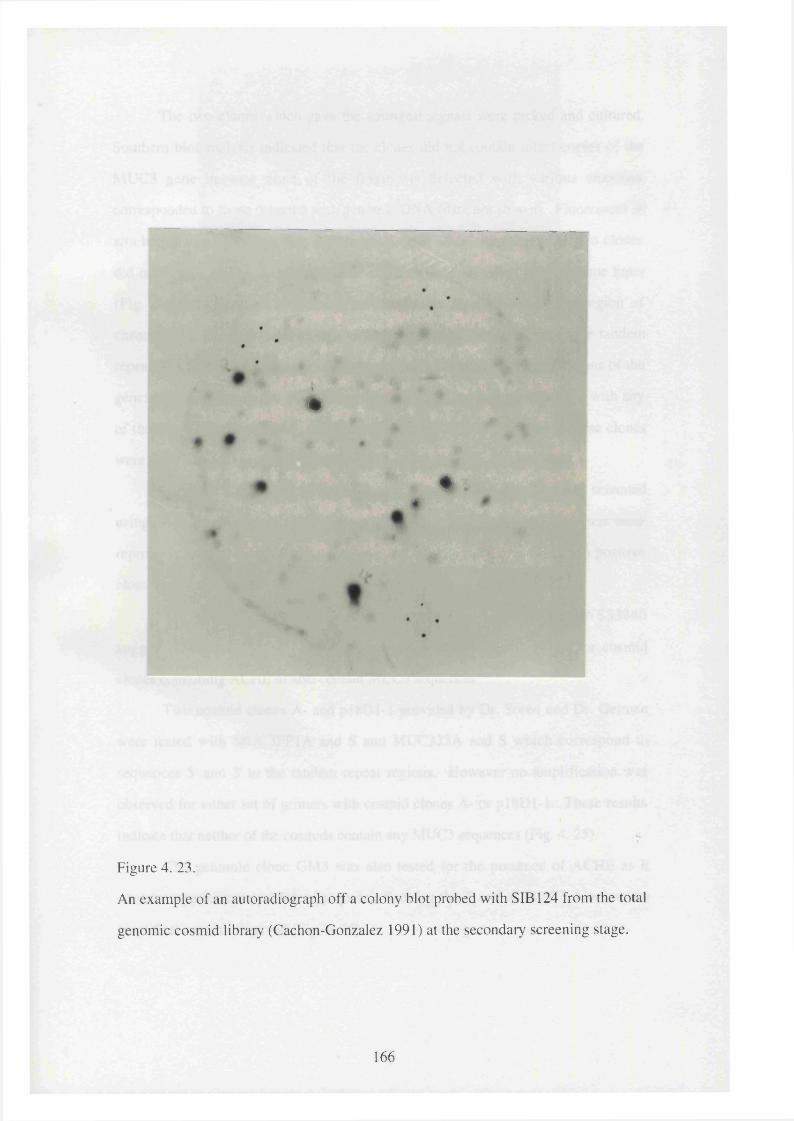
\»
##
Figure 4. 23.
An example of an autoradiograph off a colony blot probed with SIB 124 from the total
genomic cosmid library (Cachon-Gonzalez 1991) at the secondary screening stage.
166

The two clones which gave the strongest signals were picked and cultured.
Southern blot analysis indicated that the clones did not contain intact copies of the
MUC3 gene because none of the fragments detected with various enzymes
corresponded to those detected with genomic DNA (data not shown). Fluorescent in
situ hybridisation gave an unexpected result i.e. DNA samples from the two clones
did not hybridise to chromosome 7 but a signal was detected on chromosome Sqter
(Fig. 4. 24). This may indicate the presence of a related gene in this region of
chromosome 8 . However this did not seem particularly likely because the tandem
repeat sequences of mucin genes appear to be the least well conserved regions of the
genes. Further more no signal was detected in this region of chromosome 8 with any
of the other MUC3 clones used for in situ hybridisation experiments. These clones
were thus most probably chimaeric and were therefore not pursued further.
The gridded chromosome 7 library provided by the ICRF was also screened
using the SIB 124 clone however no positive clones were detected. The filters were
reprobed when the 5' cDNA clone SIB 172 became available but again no positive
clones were detected.
The positive result obtained with primers for ACHE with YWSS3840
suggested that MUC3 and ACHE might be in close enough proximity for cosmid
clones containing ACHE to also contain MUC3 sequences.
Two cosmid clones A- and p l 8D l-l provided by Dr. Soreq and Dr. Getman
were tested with MUC3FP1A and S and MUC323A and S which correspond to
sequences 5' and 3' to the tandem repeat regions. However no amplification was
observed for either set of primers with cosmid clones A- or p i 8D 1-1. These results
indicate that neither of the cosmids contain any MUC3 sequences (Fig. 4. 25).
The genomic clone GM3 was also tested for the presence of ACHE as it
contains approximately 15kb of sequence flanking the 3' end of MUC3, however no
amplification was observed (Fig. 4. 25).
167
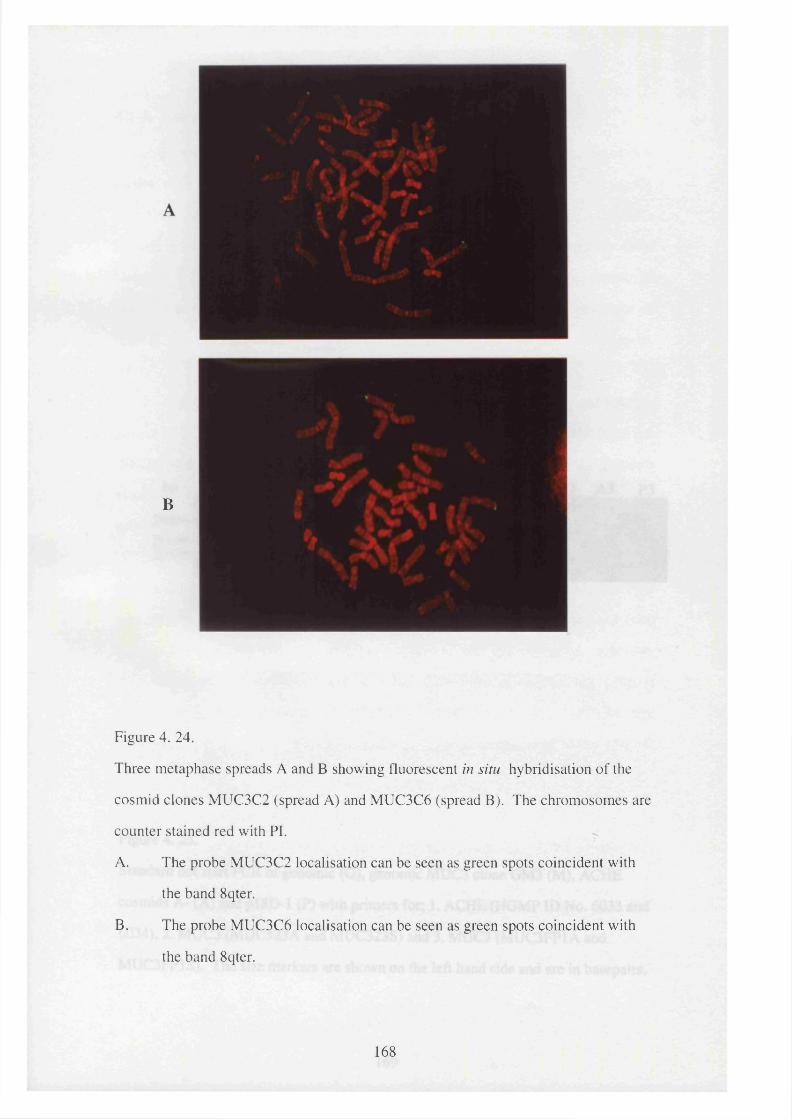
B
Figure 4. 24.
Three metaphase spreads A and B showing fluorescent in situ hybridisation of the
cosmid clones MUC3C2 (spread A) and MUC3C6 (spread B). The chromosomes are
counter stained red with PL
A. The probe MUC3C2 localisation can be seen as green spots coincident with
the band Sqter.
B. The probe MUC3C6 localisation can be seen as green spots coincident with
the band Sqter.
16S
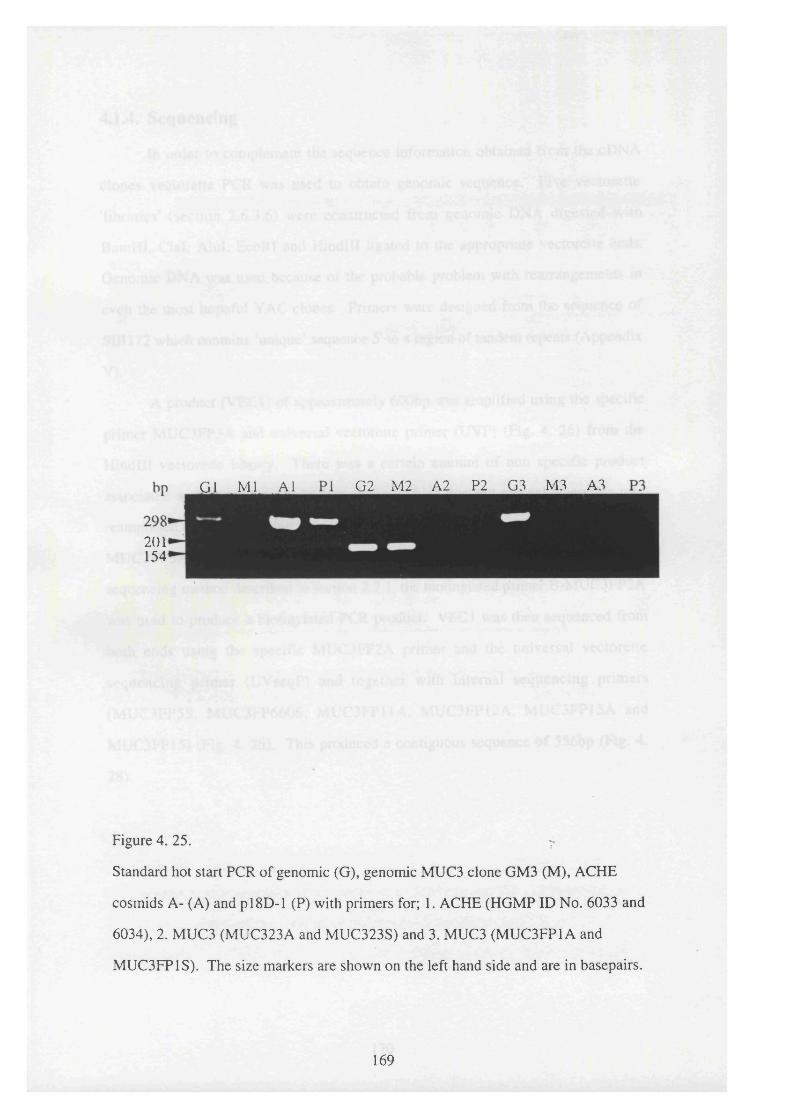
201154
G1 Ml Al G2 M2 A2 P2 G3 M3 A3
Figure 4. 25.
Standard hot start PCR of genomic (G), genomic MUC3 clone GM3 (M), ACHE
cosmids A- (A) and p l8D-l (P) with primers for; 1. ACHE (HGMP ID No. 6033 and
6034), 2. MUC3 (MUC323A and MUC323S) and 3. MUC3 (MUC3FP1A and
MUC3FP1S). The size markers are shown on the left hand side and are in basepairs.
169

4.1.4. Sequencing
In order to complement the sequence information obtained from the cDNA
clones vectorette PCR was used to obtain genomic sequence. Five vectorette
'libraries' (section 2.6 .3.6 ) were constructed from genomic DNA digested with
BamHI, Clal, Alul, EcoRI and Hindlll ligated to the appropriate vectorette ends.
Genomic DNA was used because of the probable problem with rearrangements in
even the most hopeful Y AC clones. Primers were designed from the sequence of
SIB 172 which contains ‘unique’ sequence 5' to a region of tandem repeats (Appendix
V).
A product (VECl) of approximately 600bp was amplified using the specific
primer MUC3FP3A and universal vectorette primer (UVP) (Fig. 4. 26) from the
H indlll vectorette library. There was a certain amount of non specific product
associated with the distinct band (not shown) which was not present when this was
reamplified (Fig. 4. 27) using the specific primer MUC3FP2A which is 5' (nested) to
MUC3FP3A (Fig. 4. 26). In order to sequence VECl using the biotinylated
sequencing method described in section 2.7.1. the biotinylated primer B-MUC3FP2A
was used to produce a biotinylated PCR product. VECl was then sequenced from
both ends using the specific MUC3FP2A primer and the universal vectorette
sequencing prim er (UVseqP) and together with internal sequencing primers
(MUC3FP5S, MUC3FP660S, MUC3FP11A, MUC3FP12A, MUC3FP15A and
MUC3FP15) (Fig. 4. 26). This produced a contiguous sequence of 556bp (Fig. 4.
28X
170

I I
%V E C 4
V E C 3
V E C l
S IB 172
3»-U V P
IA nti sen se
10 uu 1330
Vectorette sequence
t 9 I I 1 ? 1 ?
U V P
Pnmers
1. M U C 3F P 7A2. M U C 3F P 6A3. M U C 3F P 10S4. M U C 3F P5S5. M U C 3F P 5A6. M U C 3F P 4A7. M U C 3F P 660SK. M U C 3F P 11Ay. M U C 3F P 12A10. M U C 3F P 1S11. M U C 3F P 1S A12. M U C 3F P 2S13. M U C 3F P 2A14. M U C 3F P 3A15. M U C 3F P 1AU V P. U niversal V ectorette Prinier
Figure 4. 26.
Diagrammatic representation of the composite vectorette and SIB 172 sequence
showing the direction and position of primers used for vectorette PCR and
sequencing.
171
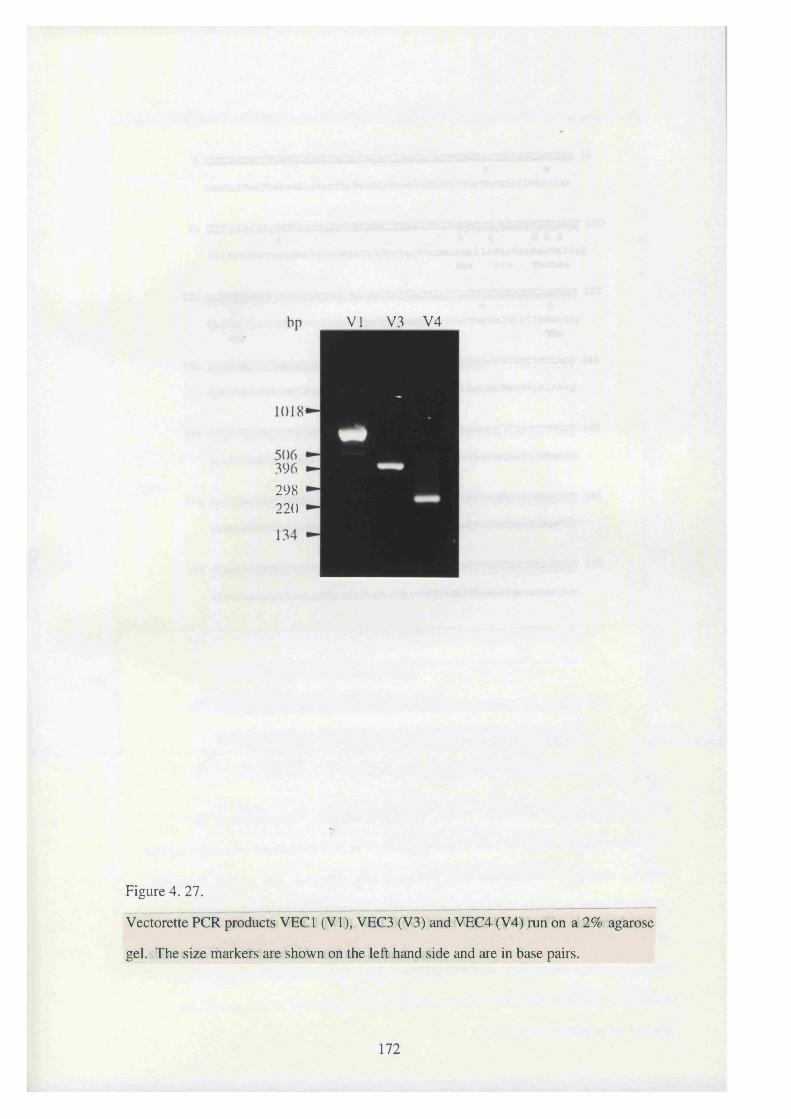
VI V3 V4
298220
Figure 4. 27.
Vectorette PCR products VECl (VI), VEC3 (V3) and VEC4 (V4) run on a 2% agarose
gel. The size markers are shown on the left hand side and are in base pairs.
172
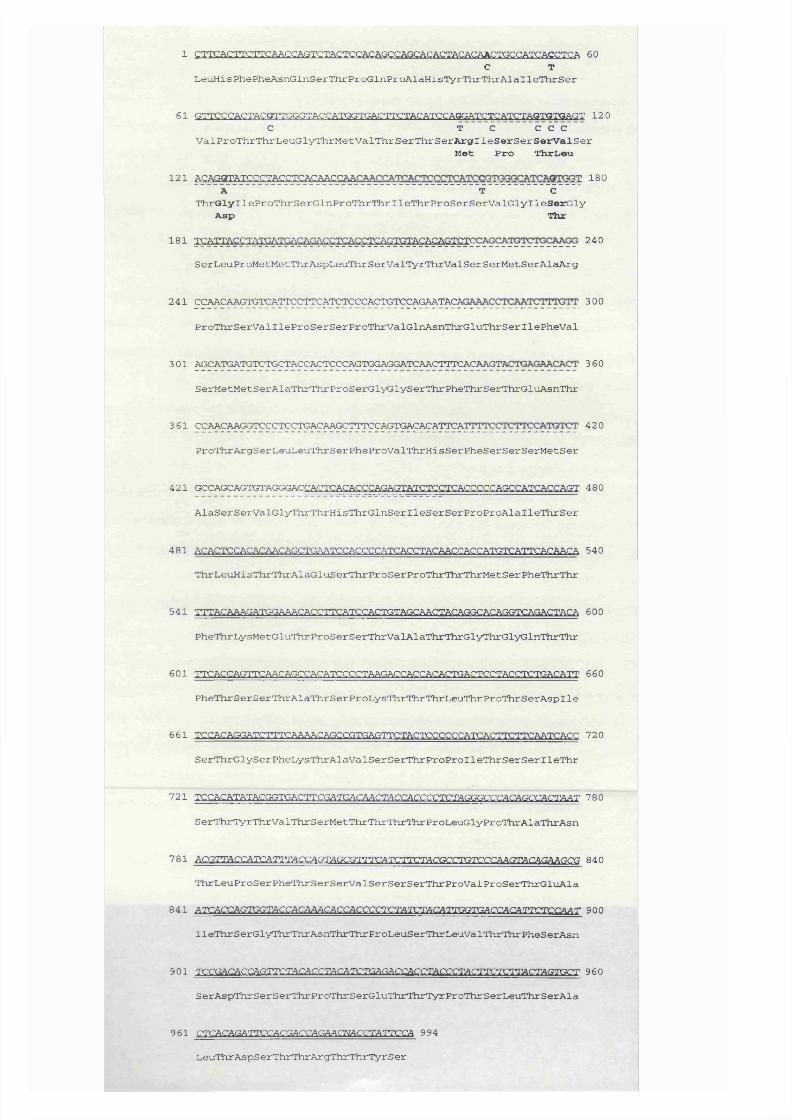
1 C T T C A C T T C T T C A A C C A G T C T A C T C C A C A G C C A G C A C A C T A C A C A A C T G C C A T C A C C T C A 6 0
C TL e u H i s P h e P h e A s n G l n S e r T h r P r o G l n P r o A l a H i s T y r T h r T h r A l a l l e T h r S e r
6 1 G T T C C C A C T A C G T T G G G T A C C A T G G T G A C T T C T A C A T C C A G G A T C T C A T C T A G T O T G A G T 1 2 0
C T C C C CV a l P r o T h r T h r L e u G l y T h r M e t V a l T h r S e r T h r S e r A r s r I l e S o r S e r S e i V a l S e r
M e t P r o T h r L o u
1 2 1 A C A G O T A T C C C T A C C T ^ C j ^ C C ^ 1 8 0
A ~~ ’ T CT h r G l y l l e P r o T h r S e r G l n P r o T h r T h r l l e T h r P r o S e r S e r V a l G l y l l e S o r G l y
A s p T tir
1 8 1 T C A T T A C C T A T G A T C A C A G A C C T C A C C T C A G T T G T A C A C A G T C T C 2 4 0
S e r L e u P r o M e t M e t T h r A s p L e u T h x S e r V a l T y r T h r V a l S e r S e r M e t S e r A l a A r g
2 4 1 C C ^ C f ^ G T ? G T C A T T C C lT ^ A T C T C C C A C r o T C C A G A A T A C A 3 0 0
P r o T h r S e r V a l l l e P r o S e r S e r P r o T h r V a l G l n A s n T h r G l u T h r S e r l l e P h e V a l
3 0 1 A G C A T G A T C T C T G C T A C C A C T C C C A G T C G A G G A T C ^ C T T T C A C ^ G T ^ 3 6 0
S e r M e t M e t S e r A l a T h r T h r P r o S e r G l y G l y S e r T h r P h e T h r S e r T h r G l u A s n T h r
3 6 1 C C ^ C f ^ G G T C C C T C C T G A C ^ G C T T T C C A G T ^ C A C A l T ^ 4 2 0
P r o T h r A r g S e r L e u L e u T h r S e r P h e P r o V a l T h r H i s S e r P h e S e r S e r S e r M e t S e r
4 2 1 G C C A G C A G T C T A G G G A C C A C T C A C A C C C A G A G T A T C T C C T C A C C C C C A G C C A T C A C C A G T 4 8 0
A l a S e r S e r V a l G l y T h r T h r H i s T h r G l n S e r l l e S e r S e r P r o P r o A l a l l e T h r S e r
4 8 1 A C A C T C C A C A C A A C A g C T G A A T C C A C C C C A T C A (:C T A C A A C C A C C A T G T C A T T C A C A A C A 5 4 0
T h r L e u H i s T h r T h r A l a G l u S e r T h r P r o S e r P r o T h r T h r T h r M e t S e r P h e T h r T h r
5 4 1 T T T A C A A A G A T G G A A A C A C C T T C A T C C A C T G T A G C A A C T A C A G G C A C A G G T C A G A C T A C A 6 0 0
P h e T h r L y s M e t G l u T h r P r o S e r S e r T h r V a l A l a T h r T h r G l y T h r G l y G l n T h r T h r
6 0 1 T T C A C C A G T T C A A C A G G C A C A T C .C C C T A A G A C C A C C A C A C T G A C T C C T A C C T C T G A C A T T 6 6 0
P h e T h r S e r S e r l l i r A l a T h r S e r P r o L y s T h r T h r T h r L e u T h r P r o T h r S e r A s p I l e
6 6 1 T C C A C A G G A T C T T T C A A A A C A G C C G T G A G T T C T A C T C C C C C C A T C A C T T C T T C A A T C A C C 7 2 0
S e r T h r G l y S e r P h e L y s T h r A l a V a l S e r S e r T h r P r o P r o I l e T h r S e r S e r l l e T h r
7 2 1 T ^ Q hQ hT h T h Q Q Q T Q h Q T T C G A T G A C A A C T A C C A C C C C T C T A G G G C C C A C A G C C A C T A A T 7 8 0
S e r T h r T y r T h r V a l T h r S e r M e t T h r T h r T h r T h r P r o L e u G l y P r o T h r A l a T h r A s n
7 8 1 A ^ T T A Q C A T (^ T T T A K A S T A G C G T T T C A T C T T C T A C G C C T G T C C C A A G T A C A G A A G C G 8 4 0
T h r L e u P r o S e r P h e T h x S e r S e r V a l S e r S e r S e r T h r P r o V a l P r o S e r T h r G l i i A l a
8 4 1 A T C A C G A G T C G T A C C A C A A A C A C C a C œ C T C T A Œ r T A C A r ro G T tS A C C A C A T ir r r C C A A T 9 0 0
I l e T h r S e r G l y T h r T h r A s n T h r T h r P r o L e u S e r T h r L e u V a l T h r T h r P h e S e r A s n
9 0 1 TC C G A C A C C A G TT C TA C A C C TA C ^TC TG A C iA C C A C C TA C C C yrA C yrT C TC TT A C TA a'T rx-^ 9 6 0
S e r A s p T h r S e r S e r T h r P r o T h r S e r G l u T h r T h r T y r P r o T h r S e r L e u T h r S e r A l a
9 6 1 C TC A C A G A TT C C A C G A C C A G A A C N A C C T A TTC C A 9 9 4
L e u T h r A s p S e r T h r T h r A r g T h r T h r T y r S e r

Two more primers were designed from the 5' end of the VECl sequence i.e.
MUC3FP4A and the nested primer MUC3FP5A (Fig. 4. 26). Using these primers a
product (VEC3) of approximately 350bp was amplified from the H indlll vectorette
library (Fig. 4. 27). This was reamplified using MUC3FP5A together with the
biotinylated universal vectorette primer (B-UVP). This product was sequenced from
both ends using the specific primer MUC3FP5A and UVseqP together with internal
sequencing primers (MUC3FP10S and MUC3FP6A) (Fig. 4. 26). This produced a
contiguous sequence of 358bp which had a 21bp overlap with the VECl sequence
(Fig. 4. 28).
The product VEC4 (approximately 150bp) was amplified from the Alul
vectorette library using primers designed from the 5' end of VEC3 i.e. MUC3FP6A
and the nested primer MUC3FP7A (Figs. 4. 25 and 4. 24). The product was
sequenced from both ends using the cycle sequencing method described in section
2.7.2. and the primers MUC3FP7A and UVseqP. A sequence of 207bp was obtained
with an overlap of 106bp the VEC3 sequence (Fig. 4. 28).
The sequences of VECl, 3 and 4 form a contiguous sequence of 994bp which
extends 739bp 5' to the SIB 172 sequence and has now been sequenced completely on
both strands (Fig. 4. 28). The single open reading frame codes for a 331 amino acid
polypeptide which is rich in threonine (29.6%), serine (21.8%) and proline (9.3%)
which together account for 60.7% of amino acids in the peptide (Fig. 4. 28). It is
interesting to note that in the VEC4 nucleotide sequence shown in Figure 4. 26 there
are a number of positions were it was not possible to distinguish between two
alternative nucleotides. In a number of cases the alternative nucleotides also leads to
an alternative amino acid but do not create any stop codons (Fig. 4. 28). This
suggests that two distinct species are present in the PCR product both of which are
very similar at the nucleotide level. The nucleotide sequence and both versions of the
peptide sequence have been used to search the sequence databases at the HGMP
resource centre, which include GenBank and SwissProt. However no significant
homologies were detected with any of the DNA or protein sequences in these
174

databases. Also both the peptide sequences and nucleotide sequence were analysed
using the program ‘Repeat’ but no significant repetitive structure was found.
175
4.2. Discussion
The MUC3 polymorphisms detected with SIB 124 on DNA digested with PstI
and PvuII indicate that there are two separate regions of tandem repeats separated by
‘unique’ sequence, in which PstI and PvuII sites are located, and that at least part of
the variation is due to VNTR. However it seems that the PstI polymorphism is not
simply the result of VNTR variation but may also result from a polymorphic flanking
PstI site. The most likely interpretation is that there is an additional polymorphic PstI
site closer to the tandem repeats. This is reminiscent of the situation with MUC2 were
there are polymorphic restriction sites as well as the VNTR polymorphism, although
in the case of MUC2 they are within the tandem repeats (Toribara, Gum et al. 1991).
Like many of the mucin genes, MUC3 shows a high level of variation which is
illustrated by the large number of alleles observed, although the resolution of the
Southern blots used did not allow the precise number to be determined. It seems
likely that the generation and maintenance of the VNTR polymorphism would be due
to mutational processes such as unequal sister chromatid exchange as discussed in
section 1.1. It is worth noting that no new mutations were observed in the 40 CEPH
EUROGEM families tested.
The high variability of MUC3 meant that it was an excellent marker for
genetic mapping. Although MUC3 had been physically assigned to chromosome
7q22 very little was known about the relative order and distances of the markers in
this region especially with respect to MUC3 at the outset of this project. The initial
intention for generating the map of chromosome 7 shown in Figure 4. 3 was to try
and create a map with as many markers as possible and to try and integrate markers
from the GENETHON and NIH/CEPH maps (1992; Weissenbach, Gyapay et al.
1992). It was also hoped that the markers included in the region containing MUC3
may prove useful for long range physical mapping. When the relative order of
markers which were included in the map I had constructed and each of the published
maps were compared they were found to be in agreement (Appendix VI). Also the
order of the markers which had been mapped using physical methods to particular
176

regions on chromosome 7 agreed with that predicted from my map (Fig. 4. 3).
However the genetic distances of the markers flanking MUC3 suggested that they
were probably separated by large physical distances and would not be useful for
PFGE.
Using the order from the chromosome 7 map shown in Figure 4. 3 a map of
the q arm was constructed when version 7.1 of the CEPH database became available
which had improved data for a number of the markers on version 6 and many new
markers (Fig. 4. 4). This map included a number of new markers which map closer to
MUC3 such as D7S1493, D7S515, UT7164 and the genes C0L1A2 and MET (Fig. 4.
4). Unfortunately the two genes (C0L1A2 and MET) which would be the most
interesting for long range physical mapping are still a considerable genetic distance
from MUC3 i.e. COL1A2 is 6 .6 cM and MET is 21.7 cM from MUC3 and are thus
not suitable. However this map together with maps from other laboratories was used
to construct a consensus map of chromosome 7 at the second International Workshop
(Tsui, Donis-Keller et al. 1995).
It is interesting to note that the maps of chromosome 7 calculated for each sex
are of different lengths i.e.. Male 224.2 cM and female 342.7 cM (Fig. 4. 3), although
the total map length is likely to have been increased by the inclusion of errors. The
longer female map reflects the fact that on average there is more recombination in
females than males throughout the genome. This is in accordance with Haldanes
observation that crossing over is more frequent in the homogametic sex e.g. XX than
in the heterogametic sex e.g. XY (Haldane 1922). There are however regional
differences in the relative recombination rate and it is possible that this will also
prove to be the case for chromosome 7 (Keith et al. 1990). The distance between loci
towards the telomeres of the male map appear to increase which indicates more
recombinations, were as they seem more evenly spread along the chromosome in the
female map. This may be an indication of a similar phenomenon to that observed
with chromosome 1 Ip 15, chromosome 9, mouse chromosome 2 and chromosome 21
as discussed in section 3.5.
177

The physical mapping of the region of chromosome 7 to which MUC3 has
been localised has proved quite difficult and is reflected in the lack of large genomic
clones such as YACs and cosmids for this region. A number of genes were located in
the same region of chromosome 7 in the second International Workshop report for
which the relative order was not known (1992; Weissenbach, Gyapay et al. 1992).
This group included MUC3, PAIl, ACHE and EPO. Because of the lack of physical
mapping resources the most straightforward method was to use genetic information
for mapping loci by comparison with panels of defined meiotic breakpoints as
described in section 3.5. One difference however was the use of the program
‘CROSSFIND’ written by John Attwood in this laboratory (Attwood and Povey
1996) which has been designed to create breakpoint diagrams using the entire map of
a chromosome. The map used was based on the consensus order of the whole of
chromosome 7 which includes MUC3 but not PAIl EPO and PA Il. The most
suitable candidate for mapping in this way was PAIl because an extremely variable
tetranucleotide repeat polymorphism had already been described for this gene (GOB
accession ID; GDB:512834). PAIl had already been included in a map of
chromosome 7 by the Donnis-Keller group under its old name PLANHl (Tsui,
Donis-Keller et al. 1995). However these workers had not been able to insert MUC3
into the same map but had shown that it probably mapped somewhere in the same
region. Comparison of the results obtained from analysis of the PAIl polymorphism
with the defined meiotic breakpoints show that the most likely position for PAIl is
between MUC3 and D7S554.
This demonstrates a rapid and relatively straightforward method of genetic
mapping. Although this method does not give an indication of the genetic distances it
may be possible to use the order determined by this method together with a program
such as CRI-MAP. However because the families used in this analysis were not
selected randomly but on the basis that they contained a recombination, map
distances based on these data would be artificially high. The close proximity of PAIl
to MUC3 indicates that this might possibly be a useful marker for PFGE analysis.
178

These panels of chromosomes will also be useful for the future mapping of other loci
on chromosome 7 and in particular the precise mapping of markers within the same
region as MUC3 and PAIl.
The genetic analysis of MUC3 shows that the two sets of polymorphic bands
detected with PstI and PvuII are tightly linked, indicating that the two sets of tandem
repeats are in close proximity to each other. This suggests two possible scenarios;
one is that there is a single MUC3 gene with two regions of tandem repeats separated
by unique sequence, the other is that there are two genes. Attempts were made to
investigate the physical structure of the MUC3 gene locus using a variety of
techniques.
The physical mapping of MUC3 has been complicated by the lack of genomic
clones. However a certain amount of information has come from the use the cDNA
clones (SIB 124, clone 20 and SIB172U) for Southern blot analysis of genomic DNA
separated using PFGE and standard gel electrophoresis.
In situ hybridisation using probes for the tandem repeat cDNA clone SIB 124,
the ‘unique’ sequence cDNA clone 23 and the genomic clone GM3 indicate that
MUC3 maps to a single locus on chromosome 7q22. Furthermore all the MUC3
sequences appear to be located on a single 400kb Notl fragment and a single 200kb
Swa I fragment (Fig. 4. 12). However the Swa I fragment is the smallest single
fragment that has been detected and may indicate that the MUC3 genetic region
covers a large region of DNA. There does not appear to be any very large scale
interindividual variation in this region and the variation due too VNTR is presumably
too small to be detected given the resolution of PFGE (Fig. 4. 13). The Notl sites
may indicate the presence of CpG islands as a similar size fragment is also detected
with BssHII (Table 4. 4). CpG island are often associated with the 5’ regions of
genes (Craig and Bickmore 1994). If MUC3 has a CpG island associated with its 5’
end then the fact that only a single fragment is detected with Notl and BssHII might
hint that there is either a single MUC3 gene in which the duplicated sequences are
tandemly arrayed or that the two genes are inverted with respect to each other.
179

PFGE also shows that two fragments are detected with SIB 124 on genomic
DNA digested with other enzymes such as Smal (80kb and 45kb) and Sfil (160kb and
85kb) (Table 4. 4). These fragments may indicate the presence of cut sites for these
enzymes in the sequences flanking and between the tandem repeat regions. The
multiple fragments detected with the enzymes SacII, Nrul and Mlu I also indicate
multiple cut sites within MUC3. However the intensity of the bands is variable and
overall the hybridisation does not appear to be as good as with the other enzymes
(Fig. 4. 11). Since the DNA blocks were all made at the same time and should be
virtually identical in their DNA content this may indicate that the digestion of the
agarose embedded DNA was not complete, possibly due to technical reasons.
However it should be noted that some of these enzymes are méthylation sensitive and
méthylation of the DNA may have resulted in partial digestion to produce the
multiple fragments detected.
When Southern Blots of genomic DNA digested with PvuII, PstI and Hindlll,
run under standard conditions, were probed with clone 20 and SIB172U a number of
bands were detected as well as the larger polymorphic bands detected with SIB 124
(Fig. 4. 10) and when PvuII digests are used, clone 20 and SIB172U detect both sets
of polymorphic bands detected by SIB 124, which would suggest that these ‘unique’
sequences are also repeated. The common 1.8kb PvuII fragment detected by both
Clone 20 and SIB172U would seem to indicate that these or sequences very similar to
these clones are physically close.
It should also be noted that there is some variation of the size of these
additional bands with Pstl and this may be related to the proposed polymorphic PstI
site as no such variation is observed with PvuII.
The 5’ end of clone 20 shares identical overlapping sequence with clone 23
which contains a number of tandem repeats at its 5’ end, whereas the SIBI72U
‘unique’ sequence is located 5’ to one of the regions of tandem repeat. This may
indicate that the copies of clone 20-like sequence are associated with the 3’ ends of
both tandem repeat regions and that SIB 172 like sequences are associated with the 5’
180
ends. Also the close proximity of clone 20-like and SIB 172-like sequences indicated
by the l.Skb PvuII fragment suggests that the MUC3 duplicated sequences are
tandemly arrayed. If these are two tandemly arrayed genes, the two genes must be
extremely close, no more than 0.5 to l.Okb apart. It is thus perhaps more probable
that there is a single gene with tandemly arrayed internal duplications. There is
precedent for this in the case of MUC5AC which appears to show two or more major
regions of tandem repeat and multiple copies of certain cysteine rich regions
(Guyonnet-Duperat, Audie et al. 1995).
It is interesting to note that clone 20 probably corresponds to the 3’ end of a
MUC3 gene due to the presence of a stop codon and a long untranslated region. Also
more recently a polyadenylation signal has been identified in sequence from the
genomic clone GM3 which contains identical sequence corresponding to the whole of
the clone 20 cDNA (Jim Gum personal communication). Indeed when GM3 was
tested with primers designed from SIB172U sequence no amplification was detected
(Fig. 4. 25). This indicates that clone 20 and GM3 correspond to the 3’ end of the
entire MUC3 genetic region.
A speculative model of MUC3 based on this and other data presented in this
thesis is shown in (Fig. 4. 29). The whole MUC3 genetic region is contained within a
200kb Swa I fragment. It is proposed that the region between the tandem repeats
contains sequences similar to those in clone 23, clone 20 and SIB 172. A PvuII and a
Hindlll restriction site are located upstream of the SIB 172 sequence and were
identified by vectorette sequencing described earlier. The structure of the 3' end is
based on that described earlier with the two PstI and PvuII sites present in the
sequence shown in their approximate locations. All the other restriction sites shown
in the diagram are hypothetical and their relative positions are not based on actual
physical distances. The most 3' Hindlll site has been placed outside of the known
sequence as clone 2 0 only detects the same two fragments of 2 0 +kb and 12+kb
detected with SIB 124. The polymorphic PstI site has been placed between the two
regions of tandem repeats although it may be present in the flanking DNA.
181

Figure 4. 29
Diagrammatic representation of the speculative model of MUC3.
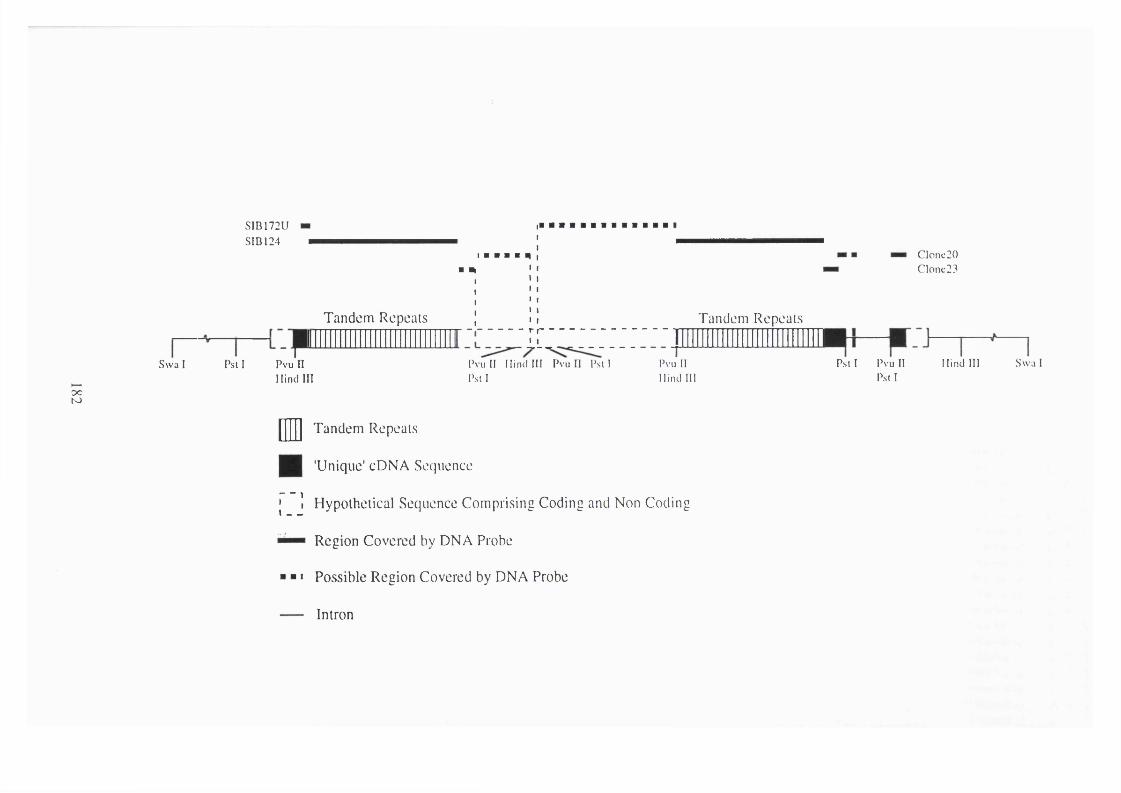
ocK)
SIB 172U
SIB 124
Sw a I Psi I
1 ■ ■ ■ ■ ^■ m
1 ' 1 ' 1 '
Tandem Repeals | i 1 Tandem Repeals1. . . .............................I L ........................................................... ... T ..................................................]
C lon c20 C lon e23
Pvu n Ilind III
Pvu II Ilind III Pvu n P s l l Pvu IIP stI ilind 111
r'II __
■ ■ I
Tandem Repeals
'Unique' cDNA Sequence
Hypolheiical Sequence Comprising Coding and Non Coding
Region Covered by DNA Probe
Possible Region Covered by DNA Probe
In iron
Pst I Pvu II Pst I
Ilind 111 Sw a I
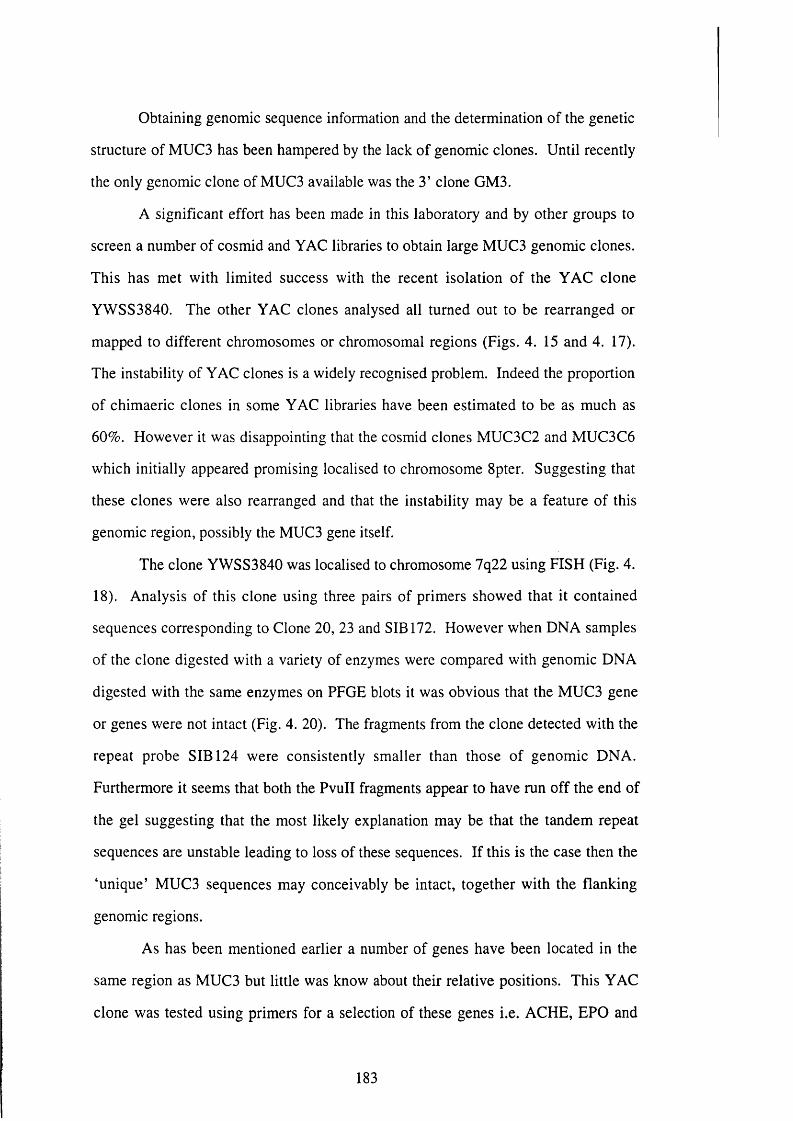
Obtaining genomic sequence information and the determination of the genetic
structure of MUC3 has been hampered by the lack of genomic clones. Until recently
the only genomic clone of MUC3 available was the 3’ clone GM3.
A significant effort has been made in this laboratory and by other groups to
screen a number of cosmid and Y AC libraries to obtain large MUC3 genomic clones.
This has met with limited success with the recent isolation of the Y AC clone
YWSS3840. The other Y AC clones analysed all turned out to be rearranged or
mapped to different chromosomes or chromosomal regions (Figs. 4. 15 and 4. 17).
The instability of Y AC clones is a widely recognised problem. Indeed the proportion
of chimaeric clones in some Y AC libraries have been estimated to be as much as
60%. However it was disappointing that the cosmid clones MUC3C2 and MUC3C6
which initially appeared promising localised to chromosome 8 pter. Suggesting that
these clones were also rearranged and that the instability may be a feature of this
genomic region, possibly the MUC3 gene itself.
The clone YWSS3840 was localised to chromosome 7q22 using FISH (Fig. 4.
18). Analysis of this clone using three pairs of primers showed that it contained
sequences corresponding to Clone 20, 23 and SIB 172. However when DNA samples
of the clone digested with a variety of enzymes were compared with genomic DNA
digested with the same enzymes on PFGE blots it was obvious that the MUC3 gene
or genes were not intact (Fig. 4. 20). The fragments from the clone detected with the
repeat probe SIB 124 were consistently smaller than those of genomic DNA.
Furthermore it seems that both the PvuII fragments appear to have run off the end of
the gel suggesting that the most likely explanation may be that the tandem repeat
sequences are unstable leading to loss of these sequences. If this is the case then the
‘unique’ MUC3 sequences may conceivably be intact, together with the flanking
genomic regions.
As has been mentioned earlier a number of genes have been located in the
same region as MUC3 but little was know about their relative positions. This Y AC
clone was tested using primers for a selection of these genes i.e. ACHE, EPO and
183
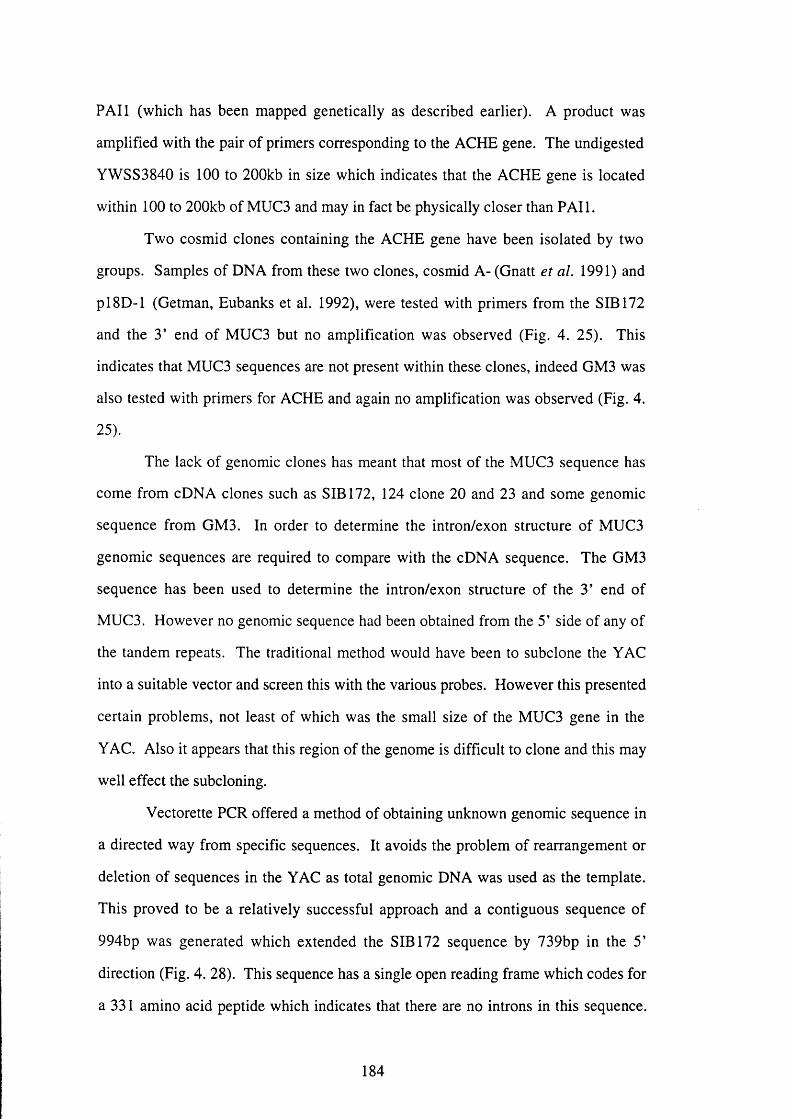
PAIl (which has been mapped genetically as described earlier). A product was
amplified with the pair of primers corresponding to the ACHE gene. The undigested
YWSS3840 is 100 to 200kb in size which indicates that the ACHE gene is located
within 100 to 200kb of MUC3 and may in fact be physically closer than PAIl.
Two cosmid clones containing the ACHE gene have been isolated by two
groups. Samples of DNA from these two clones, cosmid A- (Gnatt et al. 1991) and
p l 8 D -l (Getman, Eubanks et al. 1992), were tested with primers from the SIB 172
and the 3’ end of MUC3 but no amplification was observed (Fig. 4. 25). This
indicates that MUC3 sequences are not present within these clones, indeed GM3 was
also tested with primers for ACHE and again no amplification was observed (Fig. 4.
25).
The lack of genomic clones has meant that most of the MUC3 sequence has
come from cDNA clones such as SIB 172, 124 clone 20 and 23 and some genomic
sequence from GM3. In order to determine the intron/exon structure of MUC3
genomic sequences are required to compare with the cDNA sequence. The GM3
sequence has been used to determine the intron/exon structure of the 3’ end of
MUC3. However no genomic sequence had been obtained from the 5’ side of any of
the tandem repeats. The traditional method would have been to subclone the Y AC
into a suitable vector and screen this with the various probes. However this presented
certain problems, not least of which was the small size of the MUC3 gene in the
YAC. Also it appears that this region of the genome is difficult to clone and this may
well effect the subcloning.
Vectorette PCR offered a method of obtaining unknown genomic sequence in
a directed way from specific sequences. It avoids the problem of rearrangement or
deletion of sequences in the Y AC as total genomic DNA was used as the template.
This proved to be a relatively successful approach and a contiguous sequence of
994bp was generated which extended the SIB 172 sequence by 739bp in the 5 ’
direction (Fig. 4. 28). This sequence has a single open reading frame which codes for
a 331 amino acid peptide which indicates that there are no introns in this sequence.
184
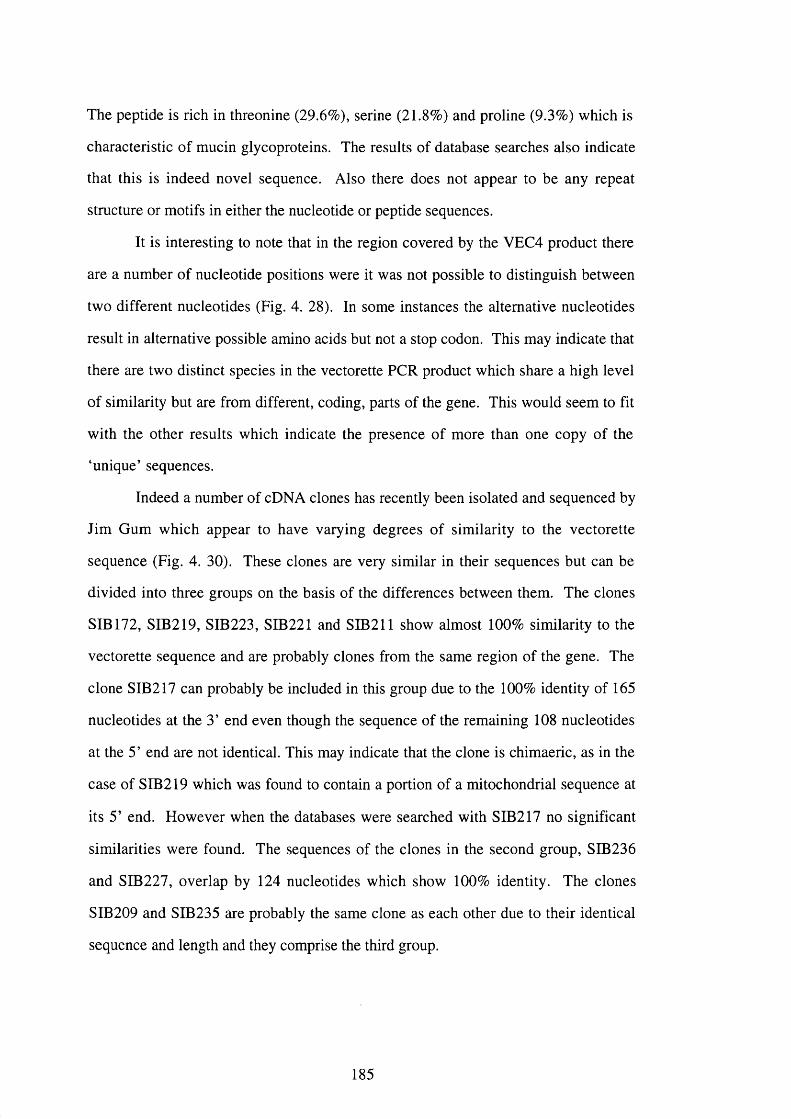
The peptide is rich in threonine (29.6%), serine (21.8%) and proline (9.3%) which is
characteristic of mucin glycoproteins. The results of database searches also indicate
that this is indeed novel sequence. Also there does not appear to be any repeat
structure or motifs in either the nucleotide or peptide sequences.
It is interesting to note that in the region covered by the VEC4 product there
are a number of nucleotide positions were it was not possible to distinguish between
two different nucleotides (Fig. 4. 28). In some instances the alternative nucleotides
result in alternative possible amino acids but not a stop codon. This may indicate that
there are two distinct species in the vectorette PCR product which share a high level
of similarity but are from different, coding, parts of the gene. This would seem to fit
with the other results which indicate the presence of more than one copy of the
‘unique’ sequences.
Indeed a number of cDNA clones has recently been isolated and sequenced by
Jim Gum which appear to have varying degrees of similarity to the vectorette
sequence (Fig. 4. 30). These clones are very similar in their sequences but can be
divided into three groups on the basis of the differences between them. The clones
SIB 172, SIB219, SIB223, SIB221 and SIB211 show almost 100% similarity to the
vectorette sequence and are probably clones from the same region of the gene. The
clone SIB217 can probably be included in this group due to the 100% identity of 165
nucleotides at the 3’ end even though the sequence of the remaining 108 nucleotides
at the 5’ end are not identical. This may indicate that the clone is chimaeric, as in the
case of SIB219 which was found to contain a portion of a mitochondrial sequence at
its 5’ end. However when the databases were searched with SIB217 no significant
similarities were found. The sequences of the clones in the second group, SIB236
and SIB227, overlap by 124 nucleotides which show 100% identity. The clones
SIB209 and SIB235 are probably the same clone as each other due to their identical
sequence and length and they comprise the third group.
185

Figure 4. 30.
Sequence alignments of the sequences SIB 172, SIB219, SIB223, SIB221, SIB217,
SIB236, SIB227, SIB209, SIB235 and the VEC.COMP sequence which is comprised
of the V ECl,3 and 4 sequences.

VEC.COMP > ACTTCACTTCTTCAACCAGTCTACTCCACAGCCAGCACACTACACCACTGCCATCACTTC 60 CONSENSUS > ACTTCACTTCTTCAACCAGTCTACTCCACAGCCAGCACACTACACCACTGCCATCACTTC 60
VEC.COMP > AGTTCCCACTACCTTGGGTACCATGGTGACTTCTACATCCATGATCCCATCTAGTCTCAG 120 CONSENSUS > AGTTCCCACTACCTTGGGTACCATGGTGACTTCTACATCCATGATCCCATCTAGTCTCAG 120
VEC.COMP > TACAGATATCCCTACCTCACAACCAACAACCATCACTCCCTCATCTGTGGGCATCACTGG 180 CONSENSUS > TACAGATATCCCTACCTCACAACCAACAACCATCACTCCCTCATCTGTGGGCATCACTGG 180
VEC.COMP > TTCATTACCTATGATGACAGACCTCACCTCAGTGTACACAGTCTCCAGCATGTCTGCAAG 240 CONSENSUS > TTCATTACCTATGATGACAGACCTCACCTCAGTGTACACAGTCTCCAGCATGTCTGCAAG 24 0
VEC.COMP > GCCAACAAGTGTCATTCCTTCATCTCCCACTGTCCAGAATACAGAAACCTCAATCTTTGT 300 CONSENSUS > GCCAACAAGTGTCATTCCTTCATCTCCCACTGTCCAGAATACAGAAACCTCAATCTTTGT 300
186
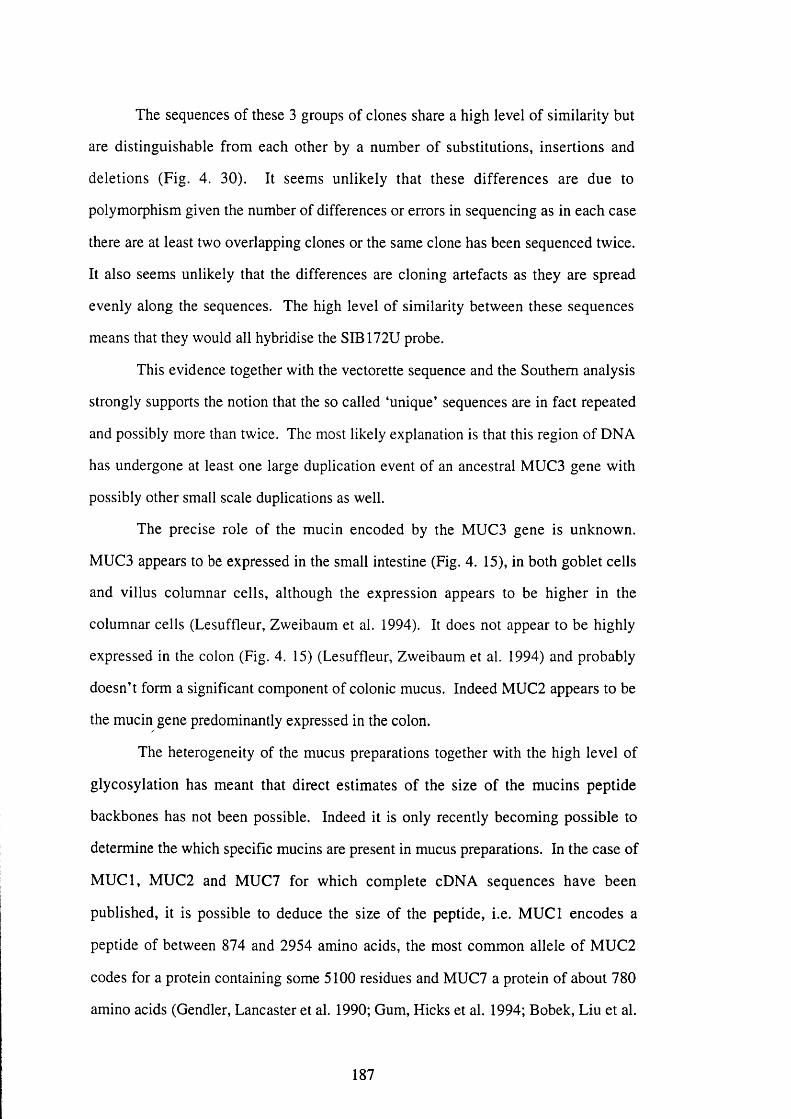
The sequences of these 3 groups of clones share a high level of similarity but
are distinguishable from each other by a number of substitutions, insertions and
deletions (Fig. 4. 30). It seems unlikely that these differences are due to
polymorphism given the number of differences or errors in sequencing as in each case
there are at least two overlapping clones or the same clone has been sequenced twice.
It also seems unlikely that the differences are cloning artefacts as they are spread
evenly along the sequences. The high level of similarity between these sequences
means that they would all hybridise the SIB172U probe.
This evidence together with the vectorette sequence and the Southern analysis
strongly supports the notion that the so called ‘unique’ sequences are in fact repeated
and possibly more than twice. The most likely explanation is that this region of DNA
has undergone at least one large duplication event of an ancestral MUC3 gene with
possibly other small scale duplications as well.
The precise role of the mucin encoded by the MUC3 gene is unknown.
MUC3 appears to be expressed in the small intestine (Fig. 4. 15), in both goblet cells
and villus columnar cells, although the expression appears to be higher in the
columnar cells (Lesuffleur, Zweibaum et al. 1994). It does not appear to be highly
expressed in the colon (Fig. 4. 15) (Lesuffleur, Zweibaum et al. 1994) and probably
doesn’t form a significant component of colonic mucus. Indeed MUC2 appears to be
the mucin gene predominantly expressed in the colon.
The heterogeneity of the mucus preparations together with the high level of
glycosylation has meant that direct estimates of the size of the mucins peptide
backbones has not been possible. Indeed it is only recently becoming possible to
determine the which specific mucins are present in mucus preparations. In the case of
M U C l, MUC2 and MUC7 for which complete cDNA sequences have been
published, it is possible to deduce the size of the peptide, i.e. M UCl encodes a
peptide of between 874 and 2954 amino acids, the most common allele of MUC2
codes for a protein containing some 5100 residues and MUC7 a protein of about 780
amino acids (Gendler, Lancaster et al. 1990; Gum, Hicks et al. 1994; Bobek, Liu et al.
187
1996). However only partial cDNA clones have been isolated for the other mucin
genes including MUC3. Accurate estimates of the size of the MUC3 mRNA has
proved difficult to obtain due to the ‘polydisperse’ transcripts detected on Northern
blots. These smeared signals appear to be a common feature of mucin genes although
the cause is unknown and may merely be due to degradation, however mechanisms
such as alternative splicing can not be ruled out.
A major transcript of approximately 13kb has been detected with MUC3 on
Northern blots of RNA from the cell line HT29 (Lesuffleur et al. 1993), which would
correspond to a protein of about 4330 residues (approximate Mr of 400 000 to 500
000). It is interesting to note that if the VNTR regions were transcribed in their
entirety the difference in size between the various alleles are larger than the 13kb
transcript detected in HT29 cells. Thus it seems likely that the tandem repeats are
interrupted by an intron or introns.
A possible model for this is the FIM-B.l and FIM-C.l mucins which have
repetitive elements encoded by separate exons (Hoffmann and Hauser 1993).
Although in the case of MUC3 it seems more likely that the repeats are in clusters
separated by introns. This model raises the possibility of a higher order of repeats in
which the repeat unit is comprised of an exon containing a number of tandem repeats
together with an intron. Thus not only would it be possible for there to be variation in
the number of 51 bp repeats in the exon but also variation in the number of exon-
intron repeats.
188
5. General Discussion
As described in section 1.3 of the Introduction of this thesis the biochemical
analysis of mucins has proved difficult due to their large size and enormous
heterogeneity. The isolation of cDNA clones corresponding to different mucin genes
led to a certain amount of optimism that DNA cloning would increase the rate of
progress in the understanding of these glycoproteins. To a certain extent this has
happened. So far at least seven human mucin genes have been cloned and expression
studies show that the mucus gel secreted by many tissues are comprised of more than
one mucin such as in the small intestine where both MUC2 and MUC3 appear to be
expressed (Lesuffleur, Zweibaum et al. 1994). This together with the high level of
genetic polymorphism found in many of the mucin genes and their glycosylation
presumably accounts for a significant proportion of the heterogeneity of mucus gels.
Also the determination of partial cDNA sequences for these genes and complete
sequences in the case of MUCl, MUC2 and MUC7 has enabled the sequence of the
peptide backbones to be deduced. This has led to the production of highly specific
monoclonal antibodies using synthetic peptides as antigens, as in the case of MUC2
and MUC5AC (Durrant et al. 1994; Hovenberg et al. 1996), which can be used for
identifying the components of the mucus itself.
It seemed that the isolation of cDNA clones would rapidly lead to the isolation
of genomic clones and thus provide tools for the analysis of the genomic structure of
the mucin genes. However the analysis of the genomic structure of these genes has
by no means been straightforward. The isolation of large scale clones such as
cosmids and YACs has been especially troublesome. Indeed it is worth noting that
there are still no cosmid or Y AC contigs covering the chromosomal regions which
contain MUC3 and the cluster on l lp l5 . Specifically in the case of MUC3 Y AC
libraries were extensively screened and although a few clones were isolated these
were shown to be unstable including the clone containing genuine MUC3 sequences.
It may be that that a greater effort could have been made in obtaining cosmid clones
189

but the nature of the construction of the libraries using the Sau3A partial digestion
and the presence of Sau3 A sites in each of the tandem repeats of MUC3 did not bode
well. Also the very nature of the mucin genes and in particular the tandem repeat
regions may be responsible for instability of these sequences when cloned. Indeed
the instability of repetitive sequences in clones even when recombination suppressed
cell lines are used has been widely recognised. Unfortunately at the time this work
was carried out libraries constructed using other vectors such as PI and BACs were
not available which may have proved to be more suitable.
This meant that techniques such as linkage and PFGE have proved extremely
useful in the analysis of the chromosomal regions 7q22 and 1 Ip 15. The analysis of
the genes themselves has required the use of both traditional techniques such as
Southern blot analysis and newer techniques like vectorette PCR. It seems likely that
the elucidation of the structure of the mucin genes will require the use of a wide range
of techniques as demonstrated in this thesis.
So far mucin genes have been localised to chromosomes 1 ,3 , 4, 7 and 11.
The determination of the genomic structure of these genes and their physical
relationships to one another will be useful for investigating the evolutionary basis of
the mucin genes and whether there is any functional significance in their position and
structure.
The mucin gene family on chromosome l lp l5 are particularly interesting in
this respect now that the order of the genes and the orientation of the cluster has been
determined using physical and genetic mapping techniques. It has been speculated
that the order of the genes may be related to the pattern of expression (Pigny,
Guyonnet-Duperat et al. 1996). It was noted that there seems to be a correspondence
between the order of the genes and the preferential expression of particular genes in
specific tissues i.e. the genes towards the centromere are preferentially expressed in
the epithelia of anterior tissues such as bronchus, while the more telomeric genes
showed preferential expression in the epithelia of posterior tissues such as colon.
190
Also the similarities between the ‘unique’ sequences of these genes indicate that they
arose from a common ancestor.
It might therefore be tempting to think that the all the mucin genes on the
different chromosomes arose from a single ancestral gene. However, although the
mucin genes share some characteristics such as the tandem repeats there are
significant differences. MUCl for instance is widely expressed in a large number of
tissues and has a transmembrane region which has not been found in any other
mucins(Gendler, Lancaster et al. 1990). There does not appear to be a very high level
of similarity between the unique sequences of mucins on different chromosomes. For
example the cystine knot like sequence found in the deduced carboxyl terminal
peptide sequence of MUC2 and MUC5AC (Meitinger, Meindl et al. 1993; Lesuffleur,
Roche et al. 1995) is not present in M UCl, MUC3 or MUC7. Also the cysteine
residues present in the MUC2 peptide which are able to form disulphide bridges
implicated in gel formation (Gum et al. 1992) are not present in MUCl or MUC7. It
is not known whether they are present in the ‘unique’ sequences of MUC4 and MUC3
which have not yet been cloned. MUC4 expression like MUC3 is not limited to the
goblet cells in the tissues in which it is expressed, unlike MUC2 for instance
(Lesuffleur, Zweibaum et al. 1994). It is curious to note that a signal was detected at
the tip of the q arm of chromosome 3 when using the ‘unique’ MUC3 clone 23 in in
situ hybridisation experiments at lower than normal stringency (M. Fox
unpublished). It is tempting to speculate that there may be an evolutionary and or
functional relationship between MUC3 and MUC4.
It would seem that although the mucin peptides share some characteristics
such as tandem repeats rich in threonine and serine it may be that this is coincidental
and that this apparent similarity arose from ‘convergent’ evolution. Indeed the
differences in expression and the inability of some mucins to form gels indicates that
the different mucins fulfil different functions but all require a high level of
glycosylation. It may be that the mucin gene family seem today arose by both
‘divergent’ evolution, such as the cluster on chromosome l lp l5 , and by ‘convergent
191

evolution’ accounting for the genes on other chromosomes. Thus the determination
of the gene structure as well as the sequence of these gene will be invaluable in
unravelling the complex evolutionary relationships of the mucin gene family.
192
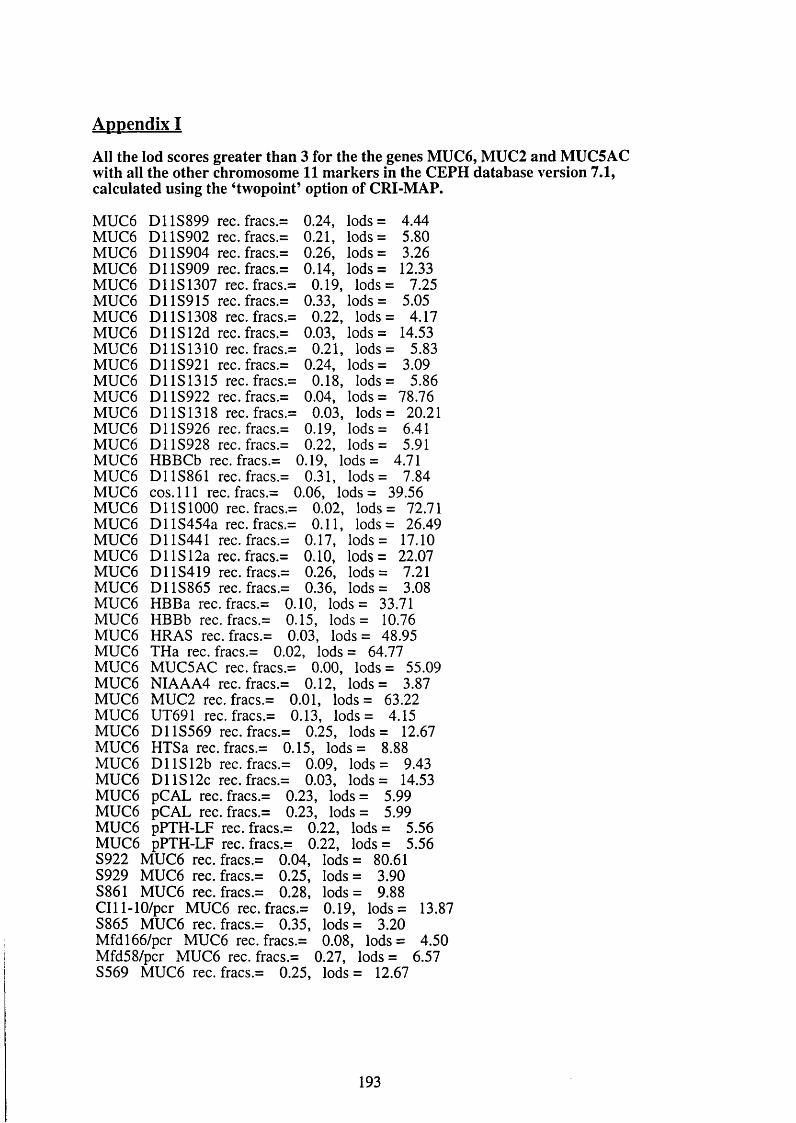
Appendix I
All the lod scores greater than 3 for the the genes MUC6, MUC2 and MUC5AC with all the other chromosome 11 markers in the CEPH database version 7.1, calculated using the ‘twopoint’ option of CRI-MAP.
MUC6MUC6MUC6MUC6MUC6MUC6MUC6MUC6MUC6MUC6MUC6MUC6MUC6MUC6MUC6MUC6MUC6MUC6MUC6MUC6MUC6MUC6MUC6MUC6MUC6MUC6MUC6MUC6MUC6MUC6MUC6MUC6MUC6MUC6MUC6MUC6MUC6MUC6MUC6MUC6S922
D11S899D11S902D11S904D11S909
rec. fracs.= rec. fracs.= rec. fracs.= rec. fracs.=
0.24, lods =0 .2 1 , lods =0.26, lods =0.14, lods =
0.19, lods = lods =
lods = lods =
lods = lods =
lods = lods =
lods = 20 .21 lods = 6.41
0.33,0 .2 2 ,
0.03,0 .2 1 ,
0.24,0.18,
0.04,0.03,
0.19,
4.445.803.2612.33
7.255.05
4.1714.53
5.833.09
5.8678.76
0.22, lods= 5.91
D11S1307 rec. fracs.=D11S915 rec. fracs.=D11S1308 rec. fracs.=D llS 12d rec. fracs.=D11S1310 rec. fracs.=D11S921 rec. fracs.=D11S1315 rec. fracs.=D11S922 rec. fracs.=D11S1318 rec. fracs.=D11S926 rec. fracs.=D11S928 rec. frac s. =HBBCb rec. frac s.= 0.19, lods = 4.71 D11S861 rec. fracs.= 0.31, lods = 7.84 c o s .l l l rec. fracs.= 0.06, lods = 39.56 D1 IS 1000 rec. fracs.= 0.02, lods = 72.71 D1 lS454a rec. fracs.= 0.11, lods = 26.49 D11S441 rec. fracs.= 0.17, lods = 17.10 D1 lS12a rec. fracs.= 0.10, lods = 22.07 D11S419 rec. fracs.= 0.26, lods = 7.21 D11S865 rec. fracs.= 0.36, lods = 3.08 HBBa rec. fracs.= 0.10, lods = 33.71 HBBb rec. fracs. = 0.15, lods = 10.76 HRAS rec. fracs.= 0.03, lods = 48.95 THa rec. fracs.= 0.02, lods = 64.77 MUC5AC rec. fracs.= 0.00, lods = 55.09 NIAAA4 rec. fracs.= 0.12, lods = 3.87 MUC2 rec. fracs.= 0.01, lods = 63.22 UT691 rec. fracs.= 0.13, lods = 4.15 D11S569 rec. fracs.= 0.25, lods = 12.67 HTSa rec. fracs.= 0.15, lods = 8.88 D llS12b rec. fracs.= 0.09, lods = 9.43 D llS12c rec. fracs.= 0.03, lods = 14.53 pCAL rec. fracs.= 0.23, lods = 5.99 pCAL rec. fracs.= 0.23, lods = 5.99 pPTH-LF rec. fracs.= 0.22, lods = 5.56 pPTH-LF rec. fracs.= 0.22, lods = 5.56
MUC6 rec. fracs.= 0.04, lods = 80.61S929 MUC6 rec. fracs.= 0.25, lods = 3.90S861 MUC6 rec. fracs.= 0.28, lods = 9.88C lll-lO /pcr MUC6 rec. fracs.= 0.19, lods = 13.87S865 MUC6 rec. fracs.= 0.35, lods = 3.20M fdl6 6 /pcr MUC6 rec. fracs.= 0.08, lods = 4.50 Mfd58/pcr MUC6 rec. fracs.= 0.27, lods = 6.57 S569 MUC6 rec. fracs.= 0.25, lods = 12.67
193
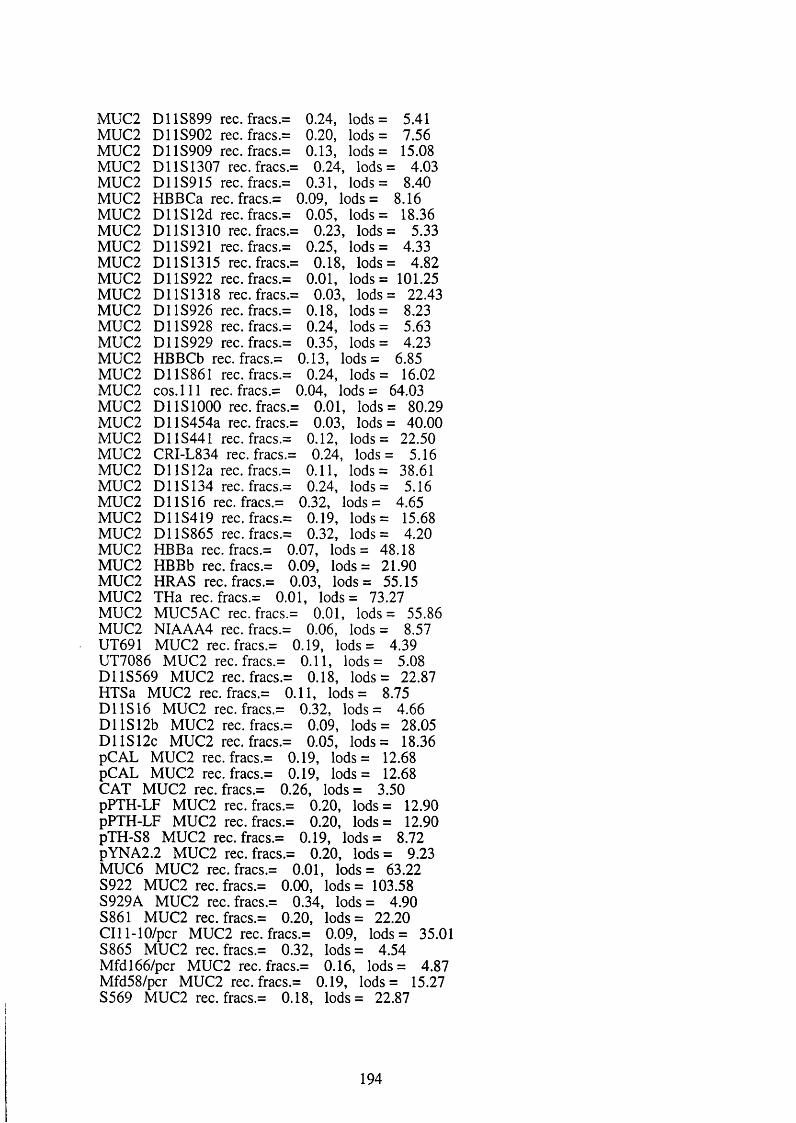
MUC2 D11S899 rec. fracs.= 0.24, lods = 5.41 MUC2 D11S902 rec. fracs.= 0.20, lods = 7.56 MUC2 D11S909 rec. fracs.= 0.13, lods = 15.08 MUC2 D11S1307 rec. fracs.= 0.24, lods= 4.03MUC2 D11S915 rec. fracs.= 0.31, lods = 8.40 MUC2 HBBCa rec. fracs.= 0.09, lods = 8.16 MUC2 D llS12d rec. fracs.= 0.05, lods = 18.36MUC2 D11S1310 rec. fracs.= 0.23, lods = 5.33MUC2 D11S921 rec. fracs.= 0.25, lods = 4.33 MUC2 D11S1315 rec. fracs.= 0.18, lods= 4.82MUC2 D11S922 rec.fracs.= 0.01, lods = 101.25MUC2 D11S1318 rec. fracs.= 0.03, lods = 22.43MUC2 D11S926 rec. fracs.= 0.18, lods = 8.23MUC2 D11S928 rec. fracs.= 0.24, lods = 5.63MUC2 D11S929 rec. fracs.= 0.35, lods = 4.23MUC2 HBBCb rec. fracs.= 0.13, lods = 6.85 MUC2 D11S861 rec. fracs.= 0.24, lods = 16.02MUC2 c o s .l l l rec. fracs.= 0.04, lods = 64.03MUC2 DllSlOOO rec.fracs.= 0.01, lods= 80.29MUC2 D llS454a rec. fracs.= 0.03, lods = 40.00MUC2 D11S441 rec. fracs.= 0.12, lods = 22.50 MUC2 CRI-L834 rec. fracs.= 0.24, lods = 5.16 MUC2 D1 lS12a rec. fracs.= 0.11, lods = 38.61MUC2 D11S134 rec. frac s. = 0.24, lods = 5.16MUC2 D11S16 rec. fracs.= 0.32, lods = 4.65 MUC2 D11S419 rec. fracs.= 0.19, lods = 15.68 MUC2 D11S865 rec. fracs.= 0.32, lods = 4.20 MUC2 HBBa rec. fracs.= 0.07, lods = 48.18 MUC2 HBBb rec. fracs.= 0.09, lods = 21.90MUC2 HRAS rec. fracs.= 0.03, lods = 55.15MUC2 THa rec. fracs.= 0.01, lods = 73.27 MUC2 MUC5AC rec. fracs. = 0.01, lods = 55.86 MUC2 NIAAA4 rec. fracs.= 0.06, lods = 8.57 UT691 MUC2 rec. fracs.= 0.19, lods = 4.39UT7086 MUC2 rec. fracs.= 0.11, lods = 5.08 D11S569 MUC2 rec. fracs.= 0.18, lods = 22.87 HTSa MUC2 rec. fracs.= 0.11, lods = 8.75 D11S16 MUC2 rec. fracs.= 0.32, lods = 4.66 D U S 12b MUC2 rec. fracs.= 0.09, lods = 28.05 D11S12C MUC2 rec. fracs.= 0.05, lods = 18.36 pCAL MUC2 rec. fracs.= 0.19, lods = 12.68pCAL MUC2 rec. fracs. = 0.19, lods = 12.68CAT MUC2 rec. fracs.= 0.26, lods = 3.50 pPTH-LF MUC2 rec. fracs.= 0.20, lods = 12.90 pPTH-LF MUC2 rec. fracs.= 0.20, lods = 12.90 pTH-S8 MUC2 rec. fracs.= 0.19, lods = 8.72 pYNA2.2 MUC2 rec. fracs.= 0.20, lods = 9.23 MUC6 MUC2 rec. fracs.= 0.01, lods = 63.22S922 MUC2 rec. fracs.= 0.00, lods = 103.58 S929A MUC2 rec. fracs.= 0.34, lods = 4.90S861 MUC2 rec. fracs.= 0.20, lods = 22.20 CIl 1-10/pcr MUC2 rec. fracs.= 0.09, lods = 35.01 S865 MUC2 rec. fracs.= 0.32, lods = 4.54 M fdl6 6 /pcr MUC2 rec. fracs. = 0.16, lods = 4.87 Mfd58/pcr MUC2 rec. fracs.= 0.19, lods = 15.27 S569 MUC2 rec. fracs.= 0.18, lods = 22.87
194

MUC5ACMUC5ACMUC5ACMUC5ACMUC5ACMUC5ACMUC5ACMUC5ACMUC5ACMUC5ACMUC5ACMUC5ACMUC5ACMUC5ACMUC5ACMUC5ACMUC5ACMUC5ACMUC5ACMUC5ACMUC5ACMUC5ACMUC5ACMUC5ACMUC5ACMUC5ACMUC5ACMUC5ACMUC5ACMUC5ACMUC5ACMUC5ACMUC5ACMUC5ACMUC5ACMUC5ACMUC5ACMUC5ACMUC5ACMUC5ACMUC5ACMUC5ACMUC5AC
D11S899 rec. fracs.= D11S902 rec. fracs.= D11S1324 rec. fracs.= D11S904 rec. fracs.= D11S909 rec. fracs.= D U S 1307 rec. fracs.= D11S915 rec. fracs.= D11S1308 rec. fracs.= D l lS 12d rec. fracs.= D11S1310 rec. fracs.= D11S921 rec. fracs.= D U S 1315 rec. fracs.= D11S922 rec. fracs.= D1 IS 1318 rec. fracs.= D11S926 rec. fracs.= D11S928 rec. fracs.= D11S929 rec. fracs.= HBBCb rec. fracs.= D11S861 rec. fracs.= c o s .l l l rec. fracs.= DllSlOOO rec. fracs. = D llS454a rec. fracs.= D11S455 rec. fracs.= D11S441 rec. frac s. = D llS 12a rec. fracs.= D11S16 rec. fracs.= D11S419 rec. fracs.= HBBa rec. fracs.= HBBb rec. fracs.=
0.19,0.18,
0.28,0.25,0.15,
0.18,0.29,
0.19,0.06,
0 .2 1 ,0.23,
0.17,0 .0 1 ,
0.04,0 .2 0 ,0.19,0.34,
0.18, lods = 0.26, lods =
0.04, lods =
lods = lods =
lods = lods = lods =
lods = lods =
lods = lods =
lods = lods =
lods = lods =
lods = lods = lods = lods =
6.15 7.40
3.194.16 9.92
6.097.28
4.415.81
4.963.72
5.4783.46
18.156.437.523.94
3.259.48
37.920 .0 0 , lods = 0.07, lods =
0 .2 1 , lods = 0.19, lods = 0.15, lods =
0.29, lods = 0.23, lods =
0 .10 , lods = 0.18, lods =
65.51 22.32 3.79 10.71 9.85
3.97 7.99
29.52 6.75
HRAS rec. fracs.= 0.02, lods = 40.12THa rec. fracs.= 0.03, lods = 53.77 MUC2 rec. fracs.= 0.00, lods = 56.67 UT691 rec. fracs.= 0.13, lods = 6.43 UT7086 rec. fracs.= 0.10, lods = 4.24 D11S569 rec. frac s. = 0.22, lods = 13,69 HTSa rec. fracs.= 0.12, lods = 5.96D11S16 rec. fracs.= 0.29, lods = 3.92 D llS12b rec. fracs.= 0.13, lods = 5.36 D llS12c rec. fracs.= 0.06, lods = 5.81 pCAL rec. fracs.= 0.19, lods = 4.47pCAL rec. fracs.= 0.19, lods = 4.47pPTH-LF rec. fracs.= 0.19, lods = 3.95 pPTH-LF rec. fracs.= 0.19, lods = 3.95
MUC6 MUC5AC rec. fracs.= 0.00, lods = 55.39 S922 MUC5AC rec. fracs.= 0.00, lods = 84.95S929 MUC5AC rec. fracs.= 0.24, lods = 5.64S929A MUC5AC rec. fracs.= 0.33, lods = 4.12 S861 MUC5AC rec. fracs.= 0.25, lods = 11.02CIl 1-10/pcr MUC5AC rec. fracs.= 0.15, lods = 15.84 M fd l6 6 /pcr MUC5AC rec. fracs.= 0.12, lods = 6.60 Mfd58/pcr MUC5AC rec. fracs.= 0.23, lods = 7.62 S569 MUC5AC rec. fracs.= 0.22, lods = 13.69
195
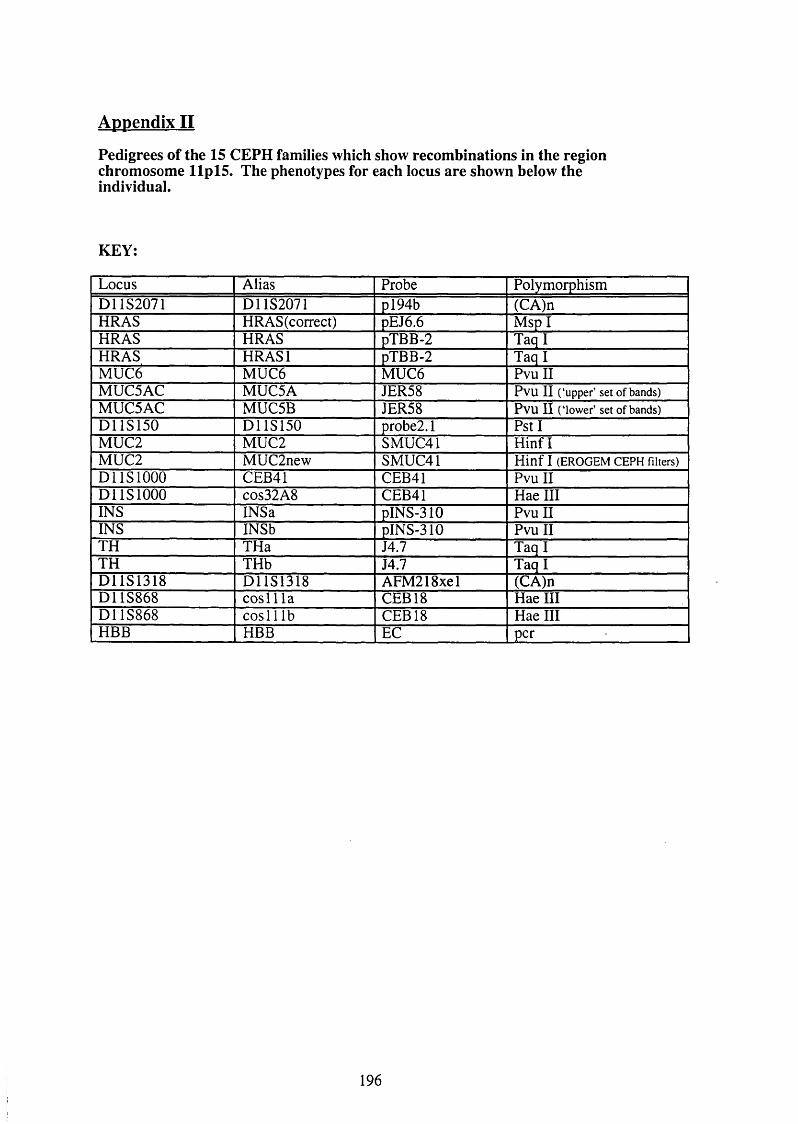
Appendix II
Pedigrees of the 15 CEPH families which show recombinations in the region chromosome llp lS . The phenotypes for each locus are shown below the individual.
KEY:
Locus Alias Probe PolymorphismD11S2071 D11S2071 j)194b (CA)nHRAS HRAS (correct) pEJ6.6 Msp IHRAS HRAS pTBB-2 Tap IHRAS HRASl pTBB-2 Tag IMUC6 MUC6 MUC6 Pvu IIMUC5AC MUC5A JER58 Pvu II (‘upper’ set of bands)MUC5AC MUC5B JER58 Pvu II (‘lower’ set of bands)D11S150 D11S150 probe2 .1 Pst IMUC2 MUC2 SMUC41 H inflMUC2 MUC2new SMUC41 Hinf I (ERO G EM CEPH filters)
DllSlOOO CEB41 CEB41 Pvu IIDllSlOOO COS32A8 CEB41 Hae IIIINS INSa pINS-310 Pvu IIINS INSb pINS-310 Pvu IITH THa J4.7 Tag ITH THb J4.7 Tag IDIIS1318 D1IS1318 AFM218xel (CA)nD11S868 c o s ll la CEB18 Hae IIID11S868 c o s ll lb CEB18 Hae IIIHBB HBB EC per
196
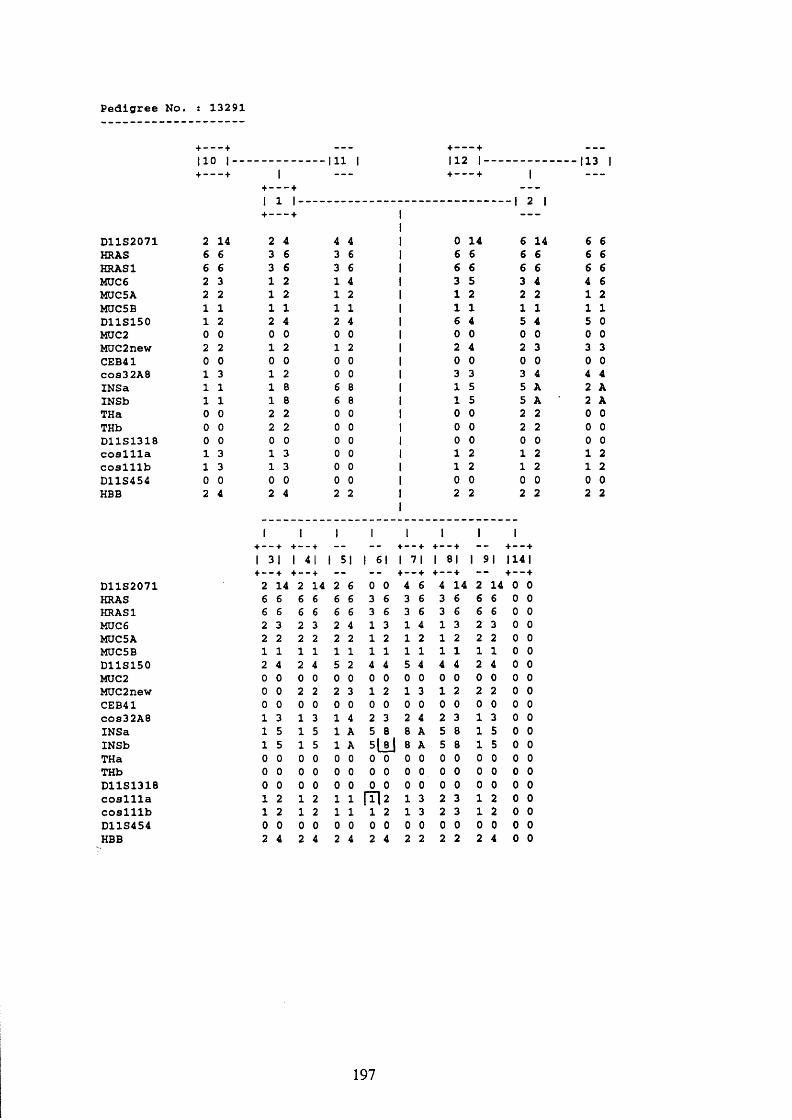
P e d i g r e e N o . : 1 3 2 9 1
+----- +110 1 - - - - 1 1 1+ — — — + 1
+ - — — +1 1 I - - + “■“*“ +
D 11S 2071 2 14 2 4 4 4HRAS 6 6 3 6 3 6HRASl 6 6 3 6 3 6MUC6 2 3 1 2 1 4MUC5A 2 2 1 2 1 2MUC5B 1 1 1 1 1 1D 11S 150 1 2 2 4 2 4MUC2 0 0 0 0 0 0MUC2new 2 2 1 2 1 2CEB41 0 0 0 0 0 0COS32A8 1 3 1 2 0 0IN Sa 1 1 1 8 6 8INSb 1 1 1 8 6 8THa 0 0 2 2 0 0THb 0 0 2 2 0 0D 11S 1318 0 0 0 0 0 0c o s l l l a 1 3 1 3 0 0c o s l l l b 1 3 1 3 0 0D 11S454 0 0 0 0 0 0HBB 2 4 2 4 2 2
+ — — — +
1 1 2 I-
I 2 I
+ “• - +
I 31+ - - + I 41 I 51 I 61
+ • • +I 7 !
+ — “ + I 81 91
I+ - - + 114 1
+ - - ■ + + - - - + - - - - + - - ■ + + -■- + + - - • +D 11S 2071 2 14 2 14 2 6 0 0 4 6 4 14 2 14 0 0HRAS 6 6 6 6 6 6 3 6 3 6 3 6 6 6 0 0HRASl 6 6 6 6 6 6 3 6 3 6 3 6 6 6 0 0MUC6 2 3 2 3 2 4 1 3 1 4 1 3 2 3 0 0MUC5A 2 2 2 2 2 2 1 2 1 2 1 2 2 2 0 0MUC5B 1 1 1 1 1 1 1 1 1 1 1 1 1 1 0 0D 11S 150 2 4 2 4 5 2 4 4 5 4 4 4 2 4 0 0MUC2 0 0 0 0 0 0 0 0 0 0 0 0 0 0 0 0MUC2new 0 0 2 2 2 3 1 2 1 3 1 2 2 2 0 0CEB41 0 0 0 0 0 0 0 0 0 0 0 0 0 0 0 0COS32A8 1 3 1 3 1 4 2 3 2 4 2 3 1 3 0 0IN Sa 1 5 1 5 1 A 5 8 8 A 5 8 1 5 0 0INSb 1 5 1 5 1 A 5|_8l 8 A 5 8 1 5 0 0THa 0 0 0 0 0 0 0 0 0 0 0 0 0 0 0 0THb 0 0 0 0 0 0 0 0 0 0 0 0 0 0 0 0D 11S 1318 0 0 0 0 0 0 0 0 0 0 0 0 0 0 0 0c o s l l l a 1 2 1 2 1 1 r ï i 2 1 3 2 3 1 2 0 0c o s l l l b 1 2 1 2 1 1 1 2 1 3 2 3 1 2 0 0D 11S454 0 0 0 0 0 0 0 0 0 0 0 0 0 0 0 0HBB 2 4 2 4 2 4 2 4 2 2 2 2 2 4 0 0
113
0 14 6 14 6 66 6 6 6 6 66 6 6 6 6 63 5 3 4 4 61 2 2 2 1 21 1 1 1 1 16 4 5 4 5 00 0 0 0 0 02 4 2 3 3 30 0 0 0 0 03 3 3 4 4 41 5 5 A 2 A1 5 5 A 2 A0 0 2 2 0 00 0 2 2 0 00 0 0 0 0 01 2 1 2 1 21 2 1 2 1 20 0 0 0 0 02 2 2 2 2 2
197
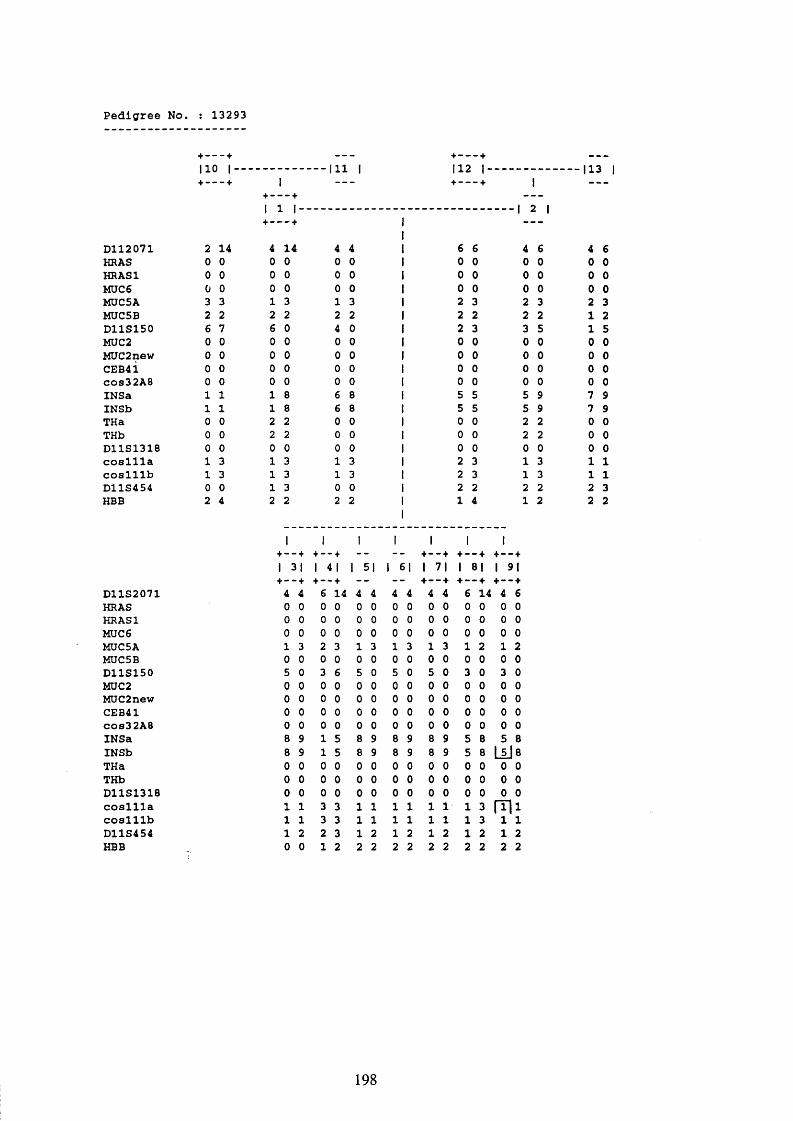
P e d i g r e e No. 1 3 2 9 3
110 I - - - - 1 1 11
1 1 I - -
D 112071 2 14 4 14 4 4HRAS 0 0 0 0 0 0HRASl 0 0 0 0 0 0MUC6 Ü 0 0 0 0 0MUC5A 3 3 1 3 1 3MUC5B 2 2 2 2 2 2D 11S150 6 7 6 0 4 0MUC2 0 0 0 0 0 014UC2new 0 0 0 0 0 0CEB4Î 0 0 0 0 0 0COS32A8 0 0 0 0 0 0IN Sa 1 1 1 8 6 8INSb 1 1 1 8 6 8THa 0 0 2 2 0 0THb 0 0 2 2 0 0D 11S1318 0 0 0 0 0 0c o s l l l a 1 3 1 3 1 3c o s l l l b 1 3 1 3 1 3D 11S454 0 0 1 3 0 0HBB 2 4 2 2 2 2
+ — — — +112 |.
+ — — — +
I 2 I
+ — “ + I 31
+ - • + I 41 51 61
+ - - + I 71
+ - - + I 81
+ - - + I 91
+ - -- + + - - • + - - - - + - - - + + - - - + + - - +D 11S 2071 4 4 6 14 4 4 4 4 4 4 6 14 4 6HRAS 0 0 0 0 0 0 0 0 0 0 0 0 0 0HRASl 0 0 0 0 0 0 0 0 0 0 0 0 0 0MUC6 0 0 0 0 0 0 0 0 0 0 0 0 0 0MUC5A 1 3 2 3 1 3 1 3 1 3 1 2 1 2MUC5B 0 0 0 0 0 0 0 0 0 0 0 0 0 0D 11S150 5 0 3 6 5 0 5 0 5 0 3 0 3 0MUC2 0 0 0 0 0 0 0 0 0 0 0 0 0 0MUC2new 0 0 0 0 0 0 0 0 0 0 0 0 0 0CEB41 0 0 0 0 0 0 0 0 0 0 0 0 0 0COS32A8 0 0 0 0 0 0 0 0 0 0 0 0 0 0IN Sa 8 9 1 5 8 9 8 9 8 9 5 8 5 8INSb 8 9 1 5 8 9 8 9 8 9 5 8 Li J bTHa 0 0 0 0 0 0 0 0 0 0 0 0 0 0THb 0 0 0 0 0 0 0 0 0 0 0 0 0 0D 11S 1318 0 0 0 0 0 0 0 0 0 0 0 0 0 0c o s l l l a 1 1 3 3 1 1 1 1 1 1 1 3 m ic o s l l l b 1 1 3 3 1 1 1 1 1 1 1 3 1 1D 11S454 1 2 2 3 1 2 1 2 1 2 1 2 1 2HBB 0 0 1 2 2 2 2 2 2 2 2 2 2 2
113
198
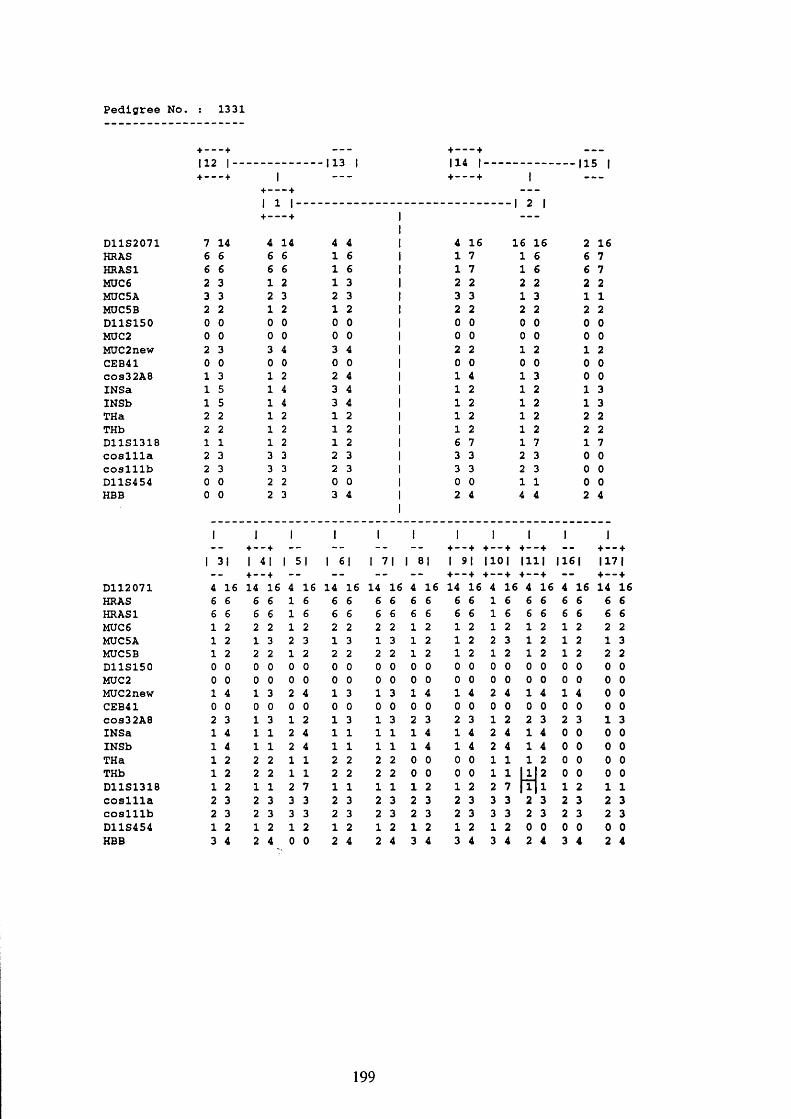
P e d i g r e e N o . : 1331
+ - - - +
1 12 I- 1 1 3+ — - — +
114 I- 115 I+ — — — + 1 - + - - - + 1 -
+ - - - + — — —1 1 1- 1 2 1+ - - - + 1 -----
D 11S2071 7 14 4 14 4 411 4 16 16 16 2 16
HRAS 6 6 6 6 1 6 1 1 7 1 6 6 7HRASl 6 6 6 6 1 6 1 1 7 1 6 6 7MUC6 2 3 1 2 1 3 1 2 2 2 2 2 2MUC5A 3 3 2 3 2 3 1 3 3 1 3 1 1MÜC5B 2 2 1 2 1 2 1 2 2 2 2 2 2D 11S150 0 0 0 0 0 0 1 0 0 0 0 0 0MÜC2 0 0 0 0 0 0 1 0 0 0 0 0 0MUC2new 2 3 3 4 3 4 1 2 2 1 2 1 2CEB41 0 0 0 0 0 0 1 0 0 0 0 0 0COS32A8 1 3 1 2 2 4 1 1 4 1 3 0 0IN Sa 1 5 1 4 3 4 1 1 2 1 2 1 3INSb 1 5 1 4 3 4 1 1 2 1 2 1 3THa 2 2 1 2 1 2 1 1 2 1 2 2 2THb 2 2 1 2 1 2 1 1 2 1 2 2 2D 11S1318 1 1 1 2 1 2 1 6 7 1 7 1 7c o s l l l a 2 3 3 3 2 3 1 3 3 2 3 0 0c o s l l l b 2 3 3 3 2 3 1 3 3 2 3 0 0D 11S454 0 0 2 2 0 0 1 0 0 1 1 0 0HBB 0 0 2 3 3 4 1
12 4 4 4 2 4
1 1+ — - +
1 1 1 1 1+ - - +
1+ - - +
1+---+
1 1+ - - +
1 31 1 41 1 5 1 1 6 | 1 71 81 1 91 110 1 n i l 1161 117 1— — + - “ + - - - + - - + + - - + + - — + - - + - - +
D 112071 4 16 14 16 4 16 14 16 14 16 4 16 14 16 4 16 4 16 4 16 14 16HRAS 6 6 6 6 1 6 6 6 6 6 6 6 6 6 1 6 6 6 6 6 6 6HRASl 6 6 6 6 1 6 6 6 6 6 6 6 6 6 1 6 6 6 6 6 6 6MUC6 1 2 2 2 1 2 2 2 2 2 1 2 1 2 1 2 1 2 1 2 2 2MUC5A 1 2 1 3 2 3 1 3 1 3 1 2 1 2 2 3 1 2 1 2 1 3MUC5B 1 2 2 2 1 2 2 2 2 2 1 2 1 2 1 2 1 2 1 2 2 2D 11S150 0 0 0 0 0 0 0 0 0 0 0 0 0 0 0 0 0 0 0 0 0 0MUC2 0 0 0 0 0 0 0 0 0 0 0 0 0 0 0 0 0 0 0 0 0 0MUC2new 1 4 1 3 2 4 1 3 1 3 1 4 1 4 2 4 1 4 1 4 0 0CEB41 0 0 0 0 0 0 0 0 0 0 0 0 0 0 0 0 0 0 0 0 0 0COS32A8 2 3 1 3 1 2 1 3 1 3 2 3 2 3 1 2 2 3 2 3 1 3IN Sa 1 4 1 1 2 4 1 1 1 1 1 4 1 4 2 4 1 4 0 0 0 0INSb 1 4 1 1 2 4 1 1 1 1 1 4 1 4 2 4 1 4 0 0 0 0THa 1 2 2 2 1 1 2 2 2 2 0 0 0 0 1 1 1 2 0 0 0 0THb 1 2 2 2 1 1 2 2 2 2 0 0 0 0 1 1 I Î J 2 0 0 0 0D 11S1318 1 2 1 1 2 7 1 1 1 1 1 2 1 2 2 7 m i 1 2 1 1c o s l l l a 2 3 2 3 3 3 2 3 2 3 2 3 2 3 3 3 2 3 2 3 2 3c o s l l l b 2 3 2 3 3 3 2 3 2 3 2 3 2 3 3 3 2 3 2 3 2 3D 11S454 1 2 1 2 1 2 1 2 1 2 1 2 1 2 1 2 0 0 0 0 0 0HBB 3 4 2 4 0 0 2 4 2 4 3 4 3 4 3 4 2 4 3 4 2 4
199
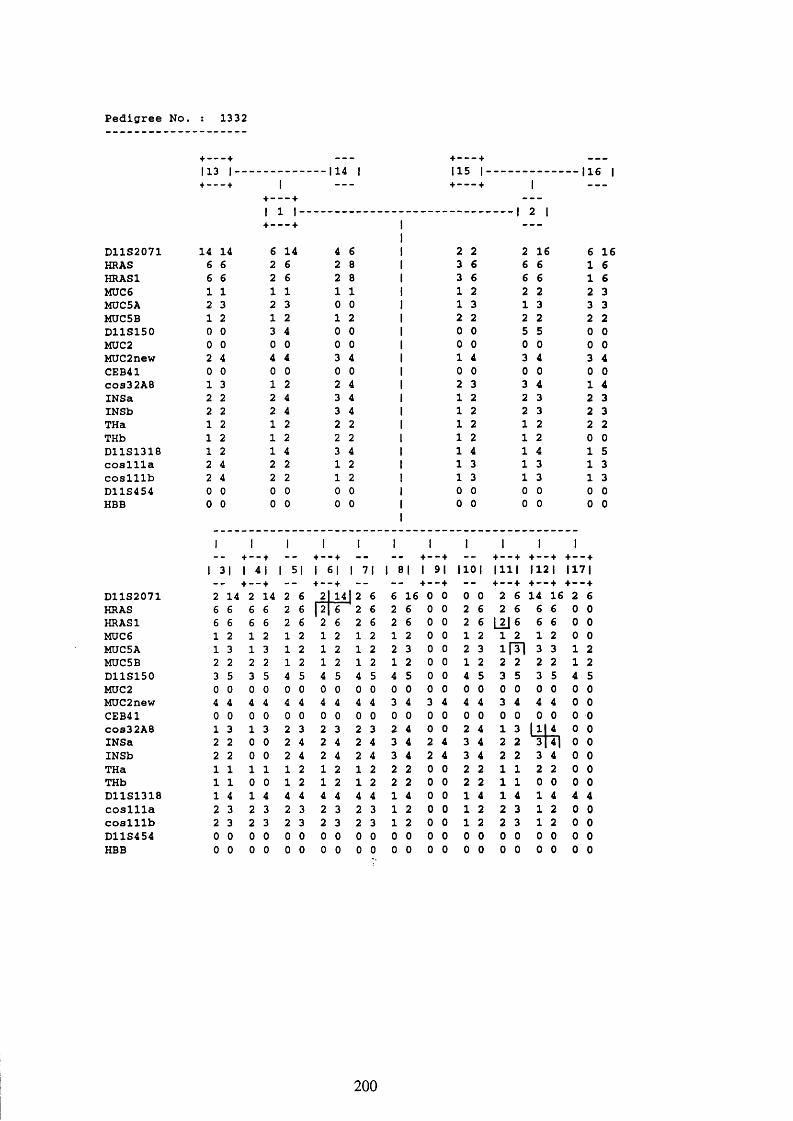
P e d i g r e e No, 1332
+ “ *■ “ + - - - -1 1 1 1 1 C 11 1 ' 1 AD 1+ “ "■“ + 1 — - + "**" + 1 - - -
+ - + - — —1 1 I - - ------ 1 2+ - + - —
D 11S 2071 14 14 6 14 4 6 2 2 2 16 6 16HRAS 6 6 2 6 2 8 3 6 6 6 1 6HRASl 6 6 2 6 2 8 3 6 6 6 1 6MUC6 1 1 1 1 1 1 1 2 2 2 2 3MÜC5A 2 3 2 3 0 0 1 3 1 3 3 3MUC5B 1 2 1 2 1 2 2 2 2 2 2 2D 11S150 0 0 3 4 0 0 0 0 5 5 G GMCJC2 0 0 0 0 0 0 0 0 G G G GMUC2new 2 4 4 4 3 4 1 4 3 4 3 4CEB41 0 0 0 0 0 0 0 0 G G G GCOS32A8 1 3 1 2 2 4 2 3 3 4 1 4IN Sa 2 2 2 4 3 4 1 2 2 3 2 3INSb 2 2 2 4 3 4 1 2 2 3 2 3THa 1 2 1 2 2 2 1 2 1 2 2 2THb 1 2 1 2 2 2 1 2 1 2 G GD 11S1318 1 2 1 4 3 4 1 4 1 4 1 5c o s l l l a 2 4 2 2 1 2 1 3 1 3 1 3c o s l l l b 2 4 2 2 1 2 1 3 1 3 1 3D 11S454 0 0 0 0 0 0 0 0 0 0 0 0HBB 0 0 0 0 0 0 0 0 0 0 0 G
1 1+ - - +
1 1+ - - +
1 1 1+ - - +
1 1+ - - +
1+
1+ - - +
1 31 1 4 1 1 51 1 6 | 1 71 1 81 1 91 1101 u n 1121 117 1— — + - - + - + - - + - — — + - - + — — + “ “ + + + - - +
D 11S 2071 2 14 2 14 2 6 2 14 |2 6 6 16 0 0 G G 2 6 14 16 2 6HRAS 6 6 6 6 2 6 |2 6 2 6 2 6 0 0 2 6 2 6 6 6 G GHRASl 6 6 6 6 2 6 2 6 2 6 2 6 0 0 2 6 |_2J6 6 6 G GMUC6 1 2 1 2 1 2 1 2 1 2 1 2 0 0 1 2 1 2 1 2 G GMUC5A 1 3 1 3 1 2 1 2 1 2 2 3 0 0 2 3 i m 3 3 1 2MUC5B 2 2 2 2 1 2 1 2 1 2 1 2 0 0 1 2 2 2 2 2 1 2D 11S150 3 5 3 5 4 5 4 5 4 5 4 5 0 0 4 5 3 5 3 5 4 5MÜC2 0 0 0 0 0 0 0 0 0 0 0 0 0 0 G 0 G G 0 G G GMUC2new 4 4 4 4 4 4 4 4 4 4 3 4 3 4 4 4 3 4 4 4 G GCEB41 0 0 0 0 0 0 0 0 0 0 0 0 0 0 G G G 0 G G G GCOS32A8 1 3 1 3 2 3 2 3 2 3 2 4 0 0 2 4 1 3 L a 4 0 GINSa 2 2 0 0 2 4 2 4 2 4 3 4 2 4 3 4 2 2 % G GINSb 2 2 0 0 2 4 2 4 2 4 3 4 2 4 3 4 2 2 3 4 0 GTHa 1 1 1 1 1 2 1 2 1 2 2 2 0 0 2 2 1 1 2 2 0 GTHb 1 1 0 0 1 2 1 2 1 2 2 2 0 0 2 2 1 1 G G G 0D 11S1318 1 4 1 4 4 4 4 4 4 4 1 4 0 0 1 4 1 4 1 4 4 4c o s l l l a 2 3 2 3 2 3 2 3 2 3 1 2 0 0 1 2 2 3 1 2 G 0c o s l l l b 2 3 2 3 2 3 2 3 2 3 1 2 0 0 1 2 2 3 1 2 G GD 11S454 0 0 0 0 0 0 0 0 0 0 0 0 0 0 G G G G G G G GHBB 0 0 0 0 0 0 0 0 0 0 0 0 0 0 G G G G G G G G
200
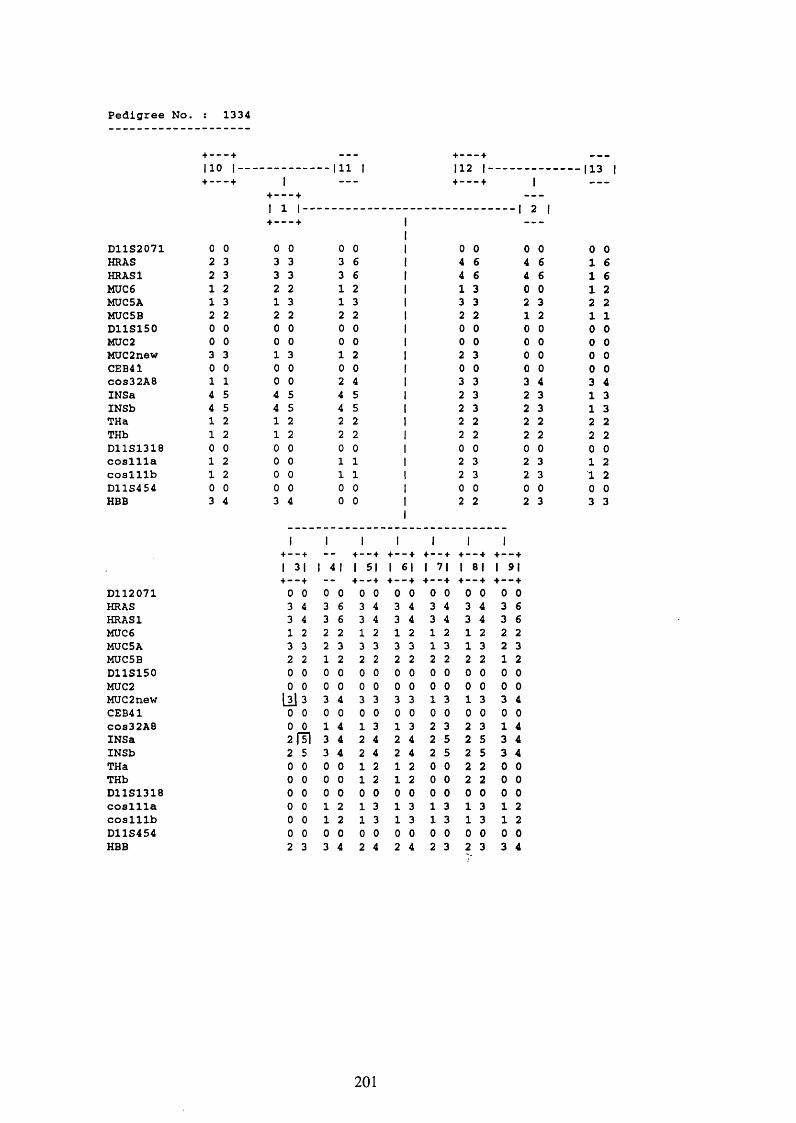
P e d i g r e e No, 1334
+ — •” — +
1 1 0 1 -
+ • — — +
111 I 112 I- + — — — +
1 1 3 I
D 11S2071HRASHRASlMÜC6MUC5AMUC5BD 11S150MUC2MUC2newCEB41COS32A8INSaINSbTHaTHbD 11S 1318c o s l l l ac o s l l l bD 11S454HBB
+ - — - +
I 1 I- + — — • +
+ - -■ + + - - + + - - + + - - + + -•- + + - - +1 31 1 4 I 1 51 1 61 1 71 1 81 1 91+ - - + + - - + + -•- + + - - + + -■- + + - - +
D 112071 0 0 0 0 0 0 0 0 0 0 0 0 0 0HRAS 3 4 3 6 3 4 3 4 3 4 3 4 3 6HRASl 3 4 3 6 3 4 3 4 3 4 3 4 3 6MUC6 1 2 2 2 1 2 1 2 1 2 1 2 2 2MUC5A 3 3 2 3 3 3 3 3 1 3 1 3 2 3MUC5B 2 2 1 2 2 2 2 2 2 2 2 2 1 2D 11S150 0 0 0 0 0 0 0 0 0 0 0 0 0 0MUC2 0 0 0 0 0 0 0 0 0 0 0 0 0 0MUC2new 111 3 3 4 3 3 3 3 1 3 1 3 3 4CEB41 0 0 0 0 0 0 0 0 0 0 0 0 0 0COS32A8 0 0 1 4 1 3 1 3 2 3 2 3 1 4IN Sa 2151 3 4 2 4 2 4 2 5 2 5 3 4INSb 2 5 3 4 2 4 2 4 2 5 2 5 3 4THa 0 0 0 0 1 2 1 2 0 0 2 2 0 0THb 0 0 0 0 1 2 1 2 0 0 2 2 0 0D 11S1318 0 0 0 0 0 0 0 0 0 0 0 0 0 0c o s l l l a 0 0 1 2 1 3 1 3 1 3 1 3 1 2c o s l l l b 0 0 1 2 1 3 1 3 1 3 1 3 1 2D 11S454 0 0 0 0 0 0 0 0 0 0 0 0 0 0HBB 2 3 3 4 2 4 2 4 2 3 2 3 3 4
201
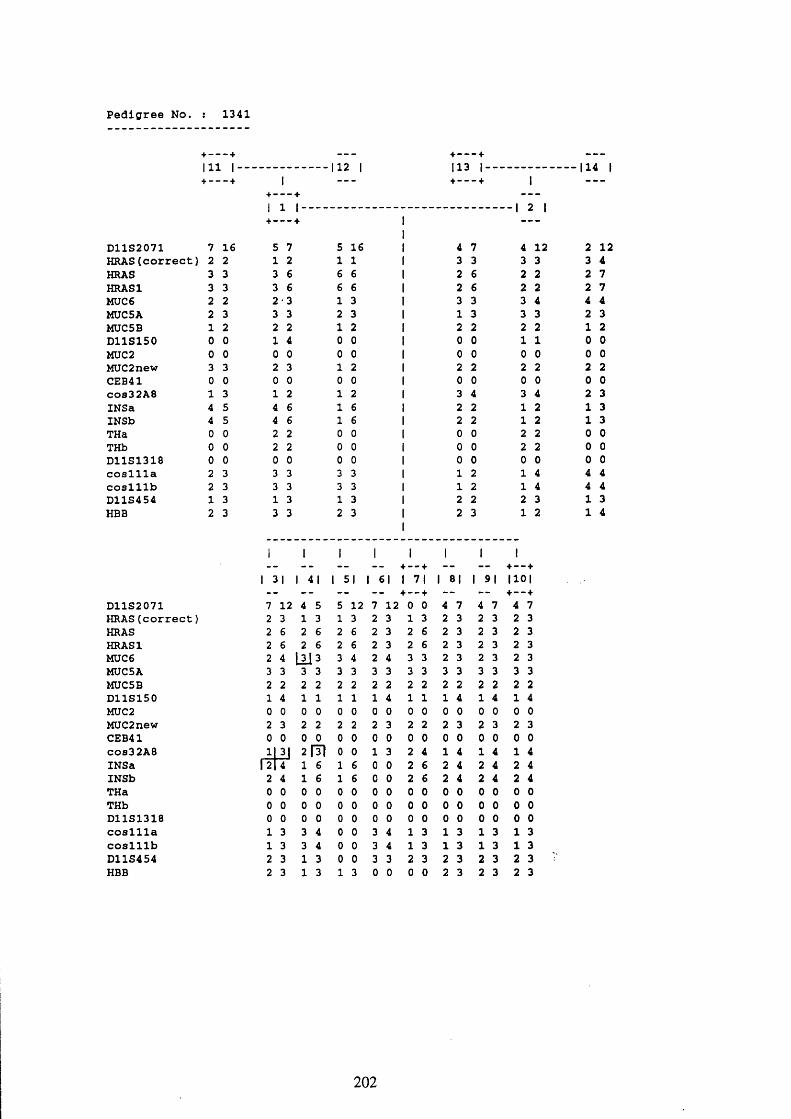
P e d i g r e e No, 1 3 4 1
+ — — — + 111 I - - - - I 1 2 1+ “ “ “ + 1 -----
D 11S2071 7 16
+ — — — +1 1 I - - + " — " +
5 7 5 16H R A S (c o r r e c t) 2 2 1 2 1 1HRAS 3 3 3 6 6 6HRASl 3 3 3 6 6 6MUC6 2 2 2 3 1 3MUC5A 2 3 3 3 2 3MÜC5B 1 2 2 2 1 2D 11S 150 0 0 1 4 0 0MUC2 0 0 0 0 0 0MUC2new 3 3 2 3 1 2CEB41 0 0 0 0 0 0COS32A8 1 3 1 2 1 2INSa 4 5 4 6 1 6INSb 4 5 4 6 1 6THa 0 0 2 2 0 0THb 0 0 2 2 0 0D 11S 1318 0 0 0 0 0 0c o s l l l a 2 3 3 3 3 3c o s l l l b 2 3 3 3 3 3D 11S454 1 3 1 3 1 3HBB 2 3 3 3 2 3
+ • • • +113 1- + — — — +
I 2 I
+ — — + — — — — + — — +
1 :31 1 41 1 51 1 61 1 71 1 131 1 91 1101
D 11S 2071 7 12 4 5 5 12 7 12 0 0 4 7 4 7 4 7H R A S (c o r r e c t} 2 3 1 3 1 3 2 3 1 3 2 3 2 3 2 3HRAS 2 6 2 6 2 6 2 3 2 6 2 3 2 3 2 3HRASl 2 6 2 6 2 6 2 3 2 6 2 3 2 3 2 3MUC6 2 4 |3 j 3 3 4 2 4 3 3 2 3 2 3 2 3MUC5A 3 3 3 3 3 3 3 3 3 3 3 3 3 3 3 3MUC5B 2 2 2 2 2 2 2 2 2 2 2 2 2 2 2 2D 11S150 1 4 1 1 1 1 1 4 1 1 1 4 1 4 1 4MUC2 0 0 0 0 0 0 0 0 0 0 0 0 0 0 0 0MUC2new 2 3 2 2 2 2 2 3 2 2 2 3 2 3 2 3CEB41 0 0 0 0 0 0 0 0 0 0 0 0 0 0 0 0COS32A8 1 P I 2 m 0 0 1 3 2 4 1 4 1 4 1 4IN Sa 1 2 1 6 1 6 0 0 2 6 2 4 2 4 2 4INSb 2 4 1 6 1 6 0 0 2 6 2 4 2 4 2 4THa 0 0 0 0 0 0 0 0 0 0 0 0 0 0 0 0THb 0 0 0 0 0 0 0 0 0 0 0 0 0 0 0 0D 11S 1318 0 0 0 0 0 0 0 0 0 0 0 0 0 0 0 0c o s l l l a 1 3 3 4 0 0 3 4 1 3 1 3 1 3 1 3c o s l l l b 1 3 3 4 0 0 3 4 1 3 1 3 1 3 1 3D 11S454 2 3 1 3 0 0 3 3 2 3 2 3 2 3 2 3HBB 2 3 1 3 1 3 0 0 0 0 2 3 2 3 2 3
114 I
4 7 4 12 2 123 3 3 3 3 42 6 2 2 2 72 6 2 2 2 73 3 3 4 4 41 3 3 3 2 32 2 2 2 1 20 0 1 1 0 00 0 0 0 0 02 2 2 2 2 20 0 0 0 0 03 4 3 4 2 32 2 1 2 1 32 2 1 2 1 30 0 2 2 0 00 0 2 2 0 00 0 0 0 0 01 2 1 4 4 41 2 1 4 4 42 2 2 3 1 32 3 1 2 1 4
202

P e d i g r e e No. 1347
112 I- 113 1+ “* • — +114 1- 115
- - + 1 - - - + -■- - + 1 - —+ " — —+ — — —1 1 1- -1 2 1+ “ —“ + — -
D 11S 2071 3 6 3 7 6 7 5 5 5 6 6 2HRAS 6 6 6 6 6 6 6 6 6 6 6 6HRASl 6 6 6 6 6 6 6 6 6 6 6 6MÜC6 2 3 2 4 4 4 1 1 1 2 2 2MÜC5A 1 3 1 3 3 3 2 3 2 2 2 3MUC5B 2 3 2 3 2 2 1 2 1 1 1 2D 11S 150 0 0 0 3 0 0 0 0 4 5 0 0MUC2 0 0 0 0 0 0 0 0 0 0 0 0MUC2new 1 3 2 3 2 2 3 3 3 3 1 3CEB41 0 0 0 0 0 0 0 0 0 0 0 0COS32A8 1 3 1 2 2 4 2 3 3 4 1 4IN Sa 1 5 1 3 3 3 4 4 2 4 2 2INSb 1 5 1 3 3 3 4 4 2 4 2 2THa 2 2 2 2 1 2 2 2 1 2 1 2THb 2 2 2 2 1 2 2 2 1 2 1 2D 11S 1318 1 1 1 2 1 2 3 A 3 A 3 3c o s l l l a 2 3 1 3 1 1 1 3 1 3 1 1c o s l l l b 2 3 1 3 1 1 1 3 1 3 1 1D 11S454 2 3 2 2 2 3 1 1 1 3 3 3HBB 2 5 2 3 3 4 3 4 2 4 2 4
1 1+ - - +
1+ - - +
1t - - f
1 1 1+ - - +
1+ - - +
1+ - - +
1+ - - +
1 31 1 41 1 51 1 61 1 71 1 81 1 91 1101 1111 1161- + - - + + - - + + - - + - - + - - + + - - + + " •■ + f - - +
D 11S 2071 6 7 5 7 3 5 5 7 5 7 3 5 5 7 3 5 6 7 3 5HRAS £ 6 6 6 £ £ £ 6 6 6 6 £ 6 6 6 6 6 6 0 0HRASl 6 6 6 6 6 6 6 6 6 6 6 £ 6 6 6 6 6 6 0 0MUC6 2 4 1 4 1 2 1 4 1 4 1 2 1 4 1 2 2 4 0 0MUC5A 2 3 2 3 1 2 2 3 2 3 1 2 2 3 1 2 2 3 1 2MUC5B 1 2 1 2 1 3 1 2 1 2 1 3 1 2 0 0 1 2 1 3D 11S150 0 5 0 4 3 4 0 4 0 4 3 4 0 4 3 4 0 5 3 4MUC2 0 0 0 0 0 0 0 0 0 0 0 0 0 0 0 0 0 0 0 0MUC2new 2 3 2 3 3 3 2 3 2 3 3 3 2 3 3 3 2 3 3U 1CEB41 0 0 0 0 0 0 0 0 0 0 0 0 0 0 0 0 0 0 0 0COS32A8 2 4 2 3 1 3 2 3 2 3 1 3 2 3 1 3 2 4 0 0IN Sa 2 3 3 4 1 4 3 4 3 4 1 4 3 4 1 4 2 3 0 0INSb 2 3 3 4 1 4 3 4 3 4 1 4 3 4 1 4 2 3 0 0THa 1 2 2 2 2 2 2 2 2 2 2 2 2 2 2 2 1 2 0 0THb 1 2 2 2 2 2 2 2 2 2 2 2 2 2 2 2 1 2 0 0D 11S1318 2 3 2 A 1 A 2 A 2 A 1 A 2 A 1 A 2 3 f2 lAc o s l l l a 1 1 1 3 3 3 1 3 1 3 3 3 1 3 3 3 1 1 0 0c o s l l l b 1 1 1 3 3 3 1 3 1 3 3 3 1 3 3 3 1 1 0 0D 11S454 2 3 1 2 1 2 1 2 1 2 1 2 1 2 1 2 2 3 0 0HBB 2 3 3 4 2 4 2 4 0 0 3 4 3 4 2 4 2 3 3 4
203
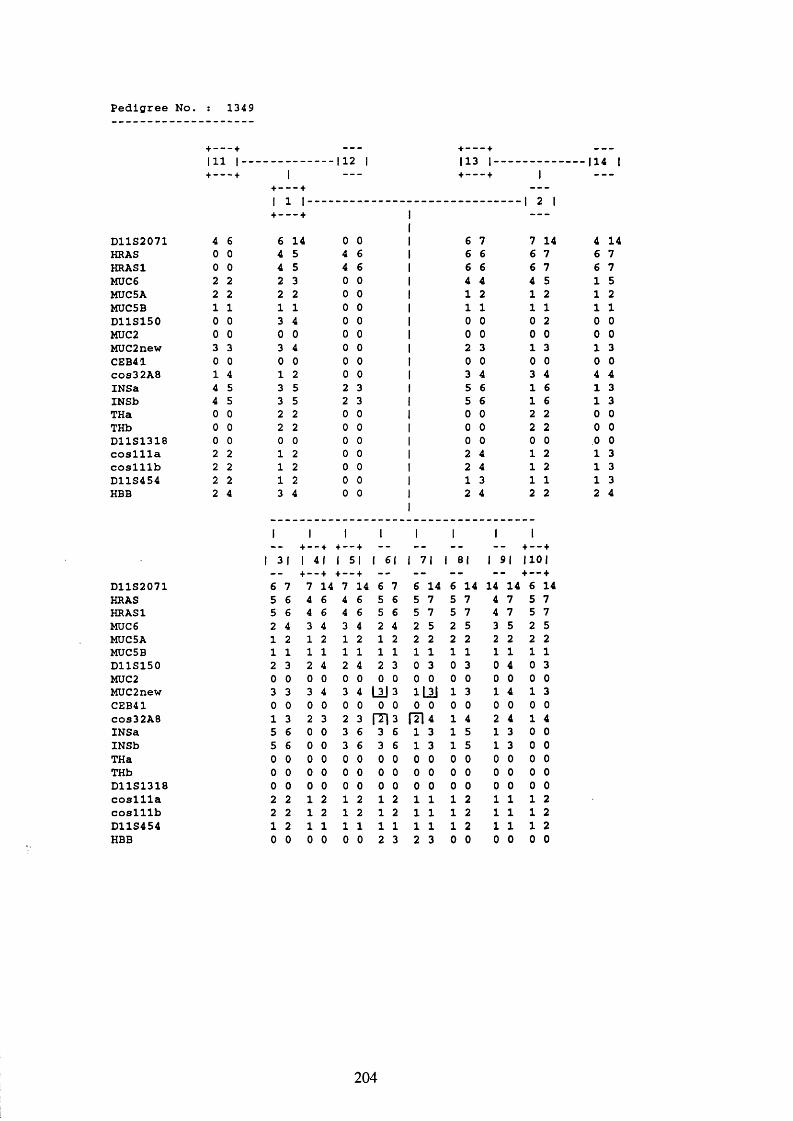
P e d i g r e e No, 1349
+ - - - + - + - - - + -1XI 1■-+ — — — + 1 - + - - - + 1 -
+ - “ " + — — —1 1 1- 1 2 1+ - - - + 1 -----
D 11S 2071 4 6 6 14 0 011 6 7 7 14 4 14
HRAS 0 0 4 5 4 6 1 6 6 6 7 6 7HRASl 0 0 4 5 4 6 1 6 6 6 7 6 7MUC6 2 2 2 3 0 0 1 4 4 4 5 1 5MUC5A 2 2 2 2 0 0 1 1 2 1 2 1 2MUC5B 1 1 1 1 0 0 1 1 1 1 1 1 1D 11S150 0 0 3 4 0 0 1 0 0 0 2 0 0MUC2 0 0 0 0 0 0 1 0 0 0 0 G 0MUC2new 3 3 3 4 0 0 1 2 3 1 3 1 3CEB41 0 0 0 0 0 0 I 0 0 0 0 G GCOS32A8 1 4 1 2 0 0 1 3 4 3 4 4 4IN Sa 4 5 3 5 2 3 1 5 6 1 6 1 3INSb 4 5 3 5 2 3 1 5 6 1 6 1 3THa 0 0 2 2 0 0 1 0 0 2 2 0 GTHb 0 0 2 2 0 0 1 0 0 2 2 0 GD 11S1318 0 0 0 0 0 0 1 0 0 0 0 G Gc o s l l l a 2 2 1 2 0 0 1 2 4 1 2 1 3c o s l l l b 2 2 1 2 0 0 1 2 4 1 2 1 3D 11S454 2 2 1 2 0 0 1 1 3 1 1 1 3HBB 2 4 3 4 0 0 1
12 4 2 2 2 4
1 1+ - - +
1+ - - +
1 1 1 1 1+ - - +
1 31 1 41 1 5 1 1 61 1 71 81 1 91 1101— — + - - + + - - + — — — “ - - + - - +
D 11S2071 6 7 7 14 7 14 6 7 6 14 6 14 14 14 6 14HRAS 5 6 4 6 4 6 5 6 5 7 5 7 4 7 5 7HRASl 5 6 4 6 4 6 5 6 5 7 5 7 4 7 5 7MUC6 2 4 3 4 3 4 2 4 2 5 2 5 3 5 2 5MUC5A 1 2 1 2 1 2 1 2 2 2 2 2 2 2 2 2MUC5B 1 1 1 1 1 1 1 1 1 1 1 1 1 1 1 1D 11S150 2 3 2 4 2 4 2 3 0 3 0 3 0 4 G 3MUC2 0 0 0 0 0 0 0 0 0 0 0 0 0 0 G GMUC2new 3 3 3 4 3 4 LU 3 113J 1 3 1 4 1 3CEB41 0 0 0 0 0 0 0 0 0 0 0 0 0 0 0 GCOS32A8 1 3 2 3 2 3 (T13 f2 l 4 1 4 2 4 1 4IN Sa 5 6 0 0 3 6 3 6 1 3 1 5 1 3 G GINSb 5 6 0 0 3 6 3 6 1 3 1 5 1 3 0 GTHa 0 0 0 0 0 0 0 0 0 0 0 0 0 0 G 0THb 0 0 0 0 0 0 0 0 0 0 0 0 0 0 G GD 11S 1318 0 0 0 0 0 0 0 0 0 0 0 0 0 0 G Gc o s l l l a 2 2 1 2 1 2 1 2 1 1 1 2 1 1 1 2c o s l l l b 2 2 1 2 1 2 1 2 1 1 1 2 1 1 1 2D 11S454 1 2 1 1 1 1 1 1 1 1 1 2 1 1 1 2HBB 0 0 0 0 0 0 2 3 2 3 0 0 0 0 0 0
204

P e d i g r e e N o . : 1362
+ — — — +
1 1 3 I- 114+ • “ “ +1 1 5 I- 1 1 6 I
+ -----+ 1 -- +-----+ 1 -+ - — —+ - — —1 1 -1 2 1+ - — + - - -
D 11S2071 6 7 5 6 4 5 11 16 7 16 6 7HRAS 6 6 6 6 3 6 3 6 3 6 6 6HRASl 6 6 6 6 3 6 3 6 3 6 6 6MÜC6 2 3 1 2 1 4 2 2 2 2 2 2MUC5A 1 2 2 2 2 2 1 2 1 2 2 2MUC5B 1 1 1 1 1 1 1 2 1 2 1 1D 11S150 1 3 3 6 4 6 5 6 5 6 2 6MÜC2 0 0 0 0 0 0 0 0 0 0 0 0MUC2new 3 6 3 3 3 5 1 2 2 3 3 4CEB41 1 3 1 2 2 4 2 3 1 3 1 2COS32A8 1 3 1 2 2 4 2 3 1 3 1 2IN Sa 1 3 3 4 4 5 2 6 2 6 1 2INSb 1 3 3 4 4 5 2 6 2 6 1 2THa 0 0 2 2 0 0 0 0 2 2 0 0THb 0 0 2 2 0 0 0 0 2 2 0 0D 11S1318 1 5 1 3 3 3 1 1 1 1 1 1c o s l l l a 2 2 1 2 1 2 1 3 1 3 2 3c o s l l l b 2 2 1 2 1 2 1 3 1 3 2 3D 11S454 2 2 2 2 1 2 1 1 1 2 1 2HBB 2 2 2 4 3 4 2 3 1 2 1 3
1 1 1+ - - +
1 1 1+ - - +
1 I 1+ - - +
1 1+ - - +
1 31 1 4 1 1 51 61 1 71 1 81 91 110 1 i l l ! 112 1 1171— — + - - + - - + - - + - — — + - - + — — + - - +
D 11S2071 6 7 6 14 5 16 6 7 5 7 5 16 6 7 6 16 5 7 6 16 5 7HRAS 6 6 3 6 3 6 6 6 6 6 3 6 6 6 3 6 6 6 3 6 6 6HRASl 6 6 3 6 3 6 6 6 6 6 3 6 6 6 3 6 6 6 3 6 6 6MUC6 2 2 2 2 1 2 2 2 1 2 1 2 2 2 2 2 1 2 1 2 1 2MUC5A 2 2 1 2 1 2 2 2 2 2 1 2 2 2 1 2 2 2 1 2 2 2MUC5B 1 1 1 2 1 2 1 1 1 1 1 2 1 1 1 2 1 1 1 2 1 1D 11S2071 3 6 3 5 5 6 3 6 6 6 5 6 3 6 3 5 6 6 5 6 3 6MUC2 0 0 0 0 0 0 0 0 0 0 0 0 0 0 0 0 0 0 0 0 0 0MUC2new 3 3 2 3 2 3 3 3 3 3 2 3 3 3 2 3 3 3 2 3 3 3CEB41 0 0 1 3 0 0 1 1 1 2 0 0 1 1 1 3 1 2 2 3 1 1COS32A6 0 0 1 3 0 0 1 1 1 2 0 0 1 1 1 3 1 2 2 3 1 1IN Sa 2 3 4 6 4 6 2 3 2 4 4 6 2 3 3 6 2 4 4 6 0 0INSb 2 3 4 6 4 6 2 3 2 4 4 6 2 3 3 6 2 4 4 6 0 0THa 0 0 0 0 0 0 0 0 0 0 0 0 0 0 0 0 0 0 0 0 0 0THb 0 0 0 0 0 0 0 0 0 0 0 0 0 0 0 0 0 0 0 0 0 0D 11S1318 | 1 | 1 1 1 1 3 1 1 1 3 1 3 1 1 1 1 1 3 1 3 1 1c o s l l l a |T 13 1 2 1 1 2 3 1 3 1 1 2 3 1 2 1 3 1 1 2 3c o s l l l b 1 3 1 2 1 1 2 3 1 3 1 1 2 3 1 2 1 3 1 1 2 3D 11S454 2 2 1 2 1 2 2 2 2 2 1 2 2 2 1 2 2 2 1 2 2 2HBB 1 4 2 2 2 4 1 2 1 4 2 4 1 2 2 2 2 4 2 4 1 2
205
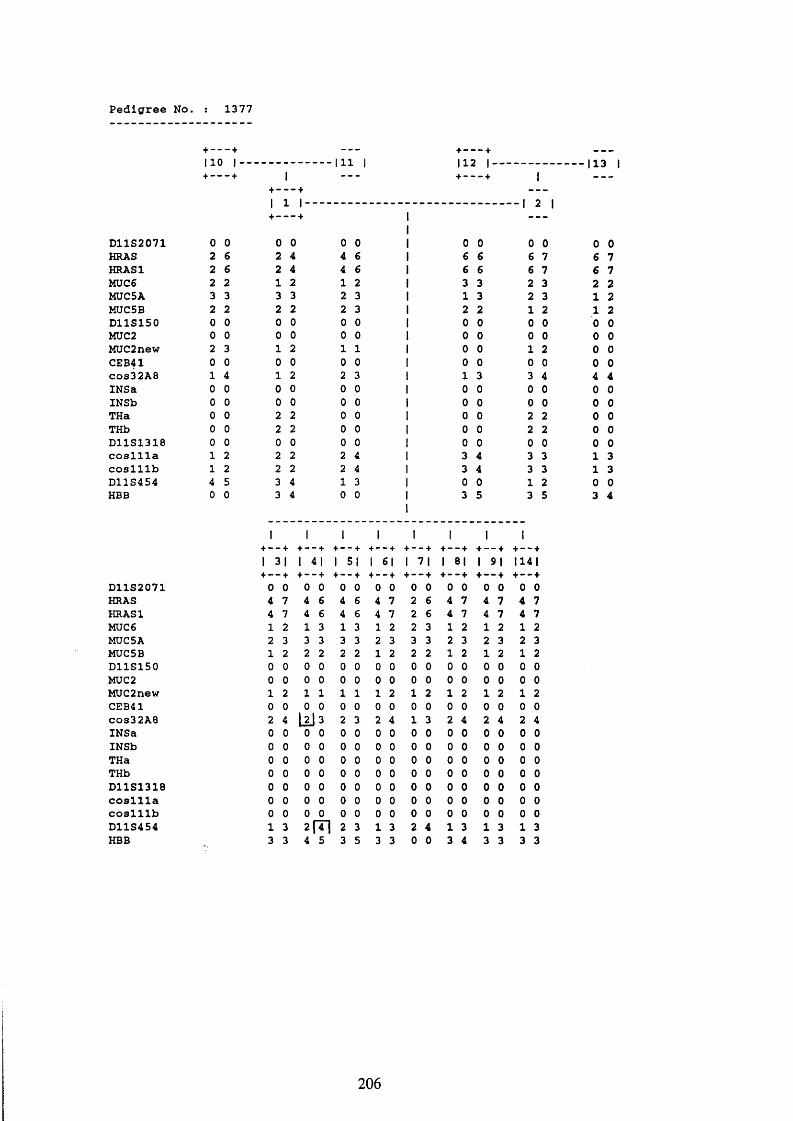
P e d i g r e e N o. : 1 3 7 7
+ — — — + - + - - - + --1 20 1 * 1+-----+ 1 - - - + - - - + 1 -
+ — — — + — — 1 1 1-------+ — — — + 1
- - I 2 1
D 11S 2071 0 0 0 0 0 011 0 0 0 0 0 0
HRAS 2 6 2 4 4 6 1 6 6 6 7 6 7HRASl 2 6 2 4 4 6 1 6 6 6 7 6 7MUC6 2 2 1 2 1 2 1 3 3 2 3 2 2MUC5A 3 3 3 3 2 3 1 1 3 2 3 1 2MUC5B 2 2 2 2 2 3 1 2 2 1 2 1 2D 11S150 0 0 0 0 0 0 1 0 0 0 0 0 0MUC2 0 0 0 0 0 0 1 0 0 0 0 0 0MUC2new 2 3 1 2 1 1 1 0 0 1 2 0 0CEB41 0 0 0 0 0 0 1 0 0 0 0 0 0COS32A8 1 4 1 2 2 3 1 1 3 3 4 4 4INSa 0 0 0 0 0 0 1 0 0 0 0 0 0INSb 0 0 0 0 0 0 1 0 0 0 0 0 0THa 0 0 2 2 0 0 1 0 0 2 2 0 0THb 0 0 2 2 0 0 1 0 0 2 2 0 0D 11S1318 0 0 0 0 0 0 1 0 0 0 0 0 0c o s l l l a 1 2 2 2 2 4 1 3 4 3 3 1 3c o s l l l b 1 2 2 2 2 4 1 3 4 3 3 1 3D 11S454 4 5 3 4 1 3 1 0 0 1 2 0 0HBB 0 0 3 4 0 0 1
13 5 3 5 3 4
1 1 + — + + — +
1+ - - +
1+ - - +
1+ - - +
1+ - - +
1+ - - +
1+ - - +
1 31 1 41 1 51 1 61 1 71 1 81 1 91 1141+ — “ + + — — + + - - + + - - + + - - + + - - + + - - + + - - +
D 11S 2071 0 0 0 0 0 0 0 0 0 0 0 0 0 0 0 0HRAS 4 7 4 6 4 6 4 7 2 6 4 7 4 7 4 7HRASl 4 7 4 6 4 6 4 7 2 6 4 7 4 7 4 7MUC6 1 2 1 3 1 3 1 2 2 3 1 2 1 2 1 2MUC5A 2 3 3 3 3 3 2 3 3 3 2 3 2 3 2 3MUC5B 1 2 2 2 2 2 1 2 2 2 1 2 1 2 1 2D 11S150 0 0 0 0 0 0 0 0 0 0 0 0 0 0 0 0MUC2 0 0 0 0 0 0 0 0 0 0 0 0 0 0 0 0MUC2new 1 2 1 1 1 1 1 2 1 2 1 2 1 2 1 2CEB41 0 0 0 0 0 0 0 0 0 0 0 0 0 0 0 0c o s 3 2A8 2 4 [ 2 ) 3 2 3 2 4 1 3 2 4 2 4 2 4INSa 0 0 0 0 0 0 0 0 0 0 0 0 0 0 0 0INSb 0 0 0 0 0 0 0 0 0 0 0 0 0 0 0 0THa 0 0 0 0 0 0 0 0 0 0 0 0 0 0 0 0THb 0 0 0 0 0 0 0 0 0 0 0 0 0 0 0 0D 1 1 S 1 3 1 8 0 0 0 0 0 0 0 0 0 0 0 0 0 0 0 0c o s l l l a 0 0 0 0 0 0 0 0 0 0 0 0 0 0 0 0c o s l l l b 0 0 0 0 0 0 0 0 0 0 0 0 0 0 0 0D 11S454 1 3 2 [ Z ] 2 3 1 3 2 4 1 3 1 3 1 3HBB 3 3 4 5 3 5 3 3 0 0 3 4 3 3 3 3
206
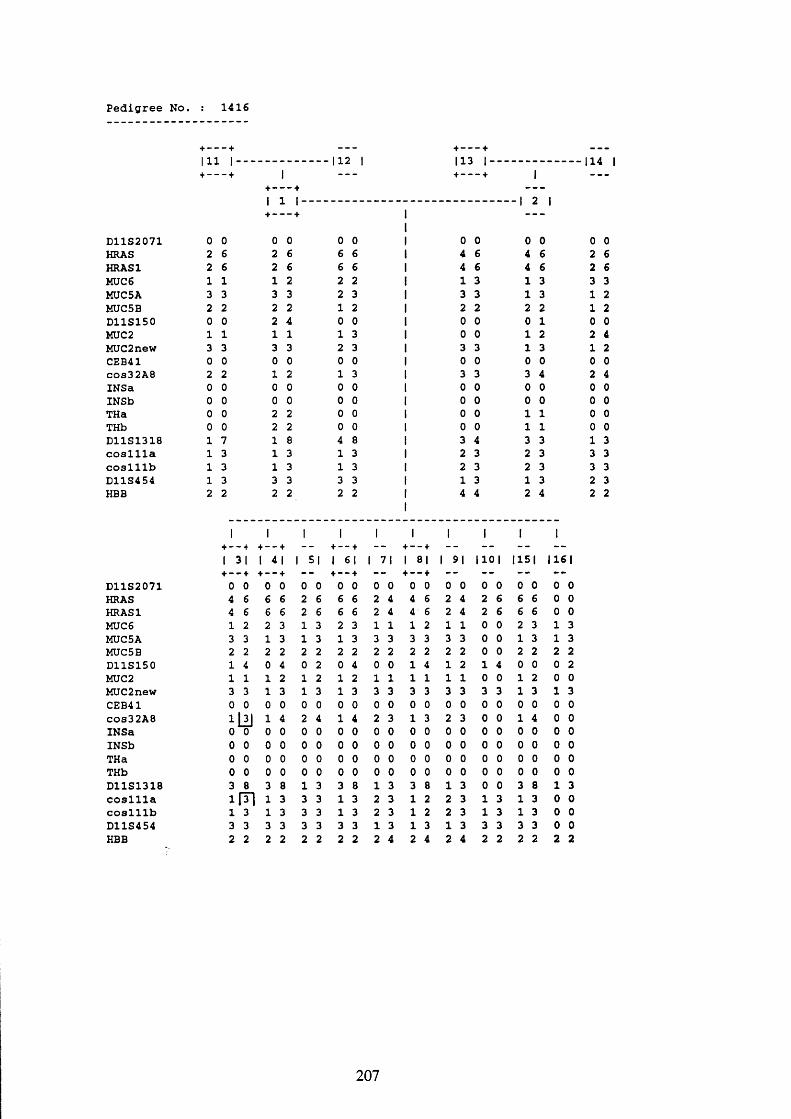
P e d i g r e e N o . : 1 4 1 6
1 1 1 I- + +
112 113 I- 114 I
1 1 1 - - 1 i I+ - - - + 1 -----
D 11S2071 0 0 0 0 0 011 0 0 0 0 0 0
HRAS 2 6 2 6 6 6 1 4 6 4 6 2 6HRASl 2 6 2 6 6 6 1 4 6 4 6 2 6MUC6 1 1 1 2 2 2 1 1 3 1 3 3 3MÜC5A 3 3 3 3 2 3 1 3 3 1 3 1 2MUC5B 2 2 2 2 1 2 1 2 2 2 2 1 2D 11S150 0 0 2 4 0 0 1 0 0 0 1 0 0MÜC2 1 1 1 1 1 3 1 0 0 1 2 2 4MUC2new 3 3 3 3 2 3 1 3 3 1 3 1 2CEB41 0 0 0 0 0 0 1 0 0 0 0 0 0COS32A8 2 2 1 2 1 3 1 3 3 3 4 2 4INSa 0 0 0 0 0 0 1 0 0 0 0 0 0INSb 0 0 0 0 0 0 1 0 0 0 0 0 0THa 0 0 2 2 0 0 1 0 0 1 1 0 0THb 0 0 2 2 0 0 1 0 0 1 1 0 0D 11S1318 1 7 1 8 4 8 1 3 4 3 3 1 3c o s l l l a 1 3 1 3 1 3 1 2 3 2 3 3 3c o s l l l b 1 3 1 3 1 3 1 2 3 2 3 3 3D 11S454 1 3 3 3 3 3 1 1 3 1 3 2 3HBB 2 2 2 2 2 2 1
14 4 2 4 2 2
1+ - - +
1+ - — +
1 1+ - - +
1 1+ - - +
1 1 1 1
1 31 1 41 1 51 1 61 1 71 1 81 1 91 1101 1151 116 1+ - - + + - - + - + - - + - + - - + - - - - -
D 11S2071 0 0 0 0 0 0 0 0 0 0 0 0 0 0 0 0 0 0 0 0HRAS 4 6 6 6 2 6 6 6 2 4 4 6 2 4 2 6 6 6 0 0HRASl 4 6 6 6 2 6 6 6 2 4 4 6 2 4 2 6 6 6 0 0MUC6 1 2 2 3 1 3 2 3 1 1 1 2 1 1 0 0 2 3 1 3MUC5A 3 3 1 3 1 3 1 3 3 3 3 3 3 3 0 0 1 3 1 3MUC5B 2 2 2 2 2 2 2 2 2 2 2 2 2 2 0 0 2 2 2 2D 11S150 1 4 0 4 0 2 0 4 0 0 1 4 1 2 1 4 0 0 0 2MUC2 1 1 1 2 1 2 1 2 1 1 1 1 1 1 0 0 1 2 0 0MUC2new 3 3 1 3 1 3 1 3 3 3 3 3 3 3 3 3 1 3 1 3CEB41 0 0 0 0 0 0 0 0 0 0 0 0 0 0 0 0 0 0 0 0COS32A8 1 l i j 1 4 2 4 1 4 2 3 1 3 2 3 0 0 1 4 0 0INSa 0 0 0 0 0 0 0 0 0 0 0 0 0 0 0 0 0 0 0 0INSb 0 0 0 0 0 0 0 0 0 0 0 0 0 0 0 0 0 0 0 0THa 0 0 0 0 0 0 0 0 0 0 0 0 0 0 0 0 0 0 0 0THb 0 0 0 0 0 0 0 0 0 0 0 0 0 0 0 0 0 0 0 0D 11S1318 3 8 3 8 1 3 3 8 1 3 3 8 1 3 0 0 3 8 1 3c o s l l l a i m 1 3 3 3 1 3 2 3 1 2 2 3 1 3 1 3 0 0c o s l l l b 1 3 1 3 3 3 1 3 2 3 1 2 2 3 1 3 1 3 0 0D 11S454 3 3 3 3 3 3 3 3 1 3 1 3 1 3 3 3 3 3 0 0HBB 2 2 2 2 2 2 2 2 2 4 2 4 2 4 2 2 2 2 2 2
207

P e d i g r e e No. : 1410
+--- +1 11 I 112 I 113 I- 114 I+ - - + I - + - - - + 1 -■- -
1 1 1- -1 2 1+ ■“*" —+ 1 -----
D 11S2071 2 6 2 7 4 711 6 6 4 6 4 14
HRAS 6 6 1 6 1 6 1 6 6 3 6 3 6HRASl 6 6 1 6 1 6 1 6 6 3 6 3 6MÜC6 4 4 2 4 2 3 1 3 3 1 3 1 1MUC5A 2 3 3 3 3 3 1 1 3 1 3 1 2MUC5B 1 2 2 2 2 2 1 2 2 2 2 1 2D 11S150 0 0 2 5 0 0 1 0 0 6 7 0 0MUC2 2 2 2 2 2 2 1 2 2 1 2 1 2MUC2new 4 4 3 4 3 5 1 2 3 1 3 1 5CEB41 0 0 0 0 0 0 1 0 0 0 0 0 0co s3 2 A 8 1 3 1 2 2 4 1 2 3 3 4 1 4INSa 0 0 0 0 0 0 1 0 0 0 0 0 0INSb 0 0 0 0 0 0 1 0 0 0 0 0 0THa 2 2 2 2 2 2 1 1 2 1 1 1 2THb 2 2 2 2 2 2 1 1 2 1 1 1 2D 11S1318 0 0 0 0 0 0 1 0 0 0 0 0 0c o s l l l a 1 3 3 3 3 3 1 1 2 2 2 2 3c o s l l l b 1 3 3 3 3 3 1 1 2 2 2 2 3D 11S454 2 3 1 3 1 4 1 2 4 2 4 2 3HBB 0 0 0 0 0 0 1
10 0 0 0 0 0
1
1 31
1
1 dl
1
1 51
1+ - 1
- + 51
1
1 71
1+ - 1
- + B|
1
1 91
1
1101
D 11S2071 2 4 4 7 6 7 4 7 6 7 6 7 2 4 4 7HRAS 3 6 1 3 1 6 1 3 1 6 1 6 3 6 1 3HRASl 3 6 1 3 1 6 1 3 1 6 1 6 3 6 1 3MUC6 1 4 0 0 2 3 1 2 2 3 2 3 H_4J 1 2
MUC5A 1 3 1 3 3 3 0 0 3 3 3 3 1 3 1 3MUC5B 2 2 2 2 2 2 2 2 2 2 2 2 2 2 2 2
D 11S150 5 7 2 7 2 6 2 7 2 6 2 6 (T1 7 2 7MUC2 1 2 1 2 2 2 1 2 2 2 2 2 1 2 1 2
MUC2new 1 4 1 3 3 3 1 3 3 3 3 3 1 3 1 3CEB41 0 0 0 0 0 0 0 0 0 0 0 0 0 0 0 0
COS32A8 1 4 2 4 2 3 0 0 2 3 2 3 2 4 2 4IN Sa 0 0 0 0 0 0 0 0 0 0 0 0 0 0 0 0INSb 0 0 0 0 0 0 0 0 0 0 0 0 0 0 0 0THa 1 2 1 2 1 2 1 2 1 2 1 2 1 2 1 2
THb 1 2 1 2 1 2 1 2 1 2 1 2 1 2 1 2D 11S1318 0 0 0 0 0 0 0 0 0 0 0 0 0 0 0 0c o s l l l a 0 0 0 0 0 0 0 0 0 0 0 0 0 0 0 0c o s l l l b 0 0 0 0 0 0 0 0 0 0 0 0 0 0 0 0D 11S454 2 3 1 2 1 4 1 2 1 4 1 4 1 2 1 2HBB 0 0 0 0 0 0 0 0 0 0 0 0 0 0 0 0
208

P e d i g r e e N o . : 1424
1 1 1 I- + — — — +
D 11S2071HRASHRASlMÜC6MUC5AMÜC5BD 11S150MÜC2MUC2newCEB41COS32A8IN SaINSbTHaTHbD 11S1318c o s l l l ac o s l l l bD 11S454HBB
I+ — — — +I 1 !•
112 1 1 3 I- + — — • +
I 2 I
114
D 11S2071HRASHRASlMUC6MUC5AMUC5BD 11S150MUC2MUC2newCEB41COS32A8IN SaINSbTHaTHbD 11S1318c o s l l l ac o s l l l bD 11S454HBB
+ -- +I 31 + - “ +
4 6 1 6 1 6 iL U 1 2 1 3 0 0 0 0
it] 2 0 0
+ - - + I 41 + — +
1 2
+ - “ +I 61 + — +
4 6 1 1 1 1 1 0 0 2 0 2 0 0 0 0 0 3 3 3 0
7 I
66632300303 0 0 0 0 04 4 4 0
+ “ — + I 81 + “ “ +
1 4
+ “ " + I 91 + - - +
4 6
+ — — +
1 1 0 1
+ - - + 4 6
209

P e d i g r e e No. 102
+ - - - +I I-
+ — — — +
I I
D 112071HRASHRASlMUC6MÜC5AMUC5BD 11S 150MUC2MUC2newCEB41co s3 2 A 8IN SaINSbTHaTHbD 11S 1318c o s l l l ac o s l l l bD 11S454HBB
+ — — — +I 1 I- + — • • +
I 2 I
150022200333 0 0 2 2 1 2 2 24
- + - - + - - - + - - + + - - + - + — + - - + - - + + - - +1 31 1 4 1 51 1 61 1 71 1 81 1 91 1101 n i l 1121 113 1 114 1 1151 1161
- + - - + - - + - - + + - - + - + — + - - - - + - - + + ” - +D 11S 2071 4 15 4 15 2 4 0 0 2 4 4 15 4 15 0 0 0 0 0 0 0 0 0 0 0 0 0 0HRAS 0 0 0 0 0 0 0 0 0 0 0 0 0 0 0 0 0 0 0 0 0 0 0 0 0 0 0 0HRASl 0 0 0 0 0 0 0 0 0 0 0 0 0 0 0 0 0 0 0 0 0 0 0 0 0 0 0 0MUC6 2 3 2 2 1 2 2 2 1 2 2 2 2 3 2 3 2 2 2 3 1 2 2 2 1 3 2 2MUC5A 1 2 2 2 2 2 2 2 2 2 2 2 1 2 1 2 2 2 1 2 2 2 2 2 1 2 2 2MUCSB 1 2 2 2 2 2 2 2 2 2 2 2 1 2 1 2 2 2 1 2 2 2 2 2 1 2 2 2D 11S 150 1 2 2 3 3 4 2 3 3 4 2 3 1 2 1 2 2 3 1 2 3 4 2 3 1 4 2 3MUC2 0 0 0 0 0 0 0 0 0 0 0 0 0 0 0 0 0 0 0 0 0 0 0 0 0 0 0 0MUC2new 1 3 2 3 1 2 2 3 1 2 2 3 1 3 1 3 2 3 1 3 1 2 2 3 1 1 2 3CEB41 1 2 2 2 0 0 2 2 2 3 2 2 1 2 1 2 2 2 1 2 2 3 2 2 1 3 2 2COS32A8 1 2 2 2 0 0 2 2 2 3 2 2 1 2 1 2 2 2 1 2 2 3 2 2 1 3 2 2IN Sa 0 0 0 0 0 0 0 0 0 0 0 0 0 0 0 0 0 0 0 0 0 0 0 0 0 0 0 0INSb 0 0 0 0 0 0 0 0 0 0 0 0 0 0 0 0 0 0 0 0 0 0 0 0 0 0 0 0THa 0 0 0 0 0 0 0 0 0 0 0 0 0 0 0 0 0 0 0 0 0 0 0 0 0 0 0 0THb 0 0 0 0 0 0 0 0 0 0 0 0 0 0 0 0 0 0 0 0 0 0 0 0 0 0 0 0D 11S 1318 1 3 1 1 1 1 1 1 1 1 1 1 l i i 1 3 1 1 1 3 1 1 1 1 1 3 1 3c o s l l l a 2 4 1 2 1 1 1 2 1 1 1 2 |T 2 2 4 1 2 2 4 1 1 1 2 1 4 2 4c o s l l l b 2 4 1 2 0 0 1 2 1 1 1 2 1 2 2 4 1 2 2 4 1 1 1 2 1 w 2 4D 11S454 1 2 1 2 0 0 1 2 1 1 0 0 0 0 1 2 1 2 1 2 1 1 1 2 1 2 0 0HBB 3 4 4 4 3 4 4 4 3 4 4 4 4 4 3 4 4 4 3 4 3 4 4 4 3 3 3 4
210

P e d i g r e e No. : 1413
+ +1 2 0 I- 1 1 8 I
+ — + 1 21 I- 119 I
+ - - - 4 1 ------ + - + ------+ - - - + - - -1 1 1- - - 2 1+ - - - + 1 - - -
D 11S2071 0 0 1 3 3 41I 0 0 1 3 2 3
HRAS 0 0 1 2 1 6 1 0 0 3 6 6 6HRASl 0 0 1 2 1 6 1 0 0 3 6 6 6HOC 6 0 0 1 2 1 2 1 0 0 1 1 1 1MÜC5A 0 0 1 2 1 2 1 0 0 2 2 1 2MUC5B 0 0 1 2 1 2 1 0 0 2 2 1 2D 11S150 0 0 3 5 0 0 1 0 0 1 2 0 0MÜC2 0 0 0 0 0 0 1 0 0 0 0 0 0MUC2new 0 0 1 1 1 1 1 0 0 1 2 1 2CEB41 0 0 1 2 2 3 1 0 0 1 4 3 4COS32A8 0 0 1 2 2 3 1 0 0 1 4 3 4INSa 0 0 0 0 0 0 1 0 0 0 0 0 0INSb 0 0 0 0 0 0 1 0 0 0 0 0 0THa 0 0 2 2 2 2 1 0 0 2 2 2 2THb 0 0 2 2 2 2 1 0 0 2 2 2 2D 11S1318 0 0 4 6 3 6 1 0 0 1 4 1 7c o s l l l a 0 0 1 1 1 3 1 0 0 2 3 1 2c o s l l l b 0 0 1 1 1 3 1 0 0 2 3 1 2D 11S454 0 0 1 3 3 3 1 0 0 2 3 3 3HBB 0 0 0 0 0 0 1
10 0 3 4 0 0
+ -1- + +
1+ + -
I- +
1 1+
1+ + -
1- + + — + f - - +
1 1+ — — +
31 1 4 1 1 51 1 6 1 1 71 1 81 1 91 110 1 1111 112 1 1131 114 1 1151 1161 1171+ - - + + + + - - + --- H + + - - + + - - + t - - + + - - - + + - - + f - - - + - - + — - +
D 11S2071 3 3 3 3 1 3 1 3 3 3 1 3 3 3 1 3 1 3 1 1 1 3 1 3 3 3 1 1 1 1HRAS 1 |6 1 6 2 6 2 6 1 6 1 3 1 6 1 3 1 3 2 3 1 3 1 3 1 6 1 6 2 3HRASl 1 6 1 6 2 6 2 6 1 6 1 3 1 6 1 3 1 3 2 3 1 3 1 3 1 6 1 6 2 3M a ce 1 1 1 2 1 1 1 1 1 2 1 2 1 2 1 2 1 2 1 1 1 2 1 2 1 2 1 2 1 1MUCSA 2 2 1 2 2 2 2 2 1 2 1 2 1 2 1 2 0 0 2 2 1 2 1 2 1 2 1 2 2 2MUCSB 2 2 1 2 2 2 2 2 1 2 1 2 1 2 1 2 1 2 2 2 1 2 1 2 1 2 1 2 2 2D 11S150 1 3 1 5 1 1 1 3 1 5 2 5 1 5 2 5 2 5 2 3 2 5 2 5 1 5 1 5 2 3MUC2 0 0 0 0 0 0 0 0 0 0 0 0 0 0 0 0 0 0 0 0 0 0 0 0 0 0 0 0 0 0MUC2new 1 2 1 2 1 2 1 2 1 2 1 1 1 2 1 1 1 1 1 1 1 1 1 1 1 2 1 2 1 1CEB41 1 4 2 4 1 4 1 4 2 4 1 2 2 4 1 2 1 2 1 1 0 0 1 2 2 4 2 4 1 1COS32A8 1 4 2 4 1 4 1 4 2 4 1 2 2 4 1 2 1 2 1 1 0 0 1 2 2 4 2 4 1 1INSa 0 0 0 0 0 0 0 0 0 0 0 0 0 0 0 0 0 0 0 0 0 0 0 0 0 0 0 0 0 0INSb 0 0 0 0 0 0 0 0 0 0 0 0 0 0 0 0 0 0 0 0 0 0 0 0 0 0 0 0 0 0THa 2 2 2 2 2 2 2 2 0 0 2 2 2 2 2 2 2 2 2 2 2 2 2 2 2 2 2 2 2 2THb 2 2 2 2 2 2 2 2 0 0 2 2 2 2 2 2 2 2 2 2 2 2 2 2 2 2 2 2 2 2D 11S1318 1 4 1 6 1 4 1 4 1 6 4 6 1 6 4 6 4 6 0 0 4 6 4l6l 1 6 1 6 4|_4jc o s l l l a 1 2 1 2 1 2 1 2 1 2 1 3 1 2 1 3 1 3 1 3 0 0 1 3 1 2 1 2 1 3c o s l l l b 1 2 1 2 1 2 1 2 1 2 1 3 1 2 1 3 1 3 1 3 0 0 1 3 1 2 1 2 1 3D 11S454 1 3 3 3 1 3 1 3 3 3 2 3 3 3 2 3 2 3 1 2 2 3 n i 2 3 3 3 3 2[3\HBB 3 4 2 4 3 4 3 4 2 4 2 3 2 4 0 0 0 0 0 0 0 0 0 0 0 0 0 0 0 0
211
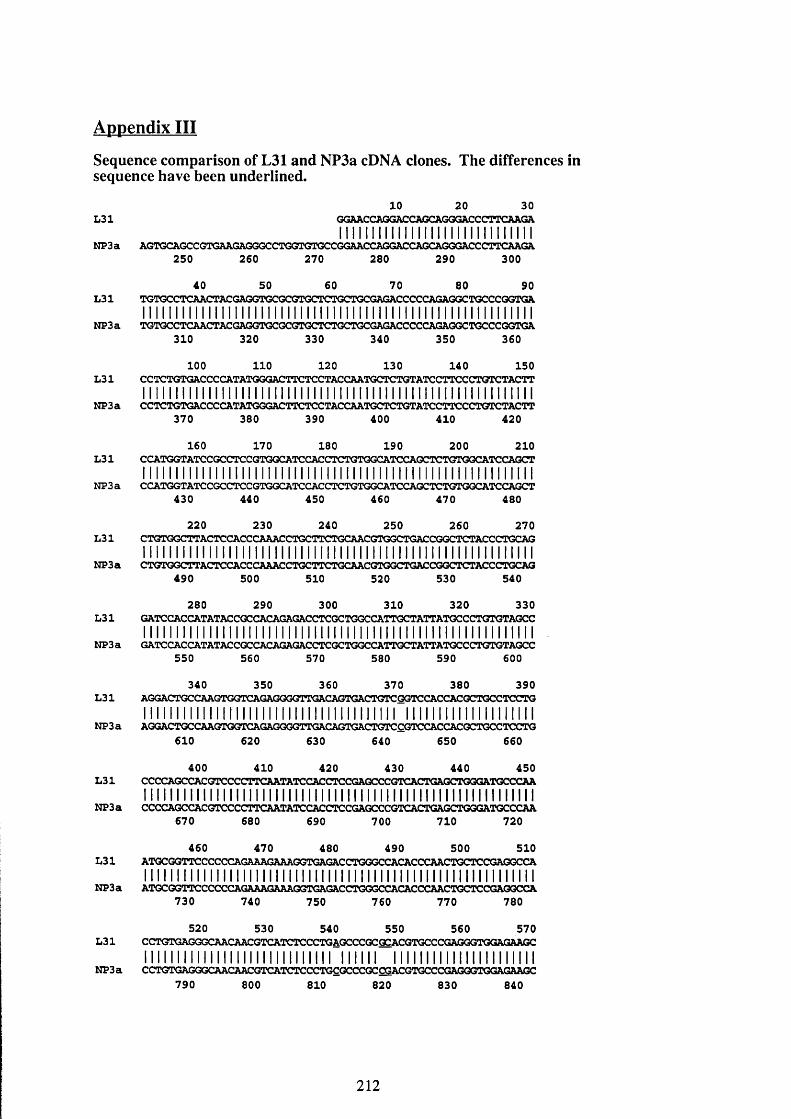
Appendix III
Sequence comparison of L31 and NP3a cDNA clones. The differences in sequence have been underlined.
10 20 30L31 GGAACCAGGACCAGCAGGGACCCTTCAAGA
M I I I I I I I I I I M I I I I I I I I I I I I I I I INP3a AGTGCAGCCGTGAAGAGGGCCTGGTGTGCCGGAACCAGGACCAGCAGGGACCCTTCAAGA
250 260 270 280 290 300
40 50 60 70 80 90L31 TGTGCCTCAACTACGAGGTGCGCGTGCTCTGCTGCGAGACCCCCAGAGGCTGCCCGGTGA
I I I I I I I I I I I I I I I I I I I I I I I I I I I I I I I I M M I I I I I I I I I I I I I I I I I I I i l l l lNP3a TGTGCCTCAACTACGAGGTGCGCGTGCTCTGCTGCGAGACCCœAGAGGCTGCCCGGTGA
310 320 330 340 350 360
100 110 120 130 140 150L31 CCTCTGTGACCCCATATGGGACTTCTCCTACCAATGCTCTGTATCCTTCCCTGTCTACTT
I I I I I M I I I I I I I I I I I I I I I I I I I I I I I I I I I I I I I I I I I I I I I I I I I I I I I I I I I I INP3 a CCTCTGTGACCCCATATGGGACTTCTCCTACCAATGCTCTGTATCCTTCCCTGTCTACTT
370 380 390 400 410 420
160 170 180 190 200 210L31 CCATGGTATCCGCCTCCGTGGCATCCACCTCTGTGGCATCCAGCTCTGTGGCATCCAGCT
M I I I I I I I I I I I I I M I I I I I I M M I I I I M I I I I M M I I I M I I I I I I I I I I I I MNP3a CCATGGTATCCGCCTCCGTGGCATCCACCTCTGTGGCATCCAGCTCTGTGGCATCCAGCT
430 440 450 460 470 480
220 230 240 250 260 270L31 CTGTGGCTTACTCCACCCAAACCTGCTTCTGCAACGTGGCTGACCGGCTCTACCCTGCAG
M M M M I M I M I I I I I I I I M I I I M I I M I I M I I M I M M M M I M M I M MNP3a CTGTGGCTTACTCCACCCAAACCTGCTTCTGCAACGTGGCTGACCGGCTCTACCCTGCAG
490 500 510 520 530 540
280 290 300 310 320 330L31 GATCCACCATATACCGCCACAGAGACCTCGCTGGCCATTGCTATTATGCCCTGTGTAGCC
I I I M I I I M I I I I I I M M M I I I I M I M M I I I I M I M I I I I I I I I I I I I I I I I I I -NP3 a GATCCACCATATACCGCCACAGAGACCTCGCTGGCCATTGCTATTATGCCCTGTGTAGCC
550 560 570 580 590 600
340 350 360 370 380 390L31 AGGACTGCCAAGTGGTCAGAGGGGTTGACAGTGACTGTCGGTCCACCACGCTGCCTCCTG
M I M I I I I M I M I M I M M I M I M I I M M M I M MIIIM1111II111M11NP3a AGGACTGCCAAGTGGTCAGAGGGGTTGACAGTGACTGTCÇGTCCACCACGCTGCCTCCTG
610 620 630 640 650 660
400 410 420 430 440 450L31 CCCCAGCCACGTCCCCrrCAATATCCACCTCCGAGCCCGTCACTGAGCTGGGATGCCCAA
M I M M M I M I M M M M M I M M I M I M M I M I I M M M I I M M M M I MNP3a CCCCAGCCACGTCCCCTTCAATATCCACCTCCGAGCCCGTCACTGAGCTGGGATGCCCAA
670 680 690 700 710 720
460 470 480 490 500 510L31 ATGCGGTTCCCCCCAGAAAGAAAGGTGAGACCTGGGCCACACCCAACTGCTCCGAGGCCA
l l l l l l l l l l l l l l l l l l l l l l l l l l l l l l l l l l l l l l l l l l l l l l l l l l l l l l l l l l l lNP3a ATGCGGTTCCCCœAGAAAGAAAGGTGAGACCTGGGCCACACCCAACTGCTCCGAGGCCA
730 740 750 760 770 780
520 530 540 550 560 570L31 CCTGTGAGGGCAACAACGTCATCTCCCTGAGCCCGCGÇACGTGCCCGAGGGTGGAGAAGC
i i i i i i i i i i i i i i i i i i i i i i i i i i i i i mil l i i i i i i i i i i i i i i i i i i i i i iNP3a CCTGTGAGGGCAACAACGTCATCTCCCTGÇGCCCGCÇSACGTGCCCGAGGGTGGAGAAGC
790 800 810 820 830 840
212
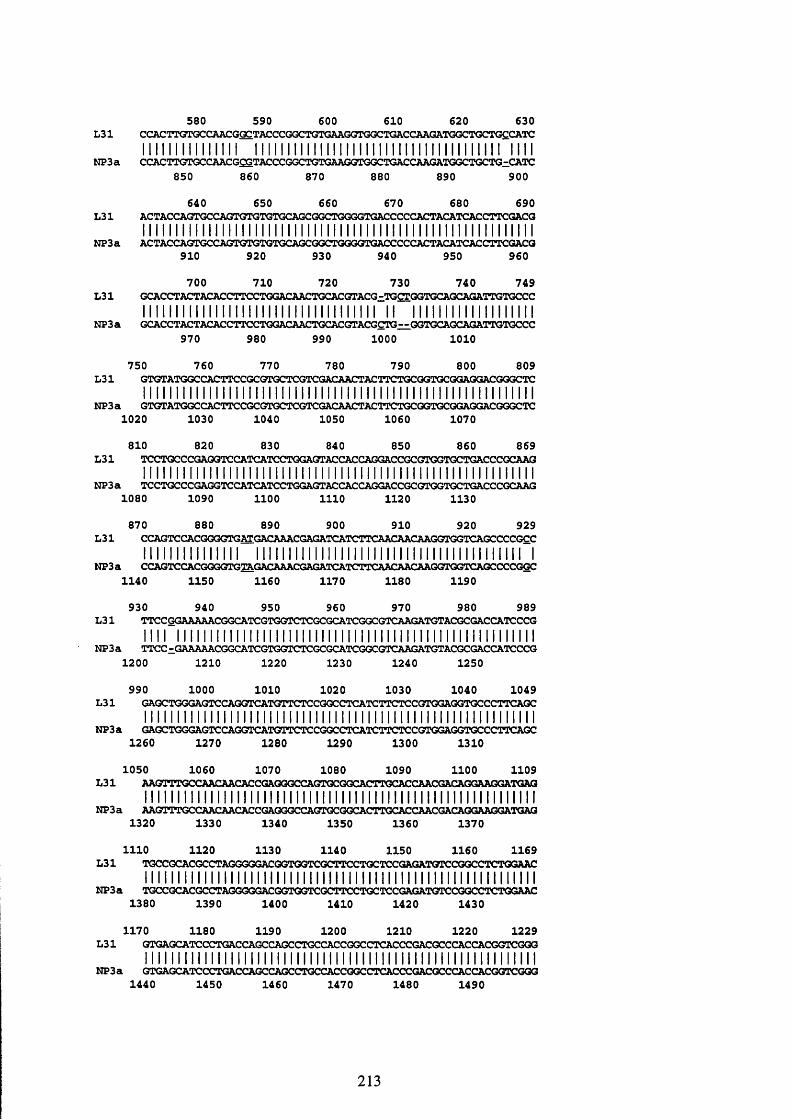
580 590 600 610 620 630LSI CCACTTGTGCCAACGGÇTACCCGGCTGTGAAGGTGGCTGACCAAGATGGCTGCTGÇCATC
I M I I I I I I I I I I I I I I I I I I I I M I I I I I I I I I I I I I I I I I I I I I I I I I I I I ININPSa CCACTTGTGCCAACGCGTACCCGGCTGTGAAGGTGGCTGACCAAGATGGCTGCTG-CATC
850 860 870 880 890 900
L31640
910
650 660 670 680
920 930 940 950
690ACTACCAGTGCCAGTGTGTGTGCAGCGGCTGGGGTGACCCCCACTACATCACCTTCGACG
I M I I I I I I I I I I I I I I I I I I I I I I I I I I I I I I I I I I I I I I I I INPSa ACTACCAGTGCCAGTGTGTGTGCAGCGGCTGGGGTGACCCCCACTACATCACCTTCGACG
960
700 710 720 730 740 749LSI GCACCTACTACACCTTCCTGGACAACTGCACGTACG-TGSGGTGCAGCAGATTGTGCCC
I I I M I I M I I I I I I I I I I I I I M I I I I I M I I I I I II l l l l l l l l l l l l l l l l l l lNPSa GCACCTACTACACCTTCCTGGACAACTGCACGTACGCTG— GGTGCAGCAGATTGTGCCC
970 980 990 1000 1010
750LSI
1020
760 770 780 790 800 809GTGTATGGCCACTTCCGCGTGCTCGTCGACAACTACTTCTGCGGTGCGGAGGACGGGCTC
l l l l l l l l l l l l l l l l l l l l l l l l l l l m i l l i i i i i i i i i i i i i iNPSa GTGTATGGCCACTTCCGCGTGCTCGTCGACAACTACTTCTGCGGTGCGGAGGACGGGCTC
1030 1040 1050 1060 1070
810LSI
1080
820 830 840 850 860 869TCCTGCCCGAGGTCCATCATCCTGGAGTACCACCAGGACCGCGTGGTGCTGACCCGCAAG
IINPSa TCCTGCCCGAGGTCCATCATCCTGGAGTACCACCAGGACCGCGTGGTGCTGACCCGCAAG
1090 1100 1110 1120 1130
870 880 890 900 910 920 929LSI CCAGTCCACGGGGTGMGACAAACGAGATCATCTTCAACAACAAGGTGGTCAGCCCCGCC
MI MMI MMMI l l l l l l l l l l l l l l l l l l l l l l l l l l l l l l l l l l l l l l l l l INPSa CCAGTCCACGGGGTGTAGACAAACGAGATCATCTTCAACAACAAGGTGGTCAGCCCCGGC
1140 1150 1160 1170 1180 1190
930 940 950 960 970 980 989LSI TTCCGGAAAAACGGCATCGTGGTCTCGCGCATCGGCGTCAAGATGTACGCGACCATCCCG
n i l l l l l l l l l l l l l l l l l l l l l l l l l l l l l l l l l l l l l l l l l l l l l l l l l l l l l l l lNPSa TTCC -GAAAAACGGCATCGTGGTCTCGCGCATCGGCGTCAAGATGTACGCGACCATCCCG
1200 1210 1220 1230 1240 1250
990LSI
1000 1010 1020 1030 1040 1049GAGCTGGGAGTCCAGGTCATGTTCTCCGGCCTCATCTTCTCCGTGGAGGTGCCCTTCAGC
l l l l l l l l l l l l l l l l l l l l l l l l l l l l l l Mi lNPSa GAGCTGGGAGTCCAGGTCATGTTCTCCGGCCTCATCTTCTCCGTGGAGGTGCCCTTCAGC
1260 1270 1280 1290 1300 1310
1050 1060 1070 1080 1090 1100 1109LSI AAGTTTGœAACAACACCGAGGGCCAGTGCGGCACTTGCACCAACGACAGGAAGGATGAG
l l l l l l l l l l l l l l l l l l l l l l l l l l l l l l l l l l l l l l l l l l l l l l l l l l l l l l l l l l l lNPSa AAGTTTGCCAACAACACCGAGGGCCAGTGCGGCACTTGCACCAACGACAGGAAGGATGAG
1320 1330 1340 1350 1360 1370
1110 1120 1130 1140 1150 1160 1169LSI TGCCGCAOXÎCTAGGGGGACGGTGGTCGCTTCCTGCTCCGAGATGTCCGGCCTCTGGAAC
l l l l l l l l l l l l l l l l l l l l l l l l l l l l l l l l l l l l l l l l l l l l l l l l l l l l l l l l l l l lNPSa TGCCGCACGCCTAGGGGGACGGTGGTCGCTTCCTGCTCCGAGATGTCCGGCCTCTGGAAC
1380 1390 1400 1410 1420 1430
1170 1180 1190 1200 1210 1220 1229LSI GTGAGCATCCCTGACCAGCCAGCCTGCCACCGGCCTCACCCGACGCCCACCACGGTCGGG
l l l l l l l l l l l l l l l l l l l l l l l l l l l l l l l l l l l l l l l l l l l l l l l l l l l l l l l l l l l lNPSa GTGAGO TCCCTGACCAGCCAGCCTGCCACCGGCCTCACCCGACGCCCACCACGGTCGGG
1440 1450 1460 1470 1480 1490
213
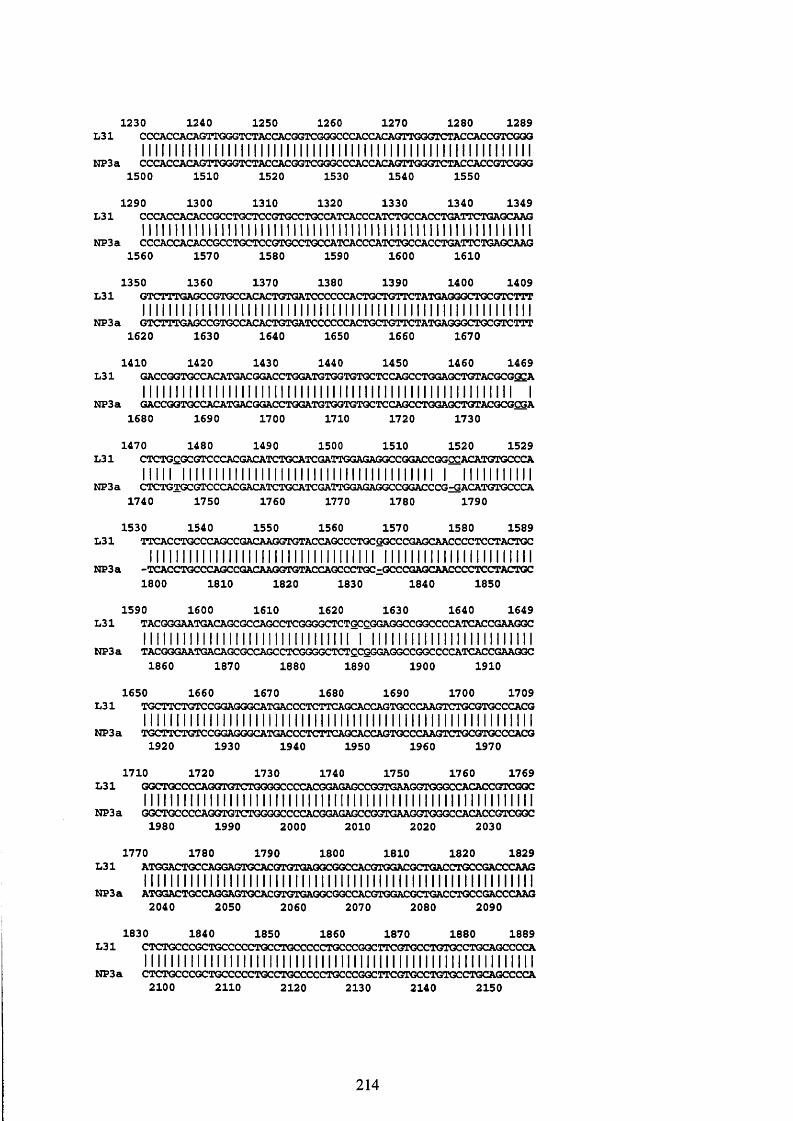
1230 1240 1250 1260 1270 1280
1500 1510 1520 1530 1540 1550
1289L31 CCCACCACAGTTGGGTCTACCACGGTCGGGCCCACCACAGTTGGGTCTACCACCGTCGQG
I I I I I I I I I I M I I I I I I I I I I I I I I I I I I I I I I I I I I I I I I I I I I I I I I I I I I I I I I I INP3a CCCACCACAGTTGGGTCTACCACGGTCGGGCCCACCACAGTTGGGTCTACCACCGTCGGG
L311290 1300 1310 1320 1330 1340 1349
CCCACCACACCGCCTGCTCCGTGCCTGCCATCACCCATCTGCCACCTGATTCTGAGCAAG
NP3a CCCACCACACCGCCTGCTCCGTGCCTGCCATCACCCATCTGCCACCTGATTCTGAGCAAG 1560 1570 1580 1590 1600 1610
1350L31
1360 1370 1380 1390 1400
l l l l l l l1620 1630 1640 1650 1660 1670
1409GTCTTTGAGCCGTGCCACACTGTGATCCCCCCACTGCTGTTCTATGAGGGCTGCGTCTTT
l l l l l l l l l l l l l l l l l l l l l l l l l l l l l l l l l l l l l l l l l l l lNP3a GTCTTTGAGCCGTGCCACACTGTGATCCCCCCACTGCTGTTCTATGAGGGCTGCGTCTTT
1410 1420 1430 1440 1450 1460 1469L31 GACCGGTGCCACATGACGGACCTGGATGTGGTGTGCTCCAGCCTGGAGCTGTACGCGGÇA
I I I I I I I I I I M I I I I I I I I I I I I I I I I I I M I I I I I I I I I I I I I I I I I I I I I I I I I INP3a GAœGGTGCCACATGACGGACCTGGATGTGGTGTGCTCCAGCCTGGAGCTGTACGCGÇGA
1680 1690 1700 1710 1720 1730
1470 1480 1490 1500 1510 1520 1529L31 CTCTGÇGCGTCCCACGACATCTGCATCGATTGGAGAGGCCGGACCGGOÇACATGTGCCCA
Mi l l l l l l l l l l l l l l l l l l l l l l l l l l l l l l l l l l l l l l l l l I l l l l l l l l l l lNP3a CTCTGTGCGTCCCACGACATCTGCATCGATTGGAGAGGCCGGACCCGdGACATGTGCCCA
1740 1750 1760 1770 1780 1790
1530 1540 1550 1560 1570 1580 1589L31 TTCACCTGCCCAGCCGACAAGGTGTACCAGCCCTGCGGCCCGAGCAACCCCTCCTACTGC
l l l l l l l l l l l l l l l l l l l l l l l l l l l l l l l l l l l l l l l l l l l l l l l l l l l l l l l l l lNP3a -TCACCTGCCCAGCCGACAAGGTGTACCAGCCCTGC-GCCCGAGCAACCCCTCCTACTGC
1800 1810 1820 1830 1840 1850
1590 1600 1610 1620 1630 1640 1649L31 TACGGGAATGACAGCGCCAGCCTCGGGGCTCTGCCGGAGGCCGGCCCCATCACCGAAGGC
l l l l l l l l l l l l l l l l l l l l l l l l l l l l l l l l I l l l l l l l l l l l l l l l l l l l l l l l l lNP3a TACGGGAATGACAGCGCCAGCCTCGGGGCTCT£CGGGAGGCCGGCCCCATCACCGAAGGC
1860 1870 1880 1890 1900 1910
1650 1660 1670 1680 1690 1700 1709L31 TGCTTCTGTCCGGAGGGCATGACCCTCTTCAGCACCAGTGCCCAAGTCTGCGTGCCCACG
l l l l l l l l l l l l l l l l l l l l l l l l l l l l l l l l l l l l l l l l l l l l l l l l l l l l l l l l l l l lNP3a TGCTTCTGTCCGGAGGGCATGACCCTCTTCAGCACCAGTGCCCAAGTCTGCGTGCCCACG
1920 1930 1940 1950 1960 1970
1710 1720 1730 1740 1750 1760 1769L31 GGCTGCCCCAGGTGTCTGGGGCCCCACGGA6AGCCGGTGAAGGTGGGCCACACCGTCGGC
l l l l l l l l l l l l l l l l l l l l l l l l l l l l l l l l l l l l l l l l l l l l l l l l l l l l l l l l l l l lNP3a GGCTGCCCCAGGTGTCTGGGGCCCCACGGAGAGCCGGTGAAGGTGGGCCACACCGTCGGC
1980 1990 2000 2010 2020 2030
1770 1780 1790 1800 1810 1820 1829L31 ATGGACTGCCAGGAGTGCACGTGTGAGGCGGCCACGTGGACGCTGACCTGCCGACCCAAG
M M M I I M I I M I M M I I M M M I M I M I I M M M M M I I M M I M M M MNP3a ATGGACTGCCAGGAGTGCACGTGTGAGGCGGCCACGTGGACGCTGACCTGCCGACCCAAG
2040 2050 2060 2070 2080 2090
1830 1840 1850 1860 1870 1880 1889L31 CTCTGCCCGCTGCCCCCTQCCTGCCCCCTGCCCGGCTTCGTGCCTGTGCCTGCAGCCCCA
l l l l l l l l l l l l l l l l l l l l l l l l l l l l l l l l l l l l l l l l l l l l l l l l l l l l l l l l l l l lNP3a CTCTGCCCGCTGCCCCCTQCCTGCCCCCTGCCCGGCTTCGTGCCTGTGCCTGCAGCCCCA
2100 2110 2120 2130 2140 2150
214

1890 1900 1910 1920 1930 1940 1949L31 CAGGCCGGCCAGTGCTGCCCCCAGTACAGCTQCGCCTGCAACACCAGœGCTQCCCCGCG
11 Ni l 1111 U l l l l I M i l l I Ml II11 Ml I I I I N i l 111 Mi l l 11 Mi l l 11UNP3a CAGGCCGGCCAGTGCTGCœCCAGTACAQCTQCGCCTGCAACACCAGCCGCTGCCCCGCG
2160 2170 2180 2190 2200 2210
1950 1960 1970 1980 1990 2000 2009L31 CCCGTGGGÇTGTCCTGAGGGCGCCCGCGÇGATCCCGACCTACCAGGAGGGGGCCTGCTGC
11II11 I 11II1111II1111 III I I I I I I I I I I I I I M I I I I I I I I I I I I I I I I INP3a CCCGTGCGGTGTCCTGAGGGCGCCCGCCGGATCCCGACCTACCAGGAGGGQGCCTGCTGC
2220 2230 2240 2250 2260 2270
2010 2020 2030 2040 2050 2060 2069L31 CCAGTCCAAAACTGCAGCTGGACAGTGTGCAGCATCAACGGGACCCTGTACCAGCCCGGC
I I I I I I I I I I I I I I I I I M I I I I I I I I I I I I I I I I I I I I M I I I I I I I I I I I I I I I I I I INP3a CCAGTCCAAAACTGCAGCTGGACAGTGTGCAGCATCAACGGGACCCTGTACCAGCCCGGC
2280 2290 2300 2310 2320 2330
2070 2080 2090 2100 2110 2120 2129L31 GCCGTGGTCTCCTCGAGCCTGTGCGAAACCTGCAGGTGTGAGCTGCCGGGTGOCCCCCCA
Mi l l I N i l II Ml II I N i l II N i l 11 Ni l II M i l l I M i l l I N i l 11 N i l IINP3a GCCGTGGTCTCCTCGAGCCTGTGCGAAACCTGCAGGTGTGAGCTGCCGGGTGGCCœCCA
2340 2350 2360 2370 2380 2390
2130 2140 2150 2160 2170 2180 2189L31 TCGGACGCGTTTGTGGTCAGCTGTGAGACCCAGATCTGCAACACACACTGCCCTGTGGGÇ
U l l l l 11 Ni l I I I U l l l l 11 Mi l l I Mi l l 11 Ml II11 U l l l l 11 Ml I I I INP3a TCGGACGCGTTTGTGGTCAGCTGTGAGACCCAGATCTGCAACACACACTGCCCTGTGÇGG
2400 2410 2420 2430 2440 2450
2190 2200 2210 2220 2230 2240 2249L31 TTCGAGTACCAGGAQCAGAGÇGGGCAGTQCTGTGGCACCTGTGTGCAGGTCGœTGTGTC
l l l l l l l l l l l l i l l l l l l l I II11 Mi l l 11 Mi l l 11 Mi l l 11 N i l I I I M i l lNP3a TTCGAGTACCAGGAGCAGA8-GCGCAGTGCTGT0GCACCTC?rGTGCAGGTCGCCTGTGTC
2460 2470 2480 2490 2500 2510
2250 2260 2270 2280 2290 2300L31 ACCAACACCAGCAAGAGCCCCGCCCACCTCTTCTACCCTGGCGAG^ACCTGGTCAGACGC
11 U l l l l 11 Mi l l 11 Mi l l 11 Mi l l ! I U l l l 11 N i l I I I I Mi l l I M i l l 11NP3a ACCAACACCAGCAAGAGCCCCGCCCACCTCTTCTACCCTGGCGAGÇACCTGGTCAGACGC
2520 2530 2540 2550 2560 2570
2310 2320 2330 2340 2350 2360L31 AGGGAACCACTGTGTGACCCACCAGTGTGAGAAGCACCAGGATGGGCTCGTGGTGGTCAC
l l l l l l l l l l l l l l l l l l l l l l l l l l l l l l l l l l l l l l l l l l l l l l l l l l l l l l l l l l l lNP3a AGGGAACCACTGTGTGACCCACCAGTGTGAGAAGCACCAGGATGGGCTCGTGGTGGTCAC
2580 2590 2600 2610 2620 2630
2370 2380 2390 2400 2410 2420L31 CACGAAGAAGGCGTGCCCCCCGCTCAGCTGTTCTCTGGACGAOGCCCGCATGAGCAAGGA
l l l l l l l l l l l l l l l l l l l l l l l l l l l l l l l l l l l l l l l l l l l l l l l l l l l l l l l l l l l lNP3a CACGAAGAAGGCGTGCCCCCCGCTCAGCTGTTCTCTGGACGAGGCCCGCATGAGCAAGGA
2640 2650 2660 2670 2680 2690
2430 2440 2450 2460 2470 2480L31 CGGCTGCTGCCGCTTCTGCCCGCTGCCCCCGCCCCCGTACCAGAACCAGTCGACCTGTQC
III111 U l l l 111 U l l l 11 U l l l 11 U l l l I Ni l 1111 U l l l 11 U l l l l I U l lNP3a CGGCTGCTGCCGCITCTGCCCX3CTGCCX:CCGCCCCX:GTACCAGAACCAGTCGACCTGTQC
2700 2710 2720 2730 2740 2750
2490 2500 2510 2520 2530 2540L31 TGTGTACCATAGGAGCCTGATCATCCAGCAGCAGGGCTGÇAGCTCCTCGGAGCCCQTGCG
I I I I I I II I I I I II I I I II I I I II I I I I I I I I I II I I I l l l l l l l l l l l l l l l l l l l lNP3a TGTGTACCATAGGAGCCTGATCATCCAGCAGCAGGGCTeGAGCTCCTCGGAGCCCGTGCG
2760 2770 2780 2790 2800 2810
215
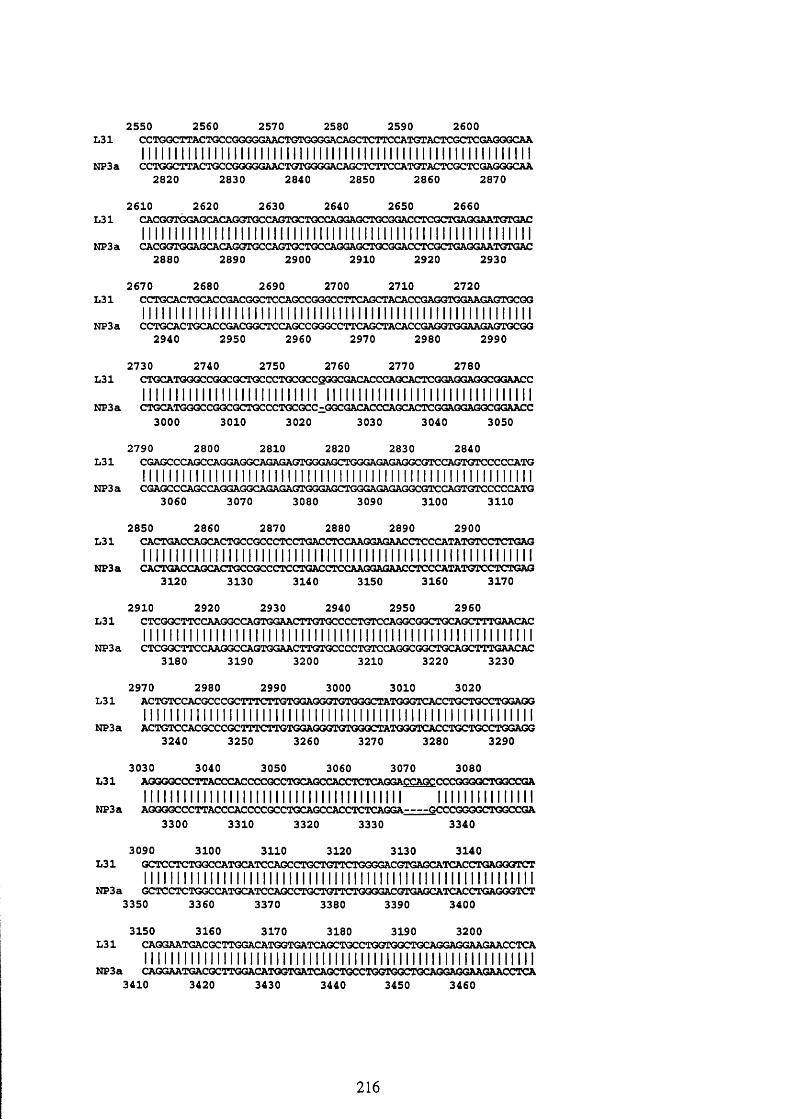
2550 2560 2570 2580 2590 2600L31 CCTGGCTTACTGCCGGGGGAACTGTGGGCACAGCTCTTCCATGTACTCGCTCGAGOGCAA
Il II 111 Ul l I I I HI II11 U l l l I U l l l I U l l l l Ml II11 Ml III11 U l l l INP3a CCTGGCTTACTGCCGGGGGAACTGTGGGGACAGCTCTTCCATGTACTCGCTCGAGGGCAA
2820 2830 2840 2850 2860 2870
2610 2620 2630 2640 2650 2660L31 CACGGTGGAGCACAGGTGCCAGTGCTOCCAGGAGCTGCGGACCTCGCTGAOGAATGTGAC
11II11 Ml I I I I U l l I I I U l l l 11 U l l l I U l l l Ml III11 U l l l 11 U l l l 11NP3a CACGGTGGAGCACAGGTGCCAGTGCTGCCAGGAGCTGCGGACCTCGCTGAGGAATGTGAC
2880 2890 2900 2910 2920 2930
2670 2680 2690 2700 2710 2720L31 CCTGCACTGCACCGACGGCTCCAGCCGGGCCTTCAGCTACACCGAGGTGGAAGAGTGCGG
11II11 Ml I II I U l l 111 H i l l 11 U l l l I U l l l I U l l l 11 U l l l 11 U l l l 11NP3a CCTGCACTGCACCGACGGCTCCAGCCGGGCCTTCAGCTACACCGAGGTGGAAGAGTGCGG
2940 2950 2960 2970 2980 2990
2730 2740 2750 2760 2770 2780L31 CTGCATGGGCCGOCGCTOCCCTOCOCCOGGCGACACCCAGCACTCGGAGGAGOCGGAACC
11111111II11111111II1111III U l l l I Ml III I U l l l I Ml II111 H i l lNP3a CTGCATGGGCCGOCGCTOCCCTGCGCC-GGCGACACCCAGCACTCGGAGGAGGCGGAACC
3000 3010 3020 3030 3040 3050
L312790 2800 2810 2820 2830 2840
CGAGCCCAGCCAGGAGGCAGAGAGTGGGAGCTGGGAGAGAGGCGTCCAGTGTCCCCCATGII
NP3a CGAGCCCAGCCAGGAGGCAGAGAGTGGGAGCTGGGAGAGAGGCGTCCAGTGTCCCCCATG 3060 3070 3080 3090 3100 3110
2850 2860 2870 2880 2890 2900L31 CACTGACCAGCACTGCCGCCCTCCTGACCTCCAAGGAGAACCTCCCATATGTCCTCTGAG
Ul l 1111 U l l l 11UIII11 U l l l I U l l l 11 Ul l 11 U l l l 11 U l l l 11 U l l lNP3a CACTGACCAGCACTGCCGCCCTCCTGACCTCCAAGGAGAACCTCCCATATGTCCTCTGAO
3120 3130 3140 3150 3160 3170
2910 2920 2930 2940 2950 2960L31 CTCGGCTTCCAAGGCCAGTGGAACrTGTGCCCCTGTCCAGGCGGCTGCAGCTTTGAACAC
U l l l l 11 U l l l l I U l l l 11 U l l l I U l l l I Ul l I II U l l l I U l l l l l I U l l lNP3a CTCGGCTTCCAAGGCCAGTGGAACTTGTGCCCCTGTCCAGGCGGCTGCAGCTTTGAACAC
3180 3190 3200 3210 3220 3230
2970 2980 2990 3000 3010 3020L31 ACTGTCCACGCCCGCTTTCTTGTGGAGGGTGTGGGCTATGGGTCACCTGCTGCCTGGAGG
U l l l l 11 U l l l 11 U l l l 11 U l l l I U l l l l U l l l 11 U l l l I U l l l l 11 U l l lNP3a ACTGTCCACGCCCGCTTTCTTGTGGAGGGTGTGGGCTATGGGTCACCTGCTGCCTGGAGG
3240 3250 3260 3270 3280 3290
3030 3040 3050 3060 3070 3080L31 AGGGGCCXn^ACCCACCCCGCCTGCAGCCACCTCTCAQGACCAGCCCCGGGGCTGGCCGA
I I I I U l l l l U l l l l I U l l l I U l l l l U l l l I U l l l I I I I U l l l l I U l lNP3a AGGGGCCCTTACCCACCCCGCCTGCAGCCACCTCTCAGGA GCCCGGGGCTGGCCGA
3300 3310 3320 3330 3340
3090 3100 3110 3120 3130L31
II l l l l l l l l l l l l l l l l l l l l
3350 3360 3370 3380 3390
3140GCTCCTCTGGCCATGO TCXJVCX:CIGCTGTTCTGGGGACGTGAGCATCACCTGAGGGTCT
I I II I I I I II I I I I II I I I I II INP3a GCTCCTCTGGCCATGCATCCAGCCTGCTGTTCTGGGGACGTGAGCATCACCTGAGGGTCT
3400
3150 3160 3170 3180 3190
3410 3420 3430 3440 3450
3200L31 CAGGAATGACGCTTGGACATGGTGATCAGCTGCCTGGTGGCTGCAGGAGGAAGAACCTCA
U l l l l 11 U l l l 11 U l l l 11 U l l l I U l l l l I U l l l U l l l l I U l l l l 11 U l l lNP3a CAGGAATGACGCTTGGACATGGTGATCAGCTGCCTGGTGGCTGCAGGAGGAAGAACCTCA
3460
216
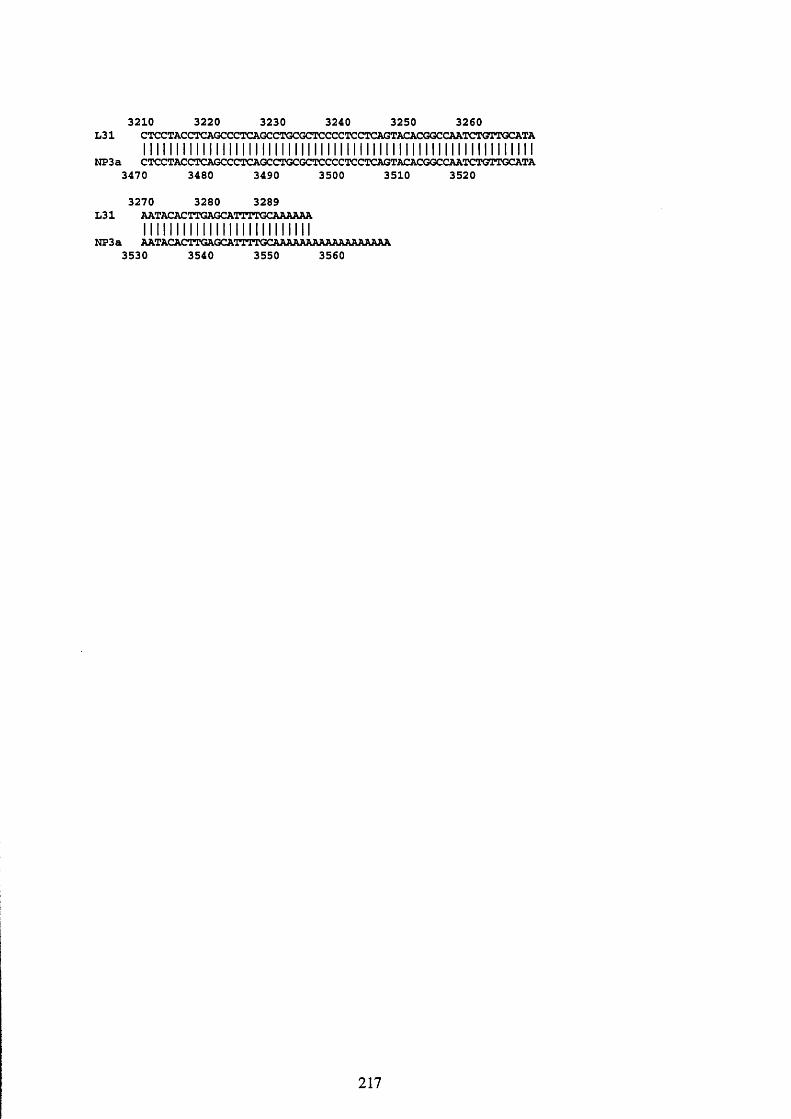
3210 3220 3230 3240 3250 3260L31 CTCCTACCTCAGCCCTCAGCCTGCGCTCCCCTCCTCAGTACACGGCCAATCTGTTGCATA
Il I U l l l l 11 U l l l 11 U l l l I U l l l l I U l l l l I U l l l I U l l l l I U l l l l I uNP3a CTCCTACCTCAGCCCTCAGCCTGCGCTCCCCTCCTCAGTACACGGCCAATCTGTTGCATA
3470 3480 3490 3500 3510 3520
3270 3280 3289L31 AATACACTTGAGCATTTTGCAAAAAA
l l l l l l l l l l l l l l l l l l l l l l l l l lNP3a AATACACTTGAGCATTTTGCAAAAAAAAAAAAAAAAAA
3530 3540 3550 3560
217
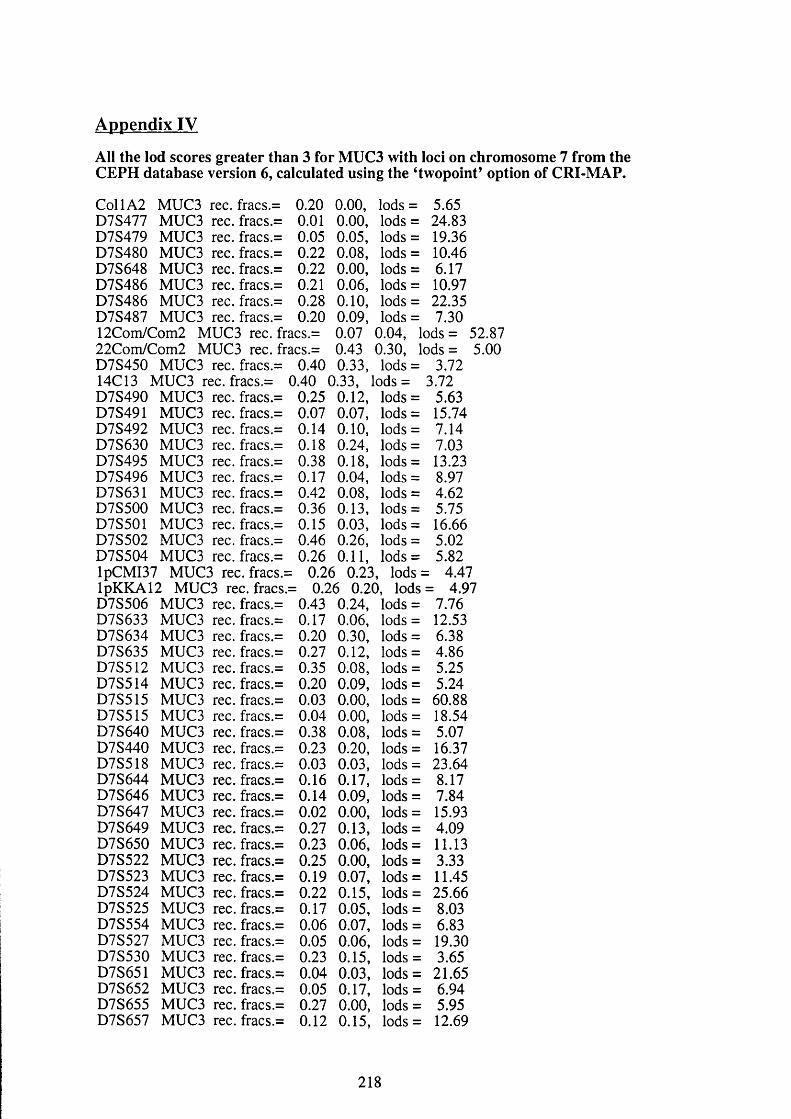
Appendix IV
All the lod scores greater than 3 for MUC3 with loci on chromosome 7 from the CEPH database version 6, calculated using the ‘twopoint’ option of CRI-MAP.
CoIlA2 D7S477 D7S479 D7S480 D7S648 D7S486 D7S486 D7S487 12Com/Com2 22Com/Com2
MUC3MUC3MUC3MUC3MUC3MUC3MUC3MUC3
rec. fracs.= rec. fracs.= rec. fracs.= rec. fracs.= rec. fracs.= rec. fracs.= rec. fracs.= rec. fracs.=
MUC3 MUC3
0.20 0.01 0.05 0.22 0.22 0.21 0.28 0.20
rec. fracs.= rec. fracs.=
D7S450 MUC3 rec. fracs.= 0.40 14C13 MUC3 rec. fracs.= 0.40
0.00,0 .00,0.05,0.08,0.00,0.06,0 . 10,0.09,0.070.430.33,
0.33,
lods = lods = lods = lods = lods = lods = lods = lods =
0.04, 0.30,
5.65 24.83 19.36 10.46 6.17 10.97 22.35 7.30
lods = lods =
52.875.00
lods = lods =
3.723.72
D7S490 MUC3 rec. fracs.= 0.25 0 .12 , lods = 5.63D7S491 MUC3 rec. fracs.= 0.07 0.07, lods = 15.74D7S492 MUC3 rec. fracs.= 0.14 0 .10 , lods = 7.14D7S630 MUC3 rec. fracs.= 0.18 0.24, lods = 7.03D7S495 MUC3 rec. fracs.= 0.38 0.18, lods = 13.23D7S496 MUC3 rec. fracs.= 0.17 0.04, lods = 8.97D7S631 MUC3 rec. fracs.= 0.42 0.08, lods = 4.62D7S500 MUC3 rec. fracs.= 0.36 0.13, lods = 5.75D7S501 MUC3 rec. fracs.= 0.15 0.03, lods = 16.66D7S502 MUC3 rec. fracs.= 0.46 0.26, lods = 5.02D7S504 MUC3 rec. fracs.= 0.26 0 .11 , lods = 5.82lpCMI37 MUC3 rec. fracs.= 0.26 0.23, lods := 4.47lpKKA12 MUC3 rec. fracs.= 0.26 0.20, lods = 4.97D7S506 MUC3 rec. fracs.= 0.43 0.24, lods = 7.76D7S633 MUC3 rec. fracs.= 0.17 0.06, lods = 12.53D7S634 MUC3 rec. fracs.= 0 .2 0 0.30, lods = &38D7S635 MUC3 rec. fracs.= 0.27 0 .12 , lods = 4.86D7S512 MUC3 rec. fracs.= 0.35 0.08, lods = 5.25D7S514 MUC3 rec. fracs.= 0 .2 0 0.09, lods = 5.24D7S515 MUC3 rec. fracs.= 0.03 0 .0 0 , lods = 60.88D7S515 MUC3 rec. fracs.= 0.04 0 .0 0 , lods = 18.54D7S640 MUC3 rec. fracs,= 0.38 0.08, lods = 5.07D7S440 MUC3 rec. fracs.= 0.23 0 .2 0 , lods = 16.37D7S518 MUC3 rec. fracs.= 0.03 0.03, lods = 23.64D7S644 MUC3 rec. fracs.= 0.16 0.17, lods = 8.17D7S646 MUC3 rec. fracs.= 0.14 0.09, lods = 7.84D7S647 MUC3 rec. fracs.= 0 .0 2 0 .0 0 , lods = 15.93D7S649 MUC3 rec. fracs.= 0.27 0.13, lods = 4.09D7S650 MUC3 rec. fracs.= 0.23 0.06, lods = 11.13D7S522 MUC3 rec. fracs.= 0.25 0 .0 0 , lods = 3.33D7S523 MUC3 rec. fracs.= 0.19 0.07, lods = 11.45D7S524 MUC3 rec. fracs.= 0 .2 2 0.15, lods = 25.66D7S525 MUC3 rec. fracs.= 0.17 0.05, lods = 8.03D7S554 MUC3 rec. fracs.= 0.06 0.07, lods = 6.83D7S527 MUC3 rec. fracs.= 0.05 0.06, lods = 19.30D7S530 MUC3 rec. fracs.= 0.23 0.15, lods = 3.65D7S651 MUC3 rec. fracs.= 0.04 0.03, lods = 21.65D7S652 MUC3 rec. fracs.= 0.05 0.17, lods = 6.94D7S655 MUC3 rec. fracs.= 0.27 0 .0 0 , lods = 5.95D7S657 MUC3 rec. fracs.= 0 .1 2 0.15, lods = 12.69
218

D7S658 MUC3 rec. fracs.= 0.04 0.04, lods = 11.66D7S660 MUC3 rec. fracs.= 0.19 0.21, lods = 3.34D7S662 MUC3 rec. fracs.= 0.02 0.04, lods = 16.57D7S666 MUC3 rec. fracs.= 0.02 0.04, lods = 16.85D7S669 MUC3 rec. fracs.= 0.23 0.31, lods = 3.93D7S461 MUC3 rec. fracs.= 0.28 0.14, lods = 16.87D7S675 MUC3 rec. fracs.= 0.21 0.13, lods = 6.45D7S466 MUC3 rec. fracs.= 0.23 0.11, lods = 32.792pCMI37 MUC3 rec. fracs.= 0.25 0.16, lods = 12.49GCK MUC3 rec. fracs.= 0.40 0.26, lods = 3.48D7S677 MUC3 rec. fracs.= 0.18 0.06, lods = 11.55D7S680 MUC3 rec. fracs.= 0.27 0.09, lods = 7.55D7S681 MUC3 rec. fracs.= 0.45 0.00, lods = 3.72D7S685 MUC3 rec. fracs.= 0.24 0.00, lods = 7.30D7S686 MUC3 rec. fracs.= 0.24 0.09, lods = 8.01D7S687 MUC3 rec. fracs.= 0.18 0.11, lods = 6.49D7S689 MUC3 rec. fracs.= 0.10 0.21, lods = 6.94D7S692 MUC3 rec. fracs.= 0.18 0.03, lods = 10.70EGFR MUC3 rec. fracs.= 0.39 0.23, lods = 7.13 3pCMI37 MUC3 rec. fracs.= 0.25 0.14, lods = 5.82A37 MUC3 rec. fracs.= 0.40 0.14, lods = 3.93D7S13 MUC3 rec. fracs.= 0.08 0.06, lods = 16.54BPGM MUC3 rec. fracs.= 0.27 0.19, lods = 5.08C33 MUC3 rec. fracs.= 0.38 0.09, lods = 4.89cos2209 MUC3 rec. fracs.= 0.27 0.24, lods = 3.47CEB24-Ha MUC3 rec. fracs.= 0.27 0.24, lods = 3.47COL1A2-1 MUC3 rec. fracs.= 0.11 0.00, lods = 21.62COL1A2-2 MUC3 rec. fracs.= 0.09 0.04, lods= 30.70CPAl MUC3 rec. fracs.= 0.24 0.13, lods = 7.78 CRI-L1033 MUC3 rec. fracs.= 0.26 0.17, lods = 3.92CRI-L1238 MUC3 rec. fracs.= 0.12 0.05, lods = 21.78D7S15 MUC3 rec. fracs.= 0.15 0.06, lods = 21.63CRI-L917 MUC3 rec. frac s. = 0.12 0.12, lods = 8.78CRI-L917 MUC3 rec. fracs.= 0.08 0.11, lods = 9.43CRI-S130 MUC3 rec. frac s. = 0.00 0.04, lods = 12.66D7S73 MUC3 rec. fracs.= 0.07 0.00, lods = 10.39CRI-S14 MUC3 rec. fracs.= 0.08 0.00, lods = 9.35D7S93 MUC3 rec. fracs.= 0.31 0.11, lods = 4.92CRI-S146 MUC3 rec. fracs.= 0.08 0.33, lods = 7.00D7S95 MUC3 rec. fracs.= 0.31 0.23, lods = 3.27CRI-S148 MUC3 rec. fracs.= 0.33 0.17, lods = 3.08CRI-S158 MUC3 rec. fracs.= 0.28 0.15, lods = 4.10D7S99 MUC3 rec. fracs.= 0.22 0.12, lods= 4.86CRI-S162 MUC3 rec. fracs.= 0.21 0.08, lods = 4.81D7S101 MUC3 rec. fracs.= 0.33 0.12, lods= 3.92CRI-S167 MUC3 rec. fracs.= 0.32 0.06, lods = 3.73CRI-S19 MUC3 rec. fracs.= 0.04 0.03, lods= 14.29D7S107 MUC3 rec. fracs.= 0.48 0.14, lods= 3.39CRI-S201 MUC3 rec. fracs.= 0.48 0.14, lods = 3.39D7S78 MUC3 rec. fracs.= 0.17 0.00, lods = 15.53CRI-S23 MUC3 rec. fracs.= 0.18 0.03, lods = 11.26D7S111 MUC3 rec. fracs.= 0.48 0.14, lods = 8.06CRI-S25 MUC3 rec. fracs.= 0.06 0.13, lods= 9.97CRI-S29 MUC3 rec. fracs.= 0.27 0.00, lods= 11.35CRI-S29 MUC3 rec. fracs.= 0.09 0.00, lods = 6.67D7S72 MUC3 rec. fracs.= 0.36 0.19, lods= 5.62CRI-S3 MUC3 rec. fracs.= 0.43 0.18, lods = 3.63CRI-S56 MUC3 rec. fracs.= 0.04 0.03, lods = 27.64
219
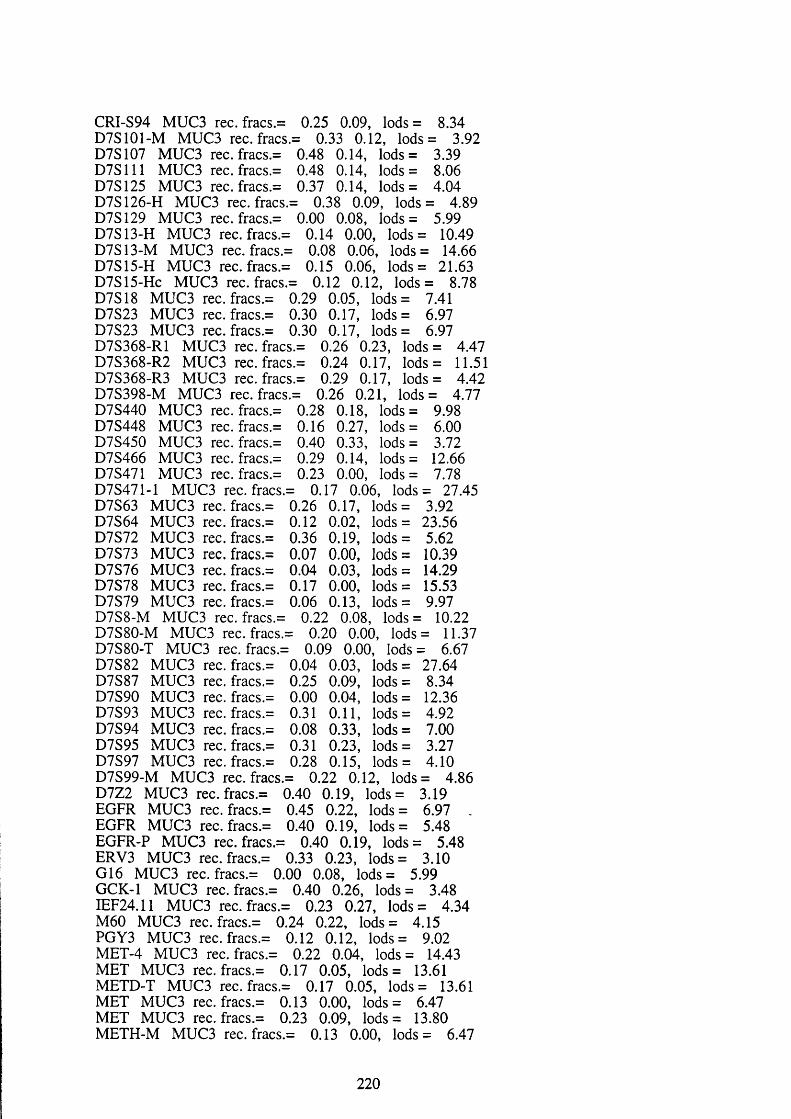
CRI-S94 MUC3 rec. fracs.= 0.25 0.09, lods = 8.34D7S101-M MUC3 rec. fracs.= 0.33 0.12, lods = 3.92D7S107 MUC3 rec. fracs.= 0.48 0.14, lods= 3.39D7S111 MUC3 rec. fracs.= 0.48 0.14, lods = 8.06D7S125 MUC3 rec. fracs.= 0.37 0.14, lods = 4.04D7S126-H MUC3 rec. fracs.= 0.38 0.09, lods = 4.89D7S129 MUC3 rec. fracs.= 0.00 0.08, lods = 5.99D7S13-H MUC3 rec. fracs.= 0.14 0.00, lods = 10.49D7S13-M MUC3 rec. fracs.= 0.08 0.06, lods = 14.66D7S15-H MUC3 rec. fracs.= 0.15 0.06, lods = 21.63D7S15-HC MUC3 rec. fracs.= 0.12 0.12, lods = 8.78D7S18 MUC3 rec. fracs.= 0.29 0.05, lods = 7.41D7S23 MUC3 rec. fracs.= 0.30 0.17, lods = 6.97D7S23 MUC3 rec. frac s. = 0.30 0.17, lods= 6.97D7S368-R1 MUC3 rec. fracs.= 0.26 0.23, lods = 4.47D7S368-R2 MUC3 rec. fracs.= 0.24 0.17, lods = 11.51D7S368-R3 MUC3 rec. fracs.= 0.29 0.17, lods = 4.42D7S398-M MUC3 rec. fracs.= 0.26 0.21, lods = 4.77D7S440 MUC3 rec. fracs.= 0.28 0.18, lods = 9.98D7S448 MUC3 rec. fracs.= 0.16 0.27, lods = 6.00D7S450 MUC3 rec. fracs.= 0.40 0.33, lods = 3.72D7S466 MUC3 rec. fracs.= 0.29 0.14, lods = 12.66D7S471 MUC3 rec. fracs.= 0.23 0.00, lods = 7.78D7S471-1 MUC3 rec. fracs.= 0.17 0.06, lods = 27.45D7S63 MUC3 rec. fracs.= 0.26 0.17, lods= 3.92D7S64 MUC3 rec. fracs.= 0.12 0.02, lods = 23.56D7S72 MUC3 rec. fracs.= 0.36 0.19, lods = 5.62D7S73 MUC3 rec. fracs.= 0.07 0.00, lods = 10.39D7S76 MUC3 rec. fracs.= 0.04 0.03, lods = 14.29D7S78 MUC3 rec. fracs.= 0.17 0.00, lods = 15.53D7S79 MUC3 rec. fracs.= 0.06 0.13, lods= 9.97D7S8-M MUC3 rec. fracs.= 0.22 0.08, lods = 10.22D7S80-M MUC3 rec. fracs.= 0.20 0.00, lods= 11.37D7S80-T MUC3 rec. fracs.= 0.09 0.00, lods = 6.67D7S82 MUC3 rec. fracs.= 0.04 0.03, lods = 27.64D7S87 MUC3 rec. frac s. = 0.25 0.09, lods = 8.34D7S90 MUC3 rec. fracs.= 0.00 0.04, lods = 12.36D7S93 MUC3 rec. fracs.= 0.31 0.11, lods = 4.92D7S94 MUC3 rec. fracs.= 0.08 0.33, lods = 7.00D7S95 MUC3 rec. fracs.= 0.31 0.23, lods = 3.27D7S97 MUC3 rec. fracs.= 0.28 0.15, lods = 4.10D7S99-M MUC3 rec. fracs.= 0.22 0.12, lods = 4.86D7Z2 MUC3 rec. fracs.= 0.40 0.19, lods = 3.19EGFR MUC3 rec. fracs.= 0.45 0.22, lods = 6.97EGFR MUC3 rec. fracs.= 0.40 0.19, lods = 5.48EGFR-P MUC3 rec. fracs.= 0.40 0.19, lods = 5.48ERV3 MUC3 rec. fracs.= 0.33 0.23, lods = 3.10G16 MUC3 rec. fracs.= 0.00 0.08, lods = 5.99GCK-1 MUC3 rec. fracs.= 0.40 0.26, lods = 3.48IEF24.11 MUC3 rec. fracs.= 0.23 0.27, lods= 4.34M60 MUC3 rec. fracs.= 0.24 0.22, lods = 4.15PGY3 MUC3 rec. fracs.= 0.12 0.12, lods= 9.02MET-4 MUC3 rec. fracs.= 0.22 0.04, lods = 14.43MET MUC3 rec. fracs.= 0.17 0.05, lods = 13.61METD-T MUC3 rec. fracs.= 0.17 0.05, lods = 13.61MET MUC3 rec. fracs.= 0.13 0.00, lods = 6.47MET MUC3 rec. fracs.= 0.23 0.09, lods = 13.80METH-M MUC3 rec. fracs.= 0.13 0.00, lods = 6.47
220
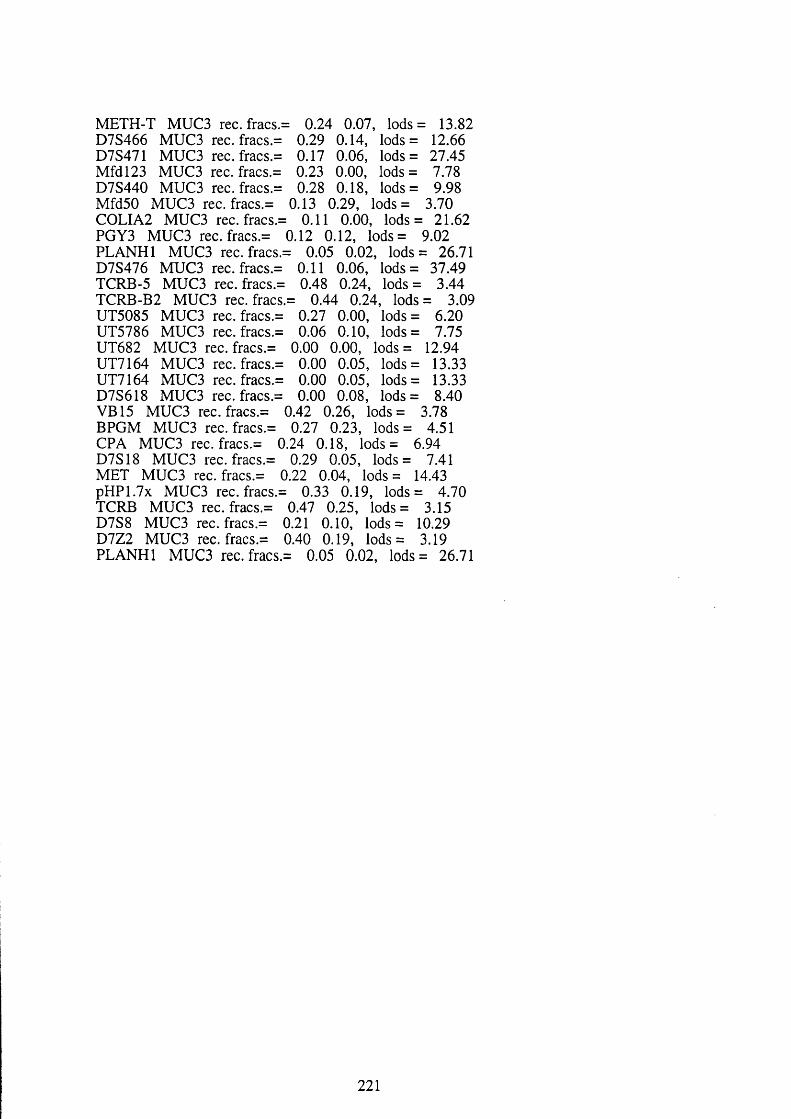
METH-T MUC3 rec. fracs.= 0.24 0.07, lods = 13.82D7S466 MUC3 rec. fracs.= 0.29 0.14, lods = 12.66D7S471 MUC3 rec. fracs.= 0.17 0.06, lods = 27.45M fdl23 MUC3 rec. fracs.= 0.23 0.00, lods = 7.78D7S440 MUC3 rec. fracs.= 0.28 0.18, lods= 9.98 Mfd50 MUC3 rec. fracs.= 0.13 0.29, lods = 3.70 C0LIA2 MUC3 rec. fracs.= 0.11 0.00, lods = 21.62PGY3 MUC3 rec. fracs.= 0.12 0.12, lods = 9.02 PLANHl MUC3 rec. fracs.= 0.05 0.02, lods = 26.71 D7S476 MUC3 rec. fracs.= 0.11 0.06, lods = 37.49TCRB-5 MUC3 rec. fracs.= 0.48 0.24, lods = 3.44TCRB-B2 MUC3 rec. fracs.= 0.44 0.24, lods = 3.09 UT5085 MUC3 rec. fracs.= 0.27 0.00, lods = 6.20UT5786 MUC3 rec. fracs.= 0.06 0.10, lods= 7.75UT682 MUC3 rec. fracs.= 0.00 0.00, lods = 12.94 UT7164 MUC3 rec. fracs.= 0.00 0.05, lods = 13.33UT7164 MUC3 rec. frac s. = 0.00 0.05, lods = 13.33D7S618 MUC3 rec. fracs.= 0.00 0.08, lods = 8.40VB15 MUC3 rec. fracs.= 0.42 0.26, lods = 3.78BPGM MUC3 rec. fracs.= 0.27 0.23, lods = 4.51CPA MUC3 rec. fracs.= 0.24 0.18, lods = 6.94 D7S18 MUC3 rec. frac s. = 0.29 0.05, lods = 7.41MET MUC3 rec. fracs.= 0.22 0.04, lods = 14.43 pHP1.7x MUC3 rec. fracs.= 0.33 0.19, lods = 4.70TCRB MUC3 rec. fracs.= 0.47 0.25, lods = 3.15D7S8 MUC3 rec. fracs.= 0.21 0.10, lods= 10.29 D7Z2 MUC3 rec. fracs.= 0.40 0.19, lods = 3.19 PLANHl MUC3 rec. fracs.= 0.05 0.02, lods = 26.71
221
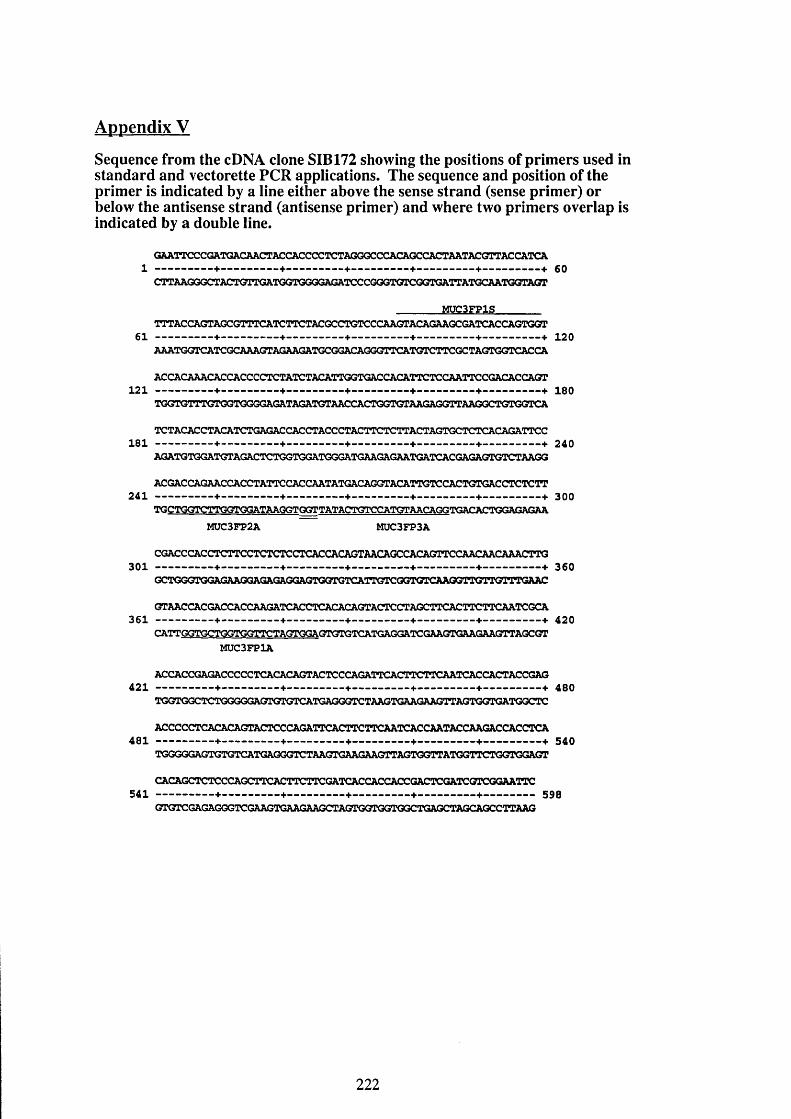
Appendix V
Sequence from the cDNA clone SIB 172 showing the positions of primers used in standard and vectorette PCR applications. The sequence and position of the primer is indicated by a line either above the sense strand (sense primer) or below the antisense strand (antisense primer) and where two primers overlap is indicated by a double line.
GAATTCCCGATGACAACTACCACCCCTCTAGGOCCXJICAGCCACTAATACGTTACCATCA1 + +— + + + + 60
CTTAAGGGCTACTGTTG2 TGGTGGGGAGATCCCGOGTGTCOGTGATTATGCAATGGTAOT
________ MUC3FP1S________TTTACCAGTAGCGTTTCATCTTCTACGCCTGTCCCAAGTACAGAAGCGATCACCAGTGGT
6 1 -----------------+--------------- +----------------- +----------------+----------------+---------------+ 120AAATGGTCATCGCAAAGTAGAAGATGCGGACAGGGTTCATGTCTTCGCTAGTGGTCACCA
ACCACAAACACCACCCCTCTATCTACATTGGTGACCACATTCTCCAATTCCGACACCAGT1 2 1 -----------------+--------------- +----------------- +----------------+----------------+---------------+ 180
TGGTGTTTGTGGTGGGGAGATAGATGTAACCACTGGTGTAAGAGGTTAAGGCTGTGGTCA
TCTACACCTACATCTGAGACCACCTACCCTACTTCTCTTACTAGTGCTCTCACAGATTCC1 8 1 -----------------+--------------- +.................. — +----------------+----------------+---------------+ 240
AGATGTGGATGTAGACTCTGGTGGATGGGATGAAGAGAATGATCACGAGAGTGTCTAAGG
ACGACCAGAACCACCTATTCCACCAATATGACAGGTACATTGTCCACTGTGACCTCTCTT241 ---------------- +---------------- +----------------- +----------------+----------------+---------------+ 300
TGCTGGTCTTGGTGGATAAGGTGGTTATACTGTCCATGTAACAGGTGACACTGGAGAGAAMÜC3FP2A MUC3FP3A
CGACCCACCTCTTCCTCTCTCCTCACCACAGTAACAGCCACAGTTCCAACAACAAACTTG301 ---------------- +-----------------+-----------------+----------------+-----------------+--------------+ 360
GCTGGGTGGAGAAGGAGAGAGGAGTGGTGTCATTGTCGGTGTCAAGGTTGTTGTTTGAAC
GTAACGACGACCACCyO^GATCAœrCACACAGTACTCCTAGCTTCACTTCTTCAATCGCA361 ----------------+-----------------+-----------------+----------------+-----------------+--------------+ 420
CATTGGTGCTGGTGGTTCTAGTGGAGTGTGTCATGAGGATCGAAGTGAAGAAGTTAGCGTMUC3FP1A
ACCACCGAGACCCCCTCACACAGTACTCCCAGATTCACTTCTTCAATCACCACTACCGAG421 ---------------- +-----------------+-----------------+----------------+-----------------+--------------+ 480
TGGTGGCTCTGGGGGAGTGTGTCATGAGGGTCTAAGTGAAGAAGTTAGTGGTGATGGCTC
ACCCCCKACACAGTACTCCCAGATTCACTTCTTCAATCACCAATACCAAGACCACCTCA481 ----------------+-----------------+-----------------+----------------+-----------------+--------------+ 540
TGGGGGAGTGTGTCATGAGGGTCTAAGTGAAGAAGTTAGTGGTTATGGTTCTGGTGGAGT
CACAGCTCTCCCAGCTTCACTTCTTCGATCACCACCACCGACTCGATCGTCGGAATTC541 ----------------+-----------------+-----------------+----------------+-----------------+------------- 598
GTGTCGAGAGGGTCGAAGTGAAGAAGCTAGTGGTGGTGGCTGAGCTAGCAGCCTTAAG
222

Appendix VI
Copies of the EUROGEM consortium and NIH/CEPH collaborative maps in
which the markers which are also included in the map presented in Figure 18
are underlined (1992; Weissenbach, Gyapay et al. 1992).
EUROGEM chromosome 7 map.
CRI S60-W^7S83
TCRG^TpIS
7 WÆRV3
CRI L1238 E07SW
pHOSe T/MET/7q31
CRl 1344 W/07SS6
0.07OOP0030.060120.010.000.06
0020.01
0.01 0.00 0 070.15
0030.010.06
0 0 4002
0.13
07SS31 AFU2S4rc9D7S517 AFM225a107S511 AFM210xc7D7S481 AFM049x«3D7SS13 AFM2l7yc5D7SS07 AA420O#«7D7S503 AFUlWtc3D7S488 AFWliarcIlD7S483 AFUl62xm7D7SS28 AFW24toJ1D7SS16 AFM224Kg5D7S526 AFU24&VC9D7S454 AFMOeTydllD7S4S7 AFWl77x110D7S528 AFU248y«5D7S4«S AFM095ie9D7S510 AFM207wb2D7S521 AFW240yWD7SS19 AFM238vb12D7S478 AFW032xa1D7S506 AFM200#c7D7S499 AFUl91xh6D7S494 AFWl65z14D7S520 AFU24(X?9D7S502 A FW 19^807S482 AFW070yclD7S489 AFWl36xe3D7SS24 AFM248U5D7S492 AFM158U1D7SS27 AFU248vdQD7S479 AFW036xp5D7S491 AFUISWIO
AFU248%5D7S51G AFW225ip9D7S515 AFM220xc11D7S501 AFM199/62D7S496 AFWl72xa1D7SS23 AFW242ve3
- D7S4Ô6 AFW098xo9- D7SS22 ApJl242yc3- 075480 AFMO42xh10- 075490 AFWlSOyg?- 075487 AFWl07vt)6- 075514 AFM218rllO
075504 AFWl99xh12- 075530 AFW249tf9
075512 AFM214yb2- 075500 AFUlOBzhS- 075509 AFW203wo1- 075495 AFUl68xc3- 075498 AFWl83ya3- 075505 AFMl99zd4- 075483 AFM074xoS- 075550 AFM224xh4
I
III
I
I
223
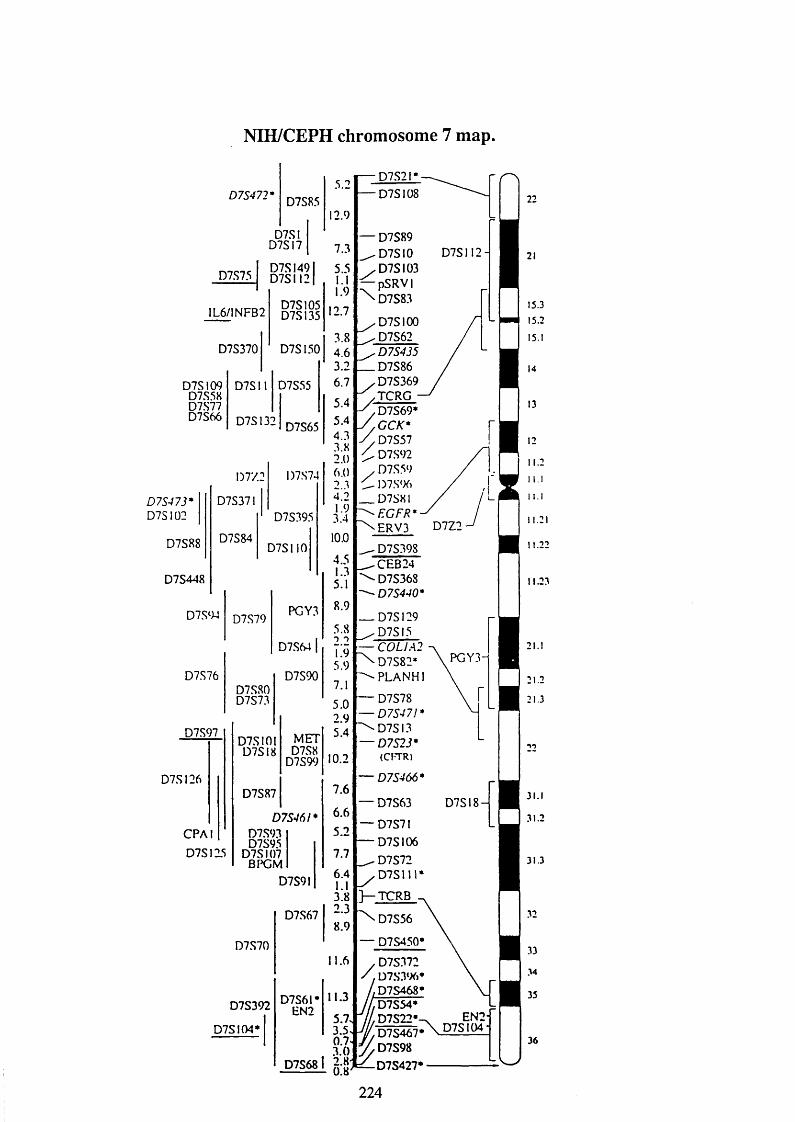
NIH/CEPH chromosome 7 map.
D7S472' D7S85
D7S75
1L6/1NFB2
D7S370
D7SID7SI7
D7SI49ID7SI12I
D7S105D7S135
D7S109D7S58D7S77D7S66
D7S150
D7S11 D7S55
D7S132
D7S473'D7S1Ü2
1)7%
D7S371
D7S88
D7S448
D7S‘)4
D7S76
D7S97
D7S84
D7S65
l)7S74
D7S395
D7SII0
D7S79
D7S80D7S73
D7SI26
CPAl D7SI2^
PGY3
D7SW I
D7S90
D7S10!D7SI8
D7S87
METD7S8
D7S99
D7S46!'D7S93D7S95
D7SI07BI>GM
D7S70
D7S392
D7SI04
D7S9I
D7S67
D7S6!'EN2
D7S68
5.2
12.9
7.35.5 1.1 1.9
12.7
3.84.63.26.75.45.44.33.8 2.0 6.0 2..14.21.93.410.0
4.51.35.1
8.9
5.8 2L95.97.15.02.95.4
10.2
7.6
6.65.2
7.76.41.13.82.38.9
11.6
11.3
5.73.5
i
— D7S2I— D7S108
— D7S89 ^ D 7 S 1 0
.D7SI03 ^pS R V I
\ D7S83
.D7SI00 ^ D7S62
^ D 7S 435 D7S86
D7S369 yTCRG
^D 7S69*y ^ G C K *y . D7S57 ^ D7S92
D7.S59 1)7.S%
D7S8IEGFR*
^ERV 3
— D7S63
— D7S71— D7SI06
D7S72D7S1I
D7S56
D7S112
D7Z2
D7S398CEB24D7S368D7S440*
D7S129D7S15C0UA2D7S82*PLANHl
D7S78D7S47I*D7S13D7S23*(CITR)
D7S466*
PGY3-
D7S18-
— D7S450*
y D7S372 / / D7S3‘X)
D7S468* y,,D7S54* /A D7S22*->
-'/y D7S467* ^D7S98 y D7S427*
EN2-D7S1Ü4-
21
15.1
14
13
12
11.2
1 1 . 2 1
11.22
11.23
2 1 . 1
31.3
32
33
34
224
References
Allen, A. (1984). Structure and Function of Gastrointestinal Mucus. Physiology of the Gastrointestinal Tract. Ed. J. R. Leonard. Pub. New York, Raven Press. 617-639.
Anand, R., Villasante, A. and TylerSmith, C. (1989). Construction of yeast artificial chromosome libraries with large inserts using fractionation by pulsed-field gel electrophoresis. Nucleic Acids Res. 17, 3425-3433.
Armour, J., Crosier, M. and Jeffreys, A. (1996). Distribution of tandem repeat polymorphism with minisatellite MS621 (D5S110). Ann. Hum. Genet. 60, 11-20.
Armour, J. A., Harris, P. C. and Jeffreys, A. J. (1993). Allelic diversity at minisatellite MS205 (D16S309): evidence for polarized variability. Hum. Mol. Genet .2 , 1137-45.
Asker, N., Baeckstrom, D., Axelsson, M. A. B., Carlstedt, I. and Hansson, G. C.(1995). The human MUC2 mucin apoprotein appears to dimerise before O- glycosylation and shares epitopes with the 'insoluble' mucin of rat small intestine. Biochem. J. 308, 873-880.
Attwood, J. and Povey, S. (1996). CROSSFIND; Software for detecting and displaying well-characterised meiotic breakpoints in human family data. Ann. Hum. Genet. In press,
Aubert, J. P., Porchet, N., Crepin, M., Duterque-Coquillaud, M., Vergnes, G., Mazzuca, M., Debuire, B., Petitprez, D. and Degand, P. (1991). Evidence for different human tracheobronchial mucin peptides deduced from nucleotide cDNA sequences. Am. J. Respir. Cell Mol. Biol. 5, 178-185.
Balague, C., Audie, J. P., Porchet, N. and Real, F. X. (1995). In situ hybridization shows distinct patterns of mucin gene expression in normal, benign, and malignant pancreas tissues. Gastroenterology. 109, 953-964.
Balazs, I., Baird, M., Wexler, K. and Wyman, A. (1986). Characterisation of the polymorphic DNA fragments detected with a new probe derived from the D14S1 locus. Am. J. Hum. Genet. 39, A229.
Berg, E. S. and Olaisen, B. (1993). Characterization of the C0L2A1 VNTR polymorphism. Genomics. 16, 350-4.
Bhargava, A. K., Woitach, J. T., Davidson, E. A. and Bhavanandan, V. P. (1990). Cloning and cDNA sequence of a bovine submaxillary gland mucin-like protein containing two distinct domains. Proc. Natl. Acad. Sci. USA. 87, 6798-6802.
Blouin, J. L., Christie, D. H., Gos, A., Lynn, A., Morris, M. A., Ledbetter, D. H., Chakravarti, A. and Antonarakis, S. E. (1995). A new dinucleotide repeat polymorphism at the telomere of chromosome 2 1 q reveals a significant difference between male and female rates of recombination. A m . J. Hum. Genet. 57, 388-94.
Bobek, L., Liu, J., Sait, S., Shows, T., Bobek, Y. and Levine, M. (1996). Structure and chromosomal localization of the human salivary mucin gene, MUC7. Genomics. 31, 277-282.
Bobek, L. A., Tsai, H., Biesbrock, A. R. and Levine, M. J. (1993). Molecular cloning, sequence, and specificity of expression of the gene encoding the low molecular weight human salivary mucin (MUC7). J . B io l. Chem . 268, 20563-9.
225
different human tracheobronchial mucin peptides deduced from nucleotide cDNA
sequences. Am. J. Respir. Cell Mol. Biol. 5, 178-185.
Balague, C., Audie, J. P., Porchet, N. and Real, F. X. (1995). In situ hybridization
shows distinct patterns of mucin gene expression in normal, benign, and malignant
pancreas tissues. Gastroenterology. 109, 953-964.
Balazs, I., Baird, M., Wexler, K. and Wyman, A. (1986). Characterisation of the
polymorphic DNA fragments detected with a new probe derived from the D14S1
locus. Am. J. Hum. Genet. 39, A229.
Berg, E. S. and Olaisen, B. (1993). Characterization of the C0L2A1 VNTR
polymorphism. Genomics. 16, 350-4.
Bhargava, A. K., Woitach, J. T., Davidson, E. A. and Bhavanandan, V. P. (1990).
Cloning and cDNA sequence of a bovine submaxillary gland mucin-like protein
containing two distinct domains. Proc. Natl. Acad. Sci. USA. 87, 6798-6802.
Blouin, J. L., Christie, D. H., Gos, A., Lynn, A., Morris, M. A., Ledbetter, D. H.,
Chakravarti, A. and Antonarakis, S. E. (1995). A new dinucleotide repeat
polymorphism at the telomere of chromosome 2 1 q reveals a significant difference
between male and female rates of recombination. Am . J. Hum. Genet. 57, 388-94.
Bobek, L., Liu, J., Sait, S., Shows, T., Bobek, Y. and Levine, M. (1996). Structure
and chromosomal localization of the human salivary mucin gene, MUC7. Genomics.
31, 277-282.
226
Bobek, L. A., Tsai, H,, Biesbrock, A. R. and Levine, M. J. (1993). Molecular cloning,
sequence, and specificity of expression of the gene encoding the low molecular
weight human salivary mucin (MUC7). J . B io l. Chem . 268, 20563-9.
Braga, V. M., Pemberton, L. F., Duhig, T. and Gendler, S. J. (1992). Spatial and
temporal expression of an epithelial mucin, M UCl, during mouse development.
Development. 115,427-37.
Brookes, A. J., Hedge, P. H. and Solomon, E. (1989). A highly polymorphic locus on
chromosome 11 which has homology to a collagen triple-helix coding sequence.
Nucleic Acids Res . 17, 1792.
Buard, J. and Vergnaud, G. (1994). Complex recombination events at the
hypermutable minisatellite CEB1 (D2S90). Embo. J . 13, 3203-10.
Burgerhout, W., Van-Someren, H. and Bootsma, D. (1973). Cytological mapping of
the genes assigned to the human A 1 chromosome by the use of radiation induced
chromosome breakage in a human Chinese hamster hybrid cell line. Humangenetik.
20, 159-162.
Cachon-Gonzalez, M. (1991). Linkage analysis in familial Adenomatous Polyposis
families in the United Kingdom, and a search for highly polymorphic markers.
Thesis. London University.
Capon, D. J., Chen, E. Y., Levinson, A. D., Seeburg, P. H. and Goeddel, D. V.
(1983). Complete nucleotide sequences of the T24 human bladder carcinoma
oncogene and its normal homologue. Nature . 302, 33-7.
227

Carle, G. F., Frank, M. and Oison, M. V. (1986). Electrophoretic separations of large
DNA molecules by periodic inversion of the electric field. Science . 232, 65-8.
Carle, G. F. and Olson, M. V. (1984). Separation of chromosomal DNA molecules
from yeast by orthogonal-field-alternation gel electrophoresis. Nucleic Acids Res . 12,
5647-64.
Chu, G., Vollrath, D. and Davis, R. W. (1986). Separation of large DNA molecules
by contour-clamped homogeneous electric fields. Science . 234, 1582-5.
Cooper, D. and Schmidtke, J. (1984). DNA restriction fragment length
polymorphisms and heterozygosity in the human genome. Hum, Genet . 6 6 , 1-16.
Craig, J. M. and Bickmore, W. A. (1994). The distribution of CpG islands in
mammalian chromosomes. Nature genetics. 7, 376-381.
Desmarais, E., Vigneron, S., Buresi, C., Cambien, F., Cambou, J. P. and Roizes, G.
(1993). Variant mapping of the Apo(B) AT rich minisatellite. Dependence on
nucleotide sequence of the copy number variations. Instability of the non-canonical
alleles. Nucleic Acids Res. 21, 2179-84.
Donis-Keller, H., Green, P., Helms, C., Cartinhour, S., Weiffenbach, B,, Stephens,
K., keith, T. P., Bowden, D. W., Smith, D. R., Lander, E. S., Botstein, D., Akots, G.,
Rediker, K. S., gravius. T., Brown, V. A., Rising, M. B., Parker, C., Powers, J. A.,
Watt, D. E., Kauffman, E. R., bricker. A., Phipps, P., Mullerkahle, H., Fulton, T. R.,
Ng, S., Schumm, J. W., Braman, J. C., knowlton, R. G., Barker, D. F., Crooks, S. M.,
Lincoln, S. E., Daly, M. J. and Abrahamson, J. (1987). A genetic-linkage map of the
human genome. C^//. 51, 319-337.
228

Dracopoli, N. C., OConnell, P., Elsner, T. L, Lalouel, J. M., White, R, L., Buetow, K.
H., Nishimura, D. Y., Murray, J. C., Helms, C., Mishra, S. K., DonisKeiler, H., Hall,
J. M,, Lee, M. K., King, M. C., Attwood, J., Morton, N. E., Robson, E. B., Mahtani,
M., Willard, H. F., et. al. (1992). A comprehensive genetic linkage map of the human
genome. NIH/CEPH Collaborative Mapping Group. Science. 258, 67-86.
Dufosse, J., Porchet, N., Audie, J., Guyonnet, D. V., Laine, A., VanSeuningen, I.,
Marrakchi, S., Degand, P. and Aubert, J. (1993). Degenerate 87-base-pair tandem
repeats create hydrophilic/hydrophobic alternating domains in human mucin peptides
mapped to l lp l5 . Biochem. J. 293, 329-337.
Durrant, L. G., Jacobs, E. and Price, M. R. (1994). Production of monoclonal
antibodies recognising the peptide core of MUC2 intestinal mucin. Eur. J. Cancer . 3,
355-63.
Eckhardt, A. E., Timpte, C. S., Abernethy, J. L., Zhao, Y. and Hill, R. L. (1991).
Porcine submaxillary mucin contains a cystine-rich, carboxyl-terminal domain in
addition to a highly repetitive, glycosylated domain. J. Biol. Chem.. 266,9678-9686.
Edgerton, M., Scannapieco, F. A., Reddy, M. S. and Levine, M. J. (1993). Human
submandibular-sublingual saliva promotes adhesion of Candida albicans to
polymethylmethacrylate. Infect. Immun . 61, 2644-52.
Edwards, A., Civitello, A., Hammond, H. A. and Caskey, C. T. (1991). DNA typing
and genetic mapping with trimeric and tetrameric tandem repeats. Am. J. Hum. Genet.
49, 746-56.
229
Essery, S. D., Weir, D. M., James, V. S., Blackwell, C. C., Saadi, A. T., Busuttil, A.
and Tzanakaki, G. (1994). Detection of microbial surface antigens that bind Lewis(a)
antigen. FEMS. Immunol Med. Microbiol 9, 15-21.
Fields, C., Adams, M. D., White, O. and Venter, J. C. (1994). How many genes in the
human genome? Nat. genet. 7, 345-346.
Fox, M., Lahbib, F., Pratt, W., Attwood, J., Gum, J., Kim, Y. and Swallow, D.
(1992). Regional localization of the intestinal mucin gene MUC3 to chromosome
7q22. Ann. Hum. Genet. 56, 281-287.
Gendler, S., Spicer, A., Braga, V., Wilson, M. and Savarirayan, S. (1994). Targeted
inactivation of the mouse muc-1 gene locus, a gene coding for a carcinoma-associated
mucin, y. Cell Biochem. 195-195.
Gendler, S., Taylor-Papadimitriou, J., Duhig, T., Rothbard, J. and Burchell, J. (1988).
A highly immunogenic region of a human polymorphic epithelial mucin expressed by
carcinomas is made up of tandem repeats. J. Biol. Chem.. 263, 12820-12823.
Gendler, S. J., Lancaster, C. A., TaylorPapadimitriou, J., Duhig, T., Peat, N.,
Burchell, J., Pemberton, L., Lalani, E. N. and Wilson, D. (1990). Molecular cloning
and expression of human tumor-associated polymorphic epithelial mucin. J. Biol.
Chem. 265, 15286-15293.
Getman, D. K., Eubanks, J. H., Camp, S., Evans, G. A. and Taylor, P. (1992). The
human gene encoding acetylcholinesterase is located on the long arm of chromosome
7. Am. J. Hum. Genet. 51, 170-7.
230

Gharib, B., Fox, M. P., Bartoli, C., Giorgi, D., Sansonetti, A., Swallow, D. M.,
Dagorn, J. C. and Berge-lefranc, J. L. (1993). Human regeneration
protein/lithostathine genes map to chromosome 2pl2. Ann .Hum. G enet. 57, 9-16.
Gnatt, A., Ginzberg, D., Lieman-Hurwitz, J., Zamir, R., Zakut, H. and Soreq, H.
(1991). Human acetylcholinesterase and butyrylcholinesterase are encoded by two
distinct genes. Cell Mol. Neurobiol. 11, 91-104.
Griffiths, B., Mathews, D. J., West, L., Attwood, J., Povey, S., Swallow, D. M., Gum,
J. R. and Kim, Y. S. (1990). Assignment of the polymorphic intestinal mucin gene
(MUC2) to chromosome 1 Ip 15. Ann. Hum. Genet. 54 277-285.
Gross, M.-S., Guyonnet-Duperat, V., Porchet, N., Bernheim, A., Aubert, J., P and
Nguyen, V., C (1992). Mucin 4 (MUC4) gene : regional assignment (3q29) and RFLP
2md\yûs. Ann. Genet. 35,21-26.
Grzeschik, K. H., Tsui, L. C. and Green, E. D. (1994). Report of the First
International Workshop on Human Chromosome 7 Mapping 1993. Cytogenet. Cell
Genet. 65, 52-62.
Gum, J., Hicks, J., Toribara, N., Siddiki, B. and Kim, Y. (1994). Molecular-cloning of
human intestinal mucin (MUC2) cDNA - identification of the amino-terminus and
overall sequence similarity to prepro-von-willebrand factor. J. Biol. Chem. 269,
2440-2446.
Gum, J. J., Hicks, J. W., Lagace, R. E., Byrd, J. C., Toribara, N. W., Siddiki, B.,
Fearney, F. J., Lamport, D. and Kim, Y. S. (1991). Molecular cloning of rat intestinal
mucin. Lack of conservation between mammalian species. J. Biol. Chem. 266, 22733-
22738.
231

Gum, J. J., Hicks, J. W., Toribara, N. W., Rothe, E. M., Lagace, R. E. and Kim, Y. S.
(1992). The human MUC2 intestinal mucin has cysteine-rich subdomains located
both upstream and downstream of its central repetitive region. J. Biol. Chem. 267,
21375-21383.
Gum, J. R., Byrd, J. C., Hicks, J. W., Toribara, N. W., Lamport, D. and Kim, Y. S.
(1989). Molecular cloning of human intestinal mucin cDNAs. Sequence analysis and
evidence for genetic polymorphism. J. Biol. Chem. 264, 6480-6487.
Gum, J. R., Hicks, J. W., Swallow, D. M., Lagace, R. L., Byrd, J. C., Lamport, D.,
Siddiki, B. and Kim, Y. S. (1990). Molecular cloning of cDNAs derived from a novel
human intestinal mucin gene. Biochem. Biophys. Res. Comm.. 171, 407-415.
Guyonnet-Duperat, V. (1993). Etude des genes de mucines humaines localises en
1 Ip 15. Thesis. Lille, Université des sciences et technologies de Lille. 221.
Guyonnet-Duperat, V., Audie, J. P., Debailleul, V., Laine, A., Buisine, M. P.,
Galieguezouitina, S., Pigny, P., Degand, P., Aubert, J. P. and Porchet, N. (1995).
Characterization of the human mucin gene MUC5AC: a consensus cysteine-rich
domain for 1 lp l5 mucin genes. Biochem. J. 305, 211-219.
Haldane, J. B. S. (1922). Sex ratio and unisexual sterility in hybrid animals. J. Genet.
12, 101-109.
Hansson, G. C., Baeckstrom, D., Carlstedt, I. and Klinga-Levan, K. (1994).
Molecular cloning of a cDNA coding for a region of an apoprotein from the
'insoluble' mucin complex of rat small intestine. Biochem. Biophys. Res. Comm. 198,
181-90.
232
Harvey, C. B., Pratt, W. S., Islam, I., Whitehouse, D. B. and Swallow, D. M. (1995).
DNA polymorphisms in the lactase gene. Linkage disequilibrium across the 70-kb
region. Eur. J. Hum. G enet. 3, 27-41.
Hauser, F., Gertzen, E. M. and Hoffmann, W. (1990). Expression of spasmolysin
(FlM -a.l) - an integumentary mucin from xenopus-laevis. Experimental Cell Res.
189,157-162.
Hauser, F. and Hoffmann, W. (1992). P-domains as shuffled cysteine rich modules in
integumentary mucin C.l (FIM-C.l) from Xenopus-Laevis polydispersity and genetic
polymorphism. J. Biol. Chem. 267, 24620-24624.
He, M., Liu, H., Wang, Y. and Austen, B. (1992). Optimized centrifugation for rapid
elution of DNA from agarose gels. Genet. Anal. Tech. A p p l. 9, 31-3.
Hilkens, J. and Buijs, F. (1988). Biosynthesis of MAM-6 , an epithelial sialomucin.
Evidence for involvement of a rare proteolytic cleavage step in the endoplasmic
reticulum. J. Biol .Chem . 263,4215-22.
Hill, A. S., Pratt, W. S., Attwood, J., Robson, E. B. and Swallow, D. M. (1994).
Polymorphism of the MUC3 gene and its localisation within a preliminary framework
map of chromosome 7. Cytogenet. Cell Genet. 65, 6 8 .
Hoffmann, W. (1988). A new repetitive protein from Xenopus laevis skin highly
homologous to pancreatic spasmolytic polypeptide. J. Biol. Chem . 263, 7686-90.
233
Hoffmann, W. and Hauser, F. (1993). Biosynthesis of frog-skin mucins - cysteine-
rich shuffled modules, polydispersities and genetic-polymorphism. Comp. Biochem.
Physiol. 105, 465-472.
Hounsell, E. P., Lawson, A. M. and Feizi, T. (1982). Structural and antigenic
diversity in mucin carbohydrate chains. Adv. Exp. Med. B io l. 144, 39-41.
Hovenberg, H. W., Davies, J. R., Herrmann, A., Linden, C.-J. and Carlstedt, I. (1996).
MUC5AC, but not MUC2, is a prominent mucin in respiratory secretions. Glycocon.
J. 13, 1-9.
Huan, L. J., Xu, G., Forstner, G. and Forstner, J. (1992). A serine, threonine and
proline-rich region near the carboxyl-terminus of a rat intestinal mucin peptide.
Biochim. Biophys. Acta . 1132, 79-82.
Jany, B. H., Gallup, M. W., Yan, P. S., Gum, J. R., Kim, Y. S. and Basbaum, C. B.
(1991). Human bronchus and intestine express the same mucin gene. J. Clin. Invest.
87, 77-82.
Jeffreys, A. J. (1979). DNA sequence variants in the G gamma-, A gamma-, delta-
and beta-globin genes of man. C ell. 18, 1-10.
Jeffreys, A. J., MacLeod, A., Tamaki, K., Neil, D. L. and Monckton, D. G. (1991).
Minisatellite repeat coding as a digital approach to DNA typing. Nature. 354, 204-
209.
Jeffreys, A. J., Neumann, R. and Wilson, V. (1990). Repeat unit sequence variation in
minisatellites: a novel source of DNA polymorphism for studying variation and
mutation by single molecule analysis. C ell. 60,473-485.
234

Jeffreys, A. J., Royle, N. J., Wilson, V. and Wong, Z. (1988). Spontaneous mutation
rates to new length alleles at tandem repetitive hypervariable loci in human DNA.
Nature . 332, 278-281.
Jeffreys, A. J., Tamaki, K., MacLeod, A., Monckton, D. G., Neil, D. L. and Armour,
J. A. (1994). Complex gene conversion events in germline mutation at human
minisatellites. Nat .G enet. 6 , 136-45.
Jeffreys, A. J., Wilson, V. and Thein, S. L. (1985). Hypervariable 'minisatellite'
regions in human DNA. Nature . 314, 67-73.
Jeffreys, A. J., Wilson, V. and Thein, S. L. (1985). Individual-specific 'fingerprints' of
human DNA. Nature . 316, 76-9.
Johnson, P. H. and Hopkinson, D. A. (1992). Detection of ABO blood group
polymorphism by denaturing gradient gel electrophoresis. Hum Mol Genet 1, 341-4.
Karlsson, S., Swallow, D. M., Griffiths, B., Corney, G., Hopkinson, D. A., Dawnay,
A. and Cartron, J. P. (1983). A genetic polymorphism of a human urinary mucin.
Ann. Hum .Genet. 47, 263-269.
Keith, T., Green, P., Reeders, S., Brown, V., Phipps, P., Bricker, A., Falls, K.,
Rediker, K., Powers, J., Hogan, C., Nelson, C., Knowlton, R. and DonisKeller, H.
(1990). Genetic linkage map of 46 DNA markers on human chromosome 16. Proc.
Natl. Acad. Sci. USA. 87, 5754-5758.
Khatri, I., Forstner, G. and Forstner, J. (1993). Suggestive evidence for two different
mucin genes in rat intestine. Biochem. J. 294, 391-399.
235
Lan, M. S., S. K. Batra, et al. (1990). Cloning and sequencing of a human pancreatic
tumor mucin cDNA. J Biol Chem. 265, 15294-9.

Klinga-Levan, K., Gum, J. R., Gendler, S. J., Kim, Y. and Hansson, G. C. (1996).
Chromosomal mapping of three mucin genes in the rat. Mammalian Genome . 7, 248-
250.
Klinger, K. W., Winqvist, R., Riccio, A., Andreasen, P. A., Sartorio, R., Nielsen, L.
S., Stuart, N., Stanislovitis, P., Watkins, P., Douglas, R. and et, a. (1987).
Plasminogen activator inhibitor type 1 gene is located at region q21.3-q22 of
chromosome 7 and genetically linked with cystic fibrosis. Proc. Natl. Acad. Sci. USA.
84, 8548-52.
Lesuffleur, T., Porchet, N., Aubert, J., Swallow, D., Gum, J., Kim, Y., Real, F. and
Zweibaum, A. (1993). Differential expression of the human mucin genes MUCl to
MUC5 in relation to growth and differentiation of different mucus-secreting HT-29
cell subpopulations. J. Cell Sci. 106, 771-783.
Lesuffleur, T., Roche, P., Hill, A., Lacasa, M., Fox, M., Swallow, D., Zweibaum, A.
and Real, F. (1995). Characterisation of a Mucin cDNA Clone Isolated from HT-29
Mucus-secreting Cells. J. Biol. Chem. 270, 13665-13673.
Lesuffleur, T., Zweibaum, A. and Real, F. X. (1994). Mucins in normal and
neoplastic human gastrointestinal tissues. Crit. Rev. Oncol. Hematol. 17, 153-80.
Ligtenberg, M., Kruijshaar, L., Buijs, F., Van, M. M., Litvinov, S. V. and Hilkens, J.
(1992). Cell-associated episialin is a complex containing two proteins derived from a
common precursor. J. Biol. Chem. 267, 6171-6177.
236

Ligtenberg, M., Vos, H. L., Gennissen, A. and Hilkens, J. (1990). Episialin, a
carcinoma-associated mucin, is generated by a polymorphic gene encoding splice
variants with alternative amino termini. J. Biol. Chem. 265, 5573-5578.
Littlefield, J. (1964). Selection of hybrids from maturing fibroblasts invitro and their
presumed recombinants. Science . 145, 709.
Mann, J. D., Caban, A., Gelb, A. G., Fisher, N., Hamper, J., Tippett, P., Sanger, R.
and Race, R. R. (1962). A sex-linked blood group. Lancet. 1, 8-10.
Maynard-Smith, S., Penrose, L. S. and Smith, C. A. B. (1961). Tables for research
workers in human genetics. Pub. London, Churchill.
Meerzaman, D., Charles, P., Daskal, E., Polymeropoulos, M., Martin, B. and Rose,
M. (1994). Cloning and analysis of cdna-encoding a major airway glycoprotein,
human tracheobronchial mucin (muc5), J. Biol. Chem. 269, 12932-12939.
Meitinger, T., Meindl, A., Bork, P., Rost, B., Sander, C., Haasemann, M. and
Murken, J. (1993). Molecular modelling of the Norrie disease protein predicts a
cystine knot growth factor tertiary structure. Nat .G enet. 5, 376-80.
Middleton-Price, H., Gendler, S. and Malcolm, S. (1988). Close linkage of PUM and
SPTA within chromosome band lq21. Ann. Hum. Genet. 52, 273-278.
Morton, N. (1955). Sequential tests for the detection of linkage. Am.. Nat. 45, 65-78.
Myers, R. M., Fischer, S. G., Lerman, L. S. and Maniatis, T. (1985). Nearly all single
base substitutions in DNA fragments joined to a GC-clamp can be detected by
denaturing gradient gel electrophoresis. Nucleic Acids Res . 13, 3131-45.
237
Nakamura, Y., Leppert, M., O'Connell, P., Wolff, R., Holm, T., Culver, M., Martin,
C., Fujimoto, E., Hoff, M., Kumlin, E. and et, a. (1987). Variable number of tandem
repeat (VNTR) markers for human gene mapping. Science. 235, 1616-22.
Neil, D. L. and Jeffreys, A. J. (1993). Digital DNA typing at a second hypervariable
locus by minisatellite variant repeat mapping. Hum. Mol. Genet. 2, 1129-35.
Nguyen, V. C., Aubert, J. P., Gross, M. S., Porchet, N., Degand, P. and Frezal, J.
(1990). Assignment of human tracheobronchial mucin gene(s) to l lp l5 and a
tracheobronchial mucin related sequence to chromosome 13. Hum.. Genet. 8 6 , 167-
172.
Nielsen, P. A., Mandel, M., Therkildsen, M. H., Bennett, E. P. and Clausen, H.
(1996). Differential expression of salivary mucins and identification of a high
molecular weight mucin (MGl) as MUC5B. Cambridge. 4th International Workshop
on Carcinoma -associated Mucins. 125.
Ohmori, H., Dohrman, A. F., Gallup, M., Tsuda, T., Kai, H., Gum, J., Jr., Kim, Y. S.
and Basbaum, C. B. (1994). Molecular cloning of the amino-terminal region of a rat
MUC 2 mucin gene homologue. Evidence for expression in both intestine and airway.
J. Biol. Chem. 269, 17833-40.
Orita, M., Iwahana, H., Kanazawa, H., Hayashi, K. and Sekiya, T. (1989). Detection
of polymorphisms of human DNA by gel electrophoresis as single-strand
conformation polymorphisms. Proc. Natl. Acad. Sci. USA. 8 6 , 2766-70.
238
Peat, N., Gendler, S. J., Lalani, N., Duhig, T. and Taylor-Papadimitriou, J. (1992).
Tissue-specific expression of a human polymorphic epithelial mucin (M UCl) in
transgenic mice. Cancer Res . 52, 1954-60.
Pemberton, L., TaylorPapadimitriou, J. and Gendler, S. J. (1992). Antibodies to the
cytoplasmic domain of the MUCl mucin show conservation throughout mammals.
BiocJiem. Biophys. Res. Comm. 185, 167-175.
Pigny, P., Guyonnet-Duperat, V., Hill, A. S., Pratt, W. S., Galliegue-Zouitina, S.,
Collyn D'Hooge, M., Laine, A., Van Seeuningen, I., Gum, J. R., Kim, Y. S., Swallow,
D. M., Aubert, J. P. and Porchet, N. (1996). Human mucin genes assigned to 1 lpl5.5:
Identification and organisation of a cluster of genes. Accepted by Genomics August
Pigny, P., Pratt, W. S., Laine, A., Leclercq, A., Swallow, D. M., Nguyen, V. C.,
Aubert, J. P. and Porchet, N. (1995). The MUC5AC gene: RFLP analysis with the
Jer58 probe. Hum. Genet. 96, 367-8.
Pinkel, D., Gray, J. W., Trask, B., van-den-Engh, G., Fuscoe, J. and van-Dekken, H.
(1986). Cytogenetic analysis by in situ hybridization with fluorescently labeled
nucleic acid probes. Cold Spring Harb. Symp. Quant. Biol. 1, 151-7.
Porchet, N., Cong, N. V., Dufosse, J., Audie, J. P., GuyonnetDuperat, V., Gross, M.
S., Denis, C., Degand, P., Bernheim, A. and Aubert, J. P. (1991). Molecular cloning
and chromosomal localization of a novel human tracheo-bronchial mucin cDNA
containing tandemly repeated sequences of 48 base pairs. Biochem. Biophys. Res.
Comm. 175, 414-422.
239
Porchet, N., Dufosse, J., Audie, J. P., Duperat, V. G., Perini, J. M., Nguyen, V. C.,
Degand, P. and Aubert, J. P. (1991). Structural features of the core proteins of human
airway mucins ascertained by cDNA cloning. Am. Rev. Respir. Disease. 144, S15-
S18.
Povey, S., Smith, M., Haines, J., Kwiatkowski, D., Fountain, J., Bale, A., Abbott, C.,
Jackson, I., Lawrie, M. and Hulten, M. (1992). Report and abstracts of the First
International Workshop on Chromosome 9. Held at Girton College Cambridge, UK,
22-24 March, 1992. Ann. Hum. Genet. 56, 167-82.
Pratt, W., Islam, I. and Swallow, D. (1996). Two additional polymorphisms within
the hypervariable MUCl gene: association of alleles either side of the VNTR region.
Ann. Hum. Genet. 60, 21-28.
Price, M. R., Crocker, G., Edwards, S., Nagra, I. S., Robins, R. a., Williams, M.,
Blamey, R. W., Swallow, D. M. and Baldwin, R. W. (1987). Identification of a
monoclonal antibody-defined breast carcinoma antigen in body fluids. Eur. J. Cancer
Clin. Oncol 23, 1169-1176.
Probst, J. C., Gertzen, E. M. and Hoffmann, W. (1990). An integumentary mucin
(FIM -B .l) from Xenopus-Laevis homologous with vonwillebrand-factor.
Biochemistry. 29, 6240-6244.
Probst, J. C., Hauser, F., Joba, W. and Hoffmann, W. (1992). The polymorphic
integumentary mucin-b. 1 from xenopus-laevis contains the short consensus repeat. J.
Biol. Chem. 267, 6310-6316.
240

Reddy, M., Levine, M. and Paranchych, W. (1993). Low-molecular-mass human
salivary mucin, MG2: Structure and binding of Pseudomonas aeruginosa. Crit. Rev.
Oral Biol Med. 4,315-323.
Redeker, E., Hoovers, J. M., Alders, M., van-Moorsel, C. J., Ivens, A. C., Gregory,
S., Kalikin, L., Bliek, J., de-Galan, L., van-den-Bogaard, R. and et, a. (1994). An
integrated physical map of 2 1 0 markers assigned to the short arm of human
chromosome \ \. Genomics. 21,538-50.
Rose, M., C, Kaufman, B. and Martin, B., M (1989). Proteolytic fragmentation and
peptide mapping of human carboxyamidomethylated tracheobronchial mucin. J. Biol
Chem. 264,8193-8199.
Rose, M. C. (1992). Mucins: Structure, function, and role in pulmonary diseases. Am.
J. Physiol 263, L413-L429.
Ruddle, F. (1973). Linkage analysis in man by somatic cell genetics. Nature. 242,
165-169.
Saiki, R. K., Gelfand, D. H., Stoffel, S., Scharf, S. J., Higuchi, R., Horn, G. T.,
Mullis, K. B. and Erlich, H. A. (1988). Primer-directed enzymatic amplification of
DNA with a thermostable DNA polymerase. Science . 239,487-91.
Sambrook, J., Fritsch, E. F. and Maniatis, T. (1989). Molecular cloning: a laboratory
manual. Pub. Cold Spring Harbor Laboratory Press.
Sanger, F., Nicklen, S. and Coulson, A. R. (1977). DNA sequencing with chain-
terminating inhibitors. Proc. Natl Acad. Scl USA . 74, 5463-7.
241

Shekels, L. L., C. Lyftogt, et al. (1995). Mouse gastric mucin: cloning and
chromosomal localization. Biochem J. 311, 775-85.
Schuler, G. D., Boguski, M. S., Stewart, E. A., Stein, L. D., Gyapay, G., Rice, K.,
White, R. E., Rodrigueztome, P., Aggarwal, A., Bajorek, E., Bentolila, S. and ai., e.
(1996). A gene map of the human genome. Science. 274, 540-546.
Seabright, M. (1971). A rapid banding technique for human chromosomes. Lancet. 2,
971-2.
Shankar, V., Tan, S., Gilmore, M. and Sachdev, G. (1992). Molecular cloning of the
carboxy terminus of a canine tracheobronchial mucin. Biochem. Biophys. Res. Comm.
189, 958-964.
Sheehan, J. K., Thornton, D. J., Somerville, M. and Carlstedt, I. (1991). The structure
and heterogeneity of respiratory mucus glycoproteins. Am. Rev. Respir. Disease. 144,
S4-S9.
Spencer, N., Hopkinson, D. and Harris, H. (1964). Phosphoglucomutase
polymorphism in man. Nature. 204, 742-745.
Spicer, A. P., Parry, G., Patton, S. and Gendler, S. J. (1991). Molecular cloning and
analysis of the mouse homologue of the tumor-associated mucin, M UCl, reveals
conservation of potential 0 -glycosylation sites, transmembrane, and cytoplasmic
domains and a loss of minisatellite-like polymorphism. J. Biol. Chem. 266, 15099-
15109.
Stoker, N. G., Cheah, K. S., Griffin, J. R., Pope, F. M. and Solomon, E. (1985). A
highly polymorphic region 3' to the human type II collagen gene. Nucleic Acids Res.
13, 4613-22.
242

Swallow, D. M., Gendler, S., Griffiths, B., Corney, G., Taylor-Papadimitriou, J. and
Bramwell, M. E. (1987). The human tumour-associated epithelial mucins are coded
by an expressed hypervariable gene locus PUM. Nature. 328, 82-84.
Swallow, D. M., Gendler, S., Griffiths, B., Kearney, A., Povey, S., Sheer, D., Palmer,
R. W. and Taylor-Papadimitriou, J. (1987). The hypervariable gene locus PUM,
which codes for the tumour associated epithelial mucins, is located on chromosome 1,
within the region lq21-24. Ann. Hum. Genet. 51, 289-294.
Swallow, D. M., Griffiths, B., Bramwell, M., Wiseman, G. and Burchell, J. (1986).
Detection of the urinary PUM' polymorphism by the tumour binding monoclonal
antibodies Gal, Ca2, Ca3, HMFGl and HMFG2. Disease Markers 4, 247-254.
Sykes, B., Ogilvie, D. and Wordsworth, B. (1985). Lethal osteogenesis imperfecta
and a collegen gene deletion. Lenghth polymorphisms provides an alternative
explanation. Hum. Genet. 70, 35-37.
Timpte, C., Eckhardt, A., Abernethy, J. and Hill, R. (1988). Porcine Submaxillary
Gland Apomucin Contains Tandemly Repeated, Identical Sequences of 81 Residues.
J. Biol. Chem. 263, 1081-1088.
Toribara, N., Roberton, A., Ho, S., Kuo, W., Gum, E., Hicks, J., Gum, J. J., Byrd, J.,
Siddiki, B. and Kim, Y. (1993). Human gastric mucin. Identification of a unique
species by expression cloning. J. Biol. Chem. 268, 5879-5885.
Toribara, N. W., Gum, J. J., Culhane, P. J., Lagace, R. E., Hicks, J. W., Petersen, G.
M. and Kim, Y. S. (1991). MUC-2 human small intestinal mucin gene structure.
Repeated arrays and polymorphism. J. Clin. Invest. 8 8 , 1005-1013.
243
Trask, B., Pinkel, D. and van-den-Engh, G. (1989). The proximity of DNA sequences
in interphase cell nuclei is correlated to genomic distance and permits ordering of
cosmids spanning 250 kilobase pairs. Genomics . 5, 710-7.
Troxler, R. F., Offner, G. D., Zhang, F., lontcheva, I. and Oppenheim, F. G. (1995).
Molecular cloning of a novel high molecular weight mucin (M Gl) from human
sublingual gland. Biochem. Biophys. Res. Comm. 217, 1112-9.
Tsuda, T., Gallup, M., Jany, B., Gum, J., Kim, Y. and Basbaum, C. (1993).
Characterization of a rat airway cDNA encoding a mucin-like protein. Biochem.
Biophys. Res. Comm. 195, 363-73.
Tsui, L. C., Donis-Keller, H. and Grzeschik, K. H. (1995). Report of the second
international workshop on human chromosome 7 mapping 1994. Cytogenet. Cell
Genet. 71,2-21.
Turner, B., Bhaskar, K., Hadzopoulou-Cladaras, M., Specian, R. and Lamont, J.
(1995). Isolation and characterization of cDNA clones encoding pig gastric mucin.
Biochem. J. 308, 89-96.
Tytgat, K. M., Buller, H. A., Opdam, F. J., Kim, Y. S., Finerhand, A. W. and Dekker,
J. (1994). Biosynthesis of human colonic mucin: Muc2 is the prominent secretory
mucin. Gastroenterology. 107, 1352-63.
Van Klinken, B. J.-W., Dekker, J., Buller, H. A. and Finerhand, A. W. C. (1995).
Mucin gen structure and expression: protection vs. adhesion. Am. J. Physiol. 269,
G613-G627.
244
Vergnaud, G., Mariat, D., Apiou, F., Aurias, A., Lathrop, M. and Lauthier, V. (1991).
The use of synthetic tandem repeats to isolate new VNTR loci: cloning of a human
hypermutable sequence. Ge/2<?m/c5. 11, 135-44.
Verma, M. and Davidson, E. A. (1993). Molecular cloning and sequencing of a
canine tracheobronchial mucin cDNA containing a cysteine-rich domain. Proc. Natl.
Acad. Sci. USA. 90,7144-8.
Vos, H. L., de, V. Y. and Hilkens, J. (1991). The mouse episialin (MUCl) gene and
its promoter: Rapid evolution of the repetitive domain in the protein. Biochem.
Biophys. Res. Comm. 181, 121-130.
Watkins, P. C., Eddy, R., Hoffman, N., Stanislovitis, P., Beck, A. K., Galli, J.,
Vellucci, V., Gusella, J. F. and Shows, T. B. (1986). Regional assignment of the
erythropoietin gene to human chromosome region 7pter— q22. Cytogenet. Cell
Genet. 42,214-8.
Weber, J. L. and May, P. E. (1989). Abundant class of human DNA polymorphisms
which can be typed using the polymerase chain reaction. Am. J. Hum. Genet. 44,
388-96.
Weiss, M., Baruch, A., Keydar, I. and Wreschner, D. H. (1996). Preoperative
diagnosis of thyroid papillary carcinoma by reverse transcriptase polymerase chain
reaction of the MUCl gene. Int. J. Cancer. 6 6 , 55-59.
Weissenbach, J., Gyapay, G., Dib, C., Vignal, A., Morissette, J., Millasseau, P.,
Vaysseix, G. and Lathrop, M. (1992). A second-generation linkage map of the human
genome. Nature. 359, 794-801.
245
Wolff, R. K., Nakamura, Y. and White, R. (1988). Molecular characterization of a
spontaneously generated new allele at a VNTR locus: no exchange of flanking DNA
sequence. Genomics. 3, 347-51.
Wolff, R. K., Plaetke, R., Jeffreys, A. J. and White, R. (1989). Unequal crossingover
between homologous chromosomes is not the major mechanism involved in the
generation of new alleles at VNTR loci. Genomics. 5, 382-4.
Wong, Z., Wilson, V., Patel, I., Povey, S. and Jeffreys, A. J. (1987). Characterization
of a panel of highly variable minisatellites cloned from human DNA. Ann. Hum.
Genet. 51,269-88.
Wreschner, D. H., Zrihan-Licht, S., Baruch, A., Sagiv, D., Hartman, M. L.,
Smorodinsky, N. and Keydar, I. (1994). Does a novel form of the breast cancer
marker protein, M UCl, act as a receptor molecule that modulates signal transduction?
Adv. Exp. Med. Biol. 353, 17-26.
Xu, G., Huan, L., Khatri, I., Sajjan, U. S., McCool, D., Wang, D., Jones, C., Forstner,
G. and Forstner, J. (1992). Human intestinal mucin-like protein (MLP) is homologous
with rat MLP in the C-terminal region, and is encoded by a gene on chromosome 11 p
15.5. Biochem. Biophys. Res. Comm. 183, 821-828.
Xu, G., Huan, L. J., Khatri, I. A., Wang, D., Bennick, A., Fahim, R., Forstner, G. G.
and Forstner, J. F. (1992). cDNA for the carboxyl-terminal region of a rat intestinal
mucin-like peptide. J. Biol. Chem. 267, 5401-5407.
Xu, G., Wang, D., Huan, L. J., Cutz, E., Forstner, G. G. and Forstner, J. F. (1992).
Tissue-specific expression of a rat intestinal mucin-like peptide. Biochem. J. 286,
335-338.
246
Related Documents