Minnesota Journal of Law & Inequality Minnesota Journal of Law & Inequality Volume 36 Issue 2 Article 5 July 2018 The Persistence of Segregation in the 21st Century The Persistence of Segregation in the 21st Century Paul A. Jargowsky Part of the Civil Rights and Discrimination Commons, Housing Law Commons, Land Use Law Commons, Law and Race Commons, Spatial Science Commons, and the Urban Studies and Planning Commons Follow this and additional works at: https://lawandinequality.org/ Recommended Citation Recommended Citation Paul A. Jargowsky, The Persistence of Segregation in the 21st Century, 36(2) LAW & INEQ. (2018). Available at: https://scholarship.law.umn.edu/lawineq/vol36/iss2/5 Minnesota Journal of Law & Inequality is published by the University of Minnesota Libraries Publishing.

Welcome message from author
This document is posted to help you gain knowledge. Please leave a comment to let me know what you think about it! Share it to your friends and learn new things together.
Transcript

Minnesota Journal of Law & Inequality Minnesota Journal of Law & Inequality
Volume 36 Issue 2 Article 5
July 2018
The Persistence of Segregation in the 21st Century The Persistence of Segregation in the 21st Century
Paul A. Jargowsky
Part of the Civil Rights and Discrimination Commons, Housing Law Commons, Land Use Law
Commons, Law and Race Commons, Spatial Science Commons, and the Urban Studies and Planning
Commons
Follow this and additional works at: https://lawandinequality.org/
Recommended Citation Recommended Citation Paul A. Jargowsky, The Persistence of Segregation in the 21st Century, 36(2) LAW & INEQ. (2018). Available at: https://scholarship.law.umn.edu/lawineq/vol36/iss2/5
Minnesota Journal of Law & Inequality is published by the University of Minnesota Libraries Publishing.

207
The Persistence of Segregation in the 21st Century
Paul A. Jargowsky†
Introduction Residential segregation has long been regarded as one of the
key pillars sustaining racial inequality. The Kerner Commission, formed to investigate the causes of the race riots of the 1960s, found that “[s]egregation and poverty have created in the racial ghetto a destructive environment totally unknown to most [W]hite Americans.”1 Moreover, progress against racial inequality could not be achieved, they concluded, as long as we continue to move towards “two societies, one [B]lack, one [W]hite—separate and unequal.”2 Such concerns were the impetus for a variety of strategies and legislative acts to break down the separation of the races, including school desegregation and the Fair Housing Act of 1968. Fifty years down the road from those tumultuous times, it is fair to ask whether we have made progress against racial segregation.3
Two prominent economists, Edward Glaeser of Harvard University and Jacob Vigdor of Duke University, conducted a widely-cited study of segregation over the last one-hundred and twenty years in the United States.4 Their report, provocatively titled The End of the Segregated Century, documented the rapid rise
†. This paper is an extension of remarks delivered at the Summit for Civil Rights at the University of Minnesota Law School, November 9–10, 2017. Some of the research results reported herein were funded through a grant from the National Science Foundation, Award 1636520. I received helpful comments and suggestions from Natasha Fletcher, Christopher Wheeler, and participants at the Summit. Comments and suggestions welcome; please direct them to [email protected]. 1. NAT’L ADVISORY COMM’N ON CIVIL DISORDERS, REPORT OF THE NATIONAL ADVISORY COMMISSION ON CIVIL DISORDERS 1 (1968) [hereinafter THE KERNER REPORT]. 2. Id. 3. Civil Rights Act of 1968 (Fair Housing Act), Pub. L. No. 90-284, 82 Stat. 73, 81–90 (1968). 4. EDWARD GLAESER & JACOB VIGDOR, THE END OF THE SEGREGATED CENTURY: RACIAL SEPARATION IN AMERICA’S NEIGHBORHOODS, 1890–2010, at 1–26 (2012) [hereinafter GLAESER & VIGDOR, THE END OF THE SEGREGATED CENTURY]; see also David M. Cutler, Edward L. Glaeser & Jacob L. Vigdor, The Rise and Decline of the American Ghetto, 107 J. POL. ECON. 455, 455–506 (1999) (examining segregation in United States cities from 1890 to 1990).

208 Law & Inequality [Vol. 36: 207
in segregation from 1890 through 1970, as well as the “no less dramatic” decline since 1970.5 Among other findings, they report that as of 2010, United States metropolitan areas were more integrated than at any time since 1910; that completely White neighborhoods were effectively extinct; and that Black ghettos were in rapid decline.6 Yet, they noted, “there has been only limited progress in closing achievement and employment gaps between [B]lacks and [W]hites.”7 They conclude that the belief and hope that reducing segregation would facilitate progress towards racial equality was misguided: “[f]orty years later,” they argue, “we know that this dream was a myth.”8
In this article, I argue that their optimism about racial segregation’s decline and their pessimism about the potential benefits of reducing racial segregation are incorrect on several counts. First, while there has been some progress in reducing segregation by race in United States metropolitan areas, certain methodological aspects of Glaeser and Vigdor’s analysis led them to significantly overstate the extent of the decline. Second, Glaeser and Vigdor failed to account for changes in economic segregation, which interacts with and reinforces the impact of racial segregation; in particular, economic segregation has been increasing in ways that negate some of the progress in racial segregation per se. Third, they did not address the implications of sub-metropolitan geospatial patterns, which effectively limit the access of Blacks and Hispanics to important public amenities—notably, high-quality public education. Fourth, they did not address life-cycle issues, specifically that children enrolled in school are more segregated than adults. Given that public education is organized geographically, the higher segregation of children renders the decline in segregation less meaningful in terms of access to opportunity than it appears from the overall numbers. Thus, the facts on the ground are bleaker than suggested in Glaeser and Vidgor’s analysis, and, as a result, they were incorrect to dismiss the potential benefit of racial integration to reduce social and economic disparities.
Part I explores the trends in racial segregation and shows how Glaeser and Vigdor’s conclusions depend in part on a measurement scheme that I argue is questionable. I also revisit the trends using 5. GLAESER & VIGDOR, THE END OF THE SEGREGATED CENTURY, supra note 4, at 4. 6. Id. at 1–26. 7. Id. at 10. 8. Id.

2018] The Persistence of Segregation 209
the approach that is more common in sociological analyses. Following that, in Part II I examine the distinct but related phenomenon of economic segregation. Contrary to racial segregation, economic segregation has been increasing. Given how these forms of segregation intersect and interact, the rise of economic segregation has implications for understanding the significance of racial segregation in the current context. Part III addresses the changing geographic basis of racial segregation, showing that it increasingly is structured by municipal boundaries, which has great significance given the importance of those boundaries in limiting access to economic opportunities and public amenities. The penultimate section, Part IV, addresses how life-cycle differences in segregation have led to greater segregation among children, which is a concern because children are the age group most susceptible to segregation’s negative effects. Finally, the concluding section addresses what we learn from this analysis about the persistence of racial segregation in the twenty-first century.
I. Racial Segregation Segregation is defined as the separation of distinct groups into
separate conditions. One can speak of occupational segregation by gender, educational segregation of pupils of different races into different schools or classrooms, or the economic segregation of social classes to different types of communities. In the United States, the term most often refers to racial residential segregation—that is, the segregation of persons of different races and ethnicities into different neighborhoods.
A. Measuring Racial Segregation If segregation is separation, then its opposite is an even
distribution of groups across the outcome of interest. There are many ways to measure segregation, but by far the most common is the Index of Dissimilarity,9 which equals 0 when the distribution of two groups is perfectly even and 100 if the two groups are completely separated.10 While the Index of Dissimilarity has been criticized on various methodological grounds,11 in practice it is 9. Otis Dudley Duncan & Beverly Duncan, A Methodological Analysis of Segregation Indexes, 20 AM. SOC. REV. 210, 211 (1955) (describing the Index of Dissimilarity as the “Nonwhite Section Index”). 10. Christopher Winship, A Revaluation of Indexes of Residential Segregation, 55 SOC. FORCES 1058, 1059 (1977). 11. Id. at 1058, 1061–62, 1065.

210 Law & Inequality [Vol. 36: 207
highly correlated with other measures that focus on the evenness of the distribution of groups across neighborhoods.12 The value of the Index may be interpreted as the proportion of one group that would have to move to achieve complete integration.13 In general, segregation levels of thirty or below are considered low, above thirty and up to seventy are considered moderate, and values above seventy are considered high.14
To calculate the Index of Dissimilarity, one needs to define two distinct groups and look at their distribution across smaller units (neighborhoods) within a larger unit (usually a housing market). For neighborhoods, I follow the common practice, as do Glaeser and Vigdor, of using Census tracts; these are small geographic units defined by the United States Census Bureau for data collection purposes that average about 4,000 residents.15 I use contemporaneous census tracts rather than tracts with boundaries normalized to a given year. Tracts as drawn in any given Census year are the best representation of neighborhoods in those years. This keeps the average population size of the neighborhood units more consistent over time, and it is well known that segregation measures are sensitive to the size of neighborhood units employed.16 For housing markets, I use metropolitan areas, which are cities of 50,000 or more residents, the county in which the central city is located, and surrounding counties that are closely tied to the central county by commuting patterns and other factors.17 For 1990 and 2000, I draw from the long form data from the United States Census for those years. For 2010, because a comparable long form survey was not conducted, I use the American Community Survey file that spans 2008–2012, a period centered on 2010.
12. Douglas S. Massey & Nancy A. Denton, The Dimensions of Racial Segregation, 67 SOC. FORCES 281, 284–87 (1988). 13. Winship, supra note 10, at 1061. 14. NATHAN KANTROWITZ, ETHNIC AND RACIAL SEGREGATION IN THE NEW YORK METROPOLIS 15 (1973). 15. BUREAU OF THE CENSUS, GEOGRAPHIC AREAS REFERENCE MANUAL 1–3 (1994). 16. S. Openshaw, Ecological Fallacies and the Analysis of Areal Census Data, 16 ENV’T & PLAN. A 17, 18 (1984) (“Indeed, it is now known that the modifiable nature of areal units can be systematically exploited by heuristic procedures to produce a very wide range of different results, irrespective of what individual-level analysis would have produced . . . .”); Sean F. Reardon & David O’Sullivan, Measures of Spatial Segregation, 34 SOC. METHODOLOGY 121, 123 (2004) (“Aspatial segregation measures have been repeatedly criticized in the residential segregation context for their failure to account for the spatial patterning of census tracts . . . .”). 17. 2010 Standards for Delineating Metropolitan and Micropolitan Statistical Areas, 75 Fed. Reg. 37,245, 37,252 (June 28, 2010).

2018] The Persistence of Segregation 211
B. Segregation of Who from Whom? An important issue is how to define the two groups whose
segregation is to be measured. Glaeser and Vigdor consider the segregation of Blacks from all other persons, i.e. Blacks from non-Blacks. This is a crucial and, I would argue, incorrect decision. The whole point of segregation studies is that a segregated group is excluded from contact with a powerful advantaged group and geographically isolated from the resources, housing, and public amenities that the advantaged group enjoys. Therefore, a conceptually valid measurement scheme should measure segregation of minority and disadvantaged groups from the majority group. If Blacks more frequently reside with low-income Hispanic immigrants, that does not mean they have achieved better access to high-performing schools, safer streets, and quality housing. The more logical approach to segregation analysis is to calculate the segregation of minority groups from the advantaged majority group, in other words, from non-Hispanic Whites.18 The choice between Black/non-Black and Black/White makes a large difference in the analysis, both in terms of the measured levels of segregation and the trends over time, as we see in the following section.19
C. Segregation by Race Is Declining, but How Fast? Glaeser and Vigdor, consistent with past studies,20 show that
Black versus non-Black segregation increased dramatically in the early decades of the twentieth century during the Great Migration of southern Blacks to northern industrial cities.21 By their measure, 18. Another measurement issue is that residents of group quarters should be excluded from the analysis. Residents of jails and nursing homes do not interact in the same way with other residents of a neighborhood. When a minority group member is arrested in New York City and sent “upstate,” this does not advance the cause of integration. I have excluded them in my calculations, but I am not sure how Glaeser and Vigdor handled the issue. Fortunately, the number of group quarters residents is small in most tracts and the effect on the numbers is negligible. 19. It should also be noted that race is self-identified and that starting in the 2000 Census, individuals could select more than one race. Reynolds Farley, Racial Identities in 2000: The Response to the Multiple-Race Response Option, in THE NEW RACE QUESTION: HOW THE CENSUS COUNTS MULTIRACIAL INDIVIDUALS 33, 33 (Joel Perlmann & Mary C. Waters eds., 2002). However, very few individuals chose to do so, and all analyses here are based on people who identified as White alone or Black alone, excluding those who identified as Hispanic. Id. at 45. 20. Douglas S. Massey & Zoltan L. Hajnal, The Changing Geographic Structure of Black-White Segregation in the United States, 76 SOC. SCI. Q. 527 (1995); DOUGLAS S. MASSEY & NANCY A. DENTON, AMERICAN APARTHEID: SEGREGATION AND THE MAKING OF THE UNDERCLASS (1993). 21. GLAESER & VIGDOR, THE END OF THE SEGREGATED CENTURY, supra note 4,
212 Law & Inequality [Vol. 36: 207
the Index of Dissimilarity peaked at about eighty percent in 1970.22 Since then, they find a dramatic decline to about fifty-five percent in 2010, the lowest level since 1910 and the basis of their declaring “the end of the segregated century.”23
However, a good part of the decline they report is driven by their choice of racial groups. As Hispanic and Asian immigrants arrived, they typically settled in urban population centers in areas of low-cost housing—in other words, in and around Black neighborhoods.24 Using a Black/non-Black metric, the mingling of Blacks with other minority groups shows up as integration.25
Figure 1 below compares the Black/non-Black approach to the Index of Dissimilarity between Blacks and non-Hispanic Whites between 1990 and 2010.26 During that period, the proportion of the population of the 384 metropolitan areas that was neither White nor Black nearly tripled, rising from 10% in 1990 to 28% in 2010. The 7.6-point drop in dissimilarity shown by Glaeser and Vigdor, from 65 to 57.4 (-12%) is not reflected in the figures that use Blacks and non-Hispanic Whites as the groups. While the level in 1990 was comparable to the Black/non-Black figure, the decline was much smaller, only 4.3 points on a base of 67.3 (-6%). By their choice of groups on which to compute the Index, Glaeser and Vigdor exaggerated the extent of the decline relative to 1990.
at 3. 22. Id. at 4, fig. 1. 23. Id. 24. Id. at 9–10. 25. Id. at 2–9. 26. The segregation values in this bar chart, as well as all calculations reported in the figures and text below that are not attributed to another source, were calculated by the author from the Census data described above.

2018] The Persistence of Segregation 213
Figure 1. Index of Dissimilarity, 1990–2010, Average of 384 Metroplitan Areas
The importance of this choice can also be seen by looking at the values for specific cities.
Table 1 shows the Index of Dissimilarity computed both ways for the twenty largest metropolitan areas in 1990 and 2010.27 The Index of Dissimilarity computed between Blacks and non-Hispanic Whites is always larger than when it is computed between Blacks and non-Blacks; in fact, it cannot be less. In 1990, however, the differences were mostly small, with the exceptions of New York and Los Angeles. By 2010, the difference between the two measures was also greater than in 1990, sometimes dramatically so; it more than doubled in fifteen of the twenty metropolitan areas, reflecting the increasing tendency of Blacks to share neighborhoods with the growing numbers of Hispanic and Asian immigrants.
27. The figures for 2010 differ slightly for some metropolitan areas from those shown in Table 1 of Glaeser and Vigdor due to differences in data sources and geographic concepts. GLAESER & VIGDOR, THE END OF THE SEGREGATED CENTURY, supra note 4.

214 Law & Inequality [Vol. 36: 207
Table 1. Comparison of Black/Non-Black and Black/White Indices of Dissimilarity, Twenty Largest Metropolitan Areas, 1990 and 2010
As a result, the apparent decline in racial segregation was larger using the Glaeser-Vigdor measure for all twenty metropolitan areas. In Houston, for example, the decline of twelve points in dissimilarity of Blacks versus non-Blacks was only three points when comparing Blacks and Whites. In Denver, the apparent improvement of five points is almost completely eliminated using the Black/White approach. Riverside-San Bernardino showed a small decline by the Black/non-Black measure but actually had an increase in segregation using the Black/White measure. Santa Ana-Anaheim-Irvine bucked the trend by showing an increase in both measures, but the increase was larger when contrasting Blacks and Whites. In these large metropolitan areas, on average there was progress by both measures, but using the Black/non-Black Index of Dissimilarity greatly exaggerated the progress toward racial integration. While it is true that over this period Blacks were less likely to live alone in neighborhoods, to a large extent this reflected an influx of immigrants rather than achieving access to non-Hispanic White neighborhoods and the resources and public amenities they possess. To better capture this reality, for the remainder of the Article, racial segregation is measured by applying

2018] The Persistence of Segregation 215
the Index of Dissimilarity to Blacks as compared to non-Hispanic Whites.
D. Segregation Is Highest Where Blacks Actually Live Segregation of Blacks from non-Hispanic Whites is
substantially worse in metropolitan areas with larger Black populations. Figure 2 shows the segregation levels of the 384 metropolitan areas graphed against the log of the number of Black residents. The bivariate regression line, as shown in the figure, indicates that the Index of Dissimilarity increases by 0.5 points for every 10% increase in Black population (t=14.27, p<0.001). Metropolitan areas with lower segregation levels tend to have fewer than 100,000 Black residents, but those areas with more than 500,000 Black residents virtually all have high segregation levels. As a result, more than half of all metropolitan Blacks lived in areas where the 2010 Index of Dissimilarity was 60 or higher; one-fourth lived in areas where it was 70 or higher; and more than one in ten lived in one of the four metropolitan areas where the Index of Dissimilarity was 80 or more—New York (80.2), Detroit (81.2), Newark-Union (80.0), or Milwaukee (81.6).
Figure 2. Segregation Between Blacks and Non-Hispanic Whites by Black Population Size (Log), 2010
20
40
60
80
Index ofDissimilarity
10,000 100,000 1,000,000
Black Population (log)

216 Law & Inequality [Vol. 36: 207
These figures show that segregation, far from having ended, is still a prominent feature of the United States metropolitan landscape. That is not to say there has been no progress. For example, as Glaeser and Vigdor point out, the number of census tracts with exactly zero Black residents declined from 4,700 in 1960 to only 424 in 2010.28 However, a single Black resident in a neighborhood of thousands may not be that meaningful, so it is more insightful to look at broader categories of racial percentages, as shown in Table 2. The change from 1990 to 2010 in the proportion of the Black population of metropolitan areas29 living in predominantly White neighborhoods—census tracts that were less than 10% Black—rose only a slight amount, from 13% to 14.3%, a much more modest change than implied by the “zero Black residents” figure. The proportion of Blacks living in virtually all-Black tracts—90% Black or more—declined substantially from 28% to 14%.30 Where did the other 14% go? The fastest growth was in neighborhoods in the range of 10% to 40% Black. Nearly 85% of the White population lived in neighborhoods where fewer than 10% of the residents were Black in 1990; while that declined, more than three-fourths of Whites still lived in such neighborhoods by 2010. These are positive changes, but not particularly large or dramatic ones.
28. GLAESER & VIGDOR, THE END OF THE SEGREGATED CENTURY, supra note 4, at 7. Note that even this decline is an underestimate, because the number of census tracts increased from 22,688 to 72,531 as tracts were split to accommodate population growth and more areas of the country were divided into census tracts. Id. 29. Note that about 90% of Blacks and 80% of Whites live in one of the 384 areas covered in the analysis as of 2010. 30. Note that this change could happen either by Blacks leaving tracts with 90% or more Black residents or by an influx of non-Black residents, leading the tract to be re-categorized as below 90%.

2018] The Persistence of Segregation 217
Table 2. Distribution of Metropolitan Area Residents by Percent Black, 1990–2010
Another indication of progress is the decline in cities with extreme levels of segregation. While 52% of Blacks still lived in metropolitan areas with segregation levels of 60 or more in 2010, as noted earlier, this is down from 75% in 1990. And while 11% of metropolitan Blacks lived in metropolitan areas with Dissimilarity of 80 or more in 2010, that figure was down from 26% in 1990. But at the pace of the decline in Black/non-Hispanic White segregation experienced over 1990 to 2010, it will be decades before it is reduced to levels comparable with other racial and ethnic minority groups today or the historical levels experienced by European immigrants at the peak of their segregation.
II. Economic Segregation31 Race is the preeminent dimension of residential segregation in
the United States, but it is not the only one. Poor, middle-class, and affluent households tend to live in very different neighborhoods, separated by walls, highways, railroad tracks, and municipal boundaries. Metropolitan neighborhoods vary enormously in terms of residents’ incomes, housing size and conditions, and public amenities—from sheet-rock mansions surrounded by green lawns in wealthy suburban enclaves to run-down row homes and housing projects in depopulated central-city ghettos and barrios. This phenomenon is known as economic segregation, and it serves to reinforce racial segregation and exacerbate its effects.32 Given that 31. This section draws heavily on Paul A. Jargowsky & Christopher Wheeler, Economic Segregation in US Metropolitan Areas, 1970–2010, (21st Century Cities Initiative, John Hopkins Univ., Nov. 2017), http://www.21stcenturyneighborhoods.org/wp-content/uploads/2017/11/jargowsky.pdf. 32. Douglas S. Massey, Jonathan Rothwell & Thurston Domina, The Changing

218 Law & Inequality [Vol. 36: 207
minority groups are poorer on average than non-Hispanic Whites, economic and racial segregation interact with each other to create neighborhoods which are doubly isolated from the mainstream of American society.
Economic segregation, resulting in vastly unequal neighborhoods, is linked to many social and economic problems. Residents of high-poverty neighborhoods are systematically cut off from public resources in education, housing, and health care and simultaneously exposed to higher levels of crime, violence, and economic isolation.33 High-poverty neighborhoods have significant long-term consequences for their residents, particularly young children who grow up in such places.34 While residents of high-poverty areas are harmed most directly, the costs of economic segregation are shared more broadly.35 Crime and violence incur substantial costs in terms of enhanced security, policing, court systems, and incarceration.36 Poor health outcomes among the uninsured and those with publicly-funded insurance drive up health care expenses.37 The costs, financial and otherwise, of these outcomes are passed on to more privileged residents of metropolitan areas wherever they might reside.38
Bases of Segregation in the United States, 626 ANN. AM. ACAD. POL. SOC. SCI. 74, 77, 87–88 (2009). 33. ROBERT J. SAMPSON, GREAT AMERICAN CITY: CHICAGO AND THE ENDURING NEIGHBORHOOD EFFECT 46–49 (2012); PATRICK SHARKEY, STUCK IN PLACE: URBAN NEIGHBORHOODS AND THE END OF PROGRESS TOWARD RACIAL EQUALITY 28–30 (2013). 34. Raj Chetty, Nathaniel Hendren & Lawrence F. Katz, The Effects of Exposure to Better Neighborhoods on Children: New Evidence from the Moving to Opportunity Experiment, 106 AM. ECON. REV. 855, 858 (2016) [hereinafter Chetty, Hendren & Katz, Effects of Exposure]; Raj Chetty et al., Where is the Land of Opportunity? The Geography of Intergenerational Mobility in the United States, 129 Q.J. ECON. 1553, 1611 (2014) [hereinafter Chetty et al., Land of Opportunity]; Patrick Sharkey, The Intergenerational Transmission of Context, 113 AM. J. SOC. 931, 933 (2008). 35. GREGORY ACS ET AL., THE COST OF SEGREGATION: NATIONAL TRENDS AND THE CASE OF CHICAGO, 1990–2010, at 18–27 (2017); PETER DREIER, JOHN MOLLENKOPF & TODD SWANSTROM, PLACE MATTERS: METROPOLITICS FOR THE TWENTY-FIRST CENTURY 88–93 (3d ed. 2014). 36. ACS, supra note 35, at 6 (“In particular, [B]lacks living in hypersegregated areas are exposed to elevated levels of crime and violence, pervasive joblessness, lower levels of educational attainment, low collective efficacy, and chronic physical and psychological health conditions.”); DREIER, MOLLENKOPF & SWANSTROM, supra note 35, at 88–89. 37. Id. 38. Id.

2018] The Persistence of Segregation 219
A. Measurement Issues Segregation on the basis of household income presents a
challenge in terms of measurement because income is a continuous variable rather than a categorical one like race. The poverty line does define two groups, poor and non-poor, whose segregation from each other can be measured using the Index of Dissimilarity. However, much of the variation in income is discarded by this approach, since a family of four with income slightly above the poverty line, say $26,000, is lumped together with multi-millionaires. Measurement of economic segregation requires a more sophisticated approach.
In previous work, Jeongdai Kim and I developed a class of measures of segregation based on ideas from information theory that are particularly useful for measuring segregation on a continuous variable.39 We argued that economic segregation may be measured by computing the ratio of neighborhood inequality to household inequality. The basic idea is that there is a certain amount of income inequality between households. These households are then grouped into neighborhoods. If there were perfect economic integration, all neighborhoods would be more or less equal; neighborhood inequality—the numerator in the ratio—would be zero, and therefore, economic segregation would be zero as well. In contrast, if there were perfect economic segregation, there would be no mixing of households of different income levels within neighborhoods. The neighborhood and household inequality measures would then be the same, and thus, the segregation measure formed by their ratio would be 1.0. While almost any measure of inequality can be used to form this ratio, the results presented below employ the well-known Gini Coefficient,40 which measures how unequally income is distributed across the household or neighborhood units.41
39. Paul A. Jargowsky & Jeongdai Kim, The Information Theory of Segregation: Uniting Segregation and Inequality in a Common Framework (Nat’l Poverty Ctr., Working Paper 09-05, 2009); Paul A. Jargowsky & Jeongdai Kim, The GINI Coefficient and Segregation on a Continuous Variable (Nat’l Poverty Ctr., Working Paper 05-2, 2005). 40. Corrado Gini, Measurement of Inequality of Incomes, 31 ECON. J. 124, 124–26 (1921); THOMAS PIKETTY, THE ECONOMICS OF INEQUALITY 10 (Arthur Goldhammer trans., 2015). 41. Other inequality measures, such as the Theil Index, could equally well be used. An example is the Neighborhood Sorting Index, which is the ratio of the standard deviation of household income to the standard deviation of neighborhood income. Paul A. Jargowsky, Take the Money and Run: Economic Segregation in U.S. Metropolitan Areas, 61 AM. SOC. REV. 984, 988 (1996).
220 Law & Inequality [Vol. 36: 207
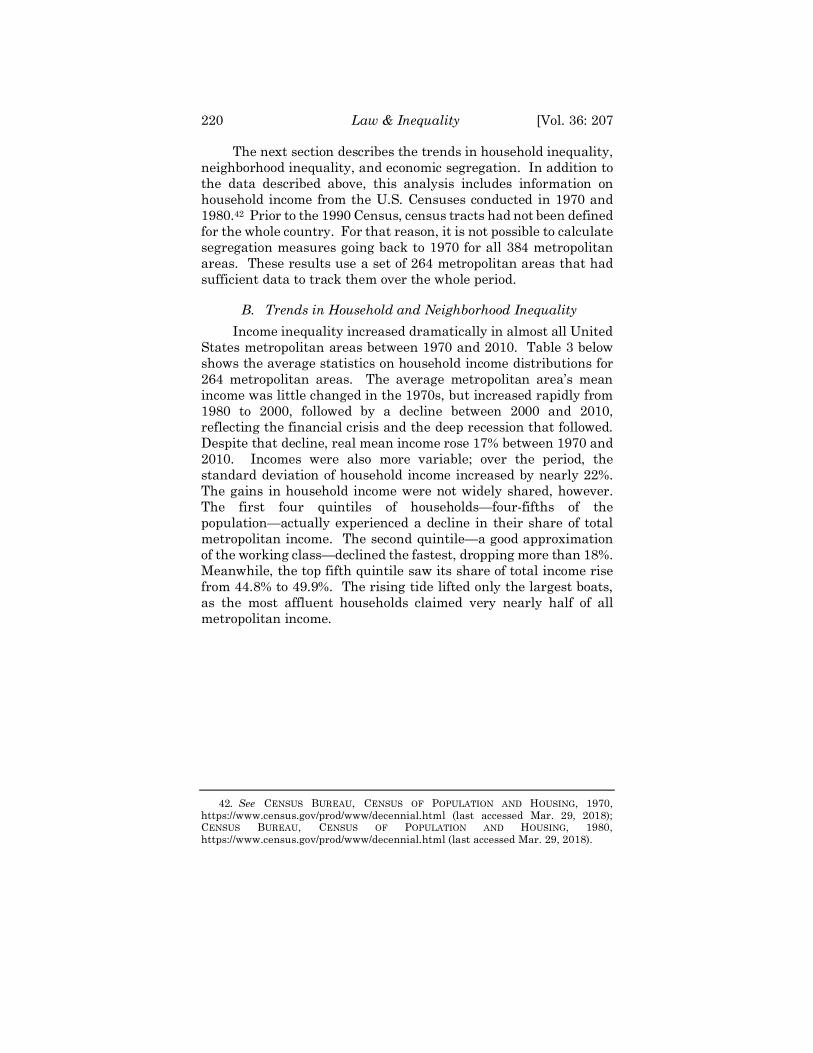
The next section describes the trends in household inequality, neighborhood inequality, and economic segregation. In addition to the data described above, this analysis includes information on household income from the U.S. Censuses conducted in 1970 and 1980.42 Prior to the 1990 Census, census tracts had not been defined for the whole country. For that reason, it is not possible to calculate segregation measures going back to 1970 for all 384 metropolitan areas. These results use a set of 264 metropolitan areas that had sufficient data to track them over the whole period.
B. Trends in Household and Neighborhood Inequality Income inequality increased dramatically in almost all United
States metropolitan areas between 1970 and 2010. Table 3 below shows the average statistics on household income distributions for 264 metropolitan areas. The average metropolitan area’s mean income was little changed in the 1970s, but increased rapidly from 1980 to 2000, followed by a decline between 2000 and 2010, reflecting the financial crisis and the deep recession that followed. Despite that decline, real mean income rose 17% between 1970 and 2010. Incomes were also more variable; over the period, the standard deviation of household income increased by nearly 22%. The gains in household income were not widely shared, however. The first four quintiles of households—four-fifths of the population—actually experienced a decline in their share of total metropolitan income. The second quintile—a good approximation of the working class—declined the fastest, dropping more than 18%. Meanwhile, the top fifth quintile saw its share of total income rise from 44.8% to 49.9%. The rising tide lifted only the largest boats, as the most affluent households claimed very nearly half of all metropolitan income.
42. See CENSUS BUREAU, CENSUS OF POPULATION AND HOUSING, 1970, https://www.census.gov/prod/www/decennial.html (last accessed Mar. 29, 2018); CENSUS BUREAU, CENSUS OF POPULATION AND HOUSING, 1980, https://www.census.gov/prod/www/decennial.html (last accessed Mar. 29, 2018).

2018] The Persistence of Segregation 221
Table 3. Distribution of Household Income in the Average Metropolitan Area
Clearly, household income inequality was increasing over this
period. Figure 3 shows the average Gini Index of Income Inequality for both households and neighborhoods relative to 1970 for the 264 metropolitan areas. Household inequality increased steadily starting in 1980, consistent with national and international trends showing that inequality began rising in the late 1970s. Neighborhood inequality rose faster than household inequality in the 1980s and 2000s; in the 1990s, household inequality grew faster. Over the whole period, however, neighborhood inequality in United States metropolitan areas clearly outpaced household inequality.

222 Law & Inequality [Vol. 36: 207
Figure 3. Gini Coefficients, Household and Neighborhood, Relative to 1970
Household inequality is a precondition for economic segregation, just as there can be no racial segregation unless there are different racial groups. Given a level of income inequality among households, economic segregation comes down to the question of how much inequality is between rather than within neighborhoods. As household income inequality has risen, if the division of that inequality within and between neighborhoods had remained the same, neighborhood inequality would have increased at the same rate as household inequality. As the figure shows, however, neighborhood inequality grew faster. The implication is that neighborhoods became more unequal for two different reasons. First, there was simply a lot more inequality overall. Second, households were sorted into neighborhoods in ways that led a greater proportion of household inequality to be between, rather than within neighborhoods. In other words, economic segregation increased.43 43. Other approaches to measuring economic segregation reach the same conclusion. See Sean F. Reardon & Kendra Bischoff, Income Inequality and Income Segregation, 116 AM. J. SOC. 1092, 1093 (2011); Ann Owens, Inequality in Children’s Contexts: Income Segregation of Households with and Without Children, 81 AM. SOC. REV. 549, 550–51 (2016); Tara Watson, Inequality and the Measurement of Residential Segregation by Income in American Neighborhoods, 55 REV. INCOME
2018] The Persistence of Segregation 223
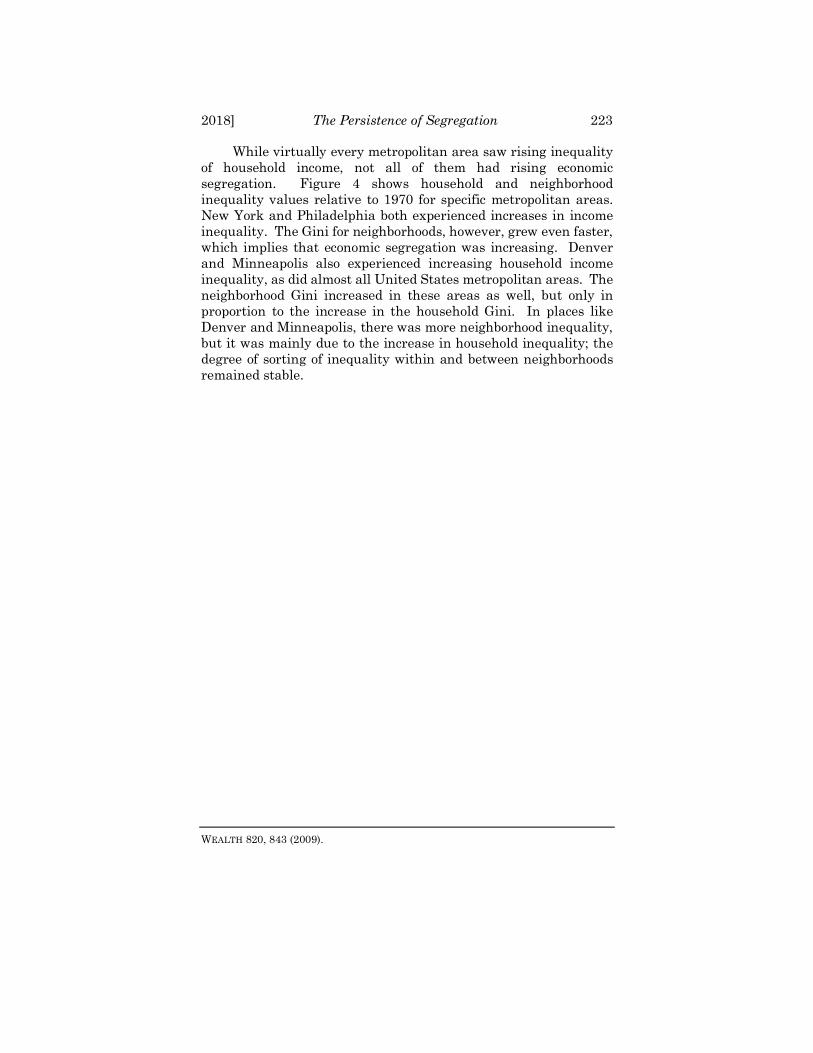
While virtually every metropolitan area saw rising inequality of household income, not all of them had rising economic segregation. Figure 4 shows household and neighborhood inequality values relative to 1970 for specific metropolitan areas. New York and Philadelphia both experienced increases in income inequality. The Gini for neighborhoods, however, grew even faster, which implies that economic segregation was increasing. Denver and Minneapolis also experienced increasing household income inequality, as did almost all United States metropolitan areas. The neighborhood Gini increased in these areas as well, but only in proportion to the increase in the household Gini. In places like Denver and Minneapolis, there was more neighborhood inequality, but it was mainly due to the increase in household inequality; the degree of sorting of inequality within and between neighborhoods remained stable.
WEALTH 820, 843 (2009).

224 Law & Inequality [Vol. 36: 207
Figure 4. Household and Neighborhood Inequality in 4 Metropolitan Areas
This is an important difference. Household inequality was
increasing everywhere, but that was mostly due to factors outside of local policymakers’ control—globalization, returns to skill, the national economy, etc. In addition, some places made things worse by having more residential sorting of households by income—New York, for example, but not Minneapolis. Much of that could be due to suburban sprawl, zoning, school assignment policies, and the construction and spatial distribution of different types of housing. Richard Rothstein has powerfully described the role of law and policy in creating and sustaining racial segregation.44 Likewise, law and policy contribute to—indeed, often require—economic segregation.45
Increasing income inequality and economic segregation undercut the potential beneficial effects of the decreases in racial
44. RICHARD ROTHSTEIN, THE COLOR OF LAW: A FORGOTTEN HISTORY OF HOW OUR GOVERNMENT SEGREGATED AMERICA 51–57, 77–91, 190–93 (2017). 45. Jonathan T. Rothwell & Douglas S. Massey, Density Zoning and Class Segregation in U.S. Metropolitan Areas, 91 SOC. SCI. Q. 1123 (2010); PAUL A. JARGOWSKY, ARCHITECTURE OF SEGREGATION: CIVIL UNREST, THE CONCENTRATION OF POVERTY, AND PUBLIC POLICY (2015), http://www.tcf.org/assets/downloads/Jargowsky_ArchitectureofSegregation.pdf; Editorial, The Architecture of Segregation, N.Y. TIMES (Sept. 5, 2015), http://www.nytimes.com/2015/09/06/opinion/sunday/the-architecture-of-segregation.html; Michael C. Lens & Paavo Monkkonen, Do Strict Land Use Regulations Make Metropolitan Areas More Segregated by Income?, 82 J. AM. PLAN. ASSOC. 6, 7–11 (2016).
2018] The Persistence of Segregation 225
segregation discussed in the previous section. Inequality, racial segregation, and economic segregation interact.46 Because Black incomes are so much lower on average than White incomes, segregation by race also means that Black neighborhoods will be far poorer than White neighborhoods at any given level of economic segregation. Because there is so much inequality among households, economic segregation results in greater inequality among neighborhoods at any given level of racial segregation. Because there is so much racial segregation, economic segregation among Blacks produces much poorer neighborhoods than if Blacks were interspersed with the much less poor White population. Thus, it is misguided to declare the “end of the segregated century” due to a decline in racial segregation when, at the same time, household income inequality and economic segregation have been increasing. Surely, the decline in racial segregation since the 1970s is evidence of progress in both social and legal terms. However, other things are not equal. The racial segregation that stubbornly persists plays out in a very different context; its negative effects are exacerbated by substantially higher levels of income inequality and economic segregation.
III. Metropolitan Geography Racial segregation has undergone geographic restructuring.
At the turn of the twentieth century, most Blacks resided in rural areas and small towns in the South whereas the White population was predominantly Northern and urban. After the Great Migration, however, regional segregation subsided and neighborhood-level segregation exploded.47 Douglas Massey notes that, starting in about 1950, Blacks and Whites became more segregated across municipal boundaries. Massey goes on to state that, “[a]fter 1950 . . . [B]lacks and [W]hites came to reside in wholly different towns and cities.”48 This process was driven by White flight and suburban sprawl, as new suburbs used land-use policies and exclusionary zoning to effectively protect suburban Whites from having lower-income and minority neighbors.49 It is 46. Massey, Rothwell & Domina, supra note 32, at 87–88. 47. See Massey & Hajnal, supra note 20, at 534–536. 48. Douglas S. Massey, Residential Segregation and Neighborhood Conditions in U.S. Metropolitan Areas, in AMERICA BECOMING: RACIAL TRENDS AND THEIR CONSEQUENCES 391, 398 (Neil J. Smelser, William Julius Wilson & Faith Mitchell eds., 2001). Massey references his early study with Zoltan L. Hajnal on indices of Black/White segregation. Massey & Hajnal, supra note 20, at 537. 49. See generally Jonathan Rothwell & Douglas S. Massey, The Effect of Density Zoning on Racial Segregation in U.S. Urban Areas, 44 URB. AFF. REV. 779, 779–82
226 Law & Inequality [Vol. 36: 207
perhaps equally important that White parents were able to send their children to predominantly White schools if they could afford the entry fees: the down payment, property taxes, and monthly mortgage on a large suburban home. As Ruth Bader Ginsburg has noted, “even though the days of state enforced segregation are gone, segregation because of geographical boundaries remains.”50
The proliferation of suburban jurisdictions, particularly after 1970, facilitated White flight. While Blacks have suburbanized, in many cases they have moved to older inner-ring suburbs whose White populations have moved to newer, more remote suburbs;51 Ferguson, Missouri, is a case in point. Newer suburbs where the majority of housing units were built after 1970 still tend to be disproportionately White and affluent.52 To a large extent, racial segregation is driven by jurisdictional boundaries. In research with Deborah Rog and Kathryn Henderson, I computed the Index of Dissimilarity using city and suburban jurisdictions rather than census tracts as the neighborhood unit. The Index of Dissimilarity represents how much segregation would remain if there was complete integration within jurisdiction boundaries. For example, in the Philadelphia metropolitan area, it would be as if every neighborhood in Philadelphia had the same share of Whites and Blacks as the city as a whole, and the same for the several hundred suburbs in the metropolitan area.53 On average, across 384 metropolitan areas, the level of segregation calculated using municipal jurisdictions is three-fourths of the figures discussed above using census tracts.54 In other words, if segregation could be completely eliminated within cities and towns, three-fourths of (2009); see also Paul A. Jargowsky, Sprawl, Concentration of Poverty, and Urban Inequality, in URBAN SPRAWL: CAUSES, CONSEQUENCES, & POLICY RESPONSES 39, 42–48 (Gregory Squires ed., 2002) (exploring how exclusion from the suburbs led to racial residential segregation and the concentration of poverty). 50. Irin Carmon, Exclusive Justice Ruth Bader Ginsburg Interview: Full Transcript (last update Feb. 17, 2015, 8:06 PM), http://www.msnbc.com/msnbc/exclusive-justice-ruth-bader-ginsburg-interview-full-transcript. 51. See Bernadette Hanlon, The Decline of Older, Inner Suburbs in Metropolitan America, 19 HOUS. POL’Y DEBATE 423 (2008); Katrin Anacker, Christopher Niedt & Chang Kwon, Analyzing Segregation in Mature and Developing Suburbs in the United States, 39 J. URB. AFF. 819 (2017). 52. See Paul A. Jargowsky, Debra J. Rog & Kathryn Henderson, Suburban Poverty and Racial Segregation, URB. PUB. 1–8 (2014), https://engagedscholarship.csuohio.edu/cgi/viewcontent.cgi?article=2309&context=urban_facpub (discussing a “boom” in construction of suburbs in the 1970s and exploring how “[W]hite flight was a primary cause in the development of the new suburbs”). This report was prepared for the U.S. Department of Health and Human Services and was reproduced in Urban Publications. 53. Id. at 11. 54. Id. at 9–11, fig. 6.
2018] The Persistence of Segregation 227
segregation would still remain because of the segregation between metropolitan jurisdictions.
To the extent that reductions in racial segregation have played out in large central cities, the benefits of these reductions may be limited if they occurred within fiscally-strapped central cities or within aging, deteriorating suburbs. Although there are a bewildering variety of governance structures and divisions of power between cities, towns, villages, school districts, counties, special-purpose districts, and state governments, in no metropolitan area are the collection of taxes and the provision of public amenities equal across all the subareas that comprise it.55 Hence, in terms of access to resources and public amenities such as quality public schools, the increasing fragmentation of metropolitan areas since 1970 effectively undercuts progress in segregation at the neighborhood level.
IV. Segregation, Children, and Access to Opportunity Powerful research by Stanford economist Raj Chetty and his
colleagues demonstrates that the effects of living in segregated and impoverished neighborhoods are particularly important for young children.56 The longer-term benefits of reductions in segregation, therefore, are tied to reducing segregation as it affects the neighborhoods where children live and, in turn, the schools they attend. Residential decisions are made by adults, but they are affected by the presence and age of children.57 Those adults with children are often motivated to seek safe neighborhoods and better schools if they have the financial means to do so.58 To the extent
55. See generally NANCY BURNS, THE FORMATION OF AMERICAN LOCAL GOVERNMENTS: PRIVATE VALUES IN PUBLIC INSTITUTIONS (1994) (using data to explore what motivated different income and racial groups to demand different kinds of taxation, public services, and local government); see also KENNETH T. JACKSON, CRABGRASS FRONTIER: THE SUBURBANIZATION OF THE UNITED STATES 130–32 (1985). 56. See generally Chetty, Hendren & Katz, Effects of Exposure, supra note 34 (analyzing long-term data indicating that children who moved to low-poverty areas experienced improved outcomes in areas such as college attendance and income as an adult); see also Chetty et al., Land of Opportunity, supra note 34, at 1619–1620. 57. See generally W.A.V. Clark & Jun L. Onaka, Life Cycle and Housing Adjustment as Explanations of Residential Mobility, 20 URB. STUD. 47 (1983) (analyzing how trends in household lifestyle and composition impacts the decision to move); PETER H. ROSSI, WHY FAMILIES MOVE: A STUDY IN THE SOCIAL PSYCHOLOGY OF URBAN RESIDENTIAL MOBILITY 42, 70–80 (1955). 58. ANNETTE LAREAU & KIMBERLY GOYETTE, CHOOSING HOMES, CHOOSING SCHOOLS: RESIDENTIAL SEGREGATION AND THE SEARCH FOR A GOOD SCHOOL 137–39 (2014).

228 Law & Inequality [Vol. 36: 207
that some Whites have moved back to central cities in recent years, they are likely to be childless, young adults, and empty nesters.59
These life-cycle considerations often lead to different levels of segregation between White and Black children compared to White and Black adults. Figure 5, below, shows the average level of segregation of Black and White children enrolled in school by education level.60 Segregation of children enrolled in school is substantially higher than in the corresponding non-enrolled populations. For example, the Index of Dissimilarity for Whites and Blacks not attending primary or secondary school is 0.582, whereas Black and White children enrolled in elementary school have an Index of Dissimilarity of 0.717, 23% higher.61 White and Black high school students are even more segregated, with a segregation score of 0.738.62 The residential segregation of children enrolled in kindergarten and pre-kindergarten is influenced both by the segregation of families with children in that age range and by the choices families make about enrolling those children, since these schooling levels are not compulsory. Apparently, families exercise their choices in ways that further increase segregation: children enrolled in kindergarten and pre-kindergarten have the highest Black/White segregation, measured at 0.798 (37% higher than those not enrolled)—reminiscent of the peak segregation levels of 1970.63 To be clear, this extreme figure is not based on a few highly segregated metropolitan areas, but rather, is the nationwide average of all 384 metropolitan areas.64
59. See generally Ingrid Gould Ellen, Keren Mertens Horn & Katherine M. O’Regan, Why Do Higher-Income Households Choose Low-Income Neighbourhoods? Pioneering or Thrift?, 50 URB. STUD. 2478 (2013) (exploring why higher-income households move into lower-income areas). 60. The figure and the analysis of this paragraph are based on the 2007–2011 American Community Survey and are adapted from Paul A. Jargowsky, Segregation, Neighborhoods, and Schools, in CHOOSING HOMES, CHOOSING SCHOOLS, supra note 58, at 97–136. 61. Id. 62. Id. 63. Id. 64. Id.

2018] The Persistence of Segregation 229
Figure 5. Black/White Segregation by School Enrollment
Because of the residential decisions of parents with children and other life-cycle considerations, the declines in racial segregation have left children behind.65 Declines in segregation that skip over children are less likely to have beneficial effects on social and economic outcomes. Ultimately, to evaluate how much progress there has been against segregation, we must pay attention to how and why segregation has negative effects. We must get under the hood of the overall segregation levels and investigate who remains segregated and how that is likely to affect racial inequality.
Conclusion Edward Glaeser and Jacob Vigdor are two highly acclaimed
economists, and rightly so.66 They have published prolifically on a variety of topics, and their work is widely cited. However, I respectfully disagree with their conclusion that the regime of racial segregation of Blacks that began in the early twentieth century has ended. Further, I argue that they have failed to show that the “dream” that racial disparities in achievement and employment could be ameliorated by reducing racial segregation “was a myth.” However, my point in framing this discussion around Glaeser and 65. Similarly, the increases in economic segregation are driven largely by families with children. The economic segregation of childless families has not increased to any appreciable degree. Owens, supra note 43. 66. Edward Glaeser is the Fred and Eleanor Glimp Professor of Economics at Harvard University, and Jacob Vigdor is the Daniel J. Evans Professor of Public Policy & Governance at the Evans School of Public Policy and Governance at the University of Washington. GLAESER & VIGDOR, supra note 4.

230 Law & Inequality [Vol. 36: 207
Vigdor’s article is not to attack them, since different scholars will always weigh evidence in different ways. Rather, my point is to argue that racial segregation and its consequences need to be understood in terms of a broader set of factors that, operating together, limit spatial access to opportunity.
To borrow a concept from economics, Glaeser and Vigdor did a comparative statics analysis of segregation. That is, they looked at the changes in racial segregation as if other things were being held constant, and noted that though segregation declined, there had been “only limited progress” in improving the educational and labor market equilibria.67 Beyond the problem of overstating the decline in segregation due to their measurement strategy, they did not take into account the interaction of racial segregation with growing economic segregation, itself driven in part by White flight to the suburbs to escape attempts to desegregate schools and housing in the central cities. They also failed to appreciate the way in which the impact of racial segregation is magnified by growing income inequality and the changing spatial structure of metropolitan areas. Further, by not thinking critically about the mechanisms through which racial segregation’s harms propagate, they did not investigate the extent to which children, and therefore schools, remain segregated at levels more common in the 1970s, the height of the segregated century.
To borrow a concept from legal analysis, I argue that the preponderance of the evidence demonstrates that racial segregation is still with us and continues to hold back Blacks, particularly those living in racially and economically isolated neighborhoods. We do not yet have reason or evidence to reject the view that integration could help to achieve a more equal society because segregation still dominates the demographic organization of our nation’s metropolitan areas. We will not be in a position to empirically evaluate the potential of reducing segregation until we achieve substantial racial integration, particularly if it can be achieved without offsetting effects due to increasing inequality, economic segregation, and metropolitan fragmentation.
67. See id. at 10.
Related Documents