1 The Persistence of Entrepreneurship and Innovative Immigrants Yong Suk Lee a,* Chuck Eesley b Stanford University Stanford University February 2018 Abstract Ethnicity and immigration status may play a role in entrepreneurship and innovation, yet the impact of university entrepreneurship education on this relationship is under-explored. This paper examines the persistence and differences in entrepreneurship by ethnicity and nationality. We find that among Stanford alumni, Asian Americans have a higher rate of entrepreneurship than white Americans. However, non- American Asians have a substantially lower, about 12 percentage points lower, start-up rate than Asian Americans. Such discrepancy not only holds for entrepreneurial choice but also for investing as an angel investor or venture capitalist, or utilizing Stanford networks to find funding sources or partners. Participation in Stanford University’s entrepreneurship program as a student does little to reduce this gap. The low level of parental entrepreneurship and the high degree of intergenerational correlation in entrepreneurship likely result in the lower level of entrepreneurship and participation in university entrepreneurship programs among Asians relative to their Asian American counterparts. Our findings highlight the value of immigration in terms of breaking the persistence in entrepreneurship among certain ethnic groups and promoting potential high-growth entrepreneurship in the United States. In addition, our findings may have important implications for programs to incorporate immigrant entrepreneurs within their home countries to promote entrepreneurship and help break the persistence of entrepreneurship across generations. Keywords: Intergenerational persistence in entrepreneurship, Immigrant entrepreneurship, Silicon Valley, Stanford University. JEL Codes: F22, J15, L26, M13 a Freeman Spogli Institute for International Studies, Stanford University, Stanford CA 94305 (email: [email protected]) b Department of Management Science and Engineering, Stanford University, Stanford CA 94305 (email: [email protected]) * Corresponding author: Encina Hall E309, 616 Serra Street, Stanford, CA 94305, USA. Tel: 1-650-736-0756.

Welcome message from author
This document is posted to help you gain knowledge. Please leave a comment to let me know what you think about it! Share it to your friends and learn new things together.
Transcript

1
The Persistence of Entrepreneurship and Innovative Immigrants
Yong Suk Leea,* Chuck Eesleyb Stanford University Stanford University
February 2018
Abstract Ethnicity and immigration status may play a role in entrepreneurship and innovation, yet the impact of university entrepreneurship education on this relationship is under-explored. This paper examines the persistence and differences in entrepreneurship by ethnicity and nationality. We find that among Stanford alumni, Asian Americans have a higher rate of entrepreneurship than white Americans. However, non-American Asians have a substantially lower, about 12 percentage points lower, start-up rate than Asian Americans. Such discrepancy not only holds for entrepreneurial choice but also for investing as an angel investor or venture capitalist, or utilizing Stanford networks to find funding sources or partners. Participation in Stanford University’s entrepreneurship program as a student does little to reduce this gap. The low level of parental entrepreneurship and the high degree of intergenerational correlation in entrepreneurship likely result in the lower level of entrepreneurship and participation in university entrepreneurship programs among Asians relative to their Asian American counterparts. Our findings highlight the value of immigration in terms of breaking the persistence in entrepreneurship among certain ethnic groups and promoting potential high-growth entrepreneurship in the United States. In addition, our findings may have important implications for programs to incorporate immigrant entrepreneurs within their home countries to promote entrepreneurship and help break the persistence of entrepreneurship across generations. Keywords: Intergenerational persistence in entrepreneurship, Immigrant entrepreneurship, Silicon Valley, Stanford University.
JEL Codes: F22, J15, L26, M13
a Freeman Spogli Institute for International Studies, Stanford University, Stanford CA 94305 (email: [email protected]) b Department of Management Science and Engineering, Stanford University, Stanford CA 94305 (email: [email protected]) * Corresponding author: Encina Hall E309, 616 Serra Street, Stanford, CA 94305, USA. Tel: 1-650-736-0756.

2
1. Introduction
The important role of universities as well as immigrants in driving innovation and
entrepreneurship is increasingly recognized (Saxenian, 2006; Åstebro, Bazzazian, and Braguinsky, 2012).
For example, Hsu, Roberts, and Eesley (2007) find that among MIT alumni, non-US citizens become
entrepreneurs at significantly higher rates than US citizens.1 Despite the importance of both universities
and immigrants, these two literatures have largely evolved independently, leaving us with relatively little
to say about the possible impact of university or public policies on high-skilled immigrant entrepreneurs.
One of the most notable features of entrepreneurship and innovation in Silicon Valley is the role Asian
immigrant entrepreneurs have played (Saxenian, 1999, 2006). Despite the importance of Silicon Valley
entrepreneurship and innovation, there is surprisingly little empirical analysis of entrepreneurial activity
that originates from Silicon Valley. This paper examines the persistence and differences in
entrepreneurship rates of Stanford alumni by ethnicity and nationality. Rather than examining issues of
causality, our goal is to present an exploratory analysis of the patterns of Stanford alumni becoming
entrepreneurs by family background, ethnicity and nationality. Analysis of a population from a research
university with a well-established reputation for innovation and entrepreneurship is important in
establishing basic facts regarding university-trained, high skill immigrants. We know from anecdotal and
systematic evidence that top research universities generate many leading firms. Many of these companies
were started by either immigrants or first-generation U.S. citizens (Hart and Acs, 2011).2 Research on
academic entrepreneurship focuses largely on faculty entrepreneurs, technology transfer, and university
spin-offs (Dahlstrand, 1997; DiGregorio and Shane, 2003; Etzkowitz, 1998, 2003; Nicolaou and Birley,
2003; Vohora et al., 2004). Yet, we now know that the influence of the university on entrepreneurial
behavior includes students and alumni as well (Åstebro, Bazzazian and Braguinsky, 2012; Bramwell and
Wolfe, 2008; Hsu, Eesley and Roberts, 2007). However, the impact of the university environment on
1 We use the term “alumni” throughout to include both male alumni and female alumnae. 2 Prominent examples include Sun Microsystems (Andreas Bechtolsheim and Vinod Khosla), Google (Sergey Brin), LinkedIn (Konstantin Guericke and Jean-Luc Vaillant), Hotmail (Sabeer Bhatia), Nvidia (Jen-Hsun Huang), Morris Chang (TSMC) and Yahoo! (Jerry Yang).

3
entrepreneurship among alumni merits deeper exploration, especially when it comes to immigrants and
students from non-Caucasian, non-domestic backgrounds.
The question of who becomes an entrepreneur is not a new one to the literature. Yet, we offer
three empirical advances. First, our data comprise a representative sample of Stanford alumni who were
not selected based on successful entry into entrepreneurship. Second, detailed data on alumni allows us to
distinguish not only those from entrepreneurial families, but also to separately examine immigrants and
first-generation Americans of similar ethnicity. Finally, a focus on alumni from a top research university
permits the examination of the entrepreneurial career choices of a set of individuals with a degree of
relative uniformity in educational level, exposure to an entrepreneurial environment in the university
years and even social networks. This permits more of an apples-to-apples comparison.
The second research question we address is how the rate of entrepreneurship changes with
participation in university entrepreneurship programs. This question has been relatively less explored in
the literature, especially in connection with immigration status, ethnicity and career decisions. Relatively
little work has examined the impact of educational initiatives to spur innovation and entrepreneurship
among alumni (for an exception, see Eesley, Li and Yang, 2016). One of the main contributions of this
paper is in its coverage of a representative sample of all Stanford University graduates since the 1930s,
regardless of whether one became an entrepreneur or not. The detailed demographic data in the survey
allows us to explore both across and within ethnicity and nationality differences in entrepreneurship.
We find that among Stanford alumni, Asians on average are less likely to become an
entrepreneur, invest as an angel investor or venture capitalist (VC), or become an entrepreneur turned
investor. However, once we separate Asian Americans from non-American Asians the results diverge.
Asian Americans have a higher rate of entrepreneurship than white Americans. However, Asians of
foreign nationality have a substantially lower (by about 12 percentage points), start-up rate than Asian

4
Americans. 3 The stark difference between Asian Americans and non-American Asians in
entrepreneurship among Stanford University alumni suggests that despite the persistent cultural traits
shared within each Asian subgroup, the difference in institutional and educational upbringing in the US
generates large differences in start-up activity. We then examine whether these differences within the
Asian sub-groups decrease as foreign Asian students obtain US university education and take advantage
of the university’s entrepreneurship programs. We focus on two major entrepreneurship programs
initiated by Stanford University, the Center for Entrepreneurial Studies (CES) at the Business School and
the Stanford Technology Ventures Program (STVP) at the Engineering School. We find that both
programs positively and significantly predict start-up activity. However, controlling for program
participation in both programs does not reduce the within Asian ethnic subgroup differences in
entrepreneurship.
Why might non-American Asians be less entrepreneurial and why do they utilize
entrepreneurship training to a lesser degree than their Asian American counterparts despite coming from
similar cultural backgrounds? We find that parental entrepreneurship is lower among Asian Americans
and even more so for non-American East Asians. Given that parental entrepreneurship status is one of the
strongest and most persistent predictor of entrepreneurship, the low parental entrepreneurship rate among
East Asians presents a persistent hurdle to promoting entrepreneurship in their respective countries.
Further compounding the low levels of parental entrepreneurship is the high degree of intergenerational
correlation in entrepreneurship, i.e., the relationship between one's entrepreneurship outcome and his or
her parents' entrepreneurship experience. These two features likely reflect the relatively lower level of
entrepreneurship and participation in university entrepreneurship programs among Asian non-Americans
relative to their Asian American counterparts.
The findings of this paper have important implication both in terms of the literature as well as
policy. The literature has widely documented the difference in the rate and patterns of entrepreneurship by 3 When we further separate the Asian category into three subgroups, i.e., Chinese, Indian, and other Asian, we find that the higher rate of start-up among Asian Americans is driven by the Chinese and Indian Americans. This is consistent with Saxenian’s research on the high degree of entrepreneurship by Chinese and Indian immigrants.

5
ethnicity or immigrant status in the US (Fairlie and Robb, 2007). For example, Fairlie (1999) finds that
family background explains the significantly lower rates of black entrepreneurship in the US. Fairlie and
Robb (2007) further find that the lower performance of black entrepreneurship is due to the lack of
training in family businesses. Immigrants, especially Asian immigrants are often hailed as more
entrepreneurial and studies on Silicon Valley entrepreneurship highlights the role immigrants have played
in founding high-growth technology ventures (Saxenian 1999, 2006). Our finding that Asian Americans
have higher rates of entrepreneurship, but that the rate of entrepreneurship for non-American Asians are
substantially lower, adds to the literature by illustrating how entrepreneurship within ethnic groups differs
by nationality or immigrant status. Furthermore, we document that the intergenerational persistence of
entrepreneurship is substantially higher for East Asians. A growing literature emphasizes the importance
of culture as a determinant for economic outcomes. However, quantifying culture is challenging and the
literature has often used immigrant history, e.g., parent’s original country, to proxy for culture (Fernandez
2010, Guiso et al. 2004). The findings of our paper show that such an approach should be examined with
caution as entrepreneurial activities of individuals of the same ethnicity, age, and from very similar
educational background differ significantly in their career choices depending on US citizenship status.
The rest of the paper proceeds as follows. Section 2 briefly reviews the prior literature on
transitions to entrepreneurship. Section 3 describes the Stanford University Innovation Survey and
Stanford University’s two major entrepreneurship initiatives. Section 4 presents the empirical framework
and Section 5 discusses the results. Section 6 concludes and discusses the policy implications.
2. Transition to Entrepreneurship
Growth in the number of entrepreneurial firms has been linked to greater real economic growth in
the U.S. (Wong, Ho and Autio, 2005). Innovation and entrepreneurship scholars have long been interested
in the question of why some people transition to being entrepreneurs due to the impact of entrepreneurial
behavior on economic growth and productivity (Schumpeter, 1934). Scholars have offered four categories
of answers to this question: (1) financial and opportunity cost-based rationales, (2) cognitive differences,

6
(3) demographic factors, and (4) training and experience effects. We review each of these briefly, yet
focus on categories (3) and (4) as the most directly relevant to our research questions.
The first set of explanations for why some transition to entrepreneurship and others do not is that
individuals with lower opportunity costs or with better access to financing are more likely to become
entrepreneurs (Amit et al., 1995; Iyigun and Owen, 1998). For example, those with higher incomes or
parents with greater levels of wealth are likely to have easier access to the funding needed to start a firm
and as expected are more likely to become founders (Dunn and Holtz-Eakin, 2000; Blau, 1987).
Employees at firms with a slowdown in sales growth are likely to have lower opportunity costs and
correspondingly are more likely to found firms (Gompers et al., 2005).
A second set of answers emphasizes cognitive differences between entrepreneurs and non-
entrepreneurs (Mitchell et al., 2000). Individuals lower in risk-aversion, higher in need for independence,
and lower in their tendency towards counterfactual thinking and regret are more likely to become
entrepreneurs (Douglas and Shepherd, 2000; Baron, 2000). Other studies find that individuals with
moderate needs for achievement and power were more likely to become entrepreneurs (Roberts, 1991).
Third, demographic factors have also demonstrated predictive power in explaining who
transitions to entrepreneurship. These factors include religious background (McClelland, 1961), age
(Levesque and Minniti, 2006; Roberts, 1991), and entrepreneurial parents (Dunn and Holtz-Eakin, 2000;
Sorensen, 2007). Parental entrepreneurship has been found to increase the probability of children's
entrepreneurship by about 60 % in Sweden (Lindquist et al., 2013). Laspita et al. (2012) show the
transmission of entrepreneurial intentions from parents to children from a cross-section of 15 countries.
Men are significantly more likely than women to become entrepreneurs (Bates, 2002). Ethnic and
immigration status has also been found to play a role with the likelihood of entrepreneurship being higher
among some immigrant communities (Hart and Acs, 2011; Saxenian, 1999, 2002; Utterback et al., 1988).
Language skills and the size of the ethnic market appear to moderate the impact of immigrant status on
entrepreneurship (Evans, 1989). Recent work has focused on the role of high skill migrants in bringing
knowledge across regional (Marx, Singh and Fleming, 2015) or national borders and influencing host

7
country productivity (Canello, 2016) and innovative capacity (Filatotchev, Liu, Lu, and Wright, 2011;
Qin, 2015; Gibson and McKenzie, 2014). However, much of the work on immigration status examines
the frequency of immigrants on founding teams (Kenney and Patton, 2015), rather than the likelihood of
an immigrant becoming an entrepreneur. It also often fails to examine immigrants alongside first-
generation children of immigrants who share ethnicity yet differ in language and cultural skills.
University training and other experience is a final category of explanations. Baumol (2005)
argues that there are differences between the type of education needed for identifying entrepreneurial
opportunities and that required for technical mastery. For example, Lazear (2005) uses a dataset of
Stanford business school alumni to show that individuals with a greater variety of courses and job
experiences were more likely to become founders. Universities, as a source of knowledge spillovers as
well as social norms and exposure to entrepreneurship are increasingly cited as a factor in generating
entrepreneurs (Bramwell and Wolfe, 2008; Dahlstrand, 1997; Oliver, 2004; Hsu, Roberts and Eesley,
2007; Guerrero, Cunningham and Urbano, 2015). However, relatively little prior work explicitly
examines the role of specific entrepreneurship education experiences or the impact of immigrant status as
distinct from ethnicity in leading to entrepreneurial activity. We seek to address this important gap and in
doing so respond to calls in the literature for additional examination of the role of context in
entrepreneurship (Autio, Kenney, Mustar, Siegel, and Wright, 2014; Eesley, 2016; Nelson, 2014).
3. The Stanford University Innovation Survey and Stanford’s Entrepreneurship Programs
3.1 The Stanford University Innovation Survey
The sample was constructed from a novel survey administered in 2011 to 142,496 alumni from Stanford
University. The survey was conducted over a well-defined population of comparable individuals in
multiple industries, and it was administered through official university channels and hence was more
trustworthy to the respondents. By surveying the entire population (all living alumni who graduated
between the 1930s and 2010s), we were able to poll all alumni who could have founded a firm. Though
the sample of Stanford alumni is not representative of the general population, understanding

8
entrepreneurship activity among students from a research university is critical to understanding the role of
potentially high-growth entrepreneurship. Prior studies have found samples of alumni from research
universities (MIT, Stanford, Harvard and Chicago) useful in making theoretical contributions regarding
how the broader social environment influences entrepreneurs (Dobrev and Barnett 2005, Lazear 2005,
Burt 2001, Eesley and Roberts, 2012, Hsu et al. 2007, Eesley and Wang, 2017). Results based on this type
of sample may generalize to other samples of selective-admission college-educated alumni. The sample
suffers less from success bias than most datasets that condition on venture capital funding or an initial
public offering. It is important to note that the surveyed alumni are not selected based on successful entry
into entrepreneurship. Unlike samples that focus on innovators or venture-backed founders, the results do
not suffer from biases due to sampling on the dependent variable.
The 2011 survey generated 27,780 individual responses for a response rate of 19.5%. The
response rates are similar across gender, departments, and graduation year. If we take graduates from
1933-1971, the response rate was 22% and graduates from 1972-2010, the response rate was 18 percent,
indicating that older graduates were not less likely to respond. The Appendix shows a multivariate
regression predicting response to further assess response rate characteristics among the alumni sample.
The dependent variable is equal to one if the individual responded to the survey and zero otherwise. Due
to the large sample size, some variables are statistically significant. The first column indicates that women
were 5.1% more likely to respond than men. Those in more recent graduation years were 0.9% less likely
to respond. Graduates of the Education and Medical schools were more likely to respond and those from
Law and Engineering were less likely to respond. Finally, we include fixed effects for graduation year,
and a full set of interactions between gender and graduation year and school. In this model, we do not
detect significant differences for the main effects of gender and school (see Eesley and Miller, 2012 for
detailed benchmarking and response rate analyses). Out of the respondents, nearly 8,000 reported being
entrepreneurs who founded any type of organization (for-profit or non-profit) and 4,290 said they had
founded an incorporated business. This is the first journal article to use the Stanford University
Innovation Survey.

9
An innovation ecosystem requires not only creative entrepreneurs but also active investors.
Moreover, one of Silicon Valley’s unique features is the abundance of entrepreneurs who become angel
investors or form or join venture capital firms. These “entrepreneur investors” may better identify
potentially successful start-ups and guide start-ups towards success at various stages of growth. The
Stanford survey not only asks one’s entrepreneurship status, but also whether one invested in start-ups.
We are thus able to examine whether one was an angel or VC investor, or an entrepreneur investor, in
addition to one’s entrepreneurship status, i.e., whether one found a new organization. Responses include
data on 2,798 individuals who were early employees (16 percent of the alumni), 349 venture capital
investors, and 2,572 angel investors. Some 3,600 respondents, 18 percent, said they had been on a private
company board of directors.
Another important value of the Stanford Innovation Survey is the rich information on ethnicity
and nationality of the students with a particular emphasis on Asians, which this paper probes into. Each
respondent was asked to identify his or her ethnicity as white, black, Hispanic, Native American, Chinese,
Indian, Other Asian, and Other. Furthermore, respondents were asked to name the country of citizenship
while at Stanford University. The detailed information on both ethnicity and nationality, enable us to
examine the differences in entrepreneurial activity within the same ethnic groups across nationality status,
e.g., Chinese Americans versus Chinese non-Americans.
Another valuable component of the survey is the information on whether the respondent’s parents
had entrepreneurship experience. The literature has found parental entrepreneurship status to be one of the
strongest determinants of entrepreneurship in different countries. We are able to exploit the rich ethnicity
and nationality information and parental entrepreneurship status to examine whether the intergenerational
correlation of entrepreneurship differs by different ethnic and nationality groups.4
The survey also asks a set of questions that characterize how optimistic and positive the
respondents are. In particular, it asks respondents to rate the degree to which one agrees with the
4 Personal and family wealth are also important determinants of entrepreneurship. Unfortunately, the survey did not collect information on personal or family wealth. Hence, we are not able to control for these factors in the empirical analysis.

10
following statements: “I am open to new experiences”, “In uncertain times, I usually expect the best.”,
and “Overall, I expect more good things to happen to me than bad.” We use these variables to control for
the underlying character of the individual and to examine how optimism differs by ethnicity and
nationality. Table 1 presents the summary statistics of the main variables used in the analysis.
3.2 Stanford University’s Entrepreneurship Programs
Stanford University is well known for its supportive environment for entrepreneurship among students
and faculty. The stories of the founding of Hewlett-Packard and Google are two of many examples.
Stanford University further expanded and formalized its support for entrepreneurship by establishing two
initiatives - the Center for Entrepreneurial Studies and the Stanford Technology Ventures Program- in the
mid-1990s. The Center for Entrepreneurial Studies (CES) was founded in 1996 at the Graduate School of
Business to address the needs facing entrepreneurs and the entrepreneurial community. It is a
collaborative effort that spans the whole university and supports research and teaching in a variety of
ways. For students, the CES offers a variety of courses that touch upon the various aspects of
entrepreneurship. These courses cover topics ranging from management, finance, technology, law,
education, design, etc., and are accessible to both graduate and undergraduate students. Furthermore,
experiential opportunities where students can learn the day-to-day activities of a start-up or test out new
business concepts are offered through the CES. The Stanford Technology Ventures Program (STVP) is
the entrepreneurship center founded in 1995 at the Engineering School. STVP offers courses and
extracurricular programs to students as well as support research on high-technology entrepreneurship. The
STVP houses several fellowship programs where students can get in-depth knowledge and experience of
technology start-ups, and a variety of courses are offered through the Engineering School. The Stanford
Innovation Survey asks whether each respondent had participated in the CES or STVP as a student and to
rate the degree of participation in a 1 to 4 scale, where 1 indicates no participation, 2 little participation, 3
moderate participation, and 4 heavy participation. We later use this information to examine whether

11
participation in this program changes the differential patterns of entrepreneurship as well as how
participation differs by groups.
4. The Empirical Framework
The base regression we use to examine the differences in entrepreneurship by ethnicity and nationality is
the following:
𝑦!"#$ = 𝛼 + 𝛽!𝐷!!! + 𝛾!𝐷!!𝐹!! + X!π + 𝜇! + 𝜃! + 𝜌! + 𝜀!"#$ (1)
where 𝑦!"# represents the entrepreneurship status of individual i in age cohort j, Stanford graduating
cohort k, and Stanford graduating department l. 𝐷!! is the ethnicity of individual i where n represent the
different ethnicity groups, i.e., Chinese, Indian, other Asian, Hispanic, black, and rest, with white as the
omitted category. 𝐹! is a dummy variable equal to one if the individual was a foreign national when at
Stanford as a student, and X! is the vector of control variables that include the foreign dummy, gender
dummy, parental entrepreneurship dummy, graduate degree dummy, and the three variables that proxy for
optimism. We control for the age of the individual non-parametrically by including age fixed effects 𝜇!,
and further control for Stanford cohort effects by including Stanford graduation year fixed effects 𝜃!.
Since different types of students select into different departments, we also control for department fixed
effects 𝜌!. In essence, we are comparing the entrepreneurship status by ethnicity among students within
the same department with the same age and graduating year.
The main coefficients of interests are the 𝛽!’s which identify the relative difference across
different ethnic groups, and the 𝛾!’s which identify the differences between US citizens and non-US
citizens within ethnic group n. We estimate the above with a linear probability model as well as logit
regressions. The results are similar and we present results from the linear probability regressions.
In other specifications, we examine whether the inclusion of the individual’s participation status
or participation level in the entrepreneurship programs, i.e., the CES and the STVP, in equation (1) alters
the coefficient estimates of the 𝛾! ’s. We also examine participation in the program, measures of

12
optimism, and parental entrepreneurship status as the outcome variable 𝑦!"#in equation (1) to examine
differential selection by ethnicity and nationality.
Finally, when examining the intergenerational correlation of entrepreneurship, we estimate the
following equation
𝑦!"#$ = 𝛼 + 𝜅!𝐷!!𝑃!! + X!π + 𝜇! + 𝜃! + 𝜌! + 𝜀!"#$ (2)
where 𝑃! is a dummy variable equal to one if the individual i's parent was an entrepreneur. The coefficient
𝜅! identifies the intergenerational correlation of entrepreneurship for group n. A higher value of 𝜅!
implies that persistence in entrepreneurship across generations is high, or that individuals without a parent
as entrepreneur are less likely to become entrepreneurs.
5. Results
5.1 Entrepreneurship and start-up investment patterns of Stanford Alumni
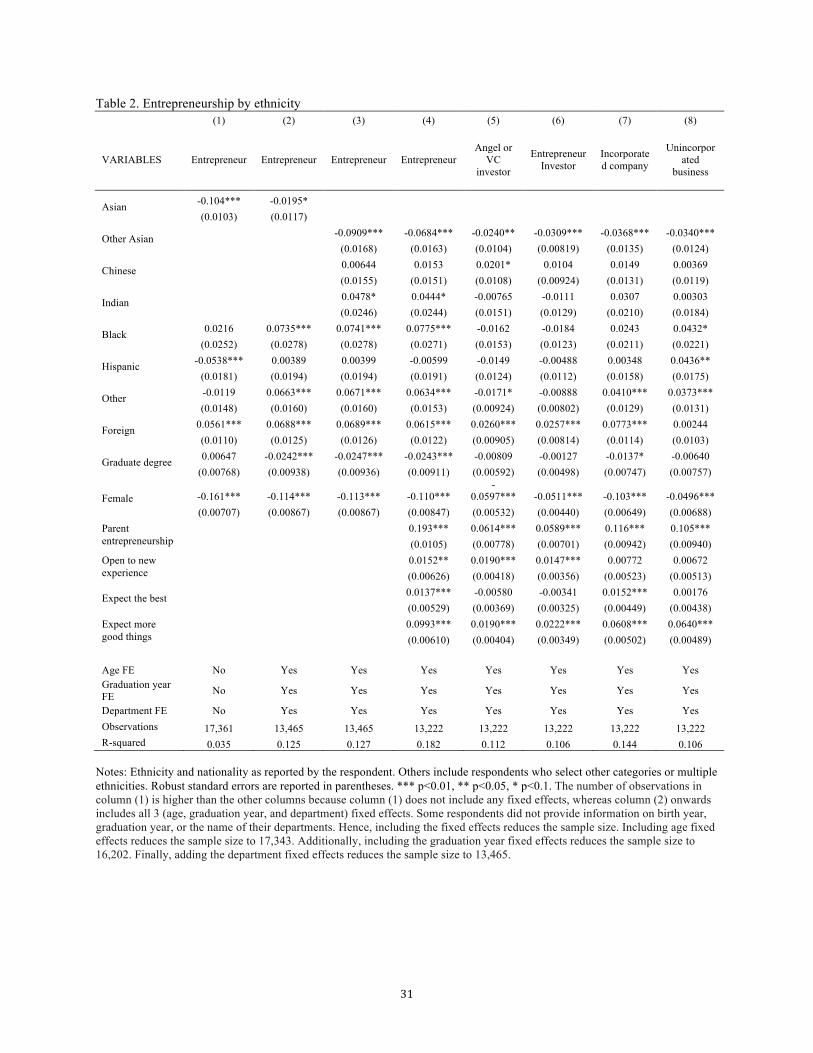
Table 2 examines how entrepreneurship and start-up investment activities of Stanford alumni
differ by ethnicity. Four ethnicities - Asian, Black, Hispanic, and other- are reported where white is the
omitted category. A simple regression that additionally controls gender, foreign status, and whether one
has a graduate degree in column (1) indicates that the share of Asians that found a new organization is 10
percentage points lower than that of whites. Entrepreneurship among Hispanics is about 5.4% lower than
whites. These effects are statistically significant at the one percent level. The ethnic composition and
characteristics of students admitted to Stanford would likely differ by age, year, and department. Hence,
we focus on the within age, cohort, and department variation in entrepreneurship by including age,
Stanford graduation year, and Stanford graduating department fixed effects in column (2) and onward.
The coefficient estimate on Asian decreases in magnitude to -0.02 but is still statistically significant at the
one percent level. In column (3) we further separate the Asian category into Chinese, Indian, and other
Asian. The coefficient estimates on Chinese and Indian are not statistically significant at the 5 percent

13
level. However, the coefficient estimate on other Asian is -0.09 and is statistically significant.5 Column
(4) additionally controls for the determinants of entrepreneurship that the literature has found to be
important. The entrepreneurship literature has found that whether one’s parent was an entrepreneur to be
one of the strongest determinants of entrepreneurship (Fairlie 1999, Djankov et al. 2007). We ask whether
either of the respondent’s parents had entrepreneurship experience and include this in column (4). Also,
personal beliefs especially relating to optimism is found to have significant effects on entrepreneurship.
We ask each respondent the degree to which one is open to new experiences, expect the best in difficult
times, and expect more good things to happen in a 1 to 5 scale. Including these variables does not alter the
significance and only slightly alters the magnitudes of the coefficient estimates. Now, other Asians on
average have about a 6.8% lower probability of becoming an entrepreneur.
Investment in start-ups is also an important part of the innovation ecosystem. In column (5) we
examine whether one’s experience in investment as an angel investor or venture capitalist differs by
ethnicity. Again, the share of other Asians that become angel or VC investors are about 3 percentage
points lower than whites. One of the unique features of the Silicon Valley venture capitalists is that many
have their own start-up experience. In column (6) we examine whether such entrepreneur investor status
differs by ethnicity. Again, the other Asian group has a significantly lower share than other ethnic
categories. The following two columns examine whether the start-up was an incorporated firm or an
unincorporated business.6
Results in Table 2 present a consistently lower participation in entrepreneurship and start-up
investment among Asians.7 In Table 3, we include each ethnicity interacted with whether one was of
foreign nationality as a student when attending Stanford University. Separating out Asian Americans
presents an interesting pattern in column (1). Asian Americans have a statistically significant higher start-
5 The negative difference in entrepreneurship with whites is predominantly due to the other Asian groups, which is about 50% Japanese and 22% Korean. 6 The other Asian category has significantly lower start-up rates in both incorporated firms and unincorporated businesses. 7 Though whether one is a US citizen or not is controlled for in Table 2, the results do not reflect any differences across foreign status among the different ethnic groups.
14
up rate than white-Americans by about 3.3 percentage points. However, Asians of foreign nationality
have a substantially lower start-up rate than Asian Americans, by 12 percentage points. We separate the
Asian category into the three groups as before in column (2). The higher rate of start-up among Asian
Americans is driven by Chinese and Indian Americans. The coefficient estimate on other Asian
Americans is negative but not statistically significant. However, when we examine the coefficient
estimates on the Asian sub-groups interacted with the dummy variable for foreign nationality when at
Stanford, all three estimates are negative and statistically significant. The following columns report
results for the same regression but with angel or VC investment and entrepreneur investor as the outcome
variable. Chinese Americans have a higher rate of investment activity compared to white Americans, and
the other Asian Americans have a statistically lower rate of investment activity compared to white-
Americans.8
Whether the graduates start their businesses in the US or outside the country is of considerable
policy relevance. The survey did ask the location of the startups, but about 45% of entrepreneurs did not
respond to that question. Noting that the sample may not be representative of all alumni, we examine
which entrepreneurs locate their startups in the US. First, among those who provided information on the
country of startup, 84.7% were located in the US (3,893 out of 4,598). If we separate this out between US
citizens and non-US citizens at time of graduation, about 95% of US citizens (2,964 out of 3,124) started
their businesses in the US, and about 63% of non-US citizens (545 out of 929) started their businesses in
the US. These statistics indicate that there are substantially more foreign students who create their
businesses in the US, rather than their home or a third country, at least among the sample of respondents. 8 We further explore the nationality of foreign students. Among foreign students with Asian ethnicity about 50 percent are Japanese and 22 percent are Korean. In Appendix Table 2 column (1) we sub-divide the other Asian foreign student category into Korean, Japanese, and other Asian. Within this sub-sub-category, the other Asian now excludes Korean, Japanese, Chinese, and Indian. The coefficient estimates on the three sub-sub-groups are all negative and statistically significant. The coefficient estimate on the Japanese sub-group is quite large in magnitude at -0.24 and statistically significant at the one percent level. The coefficient estimates on the Korean sub-group and other Asian sub-group are -0.05 and -0.08 and the latter is statistically significant at the 10 percent level. The cell sizes become smaller as we subdivide the groups and detecting statistically significance becomes more challenging. However, even at this sub-sub-division level we find persistently lower entrepreneurship rates from students coming from Asia compared to their Asian American counterparts. The differences between Asian Americans and their Asian counterparts in terms of investment activity, other than for the Koreans, are not as stark compared to the entrepreneurship results.

15
Given, that many foreign students need to go through the extra hurdle of working and staying in the US
after graduation because of their Visa status, the results suggests that many immigrant entrepreneurs
prefer the US as their startup location and the percentage could be even higher if policies can facilitate
foreign citizens to start businesses in the US.
We also examine entrepreneurship in the US based on ethnicity and nationality excluding alumni
who have started their businesses outside the US. The results are presented in columns (2) to (4) of
Appendix Table 2. Other than the negative coefficient estimate on other Asian-Americans, there are no
statistically significant differences among the different ethnicities and nationality. However, the estimates
are positive for Indian-Americans and Chinese-Americans. We additionally run a regression that
examines who reports the country of startup among entrepreneurs in column (5). We find no significant
ethnicity or nationality effects but the coefficient estimates on the Asian-American variables tend to be
negative and relatively large in magnitude. Asian-Americans maybe less likely to report the business’
location. Given the substantial non-reports on country of startup and the potential reporting bias by
ethnicity and nationality, one needs to be careful in interpreting and generalizing from these results.9
5.2. University entrepreneurship program participation
The stark difference between Asian Americans and Non-American Asians in entrepreneurship
suggests that despite the persistent cultural traits shared by the Asian sub groups, the difference in
institutional and educational upbringing in the US generates large differences in start-up activity. A
natural question is whether these differences within the Asian ethnic subgroups decrease as foreign Asian
students attend US universities and take advantage of the university entrepreneurship programs. In this
section, we examine whether the two major entrepreneurship programs initiated by Stanford University,
9 Some of the respondents provided city information when asked about the location of their startup. Again among this selected sample we find that 14.4 percent of those who provide city information (629 out of 3,739) started their enterprise in Silicon Valley, where Silicon Valley is defined by the major cities in Santa Clara Country. (Specifically, San Jose, Palo Alto, Mountain View, Cupertino, Sunnyvale, Los Altos, Milpitas, Campbell and Saratoga.) Trying different combinations of Silicon Valley cities returns similar results.

16
the Center for Entrepreneurial Studies (CES) and the Stanford Technology Ventures Program (STVP),
affect the differences in entrepreneurship activity between US and foreign Asian subgroups.
In Table 4, we first examine the relationship between entrepreneurship status and participation in
the two programs as a student. Column (1) of Panel A indicates that participation in CES is associated
with a 17 percent higher probability of being an entrepreneur, and STVP is associated with a 6.1 percent
higher probability. Though they are both statistically significant at the one percent level, participation in
CES is more than three times more likely to result in start-up activity after graduation. Due to self-
selection in participation, we caution against a causal interpretation of these results. In column (2) we
examine how program participation relates to future start-up investment as an angel investor or VC.
Results indicate that CES participation is positively and significantly related to future investor status.
However, STVP participation is not significantly related to investor status. Similar results hold when we
examine entrepreneur investor as the outcome variables. Lastly, we examine whether the respondent used
Stanford networks when looking for funding or partners for his or her start-up. Participation in both
programs is positively related to the utilization of Stanford networks but CES participation is about three
times more strongly related than STVP participation. Though both programs aimed to help promote
entrepreneurial activity among students, the CES program is more strongly related to entrepreneurship
than the STVP program. In terms of investment in start-ups, either as an angel investor, venture capital, or
entrepreneur investor, only CES participation shows a significant relationship. Though Stanford promotes
and has a strong tradition in technology start-ups, the CES, which is the more general entrepreneurship
program, compared to the STVP, which has a stronger technology focus, is related to more and broader
aspects of future entrepreneurial activity. Panel B examines the relationship between the level of
participation in these programs, which were coded in a 1 to 4 scale, and entrepreneur status. No
participation was coded as 1 and extensive participation as 4. The results imply that more extensive
participation in either program is positively related to all four outcome variables. However, CES
participation level is quantitatively a much stronger predictor than STVP participation level for all
outcomes.

17
We then examine whether controlling for one’s participation in Stanford University’s
entrepreneurship program reduces the entrepreneurship difference between US citizens and non-citizens
within the Asian ethnic subgroups. Table 5 presents regression results similar to Table 3, but additionally
includes one’s participation status in the CES and the STVP. The coefficient estimates on the other Asian
dummy and foreign dummy interaction in column (1) of Table 5 slightly decreases to -0.135 from -0.145
of Table 3 column (2). Similarly, the triple interaction terms on Table 5 column (2) are similar or slightly
smaller in magnitude than those from Table 3 column (3). However, the differences between the estimates
are not statistically different. Program participation may be slightly reducing the within Asian ethnic
subgroup differences in entrepreneurship but the effects are weak and not statistically distinguishable.
In Table 6, we examine whether there is selective participation into the entrepreneurship
programs by foreign status within Asians. Column (1) indicates that participation in the CES among non-
American Asians is about 2 percentage points lower than Asian Americans. This effect is statistically
significant at the 5 percent level. Once we subdivide this group in column (2) the statistical significance
goes away but the coefficient estimates are all negative. Columns (3) and (4) examine differential
participation in the STVP. As column (3) indicates Asian Americans have higher participation in the
STVP than white Americans, and non-American Asians are as likely to participate in the STVP. Similar
results hold when we examine the participation levels in the CES and the STVP in the following columns.
The differential results tend to be statistically stronger when we examine participation levels in CES in
columns (5) and (6). The intensity of participation in the CES is significantly lower for other Asian
Americans as well.
Table 6 results could be influenced by the fact that the majority of participants to the two main
programs are from a specific school (i.e. Business School for CES and Engineering School for STVP).
We also performed sensitivity tests by running the same regression on the subsample of individuals who
graduated from either school. The results were qualitatively similar to the full sample results. The
estimates on the various Asian categories have the same sign and similar significance levels.

18
5.3 Parental entrepreneurship and the intergenerational persistence in entrepreneurship
We have documented that there are substantial differences in the entrepreneurial activities
between Asian Americans and non-American Asians. Moreover, they also differ significantly in their
participation in university entrepreneurship initiatives. Why are non-American Asians less entrepreneurial
and utilize entrepreneurship training to a lesser degree? In this section, we examine whether the two
known determinants of entrepreneurship, optimism and parental entrepreneurship, which we examine in
the survey differ by ethnicity and foreign status. Table 7 columns (1) and (2) examine optimism. We
construct the optimism variable by adding the three variables: open to new experiences, expect the best in
difficult times, and expect more good things to happen. Column (1) indicates that Asian Americans are
significantly less optimistic than white Americans, but that non-American Asians are significantly more
optimistic than their Asian American counterparts. The difference in optimism is in the opposite
directions from our previous findings on entrepreneurship and program participation. Dividing the Asian
category into column (2) indicates that the lower level of optimism is driven by those of non-Indian
ethnicity, i.e., the Chinese American and the other Asian American categories. Moreover, the higher level
of optimism in non-American Asians is driven by the optimism of Indians. This may reflect the cultural
and religious beliefs of Indians.
We turn to parental entrepreneurship status in columns (2) to (3). Column (3) indicates that
Asian Americans are less likely to have a parent with entrepreneurship experience than white Americans
by 2.7 percentage points, and furthermore non-American Asians are less likely than Asian Americans to
have a parent with entrepreneurship experience by about 3.1 percentage points, but the latter estimate is
not statistically significant. Dividing the Asian category in column (4) shows negative coefficient
estimates for the Asian American subgroups as well as negative estimates for the non-American Asians.
Overall, the results indicate that parental entrepreneurship is lower among Asian Americans and even
more so for East Asians. Given that parental entrepreneurship status is one of the strongest and most
persistent predictors of entrepreneurship, the low parental entrepreneurship rate among East Asians
presents a hurdle in promoting entrepreneurship in these communities.

19
Finally, given the importance of parental entrepreneurship in determining entrepreneurship
among Stanford alumni, and the relatively lower levels of entrepreneurship among East Asians, we
examine whether the intergenerational correlation of entrepreneurship differs by ethnicity and nationality.
Table 8 column (1) presents the intergenerational correlation estimates of entrepreneurship among
ethnicities. White respondents who had a parent as an entrepreneur are 22.4 percent more likely to
become an entrepreneur. This intergenerational correlation is not statistically different between ethnic
groups.
In columns (2) we examine the intergenerational correlation across different nationalities.
Included nationalities are the US, China, Japan, Korea, and Taiwan, and India. The coefficient estimate
on parental entrepreneurship implies that the intergenerational correlation of entrepreneurship is around
0.23 for the excluded nationalities. The coefficient estimate on the interaction term with the US is
basically zero implying a similar magnitude for citizens from the US. However, the intergenerational
correlation jumps up for most East Asian citizens. In particular, the coefficient estimate on the interaction
term with Korean is 0.28 and statistically significant. This implies that the intergenerational correlation of
entrepreneurship among Koreans is 0.51. Having a parent with entrepreneurial experience increases one’s
probability of becoming and entrepreneur by 51 percent in Korea. A higher intergenerational correlation
implies more persistence in entrepreneurship across generations, or that the probability that someone from
a non-entrepreneur household to start a business is lower. The coefficient estimate on the Japanese term is
0.14 but statistically insignificant, but the estimate on the Chinese interaction term is large at 0.52 and
highly significant. This implies that the intergenerational correlation of entrepreneurship is extremely
high at 0.75. The estimate for Indians is small and insignificant, but the estimate for Taiwanese is 0.23
and significant at the 10 percent level. In column (3), we examine whether the intergenerational
correlation of entrepreneurship within each nationality differs between alumni who graduated before 1997
and on or after 1997. We use 1997 as the cut off because this is when the entrepreneurship programs were
available to graduating cohorts. Including the triple interaction terms generally makes the standard errors
larger since we lose power by splitting the cells. The coefficient estimates on the interaction terms now

20
represent the intergenerational correlation relative for the period before 1997. The estimates are similar in
magnitude to those from column (2), except for the Chinese, which decreases to 0.29. This in turn is
reflected in the large coefficient estimate on the triple interaction term of 0.4 for the Chinese alumni. The
triple interaction term represents the differential in the intergenerational correlation estimate after 1997
for each nationality. So, for Chinese, parental entrepreneurship status has become significantly more
important in determining one’s entrepreneurial status after 1997.
Overall, the results in this section show that the level of parental entrepreneurship is lower among
East Asians but the degree of intergenerational correlation in entrepreneurship is substantially higher.
These characteristics reflect the relatively lower level of entrepreneurship and participation in university
entrepreneurship programs among Asians, and in particular, non-American Asians.
6. Conclusion This paper examines the persistence and differences in entrepreneurship among Stanford alumni by
ethnicity and nationality. We find that among Stanford alumni, Asian Americans have a higher rate of
entrepreneurship than white Americans. However, non-American Asians have a substantially lower, by
about 12 percentage points, start-up rate than Asian Americans. Such discrepancy not only holds for
entrepreneurial choice but also for investing as an angel investor or VC, or utilizing Stanford networks to
find funding sources or partners. Participation in the entrepreneurship programs as a student does little to
reduce this gap. Furthermore, non-American Asians have lower participation rates in Stanford
University’s entrepreneurship education program, compared to their Asian American counterparts. We
find that parental entrepreneurship status is one of the strongest and most persistent predictors of
entrepreneurship, and we find that parental entrepreneurship is lowest among Asians, especially non-
American Asians. Moreover, these groups have high intergenerational persistence in entrepreneurship,
i.e., a high correlation between one’s entrepreneurship status and one’s parents’ entrepreneurship status.
The intergenerational correlation of entrepreneurship is very high for East Asians, e.g., 0.51 for Koreans
and 0.75 for Chinese, compared to 0.23 for US citizens. This value for US citizens does not differ by

21
ethnicity. The low level of parental entrepreneurship and the high degree of intergenerational correlation
in entrepreneurship among Asians likely result in the lower level of entrepreneurship and participation in
university entrepreneurship programs among Asians relative to their Asian American counterparts.
Our work further develops and builds on the line of literature emphasizing the importance of the
institutional and social context in entrepreneurship (Autio et al., 2014; Eesley, 2016; Eesley et al. 2016).
Prior research on academic entrepreneurship has emphasized certain ways that academic knowledge is
transferred to industry, for example, university technology licensing, spin-offs (Dahlstrand, 1997;
Goldfarb and Henrekson, 2003; Murray, 2002, 2004), academic publications (Zhang, Patton, and Kenney,
2013), and professorial consulting (Bramwell and Wolfe, 2008; Guerrero, Cunningham, and Urbano,
2015). However, recent work suggests another important mechanism in the knowledge related to
entrepreneurship provided to students and alumni via research universities (Eesley and Wang, 2017; Hsu,
Eesley, and Roberts, 2007). Our findings suggest that university entrepreneurship education programs
may play an important role in facilitating social processes, enhancing reputations, providing inspiration,
as well as technical training to support entrepreneurship among alumni. However, these programs vary in
the type of entrepreneurial activity they support and in their impacts across ethnicity and immigrant
status.
Three data-related issues are important to consider when interpreting these results: response rates,
representativeness, and self-reporting. First, is possible response bias. Graduates who saw themselves or
their ventures as unsuccessful may not have responded to the survey or reported on those firms. We
addressed this to an extent in the survey itself by asking about all founding attempts and then randomizing
which of those we asked for additional data on. Another issue is representativeness and if the responses
from this dataset apply to entrepreneurship in general. This paper studies alumni of an important
university situated in Silicon Valley at the intersection of technology and entrepreneurship. As would be
expected, the rate of entrepreneurship is higher in this sample relative to national statistics which
generally put the rate at four to five percent each year (Dennis, 1997; Reynolds, 1994). Thus, we do not
claim that the sample is generalizable across all types of self-employment. It is representative of an
22
important, interesting population over many decades. We see our results as generalizable to less elite
institutions. We believe the key question is whether our results are likely to be an upper bound or a lower
bound on the effect size due to the population we have sampled from. The key issues here are differences
between elite and less elite universities in exposure to entrepreneurship education and potential selection
effects. There are several reasons to believe we may be under-estimating the effect size and thus creating
a lower bound on the magnitude of the effect. First, relative to students at less elite institutions, Stanford
students have many opportunities for exposure to entrepreneurship both inside and outside of the
classroom. This is true both at the undergraduate and graduate levels. Thus, we might expect the non-
American Asian entrepreneurship rate to be even lower at less elite universities. However, we expect this
difference to be minimal given the lack of a large effect of participation in Stanford’s entrepreneurship
programs. Second, we must consider selection effects. Applicants to Stanford (or potentially to other elite
universities) may be more (or less) ‘entrepreneurial’ to begin with. If non-American Asians with
entrepreneurial parents are systematically more likely to apply (or to be accepted) to less elite universities,
relative to Asian Americans (which we see as unlikely) then we may have an upper bound on the
difference in entrepreneurship rate between these groups. On the other hand, if non-American Asians with
entrepreneurial parents are systematically more likely to apply (or to be accepted) to more elite
universities, relative to Asian Americans, then we may have a lower bound on the difference in the
entrepreneurship rate between these groups. These same conclusions would apply if applicants are
systematically more (less) likely to accept admission once offered, yet we do not see this as likely and we
have no evidence of such systematic differences in conversion rates. Finally, self-reporting and
retrospective bias may play a role, particularly for older respondents who may not recall some less
successful ventures in their past. Since founding a firm is a significant life event, which one is likely to
recall, we do not expect this type of bias to be large.
Current immigration policy is often consumed by debates surrounding low-skilled immigrants.
Though the results are based on a selected sample of Stanford University students, it does speak to highly
skilled and educated entrepreneurs, who could potentially create high-growth firms. High-skilled
23
immigration policy should be examined and evaluated separately from low-skilled immigration policy
and not lumped together into a simplified immigration policy. Young Asian immigrants who grow up in
the US are much more entrepreneurial than Asian foreign students, despite similar educational
credentials. Allowing immigrants to settle in and attain the cultural and institutional features of the US
education system at a young age could positively influence entrepreneurship and innovation, at least
among the skilled population.
Finally, the results present a sobering picture for Asian countries that are currently pursuing
various policies to promote entrepreneurship and innovation. The low levels of parental entrepreneurship
highlight the underlying socio-economic constraints in entrepreneurship. The high intergenerational
persistence in entrepreneurship further hinders the younger Asian citizens to break out from a low
equilibrium. In some respects, the entrepreneurial push pursued by Asian governments is very likely what
they need to do to break out from a spiral of low entrepreneurship and high intergenerational persistence
in entrepreneurship. However, the significant difference in entrepreneurial activities we find between
Asian Americans and non-American Asians may provide another way to promote entrepreneurship in
Asia. Asian Americans often inherit the language and cultural backgrounds from their parents and are
better able to integrate within their native land, enabling them to navigate through the bureaucracies and
culture of Asia while supplying innovative business ideas. Policies that promote such transnational
bridging may indeed serve as an effective yet low cost way to promote entrepreneurship (Shin and Choi
2015). An interesting avenue for future research would be comparing the performance of returnee
entrepreneurs. For instance, comparing the entrepreneurship rate and performance of those who
permanently remain in the US, those who build their careers in the US for several years and then return to
their home country to start a business, and those who return to their home countries soon after graduation.
It would be interesting to see whether entrepreneurs with familiarity and experience with the business
environments of both the US and home country perform better than those who predominantly only
experience one culture (the US or home).

24
Our findings also provide important nuance to the idea that universities may promote
entrepreneurship via admitting more international students or by simply exposing them to traditional
entrepreneurship classes. Admissions policies may be examined in future research that specifically select
applicants with entrepreneurial backgrounds. In terms of curriculum, it may be that classes tailored to
provide entrepreneurial mentors and role models might be especially important (Eesley and Wang, 2017).
In addition, coursework that specifically teaches skills and frameworks relevant to immigrant
entrepreneurs might be added to the curricula. For instance, Stanford has recently added courses titled,
“Creating High Potential Ventures in Developing Economies” (in the Graduate School of Business) and
“Entrepreneurship Without Borders” (in the School of Engineering) to teach skills specific to immigrant
and returnee entrepreneurs. Finally, we note that future work might examine variation across universities
in that some may be relatively more welcoming to immigrant entrepreneurs or help them get established
in entrepreneurship communities better than others via their alumni networks. For instance, New York
University (NYU) and Duke University have also partnered with universities in China to allow both
Chinese nationals and students from their U.S. campuses to mix and study either in China or in the United
States.
Prior work on immigrant entrepreneurs and innovators has emphasized the knowledge spillovers
provided by migrants (Filatotchev et al., 2011; Gibson and McKenzie, 2014; Marx et al., 2015) and return
migrants (Qin, 2015). It has also suggested that high-skill immigrants and university graduates are
particularly likely to start new firms (Hsu, Roberts and Eesley, 2007; Hart and Acs, 2011; Kenney and
Patton, 2015) and improve the productivity of local industry (Canello, 2016). Yet, such work has not
systematically examined immigrant entrepreneurs from a single university in comparison with both
domestic alumni and first-generation children of immigrants sharing the same ethnicity. Our findings
highlight the value of immigration in terms of breaking the persistence in entrepreneurship among Asians
and promoting potential high-growth entrepreneurship in the United States. Lastly, we contribute to the
empirical and theoretical discussions on entrepreneurship and innovation by examining the intersection of
immigration, culture, and education. The theory of immigrant entrepreneurs generally centers around the

25
voluntary migration of high-skilled individuals who bring knowledge, skills, and networks to the host
country. However, what we highlight in this paper is the potential contribution of second-generation
immigrants, who become culturally assimilated and educated in their host countries. There has been
relatively little discussion and examination on how this population can contribute to entrepreneurship and
innovation. Our paper presents an examination to this nascent topic.

26
Acknowledgements The authors wish to acknowledge the help of two anonymous reviewers who offered timely and constructive comments which greatly improved our work. We would also like to thank Wesley Koo for able research assistance. We acknowledge funding from the Stanford Technology Ventures Program (STVP), Sequoia Capital, the Kauffman Foundation, and the Richard Schulze Family Foundation. These funding sources did not influence the study design; in the collection, analysis and interpretation of data; in the writing of the report; and in the decision to submit the article for publication. References
Alesina, A. and Giuliano, P., 2015. Culture and institutions. Journal of Economic Literature, 53(4),
pp.898-944.
Algan, Y. and Cahuc, P., 2010. Inherited trust and growth. The American Economic Review, 100(5),
pp.2060-2092.
Amit, R., Muller, E. and Cockburn, I., 1995. Opportunity costs and entrepreneurial activity. Journal of
Business Venturing, 10(2), pp.95-106.
Åstebro, T., Bazzazian, N. and Braguinsky, S., 2012. Startups by recent university graduates and their
faculty: Implications for university entrepreneurship policy. Research Policy, 41(4), pp.663-677.
Autio, E., Kenney, M., Mustar, P., Siegel, D. and Wright, M., 2014. Entrepreneurial innovation: The
importance of context. Research Policy, 43(7), pp.1097-1108.
Baron, R.A., 2000. Counterfactual thinking and venture formation: The potential effects of thinking about
“what might have been”. Journal of business venturing, 15(1), pp.79-91.
Baumol, W.J., 2005. Education for innovation: Entrepreneurial breakthroughs versus corporate
incremental improvements. Innovation policy and the economy, 5, pp.33-56.
Blau, D.M., 1987. A time-series analysis of self-employment in the United States. Journal of political
economy, 95(3), pp.445-467.
Bramwell, A. and Wolfe, D.A., 2008. Universities and regional economic development: The
entrepreneurial University of Waterloo. Research Policy, 37(8), pp.1175-1187.
Burt, R.S., 2001. Attachment, decay, and social network. Journal of Organizational Behavior, 22(6),
pp.619-643.
Canello, J., 2016. Migrant entrepreneurs and local networks in industrial districts. Research
Policy, 45(10), pp.1953-1964.
Dahlstrand, A.L., 1997. Growth and inventiveness in technology-based spin-off firms. Research Policy 26
(3), 331–344.
Djankov, S., Y. Qian, G. Roland, E. Zhuravskaya. 2007. What makes a successful entrepreneur? evidence
from brazil. Working Paper 0104, Center for Economic and Financial Research.
Di Gregorio, D. and Shane, S., 2003. Why do some universities generate more start-ups than
27
others? Research policy, 32(2), pp.209-227.
Dobrev, S.D. and Barnett, W.P., 2005. Organizational roles and transition to entrepreneurship. Academy
of Management Journal, 48(3), pp.433-449.
Douglas, E.J. and Shepherd, D.A., 2000. Entrepreneurship as a utility maximizing response. Journal of
Business Venturing, 15(3), pp.231-251.
Dunn, T. and Holtz-Eakin, D., 2000. Financial capital, human capital, and the transition to self-
employment: Evidence from intergenerational links. Journal of labor economics, 18(2), pp.282-
305.
Eesley, C. and Wang, Y., 2017. Social influence in career choice: Evidence from a randomized field
experiment on entrepreneurial mentorship. Research Policy, 46(3), pp.636-650.
Eesley, C., 2016. Institutional barriers to growth: entrepreneurship, human capital and institutional
change. Organization Science, 27(5), pp.1290-1306.
Eesley, C.; J.B. Li, and D. Yang. 2016. Does Institutional Change in Universities Influence High-Tech
Entrepreneurship?: Evidence from China’s Project 985. Organization Science, 27(2): (March-
April): 446-461.
Eesley, C.E. and Roberts, E.B., 2012. Are you experienced or are you talented?: When does innate talent
versus experience explain entrepreneurial performance?. Strategic Entrepreneurship
Journal, 6(3), pp.207-219.
Eesley, Charles E. and William Miller. 2012. Impact: Stanford University Economic Impact via
Innovation and Entrepreneurship. Stanford University Working paper.
Etzkowitz, H., 1998. The norms of entrepreneurial science: cognitive effects of the new university–
industry linkages. Research policy, 27(8), pp.823-833.
Etzkowitz, H., 2003. Research groups as ‘quasi-firms’: the invention of the entrepreneurial
university. Research policy, 32(1), pp.109-121.
Evans, D.S. and Leighton, L.S., 1989. Some empirical aspects of entrepreneurship. The American
Economic Review, 79(3), pp.519-535.
Fairlie, Robert W. 1999. The Absence of the African-American Owned Business: An Analysis of the
Dynamics of Self-Employment, Journal of Labor Economics, 17(1), pp. 80-108
Fairlie, Robert W., and Alicia M. Robb. 2007. Why are Black-Owned Businesses Less Successful than
White-Owned Businesses? The Role of Families, Inheritances, and Business Human Capital,
Journal of Labor Economics, 25(2), pp.289-323.
Fernández, R., 2011. Does culture matter? In Handbook of social economics (Vol. 1, pp. 481-510). North-
Holland.

28
Filatotchev, I., Liu, X., Lu, J. and Wright, M., 2011. Knowledge spillovers through human mobility
across national borders: Evidence from Zhongguancun Science Park in China. Research
Policy, 40(3), pp.453-462.
Gibson, J. and McKenzie, D., 2014. Scientific mobility and knowledge networks in high emigration
countries: Evidence from the Pacific. Research Policy, 43(9), pp.1486-1495.
Goldfarb, B. and Henrekson, M., 2003. Bottom-up versus top-down policies towards the
commercialization of university intellectual property. Research policy, 32(4), pp.639-658.
Guerrero, M., Cunningham, J.A. and Urbano, D., 2015. Economic impact of entrepreneurial universities’
activities: An exploratory study of the United Kingdom. Research Policy, 44(3), pp.748-764.
Guiso, Luigi, Paola Sapienza, and Luigi Zingales. 2006. Does Culture Affect Economic Outcomes?
Journal of Economic Perspectives, 20(2), pp. 23-48.
Hart, D.M. and Acs, Z.J., 2011. High-tech immigrant entrepreneurship in the United States. Economic
Development Quarterly, 25(2), pp.116-129.
Hsu, David; Roberts, E.B.; Eesley, Charles. 2007. Entrepreneurs from Technology-Based Universities:
Evidence from MIT. Research Policy 36, 768–788.
Iyigun, M., A. Owen. 1998. Risk, entrepreneurship and human capital accumulation. American Economic
Review, 88 pp. 454–457
Kenney, M. and Patton, D., 2015. Gender, ethnicity and entrepreneurship in initial public offerings:
illustrations from an open database. Research Policy, 44(9), pp.1773-1784.
Laspita, Stavroula, Nicola Breugst, Stephan Heblich, and Holger Patzelt. 2012. Intergenerational
transmission of entrepreneurial intentions, Journal of Business Venturing, 27(2), pp. 414-435.
Lazear, Edward P. 2005. Entrepreneurship. Journal of Labor Economics, 23(4), pp. 649-80.
Levesque, M. and Minniti, M., 2006. The effect of aging on entrepreneurial behavior. Journal of Business
Venturing, 21(2), pp.177-194.
Lindquist, Matthew J., Joeri Sol, and Mirjam Van Praag. 2015. Why Do Entrepreneurial Parents Have
Entrepreneurial Children? Journal of Labor Economics, 33(2), pp. 269-296
Marx, M., Singh, J. and Fleming, L., 2015. Regional disadvantage? Employee non-compete agreements
and brain drain. Research Policy, 44(2), pp.394-404.
McClelland, D. 1961. The achieving society. Princeton, NJ: Van Nostrand.
Mitchell, R.K., Smith, B., Seawright, K.W. and Morse, E.A., 2000. Cross-cultural cognitions and the
venture creation decision. Academy of management Journal, 43(5), pp.974-993.
Murray, F., 2002. Innovation as co-evolution of scientific and technological networks: exploring tissue
engineering. Research policy, 31(8), pp.1389-1403.

29
Murray, F., 2004. The role of academic inventors in entrepreneurial firms: sharing the laboratory
life. Research Policy, 33(4), pp.643-659.
Nelson, A.J., 2014. From the ivory tower to the startup garage: Organizational context and
commercialization processes. Research Policy, 43(7), pp.1144-1156.
Nicolaou, N. and Birley, S., 2003. Social networks in organizational emergence: The university spinout
phenomenon. Management science, 49(12), pp.1702-1725.
Oliver, A.L., 2004. Biotechnology entrepreneurial scientists and their collaborations. Research
Policy, 33(4), pp.583-597.
Qin, F., 2015. Global talent, local careers: Circular migration of top Indian engineers and
professionals. Research Policy, 44(2), pp.405-420.
Roberts, E.B., 1991. Entrepreneurs in high technology: Lessons from MIT and beyond. Oxford University
Press.
Saxenian, AnnaLee. 1999. Silicon Valley’s New Immigrant Entrepreneurs. San Francisco: Public Policy
Institute of California.
Saxenian, AnnaLee. 2006. The New Argonauts: Regional Advantage in a Global Economy. Cambridge,
Mass.: Harvard University Press.
Schumpeter, J.A., 1934. The theory of economic development: An inquiry into profits, capital, credit,
interest, and the business cycle (Vol. 55). Transaction publishers.
Shin, Gi-Wook and Joon Nak Choi. 2015. Global Talent: Skilled Labor as Social Capital in Korea.
Stanford, Ca.: Stanford University Press.
Sørensen, J.B., 2007. Closure and exposure: Mechanisms in the intergenerational transmission of self-
employment. In The Sociology of Entrepreneurship (pp. 83-124). Emerald Group Publishing
Limited.
Utterback, J.M., Meyer, M., Roberts, E. and Reitberger, G., 1988. Technology and industrial innovation
in Sweden: a study of technology-based firms formed between 1965 and 1980. Research
Policy, 17(1), pp.15-26.
Vohora, A., Wright, M. and Lockett, A., 2004. Critical junctures in the development of university high-
tech spinout companies. Research policy, 33(1), pp.147-175.
Wong, P.K., Ho, Y.P. and Autio, E., 2005. Entrepreneurship, innovation and economic growth: Evidence
from GEM data. Small business economics, 24(3), pp.335-350.
Zhang, H., Patton, D. and Kenney, M., 2013. Building global-class universities: Assessing the impact of
the 985 Project. Research Policy, 42(3), pp.765-775.

30
Table 1. Summary statistics
Variable Mean Std. Dev. Min Max Obs
Entrepreneurship 0.32 0.47 0 1 13465 Invest as an angel or venture capital 0.10 0.31 0 1 13465 Entrepreneur Investor 0.07 0.26 0 1 13465 Incorporated company 0.32 0.47 0 1 13465 Unincorporated business 0.10 0.31 0 1 13465 Partnership 0.07 0.26 0 1 13465 Informal business 0.06 0.24 0 1 13465 Stanford graduating year 1985.86 16.65 1940 2010 13465 Graduate degree 0.71 0.45 0 1 13465 Age 49.81 16.54 21 93 13465 Female 0.37 0.48 0 1 13465 Asian only 0.15 0.36 0 1 13465 White only 0.73 0.44 0 1 13465 Black only 0.02 0.14 0 1 13465 Hispanic only 0.04 0.19 0 1 13465 Other ethnicity 0.06 0.24 0 1 13465 Foreign national 0.15 0.35 0 1 13465 China 0.01 0.08 0 1 13465 Japan 0.01 0.10 0 1 13465 Korea 0.01 0.07 0 1 13465 Taiwan 0.01 0.07 0 1 13465 India 0.01 0.11 0 1 13465 Open to new experience 4.19 0.75 1 5 13261 Expect more good things 4.34 0.69 1 5 13269 Expect the best in difficult times 3.63 0.89 1 5 13274 Parent entrepreneurial experience 0.18 0.38 0 1 13465 Participate in Center for Entrepreneurship Studies 0.02 0.14 0 1 12646 Participate in Stanford Technology Ventures Program 0.03 0.17 0 1 12641
Notes: Data from the Stanford Alumni Survey. Ethnicity and nationality as reported by the respondent. Others include respondents who select other categories or multiple ethnicities.
31
Table 2. Entrepreneurship by ethnicity (1) (2) (3) (4) (5) (6) (7) (8)
VARIABLES Entrepreneur Entrepreneur Entrepreneur Entrepreneur Angel or
VC investor
Entrepreneur Investor
Incorporated company
Unincorporated
business
Asian -0.104*** -0.0195*
(0.0103) (0.0117)
Other Asian -0.0909*** -0.0684*** -0.0240** -0.0309*** -0.0368*** -0.0340*** (0.0168) (0.0163) (0.0104) (0.00819) (0.0135) (0.0124)
Chinese 0.00644 0.0153 0.0201* 0.0104 0.0149 0.00369 (0.0155) (0.0151) (0.0108) (0.00924) (0.0131) (0.0119)
Indian 0.0478* 0.0444* -0.00765 -0.0111 0.0307 0.00303 (0.0246) (0.0244) (0.0151) (0.0129) (0.0210) (0.0184)
Black 0.0216 0.0735*** 0.0741*** 0.0775*** -0.0162 -0.0184 0.0243 0.0432* (0.0252) (0.0278) (0.0278) (0.0271) (0.0153) (0.0123) (0.0211) (0.0221)
Hispanic -0.0538*** 0.00389 0.00399 -0.00599 -0.0149 -0.00488 0.00348 0.0436** (0.0181) (0.0194) (0.0194) (0.0191) (0.0124) (0.0112) (0.0158) (0.0175)
Other -0.0119 0.0663*** 0.0671*** 0.0634*** -0.0171* -0.00888 0.0410*** 0.0373*** (0.0148) (0.0160) (0.0160) (0.0153) (0.00924) (0.00802) (0.0129) (0.0131)
Foreign 0.0561*** 0.0688*** 0.0689*** 0.0615*** 0.0260*** 0.0257*** 0.0773*** 0.00244 (0.0110) (0.0125) (0.0126) (0.0122) (0.00905) (0.00814) (0.0114) (0.0103)
Graduate degree 0.00647 -0.0242*** -0.0247*** -0.0243*** -0.00809 -0.00127 -0.0137* -0.00640 (0.00768) (0.00938) (0.00936) (0.00911) (0.00592) (0.00498) (0.00747) (0.00757)
Female -0.161*** -0.114*** -0.113*** -0.110*** -
0.0597*** -0.0511*** -0.103*** -0.0496*** (0.00707) (0.00867) (0.00867) (0.00847) (0.00532) (0.00440) (0.00649) (0.00688)
Parent entrepreneurship
0.193*** 0.0614*** 0.0589*** 0.116*** 0.105*** (0.0105) (0.00778) (0.00701) (0.00942) (0.00940)
Open to new experience
0.0152** 0.0190*** 0.0147*** 0.00772 0.00672 (0.00626) (0.00418) (0.00356) (0.00523) (0.00513)
Expect the best 0.0137*** -0.00580 -0.00341 0.0152*** 0.00176 (0.00529) (0.00369) (0.00325) (0.00449) (0.00438)
Expect more good things
0.0993*** 0.0190*** 0.0222*** 0.0608*** 0.0640*** (0.00610) (0.00404) (0.00349) (0.00502) (0.00489)
Age FE No Yes Yes Yes Yes Yes Yes Yes Graduation year FE No Yes Yes Yes Yes Yes Yes Yes
Department FE No Yes Yes Yes Yes Yes Yes Yes Observations 17,361 13,465 13,465 13,222 13,222 13,222 13,222 13,222 R-squared 0.035 0.125 0.127 0.182 0.112 0.106 0.144 0.106
Notes: Ethnicity and nationality as reported by the respondent. Others include respondents who select other categories or multiple ethnicities. Robust standard errors are reported in parentheses. *** p<0.01, ** p<0.05, * p<0.1. The number of observations in column (1) is higher than the other columns because column (1) does not include any fixed effects, whereas column (2) onwards includes all 3 (age, graduation year, and department) fixed effects. Some respondents did not provide information on birth year, graduation year, or the name of their departments. Hence, including the fixed effects reduces the sample size. Including age fixed effects reduces the sample size to 17,343. Additionally, including the graduation year fixed effects reduces the sample size to 16,202. Finally, adding the department fixed effects reduces the sample size to 13,465.

32
Table 3. Entrepreneur and investor status based on ethnicity and nationality (1) (2) (3) (4) (5) (6)
VARIABLES Entrepreneur Angel or VC investor Entrepreneur Investor
Asian 0.0335** 0.00576 -0.000182 (0.0133) (0.00856) (0.00703)
Other Asian -0.0135 -0.0325*** -0.0301*** (0.0202) (0.0103) (0.00731)
Chinese 0.0411** 0.0290** 0.0168 (0.0177) (0.0126) (0.0105)
Indian 0.107*** 0.0116 0.00479 (0.0343) (0.0196) (0.0162)
Black 0.0776*** 0.0779*** -0.0178 -0.0176 -0.0186 -0.0185 (0.0286) (0.0286) (0.0157) (0.0157) (0.0125) (0.0125)
Hispanic -0.0300 -0.0299 -0.0257** -0.0256** -0.0114 -0.0113 (0.0204) (0.0204) (0.0118) (0.0118) (0.0104) (0.0104)
Other 0.0522*** 0.0528*** -0.0136 -0.0134 -0.00954 -0.00938 (0.0164) (0.0164) (0.00942) (0.00942) (0.00781) (0.00781)
Asian*Foreign -0.120*** -0.0204 -0.0228 (0.0249) (0.0178) (0.0156)
Other Asian*Foreign -0.145*** 0.0167 -0.00445 (0.0340) (0.0239) (0.0195)
Chinese*Foreign -0.0917*** -0.0281 -0.0207 (0.0329) (0.0242) (0.0212)
Indian*Foreign -0.139*** -0.0391 -0.0330 (0.0487) (0.0302) (0.0260)
Black*Foreign 0.00254 0.00331 0.0177 0.0188 0.000845 0.00172 (0.0862) (0.0861) (0.0658) (0.0658) (0.0560) (0.0560)
Hispanic*Foreign 0.0901* 0.0905* 0.0436 0.0446 0.0253 0.0261 (0.0510) (0.0510) (0.0398) (0.0397) (0.0368) (0.0367)
Other*Foreign 0.0657 0.0663 -0.0261 -0.0249 0.00161 0.00255 (0.0447) (0.0447) (0.0321) (0.0320) (0.0312) (0.0312)
Foreign 0.0908*** 0.0897*** 0.0307** 0.0296** 0.0306*** 0.0296*** (0.0167) (0.0167) (0.0127) (0.0125) (0.0116) (0.0115)
Base controls Yes Yes Yes Yes Yes Yes Age fixed effects Yes Yes Yes Yes Yes Yes Graduation year FE Yes Yes Yes Yes Yes Yes Department FE Yes Yes Yes Yes Yes Yes Observations 13,222 13,222 13,222 13,222 13,222 13,222 R-squared 0.183 0.184 0.112 0.113 0.106 0.107
Notes: Base controls include gender, whether one received a graduate degree, parental entrepreneurship, and the three measures of optimism. Ethnicity and nationality as reported by the respondent. Others include respondents who select other categories or multiple ethnicities. Robust standard errors are reported in parentheses. *** p<0.01, ** p<0.05, * p<0.1.

33
Table 4. Entrepreneurship status and Stanford entrepreneurship program participation (1) (2) (3) (4)
VARIABLES Entrepreneur Angel or VC investor
Entrepreneur Investor
Utilize Stanford network for
funding
A. Program participation
Participate in CES 0.171*** 0.0815*** 0.0497** 0.203***
(0.0317) (0.0279) (0.0249) (0.0524)
Participate in STVP 0.0612*** 0.00902 0.0106 0.0743***
(0.0232) (0.0169) (0.0144) (0.0283)
R-squared 0.180 0.113 0.107 0.055
B. Level of participation
Level of participation in CES 0.109*** 0.0691*** 0.0710*** 0.200***
(0.0129) (0.0124) (0.0120) (0.0268)
Level of participation in STVP 0.0535*** 0.0261*** 0.0214*** 0.0449***
(0.0107) (0.00876) (0.00774) (0.0130)
R-squared 0.185 0.119 0.115 0.085
Base controls Yes Yes Yes Yes
Ethnicity Yes Yes Yes Yes
Ethnicity*Foreign Yes Yes Yes Yes
Age fixed effects Yes Yes Yes Yes
Graduation year FE Yes Yes Yes Yes
Department FE Yes Yes Yes Yes
Observations 12,454 12,454 12,454 12,389 Notes: Base controls include gender, whether one received a graduate degree, parental entrepreneurship, and the three measures of optimism. Ethnicity and nationality as reported by the respondent. Others include respondents who select other categories or multiple ethnicities. Robust standard errors are reported in parentheses. *** p<0.01, ** p<0.05, * p<0.1.
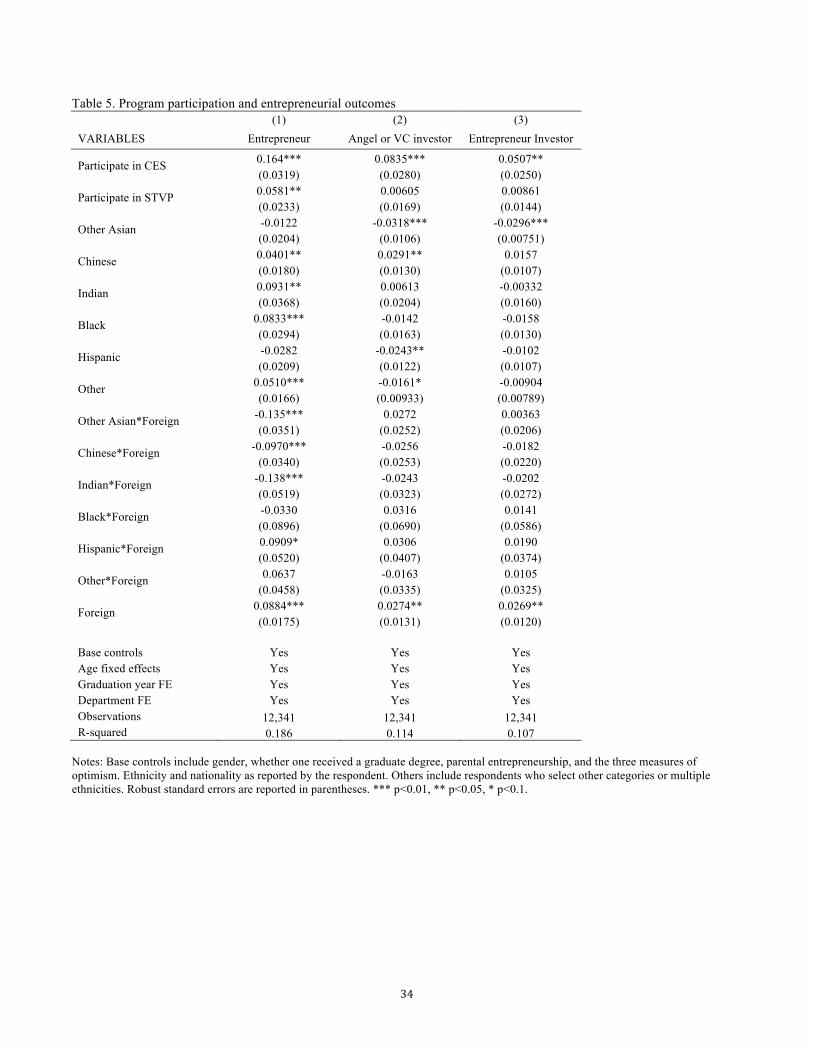
34
Table 5. Program participation and entrepreneurial outcomes (1) (2) (3) VARIABLES Entrepreneur Angel or VC investor Entrepreneur Investor
Participate in CES 0.164*** 0.0835*** 0.0507** (0.0319) (0.0280) (0.0250)
Participate in STVP 0.0581** 0.00605 0.00861 (0.0233) (0.0169) (0.0144)
Other Asian -0.0122 -0.0318*** -0.0296*** (0.0204) (0.0106) (0.00751)
Chinese 0.0401** 0.0291** 0.0157 (0.0180) (0.0130) (0.0107)
Indian 0.0931** 0.00613 -0.00332 (0.0368) (0.0204) (0.0160)
Black 0.0833*** -0.0142 -0.0158 (0.0294) (0.0163) (0.0130)
Hispanic -0.0282 -0.0243** -0.0102 (0.0209) (0.0122) (0.0107)
Other 0.0510*** -0.0161* -0.00904 (0.0166) (0.00933) (0.00789)
Other Asian*Foreign -0.135*** 0.0272 0.00363 (0.0351) (0.0252) (0.0206)
Chinese*Foreign -0.0970*** -0.0256 -0.0182 (0.0340) (0.0253) (0.0220)
Indian*Foreign -0.138*** -0.0243 -0.0202 (0.0519) (0.0323) (0.0272)
Black*Foreign -0.0330 0.0316 0.0141 (0.0896) (0.0690) (0.0586)
Hispanic*Foreign 0.0909* 0.0306 0.0190 (0.0520) (0.0407) (0.0374)
Other*Foreign 0.0637 -0.0163 0.0105 (0.0458) (0.0335) (0.0325)
Foreign 0.0884*** 0.0274** 0.0269** (0.0175) (0.0131) (0.0120)
Base controls Yes Yes Yes Age fixed effects Yes Yes Yes Graduation year FE Yes Yes Yes Department FE Yes Yes Yes Observations 12,341 12,341 12,341 R-squared 0.186 0.114 0.107
Notes: Base controls include gender, whether one received a graduate degree, parental entrepreneurship, and the three measures of optimism. Ethnicity and nationality as reported by the respondent. Others include respondents who select other categories or multiple ethnicities. Robust standard errors are reported in parentheses. *** p<0.01, ** p<0.05, * p<0.1.

35
Table 6. Program participation by ethnicity and nationality (1) (2) (3) (4) (5) (6) (7) (8)
VARIABLES Participate in CES Participate in STVP Participation level in CES
Participation level in STVP
Asian 0.00106 0.0152** 0.0328 0.0762 (0.00500) (0.00706) (0.0370) (0.0472)
Other Asian -0.0132** -0.00291 -0.0938** 0.00484 (0.00548) (0.00958) (0.0435) (0.0658)
Chinese 0.00482 0.0173* 0.0731 0.0703 (0.00715) (0.00986) (0.0547) (0.0655)
Indian 0.00303 0.0420* 0.119 0.233* (0.0144) (0.0232) (0.103) (0.134)
Black 0.00194 0.00158 0.0179 0.0179 0.0746 0.0739 0.288** 0.289** (0.00996) (0.00997) (0.0141) (0.0141) (0.0822) (0.0824) (0.133) (0.133)
Hispanic -0.000203 -0.000588 -0.00408 -0.00430 0.0511 0.0497 0.0513 0.0494 (0.00766) (0.00766) (0.00893) (0.00893) (0.0682) (0.0682) (0.0910) (0.0910)
Other 0.00414 0.00381 0.00223 0.00224 0.0193 0.0170 0.0463 0.0459 (0.00621) (0.00622) (0.00742) (0.00743) (0.0407) (0.0407) (0.0579) (0.0579)
Asian*Foreign -0.0204** -0.00172 -0.205*** -0.138 (0.0102) (0.0143) (0.0762) (0.0953)
Other Asian*Foreign -0.0131 -0.00901 -0.0446 -0.156 (0.0120) (0.0172) (0.104) (0.131)
Chinese*Foreign -0.0117 0.00132 -0.242** -0.0986 (0.0140) (0.0204) (0.0951) (0.126)
Indian*Foreign -0.0273 0.00336 -0.326** -0.215 (0.0193) (0.0345) (0.128) (0.176)
Black*Foreign 0.0426 0.0436 0.0103 0.0103 0.268 0.275 -0.438 -0.432 (0.0553) (0.0553) (0.0601) (0.0601) (0.315) (0.315) (0.337) (0.338)
Hispanic*Foreign -0.00822 -0.00721 -0.0100 -0.0101 -0.131 -0.126 -0.173 -0.166 (0.0272) (0.0272) (0.0262) (0.0262) (0.179) (0.179) (0.201) (0.201)
Other*Foreign 0.00467 0.00575 -0.0296 -0.0297 -0.129 -0.125 -0.277 -0.271 (0.0227) (0.0227) (0.0199) (0.0199) (0.109) (0.108) (0.206) (0.205)
Foreign 0.00313 0.00211 0.0179** 0.0179** 0.0598 0.0556 0.232*** 0.226*** (0.00711) (0.00704) (0.00819) (0.00819) (0.0569) (0.0566) (0.0648) (0.0641)
Base controls Yes Yes Yes Yes Yes Yes Yes Yes Age fixed effects Yes Yes Yes Yes Yes Yes Yes Yes Graduation year FE Yes Yes Yes Yes Yes Yes Yes Yes Department FE Yes Yes Yes Yes Yes Yes Yes Yes Observations 12,445 12,445 12,440 12,440 2,312 2,312 2,647 2,647 R-squared 0.132 0.132 0.071 0.072 0.373 0.375 0.169 0.171
Notes: Base controls include gender, whether one received a graduate degree, parental entrepreneurship, and the three measures of optimism. Ethnicity and nationality as reported by the respondent. Others include respondents who select other categories or multiple ethnicities. Robust standard errors are reported in parentheses. *** p<0.01, ** p<0.05, * p<0.1.

36
Table 7. Determinants of entrepreneurship by ethnicity and nationality (1) (2) (3) (4) VARIABLES Optimism Parent is entrepreneur
Asian -0.162*** -0.0270** (0.0587) (0.0119)
Other Asian -0.204** -0.0488*** (0.101) (0.0183)
Chinese -0.186** -0.0165 (0.0762) (0.0163)
Indian 0.150 -0.0136 (0.133) (0.0293)
Black 0.0951 0.101 -0.0483** -0.0481** (0.139) (0.139) (0.0225) (0.0225)
Hispanic 0.233** 0.237** -0.0444** -0.0442** (0.0978) (0.0978) (0.0186) (0.0186)
Other -0.0559 -0.0497 -0.00720 -0.00694 (0.0801) (0.0801) (0.0156) (0.0156)
Asian*Foreign 0.269** -0.0314 (0.106) (0.0218)
Other Asian*Foreign 0.0917 -0.0236 (0.158) (0.0302)
Chinese*Foreign 0.198 -0.0557* (0.142) (0.0287)
Indian*Foreign 0.459** -0.0325 (0.192) (0.0420)
Black*Foreign 0.416 0.412 0.0841 0.0806 (0.321) (0.321) (0.0942) (0.0942)
Hispanic*Foreign 0.190 0.183 0.139*** 0.135*** (0.225) (0.225) (0.0504) (0.0504)
Other*Foreign 0.168 0.162 0.0749* 0.0715 (0.191) (0.191) (0.0455) (0.0455)
Foreign -0.0332 -0.0301 0.0300** 0.0335** (0.0677) (0.0678) (0.0148) (0.0148)
Base controls Yes Yes Yes Yes Age fixed effects Yes Yes Yes Yes Graduation year FE Yes Yes Yes Yes Department FE Yes Yes Yes Yes Observations 13,222 13,222 13,465 13,465 R-squared 0.033 0.034 0.034 0.035
Notes: Base controls include gender, whether one received a graduate degree, parental entrepreneurship, and the three measures of optimism. Ethnicity and nationality as reported by the respondent. Others include respondents who select other categories or multiple ethnicities. Robust standard errors are reported in parentheses. *** p<0.01, ** p<0.05, * p<0.1.

37
Table 8. Intergenerational correlation of entrepreneurship by ethnicity and nationality (1) (2) (3) VARIABLES Entrepreneur Entrepreneur Entrepreneur
Parent entrepreneurship 0.224***
Parent entrepreneurship 0.227*** 0.227***
(0.0111) (0.0268) (0.0268)
Parent entrepreneurship* Asian -0.00186 Parent entrepreneurship*
Korean 0.280** 0.272
(0.0287) (0.140) (0.216)
Parent entrepreneurship* Black 0.0607 Parent entrepreneurship*
Japanese 0.143 0.202
(0.0687) (0.152) (0.176) Parent entrepreneurship* Hispanic
-0.0164 Parent entrepreneurship* Chinese
0.519*** 0.292*** (0.0510) (0.105) (0.110)
Parent entrepreneurship* Others
0.0174 Parent entrepreneurship* Indian
0.0609 0.0616 (0.0374) (0.0939) (0.152)
Parent entrepreneurship* Taiwanese
0.234* 0.259 (0.132) (0.193)
Parent entrepreneurship* US -0.00820 0.00811
(0.0288) (0.0297) Parent entrepreneurship*
Korean*Post 1997 0.0162
(0.284) Parent entrepreneurship*
Japanese*Post 1997 -0.193
(0.336) Parent entrepreneurship*
Chinese*Post 1997 0.399***
(0.122) Parent entrepreneurship*
Indian*Post 1997 0.0253
(0.185) Parent entrepreneurship*
Taiwanese*Post 1997 -0.0296
(0.254) Parent entrepreneurship*
US*Post 1997 -0.0516**
(0.0215) Ethnicity dummies Yes Ethnicity dummies No No Country dummies*Post 1997 No Country dummies*Post 1997 Yes Yes Country dummies No Country dummies Yes Yes Base controls Yes Base controls Yes Yes Age fixed effects Yes Age fixed effects Yes Yes Stanford graduation year FE Yes Stanford graduation year FE Yes Yes Observations 16,202 Observations 16,359 16,359 R-squared 0.121 R-squared 0.123 0.124
Notes: Base controls include gender, whether one received a graduate degree, parental entrepreneurship, and the three measures of optimism. Ethnicity and nationality as reported by the respondent. Others include respondents who select other categories or multiple ethnicities. Robust standard errors are reported in parentheses. *** p<0.01, ** p<0.05, * p<0.1.

38
Appendix Table 1 Logit regressions on responder status
Pr(respond) Pr(respond) Pr(respond) Pr(respond) Female 1.051** 1.143 (0.018) (0.514) Earth Sciences 1.074 0.535 (0.053) (0.550) Education 1.183*** 0.662 (0.039) (0.905) Engineering 0.883*** 0.280 (0.020) (0.236) Law 0.741*** 0.565 (0.027) (0.185) Medicine 1.698*** 0.170 (0.048) (0.162) Humanities & Sciences 0.508*** (0.011) Graduation Year 0.991*** (0.000) Gender*Graduation year FE Yes Gender*school FE Yes Graduation Year FE Yes Observations 133,916 139,004 143,632 70,926
Notes: Robust standard errors are reported in parentheses. *** p<0.01, ** p<0.05, * p<0.1.

39
Appendix Table 2 Entrepreneurship in the US based on ethnicity and nationality
(1) (2) (3) (4) (5)
VARIABLES Entrepreneur Entrepreneurship in the US Report country
Asian -0.00665 (0.0131)
Other Asian -0.0131 -0.0447** -0.0444** -0.0362 (0.0202) (0.0196) (0.0196) (0.0537)
Chinese 0.0420** 0.00394 0.00448 -0.0635 (0.0177) (0.0177) (0.0177) (0.0388)
Indian 0.108*** 0.0420 0.0427 -0.0490 (0.0343) (0.0329) (0.0329) (0.0684)
Black 0.0781*** 0.0508* 0.0510* 0.0512* -0.0249 (0.0286) (0.0282) (0.0282) (0.0282) (0.0494)
Hispanic -0.0296 -0.0580*** -0.0579*** -0.0577*** -0.0847 (0.0204) (0.0200) (0.0200) (0.0200) (0.0548)
Other 0.0532*** 0.0203 0.0207 0.0210 -0.00639 (0.0164) (0.0163) (0.0163) (0.0163) (0.0345)
Asian*Foreign 0.0145 (0.0233)
Other Asian*Foreign 0.0130 0.0494 (0.0320) (0.0745)
Other Asian *Foreign*Korea -0.0492 0.0500 (0.0504) (0.0465)
Other Asian *Foreign*Japan -0.238*** -0.0445 (0.0416) (0.0372)
Other Asian *Foreign*Rest -0.0831* 0.0670 (0.0487) (0.0488)
Chinese*Foreign -0.0919*** -0.00266 -0.00282 0.00867 (0.0329) (0.0305) (0.0305) (0.0637)
Indian*Foreign -0.139*** 0.0170 0.0170 0.000927 (0.0487) (0.0456) (0.0456) (0.0893)
Black*Foreign 0.00388 0.145 0.0867 0.0873 0.161 (0.0860) (0.150) (0.103) (0.103) (0.101)
Hispanic*Foreign 0.0901* -0.0877 0.0663 0.0662 0.0981 (0.0510) (0.0665) (0.0567) (0.0567) (0.0799)
Other*Foreign 0.0662 -0.0692 0.0522 0.0520 0.0127 (0.0447) (0.0657) (0.0516) (0.0516) (0.0657)
Foreign 0.0897*** -0.610*** -0.101*** -0.101*** 0.0216 (0.0167) (0.0264) (0.0158) (0.0158) (0.0244)
Base controls Yes Yes Yes Yes Yes Age fixed effects Yes Yes Yes Yes Yes Graduation year FE Yes Yes Yes Yes Yes Department FE Yes Yes Yes Yes Yes Observations 13,222 12,653 12,653 12,653 4,281 R-squared 0.185 0.136 0.136 0.137 0.242
Notes: Base controls include gender, whether one received a graduate degree, parental entrepreneurship, and the three measures of optimism. Ethnicity and nationality as reported by the respondent. Others include respondents who select other categories or multiple ethnicities. Robust standard errors are reported in parentheses. *** p<0.01, ** p<0.05, * p<0.1.
Related Documents