International Journal of Advanced Research in Engineering and Technology (IJARET), ISSN 0976 – 6480(Print), ISSN 0976 – 6499(Online) Volume 5, Issue 4, April (2014), pp. 119-130 © IAEME 119 THE PERFORMANCE OF VARIOUS THRESHOLDING ALGORITHMS FOR SEGMENTATION OF BIOMEDICAL IMAGE Manoj R. Tarambale 1 and Nitin S. Lingayat 2 1 Electrical HOD, Marathwada Mitra Mandal’s College of Engineering, Pune, Pin-411052, University of Pune, Maharashtra, India. 2 Electrical HOD, DR. Babasaheb Ambedkar Technological University’s Institute of Petrochemical Engineering, Lonere, Dist. Raigard, Maharashtra, India Pin–402103. ABSTRACT In biomedical image processing, segmentation is required for separating suspicious organ from the medical radiography. In segmentation techniques, thresholding is widely used because of its intuitive properties, simplicity of implementation and computational speed. Thresholding divided intensity of the image into two sub groups 0 or 255 for 8 bit image. Biomedical images contain complex anatomy which makes the segmentation task difficult. Various algorithms have been proposed to threshold the image. These algorithms take into consideration one or two properties of image for computing threshold. This paper contains performance comparison of various thresholding algorithms by applying on the chest radiograph (X-ray Image). Keywords: Diagnosis, Feature, Global Thresholding, Segmentation, Transformation. I. INTRODUCTION Biomedical image processing is an emerging technology which is widely used for diagnosing suspicious diseases using medical radiography and computer aided diagnosis. In biomedical image processing, segmentation is done to separate suspicious region from the rest of the image. Feature extraction and classification results are totally depending upon how accurately the region is segmented. Segmentation technique partitions an image into distinct regions containing each pixel with similar attributes. For meaningful and useful image analysis and interpretation, the regions should strongly relate to depict objects or features of interest. Meaningful segmentation is the first step from the low-level image processing for transforming a grayscale or colour image into one or more other INTERNATIONAL JOURNAL OF ADVANCED RESEARCH IN ENGINEERING AND TECHNOLOGY (IJARET) ISSN 0976 - 6480 (Print) ISSN 0976 - 6499 (Online) Volume 5, Issue 4, April (2014), pp. 119-130 © IAEME: www.iaeme.com/ijaret.asp Journal Impact Factor (2014): 7.8273 (Calculated by GISI) www.jifactor.com IJARET © I A E M E

Welcome message from author
This document is posted to help you gain knowledge. Please leave a comment to let me know what you think about it! Share it to your friends and learn new things together.
Transcript
International Journal of Advanced Research in Engineering and Technology (IJARET), ISSN 0976 –
6480(Print), ISSN 0976 – 6499(Online) Volume 5, Issue 4, April (2014), pp. 119-130 © IAEME
119
THE PERFORMANCE OF VARIOUS THRESHOLDING ALGORITHMS
FOR SEGMENTATION OF BIOMEDICAL IMAGE
Manoj R. Tarambale1
and Nitin S. Lingayat2
1Electrical HOD, Marathwada Mitra Mandal’s College of Engineering,
Pune, Pin-411052, University of Pune, Maharashtra, India. 2Electrical HOD, DR. Babasaheb Ambedkar Technological University’s Institute of Petrochemical
Engineering, Lonere, Dist. Raigard, Maharashtra, India Pin–402103.
ABSTRACT In biomedical image processing, segmentation is required for separating suspicious organ
from the medical radiography. In segmentation techniques, thresholding is widely used because of its
intuitive properties, simplicity of implementation and computational speed. Thresholding divided
intensity of the image into two sub groups 0 or 255 for 8 bit image. Biomedical images contain
complex anatomy which makes the segmentation task difficult. Various algorithms have been
proposed to threshold the image. These algorithms take into consideration one or two properties of
image for computing threshold. This paper contains performance comparison of various thresholding
algorithms by applying on the chest radiograph (X-ray Image).
Keywords: Diagnosis, Feature, Global Thresholding, Segmentation, Transformation.
I. INTRODUCTION
Biomedical image processing is an emerging technology which is widely used for diagnosing
suspicious diseases using medical radiography and computer aided diagnosis. In biomedical image
processing, segmentation is done to separate suspicious region from the rest of the image. Feature
extraction and classification results are totally depending upon how accurately the region is
segmented.
Segmentation technique partitions an image into distinct regions containing each pixel with
similar attributes. For meaningful and useful image analysis and interpretation, the regions should
strongly relate to depict objects or features of interest. Meaningful segmentation is the first step from
the low-level image processing for transforming a grayscale or colour image into one or more other
INTERNATIONAL JOURNAL OF ADVANCED RESEARCH IN ENGINEERING
AND TECHNOLOGY (IJARET)
ISSN 0976 - 6480 (Print) ISSN 0976 - 6499 (Online) Volume 5, Issue 4, April (2014), pp. 119-130 © IAEME: www.iaeme.com/ijaret.asp Journal Impact Factor (2014): 7.8273 (Calculated by GISI) www.jifactor.com
IJARET
© I A E M E
International Journal of Advanced Research in Engineering and Technology (IJARET), ISSN 0976 –
6480(Print), ISSN 0976 – 6499(Online) Volume 5, Issue 4, April (2014), pp. 119-130 © IAEME
120
images, to high-level image description in terms of features, objects, and scenes [1]. The success of
image analysis depends on the reliability of segmentation, but an accurate partitioning of an image is
generally a very challenging job. Segmentation is typically used to identify objects or other relevant
information in digital images. There are many different ways to perform image segmentation
includes-Thresholding, Color-based, Transform methods and Texture methods based. An effective
approach to performing image segmentation includes using algorithms, tools, and a comprehensive
environment for data analysis, visualization, and algorithm development.
In digital image processing, thresholding is a well-known technique for image segmentation.
Thresholding is a segmentation technique which is widely used for separating solid region from the
background, separating important area from the rest of the image or finding the edges of the image
[2]. Because of its wide applicability to other areas of the digital image processing, quite a number of
thresholding methods have been proposed over the years. Depending on the application, threshold
algorithm is selected.
Thresholding technique produces segments having pixels with the similar intensities.
Thresholding is a useful technique for establishing boundaries in images that contains solid objects
resting on a contrasting background. There exit a large number of gray-level based segmentation
methods using either global or local information. The thresholding technique requires that an object
has homogenous intensity and background with a different intensity level [3]. To make segmentation
more robust, the threshold should be automatically selected by the system. Knowledge about the
objects, the application, and the environment should be used to choose the threshold automatically by
seeing intensity characteristics of the objects, sizes of the objects, fractions of an image occupied by
the objects and number of different types of objects appearing in an image.
II. GLOBAL THRESHOLDING
Global thresholding is the simplest and most widely used of all possible segmentation
methods. Global thresholding consists of setting an intensity value (threshold) such that all pixels
having intensity value below the threshold belong to one phase; the remainder belongs to the other.
Global thresholding is as good as the degree of intensity separation between the two peaks in the
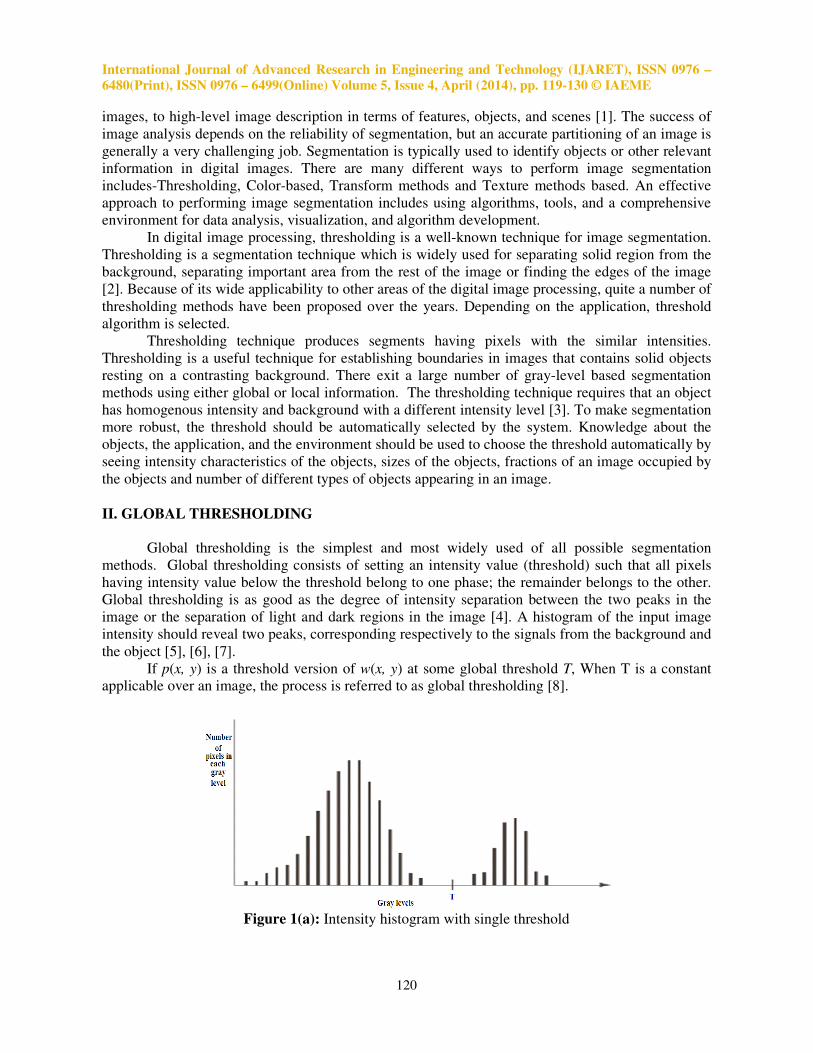
image or the separation of light and dark regions in the image [4]. A histogram of the input image
intensity should reveal two peaks, corresponding respectively to the signals from the background and
the object [5], [6], [7].
If p(x, y) is a threshold version of w(x, y) at some global threshold T, When T is a constant
applicable over an image, the process is referred to as global thresholding [8].
Figure 1(a): Intensity histogram with single threshold
International Journal of Advanced Research in Engineering and Technology (IJARET), ISSN 0976 –
6480(Print), ISSN 0976 – 6499(Online) Volume 5, Issue 4, April (2014), pp. 119-130 © IAEME
121
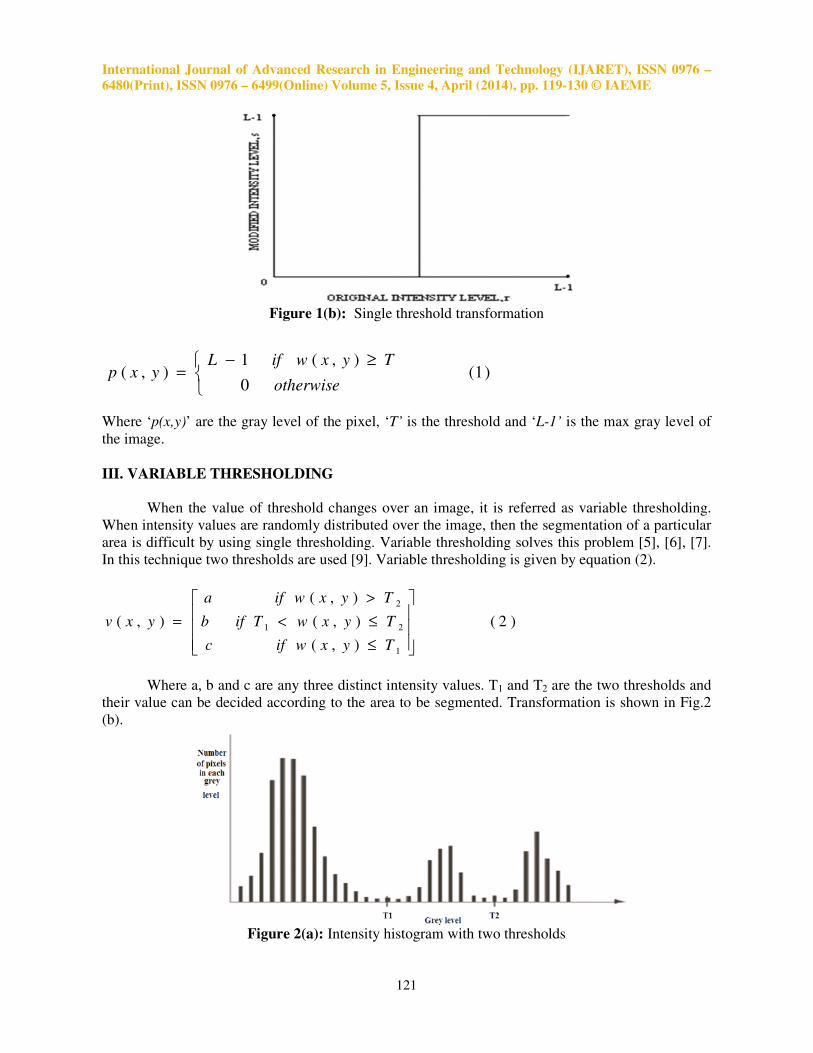
Figure 1(b): Single threshold transformation
)1(0
),(1),(
≥−
=otherwise
TyxwifLyxp
Where ‘p(x,y)’ are the gray level of the pixel, ‘T’ is the threshold and ‘L-1’ is the max gray level of
the image.
III. VARIABLE THRESHOLDING
When the value of threshold changes over an image, it is referred as variable thresholding.
When intensity values are randomly distributed over the image, then the segmentation of a particular
area is difficult by using single thresholding. Variable thresholding solves this problem [5], [6], [7].
In this technique two thresholds are used [9]. Variable thresholding is given by equation (2).
)2(
),(
),(
),(
),(
1
21
2
≤
≤<
>
=
Tyxwifc
TyxwTifb
Tyxwifa
yxv
Where a, b and c are any three distinct intensity values. T1 and T2 are the two thresholds and
their value can be decided according to the area to be segmented. Transformation is shown in Fig.2
(b).
Figure 2(a): Intensity histogram with two thresholds
International Journal of Advanced Research in Engineering and Technology (IJARET), ISSN 0976 –
6480(Print), ISSN 0976 – 6499(Online) Volume 5, Issue 4, April (2014), pp. 119-130 © IAEME
122
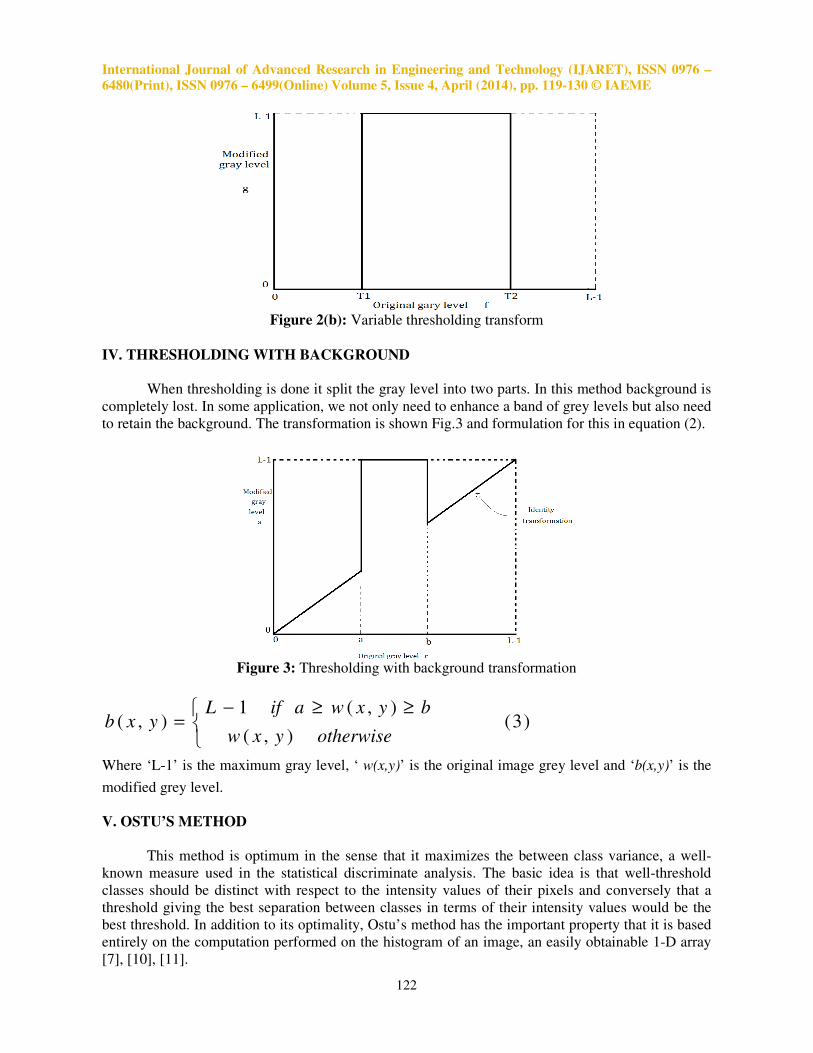
Figure 2(b): Variable thresholding transform
IV. THRESHOLDING WITH BACKGROUND
When thresholding is done it split the gray level into two parts. In this method background is
completely lost. In some application, we not only need to enhance a band of grey levels but also need
to retain the background. The transformation is shown Fig.3 and formulation for this in equation (2).
Figure 3: Thresholding with background transformation
)3(),(
),(1),(
≥≥−
=otherwiseyxw
byxwaifLyxb
Where ‘L-1’ is the maximum gray level, ‘ w(x,y)’ is the original image grey level and ‘b(x,y)’ is the
modified grey level.
V. OSTU’S METHOD
This method is optimum in the sense that it maximizes the between class variance, a well-
known measure used in the statistical discriminate analysis. The basic idea is that well-threshold
classes should be distinct with respect to the intensity values of their pixels and conversely that a
threshold giving the best separation between classes in terms of their intensity values would be the
best threshold. In addition to its optimality, Ostu’s method has the important property that it is based
entirely on the computation performed on the histogram of an image, an easily obtainable 1-D array
[7], [10], [11].
International Journal of Advanced Research in Engineering and Technology (IJARET), ISSN 0976 –
6480(Print), ISSN 0976 – 6499(Online) Volume 5, Issue 4, April (2014), pp. 119-130 © IAEME
123
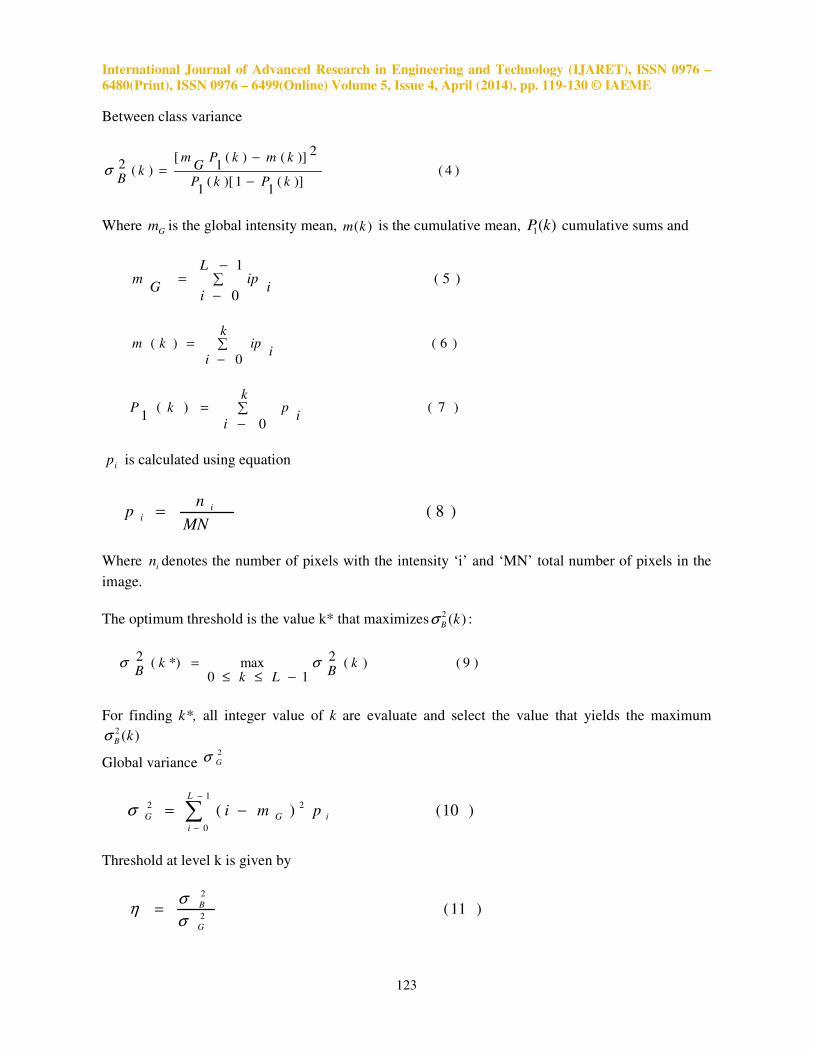
Between class variance
)4()](
11)[(
1
2)]()(
1[
)(2
kPkP
kmkPG
mk
B −
−=σ
Where Gm is the global intensity mean, )(km is the cumulative mean, )(1 kP cumulative sums and
)5(
1
0∑−
−
=L
ii
ipG
m
)6(
0
)( ∑−
=k
ii
ipkm
)7(
0
)(1
∑−
=k
ii
pkP
ip is calculated using equation
)8(
MN
np i
i =
Where in denotes the number of pixels with the intensity ‘i’ and ‘MN’ total number of pixels in the
image.
The optimum threshold is the value k* that maximizes )(2kBσ :
)9()(
2
10max*)(
2k
BLkk
Bσσ
−≤≤
=
For finding k*, all integer value of k are evaluate and select the value that yields the maximum
)(2kBσ
Global variance 2
Gσ
)10()(
1
0
22 ∑−
−
−=
L
i
iGG pmiσ
Threshold at level k is given by
)11(
2
2
G
B
σ
ση =
International Journal of Advanced Research in Engineering and Technology (IJARET), ISSN 0976
6480(Print), ISSN 0976 – 6499(Online) Volume 5, Issue 4, April (2014), pp.
VI. SAUVOLA THRESHOLDING
In Sauvola’s binarization method, the threshold
and standard deviation s(x, y) of the pixel intensities in a
(x, y):
(1),(),(
+=
R
xskyxmyxt
where R is the maximum value of the standard deviation (
and k is a parameter which takes positive values in the range
standard deviation s(x, y) adapt the value of the threshold according to the contrast in the local
neighborhood of the pixel. When, there
which results in t(x, y) ~ m(x, y). The parameter
window such that the higher the value of
However in order to compute the threshold
computed for each pixel [12].
VII. VARIABLE THRESHOLDING BY SUBDIVING IMAGE
In this approach image is subdivided into non
to compensate for non-uniformities in illumination and or
enough so that the illumination of each is approximately uniform. In this technique
image are independently thresholded and again
obtain full image.
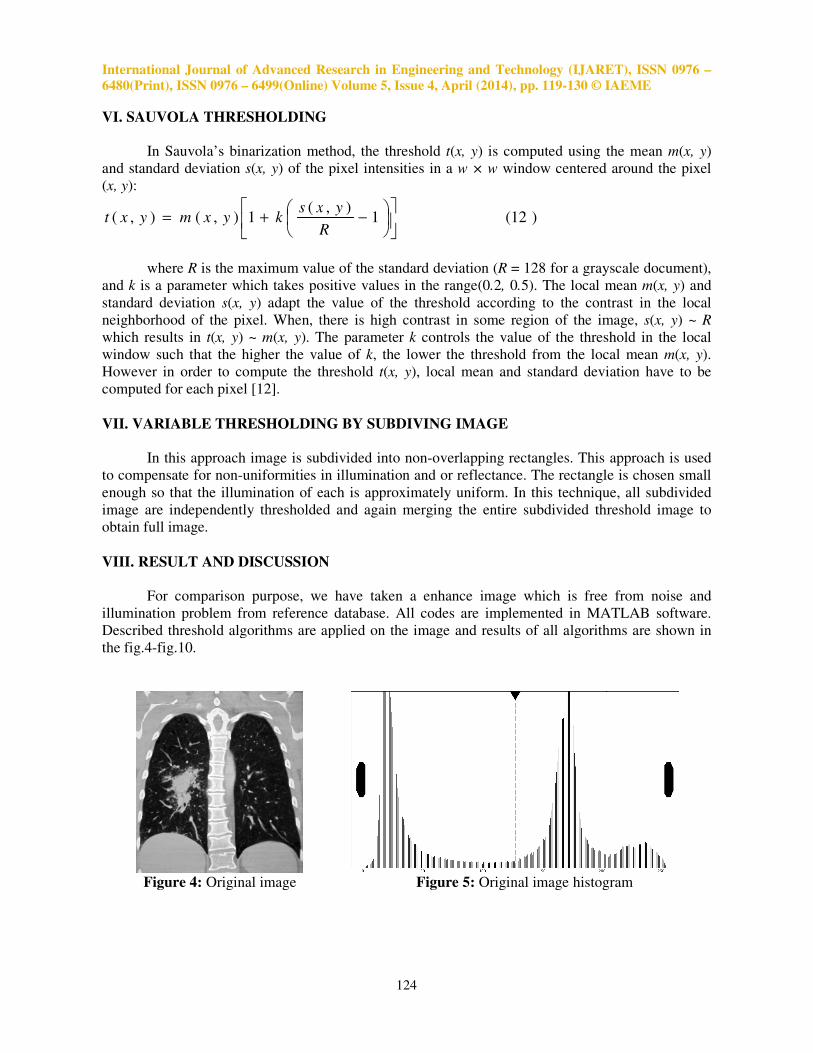
VIII. RESULT AND DISCUSSION
For comparison purpose, we have
illumination problem from reference database
Described threshold algorithms are applied on the image
the fig.4-fig.10.
Figure 4: Original image
International Journal of Advanced Research in Engineering and Technology (IJARET), ISSN 0976
line) Volume 5, Issue 4, April (2014), pp. 119-130 © IAEME
124
SAUVOLA THRESHOLDING
In Sauvola’s binarization method, the threshold t(x, y) is computed using the mean
) of the pixel intensities in a w × w window centered
)12(1),
−
R
yx
is the maximum value of the standard deviation (R = 128 for a grayscale document),
is a parameter which takes positive values in the range(0.2, 0.5). The local mean
) adapt the value of the threshold according to the contrast in the local
, there is high contrast in some region of the image,
). The parameter k controls the value of the threshold in the local
window such that the higher the value of k, the lower the threshold from the local mean
However in order to compute the threshold t(x, y), local mean and standard deviation have to be
ARIABLE THRESHOLDING BY SUBDIVING IMAGE
In this approach image is subdivided into non-overlapping rectangles. This
uniformities in illumination and or reflectance. The rectangle is
lumination of each is approximately uniform. In this technique
thresholded and again merging the entire subdivided threshold
RESULT AND DISCUSSION
For comparison purpose, we have taken a enhance image which is free from noise and
from reference database. All codes are implemented in MATLAB software.
threshold algorithms are applied on the image and results of all algorithms
Original image Figure 5: Original image histogram
International Journal of Advanced Research in Engineering and Technology (IJARET), ISSN 0976 –
© IAEME
) is computed using the mean m(x, y)
window centered around the pixel
= 128 for a grayscale document),
. The local mean m(x, y) and
) adapt the value of the threshold according to the contrast in the local
is high contrast in some region of the image, s(x, y) ~ R
he threshold in the local
, the lower the threshold from the local mean m(x, y).
), local mean and standard deviation have to be
approach is used
rectangle is chosen small
lumination of each is approximately uniform. In this technique, all subdivided
threshold image to
taken a enhance image which is free from noise and
. All codes are implemented in MATLAB software.
algorithms are shown in
Original image histogram
International Journal of Advanced Research in Engineering and Technology (IJARET), ISSN 0976 –
6480(Print), ISSN 0976 – 6499(Online) Volume 5, Issue 4, April (2014), pp. 119-130 © IAEME
125
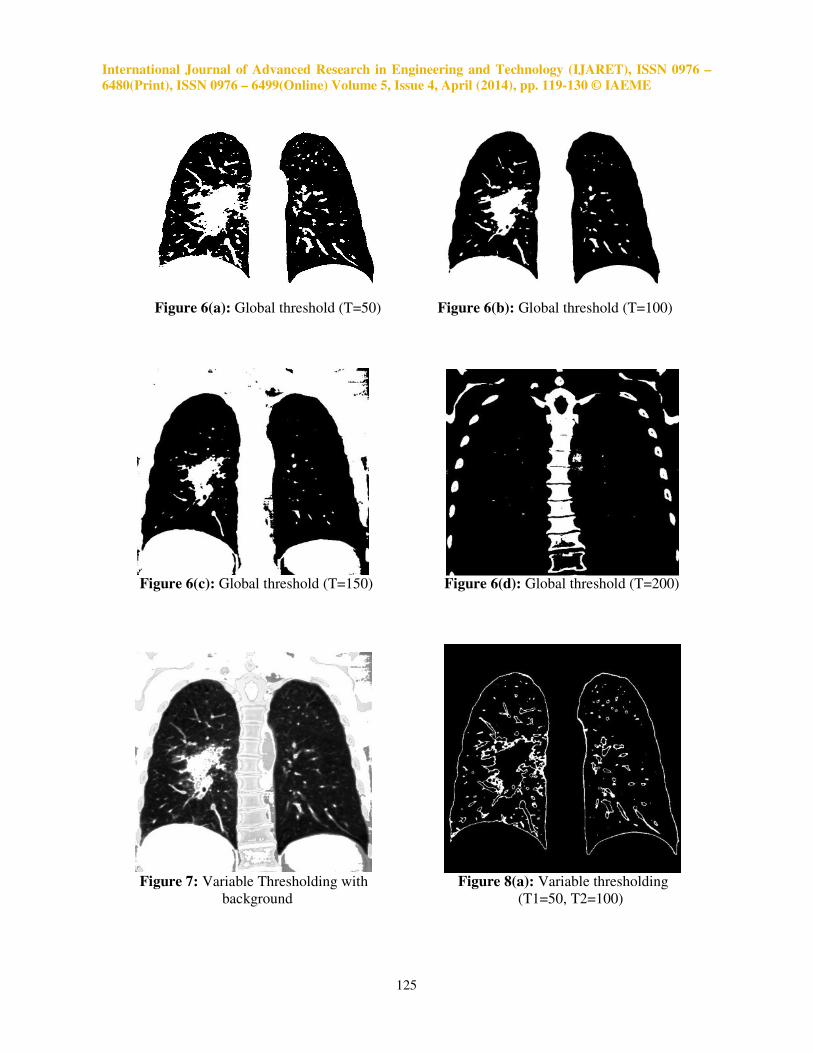
Figure 6(a): Global threshold (T=50) Figure 6(b): Global threshold (T=100)
Figure 6(c): Global threshold (T=150) Figure 6(d): Global threshold (T=200)
Figure 7: Variable Thresholding with Figure 8(a): Variable thresholding
background (T1=50, T2=100)
International Journal of Advanced Research in Engineering and Technology (IJARET), ISSN 0976 –
6480(Print), ISSN 0976 – 6499(Online) Volume 5, Issue 4, April (2014), pp. 119-130 © IAEME
126
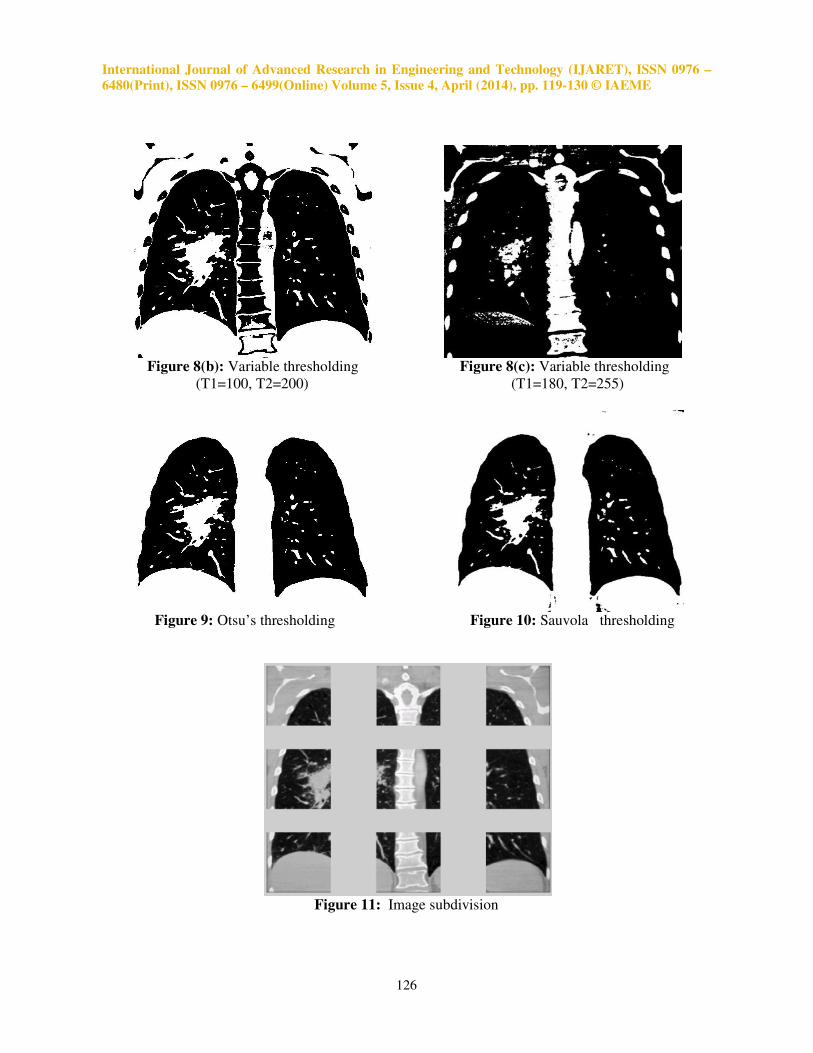
Figure 8(b): Variable thresholding Figure 8(c): Variable thresholding
(T1=100, T2=200) (T1=180, T2=255)
Figure 9: Otsu’s thresholding Figure 10: Sauvola thresholding
Figure 11: Image subdivision
International Journal of Advanced Research in Engineering and Technology (IJARET), ISSN 0976 –
6480(Print), ISSN 0976 – 6499(Online) Volume 5, Issue 4, April (2014), pp. 119-130 © IAEME
127
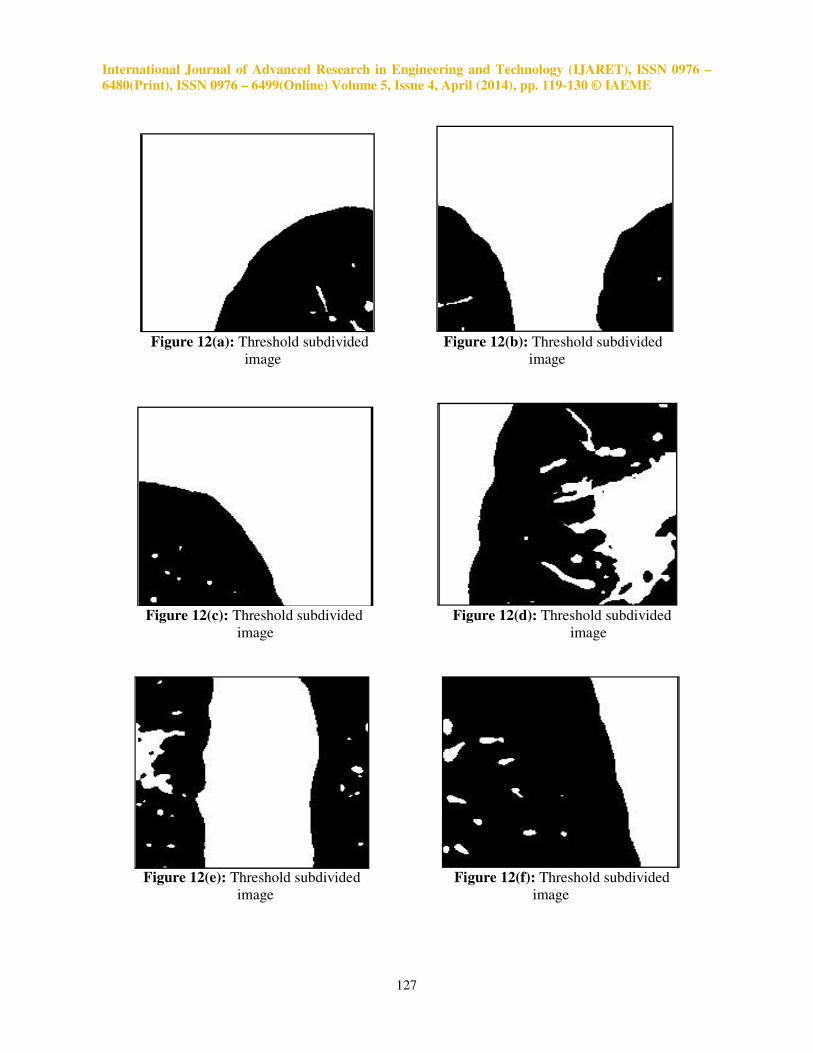
Figure 12(a): Threshold subdivided Figure 12(b): Threshold subdivided
image image
Figure 12(c): Threshold subdivided Figure 12(d): Threshold subdivided
image image
Figure 12(e): Threshold subdivided Figure 12(f): Threshold subdivided
image image
International Journal of Advanced Research in Engineering and Technology (IJARET), ISSN 0976 –
6480(Print), ISSN 0976 – 6499(Online) Volume 5, Issue 4, April (2014), pp. 119-130 © IAEME
128
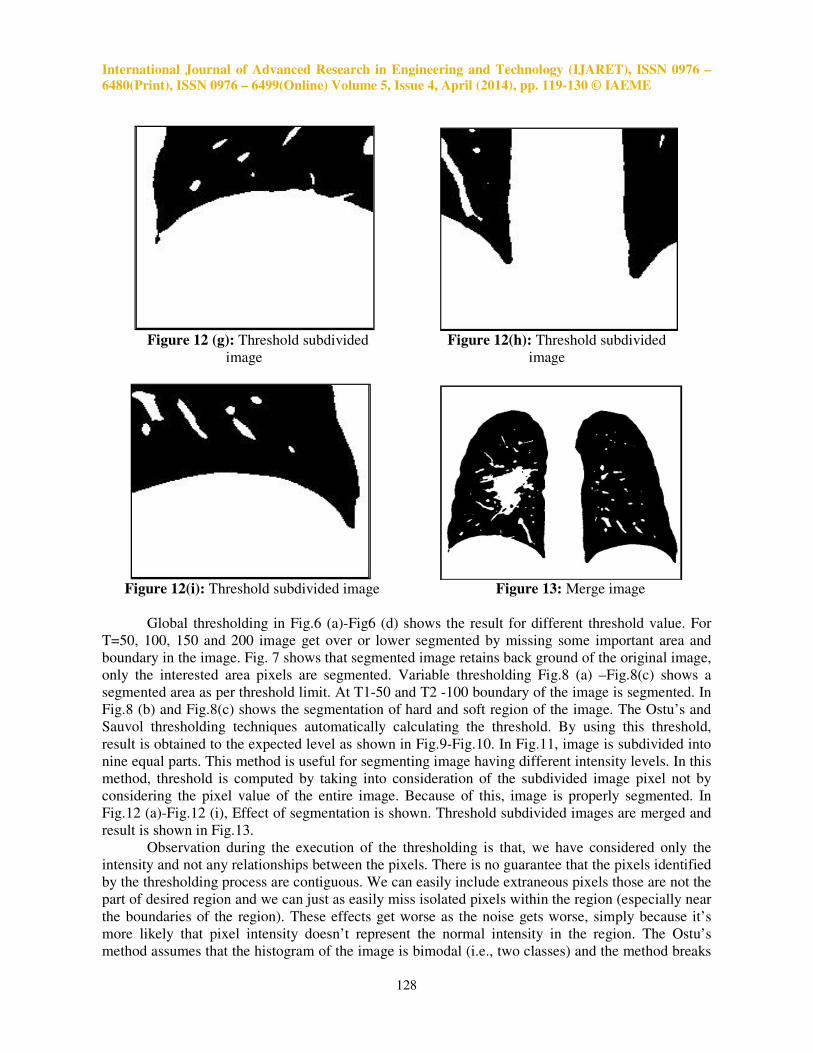
Figure 12 (g): Threshold subdivided Figure 12(h): Threshold subdivided
image image
Figure 12(i): Threshold subdivided image Figure 13: Merge image
Global thresholding in Fig.6 (a)-Fig6 (d) shows the result for different threshold value. For
T=50, 100, 150 and 200 image get over or lower segmented by missing some important area and
boundary in the image. Fig. 7 shows that segmented image retains back ground of the original image,
only the interested area pixels are segmented. Variable thresholding Fig.8 (a) –Fig.8(c) shows a
segmented area as per threshold limit. At T1-50 and T2 -100 boundary of the image is segmented. In
Fig.8 (b) and Fig.8(c) shows the segmentation of hard and soft region of the image. The Ostu’s and
Sauvol thresholding techniques automatically calculating the threshold. By using this threshold,
result is obtained to the expected level as shown in Fig.9-Fig.10. In Fig.11, image is subdivided into
nine equal parts. This method is useful for segmenting image having different intensity levels. In this
method, threshold is computed by taking into consideration of the subdivided image pixel not by
considering the pixel value of the entire image. Because of this, image is properly segmented. In
Fig.12 (a)-Fig.12 (i), Effect of segmentation is shown. Threshold subdivided images are merged and
result is shown in Fig.13.
Observation during the execution of the thresholding is that, we have considered only the
intensity and not any relationships between the pixels. There is no guarantee that the pixels identified
by the thresholding process are contiguous. We can easily include extraneous pixels those are not the
part of desired region and we can just as easily miss isolated pixels within the region (especially near
the boundaries of the region). These effects get worse as the noise gets worse, simply because it’s
more likely that pixel intensity doesn’t represent the normal intensity in the region. The Ostu’s
method assumes that the histogram of the image is bimodal (i.e., two classes) and the method breaks
International Journal of Advanced Research in Engineering and Technology (IJARET), ISSN 0976 –
6480(Print), ISSN 0976 – 6499(Online) Volume 5, Issue 4, April (2014), pp. 119-130 © IAEME
129
down when the two classes are very unequal (i.e., the classes have very different sizes). In this case, 2
Bσ may have two maxima and the correct maximum is not necessary the global one. The selected
threshold should correspond to a valley of the histogram and the method does not work well with
variable illumination. Implementations of variable thresholding are difficult and computational time
is also high as compare to other algorithm.
IX. CONCLUSION
Thresholding technique plays a vital role in the segmentation and is effective, if the correct
threshold value is known. Thresholding technique is simple to implement and required less time to
compute, makes it popular among the segmentation technique. Global thresholding works well, if
image contain uniform gray level. For non uniform gray level, variable thresholding produce a good
result. In subdivided image thresholding technique require a lot of analysis of the image for deciding
threshold value. Image with different intensity value can easily and properly segmented by image
subdivision method. Otsu’s and Sauvola method works well for automated thresholding of the
histogram in an image. Only noise and intensity problem produces a difficulty in thresholding the
image. Therefore before doing thresholding image should be filtered and enhancement should be
done.
X. ACKNOWLEDGMENT
We would like to express our deepest appreciation to the Japanese Society of Radiological
Technology (JSRT) in cooperation with the Japanese Radiological Society (JRS) for providing
clinically well proven images for research purpose.
REFERENCES
[1] Zhi-Kai Huang and Kwok-Wing Chau, “A New Image Thresholding Method Based
on Gaussian Mixture Model”, Applied Mathematics and Computation, vol. 205, no. 2,
pp 899-907, 2008.
[2] T.Romen Singh,
Sudipta Roy, O.Imocha Singh, Tejmani Sinam
and Kh.Manglem Singh,
“A New Local Adaptive Thresholding Technique in Binarization”, International Journal of
Computer Science Issues (IJCSI), vol. 8, issue 6, no 2, Nov 2011.
[3] Dongcheng Hu, Fei Liu, Yupin Luo and Xiaodan Song, “Active Surface Model-Based
Adaptive Thresholding Algorithm by Repulsive External Force”, Journal of Electronic
Imaging, vol- 12(2), pp-299–306, April 2003.
[4] Mehmet Sezgin and Bu lent Sankur, “Survey Over Image Thresholding Techniques
and Quantitative Performance Evaluation”, Journal of Electronic Imaging, vol- 13(1),
pp- 146–165, Jan 2004.
[5] A. K. Jain, Fundamentals of Digital Image Processing. Englewood Cliffs, NJ: Prentice-Hall,
1989.
[6] S.Jayaraman and T.Veerakumar, “Digital Image Processing,” 3rd
ed., New Delhi, India: Tata
McGraw Hill, 2010.
[7] R. C. Gonzalez and R. E. Woods, Digital Image Processing, 2nd
ed. Reading, MA: Addison-
Wesley, 1992.
[8] Orlando J. Tobias and Rui Seara, “Image Segmentation by Histogram Thresholding using
Fuzzy Sets”, IEEE TRANSACTIONS ON IMAGE PROCESSING, vol. 11, no. 12,
pp-1457-1465, Dec 2002.
International Journal of Advanced Research in Engineering and Technology (IJARET), ISSN 0976 –
6480(Print), ISSN 0976 – 6499(Online) Volume 5, Issue 4, April (2014), pp. 119-130 © IAEME
130
[9] S. Arora, J. Acharya, A. Verma, Prasanta K. Panigrahi, “Multilevel thresholding for image
segmentation through a fast statistical recursive algorithm,” Pattern Recognition Letters 29,
pp. 119–125, 2008.
[10] P.Sung Liao, T.Sheng Chen and Pau-Choo Chun, “A Fast Algorithm for Multilevel
Thresholding”, Journal Of Information Science And Engineering, vol-17, pp-713-727, 2001.
[11] Xiang, R. and Wang, R., 2004. Range image segmentation based on split-merge clustering.
In: 17th ICPR, pp. 614–617.
[12] J. Sauvola, S. Haapakoski, H. Kauniskangas, T. Seppa K nen M. Pietika Kinen and D.
Doermann, “A distributed management system for testing document image analysis
algorithms”, 4th ICDAR, Germany, pp. 989-995, 1997.
[13] Ratil Hasnat Ashique, Md Imrul Kayes, M T Hasan Amin and Badrun Naher Liya, “Speckle
Noise Reduction from Medical Ultrasound Images using Wavelet Thresholding and
Anisotropic Diffusion Method”, International journal of Electronics and Communication
Engineering &Technology (IJECET), Volume 4, Issue 4, 2013, pp. 283 - 290, ISSN Print:
0976- 6464, ISSN Online: 0976 –6472.
[14] Lalit Saxena, “Effective Thresholding of Ancient Degraded Manuscript Folio Images”,
International Journal of Computer Engineering & Technology (IJCET), Volume 4, Issue 5,
2013, pp. 285 - 291, ISSN Print: 0976 – 6367, ISSN Online: 0976 – 6375.
[15] J.Rajarajan and Dr.G.Kalivarathan, “Influence of Local Segmentation in the Context of
Digital Image Processing – A Feasibility Study”, International Journal of Computer
Engineering & Technology (IJCET), Volume 3, Issue 3, 2012, pp. 340 - 347, ISSN Print:
0976 – 6367, ISSN Online: 0976 – 6375.
Related Documents