The Pep Boys – Manny, Moe & Jack Execution Excellence & Growth September 2011

Welcome message from author
This document is posted to help you gain knowledge. Please leave a comment to let me know what you think about it! Share it to your friends and learn new things together.
Transcript

The Pep Boys – Manny, Moe & JackExecution Excellence & Growth
September 2011
2
This presentation includes “forward-looking statements” within the meaning of Section 27A of the Securities Act and Section 21E of the Exchange Act. All statements contained herein other than statements of historical fact are “forward-looking statements” for purposes of these provisions. In some cases, forward-looking statements can be identified by the use of terminology such as “may”, “will”, “expects”, “plans”, “anticipates”, “estimates”, “potential” or “continue”, or the negative thereof or other comparable terminology. We have based these forward-looking statements on our current expectations and projections about future events. Although we believe that our assumptions made in connection with the forward-looking statements are reasonable, we cannot assure investors that our assumptions and expectations will prove to have been correct. Actual results could differ materially from our forward-looking statements. We undertake no obligation to publicly update or revise any forward-looking statements, whether as a result of new information, future events or otherwise.
Safe Harbor Statement

3
The Pep Boys – Manny, Moe & JackFounders of the Automotive Aftermarket• Trusted since 1921• Philadelphia – based
725 Locations (as of 8/31/2011)• 561 Supercenters (19-20k sf)
– 9 New Prototypes (13-14k sf)
• 156 Service & Tire Centers (5-6k sf)• 8 Retail Stores
35 States and Puerto Rico
$2.1 Billion Revenues (1)
• 50% Service– 59% Maintenance & Repair– 41% Tires & Related Services
• 39% Retail– 60% Do It Yourself– 40% Accessories & Complementary
• 11% Commercial
(1) Adjusted for 99 stores acquired year to date.

4
Pep Boys Vision: Automotive Solutions Provider of Choice for the Value Oriented Customer
Pep Boys Strategy: Earn the TRUST of our Customers every day through:� Speed� Expertise� Respect� Value
Lead with our Service business and grow through Service & Tire Centers� Does Everything. For Less.� Market share leader in a fragmented market
Establish a differentiated Retail experience by leveraging our Automotive Superstore � Highest level of replacement parts coverage� Broadest range of maintenance, performance and appearance products
and accessories� Leading installer of automotive after-market products
Leverage our Automotive Superstore to provide the most complete offering for our Commercial customers � One call solution for parts, tires, equipment, and accessories
The Pep BoysVision and Strategy

5
0%
10%
20%
30%
40%
50%
60%
70%
80%
90%
FY2005
FY2006
FY2007
FY2008
FY2009
FY2010
FY2011
Service Retail
The Pep BoysEarn The Trust Of Our Customers Every Day
Speed. Expertise. Respect. Value.
Net Promoter Scores

6
The Pep BoysLead With Service
Provides parts for Service“We install what we sell”
Market leader in appearance and performance products and accessories
Speed Shops for automotive enthusiasts
Competitive pricingSuperhubs serve neighboring stores with
same-day parts availability
Delivers to Service & Tire Centers
“One Call” for parts, tires,equipment and accessories
Leverages parts inventory to support competitive assortment and pricing
RETAIL COMMERCIAL
SERVICE
Full service: tires, maintenance, undercar and underhood
Value leader as a result of our parts pricing advantage:“We buy direct from the manufacturers and
pass the savings onto our customers”
Service & Tire Centers:Convenient for customers
Local “my mechanic”
Support Service
Automotive Superstore
Support Parts

7
The Pep BoysLead With Service
Service($172 billion) (1)
Industry Characteristics
Source: 2011 Digital Aftermarket Factbook.(1) Includes tire sales.
� Service is 4x larger than DIY
� Service is expected to grow slightly faster than DIY
� Service is highly fragmented (254,000 Service establishments in the US)
� DIY had been declining prior to 2007, but has benefited from the recession
� Consumers continue to shift to Service
• Cars more complex
• Lifestyle changes
• Aging of baby boomers
� Service consolidation has started
• Service is becoming increasingly capital-intensive
• Evolving technologies require specific knowledge and training
� High barrier to entry for new players
Do It Yourself ($43 billion)
2010 Sales = $215 billion
DIY20%
DIFM & Tires80%
Sears
Pep BoysFirestoneJiffy LubeTBCMidasGoodyearAAMCOMonroMeineke
Carquest
AutozoneAdvanceO'Reilly
Pep Boys
NAPA
Independents, Regionals
64%
Dealerships30%
Other59%

8
Full service provider
More than 7000 service bays
National scale
Parts sourced directly from manufacturers
Savings passed onto customers
Tires Alignments
Oil changes Brakes
Ride control HVAC
Starting and charging Tune-ups
Engine performance Fuel systems
Maintenance products and services
Engine and transmission R&R
Computer module flashing
The Pep BoysLead With Service

9
The Pep BoysGrow Through Service & Tire Centers
• Customer friendly: local “my mechanic”
• Higher financial return: leverage existing assets
• Existing facility: 4 to 8 bays
• Full service: tires, maintenance, undercar, underhood
• Stock high velocity assortment
• Retail that targets our service customer, when space permits
• Convenient to where customers live and work– 3 to 5 mile trade area
• Higher median household income
• 5 to 15 minutes from supporting Supercenter
Model
Locations
Markets
• Individual sites in biggest Pep Boys markets
• Small chains in other Pep Boys markets
• Consider chains in new markets opportunistically
10
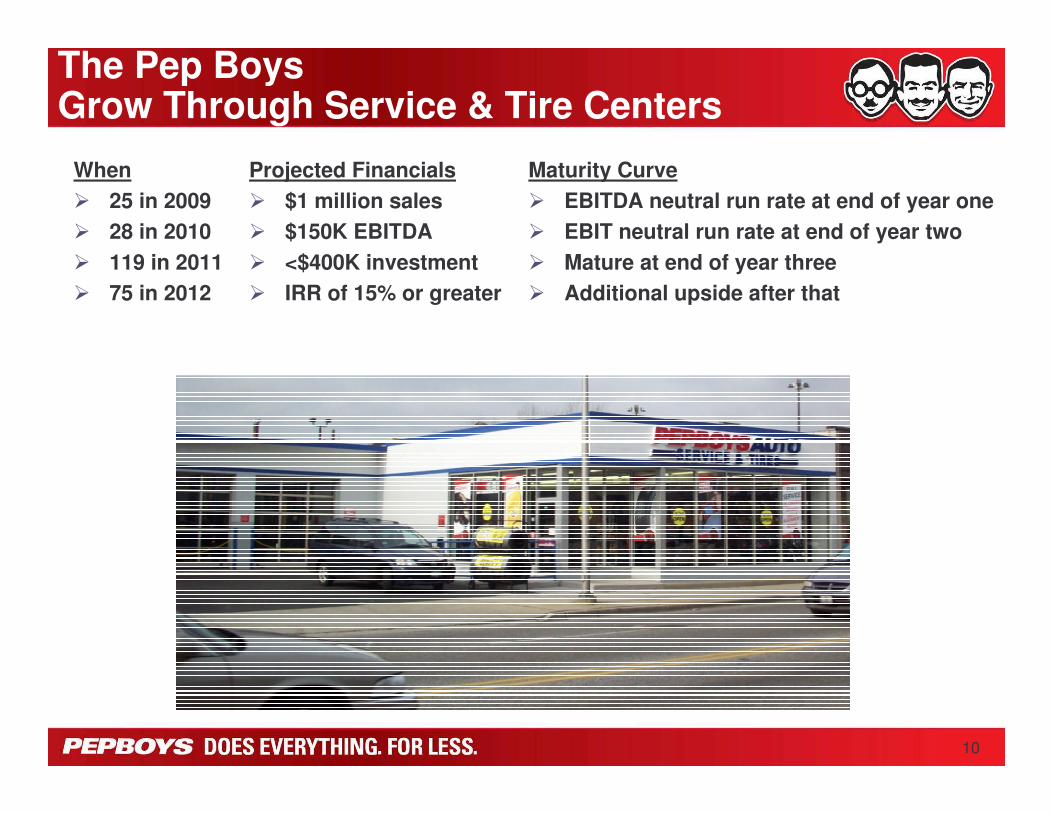
The Pep Boys Grow Through Service & Tire Centers
When� 25 in 2009� 28 in 2010� 119 in 2011� 75 in 2012
Projected Financials� $1 million sales� $150K EBITDA � <$400K investment� IRR of 15% or greater
Maturity Curve� EBITDA neutral run rate at end of year one� EBIT neutral run rate at end of year two� Mature at end of year three� Additional upside after that

11
The Pep BoysAcquisition of Big 10 Tires & Automotive
Transaction Overview
•85 Service & Tire Centers�36 Alabama�27 Florida (7-Orlando, 20-Panhandle)�22 Georgia (Atlanta)
•Improves market density in Florida and Georgia•Establishes significant presence in Alabama•Facilities average 5,800 square feet and 8.3 bays
Value Enhancement
•Add full assortment of tire and service offerings•Leverage inventory from existing supercenters•Leverage distribution from Atlanta DC•Leverage existing Pep Boys marketing expense•Reduce costs through direct sourcing of parts •Eliminate redundant overhead and advertising

12
Pep Boys Supercenters
Florida Tire Locations
NewService & Tire Centers
Orlando–Daytona Market
Big 10 Locations

13
Pep Boys Supercenters
Davco Locations
Seattle–Tacoma Market
14
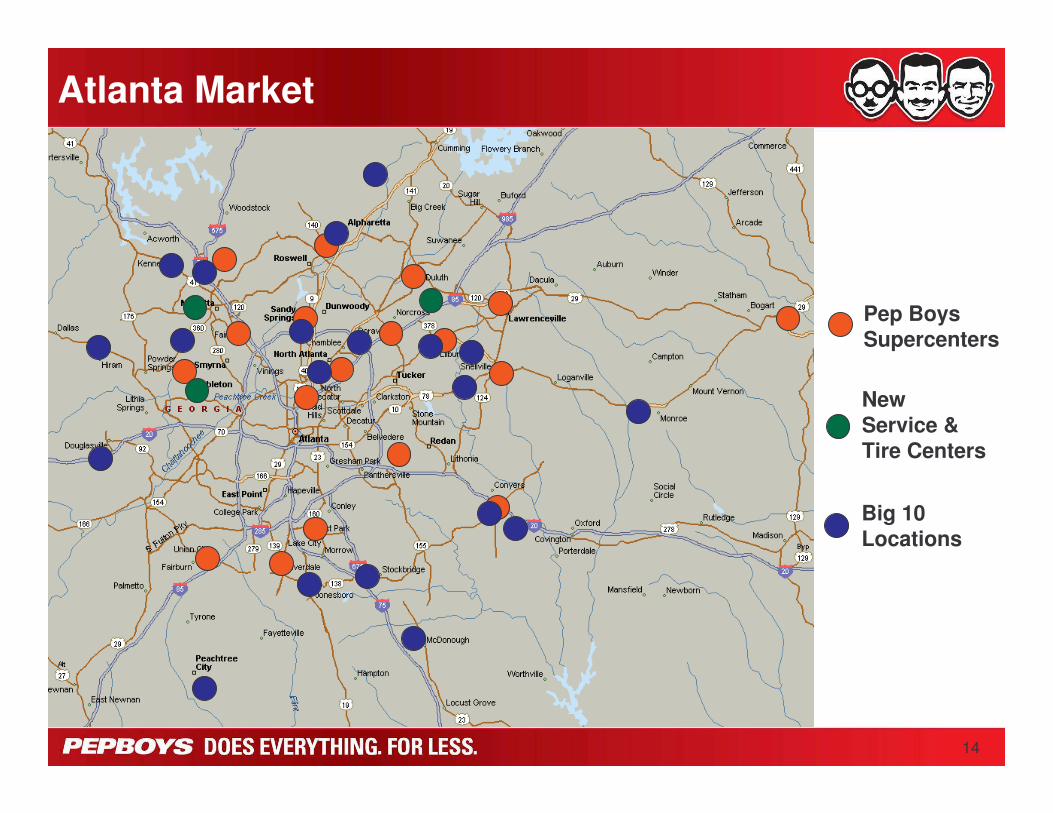
Pep Boys Supercenters
NewService & Tire Centers
Atlanta Market
Big 10 Locations

15
Pep Boys Supercenters
Gulf Coast Markets
Big 10 Locations
16
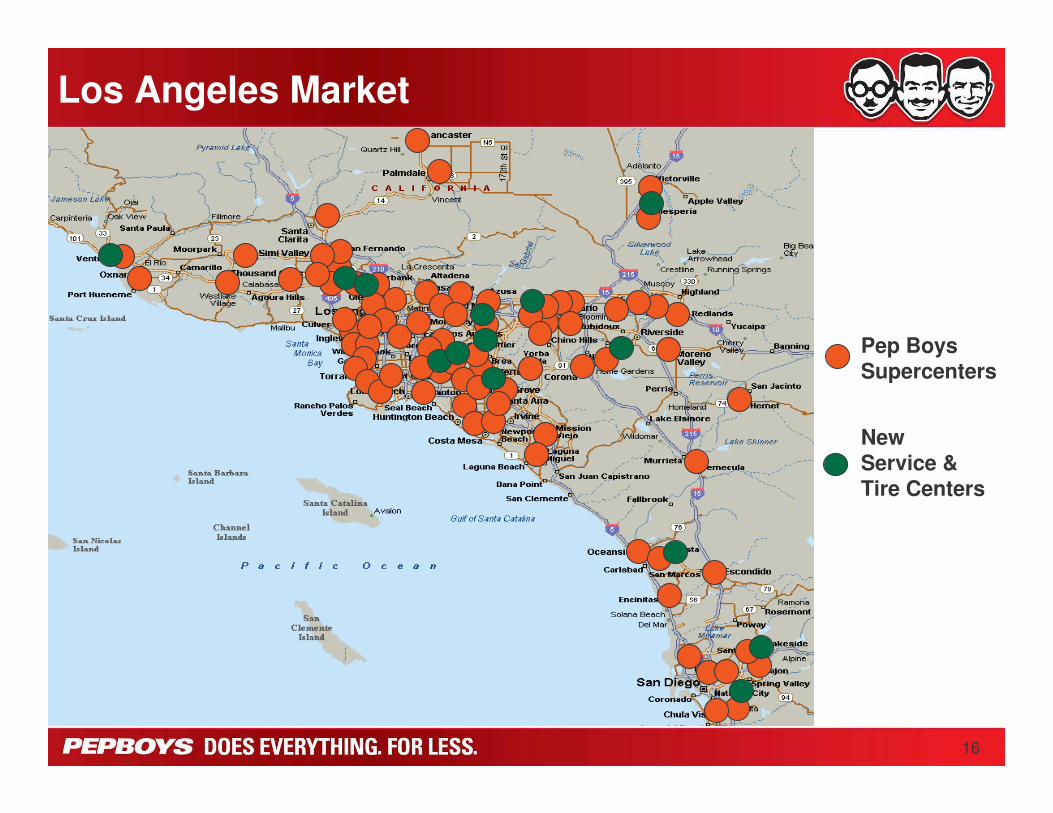
Pep Boys Supercenters
NewService & Tire Centers
Los Angeles Market

17
Pep Boys Supercenters
NewService & Tire Centers
Philadelphia Market
New Supercenters

18
Pep Boys Supercenters
NewService & Tire Centers
Chicago Market
New Supercenters

19
Pep Boys Supercenters
My Mechanic Service & Tire Centers
NewService & Tire Centers
Houston Market
New Supercenters

20
The Pep BoysService & Tire Center Sales Continue to Build
Demonstrates an increase in sales as Service & Tire Centers mature
19202124
262829
313435
37
44
5253
61
70
$0
$2,000
$4,000
$6,000
$8,000
$10,000
$12,000
$14,000
$16,000
$18,000
$20,000
$22,000
$24,000
$26,000
1 3 5 7 9 11 13 15
17 19 21 23 25
27 29 31 33 35
37 39 41 43 45 47 49 51 53 55 57 59 61 63 65
67
69 71 73 75
77
79 81 83 85 87
89 91 93
Full Weeks of Operation
Ave
rag
e W
eekl
y S
ales
Pe
r L
oca
tio
n
0
10
20
30
40
50
60
70
80
# L
oca
tion
s in
Op
era
tio
n

21
Automotive Superstore means more than just a parts store
Starts with parts (knowledgeable people, parts availability, competitive pricing)
We are the market leader in appearance products and automotive accessories
Parts, especially late model coverageFluidsTools for DIY customersWash and wax dominanceAutomotive electronicsLight maintenancePerformance / speed shopsExterior accessoriesInterior accessories
The Pep Boys Automotive Superstore

22
In 451 Locations
• One stop shop
• Leverages Automotive Superstore assortment and distribution network
• Phased replacement of Commercial point of sale system with robust solutions in late 2011 and 2012
Complete Offering• Parts• Fluids• Tires• Equipment• Accessories
Serving• Repair Shops• Dealers• Fleets
The Pep Boys“One Call” Commercial Offering
23
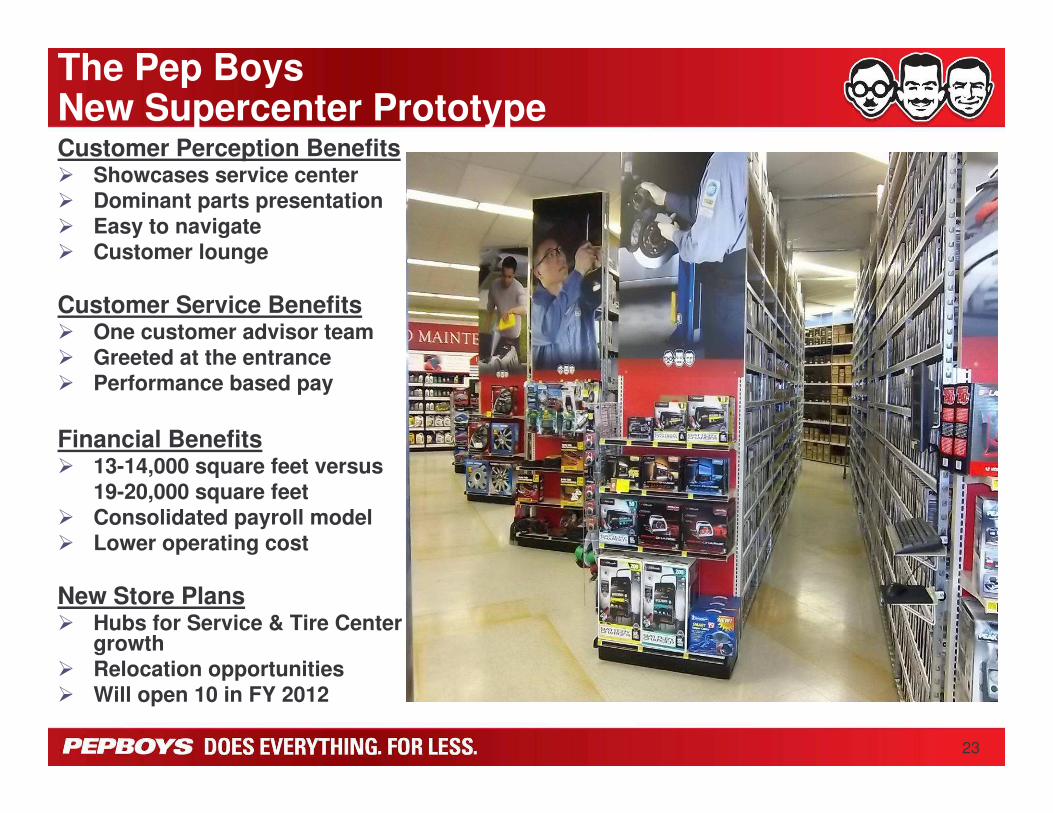
The Pep Boys New Supercenter PrototypeCustomer Perception Benefits� Showcases service center� Dominant parts presentation� Easy to navigate� Customer lounge
Customer Service Benefits� One customer advisor team� Greeted at the entrance� Performance based pay
Financial Benefits� 13-14,000 square feet versus
19-20,000 square feet� Consolidated payroll model� Lower operating cost
New Store Plans� Hubs for Service & Tire Center
growth� Relocation opportunities� Will open 10 in FY 2012

24
The Pep BoysNew Supercenter Prototype

25
The Pep Boys New Supercenter Prototype

26
The Pep Boys“One Team” Supercenter ConversionConvert existing stores to new Supercenter format
Benefits
�Catalyst for store culture change �Improved customer experience�Lower operating cost
Two Tests
Salt Lake Test:�Full store conversion �New prototype look and feel�Higher cost, longer process�Space recapture in rear of store
Phoenix Test:�Front of store conversion�Old prototype look and feel�Lower cost, shorter process�No space recapture
Up to $20 million in annual payroll and benefit savings.
Capital expenditures of$6 to $8 million.

27
The Pep BoysSpeed Shop� Remodel existing Supercenters to accommodate Speed Shops
• 10 open in California, New York, Florida, Pennsylvania, Maryland, New Jersey, and Texas
- 3 “light” speed shops also opened
• Opening 5 additional “full” speed shops in second half of 2011
� Attracts Automotive Enthusiasts
• Muscle car; import tuner; sport truck, Jeep, diesel
� Highlights our competitive point of differentiation
• Staffed with dedicated enthusiasts
• Sales and installation of our products
� Creates destination store in key markets
• Expands 3-5 mile trade area
• Draws car shows and other enthusiast activities
• Serves surrounding stores

28
The Pep Boys Distribution Network
Indianapolis Distribution
Center
RegionalDistribution
Centers
SuperhubLocations
Supercenter & Retail
Locations
Service & Tire Centers
# Locations
1
4• San Bernardino, CA• McDonough, GA• Mesquite, TX• Chester, NY
• Plainfield, IN
33 Servicing 359 stores
569
156
# SKUs
~75,000
~40,000
~40,000
~23,000
~3,000
29
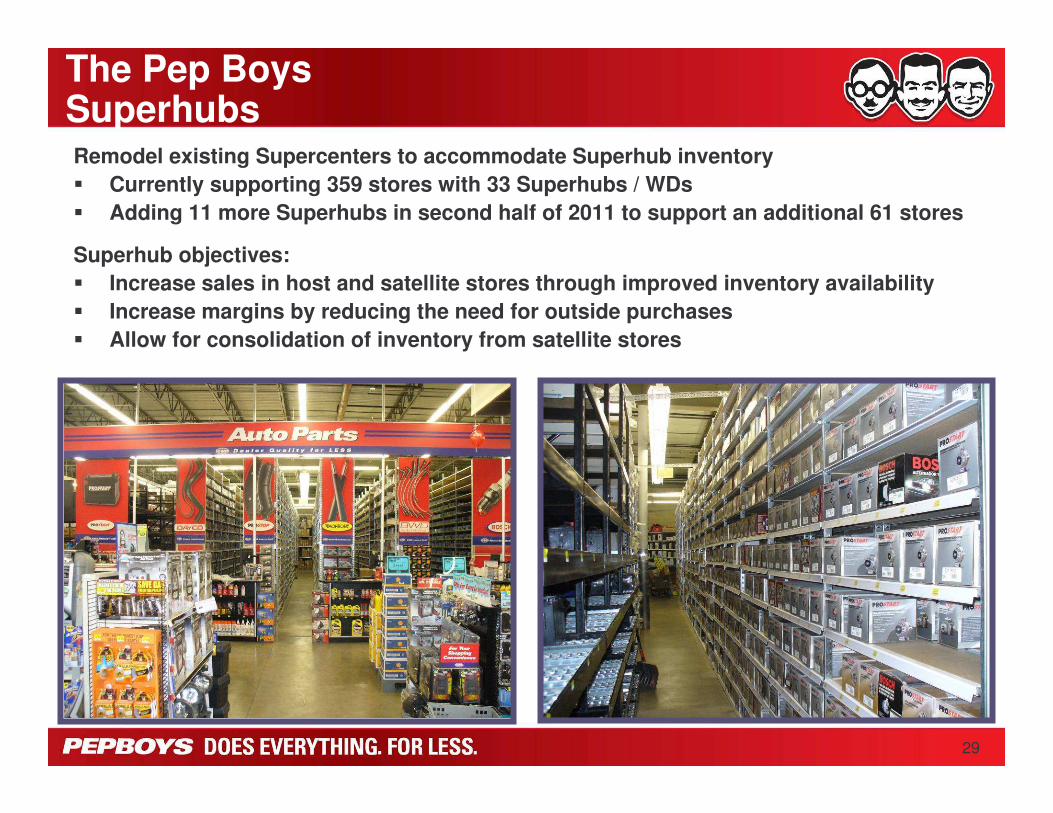
The Pep Boys SuperhubsRemodel existing Supercenters to accommodate Superhub inventory� Currently supporting 359 stores with 33 Superhubs / WDs� Adding 11 more Superhubs in second half of 2011 to support an additional 61 stores
Superhub objectives:� Increase sales in host and satellite stores through improved inventory availability� Increase margins by reducing the need for outside purchases� Allow for consolidation of inventory from satellite stores

30
The Pep BoysE-Serve … Coming This Year

31
The Pep BoysE-Serve … Coming Next Year
Excellent web experience- Discover
- Research - Purchase
My Home
Pick up in Store
Installed on My Car
Online Service
Selection
Parts and Accessories
Tires and Installation
IndianapolisDC
Shopping Experience
Payment and Shipping Fulfillment
Store

32
The Pep Boys14 Million Rewards Members
How it works…� Members get FREE Services
• Tire rotation and air pressure check• Flat repair• Brake evaluation• Check engine light evaluation• Discounted towing to a Pep Boys location
� Members earn a point for every dollar they spend in service and retail
� Rewards are equivalent to 5% of their total purchases ($200 spend = $10 reward)
� Reward vouchers are sent to members once they are earned
33
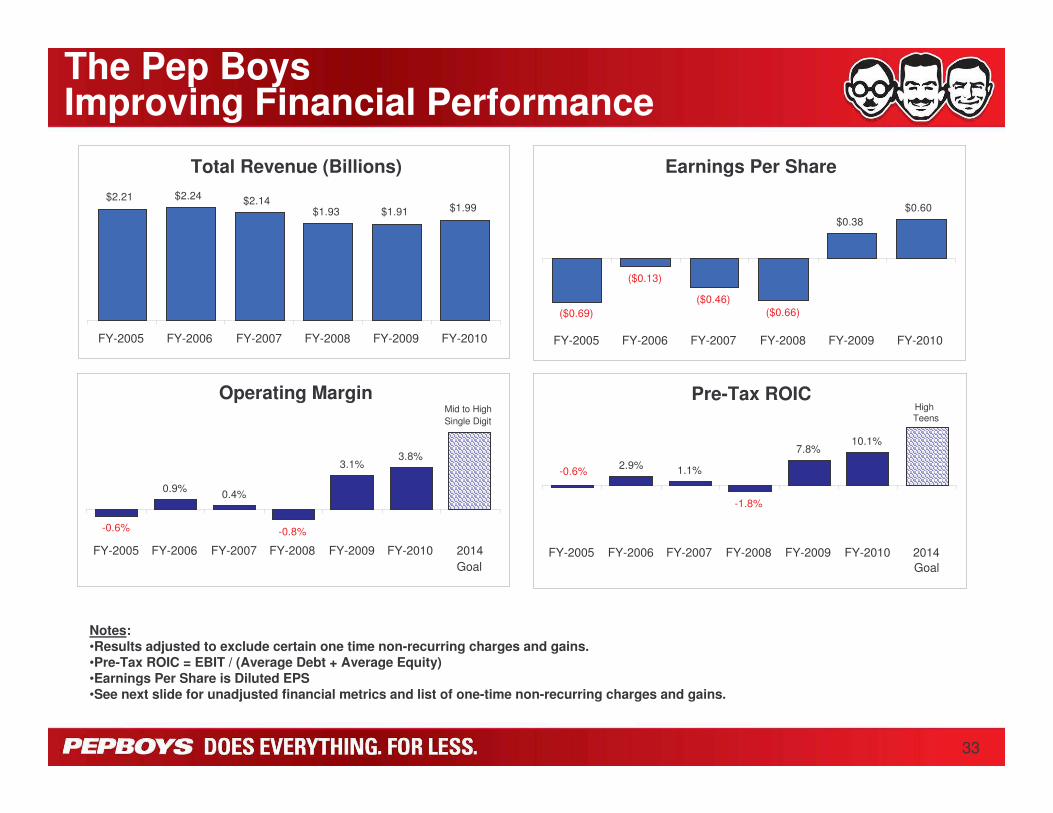
The Pep BoysImproving Financial Performance
Notes: •Results adjusted to exclude certain one time non-recurring charges and gains.•Pre-Tax ROIC = EBIT / (Average Debt + Average Equity)•Earnings Per Share is Diluted EPS•See next slide for unadjusted financial metrics and list of one-time non-recurring charges and gains.
Total Revenue (Billions)$2.21 $2.24 $2.14
$1.93 $1.91 $1.99
FY-2005 FY-2006 FY-2007 FY-2008 FY-2009 FY-2010
Operating Margin
0.9% 0.4%
3.1%3.8%
-0.8%-0.6%
FY-2005 FY-2006 FY-2007 FY-2008 FY-2009 FY-2010 2014Goal
Mid to HighSingle Digit
Earnings Per Share
($0.13)
($0.46)($0.66)
$0.38$0.60
($0.69)
FY-2005 FY-2006 FY-2007 FY-2008 FY-2009 FY-2010
Pre-Tax ROIC
2.9%7.8%
10.1%
-1.8%
1.1%-0.6%
FY-2005 FY-2006 FY-2007 FY-2008 FY-2009 FY-2010 2014Goal
HighTeens

34
The Pep BoysUnadjusted Financial Metrics
List of one-time non-recurring charges and gains:2005: Includes a $4.2 million pre-tax asset impairment charge.2006: Includes a pre-tax gain of $8.968 million from disposition of assets.2007: Includes an aggregate pre-tax charge of $10.963 million related to the closure of 31 stores ($7.199 million cost of sales and $3.764 million discontinued operations). Includes a pre-tax inventory impairment charge of $32.803 million (cost of sales) for the discontinuance of certain product offerings. Also includes a pre-tax gain of $15.151 million from disposition of assets.2008: Includes an aggregate pre-tax charge of $5.353 million ($3.427 million cost of sales and $1.926 million discontinued operations) for asset impairment. Includes a pre-tax gain from debt retirement of $3.46 million partially offset by a $1.172 million pre-tax charge for deferred financing costs. Also includes a pre-tax gain of $9.716 million from disposition of assets.2009: Includes a pre-tax charge of $3.11 million ($2.884 million cost of sales and $0.226 million discontinued operations) for asset impairment. Includes a pre-tax gain from debt retirement of $6.248 million. In addition, includes a net pre-tax gain of $1.213 million from disposition of assets.2010: Includes a pretax benefit of $5.9 million due to the reduction in reserve for excess inventory which reduced merchandise cost of sales and an aggregate pretax charge of $1.0 million for asset impairment ($0.8 million was charged to merchandise cost of sales and $0.2 million was charged to service cost of sales). Also includes a pre-tax gain of $2.467 million from disposition of assets.
Total Revenue (Billions)
$2.21 $2.24 $2.14$1.93 $1.91 $1.99
FY-2005 FY-2006 FY-2007 FY-2008 FY-2009 FY-2010
Operating Margin
1.3%
-0.8%
3.0%4.2%
-0.5%-0.6%
FY-2005 FY-2006 FY-2007 FY-2008 FY-2009 FY-2010 2014Goal
Mid to HighSingle Digit
Earnings Per Share
($0.05)
($0.79)($0.58)
$0.44$0.69
($0.69)
FY-2005 FY-2006 FY-2007 FY-2008 FY-2009 FY-2010
Pre-Tax ROIC
3.7%7.5%
11.1%
-0.6%
-1.8% -1.3%
FY-2005 FY-2006 FY-2007 FY-2008 FY-2009 FY-2010 2014Goal
HighTeens

35
The Pep Boys Macro-environment
� Primary external drivers for Pep Boys are:
• Miles driven for tires, maintenance and repairs
• GDP for discretionary purchases
� Other factors include:• Gas prices• Age of vehicles• Car sales (new and used)• Shift to smaller / lighter
vehicles• New technologies
� Our plans assume that the macro-environment continues to stabilize
� We do not foresee a rapid recovery
Notes:US Real GDP in billions of chained 2005 dollars (trailing 4 quarters expressed at annual rates).Vehicle Miles Traveled in billions trailing 4 quarters (all roads and streets).Q2 data estimated based on run rate thru May 2011Source: US Bureau of Economic Analysis
US Department of Transportation (Federal Highway Administration)
New Car Sales
Year# Units
(millions)
2010 11.62009 10.62008 13.52007 16.5
2001 - 2006 17.2
Source: Bureau of Transportation Statistics, U.S. Department of Transportation
2,700
2,800
2,900
3,000
3,100
2000
_Q1
2000
_Q2
2000
_Q
320
00_
Q4
2001
_Q1
2001
_Q
22
001_
Q3
200
1_Q
420
02_
Q1
200
2_Q
22
002_
Q3
200
2_Q
42
003_
Q1
200
3_Q
22
003_
Q3
200
3_Q
42
004_
Q1
2004
_Q2
2004
_Q3
2004
_Q4
2005
_Q1
2005
_Q2
2005
_Q3
2005
_Q4
2006
_Q1
200
6_Q
220
06_
Q3
2006
_Q4
200
7_Q
120
07_
Q2
200
7_Q
320
07_
Q4
200
8_Q
120
08_
Q2
200
8_Q
320
08_
Q4
2009
_Q1
2009
_Q2
2009
_Q3
2009
_Q4
2010
_Q1
2010
_Q2
2010
_Q3
2010
_Q4
2011
_Q
120
11_
Q2
Ve
hicl
e M
iles
Tra
vele
d
(A
nnua
l - T
raili
ng 4
Qu
arte
rs)
10,000
11,000
12,000
13,000
14,000
GD
P(A
nnua
l - T
raili
ng 4
Qu
arte
rs)
VMT (Billions) GDP (Billions)

36
The Pep BoysImproving Financial Performance� Low single digit comparable store sales growth
� 119 new Service & Tire Centers and 1 new Supercenter in 2011� Includes 99 acquisition, 4 organic Service & Tire Centers, and 1 Supercenter already opened in 2011
� 75 new Service & Tire Centers and 10 new Supercenters in 2012
� Gross margins are improving, but still an opportunity• Gross margin leaks• Cost of goods sold• Pricing and mix
� Sales growth leverages expense base• Safety and claims reductions• Productivity and cost reductions• Outlier management• “One Team” store structure
� Execution • Selling excellence• Store simplification• People and focus

37
The Pep BoysSolid Financial Position
� Financial flexibility• $60m cash• $300m debt at favorable rates
• ½ due 2013; ½ due 2014
� Dry powder• 232 owned stores• 162 ground leased stores• 331 leased stores• 4 owned distribution centers• 1 leased distribution center• 2 owned office buildings
� Sales growth leverages asset base• Investing in new parts while improving inventory productivity• Expanding vendor financing programs to improve payables leverage• Maintenance capital expenditures of $40 million per year

38
The Pep Boys Investment Story� We have turned
around the company
� We still have opportunity for improvement in our base business
� We have a solid foundation for growth for years to come
Related Documents