the partner of choice 2018 Consolidated Report and Accounts

Welcome message from author
This document is posted to help you gain knowledge. Please leave a comment to let me know what you think about it! Share it to your friends and learn new things together.
Transcript

the partnerof choice
2018 Consolidated Report and Accounts

2018 ConsolidatedReport and Accounts
Index

3
Index
Consolidated statements of financial position as of 31 December 2018 and 2017
Consolidated statements of profit or loss for the periods ended 31 December 2018 and 2017
Consolidated statements of comprehensive income for the periods ended 31 December 2018 and 2017
Consolidated statements of changes in equity for the periods ended 31 December 2018 and 2017
Consolidated statements of cash flows for the periods ended 31 December 2018 and 2017
Notes to the consolidated financial statements as of 31 December 2018
Statements of financial position as of 31 December 2018 and 2017
Statements of profit or loss for the years ended 31 December 2018 and 2017
Statements of comprehensive income for the years ended 31 December 2018 and 2017
Statements of changes in equity for the years ended 31 December 2018 and 2017
Statements of cash flows for the years ended 31 December 2018 and 2017
Notes to the financial statements as of 31 December 2018
Statutory auditor’s report
Report and opinion of thestatutory audit board
05
06
07
08
09
10
77
78
79
80
81
82
101
106

2018 ConsolidatedReport and Accounts

5
Notes 31 December 2018 31 December 2017
ASSETS
NON-CURRENT ASSETS:Investment properties 8 982,845 740,424 Investment properties under development 8 15,667 41,455 Property, plant and equipment 9 1,904 1,885 Goodwill 10 9,892 4,274 Intangible assets 11 1,462 1,456 Investments in joint ventures and associates 4 and 5 1,098,841 1,222,965 Shareholders 20 54,487 130,604 Deferred tax assets 23 2,404 2,406 Derivative financial instruments 18 492 1,319 Other non current assets 12 3,527 3,288
Total non-current assets 2,171,521 2,150,076
CURRENT ASSETS:Trade receivables 13 15,034 22,354 Shareholders 20 11,103 5,680 Other receivables 14 8,959 53,756 State and other public entities 26 8,151 5,771 Other current assets 15 8,017 16,302 Cash and bank deposits 16 312,665 68,145
Total current assets 363,929 172,008
Total assets 2,535,450 2,322,084
EQUITY, NON-CONTROLLING INTERESTS AND LIABILITIESEQUITY:
Share capital 17 162,245 162,245 Reserves 17 57,329 57,329 Currency translation reserve (179,820) (149,168)Hedging reserve (1,433) (514)Retained earnings 1,030,964 970,691 Consolidated net profit for the period attributable to the equity holders of Sonae Sierra 110,117 109,951
Equity attributable to the equity holders of Sonae Sierra 1,179,402 1,150,534 Non-controlling interests 7 593,023 578,506
Total equity 1,772,425 1,729,040
LIABILITIES:NON CURRENT LIABILITIES:
Bank loans - net of current portion 18 342,448 198,186 Debentures loans - net of current portion 18 99,181 - Derivative financial instruments 18 - 203 Shareholders 20 3,792 3,757 Accounts payable to suppliers 25 452 22 Other non current liabilities 22 21,243 6,193 Provisions 29 607 594 Deferred tax liabilities 23 147,350 133,753
Total non current liabilities 615,073 342,708
CURRENT LIABILITIES:Current portion of long term bank loans 18 44,395 71,763 Current portion of long term debentures loans 18 - 74,850 Short term bank loans and other borrowings 19 - 25,000 Shareholders 20 3,764 3,764 Accounts payable to suppliers 25 9,839 5,868 State and other public entities 26 13,419 9,496 Other payables 27 24,713 8,808 Other current liabilities 28 48,457 48,828 Provisions 29 3,365 1,959
Total current liabilities 147,952 250,336
Total equity, non-controlling interests and liabilities 2,535,450 2,322,084
The accompanying notes form an integral part of these consolidated statements of financial position.
The Board of directors
Sonae Sierra, SGPS, SA and subsidiaries
Consolidated statements of financial position as of 31 December 2018 and 2017
(Translation of the statement of financial position originally issued in Portuguese – Note 48)(Amounts stated in thousands of Euro)

2018 ConsolidatedReport and Accounts
Notes 2018 2017
Services rendered 30 156,735 173,356 Variation in fair value of the investment properties 31 26,855 60,831 Other operating revenue 32 32,554 3,659
216,144 237,846
External supplies and services (61,422) (78,210)Personnel expenses (50,170) (48,218)Depreciation and amortisation 9 and 11 (928) (1,036)Provisions and impairment 29 (1,743) (1,794)Impairment losses and write-off 33 (2,725) (1,676)Other operating expenses 34 (7,157) (6,947)
(124,145) (137,881)91,999 99,965
Finance income 35 7,309 6,876 Finance expenses 35 (15,320) (14,820)Share of results of joint ventures and associates 37 90,622 120,941 Gains and losses on investments 36 14,369 11,111
Profit before income tax 188,979 224,073
Income tax 24 (20,013) (26,095)Profit after income tax 168,966 197,978
Consolidated net profit for the period 168,966 197,978
Attributable to:Equity holders of Sonae Sierra 110,117 109,951 Non-controlling interests 7 58,849 88,027
168,966 197,978 Consolidated net profit per share:
Basic 43 3.39 3.38 Diluted 43 3.39 3.38
The accompanying notes form an integral part of these consolidated statements of profit or loss.
The Board of directors
Sonae Sierra, SGPS, SA and subsidiaries
Consolidated statements of profit or loss for the periods ended31 December 2018 and 2017
(Translation of the statement of financial position originally issued in Portuguese – Note 48)(Amounts stated in thousands of Euro)

7
Notes 2018 2017
Consolidated net profit for the period 168,966 197,978 Changes in the currency translation differences (30,652) (44,680)Changes in the fair value of hedging instruments (1,798) 695 Deferred tax related to components of other comprehensive income 468 (88)Others 59 -
Other comprehensive income for the period (31,923) (44,073)
Total comprehensive income for the period 137,043 153,905
Attributable to:Equity holders of Sonae Sierra 78,614 65,902 Non-controlling interests 58,429 88,003
137,043 153,905
The accompanying notes form an integral part of these consolidated statements of comprehensive income.
The Board of directors
Sonae Sierra, SGPS, SA and subsidiaries
Consolidated statements of comprehensive income for the periodsended 31 december 2018 and 2017
(Translation of the statement of financial position originally issued in Portuguese – Note 48)(Amounts stated in thousands of Euro)

2018 ConsolidatedReport and Accounts
Equity attributable to the equity holders of Sonae SierraReserves
Notes Sharecapital
Legalreserves
Translationreserve
Hedgingreserve
Retainedearnings
Net profitattributable to the equity
holders of Sonae Sierra
Total
Non-controlling
Interests (Note 7)
Total
Balance as of 1 January 2017 162,245 57,329 (104,488) (1,145) 864,275 181,198 1,159,414 508,485 1,667,899
Appropriation of consolidated net profit for 2016:Transfer to legal reserves and retained earnings - - - - 181,198 (181,198) - - - Dividends distributed - - - - (74,782) - (74,782) (12,475) (87,257)
- - - - 106,416 (181,198) (74,782) (12,475) (87,257)Currency translation differences - - (44,680) - - - (44,680) - (44,680)Fair value of hedging instruments 18 - - - 730 - - 730 (35) 695 Deferred tax in fair value of hedging instruments 23 - - - (99) - - (99) 11 (88)Capital increase/decrease - - - - - - (5,543) (5,543)Acquisitions/sale of subsidiaries effect - - - - - - 36 36 Consolidated net profit for the period ended 31 December 2017 - - - - - 109,951 109,951 88,027 197,978
Balance as of 31 December 2017 162,245 57,329 (149,168) (514) 970,691 109,951 1,150,534 578,506 1,729,040
Balance as of 1 January 2018 162,245 57,329 (149,168) (514) 970,691 109,951 1,150,534 578,506 1,729,040
Appropriation of consolidated net profit for 2017:Transfer to legal reserves and retained earnings - - - - 109,951 (109,951) - - - Dividends distributed - - - - (49,746) - (49,746) (43,912) (93,658)
- - - - 60,205 (109,951) (49,746) (43,912) (93,658)Currency translation differences - - (30,652) - - - (30,652) - (30,652)Fair value of hedging instruments 18 - - - (1,244) - - (1,244) (554) (1,798)Deferred tax in fair value of hedging instruments 23 - - - 325 - - 325 143 468 Consolidated net profit for the period ended 31 December 2018 - - - - - 110,117 110,117 58,849 168,966
Balance as of 31 December 2018 162,245 57,329 (179,820) (1,433) 1,030,964 110,117 1,179,402 593,023 1,772,425
The accompanying notes form an integral part of these consolidated statements of profit and loss.
The Board of directors
Sonae Sierra, SGPS, SA and subsidiaries
Consolidated statements of changes in equity for the periods ended 31 december 2018 and 2017
(Translation of the statement of financial position originally issued in Portuguese – Note 48)(Amounts stated in thousands of Euro)

9
Notes 2018 2017
OPERATING ACTIVITIES:Received from clients 156,560 168,195 Paid to suppliers (55,857) (83,300)Paid to personnel (50,147) (47,431)
Flows from operations 50,556 37,464
(Payments)/receipts of income tax (11,370) (6,360)Other (payments)/receipts relating to operating activities (2,767) (2,796)
Flows from operating activities [1] 36,419 28,308
INVESTING ACTIVITIES:
Receipts relating to:Investments 209,420 5,403 Tangible fixed assets 74,646 5,836 Interest income 3,872 2,788 Dividends 53,145 49,383 Other - 341,083 - 63,410
Payments relating to:Investments (40,561) (14,550)Tangible fixed assets (16,430) (10,389)Intangible fixed assets (592) (153)Other - (57,583) - (25,092)
Variation in loans granted (37,353) (19,715)
Flows from investing activities [2] 246,147 18,603
FINANCING ACTIVITIES:
Receipts relating to:Bank loans 21 290,000 63,077 Other - 290,000 - 63,077
Payments relating to:Interest expenses (15,374) (13,628)Dividends (93,658) (90,185)Decrease of share capital - nominal value and discounts and premiums - (5,544)Bank loans 21 (224,205) (79,684)Other - (333,237) - (189,041)
Variation in loans obtained - others 62 -
Flows from financing activities [3] (43,175) (125,964)
Variation in cash and cash equivalents [4]=[1]+[2]+[3] 239,391 (79,053)
Effect of exchange differences 1 (295)
Effect of the acquisitions and sales of companies:Parklake Shopping S.A. 6 673 - Plenerg SRL 6 29 - River Plaza Mall SRL 6 (595) - 3shoppings (consolidated) 6 - (2,135)
Cash and cash equivalents at the beginning of the year 16 68,145 149,628
Cash and cash equivalents at the end of the year 16 307,644 68,145
The accompanying notes form an integral part of these consolidated statements of comprehensive income.
The Board of directors
Sonae Sierra, SGPS, SA and subsidiaries
Consolidated statements of cash flows for the periods ended31 december 2018 and 2017
(Translation of the statement of financial position originally issued in Portuguese – Note 48)(Amounts stated in thousands of Euro)

2018 ConsolidatedReport and Accounts
1. INTRODUCTION
SONAE SIERRA, S.G.P.S., S.A. (“the Company” or “Sonae Sierra”), which has its head office in Lugar do Espido, Via Norte,
Apartado 1197, 4471-909 Maia – Portugal, is the parent company of a group of companies, as explained in Notes 3, 4 and 5
(“the Group”).
The Group’s operations consist of investment, management and development of shopping centres.
The Group operates mainly in Portugal, Brazil, Spain, Greece, Germany, Italy, Romania, Colombia, Morocco, Turkey and
Netherlands.
These financial statements are presented in Euro because that is the currency of the primary economic environment in which
the group operates. Foreign operations are included in accordance with the policy set out in Note 2.2.e).
2. PRINCIPAL ACCOUNTING POLICIES
The principal accounting policies adopted in preparing the accompanying consolidated financial statements are as follows:
2.1. Basis of preparation
The accompanying consolidated financial statements have been prepared according to the International Financial Report
Standards (“IFRS”) as approved by the European Union, applicable to economic years beginning on 1 January 2018. These
correspond to the International Financial Reporting Standards (“IFRS”) issued by the International Accounting Standards
Board (“IASB”) and interpretations issued by the International Financial Reporting Interpretations Committee (“IFRIC”) or by
the previous Standing Interpretations Committee (“SIC”) and approved by the European Union.
The accompanying consolidated financial statements have been prepared on a going concern basis and in accordance with the
accrual basis of accounting from the accounting records of the companies included in the consolidation, maintained according
to the generally accepted accounting principles in the countries of each company, adjusted in the consolidation process to
International Financial Reporting Standards (“IFRS”), as approved by the European Union.
Sonae Sierra, SGPS, SA and subsidiaries
Notes to the consolidated financial statements as of 31 December 2018
(Translation of notes originally issued in Portuguese – Note 48)(Amounts stated in thousands of Euro - kEuro)

11
New accounting standards and their impact in these consolidated financial statements
Up to the date of approval of these consolidated financial statements, the European Union endorsed the following standards,
interpretations, amendments, and revisions with mandatory application to the economic year beginning on 1 January 2018:
The Group has applied these amendments for the first time in 2018 and there is no significant impact on the accounts resulting
from their application. Anyway and specially regarding IFRS 9 and IFRS 15:
(i) IFRS 9 – Financial Instruments
The Group has adopted as of January 1, 2018 the new standard IFRS 9, which replaces the previous IAS 39. Regarding the
transition from IAS 39 to IFRS 9, the Group applied the simplified approach model, meaning that the Group did not apply IFRS
9 retrospectively.
Based on an analysis of the Group’s financial assets and liabilities, the Board of Directors assessed the impact of the adoption
of IFRS 9 on these financial statements as follows:
Classification and measurement
IFRS 9 introduced a model for the classification of financial assets based on the business model for managing the financial
assets ("business model test") and their contractual cash flow characteristics ("SPPI test").
The application of IFRS 9 did not change the fair value hedge and cash flow hedge classification.
The measurement and classification of all financial instruments continued on the same basis as previously under IAS 39.
Therefore, the captions accounts receivable, accounts payable and loans granted/obtained continued to be measured at
amortized cost under IFRS 9.
Impairment
A new methodology for the calculation and reporting of other receivables impairment losses was introduced, changing the
method from the incurred loss to the expected credit loss model (ECL), where the credit risk assessment is considered at the
initial recognition.
The Board of Directors concluded that the application of the expected credit loss model resulted in the early recognition
of credit losses for the corresponding assets in an immaterial amount, charged in the profit and loss of the year ended 31
December 2018.
Applicable for financial years
beginning on / afterIFRIC 22 Foreign Currency Transactions and Advance Consideration 01-Jan-18Amendments to IAS 40: Transfers of Investment Property 01-Jan-18Amendments to IFRS 2: Classification and Measurement of Share-based Payment Transactions 01-Jan-18Annual Improvements to IFRS Standards 2014-2016 Cycle 01-Jan-18IFRS 9 Financial Instruments 01-Jan-18IFRS 15 Revenue from Contracts with Customers 01-Jan-18Clarifications to IFRS 15 Revenue from contracts with customers 01-Jan-18Amendments to IFRS 4: Applying IFRS 9 - Financial instruments with IFRS 4 - Insurance contracts 01-Jan-18

2018 ConsolidatedReport and Accounts
(ii) IFRS 15 – Revenue from Contracts with customers
The Group has adopted as of 1 January 2018 the new standard IFRS 15, which replaces the previous IAS 18.
Revenue relates mainly to services provided to third parties, dividends and interest, which are recognised when they occur or
when the Group has the right and has performed its obligations. The moment of recognition of the performance obligation
occurs at a specific moment in time, which does not differ from the previous practice under IAS 18. There are no other significant
performance obligations to be fulfilled thereafter.
The Board of Directors concluded that the application of IFRS 15 does not have a material impact on the Group’s financial
position or financial performance.
Up to the date of approval of these financial statements, the following standards and interpretations, with mandatory
application in future reporting dates, have been endorsed by the European Union:
These standards and amendments, despite being endorsed by the European Union, have not been adopted by the Group
in 2018 because their application is not yet mandatory. Nevertheless, no significant impacts are expected from its future
adoption, except for the application of IFRS 16, which impacts were analysed by the Group as follows:
IFRS 16- Leases will replace IAS 17 - Leases for reporting periods beginning on or after 1 January 2019. IFRS 16 set outs a
comprehensive model for the identification of lease arrangements and their treatment in the financial statements of both
lessees and lessors.
The impact on the financial statements of the Group, as a lessee, relates essentially to the rental agreements of its automobile
fleet and the properties occupied by its offices. The Group has elected the partial retrospective approach on transition,
evaluating and identifying the respective components of all active leases as of 1 January 2019. On the transition date the
incremental borrowing rate of the Group will be used, considering that the right of use (RoU) is equal to the lease liability with
no impact on retained earnings.
The group expects to recognise right-of-use assets and lease liabilities of approximately 16,723 kEuro on 1 January 2019.
The group expects that net profit before tax will decrease by approximately 134 kEuro for 2019 as a result of adopting this
new standard.
As lessor, the changes introduced by IFRS 16 are not significant for the Group, the base revenue recognition model remains
the straight line, except for contingent cash flows (remuneration and discounts based on sales) that must be recognised in
the income statement in the period in which they occur. However, some additional disclosures will be required from 2019 on.
The following standards and interpretations were issued by the IASB but have not yet been endorsed by the European Union:
None of these standards have been adopted by the Group as they are not yet endorsed by the European Union. Nevertheless,
no significant impacts are expected from their future adoption.
Applicable for financial years
beginning on / afterIFRIC 23 Uncertainty over Income Tax Treatments 01-Jan-19IFRS 16 Leases 01-Jan-19Amendments to IFRS 9: Prepayment Features with Negative Compensation 01-Jan-19
Applicable for financial years
beginning on / afterIFRS 17 - Insurance Contracts 01-Jan-21Annual Improvements to IFRS Standards 2015-2017 Cycle 01-Jan-19Amendments to IAS 19: Plan Amendment, Curtailment or Settlement 01-Jan-19Amendments to IAS 28: Long-term investments in associates and loint ventures 01-Jan-19Amendments to References to the Conceptual Framework in IFRS Standards 01-Jan-20Amendment to IFRS 3 Business Combinations 01-Jan-20Amendments to IAS 1 and IAS 8: Definition of Material 01-Jan-20

13
2.2. Basis of Consolidation and investments in joint ventures and associates
The financial statements of the parent company and its subsidiaries, joint ventures and associates, included for the purpose
of these consolidated financial statements, have been prepared up to 31 December 2018 and have been adjusted, where
applicable, to ensure consistency with the Group’s accounting principles, described below.
a) Basis of consolidation
The consolidated financial statements incorporate the financial statements of the parent company (Sonae Sierra) and the
entities controlled by Sonae Sierra (subsidiaries). Control is achieved when the Company, has all of the following:
• power over the investee;
• is exposed, or has rights, to variable returns from its involvement with the investee; and
• the ability to use its power to affect its returns.
The Group reassesses whether it controls an entity if facts and circumstances indicate that there are changes to one or more
of the three elements of control listed above.
When the Company has less than the majority of the voting rights of an entity, it has power over the entity when the voting
rights are sufficient to give it the practical ability to direct the relevant activities of the entity unilaterally. The Company
considers all relevant facts and circumstances in assessing whether the Company’s voting rights in an entity are sufficient to
give it power, including:
• the size of the Company’s holding of voting rights relative to the size and dispersion of holdings of the other vote holders;
• potential voting rights held by the Company, other vote holders or other parties;
• rights arising from other contractual arrangements; and
• any additional facts and circumstances that indicate that the Company has, or does not have, the current ability to direct
the relevant activities at the time that decisions need to be made, including voting patterns at previous shareholders’
meetings.
As of 31 December 2018 and 2017, there were no entities to which these conditions applied.
Consolidation of a subsidiary begins when the Group obtains control over the subsidiary and ceases when the Group loses
control of the subsidiary, by using the full consolidation method.
The purchase method of accounting is used when recording the acquisition of subsidiaries (Note 2.2.d)).
The interests in the net assets of subsidiaries that do not belong to the Group (non-controlling interests) are presented within
equity, separately from equity attributable to equity holders of the parent company, under the caption "Non-controlling
interests”. Non-controlling interests consist of the amount of those interests at acquisition date (Note 2.2.d)) and of the
proportion in changes in equity of subsidiaries acquired after the purchase date.
The net result and each component of comprehensive income are allocated to the Group and to the non-controlling interests
in proportion to their holding (ownership interest), even if this results in a negative balance of non-controlling interests.
All intercompany transactions (including gains/losses obtained in sales within the Group), balances and dividends distributed
within the Group are eliminated in the consolidation process.

2018 ConsolidatedReport and Accounts
When the Group loses control of a subsidiary, a gain or loss is recognised in the statement of profit or loss and is calculated
as the difference between (i) the aggregate of the fair value of the consideration received and the fair value of any retained
interest in the former subsidiary and (ii) the previous carrying amount of the assets (including goodwill), and liabilities of
the subsidiary and any non-controlling interests. The fair value of any investment retained in the former subsidiary at the
date when control is lost is regarded as the fair value on initial recognition for subsequent accounting under IFRS 9, or, when
applicable, the cost on initial recognition of an investment in an associate or a joint venture.
The changes in ownership interest in the Group's subsidiaries that do not result in loss of control are recorded as equity
transactions.
The subsidiaries included in the consolidated financial statements by the full consolidation method are listed in Note 3.
b) Joint ventures and associates
A joint venture is a joint arrangement whereby the parties that have joint control of the arrangement have rights to the net
assets of the joint arrangement instead of rights to the assets and obligations for the liabilities of the joint arrangement. Joint
control is the contractually agreed sharing of control of an arrangement, which exists only when decisions about the relevant
activities require unanimous consent of the parties sharing control.
Associates are entities where the Group exercises significant influence. Significant influence (presumed when the contribution
is above 20%) is the power to participate in the financial and operating decisions of the entity, but do not hold the control on
joint control over those decisions.
Investments in joint ventures and associates are measured under the equity method, after initial recognition.
Under the equity method, investments in joint ventures and associates are recognised at cost on acquisition, adjusted after
the date of acquisition, by the amount corresponding to the Group's proportion in net profit or loss and other comprehensive
income of joint ventures and associates after that date. By applying the equity method, the Group's share in net profit or loss
and other comprehensive income of joint ventures and associates is recorded against the statement of profit or loss or other
comprehensive income, respectively, and the dividends received are deducted from the value of the investment.
The excess of cost of acquisition over the fair value of identifiable assets and liabilities of each joint venture and associate at
the acquisition date is recognised as goodwill (Note 2.2.d)) and is kept under the caption of the investments in joint venture
and associates. If the difference between the acquisition cost and fair value of assets and liabilities acquired is negative, it is
recognised as a gain for the year in the statement of profit or loss.
The investments in joint ventures and associates including, when applicable, any goodwill (Note 2.2.d)), included as part of the
investment in joint venture and associates, are assessed for impairment purposes when there are indicators that the asset
may be impaired. Any existing impairment loss is recorded as a loss in the statement of profit or loss.
When the Group's share of accumulated losses of the joint venture or associate exceeds the amount at which the investment
is recorded, the investment is reported at nil value and the recognition of losses is discontinued, except in the extent of the
Group’s commitment towards the joint venture or associate.
Unrealised gains and losses arising from transactions with joint ventures and associates are eliminated to the extent of the
Group’s interest in the joint venture or associate against the investment in that joint venture or associate.
The Group discontinues the use of the equity method from the date when the investment ceases to be a joint venture or an
associate or when the investment is classified as held for sale. When the Group retains an interest in the former joint venture
or associate and the retained interest is a financial asset, the Group measures the retained interest at fair value at that date
and the fair value is regarded as its fair value on initial recognition in accordance with IFRS 9. The difference between: (i) the
carrying amount of the joint venture or associate at the date the equity method was discontinued, and (ii) the fair value of

15
any retained interest and any proceeds from disposing of a part interest in the joint venture or associate, is included in the
determination of the gain or loss on disposal of the joint venture or associate.
If the investment becomes a subsidiary, the Group applies IFRS 3 – Business Combinations and IFRS 10 - Consolidated financial
statements (Notes 2.2.a) and 2.2.d)).
The Group continues to use the equity method when an investment in an associate becomes an investment in a joint venture
or an investment in a joint venture becomes an investment in an associate. There is no remeasurement to fair value upon such
changes in ownership interests.
Investments in joint ventures are listed in Note 4.
Investments in associates are listed in Note 5.
c) Joint operations
A joint operation is a joint arrangement whereby the parties that have joint control of the arrangement have rights to the
assets, and obligations for the liabilities, relating to the arrangement.
As of 31 December 2018 and 2017, there are no joint operations within the Group.
d) Goodwill
In the acquisitions of subsidiaries after 1 January 2010, the positive differences between the transferred price (usually
acquisition cost) increased by the amount of non-controlling interests at acquisition date and the fair value of identifiable net
assets acquired and the assumed liabilities of such companies at the acquisition date, are recorded under caption "Goodwill". If
the difference is negative, it is recognised as a gain of the year. The non-controlling interests at acquisition date are measured
at fair value or by their share of the fair value of identifiable net assets at the acquisition date.
The positive differences between the acquisition cost of investments in subsidiaries acquired until 31 December 2009, joint
ventures and associates and the fair value of identifiable assets and liabilities attributable to the Group of those companies
at the acquisition date, are recorded under the caption "Goodwill (in the case of investments in subsidiaries) or in investment
in joint ventures and associates (in the case of investments in joint ventures and associates). If the difference is negative, it is
recognised as a gain of the year. Non-controlling interests include, in the case of acquisition of subsidiaries, their proportion in
the fair value of identifiable assets and liabilities at the acquisition date.
The goodwill is not depreciated and is tested for impairment at each reporting date.
Any impairment loss on goodwill is immediately recognised in the statement of profit or loss of the year under the caption
"Write-off and impairment losses” and not subsequently reversed.
The impairment tests of goodwill are based on the Net Asset Value (“NAV”) of the shares held, at each reporting date.
The NAV corresponds to the fair value, at each reporting date, of the net assets of the subsidiary excluding deferred tax
liabilities relating to unrealised gains on investment properties.

2018 ConsolidatedReport and Accounts
e) Translation of financial statements of foreign entities
The entities that operate abroad and are financially, economically, and organisationally autonomous are considered as foreign
entities.
The assets and liabilities of the financial statements of foreign entities are translated to Euro at the exchange rate as of
the reporting date and the income and expenses and also the cash-flow statement are translated to Euro using the average
exchange rate. The amount related to the exchange rate difference is recorded in the equity under the caption “Translation
reserve”.
Goodwill and fair value adjustments resulting from the acquisition of those foreign entities are considered as assets and
liabilities of that foreign entity, being translated to Euro at the exchange rate existing as of each reporting date.
Whenever a foreign entity is sold, the accumulated exchange differences are recognised as a gain or loss in the consolidated
statement of profit or loss.
The exchange rates used for the conversion into Euro of the accounts of foreign subsidiaries, joint ventures and associates
were the following:
2.3. Investment Properties
Investment properties consist of investments in buildings and other constructions in shopping centres to earn rentals or capital
appreciation or both, rather than for use in the production or supply of goods or services or for administration purposes or for
sale in the ordinary course of business.
Investment properties are recorded at their fair value based on appraisals made by independent specialised entities (fair value
model). Changes in fair value of investment properties are accounted for in the period in which they occur, under the statement
of profit or loss caption “Variation in fair value of investment properties”.
The Group’s assets which qualify as investment properties are recognised as such when they start being used or, in the
case of the investment properties under development, when their development is considered irreversible. By the time the
asset qualifies as investment property, it is booked at its historical or production cost under “Investment properties under
development” as a tangible fixed asset– Property, Plant and Equipment (Note 2.4). Thereafter, such assets are accounted at
their fair value. The difference between fair value and cost (of purchase or production), at that date, is recorded directly in the
statement of profit or loss, under caption “Variation in fair value of investment properties”.
Costs incurred related to investment properties in use, namely maintenance, repairs, insurance, and property taxes are
recognised as an expense in the statement of profit or loss for the year to which they relate. The improvements estimated to
generate additional economic benefits are capitalised under the caption “Investment properties”.
If an investment property becomes owner-occupied, it is reclassified to the caption “Property, plant and equipment”.
2018 2017
31.12.18 Average 31.12.17 AverageBrazilian Real 0.22502 0.23289 0.25171 0.27834 New Romanian Leu 0.21441 0.21489 0.21461 0.21892 Colombian Peso 0.00027 0.00029 0.00028 0.00030 Algerian Dinar 0.00739 0.00727 0.00725 0.00800 Hong Kong Dollar 0.11151 0.10813 0.10670 0.11386 Turkish Lira 0.16535 0.17966 0.22126 0.24339 Moroccan Dirham 0.09130 0.09026 0.08947 0.09150

17
Fit out contracts are contracts under which the Group supports part of the expenses incurred with the fitout expenses and the
tenant assumes the responsibility to reimburse the Group by the amount invested over the term of the contract, in terms and
conditions specific to each contract. The amounts paid by the Group on each fit out contract are initially recorded at cost under
the caption “Investment properties”, being subsequently adjusted to the corresponding fair value, at each reporting date, as
determined by specialised independent entities. The methodology used to determine the fair value of the fit-out contracts is
like the one used in determining the fair value of the investment property to which these contracts relates. Variations in fair
value of the fit-out contracts are recorded in the consolidated statement of profit or loss under the caption “Variation in fair
value of the investment properties”.
2.4. Property, Plant and Equipment
Tangible fixed assets (Property, Plant and Equipment) are stated at cost less accumulated depreciation and any accumulated
impairment losses.
Depreciation is provided on a straight-line basis, as from the date the assets start being used, over the estimated period of
useful life of each group of assets.
The depreciation rates used correspond to the following periods of estimated useful life:
Tangible fixed assets in progress and investment properties under development are recorded at cost of acquisition or
production, deducted from eventual impairment losses. As fixed assets in progress relate mainly to tangible fixed assets, that
will qualify in the future as investment properties, those are classified separately in the statement of financial position, under
the caption “Investment properties under development”.
Gains and losses arising from the sale or disposal (write-off) of tangible fixed assets are determined as being the difference
between the sale price and the corresponding carrying amount as of the sale/disposal date, being recorded in the statement
of profit or loss, under the captions “Other operating income” or “Other operating expenses”.
2.5. Intangible assets
Intangible assets are stated at cost less accumulated depreciation and any impairment losses. Intangible assets are only
recognised if it is likely to produce future economic benefits to the Group, are controlled by the Group and the cost of the asset
can be reliably measured.
Expenditure on research activities are recorded as expenses in the period they are incurred.
Intangible assets as of 31 December 2018 consist mainly of:
• rights of facilities management, which are depreciated on a straight-line basis over the estimated period of the
management right (periods ranging from 10 to 15 years);
• Software, which is depreciated over the estimated period of use (periods ranging from 3 to 5 years).
Depreciation of intangible assets are recorded in the statement of profit or loss under caption “Depreciation and amortisation”.
YearsBuildings and other constructions 50Machinery and equipment 10Transport equipment 5Tools and utensils 4Administrative equipment 10Other property, plant and equipment 5

2018 ConsolidatedReport and Accounts
2.6 Non-current assets held for sale
Non-current assets (and all related assets and liabilities to dispose) are classified as held for sale if it is expected that its book
value will be recovered through sale rather than through continuing use. This condition is considered fulfilled only when the
sale is highly probable and the asset (and all other related assets and liabilities to dispose) is available for immediate sale under
current conditions. Additionally, there must be in place measures that make likely the sale will be held within 12 months after
the date of the classification under this caption.
When the Group is committed to a sale plan involving loss of control of a subsidiary, all of the assets and liabilities of that
subsidiary are classified as held for sale when the criteria describe above are met, regardless of whether the Group will retain a
non-controlling interest in its former subsidiary after sale.
Non-current assets (and all related assets and liabilities to dispose) classified as held for sale are measured at the lower of book
value or fair value, less costs related to the sale. In return, these assets are not amortised.
2.7. Financial assets and liabilities
Financial assets and financial liabilities are recognised in the Group’s statement of financial position when the Group becomes
a party to the contractual provisions of the instrument.
Financial assets and financial liabilities are initially measured at fair value. Transaction costs that are directly attributable to
the acquisition or issue of financial assets and financial liabilities (other than financial assets and financial liabilities at fair value
through profit or loss) are added to or deducted from the fair value of the financial assets or financial liabilities, as appropriate,
on initial recognition. Transaction costs directly attributable to the acquisition of financial assets or financial liabilities at fair
value through profit or loss are recognised immediately in profit or loss.
Financial assets are classified into the following measurement categories:
• those to be measured subsequently at fair value (either through other comprehensive income (FVTOCI) or through profit
or loss (FVTPL), and
• those to be measured at amortised cost.
Financial assets measured subsequently at fair value include mainly derivative financial instruments. The subsequent
measurement of these financial assets is carried at fair value and recorded in the statement of changes in equity, if they
qualify for hedge accounting purposes (Note 2.8). If they do not qualify for hedge accounting purposes, the fair value of these
financial assets is recorded in the statement of profit or loss.
Financial assets subsequently measured at amortised cost are those generated during normal operations of the Group, for
which there is no intention to negotiate. Classified in this category are the accounts receivable and other receivables, loans
to third parties and bank deposits. The subsequent measurement of these financial assets is carried at amortised cost in
accordance with the effective interest method.
Financial liabilities are classified into the following measurement categories:
• those to be measured subsequently at fair value through profit or loss (FVTPL), and
• those to be measured at amortised cost.
Financial liabilities measured at fair value include mainly derivative financial instruments. The subsequent measurement of
these financial liabilities is carried at fair value and recorded in the statement of changes in equity if they qualify for hedge
accounting purposes (Note 2.8). If they do not qualify for hedge accounting purposes, the fair value of these financial liabilities
is recorded in the statement of profit or loss.

19
Financial liabilities measured at amortised cost correspond to the other financial liabilities that are not classified in the former
category. In this category are classified bank loans and loans from other entities, including shareholders and accounts payable
and other payables. The subsequent measurement of these financial liabilities is carried at amortised cost, in accordance with
the effective interest method.
a)Trade and Other Receivables
Accounts receivable and other receivables are recorded at amortised cost less any eventual impairment losses.
Impairment losses are recorded based on the valuation of estimated losses from non-collection of accounts receivable at the
statement of financial position date. Impairment losses are recognised in the income statement, and can be reversed if the
estimated losses decrease, in a later period.
b) Borrowings
Loans are stated as liabilities and measured at amortised cost.
Any expenses incurred in obtaining such financing, usually paid in advance on issue, namely the bank fees and stamp duty as
well as interest and similar expenses, are recognised using the effective interest method in the results of the year, over the
lifetime of such financing. These prepaid expenses are deducted from the caption “Bank loans”.
Financial expenses including interest expenses and similar expenses (namely stamp duty), are recorded in the statement of
profit or loss on an accrual basis of accounting. The amounts due and not paid at the reporting date are recorded under the
caption “Other current liabilities”.
c) Trade and Other Payables
Accounts payable and other payables are stated at amortised cost. Usually, the amortised cost of these liabilities does not
differ from its nominal value.
d) Cash and cash equivalents
The amounts under caption "Cash and cash equivalents" includes cash on hand, bank deposits on demand and other treasury
applications which mature in less than three months that are subject to insignificant risk of change in value.
These assets are measured at amortised cost. Usually, the amortised cost of these financial assets does not differ from its
nominal value.
For purposes of the statement of cash flows, “Cash and cash equivalents” also include bank overdrafts, which are included in
the statement of financial position under caption “Other loans”.
e) Derivative financial instruments
The Group uses derivative financial instruments in managing their financial risks associated with fluctuating interest rate, only
as a way to hedge those risks. Derivatives are not used for trading purposes (speculation).
Derivative financial instruments used by the Group relate mainly to instruments for hedging interest rate on bank loans
obtained, usually corresponding to "swap" or "zero cost collars" of interest rate.

2018 ConsolidatedReport and Accounts
Derivative financial instruments are initially recorded at fair value on the date of their contract. At each reporting date, they are
remeasured at fair value, with the corresponding gain or loss on the remeasurement recorded immediately in the statement
of profit or loss, unless such instruments are designated as hedging instruments. When they are designated as a hedging
instrument (Note 0), the corresponding gain or loss in the re-measurement is recorded against the caption "Hedging reserve"
in equity and transferred to results when the covered position affects the statement of profit or loss.
A derivative with a positive fair value is recognised under caption "Derivative financial instruments" as a financial asset. A
derivative financial instrument with a negative fair value is recognised under the same caption but as a financial liability.
A derivative is presented as non-current if the remaining maturity exceeds 12 months and is not expected that it will be
executed or settled within that period.
In situations where there are derivatives embedded in other financial instruments or other host contracts, they are treated
as separate derivatives in situations where the risks and characteristics are not closely related to the host contracts and in
situations where the host contracts are not presented at fair value with unrealised gains or losses recorded in the statement
of profit or loss.
f) Impairment of financial assets
The Group recognises a loss allowance for expected credit losses “ECL” on trade receivables and contract assets. The amount
of expected credit losses is updated at each reporting date to reflect changes in credit risk since initial recognition of the
respective financial instrument.
The Group always recognises lifetime ECL for trade receivables, contract assets. The expected credit losses on these financial
assets are estimated using a provision matrix based on the Group’s historical credit loss experience, adjusted for factors that
are specific to the debtors, general economic conditions and an assessment of both the current as well as the forecast direction
of conditions at the reporting date, including time value of money where appropriate.
For all other financial instruments, the Group recognises lifetime ECL when there has been a significant increase in credit
risk since initial recognition. However, if the credit risk on the financial instrument has not increased significantly since initial
recognition, the Group measures the loss allowance for that financial instrument at an amount equal to 12-month ECL.
Lifetime ECL represents the expected credit losses that will result from all possible default events over the expected life of a
financial instrument. In contrast, 12-month ECL represents the portion of lifetime ECL that is expected to result from default
events on a financial instrument that are possible within 12 months after the reporting date.
Write-off policy
The Group writes off a financial asset when there is information indicating that the debtor is in severe financial difficulty
and there is no realistic prospect of recovery, e.g. when the debtor has been placed under liquidation or has entered into
bankruptcy proceedings. Financial assets written off may still be subject to enforcement activities under the Group’s recovery
procedures, taking into account legal advice where appropriate. Any recoveries made are recognised in profit or loss.
Measurement and recognition of expected credit losses
The measurement of expected credit losses is a function of the probability of default, loss given default (i.e. the magnitude of
the loss if there is a default) and the exposure at default. The assessment of the probability of default and loss given default is
based on historical data adjusted by forward-looking information as described above.

21
2.8. Hedge accounting
As mentioned above, the Group uses derivative financial instruments (usually swaps and zero cost collars) to cover the
risk of changing interest rate on Group’s bank loans (cash flow hedge). The amount of loans, maturities, interest rates and
reimbursement plan of loans underlying such financial instruments to hedge interest rate are usually identical in all conditions
established for the correspondent contracted loans, which usually sets the perfect relationship coverage.
The criteria for classifying financial derivatives for hedging interest rate as cash flow hedges are as follows:
• The hedge transaction is expected to be highly effective in achieving offsetting changes in fair value or cash flows
attributable to the hedged risk;
• the effectiveness of the hedge can be reliably measured;
• there is adequate documentation of the hedging relationships at the inception of the hedge;
• the forecast transaction that is hedged is highly probable.
Derivative financial instruments used by the Group to hedge the exposure to changes in the interest rate of its loans are
initially recorded at cost, if any, and subsequently adjusted to the corresponding fair value. Changes in fair value of these
hedging instruments are recorded in equity under the caption “Hedging reserve”, and then recognised in the statement of
profit or loss over the period the hedged instrument affects results, when those meet the conditions to hedge accounting,
otherwise the changes in fair value are recognised through the statement of profit or loss.
Hedge accounting of derivative instruments is discontinued when the instrument matures or is sold. Whenever a derivative
instrument can no longer be qualified as a hedging instrument, the fair value differences recorded in equity under the caption
“Hedging reserve” are transferred to profit or loss of the year or to the book value of the hedged asset; subsequent variations
in fair value are recorded in the statement of profit or loss.
2.9. Accounting for leases
A lease is classified as (i) finance lease whenever the terms of the lease transfer substantially all the risks and rewards of
ownership to the lessee and as (ii) an operating lease if the risks and rewards of ownership are not transferred to the lessee.
Classifying a lease as finance or an operating lease depends upon the substance of transaction rather than the form
of the contract.
Accounting for leases where the Group is the lessee
The assets acquired through finance lease contracts, as well as the corresponding responsibilities, are recognised by the
financial method, including in the statement of financial position the acquired asset and the pending debts in accordance
with the contractual terms. In addition, the interest included in the lease payments and the changes in the fair value of the
investment property or the depreciation of the tangible assets, are posted in the statement of profit or loss of the year.
The existing situations where the Group is the lessee are operating leases and as such the lease payments are recognised as
an expense on a straight-line basis over the lease term.
Accounting for leases where the Group is the lessor
The existing situations where the Group is the lessor relate to the contracts with the tenants of the shopping centres. These
contracts are usually for a period of six years and establish the payment by the tenant of a monthly fixed rent (invoiced in
advance), a turnover rent (invoiced if the monthly sales of the tenant are higher than the limit established in the contract) and
the payment of tenant’s share in the shopping centre operating expenses (common charges). The contract with the tenant may
also establish the payment of an entrance fee in the shopping centre (key money income) and some discounts (usually in the

2018 ConsolidatedReport and Accounts
first three years of the contract) to the fixed rent. These contracts can be renewed or cancelled by any of the parties involved (the
company or the tenant). If the cancellation is proposed by the lessor it must pay a cancellation fee (buy-out cost) to the tenant.
In accordance to the conditions of these contracts, they are classified as operating leases, being the rents (fixed and turnover
rents) and the common charges recorded as revenue in the statement of profit or loss in the year to which they relate. The
expenses (namely discounts on fixed income and buy-out costs) as well as the key income and the cancellation fee related with
the operating leases are recorded as expenses or income in the statement of profit or loss in the year to which they incurred or
are received. This procedure is consistent with the one followed by the independent specialised entity which determines the
fair value of the investment property to which the lease contracts are related (Note 2.3).
2.10. Borrowing costs
Financial costs related to borrowings are generally recognised as expense as incurred.
Borrowing costs related directly to the acquisition, construction, or production of tangible assets (usually investment properties
under development) are capitalised as part of the cost of the qualified asset. Borrowing costs are capitalised from the time of
preparation of the activities to construct or develop the asset to the time the production or construction is completed or when
the development is suspended. Any eventual financial income derived from a loan obtained earlier and allocable to a qualifying
account, is deducted from the financial expenses that qualify for capitalisation.
2.11. Provisions
Provisions are recognised when, and only when, the Group has an obligation (legal or implicit) resulting from a past event and it is
probable that an outflow of resources will be required to settle the obligation, and a reliable estimate can be made of the amount
of the obligation. Provisions are reviewed and adjusted at the reporting date to reflect the best estimate as of that date.
The Group recognises provisions for restructuring expenses when there is a formal and detailed restructuring plan and that
such plan has been communicated to the parties involved.
2.12. Income tax
The income tax for the period comprises current and deferred tax.
The current income tax is determined based on the taxable results of the companies included in the consolidation in accordance
with the tax laws enacted or substantively enacted at the reporting date in the countries where their head offices are located.
Deferred taxes are calculated using the financial position liability method, reflecting the net tax effects of temporary differences
between the carrying amounts of assets and liabilities for financial reporting purposes and the amounts used for income tax
purposes. Deferred tax assets and liabilities are not recognised when the corresponding temporary differences arise from
goodwill or from the initial recognition of assets and liabilities other than in a business combination.
Deferred tax assets and liabilities are calculated and evaluated annually at the tax rates expected to apply to the period when
the asset is realized or the liability is settled, based on tax rates (and tax laws) that have been enacted or substantially issued
at the reporting date.
Deferred tax assets are recognised only when it is probable that sufficient taxable profits will be available against which the
deferred tax assets can be utilised. At the reporting date, a review is made of the deferred tax assets and they are reduced
whenever their future use is no longer probable.
Deferred tax assets and liabilities are recorded in the statement of profit or loss, except if they relate to items directly recorded
in equity captions. In these situations, the corresponding deferred tax is also recorded under the same caption.

23
2.13. Revenue
The Group's revenue is basically due to income from investment properties via the operating lease contracts and services
related to: management services regarding the condominium and car parking of shopping centres, management services
regarding the management of the shopping centres held by third parties and development fees regarding the consulting
services on the development of new shopping centres.
The revenue related to income from investment properties via the operating lease contracts with the tenants (Note 2.9) is
recognised in the year to which it relates, as follows:
- Fixed rent:This income is invoiced in the previous month to which it relates and is recognised in the statement of profit or loss in the
period to which it relates.
- Turnover rent:This income is contingent and payable when the sales exceed the limit specified in the lease contract. As such, this income is
recorded on an accrual basis.
- Other income and expenses:Revenue arising from key money is recognised when received from the tenants and the revenue arising from contract transfer
fees is recognised when charged to tenants, in the statement of profit or loss under captions "Other operating revenue" and
"Services rendered", respectively. The discounts on fixed rents and the buy-out costs are recognised in the statement of
profit or loss when granted to tenants, under captions "Services rendered” (as a deduction) and "Other operating expenses",
respectively.
This procedure is consistent with the methodology used by the independent specialised entity that determines the fair value
of the investment property to which the lease contracts are related.
Extra-contractual discounts granted to tenants are recorded on the statement of profit or loss, under the caption “Services
rendered” (as a deduction).
Revenue relating the services provided is recognised when the Group transfers the control of the service to the customer. Such
services are recognised as a performance obligation satisfied over time, being recognised in the period in which the services
are rendered.
The dividends are recognised as gains in the year they are assigned to the shareholders.
2.14. Accrual basis of accounting
The income and expenses are recognised in the year to which they relate, regardless of the date of payment or receipt (accrual
basis of accounting). The income and expenses for which actual amounts are not known are estimated.
Under the captions "Other current assets" and "Other current liabilities” are recorded income and expenses attributable to
the current year, which settlement or receipt will only occur in future years, as well as amounts paid and received that have
occurred on the reporting date, but which relate to future periods, and that will be charged to the statement of profit or loss of
the corresponding year.

2018 ConsolidatedReport and Accounts
2.15.Impairment of assets a) Non-financial assets, excluding goodwill
With the exception of investment properties (Note 2.3) and deferred tax assets (Note 2.12), non-financial assets are assessed
for impairment at each reporting date and whenever events or changes in circumstances indicate that the amount by which
the asset is registered may not be recovered.
Whenever the carrying amount of an asset exceeds its recoverable amount, an impairment loss is recognised under the
statement of profit or loss caption “Impairment losses and write-off”.
The recoverable amount is the higher of an asset’s net selling price and value in use. The net selling price is the amount
obtainable from the sale of an asset in an arm’s length transaction less the costs of disposal. Value in use is the present value
of estimated future cash flows expected to arise from the continuing use of an asset and from its disposal at the end of its
useful life. Recoverable amounts are estimated for individual assets or, if this is not possible, for the cash-generating unit to
which the asset belongs.
Reversal of impairment losses recognised in prior years is recorded when there is an indication that the impairment losses
recognised for the asset no longer exists or has decreased. The reversal is recorded in the statement of profit or loss as
operating result. However, the increased carrying amount of an asset due to a reversal of an impairment loss is recognised
to the extent it does not exceed the carrying amount that would have been determined (net of depreciations) in case no
impairment loss had been recognised for that asset in prior years.
b) Financial assets (usually accounts receivable, in the case of Group)
Whenever there are objective indicators that the Group will not receive the amounts it is entitled to, in accordance with the
arrangements agreed between the parties, an impairment loss is recorded in the statement of profit or loss. The indicators
used by the Group to identify the signs of impairment are:
• Failure on the maturity and/or other terms agreed between the parties;
• Financial constraints of the debtor;
• Probability of insolvency of the debtor.
Whenever there is such evidence, the existence of impairment losses is assessed, which is determined by the difference
between the asset's carrying amount and its corresponding recoverable amount.
Impairment losses are recorded in the statement of profit or loss under the caption "Write-off and impairment losses" in the
period they are determined.
Subsequently, if the amount of the impairment loss reduces, it is reversed by results and recorded under the caption "Other
operating revenue”.
2.16. Balances and transactions expressed in foreign currency
Transactions in currencies other than Euro are recorded at the exchange rates prevailing on the transaction date.
At each reporting date, all monetary assets and liabilities expressed in foreign currencies are translated to Euro using the
closing exchange rates as of that date (Note 2.2.e)).
Exchange gains or losses, arising from differences between exchange rates effective at the date of transaction and those
prevailing at the date of collection, payment or at the reporting date, are recorded as income or expenses in the statement of
profit or loss

25
2.17. Current/non-current classification on the statement of financial position
Assets and liabilities due in more than one year from the reporting date are classified as non-current assets and liabilities,
respectively.
2.18. Contingent assets and liabilities
Contingent liabilities are not recognised in the consolidated financial statements. They are disclosed in the notes unless the
possibility of an outflow of resources incorporating economic benefits is remote.
A contingent asset is not recognised in the consolidated financial statements but disclosed in the notes when an inflow of
economic benefits is probable.
2.19. Risk management policies
The Group’s activities are exposed to a variety of financial risks: market risk (including currency risk, interest rate risk and price
risk), credit risk and liquidity risk. The Group’s overall risk management programme focuses on the unpredictability of financial
markets and seeks to minimise potential adverse effects on the Group’s financial performance.
Risk management is carried out by a central treasury department of the Group Sonae Sierra, under policies approved by the
Board of Directors. The Board provides written principles for overall risk management, as well as written policies covering
specific areas, such as foreign exchange risk, interest rate risk, and credit risk.
a) Foreign exchange risk
The main operating activity of each company is developed inside its country and consequently much of the company
transactions are maintained in the same currency of its country. The policy to cover this specific risk is to avoid, whenever
possible, the contracting of services in foreign currency.
As the operational activity of the Company is maintained in Euros, the Company policy is to obtain its borrowings also in Euros,
in order to eliminate the foreign currency risk.
b) Credit risk
The group’s credit risk results essentially from the credit risk of the tenants of the shopping centres managed by the Group.
The control of this risk is made by an evaluation of the credit of the tenants before their acceptance in the shopping centre as
well as a control over the credit limits attributed to each tenant.
c) Liquidity risk
The needs of treasury are managed by the financial department of the Sonae Sierra Group, which monitors the surplus and
deficits of liquidity of each one of the companies included in the consolidation. The occasional needs for liquidity are covered
by an adequate control of the accounts receivables and by the maintenance of adequate limits of credit arranged by the Group
with its banks.

2018 ConsolidatedReport and Accounts
d) Interest rate risk
The Group’s income and operating cashflows are influenced by changes in market interest rates, since its cash and cash
equivalents and intragroup financing granted are dependent on the evolution of the interest rates in Euro which, historically,
have had little volatility.
On long-term financing, and as a way to mitigate the changes in the long-term interest rates, the Group contracts cash flow
hedge instruments (“swaps”, “zero cost collars” or “caps”). Additionally, the Group also chose to fix the interest rate of some
financings.
Interest rate sensitivity analysis:
The sensitivity analysis below has been determined based on the exposure to interest rates for both derivatives and non-
derivative instruments in place during the reporting period. For floating rate assets and liabilities, the analysis is prepared
based on the following assumptions:
• Changes in market interest rates affect the interest income or expense of floating rate interest financial instruments and,
in the case of fixed rates that were contracted during the period of analysis, changes in the interest rates also affect this
component;
• Changes in market interest rates only affect interest income or expense in relation to financial instruments with fixed
interest rates if these are recognised at their fair value. As such, all financial instruments with fixed interest rates that are
carried at amortised cost are not subject to interest rate risk, as defined in IFRS 7;
• In the case of fair value hedges designed for hedging interest rate risks, when the changes in the fair values of the hedged
item and the hedging instrument attributable to interest rate movements are offset almost completely in the income
statement in the same period, these financial instruments are also not exposed to interest rate risk;
• Changes in market interest rates affect the fair value of derivatives designated as hedging instruments;
• The fair value of derivative financial instruments (“swaps”, “zero cost collars” or “caps”) and other financial assets and
liabilities is estimated by discounting the future cash flows to their net present values, using appropriate market rates
prevailing at yearend and assuming a parallel shift in yield curves;
• For the purposes of this sensitivity analysis, such analysis is performed based on all financial instruments outstanding at
the end of the relevant year.
Sensitivity analyses are performed by changing one variable while holding all other variables constant. Nonetheless, this is a
restrictive and highly unlikely assumption, since variables tend to be correlated.
If interest rates had been 75 basis points higher and all other variables were held constant, assumptions unlikely to occur due
to interest rates correlation with other variables, the impact in the Group net profit and equity would be the following:
(1) This is mainly attributable to the Group’s exposure to interest rates on its variable rate borrowings;(2) This is mainly a result of the changes in the fair value of derivatives entered as cash flow hedges that are efficient.
As of 31 December 2018 and 2017, the interest rate sensitive analysis if the interest rates had been 25 basis points lower was
not done because Euribor in 2018 and 2017 was close to 0.25%.
In management’s opinion, the sensitivity analysis is representative of the inherent interest rate risk of the year and expenses
may not reflect the exposures during the year, due to any repayments made.
2018 2017
+75 b.p. +75 b.p.Net Profit (1) (1,236) (781)Reserves (2) 33 79

27
2.20. Financial instruments by category
The financial instruments according to the policies described in Note 2.7. were classified as follows:
Financial Assets
Financial Liabilities
Financial assets at amortised cost
Assets at fair value through other comprehensive income
(Note 18)Total
As of 31 December 2018Non current assets
Derivative financial instruments 492 492Shareholders 54,487 54,487Other non-current assets 3,527 3,527
58,014 492 58,506Current assets
Trade receivables 15,034 15,034Shareholders 11,103 11,103Other receivables 8,959 8,959Cash and cash equivalents 312,665 312,665
347,761 - 347,761405,775 492 406,267
As of 31 December 2017Non current assets
Derivative financial instruments 1,319 1,319Shareholders 130,604 130,604Other non-current assets 3,288 3,288
133,892 1,319 135,211Current assets
Trade receivables 22,354 22,354Shareholders 5,680 5,680Other receivables 53,756 53,756Cash and cash equivalents 68,145 68,145
149,935 - 149,935283,827 1,319 285,146
Carrying amount Fair Value
Liabilities at fair value through other
comprehensive income (Note 18)
Liabilities at amortised cost Total Level 2
As of 31 December 2018Non current liabilities:
Bank loans - 342,448 342,448 347,872Debentures loans - 99,181 99,181 99,924Finance Lease creditors - 9 9Shareholders - 3,792 3,792Trade payables - 452 452Other non-current liabilities - 21,234 21,234
- 467,116 467,116Current liabilities:
Current portion of long term bank loans - 44,395 44,395 45,963Finance Lease creditors - 5 5Shareholders - 3,764 3,764Accounts payable to suppliers - 9,839 9,839Other payables - 24,708 24,708
- 82,711 82,711- 549,827 549,827
As of 31 December 2017Non current liabilities:
Bank loans - 198,186 198,186 212,692Derivative financial instruments 203 - 203Shareholders - 3,757 3,757Trade payables - 22 22Other non-current liabilities - 6,193 6,193
203 208,158 208,361Current liabilities:
Current portion of long term bank loans - 71,763 71,763 76,659Short term bank loans - 25,000 25,000Debentures loans - 74,850 74,850 75,148Shareholders - 3,764 3,764Accounts payable to suppliers - 5,868 5,868Other payables - 8,808 8,808
- 190,053 190,053203 398,211 398,414

2018 ConsolidatedReport and Accounts
2.21. Judgments and estimates
In the preparation of the accompanying consolidated financial statements estimates were used which affected the assets and
liabilities and the amounts recognised as income and expenses during the reporting period.
The estimates were calculated using the best information available, at the date of approval of the financial statements, of
the events and transactions in course and of the experience from current and/or past events. However, events may occur
in subsequent periods that were not anticipated as of the date of these statements and, consequently were not included in
those estimates. Changes in the estimates after the closing of the consolidated financial statements will be booked in the
subsequent year, as required in IAS 8.
The principal estimates of the Group relates to fair value, namely the fair value of the investment properties, the goodwill, the
derivatives and deferred tax assets, as follows:
a) Investment properties
The investment properties in operation are recorded at their fair value based on annual appraisals by independent specialised
entities. Those valuations assume several assumptions, including the estimate of future income and expense of each property
and the use of an appropriate discount rate.
The investment properties under development measured at cost, the Group follows the procedure of, on an annual basis,
evaluating their performance through assessments carried out by independent specialized agencies and/or testing carried out
internally, in which the net cash flows expected of those properties are considered.
b) Derivative financial instruments
The derivative financial instruments are usually used by the Group to hedge the cash flow in the form of swaps (“interest rate
swap”) or zero cost collars. The fair value of those derivatives is, at each reporting date, calculated by external entities (usually
the financial institution with which the derivative was contracted). The fair value calculated by them is internally tested in
order to validate the calculation performed by the third parties.
c) Goodwill
The impairment tests on Goodwill are based on the “Net Asset Value” (“NAV”) at the reporting date of the financial investment.
d) Deferred tax assets
The deferred tax assets are recognised only if it is expected that future fiscal profits will be enough to use the deferred tax
assets. At each reporting date, the deferred tax assets are assessed and they are reduced if future recoverability is not
anticipated. This revision is based on projections of the future activity of each company where it is applicable.
e) Other assets and liabilities
Concerning the other assets and liabilities, such as VAT to be reimbursed by tax authorities and the legal and fiscal processes
that are reflected in the financial statements of the companies, the Legal and Fiscal departments are consulted by the Board
to assess the probability of receiving and/or paying such amounts. With that information, the Board will estimate which
adjustments will be made in the financial statements.
The main assumptions used in the Group estimates are disclosed in each related note.

29
2.22. Operating segments
Operating segments are reported in accordance with the information used internally by the management of the Group.
2.23. Subsequent events
Events occurred after the reporting date that provide additional information about conditions that existed at the reporting date
(adjusting events) are reflected in the financial statements. Events occurred after the reporting date that provide information
on conditions that occur after the reporting date (non-adjusting events) are disclosed in the consolidated financial statements,
if materially significant.

2018 ConsolidatedReport and Accounts
3. SUBSIDIARIES
The subsidiaries of the Group, their head offices, and the percentage of interests held by the Group as of 31 December 2018
and 2017, are as follows:
Ownership interests and voting rights held
Company Head office 31.12.18 31.12.17
Parent companySonae Sierra, SGPS, S.A. Maia (Portugal) - -SubsidiariesInvestment
1) ALEXA Holding GmbH Dusseldorf (Germany) - 100.00%1) ALEXA Shopping Centre GmbH Dusseldorf (Germany) - 100.00%
Axnae Spain Holdings, S.L. Madrid (Spain) 100.00% 100.00%Cascaishopping-Centro Comercial, S.A. Maia (Portugal) 57.24% 57.24%Coimbrashopping- Centro Comercial, S.A. Maia (Portugal) 50.10% 50.10%Dos Mares - Shopping Centre B.V. Amsterdam (Netherlands) 50.10% 50.10%Dos Mares-Shopping Centre, S.A. Madrid (Spain) 50.10% 50.10%Gli Orsi Shopping Centre 1 Srl Milan (Italy) 100.00% 100.00%Iberian Holdings Spain, S.L. Madrid (Spain) 100.00% 100.00%Land Retail B.V. Amsterdam (Netherlands) 57.24% 57.24%
2) Luz del Tajo B.V. Amsterdam (Netherlands) - 50.10%5) Parklake Shopping, S.A. Bucharest (Romania) 100.00% -5) Parklake Business Centre Srl Bucharest (Romania) 100.00% -5) Plenerg Srl Bucharest (Romania) 100.00% -
Paracentro - Gestão de Galerias Comerciais, S.A. Maia (Portugal) 100.00% 100.00%Plaza Eboli – Centro Comercial S.A. Madrid (Spain) 100.00% 100.00%Plaza Mayor Parque de Ócio B.V. Amsterdam (Netherlands) 50.10% 50.10%Plaza Mayor Parque de Ocio, S.A. Madrid (Spain) 50.10% 50.10%
3) Plaza Mayor Shopping B.V. Amsterdam (Netherlands) - 50.10%Plaza Mayor Shopping, S.A. Madrid (Spain) 50.10% 50.10%River Plaza B.V. Amsterdam (Netherlands) 100.00% 100.00%
6) River Plaza Mall, Srl Bucharest (Romania) - 100.00%Shopping Centre Parque Principado B.V. Amsterdam (Netherlands) 50.10% 50.10%Sierra Berlin Holding B.V. Amsterdam (Netherlands) 100.00% 100.00%
2) Sierra Core Assets Holdings, B.V. Amsterdam (Netherlands) - 50.10%Sierra European Retail Real Estate Assets Holdings B.V. Amsterdam (Netherlands) 50.10% 50.10%Sierra GP Limited Guernsey 100.00% 100.00%Sierra Investments (Holland) 1 B.V. Amsterdam (Netherlands) 100.00% 100.00%Sierra Investments (Holland) 2 B.V. Amsterdam (Netherlands) 100.00% 100.00%Sierra Investments Holdings B.V. Amsterdam (Netherlands) 100.00% 100.00%Sierra Investments SGPS, S.A. Maia (Portugal) 100.00% 100.00%Sierra Parma Project BV Amsterdam (Netherlands) 100.00% 100.00%Sierra Retail Ventures BV Amsterdam (Netherlands) 50.10% 50.10%Sierra Solingen Holding GmbH Dusseldorf (Germany) 100.00% 100.00%Sierra Spain Malaga Holdings, S.L. Madrid (Spain) 50.10% 50.10%SPF - Sierra Portugal Luxembourg 100.00% 100.00%ServicesSierra Germany GmbH Dusseldorf (Germany) 100.00% 100.00%Sierra Italy Srl Milan (Italy) 100.00% 100.00%Sierra Management, SGPS, S.A. Maia (Portugal) 100.00% 100.00%Sierra Maroc Services SARL Casablanca (Morocco) 100.00% 100.00%Sierra Portugal, S.A. Lisbon (Portugal) 100.00% 100.00%Sierra Romania Shopping Centers Services, SRL Bucharest (Romania) 100.00% 100.00%Sierra Spain, Shopping Centers Services, S.A. Madrid (Spain) 100.00% 100.00%Sierra Services Holland B.V. Amsterdam (Netherlands) 100.00% 100.00%Sierra Turkey Gayrimenkul Yönetim Pazarlama ve Danışmanlık A.Ş. Istanbul (Turkey) 100.00% 100.00%DevelopmentsARP Alverca Retail Park, S.A. Maia (Portugal) 100.00% 100.00%CCCB Caldas da Rainha - Centro Comercial, S.A. Maia (Portugal) 100.00% 100.00%Ioannina Development of Shopping Centres, S.A. Athens (Greece) 100.00% 100.00%Parque de Famalicão - Empreendimentos Imobiliários, S.A. Maia (Portugal) 100.00% 100.00%Project Sierra 2 B.V. Amsterdam (Netherlands) 100.00% 100.00%Project Sierra 10 B.V. Amsterdam (Netherlands) 100.00% 100.00%Project Sierra 11 B.V. Amsterdam (Netherlands) 100.00% 100.00%Project Sierra 12 B.V. Amsterdam (Netherlands) 100.00% 100.00%Project Sierra Four, Srl Bucharest (Romania) 100.00% 100.00%Project Sierra Germany 4 (four) - Shopping Centre, GmbH Dusseldorf (Germany) 100.00% 100.00%Project Sierra Spain 1 B.V. Amsterdam (Netherlands) 100.00% 100.00%Project Sierra Spain 2- Centro Comercial S.A. Madrid (Spain) 100.00% 100.00%Project Sierra Cúcuta B.V. Amsterdam (Netherlands) 100.00% 100.00%Microcom Doi, Srl Bucharest (Romania) 100.00% 100.00%
4) Sierra Greece, S.A. Athens (Greece) - 100.00%Sierra Developments Holding B.V. Amsterdam (Netherlands) 100.00% 100.00%Sierra Developments, SGPS, S.A. Maia (Portugal) 100.00% 100.00%Sierra Maroc, SARL Casablanca (Morocco) 100.00% 100.00%Sierra Project Nürnberg B.V. Amsterdam (Netherlands) 100.00% 100.00%Sierra Real Estate Greece B.V. Amsterdam (Netherlands) 100.00% 100.00%Sierra Zenata Project B.V. Amsterdam (Netherlands) 100.00% 100.00%Weiterstadt Shopping B.V. Amsterdam (Netherlands) 100.00% 100.00%

31
1) Company ALEXA Shopping Centre GmbH merged into ALEXA Holding GmbH with effects since 1 January 2018, being afterwards merged into Sierra Berlin Holding B.V. at 30 September 2018.2) Companies liquidated in 2018. 3) Company merged into Plaza Mayor Parque de Ócio B.V. with effects since 1 January 2018.4) Company merged into Ioannina Development of Shopping Centres, S.A. with effects since 1 January 2018.5) In September 2018, the Group acquired 50% of these Companies (Note 6).6) Company scoped out from consolidation in December 2018, since the Group lost control of the company, due to the agreement made with the financing entity.
These subsidiaries were included in the consolidation by the full consolidation method, as explained in Note 2.2.a)
4. JOINT VENTURES
The joint ventures of the Group, their head offices, and the percentage of interests held by the Group as of 31 December 2018
and 2017, are as follows:
1) In December 2018, the Group sold 37.5% of the share capital of the Company retaining a minority interest of 12.5% (Note 5).2) Company acquired during 2018. 3) In September 2018, the Group acquired 50% of these Companies (Note 3) 4) Company incorporated in 2018. 5) Company merged into Sierra Investimentos Brasil Ltda in April 2018. 6) Company scoped out from consolidation since the Group lost control of the company.
Ownership interests and voting rights held
Company Head office 31.12.18 31.12.17
InvestmentCompanies owned by Sierra BVArrábidashopping- Centro Comercial, S.A. Maia (Portugal) 25.05% 25.05%Centro Colombo- Centro Comercial, S.A. Maia (Portugal) 25.05% 25.05%Centro Vasco da Gama - Centro Comercial, S.A. Maia (Portugal) 25.05% 25.05%DOC Malaga Holdings S.L. Madrid (Spain) 25.05% 25.05%DOC Malaga SITECO, S.L.U. Madrid (Spain) 25.05% 25.05%Gaiashopping I- Centro Comercial, S.A. Maia (Portugal) 25.05% 25.05%Gaiashopping II- Centro Comercial, S.A. Maia (Portugal) 25.05% 25.05%Harvey Dos Iberica, S.L. Madrid (Spain) 25.05% 25.05%
1) Iberian Assets, S.A. Madrid (Spain) - 25.05%2) Jamunder, S.L. Madrid (Spain) 25.05% -
Madeirashopping- Centro Comercial, S.A. Funchal (Portugal) 25.05% 25.05%Norte Shopping Retail and Leisure Centre B.V. Amsterdam (Netherlands) 25.05% 25.05%Norteshopping- Centro Comercial, S.A. Maia (Portugal) 25.05% 25.05%Parque Atlântico Shopping - Centro Comercial, S.A. Ponta Delgada (Portugal) 25.05% 25.05%Shopping Centre Colombo Holding B.V. Amsterdam (Netherlands) 25.05% 25.05%VdG Holding BV Amsterdam (Netherlands) 25.05% 25.05%Via Catarina- Centro Comercial, S.A. Maia (Portugal) 25.05% 25.05%Other investment companies
6) Freccia Rossa- Shopping Centre Srl Milan (Italy) - 50.00%Larissa Development of Shopping Centres, S.A. Athens (Greece) 50.00% 50.00%Pantheon Plaza B.V. Amsterdam (Netherlands) 50.00% 50.00%
3) Parklake Shopping S.A. Bucharest (Romania) - 50.00%3) Plenerg Srl Bucharest (Romania) - 50.00%
Solingen Shopping Centre GmbH Dusseldorf (Germany) 50.00% 50.00%DevelopmentsAegean Park Constructions Real Estate and Development, S.A. Athens (Greece) 50.00% 50.00%Park Avenue Developement of Shopping Centers S.A. Athens (Greece) 50.00% 50.00%Proyecto Cúcuta S.A.S. Santiago de Cali (Colombia) 50.00% 50.00%SC Aegean B.V. Amsterdam (Netherlands) 50.00% 50.00%Sierra Central S.A.S. Santiago de Cali (Colombia) 50.00% 50.00%BrazilFundo Investimento Imobiliário Parque Dom Pedro Shopping Center Rio de Janeiro (Brazil) 20.68% 20.68%Fundo Investimento Imobiliário Shop. Parque Dom Pedro Rio de Janeiro (Brazil) 31.56% 31.56%Parque D. Pedro 1 B.V. Sarl Luxembourg 50.00% 50.00%
4) Parque D. Pedro 2, Sarl Luxembourg 50.00% -Pátio Boavista Shopping, Ltda. São Paulo (Brazil) 33.32% 33.32%
5) Pátio Goiânia Shopping, Ltda. São Paulo (Brazil) - 33.32%Pátio Londrina Empreendimentos e Participações, Ltda. São Paulo (Brazil) 33.32% 33.32%Pátio São Bernardo Shopping Ltda São Paulo (Brazil) 33.32% 33.32%Pátio Sertório Shopping Ltda Manaus (Brazil) 33.32% 33.32%Pátio Uberlândia Shopping Ltda São Paulo (Brazil) 33.32% 33.32%Sierra Brazil 1 B.V. Amsterdam (Netherlands) 50.00% 50.00%Sierra Investimentos Brasil Ltda São Paulo (Brazil) 33.32% 33.32%Sonae Sierra Brasil, S.A. São Paulo (Brazil) 33.32% 33.32%Sonae Sierra Brazil B.V. Sarl Luxembourg 50.00% 50.00%Unishopping Consultoria Imobiliária Lda São Paulo (Brazil) 33.32% 33.32%

2018 ConsolidatedReport and Accounts
The details of joint ventures of the Group as of 31 December 2018 and 2017 is as follows:
31 December 2018
Equity NetProfit
% own(*)
CarryingAmount
Proportionin P/L
Adjustednet profit (**)
Dividendsreceived
Investment
Companies owned by Sierra BV
Arrábidashopping- Centro Comercial, S.A. 60,786 5,454 50.00% 30,393 2,727 2,354 2,073
1) Gaiashopping I- Centro Comercial, S.A. 70,019 5,144 50.00% 35,009 2,572 2,604 2,250
Harvey Dos Iberica, S.L. 8,790 243 50.00% 4,395 121 122 -
10) Iberian Assets, S.A - 14,582 50.00% - 7,291 6,925 -
Madeirashopping- Centro Comercial, S.A. 30,256 (5,844) 50.00% 15,128 (2,922) 1,494 1,047
2) Norte Shopping Retail and Leisure Centre B.V. 322,445 30,457 50.00% 161,223 15,229 7,568 -
Parque Atlântico Shopping - Centro Comercial, S.A. 35,341 3,253 50.00% 17,670 1,626 1,295 3,750
3) Shopping Centre Colombo Holding B.V. 510,729 54,469 50.00% 255,363 27,234 15,057 20,000
4) VdG Holding BV 224,288 31,708 50.00% 112,144 15,854 6,686 8,275
Via Catarina- Centro Comercial, S.A. 17,549 3,404 50.00% 8,775 1,702 752 -
5) DOC Malaga Holdings S.L 7,182 (47) 50.00% 3,591 (24) (24) -
Other investment companies
Freccia Rossa- Shopping Centre Srl - (12,029) 50.00% - (898) 837 -
6) Pantheon Plaza B.V. 20,527 20,031 50.00% 10,264 10,016 (217) -
9) 11) Parklake Shopping Srl - 4,650 50.00% - 2,325 527 -
11) Plenerg SRL - 123 50.00% - 62 62 -
Solingen Shopping Centre GmbH (8,315) (4,364) 50.00% (4,157) (2,182) 554 -
Developments
Park Avenue Development of Shopping Centres S.A. (927) (111) 50.00% (464) (56) (56) -
7) SC Aegean B.V. 9,853 (200) 50.00% 4,926 (100) (100) -
Proyecto Cúcuta S.A.S. 16,689 (692) 50.00% 8,344 (346) (346) -
Goodwill Cúcuta
Pud Srl 10,226 (14) 50.00% 5,113 (7) (7) -
Goodwill Pud 875
Sierra Central S.A.S. 114 (569) 50.00% 57 (285) (285) -
Goodwill Sierra Central (312)
Brazil
8) Sonae Sierra Brazil B.V. Sarl 482,357 (5,179) 50.00% 241,179 (2,589) 17,705 5,680
909,828 77,038 63,505 43,075

33
(*) The ownership interests are identical to voting rights.(**) This adjusted net profit is calculated by deducting to the net profit the variation of the fair value of the investment properties net of the respective deferred taxes.
1) Amounts related to the consolidated accounts of Gaiashopping I- Centro Comercial, S.A. that owns 100% of Gaiashopping II- Centro Comercial, S.A..2) Amounts related to the consolidated accounts of Norte Shopping Retail and Leisure Centre B.V. that owns 100% of Norteshopping- Centro Comercial, S.A..3) Amounts related to the consolidated accounts of Shopping Centre Colombo Holding B.V. that owns 100% of Centro Colombo- Centro Comercial, S.A..4) Amounts related to the consolidated accounts of Sierra VdG Holding B.V. that owns 100% of Centro Vasco da Gama - Centro Comercial, S.A.. 5) Amounts related to the consolidated accounts of DOC Malaga Holdings S.L. that owns 100% of DOC Malaga SITECO, S.L.U and Jamunder, S.L. (company acquired in 2018).6) Amounts related to the consolidated accounts of Pantheon Plaza B.V. that owns 100% of Larissa Development of Shopping Centres, S.A.. 7) Amounts related to the consolidated accounts of SC Aeean BV that owns 100% of Aegean Park Constructions Real Estate and Development, S.A..8) Amounts related to the consolidated accounts of Sonae Sierra Brasil B.V. Sarl. This company owns the following investments:
Percentage of interestsand voting rights held31.12.18 31.12.17
Fundo Investimento Imobiliário Parque Dom Pedro Shopping Center 41.36% 41.36%Fundo Investimento Imobiliário Shop. Parque Dom Pedro 63.12% 63.12%Parque D. Pedro 1 B.V. Sarl 100.00% -
12) Parque D. Pedro 2, Sarl 100.00% 100.00%Pátio Boavista Shopping, Ltda. 66.65% 66.65%
13) Pátio Goiânia Shopping, Ltda. - 66.65%Pátio Londrina Empreendimentos e Participações, Ltda. 66.65% 66.65%Pátio São Bernardo Shopping Ltda 66.65% 66.65%Pátio Sertório Shopping Ltda 66.65% 66.65%Pátio Uberlândia Shopping Ltda 66.65% 66.65%Sierra Brazil 1 B.V. 100.00% 100.00%Sierra Investimentos Brasil Ltda 66.65% 66.65%Sonae Sierra Brasil, S.A. 66.65% 66.65%Unishopping Consultoria Imobiliária Lda 66.63% 66.63%
9) Amounts related to the consolidated accounts of Parklake Shopping Srl that owns 100% of Parklake Business Centre Srl (company incorporated in 2018).10) In December 2018 the Group sold 37.5% of the share capital of the Company retaining a minority interest of 12.5%. 11) In September 2018 the Group acquired 50% of these Companies.12) Company incorporated in 2018. 13) Company merged into Sierra Investimentos Brasil Ltda in April 2018.
31 December 2017
Equity NetProfit
% own(*)
CarryingAmount
Proportionin P/L
Adjustednet profit (**)
Dividendsreceived
Investment
Companies owned by Sierra BV
Arrábidashopping- Centro Comercial, S.A. 59,478 13,925 50.00% 29,739 6,963 2,609 3,500
1) Gaiashopping I- Centro Comercial, S.A. 69,374 16,282 50.00% 34,687 8,141 2,566 3,766
Harvey Dos Iberica, S.L. 8,548 181 50.00% 4,274 90 90 -
Iberian Assets, S.A 272,527 28,479 50.00% 136,264 14,184 7,183 -
Goodwill Iberian 6,471 -
Madeirashopping- Centro Comercial, S.A. 38,193 8,662 50.00% 19,097 4,331 1,287 1,910
2) Norte Shopping Retail and Leisure Centre B.V. 291,988 37,011 50.00% 145,994 18,505 7,318 9,300
Parque Atlântico Shopping - Centro Comercial, S.A. 39,588 6,451 50.00% 19,794 3,226 1,264 1,500
3) Shopping Centre Colombo Holding B.V. 497,991 82,936 50.00% 248,993 41,468 15,757 10,000
4) VdG Holding BV 209,130 27,778 50.00% 104,565 13,889 6,514 5,750
Via Catarina- Centro Comercial, S.A. 14,145 6,040 50.00% 7,073 3,020 612 -
5) DOC Malaga Holdings S.L 7,230 (248) 50.00% 3,615 (124) (124) -
Other investment companies -
Colombo Towers Holding, B.V. - (19) 50.00% - (9) (9) 1,175
Freccia Rossa- Shopping Centre Srl (36,650) (40,269) 50.00% (18,325) (20,134) 1,760 -
6) Pantheon Plaza B.V. 417 (707) 50.00% 208 (354) (354) -
Parklake Shopping S.A. 60,284 (6,595) 50.00% 30,142 (3,297) 922 -
Plenerg Srl 46 85 50.00% 23 42 42 -
Solingen Shopping Centre GmbH (3,951) (2,296) 50.00% (1,975) (1,148) 804 -
Developments -
Park Avenue Development of Shopping Centres S.A. (816) (80) 50.00% (408) (40) (40) -
7) SC Aegean B.V. 9,993 (146) 50.00% 4,996 (73) (73) -
Proyecto Cúcuta S.A.S. 17,975 (954) 50.00% 8,987 (477) (195) -
Goodwill Cúcuta (229) -
Sierra Central S.A.S. 74 (564) 50.00% 37 (282) (282) -
Goodwill Sierra Central (280) -
Brazil -
8) Sonae Sierra Brazil B.V. Sarl 559,375 39,641 50.00% 279,687 19,820 22,383 7,153
1,063,938 107,232 70,032 44,054

2018 ConsolidatedReport and Accounts
As mentioned in Note 2.2.b), joint ventures are measured by using the equity method.
During the years ended 31 December 2018 and 2017, the movement of investments in joint ventures was as follows:
The main acquisitions and sales of companies occurred during the year ended 31 December 2018 were as follows:
Transactions in 2018:
In September 2018, the subsidiaries Project Sierra 10, B.V. (“ProjBV10”) and Project Sierra 11, B.V. (“ProjBV11”), acquired the
remaining share capital of the joint ventures Parklake Shopping S.A. (“Parklake”) (which owns 100% of the share capital of
Parklake Business Centre SRL (“Parklake Business”) and Plenerg SRL (“Plenerg”) for kEuro 39,604. Since 1 October 2018,
these companies are considered as subsidiaries (Note 6).
In December 2018, the subsidiary Iberian Holdings Spain, S.L. sold the entire share capital (50%) of the joint venture Iberian
Assets, S.A.(“Iberian”) for kEuro 164,250 to the associate Trivium Real Estate Socimi, S.A. (“Trivium”). This transaction
generated a net gain of kEuro 13,090 (net of expenses incurred in this transaction of kEuro 1,093) (Note 36). Since this date,
Iberian is considered as associate (Note 5).
2018 2017
Investment
Developments Brazil Total
Investment
Developments Brazil TotalCompanies owned by Sierra BV
Otherinvestment companies
Companies owned by Sierra BV
Otherinvestment companies
Opening balance 760,566 10,073 13,612 279,687 1,063,938 680,790 31,686 12,879 310,662 1,036,017
Iberian Assets:
- sale of 50% (150,068) - - - (150,068) - - - - -
Acquisition of Parma - - - - - - - - - -
- Equity at acquisition date (Note 36) - - 5,742 - 5,742 - - - - -
- Goodwill (Note 36) - - 875 - 875 - - - - -
Parklake and Plenerg - transfer to subsidiaries (Note 6) - (32,552) - - (32,552) - - - - -
"Iberian - percentage change effect (acquisition of non-controlling interests)" - - - - - 72 - - - 72
Scoped-out from consolidation - 7,229 - - 7,229 0 - - - -
Capital decrease - - - - - (1,225) (40) - - (1,265)
Capital increase - 12,034 661 - 12,695 3,190 4,546 3,390 - 11,126
Liquidation effect - - - - - - (45) - - (45)
Effect of the application of the equity method:
Hedging reserve (hedge accounting) (822) - (622) - (1,444) (227) - - - (227)
Translation reserve - - (311) (30,239) (30,550) 0 - (1,276) (43,642) (44,918)
Net profit (Note 37) 71,410 9,323 (1,106) (2,589) 77,038 113,693 (24,900) (1,381) 19,820 107,232
Dividends (37,395) - - (5,680) (43,075) (35,726) (1,175) - (7,153) (44,054)
643,691 6,107 18,851 241,179 909,828 760,566 10,073 13,612 279,687 1,063,938
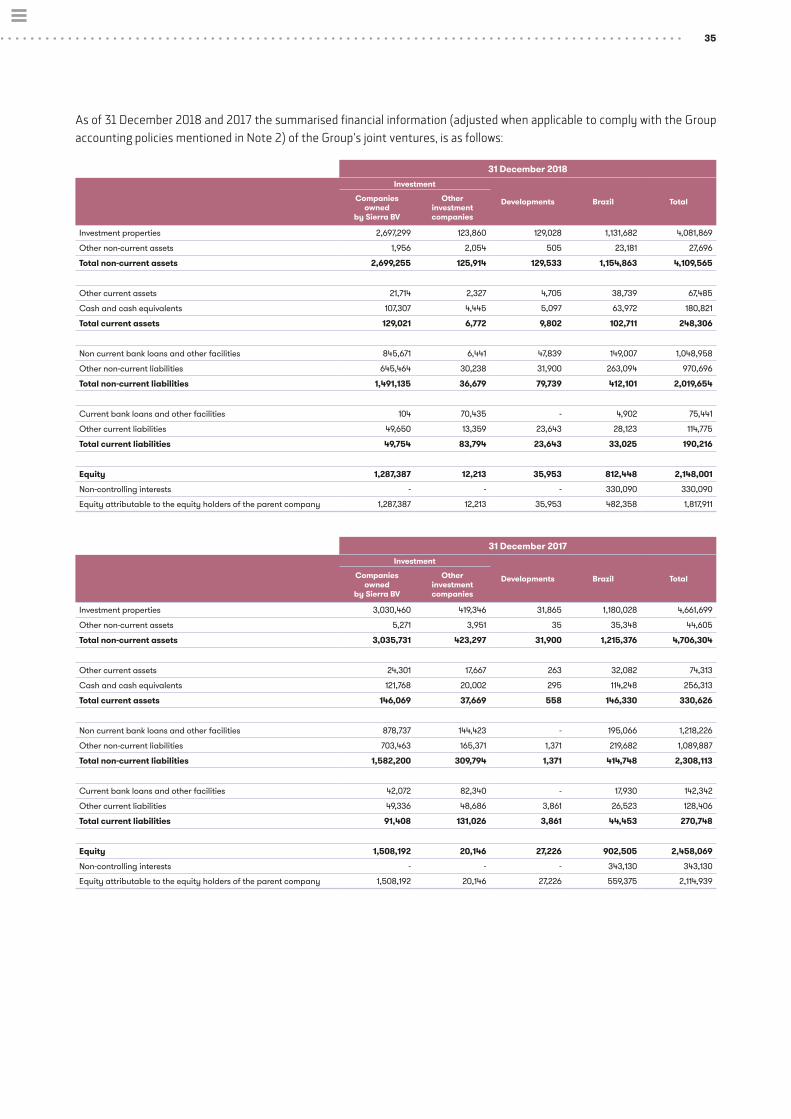
35
As of 31 December 2018 and 2017 the summarised financial information (adjusted when applicable to comply with the Group
accounting policies mentioned in Note 2) of the Group’s joint ventures, is as follows:
31 December 2018Investment
Developments Brazil TotalCompaniesowned
by Sierra BV
Otherinvestmentcompanies
Investment properties 2,697,299 123,860 129,028 1,131,682 4,081,869
Other non-current assets 1,956 2,054 505 23,181 27,696
Total non-current assets 2,699,255 125,914 129,533 1,154,863 4,109,565
Other current assets 21,714 2,327 4,705 38,739 67,485
Cash and cash equivalents 107,307 4,445 5,097 63,972 180,821
Total current assets 129,021 6,772 9,802 102,711 248,306
Non current bank loans and other facilities 845,671 6,441 47,839 149,007 1,048,958
Other non-current liabilities 645,464 30,238 31,900 263,094 970,696
Total non-current liabilities 1,491,135 36,679 79,739 412,101 2,019,654
Current bank loans and other facilities 104 70,435 - 4,902 75,441
Other current liabilities 49,650 13,359 23,643 28,123 114,775
Total current liabilities 49,754 83,794 23,643 33,025 190,216
Equity 1,287,387 12,213 35,953 812,448 2,148,001
Non-controlling interests - - - 330,090 330,090
Equity attributable to the equity holders of the parent company 1,287,387 12,213 35,953 482,358 1,817,911
31 December 2017Investment
Developments Brazil TotalCompaniesowned
by Sierra BV
Otherinvestmentcompanies
Investment properties 3,030,460 419,346 31,865 1,180,028 4,661,699
Other non-current assets 5,271 3,951 35 35,348 44,605
Total non-current assets 3,035,731 423,297 31,900 1,215,376 4,706,304
Other current assets 24,301 17,667 263 32,082 74,313
Cash and cash equivalents 121,768 20,002 295 114,248 256,313
Total current assets 146,069 37,669 558 146,330 330,626
Non current bank loans and other facilities 878,737 144,423 - 195,066 1,218,226
Other non-current liabilities 703,463 165,371 1,371 219,682 1,089,887
Total non-current liabilities 1,582,200 309,794 1,371 414,748 2,308,113
Current bank loans and other facilities 42,072 82,340 - 17,930 142,342
Other current liabilities 49,336 48,686 3,861 26,523 128,406
Total current liabilities 91,408 131,026 3,861 44,453 270,748
Equity 1,508,192 20,146 27,226 902,505 2,458,069
Non-controlling interests - - - 343,130 343,130
Equity attributable to the equity holders of the parent company 1,508,192 20,146 27,226 559,375 2,114,939

2018 ConsolidatedReport and Accounts
2018Investment
Developments Brazil TotalCompaniesowned
by Sierra BV
Otherinvestmentcompanies
Services rendered 220,831 34,253 30 98,184 353,298
Variation in fair value of the investment properties 77,100 4,891 - 67,573 149,564
Other revenue 1,606 1,099 (27) 525 3,202
External supplies and services (79,401) (17,766) (267) (20,103) (117,537)
Depreciation and amortisation (15) (15) (12) (452) (494)
Other expenses (4,295) (5,645) (511) (18,923) (29,373)
Interest income and similar 1,134 128 9 5,367 6,639
Interest expense and similar (25,736) (8,398) (795) (17,163) (52,091)
Share of results of associates - - - 1,552 1,552
Income tax (48,402) (137) (12) (87,877) (136,429)
Net profit / (loss) 142,821 8,411 (1,586) 28,684 178,330
Attributable to:
Equity holders of parent company 142,821 8,411 (1,586) (5,179) 144,468
Non-controlling interests - - - 33,863 33,863
142,821 8,411 (1,586) 28,684 178,330
Other comprehensive income for the period (1,646) - (6) (111,411) (113,063)
Total comprehensive income for the period 141,175 8,411 (1,591) (82,727) 65,267
Attributable to:
Equity holders of parent company 141,175 8,411 (1,591) (65,658) 82,336
Non-controlling interests - - - (17,069) (17,069)
141,175 8,411 (1,591) (82,727) 65,267
2017Investment
Developments Brazil TotalCompaniesowned
by Sierra BV
Otherinvestmentcompanies
Services rendered 198,861 40,897 - 110,548 350,306
Variation in fair value of the investment properties 190,628 (55,833) - 37,220 172,015
Other revenue 1,976 1,736 181 471 4,364
External supplies and services (62,349) (19,107) (293) (23,517) (105,266)
Depreciation and amortisation (15) (3) (13) (639) (670)
Other expenses (2,725) (6,206) (589) (22,210) (31,730)
Interest income and similar 603 51 14 9,813 10,481
Interest expense and similar (21,916) (10,716) (150) (26,183) (58,965)
Share of results of associates - - - 1,510 1,510
Income tax (77,566) (620) (894) (19,637) (98,717)
Net profit / (loss) 227,497 (49,801) (1,744) 67,376 243,328
Attributable to:
Equity holders of parent company 227,497 (49,801) (1,744) 39,641 215,593
Non-controlling interests - - - 27,735 27,735
227,497 (49,801) (1,744) 67,376 243,328
Other comprehensive income for the period (453) (71) (12) (140,845) (141,381)
Total comprehensive income for the period 227,044 (49,872) (1,756) (73,469) 101,947
Attributable to:
Equity holders of parent company 227,044 (49,872) (1,756) (47,645) 127,771
Non-controlling interests - - - (25,824) (25,824)
227,044 (49,872) (1,756) (73,469) 101,947

37
5. ASSOCIATES
The details of associates of the Group as of 31 December 2018 and 2017 is as follows:
31 December 2018
Headoffice Equity Net profit
/ (loss)% own
(*)Carrying
amountProportion
in P/LAdjusted
net profit(**)
Dividendsreceived
Investment
1) 3shoppings - Holding, SGPS, S.A. Maia (Portugal) 58,652 16,336 20.00% 11,730 3,267 888
ALEXA Asset GmbH & Co, KG Dusseldorf (Germany) 428,998 41,410 9.00% 38,610 3,727 1,498 1,199
Goodwill Alexa 519
Area Sur Shopping, S.L. Madrid (Spain) 51,035 2,344 15.00% 7,655 352 393 11
Le Terrazze - Shopping Centre 1 Srl Milan (Italy) 76,925 6,780 10.00% 7,693 678 588 1,911
Goodwill Le Terrazze 544
Loop5 Shopping Centre GmbH & Co KG Dusseldorf (Germany) 115,820 (16,335) 9.00% 10,424 (1,470) 925 180
2) Iberia Shop.C. Venture Coöperatief U.A. ("Iberia Coop") Amsterdam (Netherlands) 229,658 10,220 10.00% 22,966 1,021 1,409 -
Goodwill Iberia Coop 403
3) Sierra Portugal Real Estate ("SPF") Luxembourg 185,129 23,442 22.50% 41,656 5,276 (3,361) 6,185
Goodwill SPF 3,852
4) Olimpo Real Estate SOCIMI, S.A. Madrid (Spain) 207,161 16,122 3.75% 7,769 605 411 130
Serra Shopping- Centro Comercial, S.A. Lisbon (Portugal) 20,265 3,805 5.00% 1,013 190 58 -
Goodwill Serra Shopping (6)
5) Trivium Real Estate Socimi, S.A. Madrid (Spain) 255,168 14,273 12.50% 31,896 (39) (39) -
Sonaegest - Soc. Gestora de Fundos de Investimento, S.A. Maia (Portugal) 1,396 176 20.00% 278 35 35 34
Services
Sierra Cevital Shopping Center, Spa Algeria 78 - 49.00% 38 - - -
Developments
Zenata Commercial Project Morocco 17,883 (475) 11.00% 1,967 (52) (52) -
189,013 13,584 2,755 9,650
31 December 2017
Headoffice Equity Net profit
/ (loss)% own
(*)Carrying
amountProportion
in P/LAdjusted
net profit(**)
Dividendsreceived
Investment
1) 3shoppings - Holding, SGPS, S.A. Maia (Portugal) 42,316 - 20.00% 8,463 - -
ALEXA Asset GmbH & Co, KG Dusseldorf (Germany) 453,550 34,591 9.00% 40,820 3,113 1,618 1,320
Goodwill Alexa 519
Area Sur Shopping, S.L. Madrid (Spain) 51,457 589 15.00% 7,718 88 208
Le Terrazze - Shopping Centre 1 Srl Milan (Italy) 89,258 10,489 10.00% 8,926 1,049 509 98
Goodwill Le Terrazze 544
Loop5 Shopping Centre GmbH & Co KG Dusseldorf (Germany) 134,155 (10,968) 9.00% 12,074 (987) 712 900
2) Iberia Shop.C. Venture Coöperatief U.A. ("Iberia Coop") Amsterdam (Netherlands) 232,818 25,627 10.00% 23,283 2,563 1,276 -
Goodwill Iberia Coop 403
3) Sierra Portugal Real Estate ("SPF") Luxembourg 190,144 34,470 22.50% 42,783 7,756 3,536 3,375
Goodwill SPF 3,852
Olimpo Real Estate SOCIMI, S.A. ("ORES") Madrid (Spain) 195,956 1,212 3.75% 7,348 45 79 -
Sonaegest - Soc. Gestora de Fundos de Investimento, S.A. Maia (Portugal) 1,389 187 20.00% 277 37 37 56
Services
Sierra Cevital Shopping Center, Spa Algeria 76 48 49.00% 37 23 23
Expansion
Zenata Commercial Project Morocco 17,996 201 11.00% 1,980 22 22
159,027 13,709 8,019 5,749
(*) The ownership interests are identical to voting rights.(**) This adjusted net profit is calculated by deducting to the net profit the variation of the fair value of the investment properties net of the respective deferred taxes.
1) Amounts related to the consolidated accounts of 3shoppings-Holding, SGPS, S.A. that owns 100% of Guimarãeshopping-Centro Comercial, S.A. and Maiashopping-Centro Comercial, S.A..2) Amounts related to the consolidated accounts of "Iberia Coop". This company owns the following investments:
Percentage of interestsand voting rights held
Head office 31.12.18 31.12.17Albufeira RP (Luxembourg) 1, Sarl Luxembourg 100% 100%Albufeira RP (Luxembourg) 2, Sarl Luxembourg 100% 100%ALBRP Albufeira Retail Park, Lda Maia (Portugal) 100% 100%Algarveshopping- Centro Comercial, SA Maia (Portugal) 100% 100%Candotal Spain S.L.U Madrid (Spain) 100% 100%Estação Viana Centro Comercial, SA Viana do Castelo (Portugal) 100% 100%Imoconti - Sociedade Imobiliária, SA Maia (Portugal) 100% 100%Luz del Tajo Centro Comercial, SA Madrid (Spain) 100% 100%Project Guia, S.A. Maia (Portugal) 100% 100%Project Sierra 8 BV Amsterdam (Netherlands) 100% 100%

2018 ConsolidatedReport and Accounts
As mentioned in Note 2.2.b), associates are measured by using the equity method.
During the years ended 31 December 2018 and 2017, the movement of investments in associates was as follows:
3) Amounts related to the consolidated accounts of "SPF". This company owns the following investments:
Percentage of interestsand voting rights held
Head office 31.12.18 31.12.178ª Avenida Centro Comercial, S..A. Maia (Portugal) 100% 100%ALBCC Albufeirashopping C.Comercial S.A. Maia (Portugal) 100% 100%Arrábidashopping- Centro Comercial, S.A. Maia (Portugal) 50% 50%Gaiashopping I- Centro Comercial, S.A. Maia (Portugal) 50% 50%Gaiashopping II- Centro Comercial, S.A. Maia (Portugal) 50% 50%LCC LeiriaShopping Centro Comercial S.A. Maia (Portugal) 100% 100%Loureshopping- Centro Comercial, S.A. Maia (Portugal) 50% 50%PORTCC - Portimaoshopping C.Comercial S.A. Maia (Portugal) 100% 100%Rio Sul- Centro Comercial, S.A. Lisbon (Portugal) 50% 50%Serra Shopping- Centro Comercial, S.A. Lisbon (Portugal) - 50%
4) Amounts related to the consolidated accounts of "ORES". This company owns the following investments:
Percentage of interestsand voting rights held
Head office 31.12.18 31.12.17Olimpo Asset 1, S.A. Maia (Portugal) 100% 100%Olimpo Asset 2, S.A. Maia (Portugal) 100% 100%
6) Olimpo Asset 3, S.A. Maia (Portugal) 100% 100%7) Olimpo Asset 4, S.A. Maia (Portugal) 100% 100%8) Olimpo Asset 5, S.A. Maia (Portugal) 100% -8) Olimpo Asset 6, S.A. Maia (Portugal) 100% -8) Olimpo Asset 7, S.A. Maia (Portugal) 100% -8) Olimpo Asset 8, S.A. Maia (Portugal) 100% -
5) Amounts related to the consolidated accounts of Trivium Real Estate Socimi, S.A. that owns 100% of Iberian Assets, S.A..6) Ex - Portitail - Investimentos Imobiliários, SA7) Ex - Haciarriba – Projetos, Negócios e Promoções, S.A.8) Companies acquired in 2018.
2018
3shoppingsAlexaAsset
ÁreaSur
LeTerrazze
Loop 5Iberia Coop
SPF ORESSerra
ShoppingTrivium Sonaegest
Sierra Cevital
Zenata Total
Opening balance 8,463 41,339 7,718 9,470 12,074 23,686 46,635 7,348 - - 277 37 1,980 159,027
Serra Shopping - acquisition of 5% - - - - - - 654 - - - - 654 Trivium (consolidated) - acquisition of 12.5% (Note 4)
- - - - - - - 31,935 - - - 31,935
Capital decrease - - (375) - - (1,338) (218) (54) - - - - (1,985)
Capital increase - - - - 175 - - 41 216 Deferred taxes - transfer from Alexa Holding to Alexa KG
- (4,738) - - - - - (4,738)
Effect of the application of the equity method:
Hedging reserve (hedge accounting) - - (29) - - - - - - - - (29)
Translation reserve - - - - - - - - - - 1 (2) (1)
Net profit (Note 37) 3,267 3,727 352 678 (1,470) 1,021 5,276 605 184 (39) 35 - (52) 13,584
Dividends - (1,199) (11) (1,911) (180) - (6,185) (130) - - (34) - - (9,650)
11,730 39,129 7,655 8,237 10,424 23,369 45,508 7,769 1,013 31,896 278 38 1,967 189,013
2017
3shoppingsAlexaAsset
ÁreaSur
LeTerrazze
Loop 5Iberia Coop
SPF ORES SonaegestSierra
CevitalZenata Total
Opening balance - 39,546 - 8,519 13,961 21,679 42,250 7,303 296 19 (62) 133,511
Iberia Coop - acquisition: -
- Equity held - - - - - 337 - - - - 337 3shoppings (consolidated) - transfer from subsidiaries (Note 3)
8,463 - - - - - - - - - 8,463
Capital decrease - - - - - (893) - - - - (893)
Capital increase - - 7,648 - - - 2,017 9,665 Effect of the application of the equity method:
-
Hedging reserve (hedge accounting) - - (18) - - 4 - - - - (14)
Translation reserve - - - - - - - - - (5) 3 (2)
Net profit (Note 37) - 3,113 88 1,049 (987) 2,563 7,756 45 37 23 22 13,709
Dividends - (1,320) - (98) (900) - (3,375) - (56) - - (5,749)
8,463 41,339 7,718 9,470 12,074 23,686 46,635 7,348 277 37 1,980 159,027

39
The main acquisitions and sales of companies occurred during 2018 and 2017 were as follows:
Transactions in 2018
In January 2018 the Group, through its associate Sierra Portugal Real Estate (SPFRE), sold 50% of the associate Serra
Shopping- Centro Comercial, S.A. (“Serra Shopping”) for kEuro 6,544 and on the same date the Group, through its subsidiary
Sierra Investments Holding, B.V., acquired 5% of the associate Serra Shopping (2.5% from SPFRE and 2.5% from Paneuropeia
- SGPS Unipessoal Lda) for kEuro 654.
In January 2018 the Group, through its associate ORES, acquired 100% of the share capital of the companies Olimpo Asset 5,
S.A., Olimpo Asset 6, S.A., Olimpo Asset 7, S.A. and Olimpo Asset 8, S.A. for kEuro 1,310.
In November 2018, the Group acquired 12.5% of the associate Trivium for Euro 450; and in December 2018 Trivium acquired
100% of Iberian for kEuro 328,500 (Note 4).
Transactions in 2017
In February 2017 the Group, through its associate Iberia Coop, acquired 100% of the share capital of ALBRP Albufeira Retail
Park Lda for kEuro 4,887. This acquisition generated a “goodwill” of kEuro 1,371.
In May 2017 the Group, through its associate ORES, acquired 100% of the share capital of Olimpo Asset 3, S.A. (Ex - Portitail-
Investimentos Imobiliáriios, S.A.) for kEuro 6,505.
In June 2017 the Group, through its subsidiary AXNAE-Spain Holdings, S.L., acquired 15% of the share capital of Area Sur
Shopping, S.L. for kEuro 450.
In August 2017 the Group, through its associate ORES, acquired 100% of the share capital of Olimpo Asset 2, S.A. for kEuro
5,939.
In October 2017 the Group, through its associate ORES, acquired 100% of the share capital of Olimpo Asset 4, S.A. (Ex -
Haciarriba – Projectos, Negócios e Promoções, S.A.) for kEuro 10,110.
In December 2017 the Group sold 80% of the shares of 3shoppings - Holding, SGPS, S.A. (“3shoppings”), which owns 100% of
Guimarãeshopping- Centro Comercial, S.A. (“Guimarãeshopping”) and Maiashopping- Centro Comercial, S.A. (“Maiahopping”).
After this date, these companies are measured using the equity method.
As of 31 December 2018 and 2017 the summarised financial information (adjusted when applicable to comply with the Group
accounting policies mentioned in Note 2) of the Group’s associates, is as follows:
2018
3shoppings AlexaAsset
ÁreaSur
LeTerrazze Loop 5 Iberia
Coop SPF ORES SerraShopping Trivium Sonaegest Sierra
Cevital Zenata
Total non-current assets 104,610 443,000 115,664 140,361 231,420 377,269 256,772 362,542 32,512 531,877 20 15 42,099
Total current assets 5,380 18,860 4,313 10,671 18,974 13,025 8,892 15,776 2,284 16,660 1,711 436 8,219
Total non-current liabilities 15,780 27,734 67,175 72,344 123,858 151,941 56,828 165,617 12,905 283,094 44 - 28,120
Total current liabilities 35,558 5,128 1,767 1,763 10,716 8,695 23,707 5,540 1,626 10,275 291 373 4,315
Equity 58,652 428,998 51,035 76,925 115,820 229,658 185,129 207,161 20,265 255,168 1,396 78 17,883
2017
3shoppings AlexaAsset
ÁreaSur
LeTerrazze Loop 5 Iberia
Coop SPF ORES Sonaegest Sierra Cevital Zenata
Total non-current assets 88,509 433,826 115,951 136,541 261,704 379,038 246,509 176,850 24 15 17,866
Total current assets 3,347 27,841 4,192 25,506 11,302 12,772 24,018 24,050 1,703 428 8,897
Total non-current liabilities 11,760 - 66,574 70,743 127,189 151,904 74,177 2,443 - - 5,066
Total current liabilities 37,780 8,117 2,112 2,046 11,662 7,088 6,206 2,501 338 367 3,701
Equity 42,316 453,550 51,457 89,258 134,155 232,818 190,144 195,956 1,389 76 17,996

2018 ConsolidatedReport and Accounts
2018
3shoppings AlexaAsset
ÁreaSur
LeTerrazze Loop 5 Iberia
Coop SPF ORES Serra Shopping Trivium Sonaegest Sierra
Cevital Zenata
Services Rendered 12,083 29,216 9,288 11,110 20,224 34,783 12,365 18,560 3,941 35,342 990 - 3,314
Variation in fair value of the investment properties 15,796 (142) 218 2,520 (29,948) (3,597) 15,261 7,199 3,568 2,798 - - -
Other revenue 20 520 18 80 - 103 15 37 9 205 - - -
External supplies and services (6,223) (11,997) (4,248) (3,246) (6,851) (13,602) (3,004) (4,155) (2,021) (14,020) (106) - (164)
Depreciation (8) - - - - (1) - - (2) - (2) - (2,261)
Other expenses (140) (1,090) (293) (706) (751) (644) (284) (397) (91) (2,270) (646) - (339)
Financial Results (496) (3) (1,854) (2,438) (2,340) (3,397) (1,182) (3,049) (436) (2,861) - - (553)
Share of results of associates - - - - - - 5,467 - - - - - -
Income Tax (4,696) 24,906 (785) (540) 3,331 (3,425) (5,196) (2,073) (1,163) (4,921) (60) - (472)
Net profit / (loss) 16,336 41,410 2,344 6,780 (16,335) 10,220 23,442 16,122 3,805 14,273 176 - (475)
Other comprehensive income for the period - - (196) - - - - - - - - 1 (13)
Total comprehensive income for the period 16,336 41,410 2,148 6,780 (16,335) 10,220 23,442 16,122 3,805 14,273 176 1 (488)
2017
3shoppings AlexaAsset
ÁreaSur
LeTerrazze Loop 5 Iberia
Coop SPF ORES Sonaegest Sierra Cevital Zenata
Services Rendered 11,174 29,161 5,041 10,720 22,073 34,359 15,097 4,338 1,008 44 2,692
Variation in fair value of the investment properties (5,248) 16,614 (669) 5,823 (21,002) 18,573 14,546 (1,520) - - -
Other revenue 3 - - 526 - 109 1,849 48 - 173 2
External supplies and services (5,748) (10,899) (2,290) (3,016) (11,275) (14,035) (4,107) (2,076) (85) (26) (109)
Depreciation (6) - - - - (3) - - (1) (9) (1,479)
Other expenses 110 (285) (246) (550) (548) (940) (2,480) (111) (677) (132) (18)
Financial Results (469) - (1,054) (2,432) (2,341) (3,365) (2,057) 4 - (2) (885)
Share of results of associates - - - - - - 15,973 - - - -
Income Tax 184 - (193) (582) 2,125 (9,071) (4,351) 529 (58) - (2)
Net profit / (loss) (219) 34,591 589 10,489 (10,968) 25,627 34,470 1,212 187 48 201
Other comprehensive income for the period - - (122) - - - 18 - - (10) 23
Total comprehensive income for the period (219) 34,591 467 10,489 (10,968) 25,627 34,488 1,212 187 38 224

41
6. ACQUISITION AND SALE OF COMPANIES
The main sales and acquisitions of companies occurring during the year 2018 and 2017 were as follows:
Acquisitions of subsidiaries in 2018
In September 2018 the Group acquired 50% of the shares of Parklake (that owns 100% of Parklake Business) for kEuro 39,604.
This transaction generated a goodwill of kEuro 7,137 (Note 10).
On the same date, the Group also acquired 50% of the shares of Plenerg for Euro 21. This transaction generated a gain
of kEuro 85.
Subsidiaries scoped-out from consolidation in 2018
In December 2018 the subsidiary River Plaza Mall, Srl (“River Plaza”) was scoped-out from consolidation, since the Group lost
control of the company, due to the agreement made with the financing entity. This operation generated a gain of kEuro 646
(Note 36).
Sales of subsidiaries in 2017
In December 2017 the Group sold 80% of the shares of 3shoppings - Holding, SGPS, S.A. (“3shoppings”), which owns 100% of
Guimarãeshopping- Centro Comercial, S.A. (“Guimarãeshopping”) and Maiashopping- Centro Comercial, S.A. (“Maiahopping”)
for kEuro 42,674. This transaction generated a net gain of kEuro 8,821 (Note 36). After this date these companies are
measured using the equity method.
Effect of the acquisitions and sales
The effect of the acquisition of the companies during the period ended in 31 December 2018 was as follows:
2018
Acquisitions
Parklake and Parklake Business Plenerg Total
Cash and cash equivalents (I) 1,646 29 1,675
Investment properties (Note 7) 239,583 - 239,583
Investment properties under development (Note 7) 4,210 - 4,210
Property, plant and equipment 7 4 11
Deferred tax assets (Note 23) 157 - 157
Other non current assets 97 146 243
Trade receivables 2,081 202 2,283
Other current assets 3,089 345 3,434
Bank loans - non current (62,859) - (62,859)
Accounts payable and other liabilities - non-current (1,588) (97) (1,685)
Deferred tax liabilities (Note 23) (11,095) - (11,095)
Bank loans - current (5,434) - (5,434)
Shareholder loans - current (93,132) (199) (93,331)
Accounts payable and other liabilities - current (11,828) (260) (12,088)
Identifiable assets and liabilities at acquisition date 64,934 170 65,104
Carrying amount of the previous investment at acquisition date (Note 4) (32,467) (85) (32,552)
Goodwill:
Recorded as asset (Note 10) 7,137 - 7,137
Recorded as income - (85) (85)
Purchase amount (II) 39,604 - 39,604
Net cash flow (II-I) 37,958 (29) 37,929

2018 ConsolidatedReport and Accounts
The effect of the companies scoped-out from consolidation during the period ended in 31 December 2018 was as follows:
The effect of the sales of the companies during the period ended in 31 December 2017 was as follows:
2018
Scoped-out from consolidation
River Plaza
Cash and cash equivalents (I) 595
Investment properties (Note 8) 16,234
Goodwill (Note 10) 1,334
Deferred tax assets (Note 23) 46
Trade receivables 215
Other current assets 152
Deferred tax liabilities (Note 23) (1,223)
Accounts payable and other liabilities - non-current -
Other non current liabilities (262)
Accounts payable and other liabilities - current (17,737)
Identifiable assets and liabilities at sales date (646)
Transaction Result:
- Profit / (loss) on sale (Note 36) 646
Sale amount (II) -
Net cash flow (II-I) (595)
2017
Sales
3shoppings (consolidated)
Cash and cash equivalents (I) 2,135
Investment properties (Note 8) 88,500
Deferred tax assets (Note 23) 4
Trade receivables 456
Other current assets 756
Deferred tax liabilities (Note 23) (11,329)
Accounts payable and other liabilities - non-current (10)
Other non current liabilities (420)
Accounts payable and other liabilities - current (37,780)
Identifiable assets and liabilities at sales date 42,312
Transaction Result:
- Profit / (loss) on sale (Note 36) 8,821
Sale amount (II) 51,133
Net cash flow (II-I) 48,998

43
7. NON-CONTROLLING INTERESTS
As of 31 December 2018 and 2017, the details are as follows:
During the years ended 31 December 2018 and 2017 the movement in non-controlling interests was as follows:
31 December 2018
Head office Equity Net profit/ (loss) % (*) Carrying
amountProportion
in P/L
Investment
Sierra BV Amsterdam (Netherlands) 1,110,666 105,419 49.90% 554,228 52,604
Land Retail BV Amsterdam (Netherlands) 217,823 34,745 17.81% 38,795 6,221
1) Sierra Core Assets Holdings BV Amsterdam (Netherlands) - 48 49.90% - 24
593,023 58,849
31 December 2017
Head office Equity Net profit/ (loss) % (*) Carrying
amountProportion
in P/L
Investment
Sierra BV Amsterdam (Netherlands) 1,094,071 163,373 49.90% 545,947 81,524
Land Retail BV Amsterdam (Netherlands) 182,948 36,569 17.81% 32,583 6,513
Sierra Core Assets Holdings BV Amsterdam (Netherlands) (48) (20) 49.90% (24) (10)
578,506 88,027
1) Company liquidated in 2018.
(*) The ownership interests are identical to voting rights.
2018 2017
Sierra BV Land Retail BVSierra Core
Assets Holdings BV
Total Sierra BV Land Retail BVSierra Core
Assets Holdings BV
Total
Opening balance 545,947 32,583 (24) 578,506 480,292 28,207 (14) 508,485
Effect acquisition minority interests in Iberian Assets - - - - 35 - - 35
Other effects - (9) - (9) - - -
Capital decrease - - - - (3,406) (2,137) - (5,543)
Hedging reserve (hedge accounting) (411) - - (411) (23) - - (23)
Net profit 52,604 6,221 24 58,849 81,524 6,513 (10) 88,027
Dividends (43,912) - - (43,912) (12,475) - - (12,475)
554,228 38,795 - 593,023 545,947 32,583 (24) 578,506

2018 ConsolidatedReport and Accounts
As of 31 December 2018 and 2017 the summarised financial information of the subsidiaries within non-controlling interests,
before the elimination of intragroup balances and transactions, is as follows:
31 December 2018 31 December 2017
Sierra BV Land Retail BV Sierra BV Land Retail BVSierra Core Assets
Holdings BV
Total non-current assets 989,468 439,923 1,108,858 409,019 -
Total current assets 226,345 15,110 90,773 8,274 28
Total non-current liabilities 51,942 226,952 63,039 221,995 75
Total current liabilities 53,205 10,258 42,521 12,350 1
Equity 1,110,666 217,823 1,094,071 182,948 (48)
2018 2017
Sierra BV Land Retail BVSierra Core Assets
Holdings BVSierra BV Land Retail BV
Sierra Core Assets Holdings BV
Variation in fair value of the investment properties (5,838) 31,717 - 27,597 34,123 -
Services rendered and other revenue 34,801 29,753 57 42,686 28,306 -
Other revenue/(expenses) 76,456 (26,725) (9) 93,090 (25,860) (9)
Net profit / (loss) 105,419 34,745 48 163,373 36,569 (20)
Other comprehensive income for the period (823) - - (47) - -
Total comprehensive income for the period 104,596 34,745 48 163,326 36,569 (20)

45
8. INVESTMENT PROPERTIES
The movement in investment properties, during the years ended 31 December 2018 and 2017 was as follows:
Increase in investment properties under development at cost, in the amount of kEuro 4,375 (31 December 2017: kEuro 1,802)
relates mainly to a project in Nürnberg, which was sold in December 2018.
Sales of Investment Properties in operation and under development at cost in the amounts of kEuro 15,370 and kEuro 31,833,
respectively, relates to Coimbrashopping and Nürnberg project respectively. These sales generated a gain of kEuro 28,169
(Note 32).
At 31 December 2018 and 2017 investment properties in operation and the information about the fair value assessment are
as follows:
2018
Investment properties
in operation "Fit Out" Underdevelopment at cost Advances Total
Opening balance 738,936 1,488 39,730 1,725 781,879
Increases 9,369 - 4,375 - 13,744
Impairments and write-off (Note 33) - - (2,540) - (2,540)
Sales (15,370) - (31,833) - (47,203)
Fit-out receivables - (1,782) - - (1,782)
Variation in fair value of the investment properties
between years (Note 31):
- Gains 38,277 304 - - 38,581
- Losses (11,716) (10) - - (11,726)
Increases through business combination (Note 6) 239,583 - 4,210 - 243,793
Scoped-out from consolidation (Note 6) (16,234) - - - (16,234)
Closing balance 982,845 - 13,942 1,725 998,512
2017
Investment properties
in operation "Fit Out" Underdevelopment at cost Advances Total
Opening balance 762,805 1,582 39,621 1,725 805,733
Increases 3,784 188 1,802 - 5,774
Reversal of impairments - - 20 - 20
Impairments and write-off (Note 33) - - (1,676) - (1,676)
Fit-out receivables - (266) - - (266)
Transfers - - (37) - (37)
Variation in fair value of the investment properties
between years (Note 31):
- Gains 68,561 40 - - 68,601
- Losses (7,727) (43) - - (7,770)
Sales of companies (Note 6) (88,487) (13) - - (88,500)
Closing balance 738,936 1,488 39,730 1,725 781,879
31.12.2018 31.12.2017
Portugal / Spain Other European Countries Portugal / Spain Other European Countries
10 yr discount rateFloor 6.95% 8.65% 7.25% 8.50%Weighted average 7.28% 8.69% 6.49% 8.85%Cap 8.10% 8.70% 10.75% 10.55%
10 yr cap rateFloor 5.20% 6.75% 5.50% 6.75%Weighted average 5.46% 6.86% 4.89% 7.09%Cap 6.10% 6.90% 9.00% 8.75%
Annual rent per sqm (€)Floor 17 15 15 14Weighted average 31 18 25 17Cap 54 21 52 21
Fair Value (Level 3) 645,050 337,795 627,280 111,656

2018 ConsolidatedReport and Accounts
The fair value of each investment property was determined by means of a valuation as of the reporting date made by
independent specialised entities (Cushman & Wakefield and Jones Lang LaSalle).
The valuation of these investment properties was made in accordance with the Practice Statements of the RICS Appraisal and
Valuation Manual published by The Royal Institution of Chartered Surveyors (“Red Book”), located in England.
The methodology used to compute the market value of the investment properties consists in preparing 10 years’ projections
of income and expenses of each shopping centre added to the residual value, corresponding to a projected net income at year
11 and a return market rate (“Exit yield" or "cap rate"). These projections are then discounted to the valuation date using a
discount market rate. Projections are intended to reflect the actual best estimate of the valuer regarding future revenues and
costs of each shopping centre. Both the return rate and discount rate are defined in accordance to the local real estate and
institutional market conditions, being the reasonableness of the market value obtained in accordance to the methodology
referred above, tested also in terms of initial return using the estimated net income for the first year of projections.
In the valuation of investment properties, some assumptions, that in accordance with the Red Book are considered to be
special, were in addition considered, namely in the case of recently inaugurated shopping centres, in which the possible costs
still to be incurred were not considered, as the accompanying financial statements already include a provision for them.
IFRS 13 (Fair value measurement) requires disclosure of fair value measurements by level of the following fair value
measurement hierarchy:
• Level 1: Quoted prices (unadjusted) in active markets for identical assets or liabilities.
• Level 2: Inputs other than quoted prices included within level 1 that are observable.
• Level 3: Inputs that are not based on observable market data (that is, unobservable inputs).
Considering the above hierarchy investments properties of the Group are all within Level 3.
The relationship of unobservable inputs to fair value can be described as follows:
• A decrease in the estimated annual rent will decrease the fair value;
• An increase in the discount rates and the capitalization rates will decrease the fair value.
As mentioned in the valuation reports of the investment properties prepared by independent specialised entities, the
assessment of their fair value considered the definition of fair value in IFRS 13, which is consistent with the definition of market
value defined by the investment properties valuation international standards.
As of 31 December 2018 there are no Fit-out contracts and as of 31 December 2017 the fair value of the fit out contracts
existing in each investment property was as follows:
The fair value of the fit-out contracts was determined by means of a valuation as of the reporting date made by an independent
specialised entity (Cushman & Wakefield and Jones Lang LaSalle). The methodology used to compute the fair value of the
fit-out contracts consisted in determining the discounted estimated cash flows of each one of the fit-out contracts, using
a discounted market rate like the one used in determining the fair value of the investment property to which each fit out
contract relates.
31.12.2017
10 yr discount rate 10 yr cap rate
Floor Weighted average Cap Floor Weighted average Cap Amount
Portugal / Spain 7.25% 7.92% 10.75% 5.50% 5.97% 9.00% 1,488

47
During the years ended on 31 December 2018 and 2017, the income (fixed rents net of discounts, turnover rents, mall income,
key income and transfer fees) and the corresponding direct operating expenses (property tax, insurance expense, maintenance
expense, management fee and asset management fee and other direct operating expenses), relating to the investment
properties of the Group, was as follows:
At 31 December 2018 and 2017 the following investment properties had been given in guarantee of bank loans:
Dos Mares Plaza Mayor Parque de Ócio
Cascaishopping Plaza Mayor Shopping
Gli Orsi Parklake
At 31 December 2018 and 2017 there were no material contractual obligations to purchase, construct or develop investment
properties or for repairs or maintenance, other than those referred to above, except for the obligations mentioned in notes 40
and 41.
Investment properties under development at 31 December 2018 and 2017 are made up as follows:
The amounts of kEuro 68,267 and kEuro 65,727 at 31 December 2018 and 2017, respectively, recorded under caption
“Impairment for assets at risk”, relates to the provision made to anticipate losses due to the delays on the development
pipeline due to market uncertainty. In the year ended in 31 December 2018, the Group increased the impairment for assets
at risk in the amount of kEuro 2,540, in order to reflect the expected outcome of the developments as well the economic
environment of the country where they are located.
Income Direct operating expenses
31.12.2018 31.12.2017 31.12.2018 31.12.2017
Portugal / Spain 39,711 45,542 2,640 3,655
Other European Countries 11,885 8,728 1,383 1,150
51,596 54,270 4,023 4,805
31.12.2018 31.12.2017
Investment properties at cost:
Portugal / Spain 15,163 15,086
Other european countries 68,771 92,096
83,934 107,182
Impairment for assets at risk (68,267) (65,727)
15,667 41,455

2018 ConsolidatedReport and Accounts
9. PROPERTY, PLANT AND EQUIPMENT
The movement in property, plant and equipment and corresponding accumulated depreciation during the years ended
31 December 2018 and 2017 was as follows:
10. GOODWILL
At 31 December 2018 and 2017 goodwill was made up as follows:
The impairment tests made to the goodwill are based on the “Net Asset Value” (“NAV”) at the reporting date.
31.12.2018 31.12.2017Buildings and other
constructions
Machineryand
equipment
Transportequipment
Administrativeequipment
Tools andutensils
Othertangible
fixed assets
Tangiblefixed assetsin progress
Total Total
Assets:Opening balance 2,253 999 123 2,908 265 694 - 7,242 7,959 Increases 23 - - 51 10 2 270 356 387 Sales - (4) - (21) (3) (7) - (35) (462)Transfers and write-off - - (81) (1) - - - (82) (622)Currency translation differences - - - (8) - - - (8) (10)Merger 32 - - 12 3 20 - 67 - Change in consolidation perimeter (32) 2 - 30 11 (20) - (9) (9)Closing balance 2,276 997 42 2,971 286 689 270 7,531 7,243
Accumulated depreciation and impairment losses:Opening balance 852 773 99 2,755 234 643 - 5,356 5,950 Depreciation for the year 135 56 9 89 20 33 - 342 439 Sales - (4) - (18) (2) (7) - (31) (410)Transfers and write-off - - (81) (1) - - - (82) (608)Currency translation differences - - - (7) - - - (7) (8)Merger 25 - - 12 3 20 - 60 - Change in consolidation perimeter (25) - - 20 11 (17) - (11) (5)Closing balance 987 825 27 2,850 266 672 - 5,627 5,358
Net assets 1,289 172 15 121 20 17 270 1,904 1,885
31.12.2018 31.12.2017
Year ofaquisition
Grossamount
Impairmentlosses
of the year
CarryingAmount
CarryingAmount
Dos Mares 2005 1,298 - 1,298 1,298 Parklake 2018 7,137 (185) 6,952 - River Plaza Mall - - - - 1,334 Gli Orsi 2008 1,642 - 1,642 1,642
10,077 (185) 9,892 4,274

49
11. INTANGIBLE ASSETS
The movement in intangible assets and corresponding accumulated depreciation during the years ended 31 December 2018
and 2017 was as follows:
12. OTHER NON CURRENT ASSETS
At 31 December 2018 and 2017 other non-current assets were made up as follows:
The amount of kEuro 3,037 relates to the deposit in official entities of rents received from tenants mainly from shopping
centres located in Spain (Dos Mares and Plaza Mayor). The rent deposits received from tenants are classified under “Other
non-current liabilities” (Note 22) and “Other payables” (Note 27).
13. TRADE RECEIVABLES
At 31 December 2018 and 2017 trade receivables were made up as follows:
31.12.2018 31.12.2017
Software Otherintangible assets Total Total
Assets:Opening balance 4,899 11,762 16,661 16,610 Increases - 592 592 52 Sales, disposals and regularisations - - - (1)Merger 14 - 14 - Change in consolidation perimeter (14) - (14) - Closing balance 4,899 12,354 17,253 16,661
Accumulated depreciation and impairment lossesOpening balance 3,456 11,749 15,205 14,609 Depreciation for the year 583 3 586 597 Sales, disposals and regularisations - - - (1)Merger 14 - 14 - Change in consolidation perimeter (14) - (14) - Closing balance 4,039 11,752 15,791 15,205
Net assets 860 602 1,462 1,456
31.12.2018 31.12.2017Malaga City Council - 156 Rent deposits from tenants 3,037 2,574 Bank and other guarantees 174 185 Other non current assets 316 373
3,527 3,288
31.12.2018 31.12.2017Accounts receivable from customers:
Portugal 11,259 16,935 Spain 5,614 5,775 Italy 1,506 1,592 Germany 2,561 3,291 Romania 2,719 7,228 Morocco 386 475 Turkey 247 261 Greece 284 27 Other 111 55
24,687 35,639 Accumulated impairment losses on accounts receivable from customers (Note 29) (9,653) (13,285)
15,034 22,354

2018 ConsolidatedReport and Accounts
The Group’s exposure to credit risk is attributed to accounts receivables relating to the operating activity of the Group. The
amounts shown in the statement of financial position are net of the corresponding impairment losses on accounts receivable,
which were estimated by the Group, based on the experience of the Group and assessment of the economic environment.
The Board of Directors believes that the carrying amount of its trade receivables is similar to the corresponding fair value. The
Group does not have a significant concentration of credit risk, as that risk is diluted over a variety of different tenants.
Per the information included in the statement of financial position, the ageing of the trade receivables is as follows:
14. OTHER RECEIVABLES
At 31 December 2018 and 2017 other receivables were made up as follows:
The amount of kEuro 4,247 includes:
• the amount of kEuro 3,707 regarding the payment made in 2013 by Sonae Sierra SGPS, S.A. within the Special Tax Debts
Payment Regime (RERD) established by the Portuguese government in the law approved in October 2013 (Law 151-
A/2013) by which the entities that pay the tax notification will be exempt of the payment of interest and penalties; this
amount relates to corrections of the 2005 CIT due to: (i) non-deductible interest expenses amounting to kEuro 378; and
(ii) corrections concerning the price adjustment related with the sale of shares of Cascaishopping in 1996 amounting
to kEuro 3,329. The company contested the tax notifications received and did not record any impairment loss to face
eventual losses on those amounts, as the Board of Directors believes that the result will be favourable to the company.
• the amount of kEuro 518 related to tax notifications on the income tax statements relating to years 1991 to 1997 paid by
Cascaishopping – Centro Comercial, S.A. (“Cascaishopping”) to tax authorities. The corrections proposed by tax authorities
relate basically to the depreciation policy of improvements made in third parties property that, for tax purposes, were being
depreciated over five years and that the Tax Authorities believe should be depreciated over 50 years. Cascaishopping
contested the tax notifications received and did not record any impairment to cover eventual losses on those amounts, as
the Board of Directors believes that the result will be favourable to Cascaishopping.
The amount of kEuro 2,224 under "Escrow Account" is related to an escrow account from 2005 relating to a lawsuit from a
tenant, on which the court requested that the Group made a deposit of kEuro 2,224, in the event of the case being won by the
tenant. Although the case has been won by the Group, the amount was incorrectly paid to the tenant. Therefore, a full refund
of the amount paid is expected as the court's decision has been favourable to the Group.
The Group’s exposure to credit risk is attributed to accounts receivable relating the operating activity of the Group. The
amounts shown in the statement of financial position are net of the corresponding impairment losses on accounts receivable,
which were estimated by the Group, based on the experience of the Group and assessment of the economic environment.
The Board of Directors believes that the carrying amount of its trade receivables is similar to the corresponding fair value. The
Group has not a significant concentration of credit risk, as that risk is diluted over a variety of different tenants.
31.12.2018 31.12.20170-90 days 9,468 10,473 90-180 days 6,094 12,089 180-360 days 493 388 + 360 days 8,632 12,689
24,687 35,639
31.12.2018 31.12.2017Sale of shares of 3shoppings - 42,674 Tax notification paid 4,247 4,247 Escrow account 2,224 2,224 Amount to be received from Contimobe 201 1,421 Advances to suppliers 1,872 916 Dividend to be received from Alexa KG - 420 Other 2,065 3,510
10,609 55,412
Accumulated impairment losses on other receivables (Note 29) (1,650) (1,656)8,959 53,756

51
15. OTHER CURRENT ASSETS
At 31 December 2018 and 2017 other current assets were made up as follows:
In 2017 the amounts in “Interest income receivable” included interest on the advance for future share capital increase made
by the Group on behalf of the JV partner of Parklake (kEuro 5,427), which was settled upon the acquisition of the remaining
interest in the company.
16. CASH AND CASH EQUIVALENTS
At 31 December 2018 and 2017 cash and cash equivalents were made up as follows:
The amounts of kEuro 5,021 and kEuro 4,327 at 31 December 2018 and 2017, respectively, relates to the guarantees made
by the tenants. These amounts received from tenants are classified under “Other non-current liabilities” (Note 22) and “Other
payables” (Note 27).
The bank deposits include deposits made by several companies included in the consolidation, repayable in less than three
months of inception and that bear interest at market interest rates.
17. SHARE CAPITAL AND LEGAL RESERVES
At 31 December 2018 the share capital was made up of 32,514,000 fully subscribed and paid up ordinary shares of Euro 4.99 each.
The following entities own the share capital at 31 December 2018 and 2017:
On 12 September 2018, Sonae SGPS, SA acquired from Grosvenor Investments (Portugal) Sarl an additional interest of 20%
in Sonae Sierra SGPS, S.A..
At 31 December 2018 and 2017 the legal reserves were as follows:
31.12.2018 31.12.2017Interest income receivable 1,495 6,713 Variable rents receivable 1,518 1,750 Recovered costs receivable 677 1,821 Insurance 377 404 Deferred costs with financing 42 15 Key Money 321 362 Management and administrative services receivable 1,971 3,409 Others 1,616 1,828
8,017 16,302
31.12.2018 31.12.2017Cash 79 170 Bank deposits 307,565 63,648 Cash and cash equivalents 307,644 63,818 Bank deposits-tenants retentions 5,021 4,327 Cash and bank deposits 312,665 68,145
31.12.2018 31.12.2017Legal reserve 32,449 32,449 Special reserve 24,880 24,880
57,329 57,329
Entity 2018 2017Sonae SGPS. S.A. 70.00% 50.00%Grosvenor Investments (Portugal), Sarl 30.00% 50.00%

2018 ConsolidatedReport and Accounts
Legal reserve: According to the company law, at least 5% of the annual net profit, if positive, should be used in the reinforcement
of the legal reserve until it represents 20% of the capital. This reserve can only be distributed in case of liquidation of the
company but can be used to cover losses after the other reserves have been used or can be incorporated in the share capital.
As mentioned in the Portuguese commercial code, and in consequence of the capital reduction in 2003, Sonae Sierra recorded
a special reserve, to which the rules of the legal reserve apply, by an amount equivalent to the nominal amount of the shares
extinguished (kEuro 24,880).
18. BANK LOANS
At 31 December 2018 and 2017 bank loans obtained were made up as follows:
(a) To guarantee the repayment of these loans, the Group pledged the real estate properties owned by these companies.(b) To guarantee the repayment of this loan, the Group pledged the shares of the subsidiary.(c) To guarantee the repayment of this loan, the Group has a bank guarantee.
Bank loans bear interest at market interest rates and were all contracted in Euro.
At 31 December 2018 and 2017 the covenants in force can be detailed as follows:
31.12.2018 31.12.2017
Used amount Used amount
Limit Current Non current Limit Current Non current
Bond loans:
Sonae Sierra SGPS - Caixa BI 50,000 - 50,000 75,000 75,000 -
Sonae Sierra SGPS - Banco BPI 25,000 - 25,000 -
Sonae Sierra SGPS - Novo Banco 25,000 - 25,000 -
Total bond loans 100,000 - 100,000 75,000 75,000 -
Bank loans:
Portugal/Spain
a),b) 149,275 4,200 145,075 153,475 17,675 135,800
a) 35,857 35,857 - 40,076 17,321 22,755
n.a. 35,000 - 35,000 20,000 20,000 -
Other European Countries
a),b),c) 128,700 5,200 123,500 - - -
a),b) 41,300 - 41,300 58,441 17,141 41,300
Total bank loans 390,132 45,257 344,875 271,992 72,137 199,855
Deferred bank expenses incurred on the issuance of bank debt (862) (3,246) (524) (1,669)
490,132 44,395 441,629 346,992 146,613 198,186
Fair value of the financial hedging instruments - liability - - - 203
44,395 441,629 146,613 198,389
31.12.2018 31.12.2017
Used amount Used amount
Limit Current Non current Limit Current Non current
"Covenants":
"Loan to Value", "Debt Service Cover Ratio" (1),(2) 164,930 27,955 136,975 38,450 15,695 22,755
"Loan to Value", "Interest Cover Ratio" (1),(3) 41,300 - 41,300 58,441 17,141 41,300 "Loan to Value", "Debt Service Cover Ratio", "Annual EBITDA" (1),(2),(5) 135,800 4,200 131,600 140,000 4,200 135,800
"Debt to equity cover ratio" (4) - - - 1,999 1,999 - "Debt/(Investment Properties + Investment in Joint ventures and associates)", "Net Debt/Adjusted EBIT" (6),(7) 35,000 - 35,000 - - -
(1) "Loan to Value": Financial liabilities / Fair value of the investment property(2) "Debt Service Cover Ratio": Cash flow / (Paid interests plus capital amortization)(3) "Interest Cover Ratio": Cash flow / Paid interests(4) "Debt to equity cover ratio": Equity / Financial liabilities(5) "Annual EBITDA"(6) "Debt/(Investment Properties + Investment in Joint ventures and associates)"(7) "Net Debt/Adjusted EBIT"

53
Bank loans with covenants were analysed by the Group at the reporting date and, whenever breaches to these covenants
occurred the classification of the current portion was made accordingly. Regarding bank loans due in 2019 and in the case of
Plaza Mayor, the Group has started renegotiations with banks to review them.
At 31 December 2018 and 2017, loans and the respective interest are repayable as follows:
At 31 December 2018 and 2017, the Group’s financial instruments related to interest rate swaps, caps and zero cost collars
were as follows:
(*) These hedging instruments are Caps.
The fair value of the effective financial hedging instruments was recorded under hedging reserves of the Group (kEuro 2 and
kEuro -168 in 31 December 2018 and 2017, respectively).
The interest rate swaps, caps and zero cost collars are stated at their fair value at the reporting date, determined by the
valuation made by the bank entities, with which the derivatives were contracted. The computation of the fair value of these
financial instruments was made taking into consideration the reporting date, the update of the future cash-flows relating
to the difference between the interest rate to be paid by the company to the bank entity, with which the swap or collar was
negotiated, and the variable interest rate to be received by the company from the bank entity that granted the loan. In
addition, tests to the fair value of those derivative financial instruments were made by the treasury department of the Group,
to validate the fair value determined by those entities.
31.12.2018 31.12.2017
Fair value of the financialhedging instrument
Fair value of the financialhedging instrument
Loan Asset Loan Asset Liability
Financial hedging instruments:
"Swaps":
River Plaza / Société Générale - - 17,141 - 203
- - 203
"Options":
Cascaishopping / Santander (*) 43,650 146 45,000 451 -
Cascaishopping / ING (*) 24,250 81 25,000 201 -
Gli Orsi / ING (*) 41,300 2 41,300 35 -
Land Retail / Santander (*) 33,950 113 35,000 351 -
Land Retail / ING (*) 33,950 113 35,000 281 -
Parklake / OTP Group / Hypo Noe (*) 128,700 37 - - -
492 1,319 -
492 1,319 203
31.12.2018 31.12.2017
Repayment Interest Repayment Interest
Year N+1 45,257 10,118 147,137 7,027
Year N+2 9,400 9,904 26,955 3,842
Year N+3 74,175 9,094 4,200 3,643
Year N+4 54,399 7,921 45,499 3,168
Year N+5 286,900 4,194 4,200 2,713
Year N+6 and following years 20,001 480 119,001 749
490,132 41,711 346,992 21,142

2018 ConsolidatedReport and Accounts
The main hedging principles used by the Group when negotiating these hedging financial instruments are as follows:
• Matching between the cash-flows paid and received: the dates of interest payments of the loans obtained and their date
of the derivatives flows with the bank are the same;
• Matching in the index interest rate used: the reference index interest rate used in the derivatives and in the loan are the
same;
• In a scenario of increase or decrease in interest rates, the maximum amount of interest payable is perfectly calculated.
19. OTHER BANK LOANS
At 31 December 2018 and 2017 other bank loans were made up as follows:
31.12.2018 31.12.2017
Limit Current Limit Current
Short term facilities:
SPF - Sierra Portugal 6,500 - 6,500 -
Sierra B.V. - - 8,000 -
Sierra Portugal, S.A. 249 - 249 -
Sonae Sierra, SGPS, S.A. 30,000 - 55,000 25,000
36,749 - 69,749 25,000
Bank overdrafts 44,720 - 44,720 -
81,469 - 114,469 25,000

55
31.12.2018 31.12.2017
Current Non-Current Current Non-Current
Loans payable to:
Sierra European Retail Real Estate Asset Fund LP Inc. ("Sierra LP"):
Plaza Mayor Shopping B.V.* - - - 3,757
Plaza Mayor Parque de Ócio BV - 3,792 - -
- 3,792 - 3,757
Shopping Centre Parque Principado B.V.
Harvey Dos Iberica, S.L. 3,764 - 3,764 -
3,764 - 3,764 -
3,764 3,792 3,764 3,757
20. SHAREHOLDERS LOANS
At 31 December 2018 and 2017 shareholder loans were made up as follows:
These loans bear interest at market interest rates and were contracted in Euro.
31.12.2018 31.12.2017
Current Non-Current Current Non-Current
Loans receivable:Axnae Spain Holdings, S.L.:
Area Sur Shopping, S.L. - 1,950 - 1,950 - 1,950 - 1,950
Iberian Holdings Spain S.L.:Iberian Assets, S.A - - - 9,594
- - - 9,594 Project Sierra 10 BV:
Parklake Shopping, S.A. - - - 20,290 PLP S.a.r.l. - - - 20,390 Plenerg Srl - - - 100
- - - 40,780 Project Sierra Cúcuta BV:
Central Control II, SAS 2,160 - - - Proyecto Cúcuta, S.A.S. 4,185 - 1,820 -
4,185 - 1,820 - Plaza Mayor Parque d'Ócio BV:
Doc Malaga Holding, S.L. - 11,040 - 5,835 - 11,040 - 5,835
Sierra Developments Holding BVParklake Shopping, S.A. - - - 22,276 Park Avenue Development of Shopping Centres S.A. 46 442 - 442
46 442 - 22,718 Sierra BV:
Iberian Assets, S.A. - - - - Shopping Centre Colombo Holding BV - 9,000 - 9,000
- 9,000 - 9,000 Sierra Investments Holding BV:
Freccia Rossa - Shopping Centre, Srl - - - 18,718 - - - 18,718
Sierra Maroc Sarl:Zenata Commercial Project 1,307 - 137 -
1,307 - 137 - Sierra Retail Ventures BV:
Arrábidashopping - Centro Comercial, S.A. - 7,072 - 7,072 - 7,072 - 7,072
Sierra Solingen Holding GmbH:Solingen Shopping Center GmbH 3,405 14,938 3,723 14,937
3,405 14,938 3,723 14,937 Sierra Parma Project BV:
PUD S.r.l. - 10,045 - - - 10,045 - -
11,103 54,487 5,680 130,604
11,103 54,487 5,680 130,604
*The company was merged into Plaza Mayor Parque de Ócio BV in October 2018

2018 ConsolidatedReport and Accounts
21. RECONCILIATION OF LIABILITIES ARISING FROM FINANCING ACTIVITIES
The table below details the changes in the Group’s liabilities arising from financing activities, including both cash and non-cash
changes. Liabilities arising from financing activities are those for which cash flows were or, future cash flows will be, classified in
the Group’s consolidated statement of cash flows as cash flows from financing activities.
22. OTHER NON CURRENT LIABILITIES
At 31 December 2018 and 2017 other non-current liabilities were made up as follows:
The amount of kEuro 14,000 relates to the debt amount to be paid in 2020 regarding the acquisition of Parklake and Plenerg.
Non-cash changes
01.01.2018Financing cash
flowsAcquisition of subsidiaries
Excluded from consolidation
Interest capitalized
Fair value adjustments
31.12.2018
Debentures loans 75,000 25,000 - - - - 100,000
Bank loans 271,992 65,795 69,400 (17,055) - - 390,132
Other borrowings 25,000 (25,000) - - - - -
Loans from related parties 7,520 - - - 36 - 7,556
Derivative financial instruments 203 - - - - (203) -
379,715 65,795 69,400 (17,055) 36 (203) 497,688
Non-cash changes
01.01.2017Financing cash
flowsDisposal of
subsidiariesInterest
capitalizedFair value
adjustments31.12.2017
Debentures loans 75,000 - - - - 75,000
Bank loans 323,244 (16,607) (34,645) - - 271,992
Other borrowings 25,000 - - - - 25,000
Loans from related parties 7,480 - - 40 - 7,520
Derivative financial instruments 1,319 - - - (1,116) 203
432,043 (16,607) (34,645) 40 (1,116) 379,715
31.12.2018 31.12.2017
Rents deposits from tenants (Note 12 and 16) 6,481 5,928
Guarantees 457 -
Acquisition Parklake and Plenerg 14,000 -
Other non current accounts payable 305 265
21,243 6,193

57
23. DEFERRED TAXES
Deferred income tax assets and liabilities at 31 December 2018 and 2017, in accordance with the temporary differences that
generate them, are made up as follows:
Deferred income tax assets relating to the fair value of the financial hedging instruments were recorded under hedging reserves
of the Group (kEuro -1 and kEuro 24 at 31 De-cember 2018 and 2017, respectively).
The movement in deferred income tax assets and liabilities during the years ended 31 December 2018 and 2017 was as follows:
Deferred tax assets Deferred tax assets
31.12.2018 31.12.2017 31.12.2018 31.12.2017
Difference between the fair value and tax cost of tangible
fixed assets and intangible assets 94 - 148,150 134,596
Difference between the fair value and tax cost
of the fit-out contracts and the correspondent tax basis - - 13 (121)
Write-off of deferred income relating entrance fees (key money)
and expenses relating the opening of shopping centres - - (814) (730)
Fair value of hedging financial instruments - 32 1 8
Fair value of hedging financial instruments (CAP) (6) - - -
Tax losses carried forward 2,010 2,027 - -
Impairment losses on accounts receivable from customers 306 247 - -
Impairment losses on other assets and write-off of deferred costs - 100 - -
2,404 2,406 147,350 133,753
31.12.2018 31.12.2017
Asset Liability Asset Liability
Opening balance 2,406 133,753 2,879 125,101
Effect in net result:
Difference between fair value and tax cost of
tangible fixed assets and intangible assets (3) 8,238 2 20,168
Difference between fair value and tax cost of the
fit-out contracts - 12 - (78)
Write-off of movements ocurred in the year in deferred income
relating key money and expenses related
to the opening of shopping centers - 221 (5) (109)
Increase / (Decrease) of impairment losses not accepted for tax purposes (69) - (46) -
Increase / (Decrease) of tax losses carried forward (18) - (235) -
Valuation of hedging financial instruments 9 - - -
Sub-total (Note 24) (81) 8,471 (284) 19,981
Effect in equity:
Valuation of hedging financial instruments (33) (8) (199) (11)
Tax rate change effect related to the hedging - - - (3)
Transfer to associates (Note 5) - (4,738) - -
Changes in perimeter:
Sales (Note 6) (4) (11,329)
Excluded from consolidation (46) (1,223) - -
Acquisitions (Note 6) 157 11,095 - -
Others 1 - 14 14
Closing balance 2,404 147,350 2,406 133,753
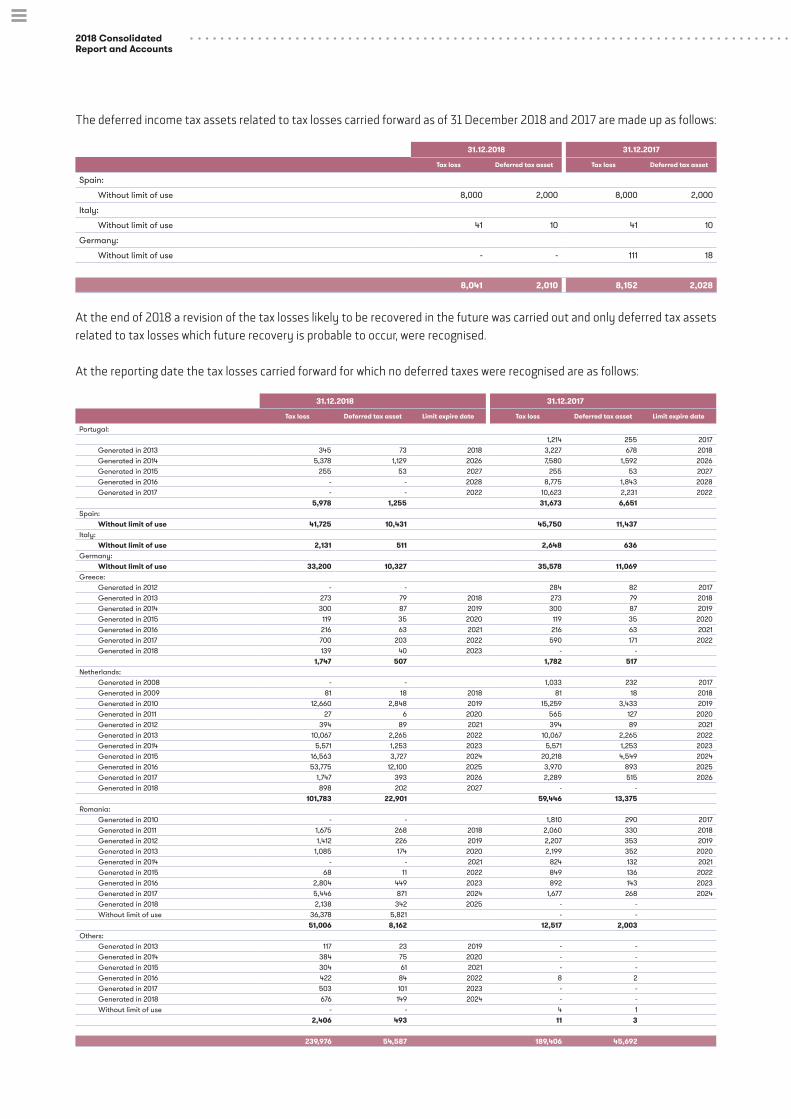
2018 ConsolidatedReport and Accounts
The deferred income tax assets related to tax losses carried forward as of 31 December 2018 and 2017 are made up as follows:
At the end of 2018 a revision of the tax losses likely to be recovered in the future was carried out and only deferred tax assets
related to tax losses which future recovery is probable to occur, were recognised.
At the reporting date the tax losses carried forward for which no deferred taxes were recognised are as follows:
31.12.2018 31.12.2017
Tax loss Deferred tax asset Tax loss Deferred tax asset
Spain:
Without limit of use 8,000 2,000 8,000 2,000
Italy:
Without limit of use 41 10 41 10
Germany:
Without limit of use - - 111 18
8,041 2,010 8,152 2,028
31.12.2018 31.12.2017
Tax loss Deferred tax asset Limit expire date Tax loss Deferred tax asset Limit expire date
Portugal:1,214 255 2017
Generated in 2013 345 73 2018 3,227 678 2018Generated in 2014 5,378 1,129 2026 7,580 1,592 2026Generated in 2015 255 53 2027 255 53 2027Generated in 2016 - - 2028 8,775 1,843 2028Generated in 2017 - - 2022 10,623 2,231 2022
5,978 1,255 31,673 6,651 Spain:
Without limit of use 41,725 10,431 45,750 11,437 Italy:
Without limit of use 2,131 511 2,648 636 Germany:
Without limit of use 33,200 10,327 35,578 11,069 Greece:
Generated in 2012 - - 284 82 2017Generated in 2013 273 79 2018 273 79 2018Generated in 2014 300 87 2019 300 87 2019Generated in 2015 119 35 2020 119 35 2020Generated in 2016 216 63 2021 216 63 2021Generated in 2017 700 203 2022 590 171 2022Generated in 2018 139 40 2023 - -
1,747 507 1,782 517 Netherlands:
Generated in 2008 - - 1,033 232 2017Generated in 2009 81 18 2018 81 18 2018Generated in 2010 12,660 2,848 2019 15,259 3,433 2019Generated in 2011 27 6 2020 565 127 2020Generated in 2012 394 89 2021 394 89 2021Generated in 2013 10,067 2,265 2022 10,067 2,265 2022Generated in 2014 5,571 1,253 2023 5,571 1,253 2023Generated in 2015 16,563 3,727 2024 20,218 4,549 2024Generated in 2016 53,775 12,100 2025 3,970 893 2025Generated in 2017 1,747 393 2026 2,289 515 2026Generated in 2018 898 202 2027 - -
101,783 22,901 59,446 13,375 Romania:
Generated in 2010 - - 1,810 290 2017Generated in 2011 1,675 268 2018 2,060 330 2018Generated in 2012 1,412 226 2019 2,207 353 2019Generated in 2013 1,085 174 2020 2,199 352 2020Generated in 2014 - - 2021 824 132 2021Generated in 2015 68 11 2022 849 136 2022Generated in 2016 2,804 449 2023 892 143 2023Generated in 2017 5,446 871 2024 1,677 268 2024Generated in 2018 2,138 342 2025 - - Without limit of use 36,378 5,821 - -
51,006 8,162 12,517 2,003 Others:
Generated in 2013 117 23 2019 - - Generated in 2014 384 75 2020 - - Generated in 2015 304 61 2021 - - Generated in 2016 422 84 2022 8 2 Generated in 2017 503 101 2023 - - Generated in 2018 676 149 2024 - - Without limit of use - - 4 1
2,406 493 11 3
239,976 54,587 189,406 45,692

59
24. INCOME TAX
Income tax for the years ended 31 December 2018 and 2017 is made up as follows:
The numerical reconciliation between tax expense and the accounting profit multiplied by the applicable tax rate, during the
years ended 31 December 2018 and 2017 is as follows:
The amount of kEuro 4,475 under “Other permanent differences and tax losses for which the recoverability is not probable”
(kEuro 8,639 in 2017) includes the effect of the non-recognition of the deferred tax assets related to the tax losses carried
forward of the companies for which the Group was not certain about its future recovery (Sonae Sierra, Sierra BV, Sierra Turkey,
Sierra Romania, Iberian Holdings Spain and Parklake in 2018) (Sonae Sierra, Sierra BV, Sierra Greece, Sierra Turkey, Sierra
Romania and River Plaza in 2017).
25. ACCOUNTS PAYABLE TO SUPPLIERS
At 31 December 2018 and 2017 accounts payable to suppliers were made up as follows:
As of 31 December 2018 and 2017, this caption relates to amounts payable resulting from purchases made in the normal
course of the Group’s activities. As of 31 December 2018, the Board of Directors believes that the carrying amount of these
accounts payable is similar to its corresponding fair value.
31.12.2018 31.12.2017
Current Non-current Current Non-current
Trade payables 7,899 - 5,085 -
Fixed assets suppliers 1,940 452 783 22
9,839 452 5,868 22
2018 2017
Current tax 11,461 5,830
Deferred tax (Note 23) 8,552 20,265
20,013 26,095
2018 2017
Profit before income tax 188,979 224,073
Gains/losses related to the sale of companies (Note 36) (14,369) (11,111)
Net result of joint ventures and associates (Note 37) (90,622) (120,941)
Impairment of goodwill 185 -
Impairment losses in the investments under development 2,540 1,676
Other permanent differences and tax losses for which the recoverability is not probable 4,475 8,639
Taxable profit 91,188 102,336
Effect of different income tax rates in other countries 4,113 21,927
95,301 124,263
Income tax rate in Portugal 21.0% 21.0%
20,013 26,095

2018 ConsolidatedReport and Accounts
The amounts reported above have the following periods for payment:
26. STATE AND OTHER PUBLIC ENTITIES
At 31 December 2018 and 2017 state and other public entities were made up as follows:
According to the current tax legislation, the tax returns of Portuguese companies included in the consolidation are subject
to revision and correction by the fiscal authorities within a period of four years; the exceptions are when fiscal losses have
occurred, fiscal incentives have been granted or auditing or claims are in course, in which case, depending on circumstances,
the final dates can be extended or suspended. So, the tax returns of the Portuguese companies of the years 2015 until 2018
are still subject to review and possible adjustment.
The Board of Directors believes that any possible adjustments that may be made by the tax authorities as a result of their
reviews will not have a significant effect on the financial statements as of 31 December 2018.
As of 31 December 2018, the Board of Directors believes that the carrying amount of these accounts receivable and payable
is similar to its fair value.
As of 31 December 2018 and 2017, there are no overdue debts to state and other public entities.
31.12.2018 31.12.2017
Current:
0-90 days 5,288 4,156
90-180 days 186 1,060
+ 180 days 4,365 652
9,839 5,868
Non-current:
n+1 440 10
n+2 6 -
n+3 - 6
n+4 6 -
n+5 - 6
452 22
31.12.2018 31.12.2017
Asset Liability Asset Liability
Current Current Current Current
Income tax 4,936 7,149 3,509 2,800
VAT 2,235 5,162 1,338 5,423
Social security contributions 338 903 243 782
Other taxes 642 205 681 491
8,151 13,419 5,771 9,496

61
27. OTHER PAYABLES
At 31 December 2018 and 2017 other payables were made up as follows:
The amount of kEuro 4,286 of gift cards relates to deposits received until 31 December 2018 on the sale of those gift cards, net
of gift cards expired or settled until that date. The Group recognises in an account payable all gift cards sold, being this account
settled when the gift cards are compensated by the tenants (in this case the fee charged is recognised on the statement of
profit or loss) or when the gift cards expire (in this case the income corresponds to the amount of the expired gift cards).
The amount of kEuro 16,000 relates to the debt amount to be paid in 2019 regarding the acquisition of Parklake and Plenerg.
As of 31 December 2018 and 2017, this caption relates to amounts payable resulting from acquisitions made in the normal
course of the Group’s activities. As of 31 December 2018, the Board of Directors believes that the carrying amounts of these
accounts payable is similar to its fair value.
The above balance for other creditors shows an average payment period below 90 days.
28. OTHER CURRENT LIABILITIES
At 31 December 2018 and 2017 other current liabilities were made up as follows:
The accrual for vacations and vacations bonus and other bonus as of 31 December 2018 and 2017, includes the amounts of
kEuro 2,174 and kEuro 2,564, respectively, related to the remuneration bonus attributed to some employees of the Group,
which will be paid in the future, as long as the employees involved are still employees of the Group as of the payment date.
These remuneration bonus will be adjusted, in each of the following periods, until the corresponding payment date, by the
annual variation of the Net Asset Value (NAV) of the Group and for the remuneration bonus attributed after 2011, inclusive, will
be also adjusted according to the direct result of the Group and the possible sales of assets during the deferred period. These
remuneration bonus are expensed linearly over the deferred period and recorded as expense, on the basis of the gross amount
that was attributed to those employees, and any subsequent adjustment, derived from the variation of the Group’s NAV or
other, recorded in the statements of profit or loss of the year in which the variation occurs.
31.12.2018 31.12.2017
Gift cards 4,286 3,493
Advances from customers 2,269 3,375
Rent deposits from tenants (Note 12 e 16) 971 806
Acquisition Parklake and Plenerg 16,000 -
Other payables 1,187 1,134
24,713 8,808
31.12.2018 31.12.2017
Accrued services payable 11,821 10,152
Accrual for vacations and vacations bonus and other bonus 13,890 13,952
Accrued fixed assets payable 12,897 13,997
Accrued interest expense 2,154 3,054
Deferred rental income 3,858 2,785
Condominium margin 871 1,185
Accrued property tax 276 397
Accrued other taxes - -
Key money invoiced in advance 525 653
Others 2,165 2,653
48,457 48,828

2018 ConsolidatedReport and Accounts
As of 31 December 2018 and 2017, the amounts of kEuro 12,897 and kEuro 13,997, respectively, relate to the estimate, made
by the Board of Directors for liabilities associated with the investments made in the investment properties, for which the
corresponding invoices have not yet been received.
29. VARIATIONS ON PROVISIONS AND IMPAIRMENT LOSSES
The movement in provisions and impairment losses, current and non-current, during the years ended 31 December 2018 and
2017 is made up as follows:
Impairment losses on accounts receivable are deducted from the amount of the corresponding asset.
30. SERVICES RENDERED
Services rendered for the years ended 31 December 2018 and 2017 are made up as follows:
The caption “Fixed rents” is net of the discounts (contractual and extra-contractual) granted to the tenants in the amount of
kEuro 3,079 and kEuro 5,067, respectively for 2018 and 2017.
2018
Balance as of31.12.2017
Increase/decrease
UtilizationBalance as of
31.12.2018
Impairment losses on accounts receivable:
Trade receivables (Note 13) 13,285 299 (3,931) 9,653
Other receivables (Note 14) 1,656 39 (45) 1,650
14,941 338 (3,976) 11,303
Provisions for risks and expenses:
Other risks and expenses 2,553 1,405 14 3,972
17,494 1,743 (3,962) 15,275
2017
Balance as of31.12.2016
Increase UtilizationBalance as of
31.12.2017
Impairment losses on accounts receivable:
Trade receivables (Note 13) 15,467 779 (2,961) 13,285
Other receivables (Note 14) 1,608 69 (21) 1,656
17,075 848 (2,982) 14,941
Provisions for risks and expenses:
Other risks and expenses 1,613 946 (6) 2,553
18,688 1,794 (2,988) 17,494
2018 2017
Services rendered:
Fixed rents 49,587 51,556
Turnover rents 1,289 1,714
Mall income 3,605 3,712
Common charges 31,374 49,336
Service fees 68,011 64,300
Parking income 1,544 1,433
Other 1,325 1,305
156,735 173,356

63
31. VARIATION IN FAIR VALUE OF INVESTMENT PROPERTIES
The variation in fair value of the investment properties in 2018 and 2017 is made up as follows:
32. OTHER OPERATING REVENUE
Other operating revenue for the years ended 31 December 2018 and 2017 is made up as follows:
33. IMPAIRMENT LOSSES AND WRITE-OFF
The impairment losses and write-offs for the years ended 31 December 2018 and 2017 are the following:
The “Write-off and Impairment losses in the investment properties under development” relate to the provision made to
anticipate losses due to the delays on the development pipeline due to market uncertainty.
34. OTHER OPERATING EXPENSES
Other operating expenses for the years ended 31 December 2018 and 2017 are made up as follows:
2018 2017
Variation in fair value between years (Note 8):
- Gains 38,277 68,561
- Losses (11,716) (7,727)
Variation in fair value on "fit-out" contracts (Note 8) 294 (3)
26,855 60,831
2018 2017
Co-generation 16 18
Development fees 2,480 1,221
Reversal of impairment losses - 1,479
Reversal of provisions - 297
Gain on sale of assets 28,169 7
Other 1,889 637
32,554 3,659
2018 2017
Impairment losses goodwill (Note 10) 185 -
Write-off and Impairment losses in the investment properties under development (Note 8) 2,540 1,676
2,725 1,676
2018 2017
Property tax 1,752 1,411
Distribution of results related to the building rights (Shopping Colombo) - 2,927
Payment of the withholding tax re dividends 2,640 -
Tax on the increase of the value of Plaza Mayor's land plot - 600
Loss on the sale of Coimbrashopping 729 -
Exchange rate losses 989 536
Goodwill Cucuta - 229
Other 1,047 1,244
7,157 6,947

2018 ConsolidatedReport and Accounts
35. NET FINANCIAL RESULTS
Net financial results are made up as follows:
36. GAINS AND LOSSES ON INVESTMENTS
Gains and losses on investments are made up as follows:
37. SHARE OF RESULTS OF JOINT VENTURES AND ASSOCIATES
Share of results of joint ventures and associates during the years ended 31 December 2018 and 2017, is detailed as follows:
2018 2017
Expenses:
Interest expense 9,671 11,947
Stamp duty related to financing 114 157
Foreign currency exchange losses 1 73
Loss on fair value of ineffective hedging derivatives 883 127
Other 4,651 2,516
15,320 14,820
Net financial expenses (8,011) (7,944)
7,309 6,876
Income:
Interest income 7,133 6,179
Foreign currency exchange gains 69 (58)
Other 107 755
7,309 6,876
2018 2017
Gain on sale of 3 Shoppings (Note 6) - 8,821
Price adjustment of 3 Shoppings 633 -
Gain on sale of Iberian Assets (Note 6) 13,090 -
River Plaza - excluded from consolidation (Note 6) 646 -
Price adjustment of Le Terrazze - 1,832
Price adjustment of Loop 5 - 458
14,369 11,111
2018 2017
Share of profit of joint ventures (Note 4) 77,038 107,232
Share of profit of associates (Note 5) 13,584 13,709
90,622 120,941

65
38. OPERATING LEASES
In the operating leases where the Group is the lessor, the minimal lease payments (fixed rents) recorded during the years
ended 31 December 2018 and 2017 amounted to kEuro 52,369 and kEuro 56,323 respectively (Note 30).
In addition, as of 31 December 2018 and 2017, the Group had, as lessor, operating lease contracts for which the minimal lease
payments (fixed rent) are due as follows:
In the Operational Leases where the Group is the lessee, the minimum lease payments recognised as expense during the years
ended 31 December 2018 and 2017 reached the amounts of kEuro 2,214 and kEuro 2,175 respectively.
In addition, as of 31 December 2018 and 2017, the Group had, as lessee, operating lease contracts for which the minimum lease
payments are due as follows:
31.12.2018 31.12.2017
Due in N+1 56,069 52,416
Due in N+2 49,493 46,026
Due in N+3 40,637 40,872
Due in N+4 28,952 32,568
Due in N+5 21,049 22,647
Due after N+5 62,588 64,721
Contracts automatically renewed 37 678
258,825 259,928
31.12.2018 31.12.2017
Due in N+1 2,006 1,905
Due in N+2 1,620 1,491
Due in N+3 1,417 1,204
Due in N+4 948 1,013
Due in N+5 283 392
Due after N+5 120 -
Contracts automatically renewed 307 344
6,701 6,349

2018 ConsolidatedReport and Accounts
39. RELATED PARTIES
Balances and transactions with related parties, during the years ended 31 December 2018 and 2017, in addition to the loans
obtained from and payable to the shareholders mentioned in Note 20, are detailed as follows:
Balances
Accounts receivable Accounts payable Other liabilities
31.12.18 31.12.17 31.12.18 31.12.17 31.12.18 31.12.17
BB Food Service, S.A. 2 11 - - 2 6
Contimobe - Imobil. Castelo Paiva, S.A. 201 1,423 71 - 6 (189)
Digitmarket - Sistemas de Informação, S.A. 5 - - 1 (156) (144)
Infofield - Informática, S.A. - - - - - 60
MCCARE - Serviços de Saúde, S.A. 1 24 - - 17 17
MDS - Corretor de Seguros, S.A. 76 84 48 4 (545) (389)
Modalfa - Comércio e Serviços, S.A. 7 7 - - - 19
Modalloop - Vestuário e Calçado, S.A. - - - - 14 14
Modelo Continente Hipermercados, S.A. 135 72 258 534 673 763
Modelo - Dist.e materiais de Construção, S.A. - - - - - 31
Pharmacontinente - Saúde e Higiene, S.A. - 38 - 3 7 14
RACE-Refrigeration & Air Condit.Engen.SA 30 4 502 164 2 1
Raso- Viagens e Turismo, S.A 1 2 61 95 14 (47)
Salsa Consolidated - - 17 - 16 25
SDSR - Sports Division SR, S.A. - 3 - 1 18 21
Sonae Center Serviços II, S.A. 352 - - 81 350 29
Torre Ocidente Imobiliária, S.A. - 4 - 4 210 285
Troiaresort-Investimentos Turísticos, S.A. 22 29 - - 22 3
Viajens y Turismo de Geotur España, S.L. - - 7 9 - -
We Do Consulting-Sist. de Informação, S.A. - - 24 31 - 39
We Do Technologies BV - 5 - - - -
Worten – Equipamentos para o Lar, S.A. 23 70 1 2 108 93
Worten España Distribución, SL - - 30 30 - -
Zippy - Comércio e Distribuição, S.A. 4 6 - - 5 5
ZYEvolution-Invest.Desenv.,SA 78 - 164 - 65 -
Joint ventures and associates of Sonae Sierra 6,723 13,231 5,769 5,473 (931) (2,507)
Sonae SGPS, S.A. - - 222 - - 220
Paneuropeia SGPS, Unipessoal, Lda. - - 8 - - -
Sierra European Retail Real Estate Asset Fund LP Inc. - - - - 31 30
7,660 15,013 7,182 6,432 (72) (1,601)

67
The remuneration of the Board of Directors, during the years ended 31 December 2018 and 2017, was as follows:
The total fees invoiced by the statutory auditor, amounted to kEuro 516, which include the amount of kEuro 272 relating
to review of accounts and the amounts of kEuro 144, kEuro 86 and kEuro 14, relating to reliability assurance services, tax
consulting and other services, respectively.
Transactions
Sales and services rendered
Purchases and services obtained
Interest income
Interest expense
2018 2017 2018 2017 2018 2017 2018 2017
BB Food Service, S.A. 35 90 1 (1) - - - -
Bom Momento - Restauração, S.A. 77 - (2) - - - - -
Contimobe - Imobil. Castelo Paiva, S.A. 32 31 (38) (478) - - - -
Continente Hipermercados, S.A. - - 22 10 - - - -
Digitmarket - Sistemas de Informação, S.A. - - 364 312 - - - -
Infofield - Informática, S.A. - 51 - - - - - -
Integrum Colombo Energia, S.A. - - - (183) - - - -
Go Well, S.A. 63 - (1) - - - - -
MCCARE - Serviços de Saúde, SA 212 210 (7) (2) - - - -
MDS - Corretor de Seguros, S.A. - - 443 157 - - - -
Modalfa - Comércio e Serviços, S.A. 19 213 - - - - - -
Modalloop - Vestuário e Calçado, S.A. 165 162 - - - - - -
Modelo - Dist.e materiais de Construção, S.A. 93 659 - - - - - -
Modelo Continente Hipermercados, S.A. 7,626 8,130 1,064 834 - - - -
Pharmacontinente - Saúde e Higiene, S.A. 102 366 - - - - - -
Público - Comunicação Social, SA - 10 - - - - - -
RACE-Refrigeration & Air Condit.Engen.SA - 4 458 170 - - - -
Raso- Viagens e Turismo, S.A 135 235 698 889 - - - -
Salsa Consolidated 442 980 - - - - - -
Saphety Level - Trusted Services, SA - - 128 148 - - - -
SDSR - Sports Division SR, S.A. 648 2,330 - (3) - - - -
Solinca - Health & Fitness, S.A. - 443 - (20) - - - -
Solinfitness - Club Malaga, S.L. - - - - 33 88 - -
Sonae Center Serviços II, S.A. - - 339 331 - - - -
Stichting Depositary APG Strategic Real Estate Pool - - - 2,927 - - - -
Tlantic Portugal - Sist.de Informação,SA - 2 28 21 - - - -
Torre Ocidente Imobiliária, S.A. - 34 686 669 - - - -
Troiaresort-Investimentos Turísticos, S.A. 165 151 22 21 - - - -
Viajens y Turismo de Geotur España, S.L. - - 231 213 - - - -
We Do Consulting-Sist. de Informação, S.A. - - 367 378 - - - -
We Do Technologies BV 4 4 - - - - - -
Worten – Equipamentos para o Lar, S.A. 1,301 2,170 (107) (71) - - - -
Worten España Distribución, SL 161 155 - - - - - -
Zippy - Comércio e Distribuição, S.A. 86 508 - (1) - - - -
ZYEvolution-Invest.Desenv.,SA - - 198 - - - - -
Joint ventures and associates of Sonae Sierra 50,032 44,140 5,578 2,279 3,205 2,758 124 122
Sonae SGPS, S.A. - - 229 220 - - - -
Sierra European Retail Real Estate Asset Fund LP Inc. - - - - - - 31 2
Sierra Investments (Luxembourg) 1 Sarl ("Luxco 1") - - - - - - - 16
Sierra Investments (Luxembourg) 2 Sarl ("Luxco 2") - - - - - - - 14
61,398 61,078 10,701 8,820 3,238 2,846 155 154
2018 2017
Fixed remuneration 1,450 1,625
Variable remuneration 1,403 1,203
2,853 2,828

2018 ConsolidatedReport and Accounts
40. CONTINGENT LIABILITIES AND BANK GUARANTEES
As of 31 December 2018 and 2017, the main contingent liabilities relate to the following situations:
• In 2018 the Group has agreed to pay up to the amount of kEuro 13,250 in case of breach of the obligations undertaken
under the investment agreement between Sierra Parma Project, B.V. and Parma Sviluppo, Srl.
• In 2018 the Group has agreed with the bank that granted the loan to Doc Malaga Siteco, S.L.U., for the construction of the
shopping centre Designer Outlet Málaga, the payment of any amount requested by the bank in the maximum amount
kEuro 7,500, in case the company is not able to comply with its obligations.
• In 2018 the Group has agreed with the bank that granted the loan to Proyecto Cúcuta S.A.S., for the construction of the
shopping centre Jardín Plaza Cúcuta, the payment of any amount requested by the bank in the maximum amount kEuro
6,070, in case the company is not able to comply with its obligations.
• In December 2013 Gli Orsi received a tax notification, whereby it is asked to pay the amount of kEuro 19,463, related with
real estate transfer tax in the amount of kEuro 9,485 and kEuro 9,978 related with penalties and interest, plus court agent
fees amounting to kEuro 905. Based on the opinion of the tax expert there are valid reasons to consider the claim without
foundation, and so the Group has appealed to the Supreme Court. In the specific case of the penalties requested by the
tax authorities, the tax expert understands that no penalty is due. To provide for this contingency, the Group has expensed
in 2013 an amount of keuro 10,390 (corresponding to real estate transfer tax (kEuro 9,485) plus count agent fee (kEuro
905). In 2016, the Group assumed the commitment to the bank ING Bank N. V. (Milan), that finance the company Gli Orsi
Shopping Centre 1, Srl, to pay future tax liabilities which may arise in relation to these tax litigations up to the maximum
amount of kEuro 25,000, in case the company is not able to settle it.
• Until this date, Sonae Sierra has received tax notifications regarding the tax deductibility of interest expenses on loans
obtained, concerning the years 2005, 2008, 2009, 2010, 2011, 2013 and 2015, in the total amount of kEuro 10,195. All
these tax notifications were claimed by Sonae Sierra and guarantees in the same amount were granted by the subsidiary
Sierra Investments, SGPS, S.A. to the Portuguese tax authorities. No provision was recorded because the Board of
Directors understands that the risk of these tax contingencies is unlikely. The fact that Sonae Sierra received a second
favourable court decision and a first court decision, respectively on 2015 and 2017 regarding the deductibility of interest
incurred in 2004 and 2009, corroborates the Group’s assessment of these contingencies.
At 31 December 2018 and 2017 the bank guarantees granted to third parties were as following:
No provision has been made for any liability arising from the tax and legal processes mentioned above, as the Board of Directors
believes that the corresponding risk is not probable.
31.12.2018 31.12. 2017
Bank guarantees:
relating to tax processes in course 1,927 1,927
to complete the construction of several projects 3,506 1,271
to secure the reimbursement of the instalment of the preliminary sale and purchase agreement with Carrefour Romania - 15,978
to secure any liability that may arise as a result of breach of commitments contained in the sale and purchase agreement of 3shoppings, SGPS, S.A. 6,600 -
Others 665 398
12,698 19,574

69
41. COMMITMENTS NOT REFLECTED ON THE FINANCIAL STATEMENTS
Following the sale of 49.9% of Sierra European Retail Real Estate Assets Holdings BV’s (“Sierra BV”) share capital to a group
of Investors, in 2003, Sonae Sierra has agreed to revise the sale price of such shares in the event of a sale, to third parties, of
some of the shopping centres owned by subsidiaries of Sierra BV (subject to some conditions).
The price revision can occur both with a sale of the asset (investment property in the case) or with a sale of the shares of the
company that is, directly or indirectly, the owner of such asset.
The price revision will be made by Sonae Sierra to the Investors in Sierra Fund or to Sierra BV if, in a relevant sale, discounts
related to deferred taxes on capital gains have been made.
The price revision will be dependent on the percentage ownership in the company that owns the asset, the Investors’ ownership
percentage in Sierra BV (and in case of a sale of shares adjusted by a 50% discount) and is limited to:
(i) in the case of the asset sale, a maximum amount of kEuro 101,705;
(ii) in the case of a sale of shares of the company that directly or indirectly owns the asset, a maximum amount of
kEuro 50,852;
(iii) in the case of a sale of shares of the company that directly or indirectly owns the asset, the price revision plus the selling
price, cannot result in a revised price that is greater than the proportion of the Net Asset Value.
Similar commitments were granted by Sonae Sierra in relation to the companies transferred to Sierra BV after 2003 and to
CBRE companies regarding the sale of 50% of Vasco da Gama.
These commitments are valid while the current agreements with the other stockholders of Sierra BV are maintained.
Furthermore, Sonae Sierra has the right to make a proposal for the acquisition of the asset or the shares at stake before they
are offered for sale to a third party.
In accordance with the agreements made between the shareholders of Sierra BV at the time of its incorporation in 2003, it was
agreed that Sierra BV should exist for an initial period of 10 years (that ended in October 2013), that could be extended by two
additional periods of one year starting in 2013. On September 2013 all the shareholders of Sierra BV approved an amendment
agreement relating to the continuation of the operations of the Fund with a long-stop date until October 2018. In 2018 the
shareholders of Sierra BV agreed to schedule a number of workshops to be carried out at each of the Core Assets – Colombo,
Norteshopping, Vasco da Gama, Cascaishopping and Plaza Mayor – to ascertain in more depth the long-term strategy of each
scheme, in view of agreeing the basis for a prospective long-term extension of the venture. The Group also continues to study
several alternatives to dispose of the other properties held by Sierra BV, but there are no intentions to proceed with forced
asset sales.
In accordance with the agreements made between the shareholders of SPF at the time of its incorporation in 2008, it was
agreed that SPF should exist for a period of 10 years (that would end in 2018), with the shareholders having the option to
redeem its shares after 2014, provided that some conditions are met. Upon a prospective redemption notice received from
shareholders, the Manager (Sonae Sierra) shall carry out its best endeavours to redeem the respective interests, in a period of
12 months. Additionally, in 2015 shareholders agreed to extend the term of the fund until 2020.
The Group believes that the direct sale of the asset is a less attractive solution as it is subject to certain liabilities that are not
crystalized in the event of a sale of the shares.

2018 ConsolidatedReport and Accounts
42. DIVIDENDS
Regarding the net Result of 2018, the Board of Directors proposes to transfer the amount to retained earnings.
The Board of Directors also proposes the distribution of free reserves in the amount of kEuro 115.100. The respective payment
will be deferred to a date to be decided by the shareholders and after the recommendation of the Board of Directors.
43. EARNINGS PER SHARE
As of 31 December 2018 and 2017, basic earnings per share correspond to the net profit divided by the weighted average
number of ordinary shares of Sonae Sierra during the year, and was computed as follows:
Sonae Sierra has no potential diluted shares and, for that reason, the diluted earnings per share is similar to the basic earnings
per share.
2018 2017
Profit considered to compute the basic earnings per share
(net profit of the year) 110,117 109,951
Number of shares 32,514,000 32,514,000
Earning per share (Euro) 3.39 3.38

71
44. SEGMENT INFORMATION
In accordance to the Management Report, the segments used by the Management of the Group are as follows:
• Investment portfolio
• Developments
• Services
• Sonae Sierra Brazil
The Sonae Sierra’s reportable segment information for the years ended 31 December 2018 and 2017, regarding the statement
of profit or loss, can be detailed as follows:
2018 2017
Net Operating Result
Investment portfolio 75,946 75,192
Developments (7,265) (8,749)
Services 18,954 17,018
Sonae Sierra Brazil 20,025 21,293
Reclassifications and adjustments 1 1
Consolidated (1) 107,661 104,755
Net financial costs
Investment portfolio 21,911 18,856
Developments (1,171) 426
Services 2,069 93
Sonae Sierra Brazil 3,964 5,521
Consolidated (1) 26,773 24,896
Direct profit before taxes
Investment portfolio 54,036 56,336
Developments (6,094) (9,174)
Services 16,885 16,925
Sonae Sierra Brazil 16,061 15,772
Reclassifications and adjustments (1) -
Consolidated 80,887 79,859
Indirect income before taxes
Investment portfolio 50,652 66,340
Developments 25,527 (1,676)
Sonae Sierra Brazil 19,851 11,759
Reclassifications and adjustments (1) -
Consolidated 96,029 76,423
Corporate tax + Deferred tax
Investment portfolio (20,491) (36,380)
Developments (4,128) 869
Services (3,669) (3,962)
Sonae Sierra Brazil (38,513) (6,856)
Reclassifications and adjustments 1 -
Consolidated (1) (66,800) (46,329)
Net profit
Investment portfolio 84,197 86,296
Developments 15,305 (9,981)
Services 13,216 12,964
Sonae Sierra Brazil (2,601) 20,675
Reclassifications and adjustments - (3)
Consolidated 110,117 109,951

2018 ConsolidatedReport and Accounts
The Sonae Sierra’s reportable segment information for the year ended 31 December 2018 and 2017, regarding the statement
of financial position, can be analysed as follows:
The reportable segment information can be reconciled with the enclosed financial statements as follows:
Statement of profit or loss
2018 2017
Investment propertiesInvestment portfolio 1,734,596 1,667,902 Sonae Sierra Brazil 361,926 377,619 Others 1 545
Consolidated (1) 2,096,523 2,046,066
Properties under development Investment portfolio 31,725 10,177 Developments 80,315 59,143 Sonae Sierra Brazil 2,213 2,677 Others (24) (30)
Consolidated (1) 114,229 71,967
Bank loansInvestment portfolio 628,961 586,236 Developments 27,046 1,999 Sonae Sierra Brazil 51,503 71,327 Bank loan at Sonae Sierra SGPS 135,000 120,000 Others - 1
Consolidated (1) 842,510 779,563
Deferred taxes liabilitiesInvestment portfolio 273,060 266,750 Developments 1,469 561 Sonae Sierra Brazil 95,621 68,551 Others (2,269) (1,814)
Consolidated 367,881 334,048
2018 2017
Net Operating Margin - segments 107,661 104,755 Equity method adjustment (1) (73,156) (70,637)Proportional method adjustment (2) 12,441 10,158 Indirect Income:Variation in fair value of the investment properties 26,855 60,831 Other indirect income / costs 24,019 (3,526)Depreciations, write-off and impairments losses (2,725) (1,676)Withholding taxes related to Interests and dividends - (5)Negative goodwill recognised in "Share of results of joint ventures and associates" 397 509 Other operating expenses (3,395) (456)Others (98) 12
Net Profit before interest and results from associated undertakings, as per Financial Statements 91,999 99,965
Net financial costs - segments 26,773 24,896 Equity method adjustment (1) (16,985) (17,604)Proportional method adjustment (2) 1,592 1,062 Withholding taxes related to Interests and dividends - (5)Other operating expenses (3,395) (456)Others 26 51
(-) Finance income (-) Finance expenses as per Financial Statements 8,011 7,944
Corporate tax + Deferred Tax - segments (66,800) (46,329)Equity method adjustment (1) 51,883 28,317 Proportional method adjustment (2) (5,107) (8,083)Others 11 -
Income tax as per Financial Statements (20,013) (26,095)
(1) The reconciliation with the statutory accounts is presented on the following tables.
(1) Joint ventures and associates are included in the statutory consolidated accounts by the equity method and in the management accounts by the proportionate method.(2) The companies owned by the group by less than 100% and more that 50% are included in the management accounts by the proportionate method and in the statutory consolidated accounts are included by the full consolidation method.

73
Statement of financial position
The average number of employees in 2018 and 2017, by business segment is detailed as follows:
2018 2017
Investment properties - segments 2,096,523 2,046,066 Equity method adjustment (1) (1,390,962) (1,469,948)Proportional method adjustment (2) 290,523 176,935 Goodwill (3) (13,239) (12,629)
Investment properties as per Financial Statements 982,845 740,424
Properties under development - segments 114,229 71,967 Equity method adjustment (1) (91,747) (30,614)Proportional method adjustment (2) 137 102 Goodwill (3) (6,952) -
Investment properties under development as per Financial Statements 15,667 41,455
Cash and cash equivalents - segments 260,358 143,507 Equity method adjustment (1) (64,567) (91,084)Proportional method adjustment (2) 116,874 15,722 Others - -
Cash and cash equivalents as per Financial Statements 312,665 68,145
Bank loans - segments 842,510 779,563 Equity method adjustment (1) (435,068) (459,933)Proportional method adjustment (2) 82,690 52,362 Financing costs (4,108) (2,193)
Debt - current and non-current as per Financial Statements 486,024 369,799
2018 2017
Investment portfolio 26 23Developments 22 19Services 448 450Non allocated 242 237
737 729
(1) Joint ventures and associates are included in the statutory consolidated accounts by the equity method and in the management accounts by the proportionate method.(2) The companies owned by the group by less than 100% and more that 50% are included in the management accounts by the proportionate method and in the statutory consolidated accounts are included by the full consolidation method.(3) The Investment portfolio segment consider the Goowdill under the caption "Investment Properties" and "Properties under development".

2018 ConsolidatedReport and Accounts
45. INDICATORS RECONCILIATION
In addition to the financial information prepared in accordance with the International Financial Reporting Standards (IFRS) the
Group uses a number of indicators in the analysis of the performance and financial position, which are classified as Alternative
Performance Indicators (APM) in accordance with the guidelines set by the European Securities and Markets Authority (ESMA).
These indicators, together with a reconciliation between the management accounts and the enclosed financial statements
are presented bellow:
Description in the management accounts
Amount in the management accounts
Statutory accounts descriptoion (Consolidated statements of profit or loss and Note 44-Segment information (*))
Reconciliation withstatutory accounts
2018 2017 2018 2017
Consolidated statements of profit or loss:
(+) Services rendered 156,735 173,356(+) Other operating revenue 32,554 3,659(-) External supplies and services -61,422 -78,210(-) Personnel expenses -50,170 -48,218(-) Depreciation and amortisation -928 -1,036(-) Provisions and impairment -1,743 -1,794(-) Other operating expenses -7,157 -6,947Note 44 (*):(+) Equity method adjustment (1) 73,156 70,637(-) Proportional method adjustment (2) -12,441 -10,158(+) Other indirect income / costs (4) -24,019 3,526(+) Withholding taxes related to Interests and dividends (4) 0 5
(-) Negative goodwill recognised in "Share of results of joint ventures and associates" in the Consolidated statements of profit or loss
-397 -509
(+) Other operating expenses (4) 3,493 444EBIT Total 107,661 104,755 107,661 104,755
Consolidated statements of profit or loss:
(+) Income tax 20,013 26,095Note 44 (*):
Current tax (3) 14,339 15,239 (+) Equity method adjustment (1) 51,883 28,317Deferred tax 52,461 31,090 (-) Proportional method adjustment (2) -5,107 -8,083
(+) Others 11 0Current tax + Deferred tax 66,800 46,329 66,800 46,329
Consolidated statements of profit or loss:
(-) Finance income -7,309 -6,876(+) Finance expenses 15,320 14,820Adjustments:(+) Equity method adjustment (1) 16,985 17,604(-) Proportional method adjustment (2) -1,592 -1,062(+) Withholding taxes related to Interests and dividends (4) 0 5(+) Other operating expenses (4) 3,493 444(+) Others (5) -125 -39
Net financial costs 26,773 24,896 26,772 24,896
2018 2017
Interest cover ratio (*) 3.5 3.6
(*) Interest cover ratio = (EBIT total - Current tax) / Net financial costs
(*) Adjustaments presented in note 44.(1) Joint ventures and associates are included in the statutory consolidated accounts by the equity method and in the management accounts by the proportionate method.(2) The companies owned by the group by less than 100% and more that 50% are included in the management accounts by the proportionate method and in the statutory consolidated accounts are included by the full consolidation method.(3) In the statutory accounts the item "Income tax" includes the deferred tax.(4) Amount included in item "Other operating expenses" in the Consolidated statements of profit or loss.(5) Amount included in item "Share of results of joint ventures and associates" in the Consolidated statements of profit or loss.

75
Description in the management accounts
Amount in the management accounts
Statutory accounts descriptoion (Consolidated statements of profit or loss and Note 44-Segment information (*))
Reconciliation withstatutory accounts
31.12.18 31.12.17 31.12.18 31.12.17
Consolidated statements of financial position:
(+) Bank loans - net of current portion 342,448 198,186(+) Debentures loans - net of current portion 99,181 0(+) Current portion of long term bank loans 44,395 71,763(+) Current portion of long term debentures loans 0 74,850(+) Short term bank loans and other borrowings 0 25,000Note 44 (*):(+) Equity method adjustment (1) 435,068 459,933(-) Proportional method adjustment (2) -82,690 -52,362(+) Financing costs (4) 4,108 2,193
Bank loans 842,510 779,563 842,510 779,563
Consolidated statements of financial position:
(-) Cash and bank deposits 312,665 68,145Adjustments:(+) Equity method adjustment (1) 64,567 91,084(-) Proportional method adjustment (2) -116,874 -15,722
Cash & Equivalents 260,358 143,507 260,358 143,507
Consolidated statements of financial position:
(+) Propriedades de investimento 982,845 740,424Nota dos segmentos (*):(+) Ajustamento MEP (1) 1,390,962 1,469,948(-) Ajustamento método proporcional (2) -290,523 -176,935(+) Goodwill (3) 13,239 12,629
Investment properties 2,096,523 2,046,066 2,096,523 2,046,066
Consolidated statements of financial position:
(+) Investment properties under development 15,667 41,455Adjustments:(+) Equity method adjustment (1) 91,747 30,614(-) Proportional method adjustment (2) -137 -102(+) Goodwill (3) 6,952 0
Properties under development 114,229 71,967 114,229 71,967
31.12.2018 31.12.2017
Debt to assets ratio (*) 26.5% 30.2%
(*) Debt to assets ratio = (Bank loans-Cash & Equivalents) /(Investment properties+Properties under development - Goodwill)
(*) Adjustments presented in note 44.(1) Joint ventures and associates are included in the statutory consolidated accounts by the equity method and in the management accounts by the proportionate method.(2) The companies owned by the group by less than 100% and more that 50% are included in the management accounts by the proportionate method and in the statutory consolidated accounts are included by the full consolidation method.(3) In the management accounts the Goodwill is included in the lines "Investment properties" and "Properties under development". In the Consolidated statements of financial position the amount of kEuro 9,892 is presented in the line "Goodwill" (2017:kEuro 4,274) an the amount of kEuro 10,298 in "Investments in joint ventures and associates" (2017: kEuro 8,355).(4) Amount inluded in the lines "Bank loans - net of current portion", "Debentures loans - net of current portion", "Current portion of long term bank loans" and "Current portion of long term debentures loans" of the Consolidated stetatements of financial position.

2018 ConsolidatedReport and Accounts
46. SUBSEQUENT EVENTS
In January, the Group sold its stake (9%) in the associate Loop5 Shopping Centre GmbH & Co KG (“Loop 5”) for kEuro 10,281.
In January, the Group acquired for kEuro 2,000, a 50% stake in Balmain Asset Management Group’s Central European platform,
whom is operating for over 15 years in Poland.
47. APPROVAL OF THE FINANCIAL STATEMENTS
The accompanying financial statements were approved by the Board of Directors and authorised for issuance on the 14 March
of 2019. However, these financial statements are still depending on the approval by the Shareholders General Meeting, in
accordance with business legislation prevailing in Portugal.
48. NOTE ADDED FOR TRANSLATION
This is a translation of financial statements originally issued in Portuguese in accordance with Portuguese Statutory
requirements, some of which may not conform to or be required in other countries. In the event of discrepancies, the
Portuguese language version prevails.
The Board of Directors

77
Notes 31 December 2018 31 December 2017
ASSETS
NON-CURRENT ASSETS:Investments in group companies and associated companies 3 1,148,979 1,148,979 Suplementary capital granted 4 49,434 49,434
Total non-current assets 1,198,413 1,198,413
CURRENT ASSETS:Loans to Group companies 5 35,031 41,040 Other receivables 6 6,111 7,010 State and other public entities 7 975 822 Other current assets 8 915 873 Cash and Cash Equivalents 9 36,122 10,710
Total current assets 79,154 60,455
Total assets 1,277,567 1,258,868
EQUITY AND LIABILITIESEQUITY:
Share capital 10 162,245 162,245 Legal Reserve 57,329 57,329 Other reserves 168,026 217,772 Retained earnings 516,787 524,007 Net Profit for the period (3,705) (7,221)
Total equity 900,682 954,132
LIABILITIES:NON CURRENT LIABILITIES:
Bank loans - net of current portion 12 34,942 - Debentures loans - net of current portion 11 99,331 -
Total non current liabilities 134,273 -
CURRENT LIABILITIES:Current portion of long term bank loans 12 (18) 44,947 Current portion of long term debentures loans 11 (179) 74,908 Loans from Group companies 13 237,968 178,202 Other Payables 15 409 350 State and other public entities 7 134 115 Other current liabilities 16 4,298 6,214
Total current liabilities 242,612 304,736
Total equity and liabilities 1,277,567 1,258,868
Sonae Sierra, SGPS, SA
Statements of financial position as of 31 december 2018 and 2017
(Translation of the statement of financial position originally issued in Portuguese - Note 26)(Amounts stated in thousands of Euro)
The accompanying notes form an integral part of these statements of financial position as of 31 December 2018.
The Board of directors

2018 ConsolidatedReport and Accounts
Notes 2018 2017
Other operating revenue 17 6 2 6 2
External supplies and services (280) (215)Personnel expenses (26) - Other operating expenses 18 (36) (21)
(342) (236)Net operating profit (336) (234)
Financial income 19 1,909 1,692 Financial expenses 19 (10,524) (12,108)Gains and losses on investments 19 3,696 1,718
Profit before income tax (5,255) (8,933)
Income tax 20 1,550 1,712 Profit after income tax (3,705) (7,221)
Net profit for the period (3,705) (7,221)
Sonae Sierra, SGPS, SA
Statements of profit and loss for the years ended 31 december 2018 and 2017
(Translation of the statement of financial position originally issued in Portuguese - Note 26)(Amounts stated in thousands of Euro)
The accompanying notes form an integral part of these statement of profit or loss for the year ended 31 December 2018.
The Board of directors

79
Notes 2018 2017
Net profit for the period (3,705) (7,221)Others - -
Other comprehensive income of the period - -
Total comprehensive income for the period (3,705) (7,221)
Sonae Sierra, SGPS, SA
Statements of comprehensive income for the years ended 31 december 2018 and 2017
(Translation of the statement of financial position originally issued in Portuguese - Note 26)(Amounts stated in thousands of Euro)
The accompanying notes form an integral part of these statements of compehensice income for the year ended 31 December 2018.
The Board of directors

2018 ConsolidatedReport and Accounts
Sonae Sierra, SGPS, SA
Statements of changes in equity for the years ended 31 december 2018 and 2017
(Translation of the statement of financial position originally issued in Portuguese - Note 26)(Amounts stated in thousands of Euro)
The accompanying notes form an integral part of these statement of changes in equity for the year ended 31 December 2018..
The Board of directors
Attributable to Equity Holders of Sonae SierraReserves
Notes Sharecapital
Legalreserve
Otherreserves
Retainedearnings Net profit Total
Balance as of 1 January 2017 162,245 57,329 292,554 529,469 (5,462) 1,036,135
Appropriation of net profit for 2016:Appropriation of net profit for 2016 - - - (5,462) 5,462 -
Dividends distributed - - (74,782) - - (74,782)Net loss for period ended 31 December 2017 - - - - (7,221) (7,221)
Balance as of 31 December 2017 162,245 57,329 217,772 524,007 (7,221) 954,132
Balance as of 1 January 2018 10 162,245 57,329 217,772 524,007 (7,221) 954,132
Appropriation of net profit for 2017:Appropriation of net profit for 2017 10 - - - (7,221) 7,221 -
Dividends distributed - - (49,746) - (49,746)Net loss for period ended 31 December 2018 - - - - (3,705) (3,705)
Balance as of 31 December 2018 162,245 57,329 168,026 516,787 (3,705) 900,682

81
Sonae Sierra, SGPS, SA
Statements of cash flows for the years ended 31 december 2018 and 2017
(Translation of the statement of financial position originally issued in Portuguese - Note 26)(Amounts stated in thousands of Euro)
The accompanying notes form an integral part of these statements of cash flows for the year ended 31 December 2018.
The Board of directors
Notes 2018 2017
OPERATING ACTIVITIES:Paid to suppliers (323) (252)Paid to personnel (85) (129)
Flows from operations (407) (381)
(Payments)/receipts of income tax (1,540) (641)Other (payments)/receipts relating to operating activities 807 (496)
Flows from operating activities [1] 1,940 (236)
INVESTING ACTIVITIES:
Receipts relating to:Interest income 1,887 1,144 Dividends 19 3,696 1,718 Loans granted 5 6,009 11,592 - 2,862
Payments relating to:Loans granted - - (27,002) (27,002)
Flows from investing activities [2] 11,592 (24,140)
FINANCING ACTIVITIES:
Receipts relating to:Bank loans 12 60,000 25,000 Debentures loans 11 100,000 - - Loans obtained - others 13 59,766 219,766 118,667 143,667
Payments relating to:Interest expenses (13,139) (9,307)Dividends 10 (49,746) (74,782)Bank loans 12 (70,000) (25,000)Debentures loans 11 (75,000) - - Loans obtained - others - (207,884) - (109,089)
Flows from financing activities [3] 11,882 34,578
Variation in cash and cash equivalents [4]=[1]+[2]+[3] 25,412 10,202
Cash and cash equivalents at the beginning of the year 9 10,710 508
Cash and cash equivalents at the end of the year 9 36,122 10,710

2018 ConsolidatedReport and Accounts
1. INTRODUCTION
SONAE SIERRA, S.G.P.S., S.A. (“the Company” or “Sonae Sierra”), has its head office in Lugar do Espido, Via Norte, Apartado
1197, 4471-909 Maia – Portugal, and its activity is holding and finance, group of companies operating in the management,
development and investment of shopping centres business.
The financial statements are presented in Euro, the functional currency of the Company, as this is the currency of the primary
economic environment in which the Company operates.
The Company has also prepared consolidated financial statements, which are separately presented and properly show the
financial position, the results and comprehensive income of its operations, changes in equity and cash flows of the Sonae
Sierra Group.
2. PRINCIPAL ACCOUNTING POLICIES
The principal accounting policies adopted in preparing the accompanying financial statements are as follows:
2.1. Basis of preparation
The accompanying financial statements have been prepared according to the International Financial Report Standards
(“IFRS”) and approved by the European Union, applicable to economic years beginning on 1 January 2018. These correspond
to the International Financial Reporting Standards (“IFRS”) issued by the International Accounting Standards Board (“IASB”)
and interpretations issued by the International Financial Reporting Interpretations Committee (“IFRIC”) or by the previous
Standing Interpretations Committee (“SIC”) and approved by the European Union.
The accompanying financial statements have been prepared on a going concern basis and in accordance with the accrual basis
of accounting, maintained according to International Financial Reporting Standards, as approved by the European Union.
New accounting standards and their impact in these financial statements
Until the date of approval of these financial statements, the European Union endorsed the following standards, interpretations,
amendments and revisions with mandatory application to the economic year beginning on 1 January 2018:
Sonae Sierra, SGPS, SA
Notes to the financial statements as of 31 December 2018
(Translation of notes originally issued in Portuguese – Note 26)(Amounts stated in thousands of Euro - kEuro)
Applicable for financial years
beginning on / afterIFRIC 22 Foreign Currency Transactions and Advance Consideration 01-Jan-18Amendments to IAS 40: Transfers of Investment Property 01-Jan-18Amendments to IFRS 2: Classification and Measurement of Share-based Payment Transactions 01-Jan-18Annual Improvements to IFRS Standards 2014-2016 Cycle 01-Jan-18IFRS 9 Financial Instruments 01-Jan-18IFRS 15 Revenue from Contracts with Customers 01-Jan-18Clarifications to IFRS 15 Revenue from contracts with customers 01-Jan-18Amendments to IFRS 4: Applying IFRS 9 - Financial instruments with IFRS 4 - Insurance contracts 01-Jan-18

83
The Company has applied these amendments for the first time in 2018 and there is no significant impact on the accounts
resulting from their application. Following the adoption of the standards IFRS 9 and IFRS 15, the impacts in the accounts can
be detailed as follows:
(i) IFRS 9 – Financial InstrumentsThe Company has adopted as of January 1, 2018 the new standard IFRS 9, which replaces the previous IAS 39. Regarding the
transition from IAS 39 to IFRS 9, the Company applied the simplified approach model, meaning that the Company did not
applied IFRS 9 retrospectively.
Based on an analysis of the Company’s financial assets and liabilities, the Board of Directors assessed the impact of the
adoption of IFRS 9 on these financial statements as follows:
Classification and measurement:
IFRS 9 introduced a model for the classification of financial assets based on the business model for managing the financial
assets ("business model test") and their contractual cash flow characteristics ("SPPI test").
The application of IFRS 9 did not change the fair value hedge and cash flow hedge classification.
The measurement and classification of all financial instruments continued on the same basis as previously under IAS 39.
Therefore, the captions accounts receivable, accounts payable and loans granted/obtained continued to be measured at
amortized cost under IFRS 9.
Impairment
A new methodology for the calculation and reporting of other receivables impairment losses was introduced, changing the
method from the incurred loss to the expected credit loss model (ECL), where the credit risk assessment is considered at the
initial recognition.
The Board of Directors concluded that the application of the expected credit loss model resulted in the early recognition
of credit losses for the corresponding assets in an immaterial amount, charged in the profit and loss of the year ended 31
December 2018.
(ii) IFRS 15 – Revenue from Contracts with customersThe Company has adopted as of January 1, 2018 the new standard IFRS 15, which replaces the previous IAS 18.
Revenue relates mainly to dividends and interest when they occur or when the Company has the right and has performed its
obligations. The moment of recognition of the performance obligation occurs at a specific moment in time, which does not
differ from the previous practice under IAS 18. There are no other significant performance obligations to be fulfilled thereafter.
The Board of Directors concluded that the application of IFRS 15 does not have a material impact on the Company’s financial
position or financial performance.
Up to the date of approval of these financial statements, the following standards and interpretations, with mandatory
application in future reporting dates, have been endorsed by the European Union:
Applicable for financial years
beginning on / afterIFRIC 23 Uncertainty over Income Tax Treatments 01-Jan-19IFRS 16 Leases 01-Jan-19Amendments to IFRS 9: Prepayment Features with Negative Compensation 01-Jan-19

2018 ConsolidatedReport and Accounts
These standards and amendments, despite being endorsed by the European Union, have not been adopted by the Company
in 2018 because their application is not yet mandatory. Nevertheless, no significant impacts are expected from its future
adoption.
The following standards and interpretations were issued by the IASB but have not yet been endorsed by the European Union:
None of these standards were adopted by the Company as they were not yet endorsed by the European Union. Anyway, it is
not anticipated any significant impact on the accompanying financial statements derived from the future adoption of these
standards.
2.2. Financial Investments
Financial investments in subsidiaries are recorded at acquisition cost less impairment losses. Impairment is assessed by
comparing the cost of the investments with the corresponding Net Asset Value of the subsidiary company.
2.3. Financial assets and liabilities
Assets and liabilities are recognised in the statement of financial position when the Company becomes part of the corresponding
contract.
Financial assets are initially recorded at their acquisition value, which is the fair value, including transaction costs, except for
financial assets measured at fair value through profit and loss, where the transaction costs are immediately recorded in the
profit and loss statement.
The Company derecognises financial assets when: (i) the contractual rights to cash flows expire; (ii) it transfers to another
entity the significant risks and benefits associated with ownership of the property or; (iii) despite having retained some, but
not substantially the significant risks and benefits, has transferred the control over them.
The Company derecognises financial liabilities only when the corresponding obligation is settled, cancelled or expires.
Financial assets are classified into the following categories:
• those to be measured subsequently at fair value (either through other comprehensive income (FVTOCI) or through profit
or loss (FVTPL), and
• those to be measured at amortised cost.
Financial assets measured subsequently at fair value include mainly derivative financial instruments. The subsequent
measurement of these financial assets is carried at fair value and recorded in the statement of changes in equity, if they
qualify for hedge accounting purposes. If they do not qualify for hedge accounting purposes, the fair value of these financial
assets is recorded in the statement of profit or loss.
Applicable for financial years
beginning on / afterIFRS 17 - Insurance Contracts 01-Jan-21Annual Improvements to IFRS Standards 2015-2017 Cycle 01-Jan-19Amendments to IAS 19: Plan Amendment, Curtailment or Settlement 01-Jan-19Amendments to IAS 28: Long-term investments in associates and loint ventures 01-Jan-19Amendments to References to the Conceptual Framework in IFRS Standards 01-Jan-20Amendment to IFRS 3 Business Combinations 01-Jan-20Amendments to IAS 1 and IAS 8: Definition of Material 01-Jan-20

85
Financial assets subsequently measured at amortised cost are those generated during normal operations of the Company, for
which there is no intention to negotiate. Classified in this category are the accounts receivable and other receivables, loans
to third parties and bank deposits. The subsequent measurement of these financial assets is carried at amortised cost in
accordance with the effective interest method.
Financial liabilities are classified into the following categories:
• those to be measured subsequently at fair value through profit or loss (FVTPL), and
• those to be measured at amortised cost.
Financial liabilities measured at fair value include mainly derivative financial instruments. The subsequent measurement of
these financial liabilities are carried at fair value and recorded in the statement of changes in equity if they qualify for hedge
accounting purposes. If they do not qualify for hedge accounting purposes, the fair value of these financial liabilities is recorded
in the statement of profit or loss.
Other financial liabilities correspond to other financial liabilities which are not classified in the former category. In this category
are classified bank loans and other current liabilities, including shareholders and accounts payable and other payables. The
subsequent measurement of these financial liabilities is carried at amortised cost, in accordance with the effective interest
method.
a) Loans granted to Group companies
Loans granted to Group companies are recorded as assets at amortised cost which usually do not differ from the nominal value.
Financial income with interest received is recorded in the profit and loss statement on an accruals basis. The amounts due and
not received at the statement of financial position date are recorded under the caption "Other current assets".
b) Trade and other receivables
Accounts receivable and other receivables are recorded at amortised cost less any eventual impairment losses. Usually, the
amortised cost of these financial assets does not usually differ from its nominal value.
c) Loans
Loans are stated as liabilities at amortised cost.
Any expenses incurred in obtaining such financing, usually paid in advance on issue, namely the bank fees and stamp duty as
well as interest expenses and similar expenses, are recognised using the effective interest method in the results of the year,
over lifetime of such financing. These expenses incurred are deducted from the caption “Bank loans”.
Financial expenses with interest expenses and similar expenses (namely stamp tax), are recorded in the statement of profit
and loss on an accrual basis of accounting. The amounts due and not paid at the statement of financial position date are
recorded under the caption “Other current liabilities”.
d) Trade and other payables
Accounts payable and other payables are stated at amortised cost. Usually, the amortised cost of these liabilities does not
differ from its nominal value.
e) Cash and cash equivalents
The amounts under caption "Cash and cash equivalents" includes cash on hand, cash at banks on demand and other treasury
applications which mature in less than three months that are subject to insignificant risk of change in value.

2018 ConsolidatedReport and Accounts
These assets are measured at amortised cost. Usually, the amortised cost of these financial assets does not differ from its
nominal value.
For purposes of the statement of cash flows, “Cash and cash equivalents” also include bank overdrafts, which are included in
the statement of financial position under caption “Other loans”.
2.4. Provisions
Provisions are recognised when, and only when, the Company has an obligation (legal or implicit) resulting from a past event
and it is probable that an outflow of resources will be required to settle the obligation, and a reliable estimate can be made of
the amount of the obligation. Provisions are reviewed and adjusted at the reporting date in order to reflect the best estimate
as of that date.
Provisions for restructuring expenses are recognised by the Company when there is a formal and detailed restructuring plan
and that such plan has been communicated to the involved parties.
2.5. Contingent assets and liabilities
Contingent liabilities are not recognized in the financial statements. They are disclosed in the notes (Note 23), unless the
possibility of an outflow of resources affecting economic benefits is remote.
A contingent asset is not recognized in the financial statements, but disclosed in the notes when an inflow of economic benefits
is probable.
2.6. Income tax
Income tax represents the sum of the tax based on the taxable results of the Company and the deferred taxes.
Current income tax is determined based on the taxable result of the Company (which are different from accounting results), in
accordance with the tax rules in force where its head office is located.
Deferred taxes are calculated using the financial position liability method, reflecting the net tax effects of temporary
differences between the carrying amounts of assets and liabilities for financial reporting purposes and the amounts used for
income tax purposes.
Deferred tax assets and liabilities are not recognised when the corresponding temporary differences arise from goodwill or
from the initial recognition of assets and liabilities other than in a business combination.
Deferred tax assets and liabilities are calculated and evaluated annually at the tax rates expected to apply to the period when
the asset is realized or the liability is settled, based on tax rates (and tax laws) that have been enacted or substantially issued
at the statement of financial position date.
Deferred tax assets are recognised only when it is probable that sufficient taxable profits will be available against which the
deferred tax assets can be utilised. At the statement of financial position date, a review is made of the deferred tax assets and
they are reduced whenever their future use is no longer probable.
Deferred tax assets and liabilities are recorded in the statement of profit and loss, except if they relate to items directly
recorded in equity captions. In these situations the corresponding deferred tax is also recorded under the same caption.

87
2.7. Statement of financial position classification
Assets and liabilities due in more than one year from the date of the statement of financial position are classified as non-
current assets and liabilities, respectively.
2.8. Revenue recognition and accrual basis
The dividends are recognised as gains in the year they are assigned by the shareholders.
The income and expenses are recognised in the year to which they relate, regardless of the date of payment or receipt (accrual
basis of accounting). The income and expenses for which actual amounts are not known are estimated.
Under the captions "Other current assets" and "Other current liabilities” are recorded income and expenses attributable to
the current year, which settlement or receipt will only occur in future years, as well as amounts paid and received that have
occurred on the date of the statement of financial position, but which relate to future periods, and that will be charged to the
profit and loss of the corresponding year.
2.9. Balances and transactions expressed in foreign currency
Transactions in currencies other than Euro are recorded at the exchange rates prevailing on the transaction date.
At each reporting date, all monetary assets and liabilities expressed in foreign currencies are translated to Euro using the
closing exchange rates as of that date.
Exchange gains or losses, arising from differences between exchange rates effective at the date of transaction and those
prevailing at the date of collection, payment or at the reporting date, are recorded as income or expenses in the statement of
profit or loss.
2.10. Risk management policies
The Group’s activities expose it to a variety of financial risks: market risk (including currency risk, interest rate risk and price
risk), credit risk and liquidity risk. The Group’s overall risk management programme focuses on the unpredictability of financial
markets and seeks to minimise potential adverse effects on the Group’s financial performance.
Risk management is carried out by a central treasury department of the Group Sonae Sierra, under policies approved by the
Board of Directors. The Board provides written principles for overall risk management, as well as written policies covering
specific areas, such as foreign exchange risk, interest rate risk, and credit risk.
a) Foreign exchange risk
The activity of the Company is developed inside Portugal and consequently the majority of the company's transactions are
maintained in the same currency of the country. The policy to cover this specific risk is to avoid if possible the contracting of
services in foreign currency.
b) Liquidity risk
The needs of treasury are managed by the financial department of Sonae Sierra which with an opportune and adequate form
manages the surplus and deficits of liquidity of each company of the Group. The occasional needs of liquidity are covered by
an adequate control of the accounts receivables and by the maintenance of adequate limits of credit settled by the Company
with banking entities.

2018 ConsolidatedReport and Accounts
c) Interest rate risk
The Company’s income and operating cashflows are influenced by changes in market interest rates, since its cash and cash
equivalents and intragroup financing granted are dependent on the evolution of the interest rates in Euro which, historically,
have little volatility.
On long-term financing, and as a way to mitigate the changes in the long-term interest rates, the Company’s contracts, in
some cases, hedge instruments (“swaps”, “zero cost collars” or “caps”).
Interest rate sensitivity analysis:
The sensitivity analysis below has been determined based on the exposure to interest rates for both derivatives and non-
derivative instruments in place during the reporting period. For floating rate assets and liabilities, the analysis is prepared
based on the following assumptions:
• Changes in market interest rates affect the interest income or expense of floating rate interest financial instruments
and, in the case of fixed rates that were contracted during the period of analysis, changes in the interest rates also
affect the latter;
• Changes in market interest rates only affect interest income or expense in relation to financial instruments with fixed
interests rates if these are recognize at their fair value. As such, all financial instruments with fixed interest rates that are
carried at amortised cost are not subject to interest rate risk, as defined in IFRS 7;
• In the case of fair value hedges designed for hedging interest rate risks, when the changes in the fair values of the hedged
item and the hedging instrument attributable to interest rate movements are offset almost completely in the income
statement in the same period, these financial instruments are also not exposed to interest rate risk;
• Changes in market interest rates affect the fair value of derivatives designated as hedging instruments;
• The fair value of derivative financial instruments (“swaps”, “zero cost collars” or “caps”) and other financial assets and
liabilities is estimated by discounting the future cash flows to their net present values, using appropriate market rates
prevailing at yearend and assuming a parallel shift in yield curves;
• For the purposes of this sensitivity analysis, such analysis is performed based on all financial instruments outstanding
during the relevant year.
Sensitivity analyses are performed by changing one variable while maintaining all other variables unchanged. Nonetheless,
this is a restrictive and highly unlikely assumption, since variables tend to be correlated.
If interest rates had been 75 basis points higher and all other variables were held constant, assumptions unlikely occur due to
interest rates correlation with other variables, the impact in the Company’s net profit and equity would be the following:
(1) This is mainly attributable to the Company’s exposure to interest rates on its variable rate borrowings.
As of 31 December 2018, and 2017 the interest rate sensitive analysis was not prepared considering a decrease of 25 basis
points, because Euribor in 2018 and 2017 is lower than 0.25%.
In management’s opinion, the sensitivity analysis is unrepresentative of the inherent interest rate risk and the year-end
exposure may not reflect the exposure during the year, due to the repayments made.
2018 2017
+75 b.p. +75 b.p.Net Profit (1) (1,482) (1,103)

89
2.11. Judgments and estimates
In the preparation of the accompanying financial statements estimates were used which affecting the assets and liabilities and
also the amounts booked as income and expenses during the reporting period.
The estimates were calculated using the best information available, at the date of approval of the financial statements, of
the events and transactions in course and of the experience from current and/or past events. However, events may occur
in subsequent periods that were not anticipated as of the date of these statements and, consequently were not included in
those estimates. Changes in the estimates after the closing of the consolidated financial statements will be booked on the
subsequent year, as defined in IAS 8.
The main assumptions used by the Company on its estimates are disclosed on the corresponding note.
2.12. Subsequent Events
Events occurred after the reporting date that provide additional information about conditions that existed at these statements
of financial position date (adjusting events) are reflected in financial statements. Events occurred after the reporting date that
provide information on conditions that occur after the reporting date (non-adjusting events) are disclosed in the financial
statements, if materially significant.
3. INVESTMENTS IN GROUP COMPANIES
As of 31 December 2018 and 2017 the Company held the following participations in group companies:
4. SUPPLEMENTARY CAPITAL GRANTED
As of 31 December 2018 and 2017 supplementary capital granted was made up as follows:
Percentage of share
capital heldEquity Net Profit Book value Book value
Company 31.12.18 31.12.17
Sierra Developments, SGPS, S.A. 100.00% 1,155,125 1,926 1,142,429 1,142,429
Sierra Management, SGPS, S.A. 100.00% 7,864 243 6,550 6,550
1,148,979 1,148,979
31.12.18 31.12.17
Sierra Developments, SGPS, S.A. 49,434 49,434 49,434 49,434

2018 ConsolidatedReport and Accounts
5. LOANS TO GROUP COMPANIESAs of 31 December 2018 and 2017 loans to group companies was made up as follows:
6. OTHER RECEIVABLES
At 31 December 2018 and 2017 other receivables was made up as follows:
The amount of kEuro 3,707 relates to the payment made in 2013 by the Company within the Special Tax Debts Payment
Regime (“RERD”) established by the Portuguese government in the law approved in October 2013 (Law 151-A/2013) by which
the entities that pay the tax notifications will be exempt of the payment of interests and penalties; this amount relates to
corrections of the 2005 CIT due to: (i) non-deductible interest expenses amounting kEuro 378; and (ii) corrections concerning
the price adjustment related with the sale of shares of Cascaishopping in 1996 amounting to kEuro 3,329. The Company
contested the tax notifications received and did not record any impairment loss to face eventual losses on those amounts, as
the Board of Directors believes that the result will be favourable to the Company (Note 23).
The ageing of the other receivables is as follows:
7. STATE AND OTHER PUBLIC ENTITIES
According to current legislation, the fiscal declarations of Portuguese companies are subject to a revision and correction by the
tax authorities within the period of four years, exception made when fiscal losses have occurred, fiscal incentives have been
conceded or tax auditing or claims are in course. In those cases, depending on circumstances, the due dates can be extended or
suspended. Because of that the fiscal declarations of the Portuguese companies of the years 2015 until 2018 can be changed.
The Board of Directors considers that any eventual modification to the fiscal declarations will not have a significant impact on
the financial statements as of 31 December 2018.
31.12.18 31.12.17
Sierra Developments, SGPS, S.A. 35,031 41,040 35,031 41,040
31.12.18 31.12.17Tax consolidation Regime (Note7):
Sierra Portugal, S.A. 1,064 1,297 Sierra Investments, SGPS, S.A. 1,164 901 Sierra Management, SGPS, S.A. 67 95 Paracentro - Gestão de Galerias Comerciais S.A. 68 72 ARP Alverca Retail Park, S.A 10 -
Other debtors: Parklake Shopping, S.A. 2 18 Others 6 897
Tax to be recovered (amount paid under tax debts exceptional payment regime - "RERD") 3,707 3,707 Others claimed taxes 23 23
6,111 7,010
31.12.18 31.12.17Not due 2,396 2,388 0-90 days 8 915 + 360 days 3,707 3,707
6,111 7,010

91
Under the terms of Article 88 of the Corporate Income Tax Code, the companies are subject to autonomous taxes on a series
of charges of the rates established in this article.
The Company is taxed for income tax purposes under the tax consolidation regime ("Regime Especial de Tributação dos
Grupos de Sociedades” - RETGS), being the consolidated taxable income of the companies included in it, calculated at the
level of Sonae Sierra as “mother company” of the group. Anyway, each company included in RETGS computes and records at
its individual level its separate estimate of current income tax by credit or debit of an account receivable from or payable to
Sonae Sierra.
The companies included in the RETGS are the following:
• ARP Alverca Retail Park, S.A.,
• CCCB Caldas da Rainha - Centro Comercial, S.A.,
• Paracentro - Gestão de Galerias Comerciais, S.A.,
• Parque de Famalicão, Empreendimentos Imobiliários, S.A.,
• Sierra Developments SGPS, S.A.,
• Sierra Investments SGPS, S.A.,
• Sierra Management SGPS, S.A. and
• Sierra Portugal, S.A..
As of 31 December 2018 and 2017 state and other public entities was made up as follows:
Income tax as of 31 December 2018 is detailed as follows:
31.12.18 Estimate of current income tax - Company (Note 20) (1,580) Estimate of current income tax - RETGS (Notes 6 and 15) 1,974 Withholding taxes / Payments on account (260)
134
31.12.18 31.12.17
Asset Liability Asset Liability
Income tax
Tax recoverable from previous years 975 - 822 -
Income tax - 134 - 115
975 134 822 115

2018 ConsolidatedReport and Accounts
8. OTHER CURRENT ASSETS
As of 31 December 2018 and 2017 other current assets was made up as follows:
The amount of kEuro 774, relates to interests receivable on short term loans granted to Sierra Developments, SGPS, S.A..
9. CASH AND CASH EQUIVALENTS
At 31 December 2018 and 2017 cash and cash equivalents was made up as follows:
10. CAPITAL
At 31 December 2018 the share capital was made up of 32,514,000 fully subscribed and paid up ordinary shares of Euro 4.99 each.
The following entities own the share capital at 31 December 2018 and 2017
On 12th September 2018, Sonae SGPS, SA acquired from Grosvenor Investments (Portugal) Sarl an additional interest of 20%
in Sonae Sierra SGPS, SA.
Following the Shareholders General Meeting deliberation, dated 10 April 2018, the net result of 2017 had the following
application:
In the same meeting, the shareholders decided to distribute dividends out of free reserves, amounting to kEuro 49,746. These
dividends were paid on 20 December 2018.
31.12.18 31.12.17Interests on loans granted to group companies:
Sierra Developments, SGPS, S.A. (Note 21) 774 752 Insurance prepayment 141 121
915 873
31.12.18 31.12.17
Bank deposits payable on demand 36,122 10,71036,122 10,710
Retained earnings (7,221)(7,221)
Entity 31.12.18 31.12.17Sonae, SGPS, S.A. 70% 50%Grosvenor Investments, (Portugal), Sarl 30% 50%

93
11. BOND LOAN
As of 31 December 2018 and 2017, bond loan was made up as follows:
On the 25th of January, the Company issued three bond loans in a total of kEuro 100,000 and, on the same date, the previous
bond loan on the amount of kEuro 75,000 was liquidated.
The principal conditions associated to these bond loans are as follows:
“SONAE SIERRA 2018-2025”• 500 bonds: Nominal value: Euro 100,000;
• Maximum term: 7 (seven) years;
• Annual interest rate: the interest rate, which is variable, is indexed to the EURIBOR 6 month’s rate on the second working
day proceeding the interest period (floor 0%), with a spread of 2.35% p.a.;
• Interest Payment: half yearly in arrears, on 25 January and 25 July of each year;
• Reimbursement: five annual reimbursements, after 25 January 2021 (inclusive) until 25 January 2025
• Tax regime: in accordance with the legislation in force in Portugal.
“SONAE SIERRA 2018-2023”
• 250 bonds: Nominal value: Euro 100,000;
• Maximum term: 5 (five) years;
• Annual interest rate: the interest rate, which is variable, is indexed to the EURIBOR 6 month’s rate on the second working
day proceeding the interest period (floor 0%), with a spread of 2.00% p.a.;
• Interest Payment: half yearly in arrears, on 25 January and 25 July of each year;
• Reimbursement: at par, in one payment on 25 January 2025 the payment date of the last coupon;
• Tax regime: in accordance with the legislation in force in Portugal.
“€25,000,000 SONAE SIERRA JANEIRO 2023”
• 250 bonds: Nominal value: Euro 100,000;
• Maximum term: 5 (five) years;
• Annual interest rate: the interest rate, which is variable, is indexed to the EURIBOR 6 month’s rate on the second working
day proceeding the interest period (floor 0%), with a spread of 2.00% p.a.;
• Interest Payment: half yearly in arrears, on 25 January and 25 July of each year;
• Reimbursement: at par, in one payment on 25 January 2025 the payment date of the last coupon;
• Tax regime: in accordance with the legislation in force in Portugal.
31.12.2018 31.12.2017
Used amount Used amount Reimbursement plan
Financing Entity Limit Current Non current Limit Current Non current
Bond loan
Caixa BI 50,000 - 50,000 75,000 75,000 january 2023
Banco BPI 25,000 - 25,000 - january 2023
Novo Banco 25,000 - 25,000 - january 2023
-
Total Bond Loan - 100,000 75,000
Deferred financing costs incurred on the issuance of the bond loan (179) (669) (92)
(179) 99,331 74,908

2018 ConsolidatedReport and Accounts
At 31 December 2018, loans and the respective interests are repayable as follows:
12. BANK LOANS
At 31 December 2018 and 2017 bank loans was made up as follows:
Bank loans bear interests at market interest rates and were contracted in Euro.
13. LOANS FROM GROUP COMPANIES
At 31 December 2018 and 2017 loans from group companies was made up as follows:
The amounts payable refers to loans obtained from group companies for less than one-year period and bear interests at
market interest rates.
31.12.18 31.12.17
Repayment Interest Repayment Interest
N+1 - 2,408 - -
N+2 - 2,415 75,000 2,731
N+3 - 2,291 - -
N+4 - 2,051 - -
N+5 50,000 1,108 - -
>5 50,000 479 - -
100,000 10,752 75,000 2,731
31.12.18 31.12.17
Loans obtained:
Sierra Investments, SGPS, SA 198,045 142,662
Sierra Management SGPS, SA 7,635 11,032
Sierra Spain Shopping Centers Services, S.L. 13,738 10,000
Sierra Portugal, S.A. 18,550 14,258
Paracentro - Gestão Galeria Comercial S.A - 250
237,968 178,202
31.12.2018 31.12.2017
Used amount Used amount
Financing Entity Limit Current Non current Limit Current Non current
Bank loans:
Caixa de Crédito Agricola 10,000 - 10,000 20,000 20,000 -
Facilities: Santander Totta 25,000 - 25,000 35,000 25,000 -
BPI 12,470 - - 12,470 - -
CGD 26,750 - - 26,750 - -
Montepio Geral 20,000 - - 20,000 - -
Novo Banco 5,500 5,500
Santander Totta 10,000 - - - - -
Total Bank loans - 35,000 45,000 -
Deferred financing expenses incurred on the issuance of the bank loans (18) (58) (53) -
(18) 34,942 44,947 -

95
14. RECONCILIATION OF LIABILITIES ARISING FROM FINANCING ACTIVITIES
The table below details changes in Company’s liabilities arising from financing activities, including both cash and non-cash
changes. Liabilities arising from financing activities are those for which cash flows were, or future cash flows will be, classified in
the Company’s statement of cash flows as cash flows from financing activities.
15. OTHER PAYABLES
At 31 December 2018 and 2017 other payables was made up as follows:
The amounts reported above have the following repayment plan:
31.12.18 31.12.17
Tax consolidation regime:
Sierra Portugal, S.A. 117 123
CCCB Caldas da Rainha - Centro Comercial, S.A. 5 6
Paracentro -Gestão Galeria Comercial S.A. 1 9
Sierra Developments, SGPS, S.A. 211 114
Parque de Famalicão, Empreendimentos Imobiliários, S.A. 5 41
Sierra Investments, SGPS, S.A. 59 2
ARP Alverca Retail Park, S.A 2 45
Services rendered:
Sierra Portugal, S.A. - 1
Other 9 9
409 350
31.12.18 31.12.17
Short term:
0-90 days 9 10
90-180 days 400 340
409 350
01.01.18 Financing cash flows 31.12.18
Debentures loans 75,000 25,000 100,000
Bank loans 45,000 (10,000) 35,000
Loans from related parties 178,202 59,766 237,968
298,202 74,766 372,968

2018 ConsolidatedReport and Accounts
16. OTHER CURRENT LIABILITIES
At 31 December 2018 and 2017 other current liabilities was made up as follows:
17. OTHER OPERATING REVENUE
Other operating income for the years ended 31 December 2018 and 2017 is made up as follows:
18. OTHER OPERATING EXPENSES
Other operating expenses for the years ended 31 December 2018 and 2017 are made up as follows:
2018 2017
Recovery of costs 6 2
6 2
2018 2017
VAT 13 11
Stamp duty 1 -
Other 20 10
34 21
31.12.18 31.12.17
Accrual for vacations and vacations bonuses and bonus - 58
Interest payable:
Sierra Investments, SGPS, S.A. 2,605 3,339
Sierra Portugal, S.A. 51 76
Sierra Spain Shopping Centers Services, S.L. 162 215
Sierra Management. SGPS, S.A. 36 112
Paracentro - Gestão Galeria Comercial S.A. - 8
Interest bond loans 967 1,843
Interest bank loans 191 370
Financing costs payable 256 158
Services rendered by third parties 20 26
Committees of guarantees 10 10
4,298 6,214

97
19. NET FINANCIAL RESULTS AND NET INCOME FROM INVESTMENTS
Net financial results are made up as follows:
Gains and losses on investments are made up as follows:
The amount recorded under the caption "Dividends" refers to dividends attributed and received from its subsidiary Sierra
Management, SGPS, S.A..
20. INCOME TAX
Income tax for the years ended 31 December 2018 and 2017 is made up as follows:
The reconciliation between tax expense and the accounting profit multiplied by the applicable tax rate is as follows:
2018 2017
Current income tax (Note 7) (1,580) (1,898)
Correction of current income tax estimate of previous year 30 186
(1,550) (1,712)
2018 2017
Dividends 3,696 1,718
3,696 1,718
2018 2017
Expenses:Interests on loans obtained from group companies (Note 21) 5,804 5,077 Interests on bond loans 2,337 4,220 Interests on overdrafts 497 561 Interests on bank loans 518 608 Stamp duty related to financing 51 73 Bank charges 1,150 1,401 Guarantees 167 168
10,524 12,108 Net financial expenses (8,615) (10,416)
1,909 1,692 Income:
Interest income (Note 21) 1,785 1,144 Other 124 548
1,909 1,692
2018 2017
Profit before income tax (5,254) (8,933)
Dividends (Note 19) (3,696) (1,718)Other 33 28
Taxable profit (8,917) (10,623)
Effect of different income tax rates in other countries - - (8,917) (10,623)
Income tax rate in Portugal 21.0% 21.0%(1,873) (2,231)
Deferred income tax not recognized 1,873 2,231 Regularization of the consolidated tax estimate (1,580) (1,898)Insuficiency of tax estimate 30 186
(1,550) (1,712)

2018 ConsolidatedReport and Accounts
21. RELATED PARTIES
Balances and transactions that existed with related parties, during the years ended 31 December 2018 and 2017, in addition to
the loans conceded to and obtained from the shareholders mentioned in Notes 5 and 13, are detailed as follows:
22. EARNINGS/LOSSES PER SHARE
As of 31 December 2018 and 2017, basic earnings per share correspond to the net profit divided by the weighted average
number of ordinary shares of Sonae Sierra during the year, and was computed as follows:
Balances
Other receivables (Note 6) Other payables (Note 15)Other current assets/liabilities
(Notes 8 and 16)
31.12.18 31.12.17 31.12.18 31.12.17 31.12.18 31.12.17
Sierra Portugal, S.A. 1,064 1,297 117 124 (51) (76)
Sierra Management, SGPS, S.A. 67 95 - - (36) (112)
Sierra Investments, SGPS, S.A. 1,164 901 59 2 (2,605) (3,339)
Paracentro - Gestão de Galerias Comerciais S.A. 68 72 1 9 - (8)
Parklake Shopping, S.A. 2 18 - - - -
Sierra Developments, SGPS, S.A. - - 211 114 774 752
Parque de Famalicão, Empreendimentos Imobiliários, S.A. - - 5 41 - -
CCCB Caldas da Rainha - Centro Comercial, S.A. - - 5 6 - -
ARP Alverca Retail Park, S.A. 10 - 2 46 - -
Sierra Spain Shopping Centers Services, S.L. - - - - (162) (215)
2,375 2,383 399 341 (2,080) (2,998)
Balances
Interest income (Note 19) Interest expense (Note 19)
31.12.18 31.12.17 31.12.18 31.12.17
Sierra Developments, SGPS, S.A. 1,785 1,144 81 28
Sierra Investments, SGPS, S.A. - - 4,520 3,999
Sierra Portugal, S.A. - - 530 258
Sierra Management. SGPS, S.A. - - 324 436
Sierra Spain Shopping Centres Services, S.L. - - 343 347
Paracentro-Gestão de Galerias Comerciais S.A. - - 6 9
1,785 1,144 5,804 5,077
2018 2017
Profit/Losses considered to compute the basic earnings per share
(net profit of the year) (3,705) (7,221)
Number of shares
32,514,000 32,514,000
Earning/Losses per share (Euro)
(0.11) (0.22)

99
23. CONTINGENT LIABILITIES AND BANK GUARANTEES
During the year ended 31 December 2015, the Company was notified by the tax authorities regarding to the deductibility of
the interest incurred with the loans obtained in the year of 2011, in the amount of kEuro 437. The subsidiary Sierra Investments
SGPS, SA provided a guarantee in the amount of kEuro 1,253, to the Portuguese tax administration on behalf of Sonae Sierra
SGPS, SA, in order to suspend the effects of this process.
However, as of 31 December 2012, the Company had been notified by the tax authorities regarding to the deductibility of the
interest incurred with loans obtained in the years 2005, 2007, 2008 and 2009 and 2010 as Mother Company of the RETGS in
the amount of KEuro 10,195. This notification was claimed by the Company. No provision was recorded because the Board of
Directors understands that the risk of this contingency is unlikely.
In what concerns the year 2005, the Company applied to the Tax Debts Exceptional Payment Regime (RERD) and paid
the corresponding tax, which is expected to be reimbursed as the Company expects a favourable decision from the court
regarding the related judicial claim (Note 6). In 20 January 2015 the Company has been notified by the court on the second
favourable decision.
Additionally, as of 31 December 2018 and 2017 the following bank guarantees were granted:
As of 31 December 2018 the amounts recorded under the caption "Tax processes in course", refer to guarantees issued in
favour of “Direcção Geral dos Impostos”, related to the suspension of income tax notifications for the years 1996 (kEuro 1,493)
and of 2013 (kEuro 24).
During the year ended 31 December 2018, the Company granted a guarantee in favour of Património Autónomo Estratégias
Inmobiliárias in the amount of kEuro 1,160 on behalf of its subsidiary Proyecto Cucuta S.A.S., to secure the reimbursement of
refund up to 50% of the advance payments made by Património Autónomo Estratégias Inmobiliárias
During the year ended 31 December 2013, the Company had granted a guarantee to the Portuguese tax administration in the
amount of kEuro 230 on behalf of its subsidiary Sierra Investments, SGPS, SA, to suspending the stamp tax notification for the
year 2010 related to short-term loans granted to the shareholder. In April 2017, and as a result of a favourable decision in the
court at first instance, the withdraw of this guarantee was ordered.
During the year ended December 31, 2012, the subsidiary Sierra Investments SGPS, SA provided a guarantee in the amount of
kEuro 8,316, to the Portuguese tax administration on behalf of Sonae Sierra SGPS, SA, in order to suspend the effects of IRC
process for the year 2008, in the Fiscal Unit, under the Special Taxation Regime for groups of Society "RETGS".
During the year ended December 31, 2013, the subsidiary Sierra Investments SGPS, SA provided three guarantees in the
amount of kEuro 3,192, kEuro 943 and kEuro 163, to the Portuguese tax administration on behalf of Sonae Sierra SGPS, SA, in
order to suspend the effects of IRC processes for the years 2009, 2010 and 2012, in the Fiscal Unit, under the Special Taxation
Regime for groups of Society "RETGS".
2018 2017
Bank guarantees:
Tax processes in course 1,517 1,517 To guarantee the obligation of Proyecto Cucuta S.A.S., of refund up to 50% of the advance payments made by Património Autónomo Estratégias Inmobiliárias 1,160 -
To secure the reimbursement of the first instalment of the preliminary sale and purchase agreement with Carrefour Romania - 2,108
To secure the reimbursement of the second instalment of the preliminary sale and purchase agreement with Carrefour Romania - 8,500
To secure the reimbursement of the third instalment of the preliminary sale and purchase agreement with Carrefour Romania - 5,370
2,677 17,495

2018 ConsolidatedReport and Accounts
During the year ended December 31, 2014, the subsidiary Sierra Investments SGPS, SA provided a guarantee in the amount
of kEuro 182, to the Portuguese tax administration on behalf of Sonae Sierra SGPS, SA, in order to suspend the effects of IRC
process for the year 2013, in the Fiscal Unit, under the Special Taxation Regime for groups of Society "RETGS".
During the year ended December 31, 2015, the subsidiary Sierra Investments SGPS, SA provided a guarantee in the amount
of kEuro 201, to the Portuguese tax administration on behalf of Sonae Sierra SGPS, SA, in order to suspend the effects of IRC
process for the year 2014, in the Fiscal Unit, under the Special Taxation Regime for groups of Society "RETGS".
24. DISCLOSURES REQUIRED BY LEGISLATION
The information on fees charged by the statutory auditor is included in the information disclosed on the consolidated financial
statements.
25. APPROVAL OF THE FINANCIAL STATEMENTS
The accompanying financial statements were approved by the Board of Directors and authorised for issuance on the 14 of
March 2019. However, these financial statements are still depending on the approval by the Shareholders General Meeting, in
accordance with business legislation prevailing in Portugal.
26. NOTE ADDED FOR TRANSLATION
This is a translation of financial statements originally issued in Portuguese in accordance with Portuguese Statutory
requirements, some of which may not conform to or be required in other countries. In the event of discrepancies, the
Portuguese language version prevails.

101
STATUTORY AUDITOR’S REPORT
(Free translation of a report originally issued in Portuguese language: In case of doubt the Portuguese version prevails)
REPORT ON THE AUDIT OF CONSOLIDATED AND SEPARATE FINANCIAL STATEMENTS
Opinion
We have audited the accompanying consolidated and separate financial statements of Sonae Sierra, S.G.P.S., S.A. (“the
Entity”) and its subsidiaries (“the Group”), which comprise the consolidated and separate statement of financial position as of
31 December 2018 (that presents a total of 2,535,450 thousand Euros and 1,277,567 thousand Euros, respectively, and total
equity of 1,772,425 thousand Euros and 900,682 thousand Euros, respectively, including a consolidated net profit attributable
to the shareholders of the parent-company of 110,117 thousand Euros and a separate net loss of 3,705 thousand Euros), the
consolidated and separate statement of profit and loss by nature, the consolidated and separate statement of comprehensive
income, the consolidated and separate statement of changes in equity and the consolidated and separate statement of cash
flows for the year then ended, and the accompanying notes to the consolidated and separate financial statements that include
a summary of the significant accounting principles.
In our opinion, the accompanying consolidated and separate financial statements give a true and fair view, in all material
respects, of the consolidated and separate financial position of Sonae Sierra, S.G.P.S., S.A. as of 31 December 2018 and of its
consolidated and separate financial performance and cash flows for the year then ended in accordance with the International
Financial Reporting Standards (IFRS) as adopted in the European Union.
Basis for opinion
We conducted our audit in accordance with International Standards on Auditing (ISA) and further technical and ethical
standards and guidelines as issued by Ordem dos Revisores Oficiais de Contas (the Portuguese Institute of Statutory
Auditors). Our responsibilities under those standards are further described in the “Auditor’s responsibilities for the audit of
the consolidated and separate financial statements” section below. We are independent from the entities that are part of the
Group in accordance with the law and we have fulfilled other ethical requirements in accordance with the Ordem dos Revisores
Oficiais de Contas code of ethics.
We believe that the audit evidence we have obtained is sufficient and appropriate to provide a basis for our opinion.
Key Audit Matters
Key audit matters are those matters that, in our professional judgment, were of most significance in our audit of the
consolidated and separate financial statements of the current period. These matters were addressed in the context of our
audit of the consolidated and separate financial statements as a whole, and in forming our opinion thereon, and we do not
provide a separate opinion on these matters.

2018 ConsolidatedReport and Accounts
Applicable to the consolidated financial statements:
Description of the most significant risks of material misstatement identified
Summary of the auditor’s responses to the assessed risks of material misstatement
Fair value of investment properties
As of 31 December 2018, the Group owns a significant
portfolio of investment properties, amounting to 982,845
thousand Euros (740,424 thousand Euros as of 31 December
2017). Also as of 31 December 2018, the Group owns a
significant portfolio of investments in joint ventures and
associates, amounting 1,098,841 thousand euros (1,222,965
thousand euros as of 31 December 2017), related to interests
on entities that directly or indirectly own investment
properties. As mentioned in Note 2.3 of the notes to the
consolidated financial statements, investment properties
(including those owned by joint ventures and associates),
which are mainly shopping centres, are measured at fair value.
The determination of fair value is performed by external
specialized and independent entities, and is determined
with the application of property valuation methodologies
based on assumptions, amongst which the discount rate and
future projections of the shopping centres operations, being
therefore a complex and judgmental computation.
Given the significance of the measurement of these
investment properties on the consolidated financial
statements, we concluded this to be a key audit matter.
• Amongst others, our audit procedures included the
analysis of the objectivity, competence, independence
and professional experience of the external valuators,
the analysis of the control activities related to the
review of the valuation reports, the analysis of the
reasonableness of main assumptions used, as well as
validation tests on the computations performed by the
valuators.
• We obtained external valuation reports of investment
properties and audit reports of the Groups’ main
components, with reference to the reporting date
and verified that the amount of fair value recognized
in the consolidated financial statements is the
amount determined by the valuators, included in the
corresponding valuation reports.
• We obtained the independence confirmation from the
valuators that performed the valuations.
• We read the valuation reports, having met with the
valuators and the Entity in order to analyse if the
valuation methodologies were reasonable, as well as
the main assumptions and base information used in
the projections.
• We analysed the reasonableness of disclosures included
in the notes of the consolidated financial statements.

103
Applicable to the separate financial statements:
Responsibilities of management and supervisory body for the consolidated and separate financial statements
Management is responsible for:
• the preparation of consolidated and separate financial statements that give a true and fair view of the Group’s financial
position, financial performance and cash flows in accordance with the International Financial Reporting Standards (IFRS)
as adopted in the European Union;
• the preparation of the management report, in accordance with applicable laws and regulations;
• designing and maintaining an appropriate internal control system to enable the preparation of financial statements that
are free from material misstatement, whether due to fraud or error;
• the adoption of accounting policies and principles appropriate in the circumstances; and
• assessing the Entity and Group’s ability to continue as a going concern, and disclosing, as applicable, the matters that may
cast significant doubt about the Group’s ability to continue as a going concern.
The supervisory body is responsible for overseeing the Entity’s financial reporting process.
Description of the most significant risks of material misstatement identified
Summary of the auditor’s responses to the assessed risks of material misstatement
Impairment on investments in group companies, joint ventures and associates
As referred in Note 2.2 of the notes to the separate financial
statements, investments in subsidiaries joint ventures and
associates are measured at cost, deducted by impairment
losses, when applicable. Impairment is determined taking
into consideration the measurement of these interest in
accordance to NAV (Net Asset Value) methodology, specified
by INREV (European Association for Investors in Non-Listed
Real Estate Vehicles), which is based on the fair value of
investment properties held directly or indirectly by the
Entity’s interests in those entities.
The determination of fair value of the investment properties,
as referred above, is performed by external specialized and
independent entities, and is determined with the application
of property valuation methodologies, based on assumptions
and future projections of the shopping centres operations,
being therefore a complex and judgmental computation.
Therefore, we concluded this subject, to be a key audit
matter.
• We obtained the detail of NAV (Net Asset Value)
calculation prepared by the Entity, which is based on
the investment properties fair value held directly or
indirectly by the Entity.
• Being fair value of the investment properties the
most significant component of the NAV calculation we
performed the procedures referred to above regarding
the key audit matter of the consolidated financial
statements “Fair value of investment properties.”

2018 ConsolidatedReport and Accounts
Auditor’s responsibilities for the audit of the consolidated and separate financial statements
Our responsibility is to obtain reasonable assurance about whether the consolidated and separate financial statements as a
whole are free from material misstatements, whether due to fraud or error, and to issue an auditor’s report that includes our
opinion. Reasonable assurance is a high level of assurance, but is not a guarantee that an audit conducted in accordance with
ISAs will always detect a material misstatement when it exists. Misstatements can arise from fraud or error and are considered
material if, individually or in the aggregate, they could reasonably be expected to influence the economic decisions of users
taken on the basis of these financial statements.
As part of an audit in accordance with ISAs, we exercise professional judgment and maintain professional skepticism throughout
the audit. We also:
• identify and assess the risks of material misstatement of the consolidated and separate financial statements, whether
due to fraud or error, design and perform audit procedures responsive to those risks, and obtain audit evidence that is
sufficient and appropriate to provide a basis for our opinion. The risk of not detecting a material misstatement resulting
from fraud is higher than for one resulting from error, as fraud may involve collusion, forgery, intentional omissions,
misrepresentations, or the override of internal control;
• obtain an understanding of internal control relevant to the audit in order to design audit procedures that are appropriate
in the circumstances, but not for the purpose of expressing an opinion on the effectiveness of the Entity and Group’s
internal control;
• evaluate the appropriateness of accounting policies used and the reasonableness of accounting estimates and related
disclosures made by management;
• conclude on the appropriateness of management’s use of the going concern basis of accounting and, based on the
audit evidence obtained, whether a material uncertainty exists related to events or conditions that may cast significant
doubt on the Entity and Group’s ability to continue as a going concern. If we conclude that a material uncertainty exists,
we are required to draw attention in our auditor’s report to the related disclosures in the financial statements or, if such
disclosures are inadequate, to modify our opinion. Our conclusions are based on the audit evidence obtained up to the
date of our report. However, future events or conditions may cause the Group to cease to continue as a going concern;
• evaluate the overall presentation, structure and content of the consolidated and separate financial statements,
including the disclosures, and whether those financial statements represent the underlying transactions and events in
a manner that achieves fair presentation;
• obtain sufficient appropriate audit evidence regarding the financial information of the entities or business activities
within the Group to express an opinion on the consolidated and separate financial statements. We are responsible for
the direction, supervision and performance of the group audit. We remain solely responsible for our audit opinion;
• communicate with those charged with governance, including the supervisory body, regarding, among other matters,
the planned scope and timing of the audit and significant audit findings, including any significant deficiencies in internal
control that we identify during our audit;
• determine, from the matters communicated with those charged with governance, including the supervisory body,
those matters that were of most significance in the audit of the consolidated and separate financial statements of the
current period and are therefore the key audit matters. We describe these matters in our auditor’s report unless law or
regulation precludes public disclosure about the matter;
• provide the supervisory body with a statement that we have complied with relevant ethical requirements regarding
independence, and communicate all relationships and other matters that may reasonably be thought to bear on our
independence, and where applicable, related safeguards.
Our responsibility also includes the verification that the information contained in the management report is consistent with
the consolidated and separate financial statements and the verifications provided in numbers 4 and 5 of article 451 of the
Portuguese Companies’ Code (“Código das Sociedades Comerciais”).

105
REPORT ON OTHER LEGAL AND REGULATORY REQUIREMENTS
On the management report
Pursuant to item e) of number 3 of article 451 of the Portuguese Companies’ Code (“Código das Sociedades Comerciais”), it
is our opinion that the management report was prepared in accordance with the applicable legal and regulatory requirements
and the information contained therein is consistent with the audited consolidated and separate financial statements and,
having regard to our knowledge and assessment over the Group, we have not identified any material misstatements.
In addition, pursuant to number 4 of article 451, of the Portuguese Company’s Code (“Código das Sociedades Comerciais”),
we conclude that the management report includes the elements required to the Entity regarding corporate governance,
under the terms of number 6 of article 245-A of the Portuguese Securities Code (“Código dos Valores Mobiliários”), and we
have not identified any material misstatements on the information disclosed therein, which, accordingly, complies with the
requirements of items c), d), f), h), i) and m) of that article.
On the non financial information provided in article 508-G of the Portuguese Companies’ Code
Pursuant to number 6 of article 451 of the Portuguese Companies’ Code, we hereby inform that the Entity mentioned in its
management report, that the non financial information as provided in article 508-G of the Portuguese Companies’ Code, will be
included in the “Economic and Social Report” (“Relatório Económico e Social”), to publish on its internet site under the defined
legal deadline.
On the additional matters provided in article 10 of Regulation (UE) 537/2014
Pursuant to article 10 of Regulation (UE) 537/2014 of the European Parliament and of the Council of 16 April 2014, in addition
to the key audit matters mentioned above, we also report on the following:
• We were appointed as auditors of Sonae Sierra, S.G.P.S., S.A. for the actual mandate (from 2017 to 2020), on the
shareholders’ general assembly held on 18 April 2017. Sonae Sierra, S.G.P.S., S.A. became a public interest entity in 2018.
• Management has confirmed to us that they are not aware of any fraud or suspicion of fraud having occurred that has a
material effect on the financial statements. In planning and executing our audit in accordance with ISAs, we maintained
professional scepticism and we designed audit procedures to respond to the risk of material misstatements in the
consolidated and separate financial statements due to fraud. As a result of our work, we have not identified any material
misstatement on the consolidated and separate financial statements due to fraud.
• We confirm that the audit opinion issued is consistent with the additional report that we prepared and delivered to the
Group’s supervisory body on 14 March 2019.
• We declare that we have not provided any prohibited services as described in number 8 of article 77, of the Ordem dos
Revisores Oficiais de Contas statutes (Legal Regime of the Portuguese Statutory Auditors) and we have remained
independent from the Group in conducting the audit.
Porto, 14 March 2019
Deloitte & Associados, SROC S.A.
Represented by Teresa Alexandra Martins Tavares, ROC

2018 ConsolidatedReport and Accounts
REPORT AND OPINION OF THE STATUTORY AUDIT BOARD
(Translation of a Report and Opinion originally issued in Portuguese.In case of discrepancy the Portuguese version prevails)
To the Shareholders of
Sonae Sierra S.G.P.S, S.A.
In compliance with the applicable legislation and the mandate we have been conferred, we herewith submit for your
consideration our Report and Opinion regarding our activity and the individual and consolidated financial statements of Sonae
Sierra SGPS, S.A. (“Company”) for the year ended 31 December 2018, including the corporate governance report, presented
by the Company’s Board of Directors.
SUPERVISION
During the year under analysis, the Statutory Audit Board accompanied in detail the management of the Company and its
subsidiaries, and verified the regularity of the accounting records, the process of preparation and divulgation of the financial
information and correspondent accounting policies, the compliance with the law and the statutes in force, the risk management
and internal control system, having met, with the periodicity considered adequate, with the Company’s Board of Directors and
managers responsible for finance, accounting, internal audit, risk management issues and planning and control, as well as with
the External Auditor, obtaining all the requested information and clarifications for an adequate understanding of the changes
in the financial position and results.
Within the scope of its mandate, the Statutory Audit Board examined the individual and consolidated Balance sheets as at 31
December 2018, the individual and consolidated statements of profit or loss by nature, of cash flows and of changes in equity
for the year then ended and the related notes to the accounts, and considered that the presented financial information comply
with the law and regulations and is adequate for the understanding of the financial situation and results, both of the Company
and consolidated.
The Statutory Audit Board has also examined the Management Report for the year ended 31 December 2018, including the
Corporate Governance report, prepared by the Board of Directors, and the Statutory External Auditor’s Report prepared by the
External Auditor, and agreed with their content.
In light of the above, the Statutory Audit Board is of the opinion that the information contained in the financial statements
under analysis, was prepared in accordance with the applicable accounting standards and gives a true and fair view of the
assets and liabilities, financial position and results of Sonae Sierra, S.G.P.S., S.A. and the companies included in consolidation
perimeter, and that the Management report faithfully describes the business evolution, performance and financial position of
the Company and of the companies included in the consolidation perimeter and contains a description of the major risks and
uncertainties that they face.
It is further informed that the report on the Corporate Governance produced complies with the provisions of article 245-A of
the Portuguese Securities Code.

107
OPINION
As a result of the aforementioned, the Statutory Audit Board is of the opinion that the conditions are fulfilled for the General
Assembly to approve:
a) The management report, the individual and consolidated statement of financial position as of 31 December 2018, the
individual and consolidated statements of profit or loss, of cash flows and of changes in equity for the year then ended and
the related notes;
b) The proposal for the application of results presented by the Board of Directors.
DECLARATION OF RESPONSIBILITY
Pursuant to number 1 of article 245 item c) of the Portuguese Securities Code (“Código dos Valores Mobiliários”), the members
of the Statutory Audit Board declare that to the best of their knowledge, the information contained in the management report
and the financial statements was prepared in accordance with the applicable accounting standards, giving a true and fair view of
the assets, liabilities, financial position and results of the company and the companies included in the consolidation perimeter.
They further understand that the management report accurately reflects the evolution of the business, performance and
position of the company and of the companies included in the consolidation perimeter and contains a description of the main
risks and uncertainties that it faces.
Maia, 14 March 2019
The Statutory Audit Board
Ana Isabel Príncipe S.S. Lourenço
Carlos Manuel Pereira da Silva
Sónia Bulhões Costa Matos Lourosa

Related Documents