Approved for public release; further dissemination unlimited Preprint UCRL-JC-136032 The Partitioning of Uranium and Neptunium onto Hydrothermally Altered Concrete P. Zhao, P.G. Allen, E.R. Sylwester, B.E. Viani This article was submitted to 7 th International Conference in the Chemistry and Migration Behavior of Actinides and Fission Products in the Geosphere, Lake Tahoe, NV, September 26-October 1, 1999 October 14, 1999 Lawrence Livermore National Laboratory U.S. Department of Energy

Welcome message from author
This document is posted to help you gain knowledge. Please leave a comment to let me know what you think about it! Share it to your friends and learn new things together.
Transcript

Approved for public release; further dissemination unlimited
PreprintUCRL-JC-136032
The Partitioning of Uranium and
Neptunium onto Hydrothermally Altered
Concrete
P. Zhao, P.G. Allen, E.R. Sylwester, B.E. Viani
This article was submitted to7th International Conference in the Chemistry and MigrationBehavior of Actinides and Fission Products in the Geosphere, LakeTahoe, NV, September 26-October 1, 1999
October 14, 1999
LawrenceLivermoreNationalLaboratory
U.S. Department of Energy

DISCLAIMER This document was prepared as an account of work sponsored by an agency of theUnited States Government. Neither the United States Government nor the University ofCalifornia nor any of their employees, makes any warranty, express or implied, orassumes any legal liability or responsibility for the accuracy, completeness, or usefulnessof any information, apparatus, product, or process disclosed, or represents that its usewould not infringe privately owned rights. Reference herein to any specific commercialproduct, process, or service by trade name, trademark, manufacturer, or otherwise, doesnot necessarily constitute or imply its endorsement, recommendation, or favoring by theUnited States Government or the University of California. The views and opinions ofauthors expressed herein do not necessarily state or reflect those of the United StatesGovernment or the University of California, and shall not be used for advertising orproduct endorsement purposes. This is a preprint of a paper intended for publication in a journal or proceedings. Since changesmay be made before publication, this preprint is made available with the understanding that it willnot be cited or reproduced without the permission of the author.
This report has been reproduced directly from the best available copy.
Available to DOE and DOE contractors from the
Office of Scientific and Technical Information P.O. Box 62, Oak Ridge, TN 37831 Prices available from (423) 576-8401
http://apollo.osti.gov/bridge/
Available to the public from the National Technical Information Service
U.S. Department of Commerce 5285 Port Royal Rd.,
Springfield, VA 22161 http://www.ntis.gov/
OR
Lawrence Livermore National Laboratory
Technical Information Department’s Digital Library http://www.llnl.gov/tid/Library.html

THE PARTITIONING OF URANIUM AND NEPTUNIUM ONTO HYDROTHERMALLYALTERED CONCRETE
By P. Zhao1, P. G. Allen1, E. R. Sylwester1, and B. E. Viani2*
1G. T. Seaborg Institute for Transactinium Science2Geosciences & Environmental Technologies DivisionLawrence Livermore National Laboratory, Livermore, California 94550, USA
Uranium(VI)/Neptunium(V)/Sorption/Cementitious materials/Carbonate complexa-tion/colloid/EXAFS
Summary
Partition coefficients (Kd) of U(VI) and Np(V) on untreated and hydrothermally altered concrete
were measured in 0.01 M NaCl and 0.01 M NaHCO3 solutions as functions of concentration of
the radionuclides, pH, and time. The partition coefficients for both U(VI) and Np(V) on hydro-
thermally altered concrete are significantly lower than those on untreated concrete. The partition
of both U(VI) and Np(V) are pH dependent, although the pH dependence does not necessarily
reflect precipitation of U and Np-bearing phases. Both sorption and precipitation appear to con-
trol partitioning of U to concrete; sorption alone appears to control partition of Np to concrete.
The presence of 0.01 M carbonate species in solution decreases Kd of U(VI) for both treated and
untreated concrete to a similar value of ~500 mL/g indicating a significant impact on U(VI) sorp-
tion. However, the presence of carbonate only reduced the Kd of Np(V) by one order of magni-
tude or less. Our results also show that significant amounts of uranium and neptunium in aque-
ous phase are associated with suspended colloids. In most cases, the colloid-associated uranium
and neptunium are the predominant species in the liquid phase. X-ray absorption spectroscopy
* Authors to whom correspondence should be addressed.

analysis of U/concrete mixtures at different pHs and times indicate that uranyl ions are parti-
tioned as monomeric species on untreated concrete, but oligomeric species on hydrothermally
altered concrete. Similar analysis of Np/concrete mixtures shows that about half of the parti-
tioned Np(V) is reduced to Np(IV) over a period of 6 months.
Introduction
Cementitious materials that are used to construct the ground support for high-level repositories
have a high probability of interacting with radionuclide-bearing fluids derived from failed waste
packages. Cementitious materials provide a highly alkaline environment; pore fluids in concrete
can have pH>10 for thousands to hundreds of thousands of years [1]. Studies have shown that
fresh concrete and cement phases strongly retard or immobilize certain actinides [2, 3]. Conse-
quently, cementitious materials may serve as a barrier to the release of the radionuclides to the far
field. However, the effect of thermal alteration of these materials, which may occur in high-level
repositories, on their interaction with radionuclides has not been addressed. In contrast to retar-
dation, colloidal silica-enriched particles that are abundant in the pore fluids of cementitious ma-
terials may facilitate radionuclide migration through the near-field into the adjacent geological en-
vironment [4]. Due to the uncertainties of these two opposite effects, it is important to investi-
gate the interaction of actinides with cementitious materials under varying conditions.
It is expected that cementitious materials in high-level waste repositories will be subjected to and
altered by hot dry and/or humid conditions for hundreds to thousands of years by the time they
interact with radionuclide-bearing fluids. After alteration, the chemical and mineralogical proper-

ties of these materials will be significantly different from that of the as-placed or fresh concrete.
To assess the effect that this alteration would have on radionuclide interactions, samples of hard-
ened concrete (untreated concrete) were hydrothermally heated at 200 ¡C for 8 months (treated
concrete). The concrete used in the experiments consisted of portland cement with an aggregate
of dolomitic limestone. X-ray diffraction analysis has shown that portlandite and amorphous
calcium silicate hydrate gels were converted to the crystalline calcium silicate hydrate minerals
tobermorite (11�), xonotlite, and scawtite, and clay minerals by the hydrothermal treatment.
Calcite, dolomite, and quartz in the aggregate were unchanged by the treatment.
This paper presents the results of batch experiments to obtain partition coefficients (Kd) for
U(VI) and Np(V) on untreated and treated concrete in 0.01 M NaCl and 0.01 MNaHCO3 solu-
tions as functions of the concentration of the radionuclides, pH and time.
Experimental
Reagents and Equipment Ð The reagents used were A.R. grade. The DI water used was made from a Millipore
Milli-Qª water system. The stock solutions of U(VI) and Np(V) were in 1 M HCl and 2 M HClO4, respectively.
The oxidation states of U(VI) and Np(V) in the stock solutions were confirmed using UV/VIS spectrometry. Iso-
topes 233U and 237Np were used as tracers for nuclear counting. A Tri-Carb 2500 Liquid Scintillation analyzer from
Packard Instrument Company was used for α-liquid scintillation counting (LSC) and α,β-LSC for U and Np aque-
ous samples, respectively. The α,β-LSC results for 237Np were verified using its γ-ray at 29.4 keV detected with a
high purity germanium detector.
Partition Experiment Ð Samples of crushed (<53 µm) treated and untreated concrete were reacted with 0.01 M NaCl
containing U and Np at mass/volume ratio of 0.4 g/L at room temperature (23±2 ¡C). Filtered and unfiltered sam-
ples of the aqueous phase were taken as a function of time to assess soluble radionuclides, as well as radionuclides
that associated with suspended colloidal particles. The filtration was performed using Anotop 0.02 µm disposable

syringe filters from Whatmanª. An argon filled glove box was used for partition experiments under conditions to
exclude CO2. Partition coefficients (mL/g) were calculated according to (1):
Kd =
√↵
√√↵
−
V
A
m
AAi
(1)
Where Ai and A are the activity (cpm/mL) in the solution before and after it contacted the concrete sample, respec-
tively; m is the mass (g) of concrete used; and V is the volume (mL) of 0.01 M NaCl or 0.01 M NaHCO3 solutions
containing U(VI) or Np(V).
XAFS Spectroscopy: LIII-edge X-ray absorption fine structure (XAFS) spectra were collected for U and Np sorption
samples at the Stanford Synchrotron Radiation Laboratory (SSRL). Spectra were measured for both U and Np
loaded concrete samples taken from the partition experiments over a range of pH from ~9 to12. These samples were
equilibrated for ca. six months prior to XAFS measurements. In addition, ÒfreshÓ samples of U(VI) and Np(V)
sorbed to treated concrete at pH 10.2 were prepared 1 month before XAFS measurement and were used as references
to study potential aging effects in the actinide speciation. The samples were studied on beam line 4-1, using a
Si(220) double-crystal monochromator. All spectra were collected at room temperature, either in transmission mode
using argon-filled ionization chambers or in fluorescence mode using a Ge solid state detector developed at Lawrence
Berkeley National Laboratory [5]. The spectra were calibrated by simultaneous measurement of UO2 or NpO2 refer-
ences, defining the first inflection at 17166.0 eV and 17606.2 eV for the U and Np LIII-edges, respectively.
The XANES and EXAFS data were extracted from the raw absorption spectra by standard methods described else-
where [6] using the suite of programs, EXAFSPAK, developed by Graham George of SSRL. Non-linear least
squares curve fitting analysis was performed using EXAFSPAK to fit the raw k3-weighted data. Modeling of the
back scattering phases and amplitudes of the individual neighboring atoms was based on FEFF7.2 [7]. The input
files for FEFF7.2 were prepared using the structural modeling code ATOMS 2.46b [8]. All of the modeled UO22+
and NpO2+ interactions were derived from FEFF7.2 single or multiple scattering paths (SS or MS) calculated for the

model compound α-UO2(OH)2 [9]. Microsoft EXCEL was used to perform principal component analysis (PCA)
on the spectra using standard methodology [10]. The relative contributions from the two oxidation states present
in the Np LIII spectra were also determined empirically using the program PEAKFITª and data based on XANES
spectra of pure Np4+ and NpO2+ standards.
Results and Discussion
1. Interaction of U(VI) with concrete
Effect of initial U concentration, concrete treatment, and dissolved carbonate -- Batch partitioning
measurements of U(VI) on both untreated and treated concrete with and without added NaHCO3
are shown in Figure 1a. In the absence of added NaHCO3, the ambient pH of the 0.01 NaCl so-
lutions in contact with untreated and treated concrete (under argon) were 11.21±0.13 and
10.33±0.06, respectively. By assuming equilibrium with calcite, the measured dissolved Ca con-
centrations were used to calculate dissolved inorganic carbon (primarily CO3--) in the 0.01 M
NaCl (3.3x10⁻⁵ and 2.4x10⁻⁵ M for the above pHs; respectively).
Figure 1a shows the partition coefficient (Kd) of U(VI), as a function of initial concentration in
0.01 M NaCl solution for treated and untreated concretes based on analysis of the unfiltered su-
pernatants after 35 days contact under argon. Partition coefficients calculated using the analysis
of the filtered supernatant were up to 4 times larger for treated concrete, but were not calculable
for the untreated concrete, and at the lowest initial U concentrations for the treated concrete be-
cause supernatant concentrations were at or below the detection limit (~2x10⁻⁸ M). KdÕs for
both treated and untreated concrete are large, but hydrothermal treatment reduces partitioning by

one to two orders of magnitude. Partitioning to the solid is significantly enhanced at low initial U
concentrations, and appears to level off for initial U concentrations greater than ~2x10⁻⁶ M.
The presence of carbonate in solution can reduce actinide sorption onto mineral phases due to
complexation [11, 12]. In the presence of 0.01 M NaHCO3 (~ 300-400 times greater dissolved
carbon than in 0.01 M NaCl samples), at pHÕs near the ambient pH of the concrete/NaCl mix-
tures (10.42±0.03 and 11.21±0.08 for treated and untreated concrete, respectively), the Kd values
for U(VI) are significantly lower than those in NaCl system (Figure 1a). There is little effect of
concrete treatment on partitioning.
Effect of pH -- The partitioning of U(VI) vs. pH for treated concrete in 0.01 NaCl after 133 days
contact is shown in Figure 2. KdÕs vary by two orders of magnitude between pH 9.3 and 11.3
with a maximum between pH 10 and 11. KdÕs based on analysis of filtered samples are up to an
order of magnitude greater than KdÕs calculated from analysis of the unfiltered samples, as previ-
ously noted for the 35 day contact-time experiments.
EXAFS Ð Figure 3 shows the Fourier Transformed (FT) k3-weighted EXAFS spectra for all ura-
nium samples. The Fourier transforms represent a pseudo-radial distribution function of the ura-
nium near-neighbor environment, where peaks representing the near neighbor atoms appear at
lower R values relative to their true distance from the U atom depending on the phase shift of the
back scattering atom. Results of the non-linear least squares curve-fitting over the k-range 3-13
�-1 are summarized in Table 1. The uranium XAFS results show the preservation of the uranyl
(UO22+) structure in all samples. All samples also show a split equatorial shell (see Table 1).

This bond heterogeneity, as opposed to a uniform equatorial shell for the pure uranyl aquo ion, is
consistent with surface adsorption and/or precipitate formation. The samples of uranium on
treated concrete also showed clear evidence for a U-U interaction at 3.94 �, suggesting that on
these surfaces uranyl adsorbs or precipitates as an oligomeric species. There was no such shell
observed in any of the untreated concrete samples, suggesting that uranyl forms monomeric sur-
face complexes on the untreated concrete.
Mineral equilibrium control on U partitioning Ð The geochemical modeling code React (version
3.0.2; Bethke [13]) and the Lawrence Livermore National Laboratory thermodynamic data base
(thermo.com.V8.R6.full (generated by GEMBOCHS.V2-Jewel.src.R6 03-dec-1996) with specific
alterations and/or additions as noted; [14]), were used to assess the potential that precipitation of
U-bearing phases in addition to sorption may control the concentration of uranium in solution.
The GEMBOCHS thermodynamic database was modified by altering the solubility data for ura-
nophane to that reported by Nguyen et al. [15], and including solubility data for becquerelite
[16]. Analyses of solutions in contact with treated concrete for 21 to 133 days were compared
to U concentrations predicted for equilibrium with a number of U-bearing phases (Figure 4a).
The predicted U concentrations were calculated for equilibrium between a specific
U-bearing phase and a solution with a composition defined by the measured pH and dissolved Ca
and Si, and assuming that:
Na and Cl were equal to 0.01 M plus the Na and/or Cl necessary to adjust pH above or
below the ambient (10.23)
Dissolved CO2 was controlled by equilibrium with calcite at the measured pH

The system was oxidizing (fugacity O2 = 0.2)
The measured dissolved U decreased significantly with contact time and became more dependent
on pH. No single U-bearing phase equilibria could reproduce the observed U concentration vs.
time and/or pH. Uranium(VI)-bearing phases such as schoepite (UO3:2H2O) and becquerelite
(Ca(UO2)6O7:11H2O) are too soluble to explain the observed data; CaUO4 is too insoluble. A
more soluble hydrated calcium/uranium bearing phase with a stoichiometry similar to CaUO4 has
been suggested as a possible control on U concentrations in portlandite containing cements [17,
18]. Although thermodynamic solubility data is not available, U concentrations in the presence
of this phase are on the order of 10-8 to 10-7 M; that is, in the range observed with the treated
concrete samples. Equilibrium with this phase would be expected to show a pH dependence
identical to crystalline CaUO4, but displaced upward 2-3 orders of magnitude.
Although equilibrium with haiweeite (Ca(UO2)2(Si2O5)3:5H2O), soddyite ((UO2)2SiO4:2H2O),
and uranophane (Ca(UO2)2(SiO3)2(OH)2) predict U concentrations that overlap the observed
data, these equilibria present significantly different pH dependencies. The concentration of U
predicted for equilibrium with Na2U2O7 is consistent with the 21-day data, however, the subse-
quent decrease in the observed dissolved U is not. It is possible that the reduction of dissolved U
concentration with time will be due to the alteration of initially precipitated Na2U2O7 to a more
stable U(VI)-bearing phase. In addition to Na2U2O7, the solubilities of two other Na/U-bearing
phases (Na-weeksite -- Na2(UO2)2(Si2O5)3:4H2O and Na-boltwoodite --
Na(H3O)(UO2)SiO4:H2O [15]) were calculated (not shown), but were also not consistent with
the observed data.

Finally, it is also possible that U may be incorporated via recrystallization [19] into the abundant
calcite present in the concrete. Coprecipitation and/or solid-solution of U in calcite was not
modeled. The EXAFS data for treated concrete is consistent with precipitation of any of the
U(VI)-bearing phases, but does not preclude sorption and/or incorporation into calcite as parti-
tioning mechanisms.
2. Interaction of Np(V) with concrete
Figure 1b shows the KdÕs for Np(V) as a function of initial concentration of Np for untreated and
treated concrete in 0.01 M NaCl and 0.01 M NaHCO3. In NaCl, the KdÕs for both concretes de-
crease with increasing initial concentration of Np(V); the Kd for untreated concrete being ap-
proximately two orders of magnitude larger than that for treated concrete. In 0.01 M NaHCO3,
Np(V) partitioning to both concretes is reduced, although the effect is smaller than that observed
for U(VI). Figure 2 shows that the Kd for Np(V) on treated concrete is strongly pH dependent.
The Kd increases monotonically by three orders of magnitude (filtered samples) in the pH range
between 9.3 to 11.3.
EXAFS Ð The normalized Np LIII-edges for three representative samples (the treated pH 10.3
fresh sample, treated pH 9.3, and untreated pH 10.3 aged samples) are shown in Figure 5 along
with the absorption spectra for NpO2+ and NpO2 reference compounds. There is a clear time
dependence in these spectra, with the fresh sample resembling NpO2+ and the aged samples
showing a transformation to a Np4+-like species. Principal Component Analysis (PCA) was per-
formed on the sample data set and confirmed the presence of two components. Target testing
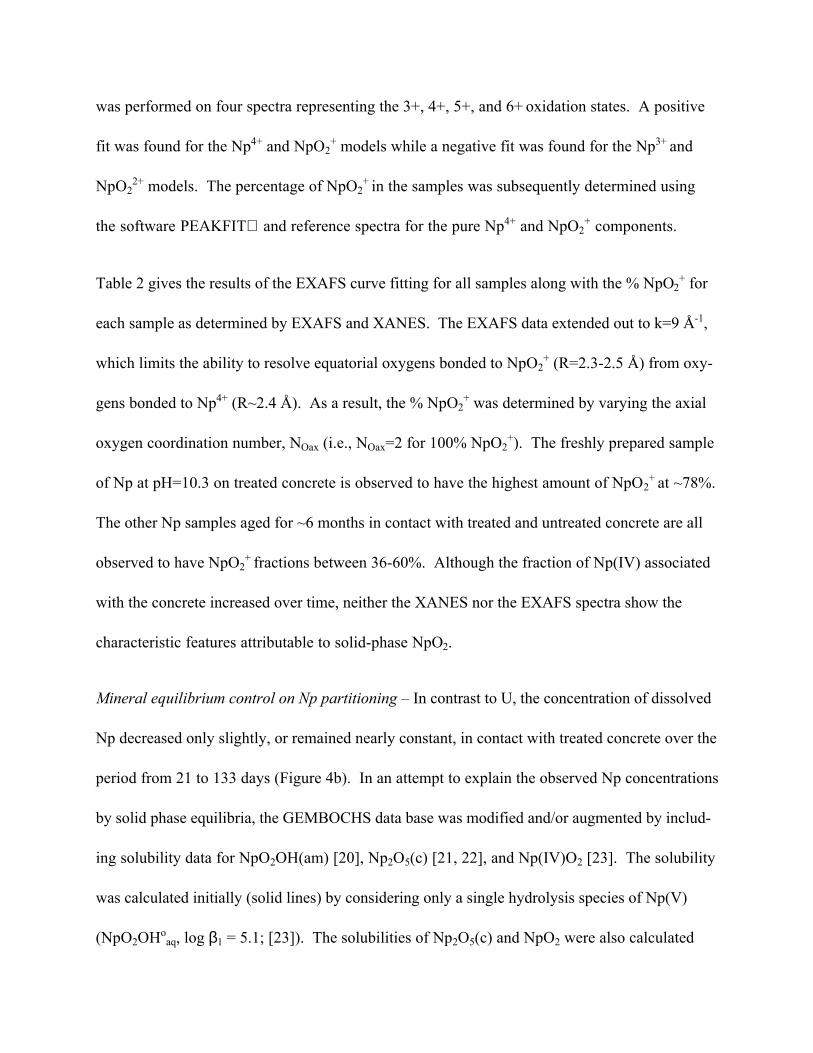
was performed on four spectra representing the 3+, 4+, 5+, and 6+ oxidation states. A positive
fit was found for the Np4+ and NpO2+ models while a negative fit was found for the Np3+ and
NpO22+ models. The percentage of NpO2
+ in the samples was subsequently determined using
the software PEAKFIT and reference spectra for the pure Np4+ and NpO2+ components.
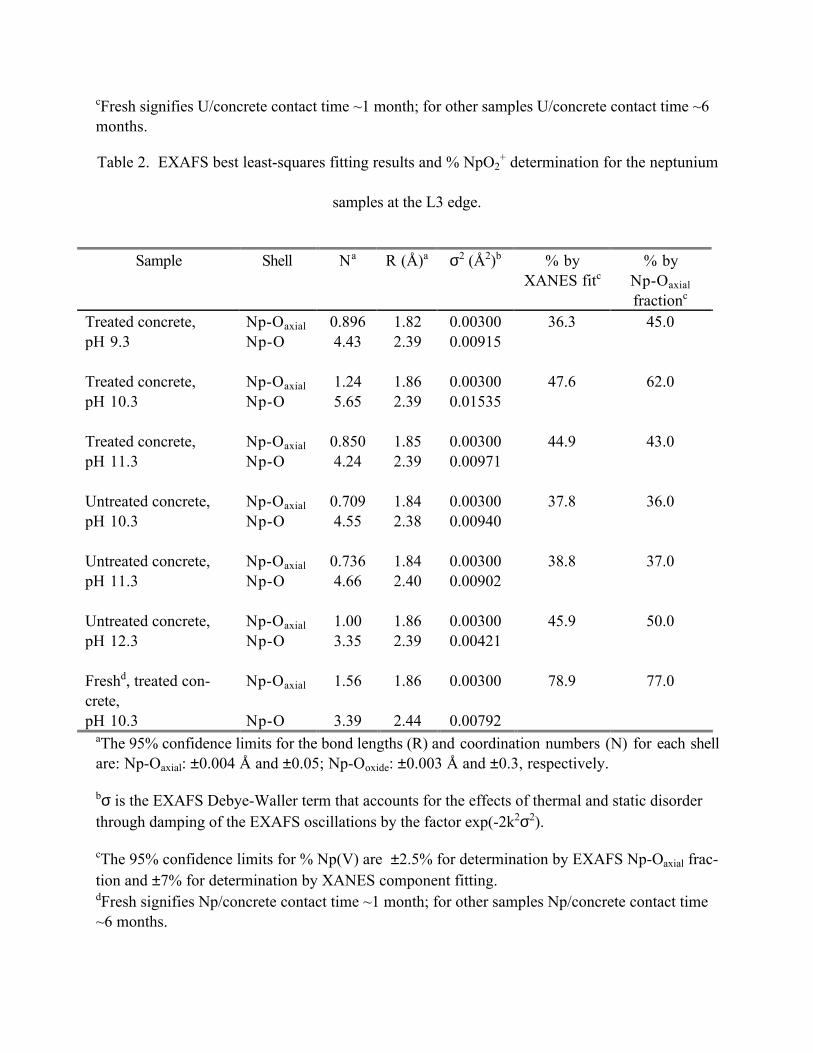
Table 2 gives the results of the EXAFS curve fitting for all samples along with the % NpO2+ for
each sample as determined by EXAFS and XANES. The EXAFS data extended out to k=9 �-1,
which limits the ability to resolve equatorial oxygens bonded to NpO2+ (R=2.3-2.5 �) from oxy-
gens bonded to Np4+ (R~2.4 �). As a result, the % NpO2+ was determined by varying the axial
oxygen coordination number, NOax (i.e., NOax=2 for 100% NpO2+). The freshly prepared sample
of Np at pH=10.3 on treated concrete is observed to have the highest amount of NpO2+ at ~78%.
The other Np samples aged for ~6 months in contact with treated and untreated concrete are all
observed to have NpO2+ fractions between 36-60%. Although the fraction of Np(IV) associated
with the concrete increased over time, neither the XANES nor the EXAFS spectra show the
characteristic features attributable to solid-phase NpO2.
Mineral equilibrium control on Np partitioning Ð In contrast to U, the concentration of dissolved
Np decreased only slightly, or remained nearly constant, in contact with treated concrete over the
period from 21 to 133 days (Figure 4b). In an attempt to explain the observed Np concentrations
by solid phase equilibria, the GEMBOCHS data base was modified and/or augmented by includ-
ing solubility data for NpO2OH(am) [20], Np2O5(c) [21, 22], and Np(IV)O2 [23]. The solubility
was calculated initially (solid lines) by considering only a single hydrolysis species of Np(V)
(NpO2OHoaq, log β1 = 5.1; [23]). The solubilities of Np2O5(c) and NpO2 were also calculated

(dotted lines) considering a less stable first hydrolysis constant of NpO2+ (log β1 = 2.7; [24]) as
well as a second hydrolysis species (NpO2(OH)-2, log β2 = 4.35; [24]). As figure 4b shows,
Np(V)- and Np(IV)-bearing oxides and hydroxides cannot explain the observed trend in Np vs.
pH. Although by decreasing the stability of the first hydrolysis constant of NpO2+, it is possi-
ble to simulate the decrease in Np concentration with increasing pH, the slope of the simulated
decrease is too small to explain the measurements. Neptunium(V) carbonate phases were also
considered, but were found to be orders of magnitude too soluble to explain the observed data.
We conclude that sorption of Np(V) controls the partitioning between treated concrete and liq-
uid, and that the observed reduction of sorbed Np(V) to Np(IV) does not appreciably affect this
distribution, nor does it apparently result in the precipitation of NpO2. Although the site of Np
sorption on the treated concrete cannot be identified, previous work has shown that calcite is an
effective sorbent for Np(V) [25].
3. Colloid-associated U and Np
As noted above, KdÕs based on analysis of the unfiltered supernatants were always smaller than
those calculated from filtered samples and suggests that a significant fraction of U and Np were
associated with the filterable particles. Comparison of U and Np concentrations in unfiltered and
filtered supernatants for the 0.01 NaCl samples show that for untreated concrete, nearly 100% of
U and Np were associated with particulates, and for treated concrete, approximately 80% of Np
was associated with the filtered colloids. Clearly, the concentration of suspended colloids in
these experiments is large because of the crushing required to reduce the particle size to < 53 µm.
The concentration of suspended colloids would be expected to be much smaller for fluids inter-

acting with intact concrete. The partitioning of U and Np based on the unfiltered supernatants
thus provides a minimum measure of U and Np retardation.
The total U and Np concentrations (colloidal + soluble) are observed to decrease over time, most
likely due to coagulation and settling of the actinide-bearing concrete colloids. Therefore, the
ÔapparentÕ Kd as calculated based on analysis of the unfiltered samples increases with time.
Thus, the ÔapparentÕ Kd based on unfiltered samples after short contact times provides a Ôcon-
servativeÕ measure of the ability of the concrete to retard U(VI) and Np(V).
The fraction of U and Np associated with colloids was reduced in the 0.01 M NaHCO3/concrete
experiments. Our results show that no detectable U-bearing concrete colloids were observed in
0.01 M NaHCO3 solution with both untreated and treated concrete. For Np in 0.01 M NaHCO3,
ca. 72% and 30% are associated with suspended particles for untreated and treated concrete, re-
spectively.
In a related study of Np and U transport through hydrothermally altered concrete, colloids gener-
ated from the treated concrete via crushing and ultrasonic treatment (median size ~ 0.3 µm) were
analyzed by X-ray diffraction and found to consist primarily of calcite and smectite [26]. ICP-
AES analysis of the unfiltered supernatants for treated concretes is consistent with this mineral-
ogy; that is, they have higher silica and calcium concentrations than the filtered samples.
Conclusions
Both treated and untreated concrete show strong partitioning of U(VI) and Np(V) to the solid in
the pH range 9 to 11.5. However, hydrothermal treatment significantly reduced the partitioning

for both U and Np. The decrease in partitioning due to hydrothermal treatment may result from
mineralogical (e.g., conversion of poorly crystalline phases and portlandite to crystalline calcium
silicate hydrate phases), chemical (in particular, the significant decrease in pH), and/or physical
changes (e.g., potential decrease in specific surface area) attendant to the hydrothermal treatment.
Dissolved carbonate reduces the partitioning of both nuclides, on both concretes, but a larger im-
pact was observed for U(VI). The partitioning is strongly pH dependent for both nuclides. For
U, partitioning to the treated concrete may be controlled by precipitation of U(VI) bearing
phases, for Np, sorption appears to be the dominant process controlling partitioning. Sorbed
Np(V) is reduced to Np(IV) during contact with both treated and untreated concrete. Strong par-
titioning to the solid phase, together with the presence of colloids generated by the sample treat-
ment, resulted in a major fraction of U and Np in the supernatant associated with the suspended
particles in the 0.01 M NaCl samples. Partition coefficients based on analysis of unfiltered sam-
ples provide a conservative estimate for U and Np retardation through concrete, however, be-
cause of the large KdÕs, there is a potential for colloid-enhanced transport.
Acknowledgements
This work was performed under the auspices of the U.S. Department of Energy by Lawrence
Livermore National Laboratory under Contract W-7405-Eng-48. This work was partly sup-
ported by the Yucca Mountain Site Characterization Project at LLNL. This work was done (par-
tially) at SSRL, which is operated by the Department of Energy, Division of Chemical Sciences.
Additional XAFS experimental support was provided by D. Caulder and W. Lukens and the Ac-
tinide Chemistry Group at Lawrence Berkeley National Laboratory.
References
1. M. Atkins, F. P. Glasser, Mat. Res. Soc. Symp. Proc. (1990).
2. T. G. Heath, D. J. Ilett, C. J. Tweed, Mat. Res. Soc. Symp. Proc. (1996).
3. B. F. Greenfield, D. J. Ilett, M. Ito, R. McCrohon, T. G. Heath, C. J. Tweed, S. J. Wil-liams, M. Yui, Radiochimica Acta 82, 27-32 (1998).
4. J. D. F. Ramsay, R. G. Avery, P. J. Russell, Radiochimica Acta 44-5, 119-124 (1988).
5. J. J. Bucher, N. M. Edelstein, K. P. Osborne, D. K. Shuh, N. Madden, P. Luke, D. Pehl,C. Cork, D. Malone, P. G. Allen, Reviews Scientific Instruments 67 (1996).
6. R. Prins, D. E. Koningsberger, Eds., X-Ray Absorption: Principles, Applications, Tech-niques for EXAFS, SEXAFS, and XANES (Wiley-Interscience, 1988).
7. J. Mustre de Leon, J. J. Rehr, S. Zabinsky, R. C. Albers, Physical Review B 44, 4146-4156 (1991).
8. B. Ravel, ÒATOMS, a program to generate atom lists for XAFS analysis from crystallo-graphic data.Ó (University of Washington, Seattle, WA., 1996).
9. J. C. Taylor, H. J. Hurst, Acta Cryst. B 27, 2018-2022 (1971).
10. E. R. Malinowski, Factor Analysis in Chemistry (Wiley-Interscience, 1991).
11. M. Del Nero, K. Ben Said, A. Clement, G. Bontems, Radiochimica Acta 81, 133-141(1998).
12. K. H. Lieser, S. Quandtklenk, B. Thybusch, Radiochimica Acta 57, 45-50 (1992).
13. C. M. Bethke, The Geochemists Workbench, Release 3.0, A Users Guide to Rxn, Act2,Tact, React, and Gtplot (Copyright Craig M. Bethke, Hydrogeology Program, Universityof Illinois, Champaign, IL., 1998).
14. J. Johnson, S. Lundeen, ÒGEMBOCHS Thermodynamic Datafiles For Use With theEQ3/6 Software PackageÓ Yucca Mountain Project Milestone Report M0L72. (LawrenceLivermore National Laboratory, 1994).
15. S. N. Nguyen, R. J. Silva, H. C. Weed, J. E. Andrews, Journal of Chemical Thermody-namics 24, 359 (1992).
16. M. C. A. Sandino, B. Grambow, Radiochimica Acta 66, 37 (1994).

17. M. Atkins, F. P. Glasser, L. P. Moroni, The long-term properties of cement and con-cretes, Mat. Res. Soc. Symp. Proc. (1991).
18. L. P. Moroni, G. F.P., Waste Management 15, 243-254 (1995).
19. D. E. Meece, L. K. Benninger, Geochimica et Cosmochimica Acta 57, 1447-1458 (1993).
20. K. E. Roberts, H. B. Silber, P. C. Torretto, T. Prussin, K. Becraft, D. E. Hobart, C. F.Novak, Radiochimica Acta 74, 27-30 (1996).
21. P. J. Pan, A. B. Campbell, Radiochimica Acta 81, 73 (1998).
22. D. W. Efurd, W. Runde, J. C. Banar, D. R. Janecky, J. P. Kaszuba, P. D. Palmer, F. R.Roensch, C. D. Tait, Environmental Science & Technology 32, 3893 (1998).
23. R. J. Lemire, ÒAn assessment of the thermodynamic behavior of neptunium in water andmodel groundwater from 25 to 150 deg CÓ AECL-7817 (Atomic Energy of Canada Lim-ited, 1984).
24. V. Neck, J. I. Kim, B. Kanellakopulos, Radiochimica Acta 56, 25 (1992).
25. W. L. Keeney-Kennicutt, J. W. Morse, Marine Chemistry 15, 133-150 (1984).
26. S. L. Matzen, J. M. Beiriger, P. C. Torretto, P. Zhao, B. E. Viani, Radiochimica Acta thisvolume.

Table 1. EXAFS best least-squares fitting results for the uranium samples.
Sample Shell Na R (�)a σ2 (�2)b
Treated concrete, pH 9.3 U-Oax 2.00 1.81 0.00201U-Oeq1 4.33 2.30 0.00776U-Oeq2 1.82 2.48 0.00776U-U 0.64 3.96 0.00076
Treated concrete, pH 10.3 U-Oax 2.00 1.82 0.00115U-Oeq1 3.38 2.28 0.00606U-Oeq2 2.22 2.44 0.00606U-U 1.07 3.96 0.00338
Treated concrete, pH 11.3 U-Oax 2.00 1.81 0.00268U-Oeq1 2.90 2.26 0.00330U-Oeq2 2.16 2.42 0.00330U-U 1.51 3.96 0.00603
Untreated concrete, pH 10.3 U-Oax 2.00 1.82 0.00184U-Oeq1 3.33 2.28 0.00687U-Oeq2 1.70 2.45 0.00687
Untreated concrete, pH 11.3 U-Oax 2.00 1.83 0.00242U-Oeq1 4.56 2.29 0.00967U-Oeq2 1.36 2.53 0.00967
Untreated concrete, pH 12.3 U-Oax 2.00 1.83 0.00216U-Oeq1 2.54 2.23 0.00163U-Oeq2 1.44 2.39 0.00163
Freshc, treated concrete, U-Oax 2.00 1.81 0.00255pH 10.3 U-Oeq1 3.40 2.30 0.00418
U-Oeq2 1.69 2.49 0.00418
aThe 95% confidence limits for the bond lengths (R) and coordination numbers (N) for each shellare: U-Oax: ±0.001 �; U-Oeq1: ±0.003 � and ±0.3; U-Oeq2: ±0.01 � and ±0.2; U-U(1-3): ±0.005 �and ±0.3, respectively.
bσ is the EXAFS Debye-Waller term that accounts for the effects of thermal and static disorderthrough damping of the EXAFS oscillations by the factor exp(-2k2σ2).
cFresh signifies U/concrete contact time ~1 month; for other samples U/concrete contact time ~6months.
Table 2. EXAFS best least-squares fitting results and % NpO2+ determination for the neptunium
samples at the L3 edge.
Sample Shell Na R (�)a σ2 (�2)b % byXANES fitc
% byNp-Oaxial
fractionc
Treated concrete, Np-Oaxial 0.896 1.82 0.00300 36.3 45.0pH 9.3 Np-O 4.43 2.39 0.00915
Treated concrete, Np-Oaxial 1.24 1.86 0.00300 47.6 62.0pH 10.3 Np-O 5.65 2.39 0.01535
Treated concrete, Np-Oaxial 0.850 1.85 0.00300 44.9 43.0pH 11.3 Np-O 4.24 2.39 0.00971
Untreated concrete, Np-Oaxial 0.709 1.84 0.00300 37.8 36.0pH 10.3 Np-O 4.55 2.38 0.00940
Untreated concrete, Np-Oaxial 0.736 1.84 0.00300 38.8 37.0pH 11.3 Np-O 4.66 2.40 0.00902
Untreated concrete, Np-Oaxial 1.00 1.86 0.00300 45.9 50.0pH 12.3 Np-O 3.35 2.39 0.00421
Freshd, treated con-crete,
Np-Oaxial 1.56 1.86 0.00300 78.9 77.0
pH 10.3 Np-O 3.39 2.44 0.00792aThe 95% confidence limits for the bond lengths (R) and coordination numbers (N) for each shellare: Np-Oaxial: ±0.004 � and ±0.05; Np-Ooxide: ±0.003 � and ±0.3, respectively.
bσ is the EXAFS Debye-Waller term that accounts for the effects of thermal and static disorderthrough damping of the EXAFS oscillations by the factor exp(-2k2σ2).
cThe 95% confidence limits for % Np(V) are ±2.5% for determination by EXAFS Np-Oaxial frac-tion and ±7% for determination by XANES component fitting.dFresh signifies Np/concrete contact time ~1 month; for other samples Np/concrete contact time~6 months.
FIGURE CAPTIONS
Figure 1. Partition coefficients (KdÕs) for (a) U and (b) Np on untreated and hydrothermally al-
tered (treated) concretes. KdÕs are calculated based on analysis of unfiltered supernatants. Error
bars represent uncertainty in counting statistics only.
Figure 2. Partition coefficients (Kd) for U (8.05x10⁻⁶ M) and Np (1.09x10⁻⁵ M) onto hydrother-
mally altered concrete vs. pH after 133 days. Error bars represent uncertainty in counting statis-
tics only.
Figure 3. Fourier transforms of U LIII EXAFS for (a) freshly prepared U on treated concrete, pH
10.3, (b) U on treated concrete, pH 12.3, (c) U on treated concrete, pH 11.3, (d) U on treated
concrete, pH 10.3, (e) U on untreated concrete, pH 11.3, (f) U on untreated concrete, pH 10.3,
and (g) U on untreated concrete, pH 9.3. Fresh signifies U/concrete contact time = ~1 month; for
other samples U/concrete contact times = ~6 months. The dashed line is the experimental data,
and the solid line corresponds to the best theoretical fit to the data.
Figure 4. Comparison of measured (a) U and (b) Np solution concentrations with predictions
based on equilibrium with U- and Np-bearing phases. See text for discussion of thermodynamic
data used for model predictions.
Figure 5. Normalized Np LIII XANES for (a) aqueous Np(V) reference, NpO2+, (b) freshly pre-
pared Np on treated concrete, pH 10.3, (c) Np on untreated concrete, pH 10.3, (d) Np on treated
concrete, pH 9.3, and (e) Np(IV) oxide reference, NpO2. Fresh signifies Np/concrete contact
time = ~1 month; for other samples Np/concrete contact times = ~6 months.

Initial U(VI) concentration, M
0.0 5.0e-6 1.0e-5 1.5e-5 2.0e-5
Kd
, mL/g
1e+2
1e+3
1e+4
1e+5
1e+6
untreatedpH 11.2, 35 days
treatedpH 10.3, 35 days
0.01 M NaCl
(a)
0.01 M NaHCO3untreatedpH 11.2, 14 days
treatedpH 10.4, 14 days
Initial Np(V) concentration, M
0.0 5.0e-6 1.0e-5 1.5e-5 2.0e-5 2.5e-5 3.0e-5
Kd
, mL/g
1e+2
1e+3
1e+4
1e+5
1e+6
0.01 M NaClpH 11.1, 35 days
untreated
treated
0.01 M NaHCO3pH 11.2, 14 days
0.01 M NaHCO3pH 10.4,15 days
0.01 NaClpH 10.2, 49 days
(b)
Figure 1

pH
9.0 10.0 11.0
Kd
, mL/g
1e+2
1e+3
1e+4
1e+5
1e+6
1e+7
filtered
unfiltered
Np
U
filtered
unfiltered
Figure 2

0
1
2
3
4
0 1 2 3 4 5
DataFit
g.
f.
e.
d.
c.
b.
a.
R (�)
FT M
agni
tude
Figure 3

pH
8 9 10 11 12
U, M
1e-11
1e-10
1e-9
1e-8
1e-7
1e-6
1e-5
1e-4
1e-3
1e-2
schoepitebecquerelite
soddyite
CaUO4
uranophane
Na2 U
2 O7
haiweeite
21 day48 day 133 day
(a)
pH
8 10 12
Np, M
1e-9
1e-8
1e-7
1e-6
1e-5
1e-4
1e-3NpO2OH(am) -- [20]
Np2O5(c) -- [21]
Np2O5(c) -- [22]
21 day49 day133 day
NpO2 -- [23]
(b)
Figure 4

1
1.5
2
2.5
17600 17620 17640 17660 17680
Normalized Absorbence
Energy (eV)
a.
b.
c.
d.
e.
Figure 5
Related Documents