Institute of Actuaries of Australia ABN 69 000 423 656 Level 2, 50 Carrington Street, Sydney NSW Australia 2000 t +61 (0) 2 9233 3466 f +61 (0) 2 9233 3446 e [email protected] w www.actuaries.asn.au The Optimal Solution to the Retirement Riddle Prepared by Steve Nagle, Anthony Saliba, Nicolette Rubinsztein and Matthew Gardiner Peer reviewed by Werner van der Merwe Presented to the Actuaries Institute Actuaries Summit 17 – 19 May 2015 Melbourne This paper has been prepared for the Actuaries Institute 2015 Actuaries Summit. The Institute’s Council wishes it to be understood that opinions put forward herein are not necessarily those of the Institute and the Council is not responsible for those opinions. Colonial First State and Ernst & Young The Institute will ensure that all reproductions of the paper acknowledge the author(s) and include the above copyright statement.

Welcome message from author
This document is posted to help you gain knowledge. Please leave a comment to let me know what you think about it! Share it to your friends and learn new things together.
Transcript

Institute of Actuaries of Australia ABN 69 000 423 656
Level 2, 50 Carrington Street, Sydney NSW Australia 2000
t +61 (0) 2 9233 3466 f +61 (0) 2 9233 3446
e [email protected] w www.actuaries.asn.au
The Optimal Solution to the
Retirement Riddle
Prepared by Steve Nagle, Anthony Saliba,
Nicolette Rubinsztein and Matthew Gardiner
Peer reviewed by Werner van der Merwe
Presented to the Actuaries Institute
Actuaries Summit
17 – 19 May 2015
Melbourne
This paper has been prepared for the Actuaries Institute 2015 Actuaries Summit.
The Institute’s Council wishes it to be understood that opinions put forward herein are not necessarily those of the
Institute and the Council is not responsible for those opinions.
Colonial First State and Ernst & Young
The Institute will ensure that all reproductions of the paper acknowledge the
author(s) and include the above copyright statement.

2
Abstract
With an ageing population the question of retirement funding takes on greater
importance, both for the retirees that must fund their retirement years and for the
policy makers that must balance diminishing resources and intergenerational tension
against the living standards of underfunded older generations. In this environment,
good retirement planning and decision making is critical for pre-retirees and retirees.
With that in mind, this paper details the findings of research and modelling
undertaken to answer the question: What is the optimal retirement solution?
This paper firstly compares the stochastically simulated performance of retirement
income products (including account based pensions, annuities and variable
annuities) against a range of metrics. Secondly, we discuss the concept of optimal in
the context of the allocation of retirement funds and how it can be measured.
Thirdly, we examine the optimal allocation to annuities of a typical retirement
portfolio.
Keywords – post-retirement, retirement income, stochastic modelling, account
based pensions, annuities, income stream, optimum.

3
TABLE OF CONTENTS
1. BACKGROUND ................................................................................................................. 4
2. ESTABLISHING A BASIS FOR COMPARING RETIREMENT INCOME PRODUCTS ............... 8
3. PRODUCTS EXAMINED AND MODEL USED .................................................................... 10
The products examined ............................................................................................ 10
The model used .......................................................................................................... 10
4. PRODUCT COMPARISON RESULTS ................................................................................. 11
Comparison A - NPV of lifetime income ................................................................. 11
Comparison B – Desired income attainability ........................................................ 12
5. SEARCHING FOR THE OPTIMAL PRODUCT .................................................................... 15
6. OPTIMAL ANNUITY ALLOCATION FOR INDIVIDUALS .................................................... 17
7. SUMMARY AND CONCLUSION ..................................................................................... 22
APPENDIX A – MODEL AND ASSUMPTIONS ...................................................................... 23
Asset Model ................................................................................................................. 23
Expected asset returns .............................................................................................. 23
Covariance structure ................................................................................................. 24
Expected life ............................................................................................................... 24
APPENDIX B – MEAN VERSUS MEDIAN OUTCOMES IN A STOCHASTIC PROJECTION ..... 25
APPENDIX C – PRODUCT ASSUMPTIONS ........................................................................... 28
Account based pension ........................................................................................... 28
Lifetime annuity .......................................................................................................... 28
Variable annuity ......................................................................................................... 29
Account based pension + deferred annuity (75:25)............................................. 30
Account based pension + lifetime annuity (75:25) ............................................... 30
APPENDIX D – ANNUITY ALLOCATION OUTPUT ................................................................ 31
ACKNOWLEDGEMENTS ...................................................................................................... 40

4
1. BACKGROUND
The Financial System Inquiry (FSI) focussed on defining the objective of our
superannuation system. There is widespread support that the objective is to provide
income streams in retirement. Pleasingly, and contrary to the popular view that the
superannuation system is beset by a lump sum culture, 83% of superannuation assets
are in fact converted to an income stream, with only 17% of assets withdrawn as a
lump sum1 (including partial lump sums – see Table 1). Furthermore, those retirees
that do take a partial or full lump sum appear to spend it sensibly for the most part2.
Whilst the vast majority of super assets are converted to an income stream, the
percentage by number of customers is much less, with 34% taking all their benefit as
a lump sum and 25% taking a partial lump sum.. However, with 57% of lump sums
being less than $40,0003, this again appears to be a rational outcome and, as the
system matures, the percentage of super assets converted to an income stream is
expected to increase to 96% by 20254.
Table 1: Estimated retirement rollovers and benefit payments
Assets Members
Lump sum 16.7% 58.9%
Full lump sum 9.5% 34.2%
Partial lump sum 7.2% 24.7%
Income stream 83.3% 41.1%
Total 100% 100%
Hence, the question has evolved from “are Australians taking up income streams?”
to “are Australians taking up the right income streams?”. The FSI didn’t think so,
making these comments:
“The lack of a significant market for products with longevity risk protection sets
Australia apart from most other developed economies”
“Superannuation assets are not being efficiently converted into retirement
incomes due to a lack of risk pooling and over-reliance on individual account
based pensions”.
This leads us to consider what income streams are available in Australia. Again,
contrary to some commentary, there is a range of retirement income streams
available, from traditional immediate annuities through to variable annuities and
account based pensions. Further, Mercer has recently announced one of the first
group self annuitisation products in Australia. The most significant omission from the
suite on offer is deferred lifetime annuities, which face regulatory barriers that
Treasury is currently reviewing. Whilst it is fair to say there is an array of products with
longevity protection available in Australia, it is also true that such products have not
had significant take-up, while a number have been closed.
1 Rice Warner, 2015; data to 30 June 2014 and prepared for Colonial First State 2 According to the Australian Bureau of Statistics, Retirement and Retirement Intentions 2013, 29% of retires who took
lump sums invested it in their own homes (including paying down their mortgage), followed by 20% who reinvested
as ordinary money and 12% that paid off debt. Only a combined 22% said they bought a car, paid for a holiday or
assisted family. 3 Australian Bureau of Statistics, Retirement and Retirement Intentions, 2013 4 Rice Warner, 2015; data to 30 June 2014 and prepared for Colonial First State

5
Despite the array of available solutions, $144bn of the $159bn retail post-retirement
market is invested in account based pensions, with only $12bn invested in term and
lifetime annuities5. A further $3.6bn6 is estimated to be held in various account based
pension products with capital or income protection (variable annuities). Whilst
variable annuity products have enjoyed significant success in the United States, this
is largely due to conditions that are not replicated locally: high adviser commissions,
often around 7%; favourable tax treatment which is particular to the US; high
provider risk, with a number of participants exiting the market after the GFC due to
hedging issues in their portfolios. The figure below displays this split of the retail
market.
Figure 1: Estimated split of pension assets across industry segments and products
To recap the context so far, the take-up of retirement income solutions is high, and
as intended for the mass market: concessional taxation is incentivising income
streams, there are a range of products available to manage retirement income
needs and risks, and widespread abuse of the system in the form of unwise spending
of lump sums, is not evident.
However, some commentators consider that the national preference for account
based pensions has introduced significant longevity risk into the post-retirement
system. Australian population life expectancy at age 65 is 84 for males and 87 for
females7. However, according to Mercer, for white collar retirees, the life
expectancies are 88 for men and 91 for women. Further, there is a 35% probability
that white collar male and female retirees will live to 91 and 93 respectively8. This
shows that there is a substantial probability that such clients will live into their 90’s
and financial planners need to plan accordingly. Despite these increasing
longevities, only 2-10% of Australian defined contribution (DC) assets are annuitised9.
This contrasts markedly with Switzerland, Chile, the United Kingdom and Ireland
5 Plan For Life, June 2014 6 Rice Warner, 2014 7
Australian Life Tables 2010-12, Australian Government Actuary 8 Mercers 2014, based on analysis of public sector pensioners 9 Pensions Institute, Briefing Paper 66: Freedom and Choice in Pensions
SMSF
249
Not for profit
85
Account based
pension
144
Variable annuity
3
Lifetime annuity
3
Term annuity
9
Retail
159
Retirement Funds Under Administration ($bn)

6
where DC pots are approximately 80%, 70%, 60% and 30% annuitised respectively. Of
these markets, although annuitisation of DC savings has only been compulsory in the
UK (with the level of annuitisation expected to fall), flexible drawdown products are
less attractive. In Switzerland annuity rates are government regulated and generous,
in Chile flexible income stream products are expensive whilst annuities are
government guaranteed and the Irish market has a significant component of
occupational DC schemes that involve some default annuitisation.
A further challenge in the Australian market is the consumer attitudes to investment
risk. Qualitative analysis and research conducted for Colonial First State by Strativity
Group found that pre-retirees and retirees are inherently conservative, concluding
that: “After reaching a ‘tipping point’, pre-retirees become highly engaged investors
and their focus becomes acutely defensive10”. According to the Investment Trends
Retirement Income Report 2014, 62% of Australians over 40 favour a low risk
defensive asset allocation over growth, and 28% would accept no growth at all
rather than any risk of losses11. That same report also indicated a significant
knowledge and consideration gap, with 39% of pre-retirees aged 40+ reporting they
didn’t know what income stream product they would use in retirement, 31% said
they intended to use an account based pension, 19% would take a full lump sum
and only 6% were considering an annuity.
The increasing range of products with longevity protection, increasing longevity and
a naturally conservative disposition suggests that Australian retirees could benefit
from greater focus by industry and government on longevity protection. The
Australian FSI’s commentary on the need for greater longevity protection is echoed
by overseas regulators. Both the US Department of Labor and the OECD12 have
encouraged the take-up of deferred lifetime annuities in particular. One of the key
recommendations coming from the OECD’s Roadmap for the Good Design of
Defined Contribution Pension Plans was:
“A combination of programmed withdrawals with a deferred life annuity that offers
protection against inflation could be seen as an appropriate default.”
Picking up on this theme of combining products, the Australia FSI made the following
observation in relation to Comprehensive Income Products for members’ Retirement
(CIPRs):
“A combination of underlying products would likely be required to provide these
features, for example, an account based pension paired with a pooled product that
provides longevity risk protection”
Given this back-drop of customer preferences, regulation and global trends, we
endeavoured to answer the question “what is the optimal retirement income stream
for retirees” in order to inform the Colonial First State product strategy. To avoid
restricting our potential solution set, it was important to look not only at the main
product categories available, but at combinations of products as well.
10 Strativity Group 2013, research conducted for Colonial First State 11 Investment Trends Retirement Income Report 2014. Excludes those that answered they did not know. 12 OECD Roadmap for the Good Design of Defined Contribution Pension Plans

7
The answer to the question of what is the optimal retirement income solution
depends critically on two aspects of retirement income projection methodology:
Allowing for asset volatility by means of stochastic projection as opposed to a
deterministic projection; and
The measures of performance outcomes.
Our approach was initially inspired by some stochastic modelling conducted by
David Bell, now CIO at AusCoal Super, indicating that nominal lifetime annuities
could offer comparable income replacement rates at a lower level of volatility
(compared to a balanced account based pension) and that variable annuities
delivered sub-optimal outcomes. He used the after-tax and real replacement rate of
pre-retirement income, targeting 70%, as a key outcome measure.
Similarly, other academic research by the University of Sydney and University of
Technology Sydney has looked at what combination of products is optimal. In their
paper Optimal Annuity Purchases of Australian Retirees, Fedor Iskhakov, Susan Thorp
and Hazel Bateman used utility functions to analyse what percentage of a person’s
balance should be allocated to an annuity. The paper includes a chart showing
levels of annuitsation for different economic assumptions and different member
balances.13.
Based on this, we set about to build a model to:
Firstly compare the various retirement products; and
Secondly, to develop a framework to determine the optimal product
selection for an individual.
13 Choices over life annuities: optimal decisions for Australian Retirees, University of Sydney and University of
Technology Sydney

8
2. ESTABLISHING A BASIS FOR COMPARING RETIREMENT INCOME PRODUCTS
In order to compare retirement income products, and then to seek an optimum
retirement income solution, we first need to establish aspects of those products that
we believe retirees value the most. Because income, under many products, can be
drawn down flexibly, there are many ways to view product outcomes, such as:
Total income, or net present value (NPV) of income, over life
The income stream received relative to desired income
Years relative to lifespan until assets are exhausted
Inheritance amount at death.
The outcomes to a retiree under these measures will also depend on interactions
with the Age Pension, and will vary according to asset returns and lifespan from
retirement, both of which are uncertain. It is therefore necessary to consider multiple
measures in multiple scenarios, and also consider the variability of outcomes. The
resulting maze of multiple views of multiple outcomes across a variety of product
combinations makes it challenging to make meaningful comparisons and draw firm
conclusions. Our approach to navigating these challenges was to fix some of the
variability, carefully select outcomes to focus on, and examine those outcomes and
the remaining variability.
In a typical retirement situation, a retiree will receive the Age Pension, plus any
annuity income, and then draw down an amount from an account based pension
(ABP) to reach their desired income. Once the account based pension is exhausted
the retiree’s income will fall. This is shown in the following diagram. For ease of
illustration, all amounts are assumed to inflate, differences between average weekly
earnings (AWE) and inflation (CPI) are ignored, and the inflation adjusted amounts
are shown.
Figure 2: Inflation-adjusted depiction of retirement income over a projection period
In order to sidestep some of the potential variability in our analysis we performed
comparisons as if the retiree’s lifespan were known, together with illustrations of
shorter or longer lifespans. We illustrated lifespans as:
the time from retirement to expected life of the individual (EL),
ten years after life expectancy (EL + 10) and, sometimes
ten years less than life expectancy (EL - 10)
Expect ed life Expect ed life + 10
Desired income
Income shortfall
$0
$10,000
$20,000
$30,000
$40,000
$50,000
$60,000
$70,000
1 2 3 4 5 6 7 8 9 10 11 12 13 14 15 16 17 18 19 20 21 22 23 24 25 26 27 28 29 30
Year
ABP drawdown
Annuity payments
Age Pension

9
An alternative would have been to use a stochastic mortality model and to illustrate
percentiles of financial outcomes driven by this and asset variability. However we felt
that this complicated rather than assisted the ease of communicating results.
In the subsequent sections of this paper we have illustrated financial outcomes,
using the above framework, under stochastic asset returns, for different product
combinations. The summary measures of product performance that we examined
are:
Table 2: Measures of product performance
Measure Definition Relevance
NPV of lifetime
income
(Section 4)
The discounted value of all future
income payments and any
inheritance amounts from the
selected retirement income
product
Summary measure of total value
delivered (at different percentiles of
asset performance and for different
lifespans assumed)
Desired income
attainability
(Section 4)
Total income received over the
retiree lifespan divided by total
desired income over the same
period, excluding any inheritance
A direct summary measure of the
achievement of the income goal
(at different percentiles of asset
performance and for different
lifespans assumed)
Utility of the
payment
stream
produced
(Section 5)
A convex function of the income
received at any point in time
Summarising the benefit, for
assumed lifespans, of the range of
potential asset market outcomes
Depth and
duration of
“income misses”
(Section 6)
Depth refers to the desired income
less the actual received income.
Duration refers to the length of time
where the desired income is not
being received.
Provides richer information about
the number of retirement years with
depleted income, and the severity
of the income reduction

10
3. PRODUCTS EXAMINED AND MODEL USED
The products examined
The products that we initially examined were account based pensions, immediate
lifetime annuities, variable annuities and two hybrid products (one being a 75:25
retirement funds mix of account based pension and immediate lifetime annuity and
the other being a 75:25 retirement funds mix of account based pension and
deferred lifetime annuity). We assumed the immediate lifetime annuity and deferred
lifetime annuity to be priced using the same model and mortality assumptions.
Table 3: List of retirement income products that were compared
Product Reference code
Account based pension ABP
Immediate lifetime annuity (CPI-indexed) LA
Variable annuity VA
75% account based pension + 25% immediate lifetime annuity ABP + LA
75% account based pension + 25% deferred lifetime annuity ABP + DA
The products modelled do not represent actual products belonging to any one
provider, yet their fees and benefits have been calibrated to existing products in
their product cohort in the current Australian market at the time this analysis was
performed. See Appendix C for the assumptions behind the products modelled. The
income drawdown rates modelled for each product are a result of the design of the
products except the account based pension which provides more flexibility. For this,
we have assumed that income is drawn down in line with the desired total income
specified for a particular retiree profile until the assets are exhausted. Desired
income is assumed to be indexed with average weekly earnings (AWE).
The model used
To properly investigate the range of outcomes produced by each retirement
income product we have used a stochastic projection model. Assets are assumed
to grow according to a lognormal distribution. This requires assumptions for expected
returns, volatilities and correlations for the asset classes. A more detailed description
of the asset model used, as well as these assumptions is provided in Appendix A.
Two important assumptions required for our comparison of products are the discount
rate used for any net present value (NPV) calculations and the process by which
annuity rates are set.
The discount rate used is assumed to be the expected return on fixed income assets
to reflect the opportunity cost of investing a particular amount of money.
The (indexed) annuity rates are determined by using a pricing model allowing for
expected annuitant mortality and assuming a level of inflation equal to the
expected inflation (CPI) for the assumed interest rate environment. An input is
required for the investment return for the assets backing the annuity. This is provided
in Appendix C for reference.

11
4. PRODUCT COMPARISON RESULTS
Comparison A - NPV of lifetime income
For the first comparison of products, we look at income received over the projection
period, or time horizon. To provide an equitable comparison we:
look at the NPV of all income payments provided (rather than just adding
them); and
include an inheritance amount on death for products that provide a residual
capital value – in this case the account based pension and variable annuity.
The income included in the calculations is:
The Age Pension;
Income on any annuity portion; and
An amount of drawn down from the account based pension to attain, in
total, the desired income for the retiree.
The following output is for a newly-retired 67 year old male who wants a desired level
of income of $43,000 and has superannuation balance at retirement of $400,000.
Each candlestick depicts the 10th, 50th and 90th percentiles for a particular product
and time horizon.
Figure 3: Comparison of NPV of income plus inheritance
This assists us in visualising the median outcome and ranges of outcomes from the
alternative products, at an “average” lifespan and alternatives. The results are
intuitive and our observations can be summarised as:
Average payouts over an average lifespan are similar
At the expected life time horizon, the median outcome across the products is
comparable. This seems reasonable as each product is, broadly speaking, returning
initial capital plus investment earnings after fees or charges. It might seem surprising
that the account based pension does not provide significantly higher “average”
returns than an annuity, as we have assumed higher mean returns for the more
growth oriented (riskier) asset mix. However this can be explained by the difference
between mean and median outcomes, which is explored further in Appendix B.
$0
$200,000
$400,000
$600,000
$800,000
$1,000,000
$1,200,000
ABP LA ABP + LA ABP + DA VA ABP LA ABP + LA ABP + DA VA ABP LA ABP + LA ABP + DA VA
10 years less than
life expectancylife expectancy 10 years more than
life expectancy

12
Those who live longer receive more, especially with annuities
The NPV of income increases with the time horizon for all products, largely because
the Age Pension is received for longer, and it does so even more for annuity
products as the payments under these contracts also match the retiree’s lifespan.
Variability of payout differs greatly by product
The account based pension and variable annuity demonstrate the largest variability
of outcomes, due to their greater exposure to risky assets. The lifetime annuity has
minimal variability.
Greater annuitisation means payout varies more with lifespan
As expected, the lifetime annuity performs well for the longer life expectancies, and
not so well if the person dies ten years before life expectancy. The account based
pension plus deferred lifetime annuity hybrid is the next most protected against
longevity, followed by the variable annuity and account based pension plus lifetime
annuity hybrid.
Comparison B – Desired income attainability
Using the same visualisation as the previous comparison, we now examine “desired
income attainability”, defined as the ratio between the actual income (again
including the Age Pension) received by the retiree to their desired income, this time
ignoring any amount left for inheritance at the presumed date of death.
As an example of this measure, if a retiree desired $50,000 per annum and received
exactly $50,000 per annum up until their expected life of 20 years, this would equate
to a desired income attainability of 100%. Similarly, the same retiree who received
$50,000 per annum in all but the last 8 years, in which they received $30,000 per
annum, would have a desired income attainability of
This example is illustrated below in Figure 4 below, where the shortfall area represents
16% (being 100% minus the desired income attainability of 84%) of the total area
bounded by the desired income and the expected life.
Figure 4: Depiction of desired income attainability (no inflation illustrated)
Expect ed life
Desired income
Income shortfall
$0
$10,000
$20,000
$30,000
$40,000
$50,000
$60,000
$70,000
1 2 3 4 5 6 7 8 9 10 11 12 13 14 15 16 17 18 19 20
Year
ABP drawdown
Annuity payments
Age Pension

13
The example above is for one particular combination of market scenario, product
and time horizon. We can produce the desired income attainability metrics for
several combinations of these dimensions to produce the chart below. Again, each
candlestick depicts the 10th, 50th and 90th percentiles for a particular product and
time horizon. The results are for the same example as above.
Figure 5: Comparison of desired income attainability
While it is using the same underlying information as the NPV chart, this comparison
accentuates the differences in income received between the products. Our
observations are summarised as follows:
Focus on the income goal has high visual impact
This measure provides a view more closely linked to the retirement goal of income
generation, and would likely have more impact than the NPV measure above to
many individuals in understanding the potential range of outcomes.
At average lifespans we clearly see the risk reward trade-off
At the expected life time horizon we see the variability in desired income
attainability for the account based products, which is due to the underlying asset
class investments providing variability in when the account balance will be
depleted. However, for this example, the account based pension is still expected to
perform well much of the time, with the median outcome delivering 84% of the
desired level of income.
Those who live longer receive more, and with more certainty, if they annuitise
At the EL + 10 time horizon the account based products spend longer with depleted
asset balances so this measure is again lower. Unsurprisingly the immediate lifetime
annuity provides a relatively known and steady income (some variability arises from
the Age Pension and indexation), and produces the best outcomes at the longest
time horizon. The performance of the “partially” annuitised hybrids lies between the
account based pension and the lifetime annuity. Conversely retirees may not be
satisfied that during their active retirement years they are only receiving 80% of their
desired level of income and, if they live less than an average lifespan, are likely to
be better off not annuitising.
60%
65%
70%
75%
80%
85%
90%
95%
100%
ABP LA ABP + LA ABP + DA VA ABP LA ABP + LA ABP + DA VA ABP LA ABP + LA ABP + DA VA
10 years less than
life expectancy life expectancy10 years more than
life expectancy

14
Variable annuities are not flattered by these metrics
The variable annuity in this example performs reasonably well at the EL + 10 horizon
but relatively poorly for both the EL-10 and EL time horizons. The shorter term
performance is impacted by our assumption that the drawdown is limited to the
product payment rate. Over the longer term, the higher fees impact asset balances
and account longevity, limiting its upside, but guaranteed income levels provide
some downside protection. In some specific scenarios with strong early asset growth
but subsequent declines, the variable annuity will be the strongest performer.
However these scenarios are not sufficient in number to tip this analysis in favour of
variable annuities.

15
5. SEARCHING FOR THE OPTIMAL PRODUCT
In the previous sections we compared different products or combinations. Our results
of those comparisons provided motivation to explore product combinations of
various proportions of account based pension and immediate lifetime annuity. While
a 25% proportion invested in an annuity appears promising, we would like to
determine a basis for suggesting an optimal proportion for particular retirement
balance and desired income combinations. As before this optimum might consider:
1. Total income, or NPV of income, over life
2. The income stream received relative to desired income
3. Years relative to lifespan until assets are exhausted
4. Inheritance amount at death
In addition we believe there is also a benefit to having:
5. Least volatility in the outcomes above (all other things equal); and
6. Access to liquidity.
The multiple dimensions of outcome present a problem for optimisation – we need
some way to trade these off against each other and produce a summary outcome
that we can use to rank the products, or combinations of products.
In an attempt to reduce the dimensions to something that would allow us to explore
optima we decided to:
Represent our first two criteria by focusing on any shortfall in income versus
the set “desired income”
Account for our third and fourth criteria by considering this shortfall up until
the retiree’s expected life and considering any inheritance available at the
end of this time horizon.
Capture volatility by presenting outcomes based on various percentiles of
market performance (as we did in sections 5 and 6)
Limit annuity allocations to 50% of any superannuation balance to ensure that
liquidity is available in at least the initial years of retirement.
Although we have now reduced the dimensionality of the problem somewhat, we
still have an issue; we have no way of determining whether an account based
pension providing a retiree’s desired income for 10 years and nothing thereafter is
better than an annuity providing for 50% of the retiree’s desired income for 20 years
(for example). To address this, we could consider using a one-size-fits-all utility
function.
The utility function considered in this context reflects the view that individuals
generally experience decreasing marginal utility in relation to income. What this
means is that a given individual would value the first dollar they receive more than
the second, the second more than the third and so on. This is illustrated in the chart
below.

16
Figure 6: Example income utility function
Here we can see that although the marginal benefit – that is, the incremental
increase in utility with each dollar of income – is higher at the lower levels of income.
We have used this to represent our belief that a retiree would rather fall short of their
desired income by 35% for two years rather than fall short by 70% for one year. In the
above diagram, this inequality may be expressed as .
Using a utility curve provides a means by which we may compare different income
scenarios. However, we are still left with three key issues:
1. Different retirees will have different trade-offs based on their own preferences
and these preferences are not readily accessible to us, so a one-size-fits-all
solution may lead to inappropriate conclusions
2. A utility function would present considerable challenges to being easily
communicated by financial advisers to their clients
3. Even if the concept of utility were more easily understood, retirees
anecdotally prefer concrete examples such as impacts of stress tests on their
financial assets, as opposed to academic concepts such as utility
The results of the calculations that we performed with sample utility curves, while
interesting, raised as many questions about the appropriate curve as they provided
insight to an “optimal” product mix. We therefore concluded, considering also the
issues above, not to further pursue the use of a utility function.
We did, however, believe that the trade-offs we explained with the utility concept
are relevant and the challenge remained to carefully present these trade-offs in a
way which could be easily understood and could facilitate a meaningful adviser
discussion to assist retirees make an informed decision about how to receive their
retirement income. We quickly found that, with so many dimensions, it is difficult to
concisely present and contrast outcomes for different products, or combinations or
products. The problems in assuming trade-offs translated into problems presenting
this information in a meaningful way. The following section suggests how these trade-
offs might be presented.
Desired
income
0 income
ab
70% shortfall
35% shortfall

17
6. OPTIMAL ANNUITY ALLOCATION FOR INDIVIDUALS
In the Section 4 we compared different products or combinations. Our results of
those comparisons provided motivation to explore product combinations of various
proportions of account based pension and immediate lifetime annuity. This is
because, while deferred lifetime annuities appear to have promise, they are not
readily available in the Australian marketplace and are unlikely to be available
without changes to the tax rules. Furthermore, the performance of the variable
annuities at the EL and EL - 10 time horizons relative to the account based pension
led us to exclude them from the optimisation analysis.
We proceeded similarly to how we had previously, by:
Representing our income criteria by focusing on any shortfall in income versus
the set “desired income” for expected life
Considering this shortfall up until the retiree’s expected life, disregarding
subsequent years, but also illustrating any assets remaining which would be
available for inheritance
Retaining a stochastic model to produce a range of scenarios and illustrating
the 10th, 50th and 90th percentiles
To illustrate the outcome for different outlooks of “expected life” we repeated the
exercise for lifespans which exceeded and fell short of the statistical expectation by
10 years.
For the calculations in the remainder of this section, we have made the following
assumptions:
All fixed costs are paid upfront
That an annuity would form part of a retiree’s defensive asset mix so that we
would invest the account based pension more heavily in growth assets as we
increase our annuity allocation. We have assumed that a 0% annuity
allocation would lead to a 60:40 account based pension, a 25% annuity
allocation would lead to a 70:30 invested account based pension and that a
50% annuity would lead to a 80:20 invested account based pension.
As in sections 5 and 6, the product combinations we explored are varying
proportions of account based pension and annuity. As retirees typically prefer
to retain some liquidity, we have not illustrated annuity proportions above
50%.
That the economic environment is similar to the current low inflation
environment.
We performed the analysis on several retiree profiles which are provided in the table
below. This section comments on results for profile 2. For all other results, see
Appendix D.

18
Table 4: List of retiree profiles that were analysed
Profile Family Status Gender Account balance Desired income
1 Single Male $200,000 $30,000
2 Single Male $400,000 $43,00014
3 Single Male $600,000 $43,00015
4 Single Male $1,000,000 $58,000
5 Couple Male and female $250,000 $40,000
6 Couple Male and female $500,000 $58,00015
7 Couple Male and female $700,000 $58,00016
8 Couple Male and female $1,200,000 $73,000
Our first step in this optimisation analysis was to revisit the concept of shortfall (Figure
2) – which is the cumulative, non-discounted sum of monthly income “misses”
(desired income minus actual income) over the projection period. In addition, we
add any potential inheritance if there is any account balance remaining at the end
of the projection period. So, a negative amount represents a shortfall and a positive
amount represents an inheritance amount. The results below are for a single male
aged 67 with an account balance of $400,000 and a drawdown rate of $43,000 per
annum (profile 2).
Figure 7: Potential inheritance or income shortfall
Outcomes differ greatly depending on the market scenario
In the figure above we can see how the levels of total shortfall over the retiree
lifespan vary depending on the market scenario (as represented by the different
percentiles) and annuity allocation used. For example, as expected, we see that a
pure account based pension (0% annuity allocation) experiences fewer shortfalls in
both the EL and EL + 10 cases as the market scenario improves.
Viewing the same data in a different order can highlight certain stories Viewing this same information in a different order allows us to more easily notice
other trends to come from this modelling. Below is the same graph as above, but
with the order of the columns changed so that each set of three column-pairs
14
This level is approximately equal to the ASFA Comfortable income level for individuals. This represents the annual
income needed by Australians to fund a comfortable standard of living in retirement, as estimated by ASFA. 15
This level is approximately equal to the ASFA Comfortable income level for couples.
EL
EL + 10-$800,000
-$700,000
-$600,000
-$500,000
-$400,000
-$300,000
-$200,000
-$100,000
$0
$100,000
$200,000
10th
percentile
Median 90th
percentile
10th
percentile
Median 90th
percentile
10th
percentile
Median 90th
percentile
0% 25% 50%
Pu
re fin
an
cia
l sh
ort
fall
Expected Life
EL + 10
Market scenario
Annuity allocation

19
represents the impact of increasing the portfolio annuity allocation within a
particular market scenario. This re-ordering makes it clear that in a strong market
scenario up to expected life, a 50% annuity allocation does not produce the best
outcome and so a retiree with an optimistic outlook on the economy may elect to
not annuitise at all. Conversely, a risk averse retiree may annuitse 50% of their
portfolio to minimise their shortfall in the event that either market performance is
poor or they outlive their expected life, or both.
Figure 8: Potential inheritance or income shortfall (re-ordered)
What is missing from this aggregate level picture is the depth and duration of the
income shortfall. While the shortfall outcomes at expected life can sometimes be
similar for different levels of annuitisation, the depth and duration will differ. In order
to present this trade-off between depth and duration of shortfall we assigned a
different colour on the chart for a different degree of shortfall, as per the following
guide. This presents enough information to inform retirees of the reality of a deep fall
in income on account exhaustion, to allow them to compare this against the
potential for asset outperformance.
Figure 9: Inflation adjusted income, showing various shortfall levels
Using this scheme we can present the difference between 0% and 50% annuitisation,
in a median market outcome by contrasting these two charts:
EL
EL + 10-$800,000
-$700,000
-$600,000
-$500,000
-$400,000
-$300,000
-$200,000
-$100,000
$0
$100,000
$200,000
0% 25% 50% 0% 25% 50% 0% 25% 50%
10th percentile Median 90th percentile
Pu
re fin
an
cia
l sh
ort
fall
Expected Life
EL + 10
Annuity allocation
Market scenario
Expect ed life Expect ed life + 10
Desired income
$0
$10,000
$20,000
$30,000
$40,000
$50,000
$60,000
$70,000
1 2 3 4 5 6 7 8 9 10 11 12 13 14 15 16 17 18 19 20 21 22 23 24 25 26 27 28 29 30
Year

20
Figure 10: Comparison of income shortfall profiles with 0% and 50% annuitisation, respectively
To illustrate, side by side, a greater range of product combinations and economic
outcomes, we have used this colour scheme in the following summary chart. The top
section of the chart displays the proportion of years that the retiree’s desired income
is provided for by their chosen product combination. Where there is a period of
shortfall, the level of this shortfall is indicated by the colour coding above. Each pair
of columns presents this information for the EL and EL + 10 time horizons as
introduced in our analysis earlier. The bottom section of the chart shows the average
levels of shortfall per annum (provided there was a shortfall) over the given time
horizon.
Figure 11: Indicating duration and depth of income shortfall
Expect ed life
Desired income
$0
$10,000
$20,000
$30,000
$40,000
$50,000
$60,000
$70,000
1 2 3 4 5 6 7 8 9 10 11 12 13 14 15 16 17 18 19 20
Year
ABP drawdown
Age Pension
Expect ed life
Desired income
$0
$10,000
$20,000
$30,000
$40,000
$50,000
$60,000
$70,000
1 2 3 4 5 6 7 8 9 10 11 12 13 14 15 16 17 18 19 20
Year
ABP drawdown
Annuity payments
Age Pension
EL
EL + 10
0
5
10
15
20
25
30
35
Ye
ars
exp
erie
nc
ing
sh
ort
fall
-$60,000
-$50,000
-$40,000
-$30,000
-$20,000
-$10,000
$0
0% 25% 50% 0% 25% 50% 0% 25% 50%
10th Median 90th
De
gre
e o
f sh
ort
fall
(pa
)
0-10% 10-20% 20-30% 30-40% 40-50% 50% +
Annuity allocation
Market scenario

21
There is a trade-off between more income in the short term versus more income in
the long term
Examining first the median outcomes at expected life, what we see is that,
unsurprisingly, by choosing more or less annuitisation we are making a trade-off
between a long shortfall and a deep shortfall. However if our intuition about retirees’
utility is right then the information around the depth of shortfall should lead some
towards more annuitisation. This visualisation of the results for poor market outcomes
or longer survival makes, as did Figure 8, more annuitisation appear attractive. This
visualisation further amplifies this message by showing relatively few additional years
of shortfall, and with significantly less shortfall.
The modelling indicates that an allocation to annuities of up to 50% will, for some
retirees, be appropriate and can deliver superior retirement outcomes. However,
applying mathematical models to real world client scenarios requires consideration
by advisers and their clients of criteria including risk aversion, liquidity needs, health
and longevity, expected Age Pension entitlements and income expectations,
among others.

22
7. SUMMARY AND CONCLUSION
Solving the retirement riddle is not easy. To establish the optimal retirement income
solution, we first had to establish the features that retirees find valuable. This allowed
us to construct measures on which we could compare the performance of
retirement income solutions. Since the universe of retirement income solutions is
large, we limited our analysis to a set of the most common products, as well as
certain combinations of those products.
To investigate the range of outcomes produced by each retirement income
solution, we developed a stochastic projection model. We then investigated the
performance measures under various economic scenarios and retiree lifespans. The
results showed that, as expected, all products – with the exception of the variable
annuity – performed similarly in average economic markets, in the base life
expectancy scenario. However, account based pensions, which are the most
common form of retirement income solution currently, exhibit poorer performance
than any of the annuity products when the retiree exceeds their expected life by ten
years. The results also showed that combinations of account based pension and
lifetime annuity can deliver attractive outcomes. The results for deferred annuities
are particularly appealing, confirming that they will be a welcome component of
the retirement toolkit.
Based on these results, and the current lack of availability of deferred lifetime
annuities, we decided to further investigate the retirement income solution of part
account based pension, part lifetime annuity. This still provided us with many
dimensions to present and so we considered using a utility function to reduce the
dimensionality of the problem. Unfortunately utility functions have their own issues
and instead of using one to bypass meaningful financial adviser conversations with
retirees about the various trade-offs, we believe there is benefit in presenting these
trade-offs in meaningful ways to assist those conversations.
We constructed shortfall charts which display the time experiencing shortfall and the
actual dollar value of the shortfall to be expected over the retiree’s life. These charts
provide insights that may not be available to retirees contemplating incorporating
annuities into their retirement income solution. The results show that partial
annuitisation, if the benefits are well-presented, may appeal to retirees who are risk
averse.
Keeping this in mind, as well as the recent Murray Inquiry’s recommendation for all
superannuation trustees to offer Comprehensive Income Products for members’
Retirement (CIPRs), we believe that this kind of analysis will prove valuable over the
next phase of Australia’s retirement income landscape.

23
APPENDIX A – MODEL AND ASSUMPTIONS
We have constructed an asset model to assist us in the analysis and comparison of
the various retirement income options. This appendix summarises the methodology
and assumptions we have used in our analysis.
Asset Model
We have used a Monte Carlo simulation model to project the performance of future
economic variables which are then used in a range of product and asset allocation
scenarios. The model enables simulation of the following economic variables:
Consumer Price Index (CPI)
Average Weekly Earnings (AWE)
Cash Rate
Fixed Income
Domestic Equity
International Equity
Listed Property
The model comprises expected levels and returns of each of these variables, as well
as their possible variation and interaction. The expectation and variation of each of
the variables is based primarily on economic fundamentals; however in setting these
assumptions we do also consider historical experience. The interaction between the
variables has been estimated using observed historical levels and returns. Further, we
have assumed all continuous time changes in variables are normally distributed and
their joint distribution is characterised by a Gaussian copula. This results in lognormal
distributions of asset values.
Expected asset returns
The table below presents our expected levels/returns for each of the above
variables. These are continuously compoundable returns expressed on an annual
basis.
Table 5: Expectations of economic assumptions
Variable Annual growth/return
CPI 2.5%
AWE 3.5%
Cash rate 4.2%
Fixed income 5.1%
Australian equity 7.8%
Listed Property 7.8%
International equity 8.2%

24
Covariance structure
The expected returns presented above provide an average around which the
quantities will vary. That variation is expressed as volatility (standard deviation of
returns) with correlation parameters for each pair of variables.
Table 6: Asset class volatilities
Variable Volatility
CPI 1.6%
AWE 2.9%
Cash rate 0.4%
Fixed income 3.5%
Australian equity 13.6%
Listed Property 18.4%
International equity 16.3%
Table 7: Asset class correlation matrix
Variable CPI AWE Cash Fixed
Income
Aus
Equity
Listed
Property
Int’l
Equity
CPI 100% 10% 10% -7% -4% 0% -8%
AWE 10% 100% 3% 6% -11% 0% -2%
Cash rate 10% 3% 100% 27% -12% -17% -15%
Fixed Income -7% 6% 27% 100% -9% 2% -19%
Aus Equity
Equity
-4% -11% -12% -9% 100% 53% 75%
Listed Property 0% 0% -17% 2% 53% 100% 45%
Int’l Equity -8% -2% -15% -19% 75% 45% 100%
Expected life
The expected life assumption is critical to the analysis as it represents the time
horizon over which the various retirement income solutions are compared. For this
assumption, we have chosen a mortality basis that we believe to be representative
of the proportion of the population that are most inclined to purchase annuities –
white collar retirees. This is heavier than the mortality basis we have used to price the
annuities. See Appendix C for more details.
Table 8: Calculated expected lives under a white collar mortality basis
Profile Expected life
Male aged 67 87
3%
100% Male and female aged 67 93 (last survivor)
17%
0%

25
APPENDIX B – MEAN VERSUS MEDIAN OUTCOMES IN A STOCHASTIC PROJECTION
It is common for past asset returns to be analysed to make inferences about future
likely returns, and for average past returns to be used as a basis for both
deterministic projections as well as to calibrate the mean outcome for stochastic
projections. In analysing the range of outcomes of a stochastic projection, one has
a range of summary measures that can be used to describe outcomes, including
mean and median outcomes. In the context of investing, or drawing down a lump
sum, these measures have the following meanings. The median is the amount of
dollars expected to be received (or the minimum time the investment is expected to
last) 50% of the time. The mean has a more subtle interpretation. If the investment
was repeated many times, over consecutive time periods, and the relevant
measures recorded, the mean estimates the arithmetic average of these outcomes.
In the context of investing retirement savings to provide an income for life, it seems
more natural to focus on the median outcome, as investors cannot repeat their
retirement and take a long run average. Gaining an appreciation of more extreme
outcomes will add to this picture.
Since the distributions of investment proceeds are strongly skewed to the right, the
median will be less than the mean. An interesting corollary of this is that a
deterministic projection, using average returns will produce the mean outcome of
the stochastic projection, which exceeds the median and runs the risk of being
misunderstood in terms of its likelihood of being achieved, as this will be less than
50%. In this appendix, we explore these differences between mean and median in
the context of our model.
In our stochastic model, asset prices in an account based pension are assumed to
follow a lognormal distribution16. A common property of the lognormal distribution is
that the mean is whilst the median is , where and represent the mean
and standard deviation of the underlying normal distribution of continuous time
asset returns. This means that an asset stochastically projected with a lognormal
distribution will experience a distribution of outcomes where the mean will be
greater than median by a factor of . As for the trivial case of , this represents
a deterministic projection whereby the median outcome will, of course, be equal to
the mean.
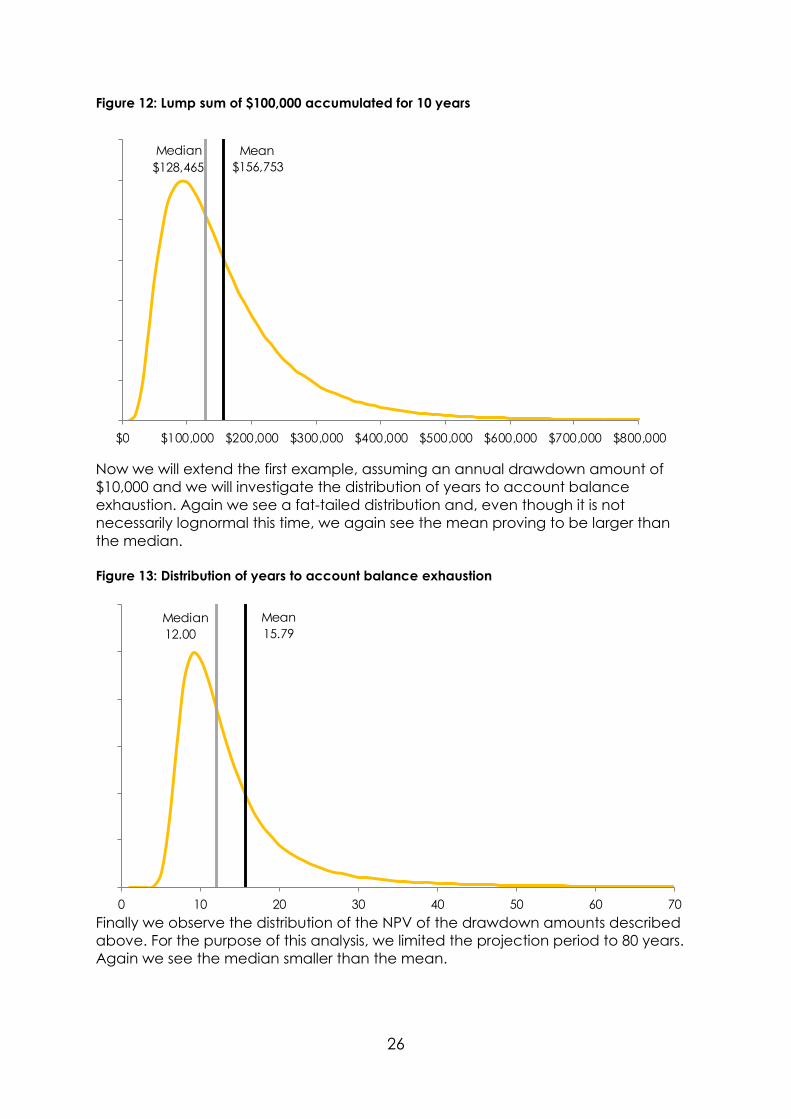
Let us first look at the distribution of asset values after ten years given a starting value
of $100,000. As expected, the mean is larger than the median due to the fat tail
outcomes pushing up the average.
16 Although we are aware of the limitations of this distribution, it is commonly used in industry to value equity
derivatives
26
Figure 12: Lump sum of $100,000 accumulated for 10 years
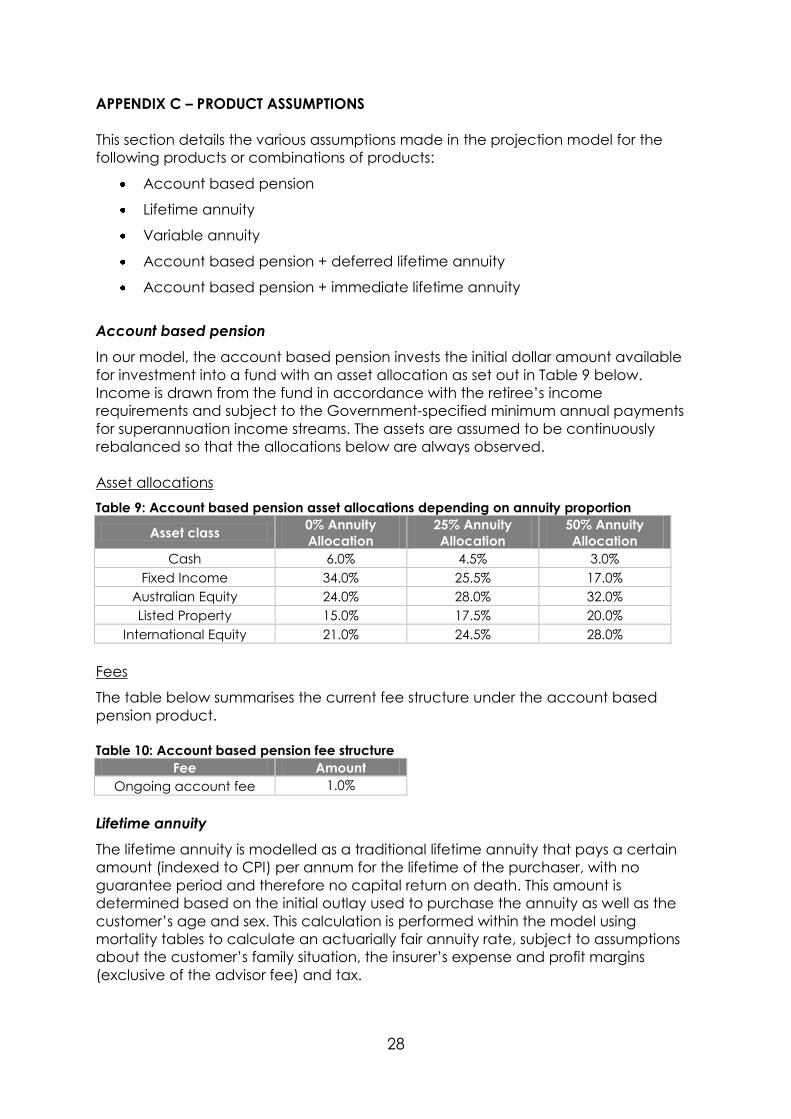
Now we will extend the first example, assuming an annual drawdown amount of
$10,000 and we will investigate the distribution of years to account balance
exhaustion. Again we see a fat-tailed distribution and, even though it is not
necessarily lognormal this time, we again see the mean proving to be larger than
the median.
Figure 13: Distribution of years to account balance exhaustion
Finally we observe the distribution of the NPV of the drawdown amounts described
above. For the purpose of this analysis, we limited the projection period to 80 years.
Again we see the median smaller than the mean.
$156,753
Mean
$128,465
Median
$0 $100,000 $200,000 $300,000 $400,000 $500,000 $600,000 $700,000 $800,000
Mean
15.7912.00
Median
0 10 20 30 40 50 60 70

27
Figure 14: Distribution of NPVs of drawdowns from $100,000 balance at $10,000 pa
In summary, the implication of this phenomenon is two-fold:
1. Deterministic models, although sometimes useful for their simplicity, do not
incorporate asset volatility and therefore care should be used
communicating results from such models as they are likely to exceed median
outcomes, and are likely to be achieved less than 50% of the time.
2. Even though larger return assumptions may be used for account based
pensions than annuities, a comparison of median scenarios may not
necessarily favour the account based pension due to their higher volatility
and the median being smaller than the mean by
$100,738
Mean
$89,839
Median
$0 $50,000 $100,000 $150,000 $200,000 $250,000 $300,000
28
APPENDIX C – PRODUCT ASSUMPTIONS
This section details the various assumptions made in the projection model for the
following products or combinations of products:
Account based pension
Lifetime annuity
Variable annuity
Account based pension + deferred lifetime annuity
Account based pension + immediate lifetime annuity
Account based pension
In our model, the account based pension invests the initial dollar amount available
for investment into a fund with an asset allocation as set out in Table 9 below.
Income is drawn from the fund in accordance with the retiree’s income
requirements and subject to the Government-specified minimum annual payments
for superannuation income streams. The assets are assumed to be continuously
rebalanced so that the allocations below are always observed.
Asset allocations
Table 9: Account based pension asset allocations depending on annuity proportion
Asset class 0% Annuity
Allocation
25% Annuity
Allocation
50% Annuity
Allocation
Cash 6.0% 4.5% 3.0%
Fixed Income 34.0% 25.5% 17.0%
Australian Equity 24.0% 28.0% 32.0%
Listed Property 15.0% 17.5% 20.0%
International Equity 21.0% 24.5% 28.0%
Fees
The table below summarises the current fee structure under the account based
pension product.
Table 10: Account based pension fee structure
Fee Amount
Ongoing account fee 1.0%
17%
0%
Lifetime annuity
The lifetime annuity is modelled as a traditional lifetime annuity that pays a certain
amount (indexed to CPI) per annum for the lifetime of the purchaser, with no
guarantee period and therefore no capital return on death. This amount is
determined based on the initial outlay used to purchase the annuity as well as the
customer’s age and sex. This calculation is performed within the model using
mortality tables to calculate an actuarially fair annuity rate, subject to assumptions
about the customer’s family situation, the insurer’s expense and profit margins
(exclusive of the advisor fee) and tax.

29
Annuity pricing assumptions
The net of expenses and profit margin internal rate of return (IRR) used in the annuity
calculations is 3.69%. Note that this is not the annuity rate, since that varies
depending on the individual and the type of annuity purchased. For example, a 67
year old male with $500,000 to invest would receive $29,291 per annum (first year)
from a CPI-indexed immediate lifetime annuity. The resulting annuity rates were
consistent at the time of our calculations, after allowing for differences in bond
returns between our model and the economy, with rates available in the market.
Mortality assumptions
The mortality tables and mortality improvement assumptions used in the annuity
calculations lead to the following expected lives for the two retiree types
investigated:
Table 11: Calculated expected lives under the annuity mortality basis
Profile Expected life
Male aged 67 88
3%
100% Male and female aged 67 96 (last survivor)
17%
0%
Variable annuity
The variable annuity modelled is much like an account based pension in which the
initial dollar amount available for investment is placed into a fund with a specified
asset allocation (Defensive, Moderate, Growth). However the retiree has no control
over the income drawn out of the account balance, as this is fixed at purchase,
subject to the rules below:
Table 12: Age pension payment rates
Age at issue Payment rate (pa % of protected
income base over the life of the VA)
Under 65 4%
65 and over 5%
The dollar amount of income received per annum may change depending on the
Government-specified minimum annual payments for super income streams.
The dollar amount may also increase due to ratcheting or decrease due to SIS
minimum payments requiring higher than planned income payments being made.
Ratcheting
The percentage listed in Table 12 above is applied to the protected income base.
The protected income base is initially set equal to the account balance and is
redefined every year. If the account balance is higher than the protected income
base at the end of a particular year, the protected income base is reset to be equal
to the account balance. In this way, the retiree is rewarded for strong economic
performance within their fund. This ratcheting feature is paid for by a guarantee fee,
which we have assumed to be 2.00% pa for a 60/40 portfolio.

30
Asset allocations
Table 13: Variable annuity asset allocations
Asset class Allocation
Cash 6.0%
Fixed Income 34.0%
Australian Equity 24.0%
Listed Property 15.0%
International Equity 21.0%
Fees
The table below summarises the current fee structure under the variable annuity
product.
Table 14: Variable annuity fee structure
Account balance Fee
First $200,000 0.40% pa
Next $600,000 0.25% pa
Over $800,000 0.20% pa
Plus:
Investment fee: 0.80% pa
Guarantee fee: 2.00% pa
Spouse benefit: 0.90% pa
Account based pension + deferred annuity (75:25)
This product splits the initial amount available for investment between the account
based pension and the deferred annuity products. The proportion invested in the
account based pension is drawn down such that the customer’s desired income is
met until account balance depletion. The remainder is invested into a deferred
annuity product which has a deferment period equal to the expected exhaustion of
the account based pension.
The cost of the deferred annuity is determined using the same model as the
immediate annuity, including the assumptions that it would be available in a zero
tax environment, which is currently not the case in Australia.
Account based pension + lifetime annuity (75:25)
This product splits the initial amount available for investment between the account
based pension and the lifetime annuity products. The proportion invested in the
account based pension is drawn down such that the customer’s desired income is
met until account balance depletion. The remainder is invested into an indexed
lifetime annuity product.

31
APPENDIX D – ANNUITY ALLOCATION OUTPUT
In section 6 of this paper we used several charts to visualize the financial shortfall, or
surplus, against retirement goals for some sample retiree profiles. In this appendix we
include those charts for a wider range of profiles as set out in the following table.
Table 15: List of retiree profiles that were analysed
Profile Family Status Gender Account balance Desired income
1 Single Male $200,000 $30,000
2 Single Male $400,000 $43,000
3 Single Male $600,000 $43,000
4 Single Male $1,000,000 $58,000
5 Couple Male and female $250,000 $40,000
6 Couple Male and female $500,000 $58,000
7 Couple Male and female $700,000 $58,000
8 Couple Male and female $1,200,000 $73,000

32
Figure 15
Profile 1 - Assets:$200,000 Desired income: $30,000 Status: Single
EL
EL + 10
-$300,000
-$200,000
-$100,000
$0
$100,000
$200,000
$300,000
0% 25% 50% 0% 25% 50% 0% 25% 50%
10th percentile Median 90th percentile
Pu
re fin
an
cia
l sh
ort
fall
Expected Life
EL + 10
EL
EL + 10
0
5
10
15
20
25
30
35
Ye
ars
exp
erie
nc
ing
sh
ort
fall
-$25,000
-$20,000
-$15,000
-$10,000
-$5,000
$0
0% 25% 50% 0% 25% 50% 0% 25% 50%
10th Median 90th
De
gre
e o
f sh
ort
fall
(pa
)
0-10% 10-20% 20-30% 30-40% 40-50% 50% +
Annuity allocation
Market scenario
Annuity allocation
Market scenario

33
Figure 16
Profile 2 - Assets:$400,000 Desired income: $43,000 Status: Single
EL
EL + 10-$800,000
-$700,000
-$600,000
-$500,000
-$400,000
-$300,000
-$200,000
-$100,000
$0
$100,000
$200,000
0% 25% 50% 0% 25% 50% 0% 25% 50%
10th percentile Median 90th percentile
Pu
re fin
an
cia
l sh
ort
fall
Expected Life
EL + 10
EL
EL + 10
0
5
10
15
20
25
30
35
Ye
ars
exp
erie
nc
ing
sh
ort
fall
-$60,000
-$50,000
-$40,000
-$30,000
-$20,000
-$10,000
$0
0% 25% 50% 0% 25% 50% 0% 25% 50%
10th Median 90th
De
gre
e o
f sh
ort
fall
(pa
)
0-10% 10-20% 20-30% 30-40% 40-50% 50% +
Annuity allocation
Market scenario
Annuity allocation
Market scenario

34
Figure 17
Profile 3 - Assets:$600,000 Desired income: $43,000 Status: Single
-$800,000
-$600,000
-$400,000
-$200,000
$0
$200,000
$400,000
$600,000
$800,000
0% 25% 50% 0% 25% 50% 0% 25% 50%
10th percentile Median 90th percentile
Pu
re fin
an
cia
l sh
ort
fall
Expected Life
EL + 10
EL
EL + 10
0
5
10
15
20
25
30
35
Ye
ars
exp
erie
nc
ing
sh
ort
fall
-$70,000
-$60,000
-$50,000
-$40,000
-$30,000
-$20,000
-$10,000
$0
0% 25% 50% 0% 25% 50% 0% 25% 50%
10th Median 90th
De
gre
e o
f sh
ort
fall
(pa
)
0-10% 10-20% 20-30% 30-40% 40-50% 50% +
Annuity allocation
Market scenario
Annuity allocation
Market scenario

35
Figure 18
Profile 4 - Assets:$1,000,000 Desired income: $58,000 Status: Single
-$1,500,000
-$1,000,000
-$500,000
$0
$500,000
$1,000,000
$1,500,000
0% 25% 50% 0% 25% 50% 0% 25% 50%
10th percentile Median 90th percentile
Pu
re fin
an
cia
l sh
ort
fall
Expected Life
EL + 10
EL
EL + 10
0
5
10
15
20
25
30
35
Ye
ars
exp
erie
nc
ing
sh
ort
fall
-$100,000
-$90,000
-$80,000
-$70,000
-$60,000
-$50,000
-$40,000
-$30,000
-$20,000
-$10,000
$0
0% 25% 50% 0% 25% 50% 0% 25% 50%
10th Median 90th
De
gre
e o
f sh
ort
fall
(pa
)
0-10% 10-20% 20-30% 30-40% 40-50% 50% +
Annuity allocation
Market scenario
Annuity allocation
Market scenario

36
Figure 19
Profile 5 - Assets:$250,000 Desired income: $40,000 Status: Couple
-$400,000
-$300,000
-$200,000
-$100,000
$0
$100,000
$200,000
$300,000
$400,000
$500,000
$600,000
0% 25% 50% 0% 25% 50% 0% 25% 50%
10th percentile Median 90th percentile
Pu
re fin
an
cia
l sh
ort
fall
Expected Life
EL + 10
EL
EL + 10
0
5
10
15
20
25
30
35
40
Ye
ars
exp
erie
nc
ing
sh
ort
fall
-$35,000
-$30,000
-$25,000
-$20,000
-$15,000
-$10,000
-$5,000
$0
0% 25% 50% 0% 25% 50% 0% 25% 50%
10th Median 90th
De
gre
e o
f sh
ort
fall
(pa
)
0-10% 10-20% 20-30% 30-40% 40-50% 50% +
Annuity allocation
Market scenario
Annuity allocation
Market scenario

37
Figure 20
Profile 6 - Assets:$500,000 Desired income: $58,000 Status: Couple
-$1,400,000
-$1,200,000
-$1,000,000
-$800,000
-$600,000
-$400,000
-$200,000
$0
$200,000
0% 25% 50% 0% 25% 50% 0% 25% 50%
10th percentile Median 90th percentile
Pu
re fin
an
cia
l sh
ort
fall
Expected Life
EL + 10
EL
EL + 10
0
5
10
15
20
25
30
35
40
Ye
ars
exp
erie
nc
ing
sh
ort
fall
-$70,000
-$60,000
-$50,000
-$40,000
-$30,000
-$20,000
-$10,000
$0
0% 25% 50% 0% 25% 50% 0% 25% 50%
10th Median 90th
De
gre
e o
f sh
ort
fall
(pa
)
0-10% 10-20% 20-30% 30-40% 40-50% 50% +
Annuity allocation
Market scenario
Annuity allocation
Market scenario

38
Figure 21
Profile 7 - Assets:$700,000 Desired income: $58,000 Status: Couple
-$1,200,000
-$1,000,000
-$800,000
-$600,000
-$400,000
-$200,000
$0
$200,000
$400,000
$600,000
0% 25% 50% 0% 25% 50% 0% 25% 50%
10th percentile Median 90th percentile
Pu
re fin
an
cia
l sh
ort
fall
Expected Life
EL + 10
EL
EL + 10
0
5
10
15
20
25
30
35
40
Ye
ars
exp
erie
nc
ing
sh
ort
fall
-$90,000
-$80,000
-$70,000
-$60,000
-$50,000
-$40,000
-$30,000
-$20,000
-$10,000
$0
0% 25% 50% 0% 25% 50% 0% 25% 50%
10th Median 90th
De
gre
e o
f sh
ort
fall
(pa
)
0-10% 10-20% 20-30% 30-40% 40-50% 50% +
Annuity allocation
Market scenario
Annuity allocation
Market scenario

39
Figure 22
Profile 8 - Assets:$1,200,000 Desired income: $73,000 Status: Couple
-$2,000,000
-$1,500,000
-$1,000,000
-$500,000
$0
$500,000
$1,000,000
0% 25% 50% 0% 25% 50% 0% 25% 50%
10th percentile Median 90th percentile
Pu
re fin
an
cia
l sh
ort
fall
Expected Life
EL + 10
EL
EL + 10
0
5
10
15
20
25
30
35
40
Ye
ars
exp
erie
nc
ing
sh
ort
fall
-$160,000
-$140,000
-$120,000
-$100,000
-$80,000
-$60,000
-$40,000
-$20,000
$0
0% 25% 50% 0% 25% 50% 0% 25% 50%
10th Median 90th
De
gre
e o
f sh
ort
fall
(pa
)
0-10% 10-20% 20-30% 30-40% 40-50% 50% +
Annuity allocation
Market scenario
Annuity allocation
Market scenario

40
ACKNOWLEDGEMENTS
Alistair See, Ernst & Young Actuarial Services, for assisting with the construction
of the retirement income stochastic projection model
Aman Ramrakha and Brent Bevan, CBA Advice Research, for guiding model
design and informing the application of its output to real world portfolios
Andrew Harman, Colonial First State Global Asset Management, for providing
the expected asset class returns and covariance structure
Craig Day, Kym Guest and Tim Sanderson, CBA Advice Technical Services, for
their assistance on model and output design
Leigh Kobus, Fintan Thornton and Clarence Law, Colonial First State and
CommInsure, for their actuarial guidance and feedback
Related Documents


![Optimal Financial Literacy and Saving for Retirement...individualswithbusinessassets.10 [Figure1here] Ourevidence,consistentwithotherstudies(e.g. CampbellandViceira,2002),indicates](https://static.cupdf.com/doc/110x72/61426953d9e4dc11f47f08c4/optimal-financial-literacy-and-saving-for-retirement-individualswithbusinessassets10.jpg)


