The opportunity for offshore February 2020 Pieter Fourie Head of Global Equities Sanlam UK For professional investors only

Welcome message from author
This document is posted to help you gain knowledge. Please leave a comment to let me know what you think about it! Share it to your friends and learn new things together.
Transcript

The opportunity for offshore
February 2020Pieter FourieHead of Global Equities Sanlam UK
For professional investors only

For authorised intermediaries only and not for distribution to retail investors
2
Sanlam Private Wealth is a trading name of Sanlam Private Investments (UK) Ltd which is
authorised and regulated by the Financial Conduct Authority. Registered in England and
Wales No.2041819. Registered Office: 16 South Park, Sevenoaks, Kent TN13 1AN.
This presentation is for information purposes and should not be treated as a forecast,
research or advice to buy or sell any particular investment or to adopt any investment
strategy. Any views expressed are based on information received from a variety of sources
which we believe to be reliable, but are not guaranteed as to accuracy or completeness by
Sanlam Private Wealth. Any expressions of opinion are subject to change without notice.
Reproduction of this presentation is not allowed in whole or in part without prior written
agreement from Sanlam Private Wealth. Past performance is not a reliable indicator of
future results. Investing involves risk and the value of investments and the income from
them may fall as well as rise and are not guaranteed. Investors may not get back the
original amount invested.
Agenda
3
1. Economic outlook
2. Market outlook
3. Philosophy and process
4. Performance
5. Portfolio analysis
6. Case studies
7. Market and outlook
8. Appendix

Economic Outlook
4
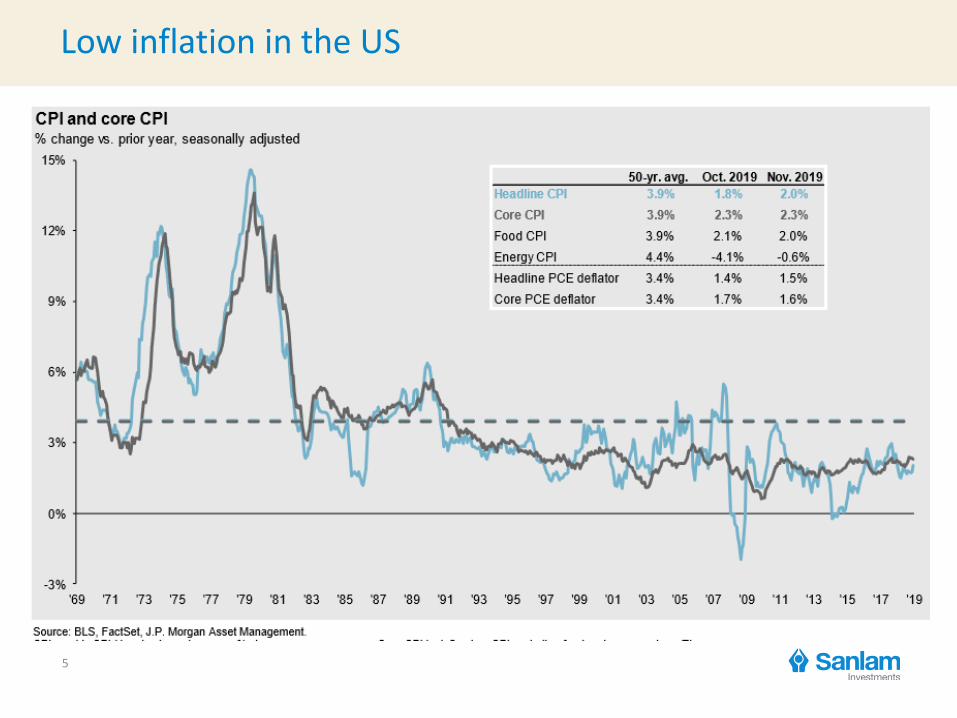
Low inflation in the US
5
Source : Bloomberg, UK Office for National Statistics, Federal Reserve Bank of Atlanta

Consumer sentiment positive - low unemployment
6
Source : Bloomberg, UK Office fro National Statistics, Bureau of Labor Statistics

Low employment lead to wage gains
7
Source : Bloomberg, UK Office for National Statistics, Federal Reserve Bank of Atlanta

Loose fiscal regime
8 Source: Sanlam, Bloomberg,
Aggregate US Tax Rate

European recovery has stalled forcing ECB’s hand
9Sources: JPM
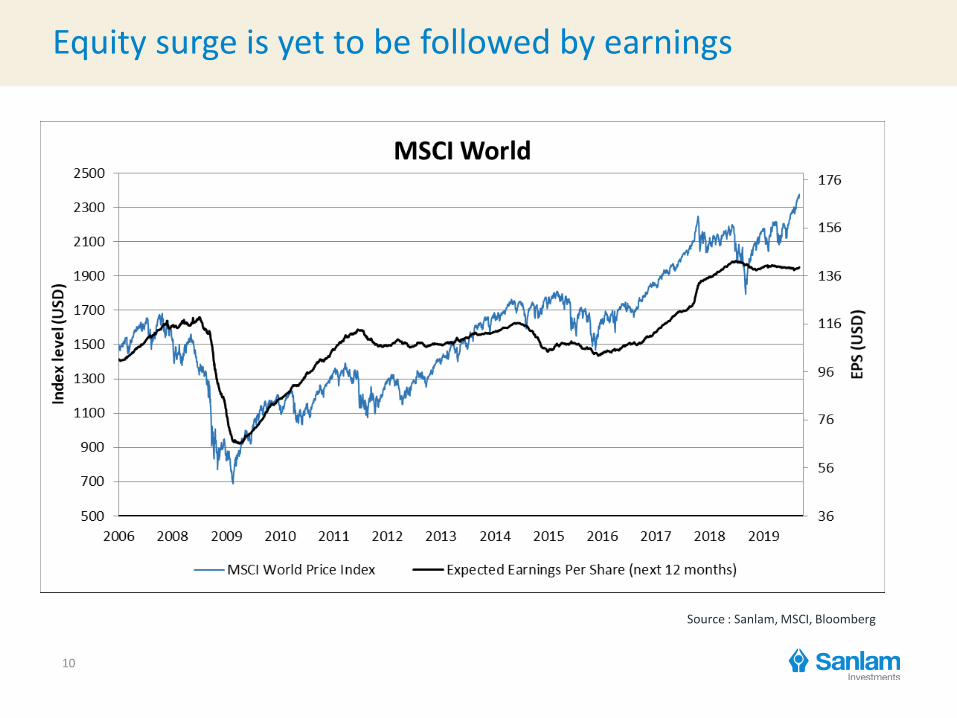
Equity surge is yet to be followed by earnings
10
Source : Sanlam, MSCI, Bloomberg

S&P 500 – blended forward PE
11
Source : Sanlam, MSCI, Bloomberg

Market Outlook
12

Government bonds are not fit for purpose
13
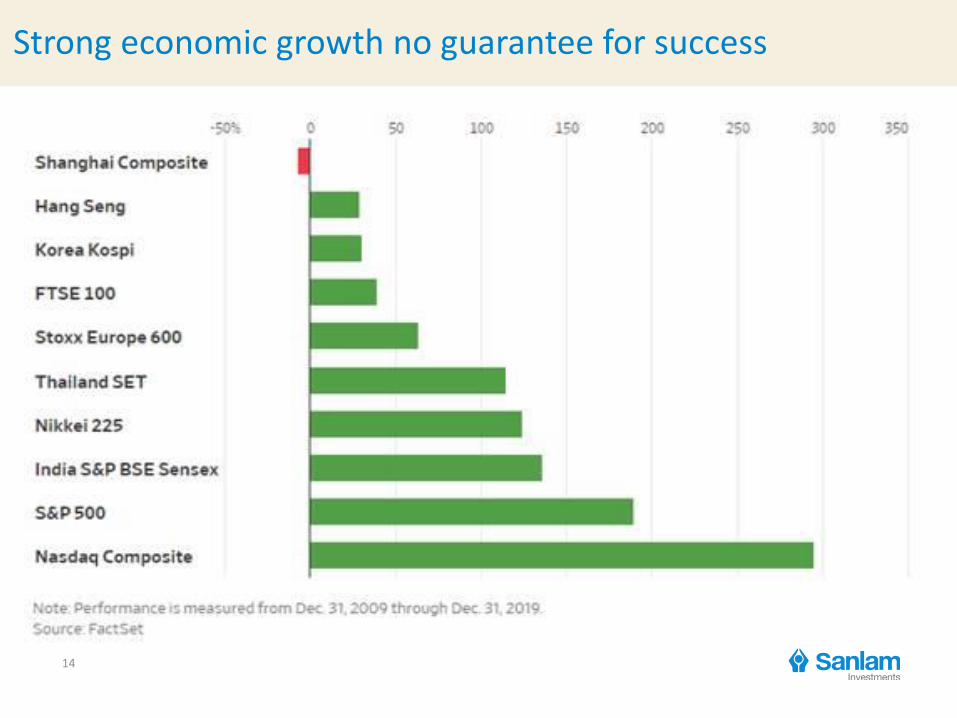
Strong economic growth no guarantee for success
14

US out performance was led by earnings growth
15

Growth trumps value over the last decade
16
5
6
7
8
9
10
11
12
13
14
2005 2007 2009 2011 2013 2015 2017 2019
Ente
rpri
ce V
alu
e t
o E
xpe
cte
d E
BIT
DA
Growth Vs Value
MSCI WORLD GROWTH INDEX MSCI WORLD VALUE INDEX

Fang dominates returns
17 Source: Sanlam, Bloomberg,

Fangs have very strong balance sheets
18 Source: Sanlam, Bloomberg,
The companies with the largest net cash position
Alphabet - $117BApple - $98BMicrosoft - $67BFacebook - $52B
Net cash position as a percentage of the market cap Alphabet - $930B = 12.6%Apple - $1.3T = 7.5%Microsoft - $1.23T = 5.4%Facebook - $598B = 8.7%
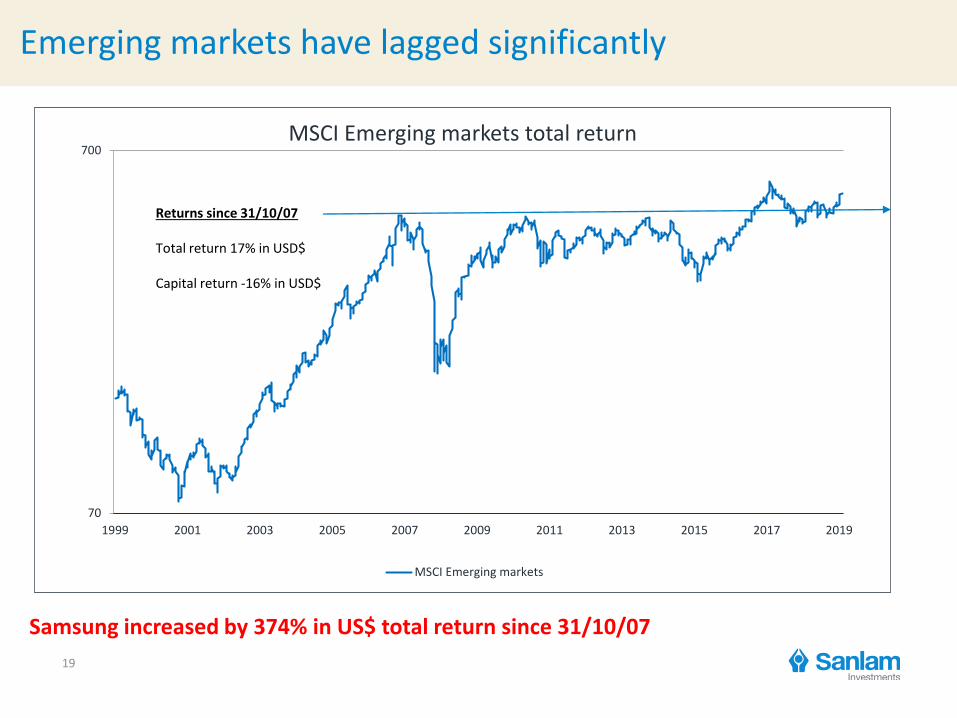
Emerging markets have lagged significantly
19
70
700
1999 2001 2003 2005 2007 2009 2011 2013 2015 2017 2019
MSCI Emerging markets total return
MSCI Emerging markets
Returns since 31/10/07
Total return 17% in USD$
Capital return -16% in USD$
Samsung increased by 374% in US$ total return since 31/10/07

Philosophy and Process
20

Global high quality team
21
Total assets under discretionary management $1.6 billion
INSTITUTIONAL FUNDS:
USD 900 million
DISCRETIONARY EQUITYMANDATES:
USD 700 million
Industry Recognition
FE Alpha
Manager Rated
2019

Investment process
22
Screen of Universe
Watchlist
Valuation
Construction
# Stocks
2700
120
25-35
Identify
Assess
Evaluate
Assign
Source: Sanlam as at 31/12/2019
#Stocks is an approximation

Stock analysis: quantitative screening
23
Income and cash flow:
• High free cash flow conversion
• Attractive gross & operating margins
• Sustainable revenue growth profile
• Secular growth industry
Balance sheet:
• Low leverage
• Low capital requirements
• High returns on capital
• Dynamic capital allocation
Bottom-up stock selection with a focus on high quality businesses

24
COMPANIES HELD SINCE INCEPTION
Microsoft
Diageo
Johnson & Johnson
Unilever
HELD AT INCEPTION, EXITED BASED ON
VALUATION
Nestle
Procter & Gamble
Accenture
Intertek
Mastercard
EXITED BASED ON VALUATION PRINCIPLES,
SUBSEQUENTLY RE-ENTERED
Samsung
Edwards Lifesciences
Yum China
Moody’s
CORE POSITION CHANGES IN 2019
ABI Inbev
General Dynamics
IHG
Pepsi (sell)
Active management, long-term time horizon
Active management

Performance
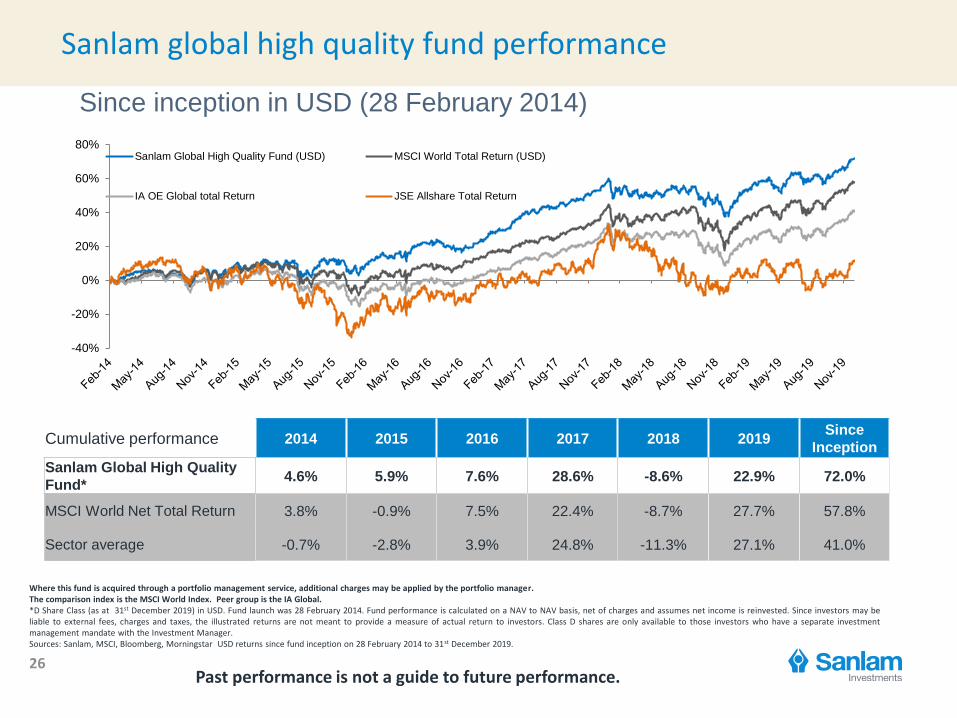
Sanlam global high quality fund performance
26
Cumulative performance 2014 2015 2016 2017 2018 2019Since
Inception
Sanlam Global High Quality
Fund*4.6% 5.9% 7.6% 28.6% -8.6% 22.9% 72.0%
MSCI World Net Total Return 3.8% -0.9% 7.5% 22.4% -8.7% 27.7% 57.8%
Sector average -0.7% -2.8% 3.9% 24.8% -11.3% 27.1% 41.0%
Where this fund is acquired through a portfolio management service, additional charges may be applied by the portfolio manager. The comparison index is the MSCI World Index. Peer group is the IA Global. *D Share Class (as at 31st December 2019) in USD. Fund launch was 28 February 2014. Fund performance is calculated on a NAV to NAV basis, net of charges and assumes net income is reinvested. Since investors may beliable to external fees, charges and taxes, the illustrated returns are not meant to provide a measure of actual return to investors. Class D shares are only available to those investors who have a separate investmentmanagement mandate with the Investment Manager.Sources: Sanlam, MSCI, Bloomberg, Morningstar USD returns since fund inception on 28 February 2014 to 31st December 2019.
Since inception in USD (28 February 2014)
Past performance is not a guide to future performance.
-40%
-20%
0%
20%
40%
60%
80%Sanlam Global High Quality Fund (USD) MSCI World Total Return (USD)
IA OE Global total Return JSE Allshare Total Return

Sanlam global high quality strategy performance
27
Since strategy inception in USD (30 April 2008)
Cumulative performance to 31st
December 20191 Year 3 Year 5 Year 7 Year 10 Year
Since
Inception
Sanlam Global High Quality Strategy 23.5% 45.5% 66.4% 102.8% 160.4% 164.5%
MSCI World Net Total Return 27.7% 42.7% 52.0% 102.1% 147.1% 99.0%
Sector average 27.1% 40.6% 42.0% 77.6% 106.0% 63.2%
Where this strategy is acquired through a portfolio management service, additional charges may be applied by the portfolio manager. The comparison index is the MSCI World Index with net dividends reinvested. Sources: SPW UK, Bloomberg, USD returns since strategy inception on 30 April 2008 to 31st December 2019Basis: GBP C share class (Base currency and class) shown in USD. NAV based, total return (net of fees). The Fund was launched on 28.02.2014 and therefore no earlier UCITS Fund performance numbers are availablePeriod: 30.04.2008 to 30.11.19 and represents a composite of the manager’s global equity track record.Past performance disclaimer. Performance from 30.04.2008 to 31.08.2012 is that of the ACPI segregated global equity mandate after all fees including transactions fees. From 31.08.2012 to 30.09.2012 is that of the MSCI WorldIndex while the manager transitioned to the Sanlam group and from 30.09.2012 to 28.02.2014 is that of the Sanlam Private Wealth Global Equity Diversified Portfolio (net of all costs including transaction fees).ACPI Investment Managers is an independently owned investment management partnershipPast performance should not be taken as an indicator of future performance.Since investors may be liable to external fees, charges and taxes, the illustrated returns are not meant to provide a measure of actual return to investors. Class C shares are only available to those investors who have a separateinvestment management mandate with the Investment Manager.
Past performance is not a guide to future performance.

Global High Quality Fund - statistics
28 Sources: Sanlam, MSCI, Bloomberg as at 31/12/2019
Sanlam Global High Quality Fund vs MSCI World
Since Inception in USD GHQF* Bmk
Total Return 74.3% 57.8%
Annualised Return 10.0% 8.1%
Annualised Volatility 10.0% 11.0%
Max Drawdown -11.6% -13.4%
Sharpe Ratio 0.70 0.47
Information Ratio 0.36
Beta 0.84
Alpha 2.7%
Annualised Tracking Error 4.3%
Where this fund is acquired through a portfolio management service, additional charges may be applied by the portfolio manager. The comparison index is the MSCI World Index. *C Share Class (as at 31st December 2019) in USD. Fund launch was 28 February 2014. Fund performance is calculated on a NAV to NAV basis, net of charges and assumes net income is reinvested. Since investors may be liable to external fees, charges and taxes, the illustrated returns are not meant to provide a measure of actual return to investors. Class C shares are only available to those investors who have a separate investment management mandate with the Investment Manager. Sources: Sanlam, MSCI, Bloomberg returns since fund inception on 28 February 2014 to 31st December 2019.

Portfolio Analysis

Top holdings as at 31st December 2019
30
Name Sector Weight (%)
Bayer Health Care 4.0
Medtronic Health Care 3.8
Tencent Communications 3.8
Alphabet Communications 3.7
Facebook Communications 3.7
Reckitt Benckiser Consumer Staples 3.7
British American Tobacco Consumer Staples 3.6
Samsung Information Technology 3.5
Booking Holdings Consumer Discretionary 3.5
Johnson & Johnson Health Care 3.5
Source: Sanlam

Global High Quality Fund - Sector positions
31 Sources: Sanlam, MSCI, Bloomberg as at 31/12/2019
0.0 5.0 10.0 15.0 20.0 25.0
Communication Services
Consumer Discretionary
Consumer Staples
Energy
Financials
Health Care
Industrials
Information Technology
Materials
Real Estate
Utilities
Benchmark Fund

Global High Quality Fund 2019 Attribution
32 Sources: Sanlam, Bloomberg USD returns from 31/12/2018 to 31/12/2019
Name Total return % Contribution to return %
Top Performers
Facebook 56.6 1.9
Allergan 45.3 1.4
Microsoft 57.6 1.3
Alphabet 29.2 1.3
Samsung 40.5 1.2
Bottom Performers
Anheuser-Busch Inbev 4.0 0.1
Altria 8.0 0.1
Imperial Brands 4.1 0.1
General Dynamics -2.5 -0.1
Cognizant -0.9 -0.1

Representation of exposures by regional revenue
33
34.1%
24.3%
36.4%
5.2%
Revenue Exposure - 2014
North America Europe
Emerging Markets Other Developed Markets
41.8%
25.4%
29.9%
3.0%
Revenue Exposure - 2019
North America Europe
Emerging Markets Other Developed Markets

European Food & HPC: Sales Breakdown by Country
34Source: Bernstein, 2018
0%
10%
20%
30%
40%
50%
60%
70%
W. Europe N. America Other DMs Emerging Markets
Danone Reckitt Benckiser Unilever

Case Studies

15
17
19
21
23
25
27
29
31
33
35
Sep 09 Sep 10 Sep 11 Sep 12 Sep 13 Sep 14 Sep 15 Sep 16 Sep 17 Sep 18
12 month forward price earnings ratio
F12M P/E Ratio +2 SD +1 SD Average -1 SD -2 SD
Intercontinental Hotel Group
36 Sources: Sanlam, Bloomberg
Return on equity 43%, and 5.5% free cash flow yield
• China growing at double digits
• Conservative growth assumptions
• Attractive free cash flow yields versus consumer staples
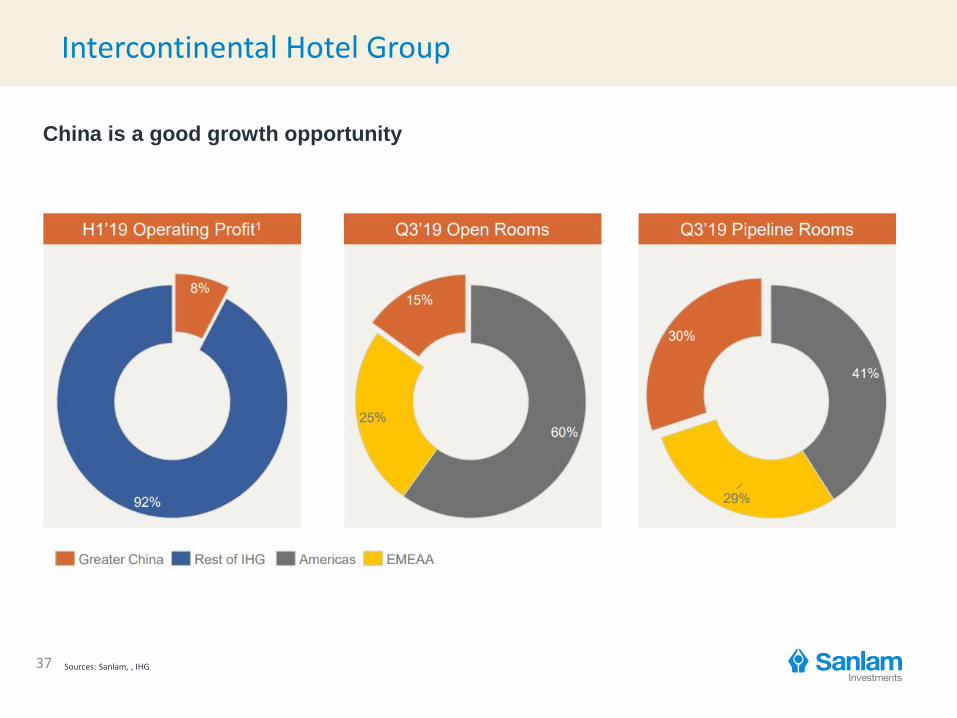
Intercontinental Hotel Group
37 Sources: Sanlam, , IHG
China is a good growth opportunity
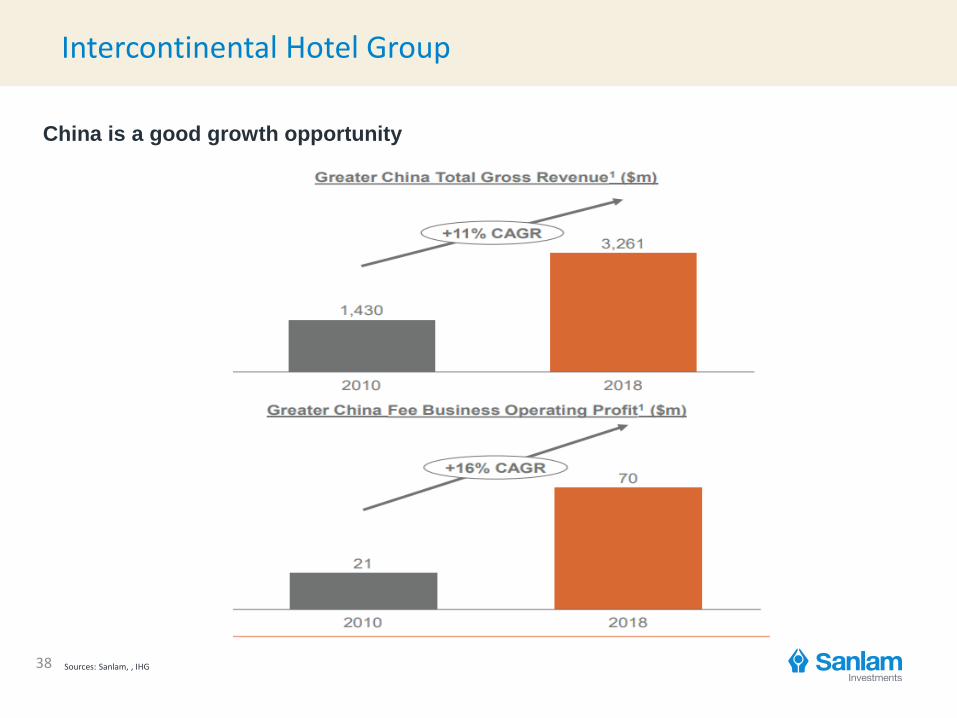
Intercontinental Hotel Group
38 Sources: Sanlam, , IHG
China is a good growth opportunity

Alphabet
39 Sources: Sanlam, Bloomberg
• Valuation at the top end of the five year range
• Communications sector presented in top five positions
• Reduced position for risk control
15
16
17
18
19
20
21
22
23
24
25
Jan 13 Jan 14 Jan 15 Jan 16 Jan 17 Jan 18 Jan 19
12 month forward Price earnings ratio
F12M P/E Ratio +2 SD +1 SD Average -1 SD -2 SD

Sanlam Global High Quality Fund valuation discipline
40 Source: Sanlam, Bloomberg, data at 31st December 2019, Sanlam Global High Quality Fund
15.7 15.7
18.6 18.5
16.6
15.1
27.3 27.7
29.4 29.6
27.726.5
0.0
5.0
10.0
15.0
20.0
25.0
30.0
35.0
Q4 2014 Q4 2015 Q4 2016 Q4 2017 Q4 2018 Q4 2019
P/E (NTM) Return on Equity (NTM) (%)

Appendix
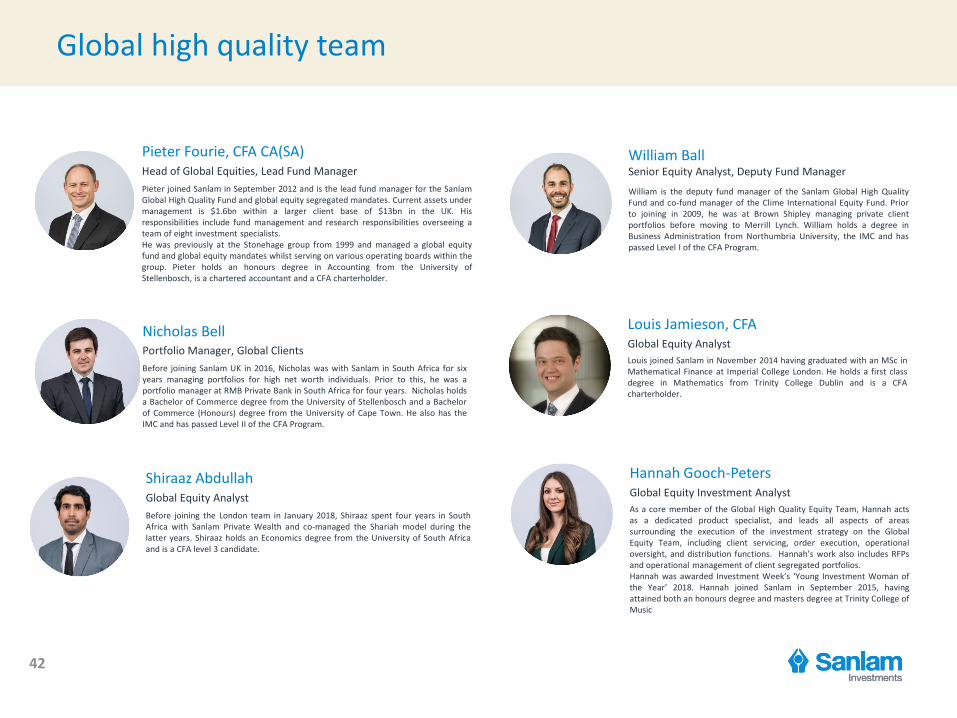
Global high quality team
42
Pieter Fourie, CFA CA(SA)
Pieter joined Sanlam in September 2012 and is the lead fund manager for the SanlamGlobal High Quality Fund and global equity segregated mandates. Current assets undermanagement is $1.6bn within a larger client base of $13bn in the UK. Hisresponsibilities include fund management and research responsibilities overseeing ateam of eight investment specialists.He was previously at the Stonehage group from 1999 and managed a global equityfund and global equity mandates whilst serving on various operating boards within thegroup. Pieter holds an honours degree in Accounting from the University ofStellenbosch, is a chartered accountant and a CFA charterholder.
William Ball
William is the deputy fund manager of the Sanlam Global High QualityFund and co-fund manager of the Clime International Equity Fund. Priorto joining in 2009, he was at Brown Shipley managing private clientportfolios before moving to Merrill Lynch. William holds a degree inBusiness Administration from Northumbria University, the IMC and haspassed Level I of the CFA Program.
Nicholas Bell
Before joining Sanlam UK in 2016, Nicholas was with Sanlam in South Africa for sixyears managing portfolios for high net worth individuals. Prior to this, he was aportfolio manager at RMB Private Bank in South Africa for four years. Nicholas holdsa Bachelor of Commerce degree from the University of Stellenbosch and a Bachelorof Commerce (Honours) degree from the University of Cape Town. He also has theIMC and has passed Level II of the CFA Program.
Head of Global Equities, Lead Fund Manager Senior Equity Analyst, Deputy Fund Manager
Portfolio Manager, Global Clients
Shiraaz Abdullah
Before joining the London team in January 2018, Shiraaz spent four years in SouthAfrica with Sanlam Private Wealth and co-managed the Shariah model during thelatter years. Shiraaz holds an Economics degree from the University of South Africaand is a CFA level 3 candidate.
Louis Jamieson, CFA
Louis joined Sanlam in November 2014 having graduated with an MSc inMathematical Finance at Imperial College London. He holds a first classdegree in Mathematics from Trinity College Dublin and is a CFAcharterholder.
Global Equity Analyst
Global Equity Analyst
Hannah Gooch-Peters
As a core member of the Global High Quality Equity Team, Hannah actsas a dedicated product specialist, and leads all aspects of areassurrounding the execution of the investment strategy on the GlobalEquity Team, including client servicing, order execution, operationaloversight, and distribution functions. Hannah’s work also includes RFPsand operational management of client segregated portfolios.Hannah was awarded Investment Week’s ‘Young Investment Woman ofthe Year’ 2018. Hannah joined Sanlam in September 2015, havingattained both an honours degree and masters degree at Trinity College ofMusic
Global Equity Investment Analyst

Global investment team
43
Pieter FourieHead of Global Equities
Lead Fund Manager Global High Quality Fund
Global High Quality Team Global Value Team UK Equity Team
William BallSenior Equity Analyst
Louis JamiesonGlobal Equity Analyst
Shiraaz AbdullahGlobal Equity Analyst
Nicholas BellGlobal Client Portfolio Manager
Hannah Gooch-PetersGlobal Equity Investment Analyst
Simon GregoryAssistant Fund Manager
Alvar FernandezAnalyst
Chris RodgersHead of UK Equities
Andrew EvansFund Manager

Please note that all Sanlam Funds carry some degree of risks which may have an adverse effect on the future value of your investment. Any offering is made only pursuant to the relevant offering document, together with the current financial statements of the relevant fund, and the relevant subscription/application forms, all of which must be read in their entirety together with the Sanlam Universal Funds plc prospectus, the Fund supplement and the KIID. All these documents explain different types of specific risks associated with the investment portfolio of each of our products and are available free of charge from the Manager or at www.sanlam.ie. No offer to purchase securities will be made or accepted prior to receipt by the offeree of these documents, and the completion of all appropriate documentation. Use or rely on this information at your own risk. Independent professional financial advice should always be sought before making an investment decision as not all investments are suitable for all investors.
This document contains information intended only for the person to whom it is addressed or presented (Investment Professionals, defined as Eligible Counterparties or Professional Clients), and is intended for evaluation purposes, with no licence to use the content or materials within. It must not be distributed to general public, or relied upon by Retail Investors.
The opinions are those of the author at the time of publication and are subject to change, without notice, at any time due to changes in market or economic conditions. Whilst care has been taken in compiling the content of this document, neither Sanlam nor any other person makes any guarantee, representation or warranty, express or implied as to its accuracy, completeness or fairness of the information and opinions contained in this document, which has been prepared in good faith, and to the fullest extent permissible under UK law. Some parts/sections of this document may been compiled from external sources. Whilst these sources are believed to be reliable, the information has not been independently verified and is subject to material amendment, revision and updating, therefore no representation is made as to its accuracy or completeness. No reliance may be placed for any purpose whatsoever on the information, representations or opinions contained in this document nor shall it or any part of it form the basis of or act as an inducement to enter into any contract for any securities, and to the fullest extent permissible under UK law no liability is accepted or any such information, representations or opinions. The comments should not be construed as a recommendation of individual holdings or market sectors, but as an illustration of broader themes.
Statements in this document that reflect projections or expectations of future financial or economic performance of a strategy, or of markets in general, and statements of any Sanlam strategies’ plans and objectives for future operations are forward-looking statements. Actual results or events may differ materially from those projected, estimated, assumed or anticipated in any such forward-looking statement. Important factors that could result in such differences, in addition to the other factors noted with forward-looking statements, include general economic conditions such as inflation, recession and interest rates, political or business conditions or in the tax or regulatory framework in the UK or other relevant jurisdictions, any of which could cause actual results to vary materially from the future results implied in such forward-looking statements. No assurance can be given as to the future results that will be achieved.
Sanlam makes no representation as to whether any illustration/example mentioned in this document is now or was ever held in any Sanlam Fund or Model Portfolio. Examples / Illustrations shown are only for the limited purpose of analysing general market, economic conditions or highlighting specific elements of the research process.
All of the information herein should be treated as confidential material with no less care than that afforded to the addressee's own confidential material of the most sensitive nature.
44
Important information
Neither Sanlam nor any other person accepts responsibility or liability whatsoever for any loss howsoever arising, either directly or indirectly from any use of this presentation or its contents or otherwise arising in connection therewith. It should not be copied, faxed, reproduced, divulged or redistributed or passed on, directly or indirectly, to any other person or published in whole or in part, for any purpose, without the express written consent of Sanlam.
This document may constitute material non-public information, the disclosure of which may be prohibited by law, and the legal responsibility for its use is borne solely by the recipient.
There is no certainty the investment objectives of the portfolios or strategies mentioned in this document will actually be achieved and no warranty or representation is given to this effect.
Sanlam funds mentioned in this document are only available for sale in certain jurisdictions. For the avoidance of doubt, this document is not intended to promote these Funds to any person in any jurisdiction where such promotion is not permitted under applicable laws and regulations. Potential investors in these Funds should inform themselves of the applicable laws and regulations of the countries of their citizenship, residence or domicile and which might be relevant to any type of transaction in shares/units of our Funds. By accepting the terms of this disclaimer, you expressly acknowledge that you are, as the case may be, an investor who is legally or otherwise duly authorised to seek information about our Funds.
45
Global high quality team
Related Documents