THE ONTARIO RURAL BEACHES STUDIES: IMPLICATIONS FOR REMEDIAL STRATEGIES August 1989 A. W. Bos, Upper Thames River Conservation Authority D. Draper, Ontario Ministry of the Environment, Toronto, Ontario D. Hayman, Upper Thames River Conservation Authority, London, Ontario

Welcome message from author
This document is posted to help you gain knowledge. Please leave a comment to let me know what you think about it! Share it to your friends and learn new things together.
Transcript

THE ONTARIO RURAL BEACHES STUDIES:
IMPLICATIONS FOR REMEDIAL STRATEGIES
August 1989
A. W. Bos, Upper Thames River Conservation Authority
D. Draper, Ontario Ministry of the Environment, Toronto, Ontario
D. Hayman, Upper Thames River Conservation Authority, London, Ontario

ABSTRACT
The ten-year Ontario Rural Beaches Studies were initiated as a result of poor bacterial or
chemical water quality at numerous public swimming beaches throughout Southern Ontario.
The studies are developing comprehensive Clean Up Rural Beaches (CURB) Plans for
watersheds upstream of problem beaches.
Preliminary results indicate that, for phosphorus control, the most cost-effective practices
are target soil erosion control programs and milkhouse wastewater treatment. For bacteria
control, restriction of livestock from streams, repair of faulty septic systems and improved
manure spreading practices are the most cost-effective solutions.
Present programs to reduce environmental impacts of agricultural activities should be
modified to reflect these findings.
2
BACKGROUND
In Ontario, the Ministry of Health monitors water quality at most public beaches toensure suitability for swimming. If several consecutive water samples exceed 100 fecalcoliform bacteria or 1000 total bacteria per 100 mL. of water, the beach is placarded as awarning to the public. In addition, beaches are sometimes placarded due to high turbidity andmore frequently due to heavy algal growth, particularly dense blue-green algal bloomsresulting from nutrient enrichment.
In 1983, approximately 10% of 1,300 provincially-monitored beaches failed to meetswimming criteria for at least 10% of the swimming season. When this situation began torepeat itself in 1984, the provincial cabinet recommended that funds be allocated and actionbe taken to improve beach water quality.
By 1985, the Ontario Ministry of the Environment (MOE) had allocated study funds over a tenyear period and analyzed the problem beaches and categorized them into four lists:
1. beaches where the source problems were known and capital works expenditureswere required as a major portion of the solution.
2. beaches where innovative technical solutions could be attempted.3. beaches where the main pollution sources were urban.4. beaches where the main pollution sources were rural.
This paper will address only the latter category dealing with beaches that are downstream ofpredominantly rural watersheds. This program has become known as the Rural BeachesProgram.
Administrative Organization
There are 38 Conservation Authorities (CA's) which carry out conservation and watermanagement activities on a watershed scale. These authorities can provide a focus for directlocal input to problem resolution. On this basis, MOE decided to carry out its beachesprograms through agreements with CA's. Because of the widespread nature of the problemand the difficulty of deploying sufficient staff to track down the sources, this regionalapproach also has advantages in terms of efficiency in program delivery and resourcerequirements.
The MOE maintains financial and technical input to the conservation authorities through acommittee structure as outlined in Figure 1. The "Rural Beaches Program" staff of eachconservation authority involved are under the technical direction of a local steering committeechaired by MOE and workshops organized by the Provincial Committee. Typically, the localcommittees also include representation from the Ontario Ministry of Agriculture and Food(OMAF), the Ministry of Natural Resources (MNR), County Medical Officers of Health, FarmerOrganizations, County Planning Departments and the Conservation Authorities, themselves.The conservation authorities hire and directly supervise the staff.
3
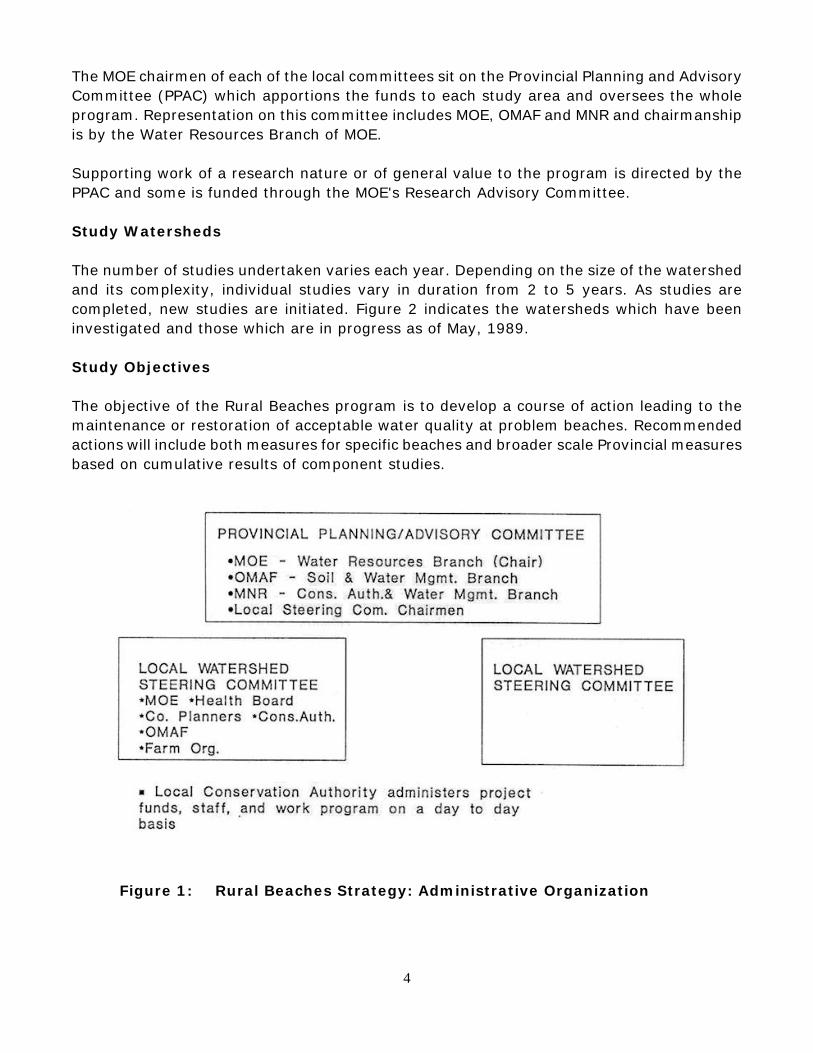
The MOE chairmen of each of the local committees sit on the Provincial Planning and AdvisoryCommittee (PPAC) which apportions the funds to each study area and oversees the wholeprogram. Representation on this committee includes MOE, OMAF and MNR and chairmanshipis by the Water Resources Branch of MOE.
Supporting work of a research nature or of general value to the program is directed by thePPAC and some is funded through the MOE's Research Advisory Committee.
Study Watersheds
The number of studies undertaken varies each year. Depending on the size of the watershedand its complexity, individual studies vary in duration from 2 to 5 years. As studies arecompleted, new studies are initiated. Figure 2 indicates the watersheds which have beeninvestigated and those which are in progress as of May, 1989.
Study Objectives
The objective of the Rural Beaches program is to develop a course of action leading to themaintenance or restoration of acceptable water quality at problem beaches. Recommendedactions will include both measures for specific beaches and broader scale Provincial measuresbased on cumulative results of component studies.
Figure 1: Rural Beaches Strategy: Administrative Organization
4
The objective of each component watershed study is to develop a Clean Up Rural Beaches(CURB) plan specific to the watershed upstream of the problem beach. The CURB plan isdeveloped, in part, through the application of basic modelling techniques to arrive at remedialstrategy options and respective cost estimates for each problem beach.
THE CURB WATERSHED ASSESSMENT MODEL
Ontario's Provincial Water Quality Objectives establish concentrations, or in the case ofbacteria, density limits for specific water uses such as drinking or swimming. Concentrationsat a particular location result from the combined effect of upstream source loadings and lossmechanisms en route to the sampling point. Hence, to evaluate the relative significance ofindividual source types impacting on beaches in this study, estimates of individualcomponents of the total loading must be made.
For both bacteria and phosphorus, this involved examining the runoff concentrations andvolumes of each contaminant source as well as the proportion of this runoff which enters thestream systems (overland or field delivery ratio). The sources were further categorized intocontinuous and pulse inputs. Continuous inputs are those which usually occur daily and areindependent of rainfall events while pulse inputs result from specific runoff events or spills.
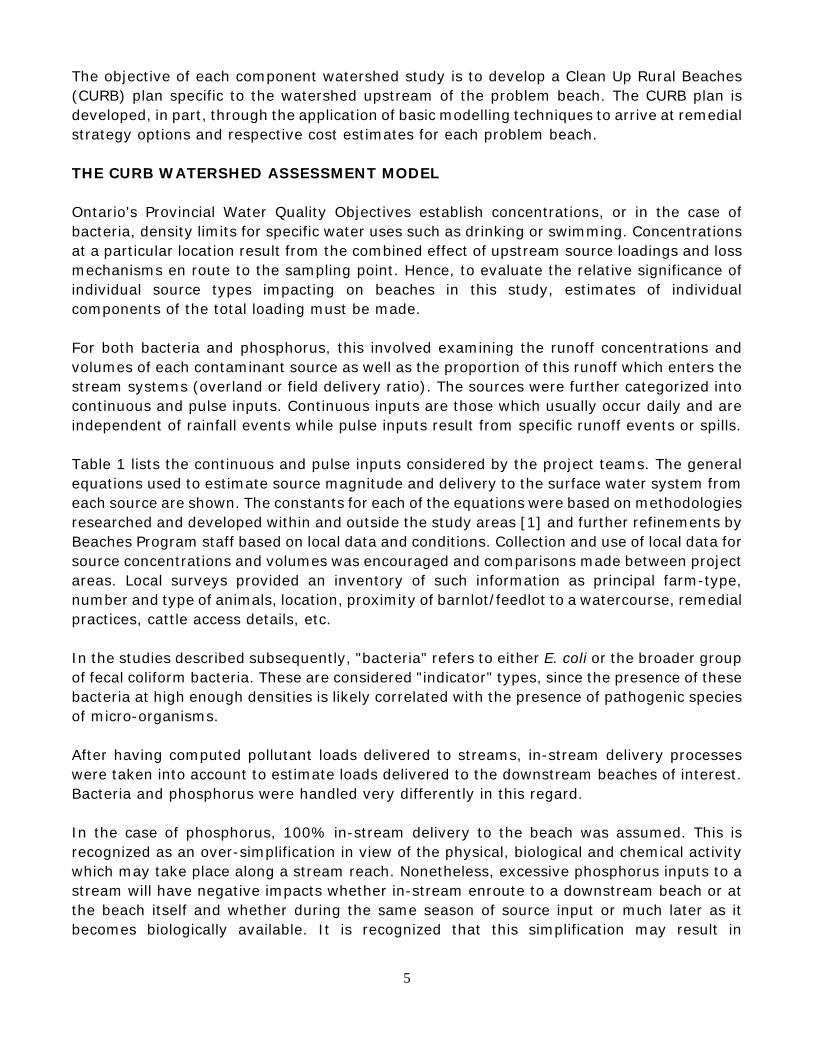
Table 1 lists the continuous and pulse inputs considered by the project teams. The generalequations used to estimate source magnitude and delivery to the surface water system fromeach source are shown. The constants for each of the equations were based on methodologiesresearched and developed within and outside the study areas [1] and further refinements byBeaches Program staff based on local data and conditions. Collection and use of local data forsource concentrations and volumes was encouraged and comparisons made between projectareas. Local surveys provided an inventory of such information as principal farm-type,number and type of animals, location, proximity of barnlot/feedlot to a watercourse, remedialpractices, cattle access details, etc.
In the studies described subsequently, "bacteria" refers to either E. coli or the broader groupof fecal coliform bacteria. These are considered "indicator" types, since the presence of thesebacteria at high enough densities is likely correlated with the presence of pathogenic speciesof micro-organisms.
After having computed pollutant loads delivered to streams, in-stream delivery processeswere taken into account to estimate loads delivered to the downstream beaches of interest.Bacteria and phosphorus were handled very differently in this regard.
In the case of phosphorus, 100% in-stream delivery to the beach was assumed. This isrecognized as an over-simplification in view of the physical, biological and chemical activitywhich may take place along a stream reach. Nonetheless, excessive phosphorus inputs to astream will have negative impacts whether in-stream enroute to a downstream beach or atthe beach itself and whether during the same season of source input or much later as itbecomes biologically available. It is recognized that this simplification may result in
5

over-estimates of cost-benefit ratios, at least for the short-term.
Modelling of bacterial transport is much more complex than phosphorus because bacteria areliving organisms whose reproductive and mortality rates are governed by environmentalfactors. Loss rates in the water column combine the processes of deposition, adsorption,death and inactivation.
Figure 2: Watersheds Studied Under the Rural Beaches Program
6
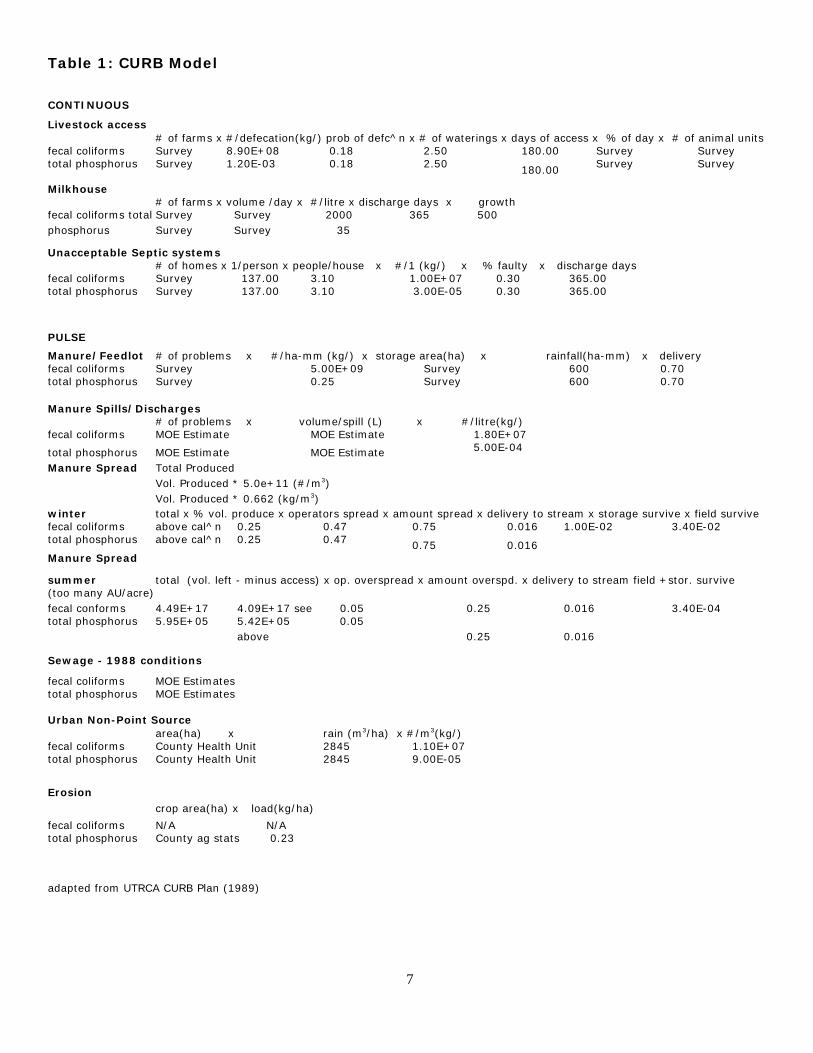
Table 1: CURB Model
CONTINUOUS
Livestock access# of farms x #/defecation(kg/) prob of defc^n x # of waterings x days of access x % of day x # of animal units
fecal coliforms Survey 8.90E+08 0.18 2.50 180.00 Survey Surveytotal phosphorus Survey 1.20E-03 0.18 2.50 180.00 Survey Survey
Milkhouse# of farms x volume /day x #/litre x discharge days x growth
fecal coliforms totalphosphorus
SurveySurvey
Survey Survey
2000 35
365 500
Unacceptable Septic systems# of homes x 1/person x people/house x #/1 (kg/) x % faulty x discharge days
fecal coliforms Survey 137.00 3.10 1.00E+07 0.30 365.00total phosphorus Survey 137.00 3.10 3.00E-05 0.30 365.00
PULSE
Manure/Feedlot # of problems x #/ha-mm (kg/) x storage area(ha) x rainfall(ha-mm) x deliveryfecal coliforms Survey 5.00E+09 Survey 600 0.70total phosphorus Survey 0.25 Survey 600 0.70
Manure Spills/Discharges# of problems x volume/spill (L) x #/litre(kg/)
fecal coliforms MOE Estimate MOE Estimate 1.80E+07
total phosphorus MOE Estimate MOE Estimate 5.00E-04
Manure Spread Total ProducedVol. Produced * 5.0e+11 (#/m3) Vol. Produced * 0.662 (kg/m3)
winter total x % vol. produce x operators spread x amount spread x delivery to stream x storage survive x field survivefecal coliforms above cal^n 0.25 0.47 0.75 0.016 1.00E-02 3.40E-02total phosphorus above cal^n 0.25 0.47 0.75 0.016Manure Spread
summer total (vol. left - minus access) x op. overspread x amount overspd. x delivery to stream field +stor. survive(too many AU/acre)fecal conforms 4.49E+17 4.09E+17 see 0.05 0.25 0.016 3.40E-04total phosphorus 5.95E+05 5.42E+05
above0.05
0.25 0.016
Sewage - 1988 conditions
fecal coliforms MOE Estimatestotal phosphorus MOE Estimates
Urban Non-Point Sourcearea(ha) x rain (m3/ha) x #/m3(kg/)
fecal coliforms County Health Unit 2845 1.10E+07total phosphorus County Health Unit 2845 9.00E-05
Erosioncrop area(ha) x load(kg/ha)
fecal coliforms N/A N/Atotal phosphorus County ag stats 0.23
adapted from UTRCA CURB Plan (1989)
7
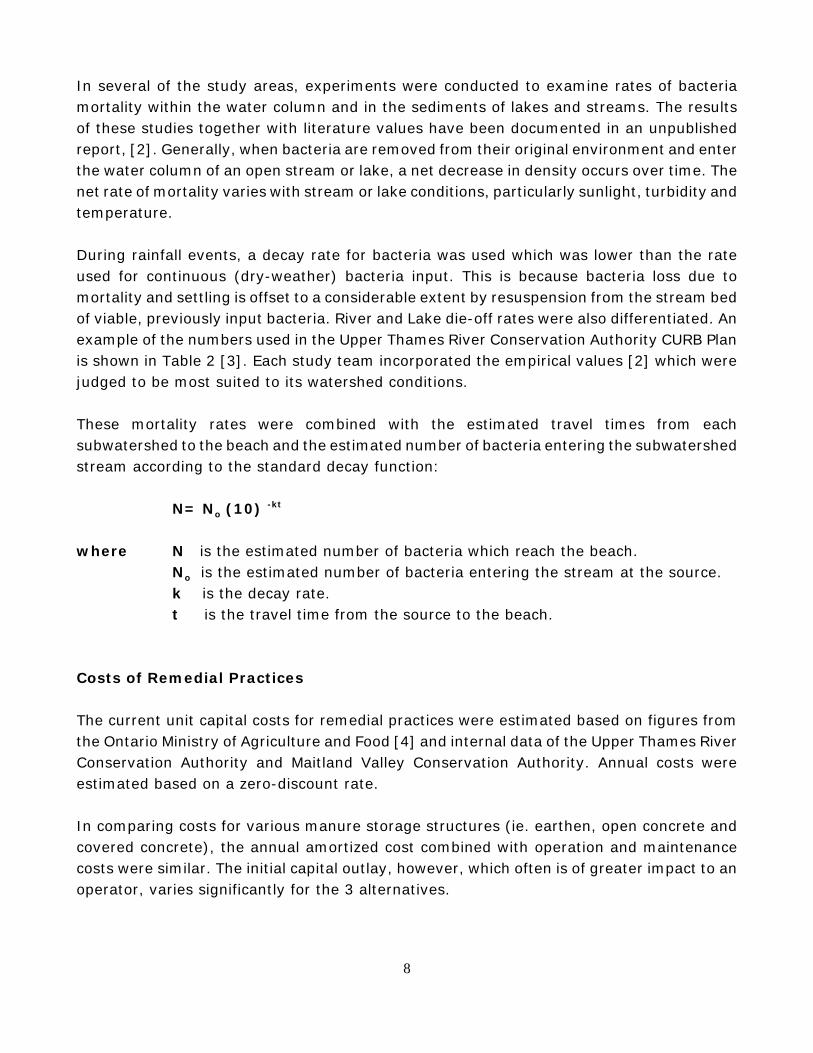
In several of the study areas, experiments were conducted to examine rates of bacteriamortality within the water column and in the sediments of lakes and streams. The resultsof these studies together with literature values have been documented in an unpublishedreport, [2]. Generally, when bacteria are removed from their original environment and enterthe water column of an open stream or lake, a net decrease in density occurs over time. Thenet rate of mortality varies with stream or lake conditions, particularly sunlight, turbidity andtemperature.
During rainfall events, a decay rate for bacteria was used which was lower than the rateused for continuous (dry-weather) bacteria input. This is because bacteria loss due tomortality and settling is offset to a considerable extent by resuspension from the stream bedof viable, previously input bacteria. River and Lake die-off rates were also differentiated. Anexample of the numbers used in the Upper Thames River Conservation Authority CURB Planis shown in Table 2 [3]. Each study team incorporated the empirical values [2] which werejudged to be most suited to its watershed conditions.
These mortality rates were combined with the estimated travel times from eachsubwatershed to the beach and the estimated number of bacteria entering the subwatershedstream according to the standard decay function:
N= No (10) -kt
where N is the estimated number of bacteria which reach the beach.No is the estimated number of bacteria entering the stream at the source. k is the decay rate.t is the travel time from the source to the beach.
Costs of Remedial Practices
The current unit capital costs for remedial practices were estimated based on figures fromthe Ontario Ministry of Agriculture and Food [4] and internal data of the Upper Thames RiverConservation Authority and Maitland Valley Conservation Authority. Annual costs wereestimated based on a zero-discount rate.
In comparing costs for various manure storage structures (ie. earthen, open concrete andcovered concrete), the annual amortized cost combined with operation and maintenancecosts were similar. The initial capital outlay, however, which often is of greater impact to anoperator, varies significantly for the 3 alternatives.
8
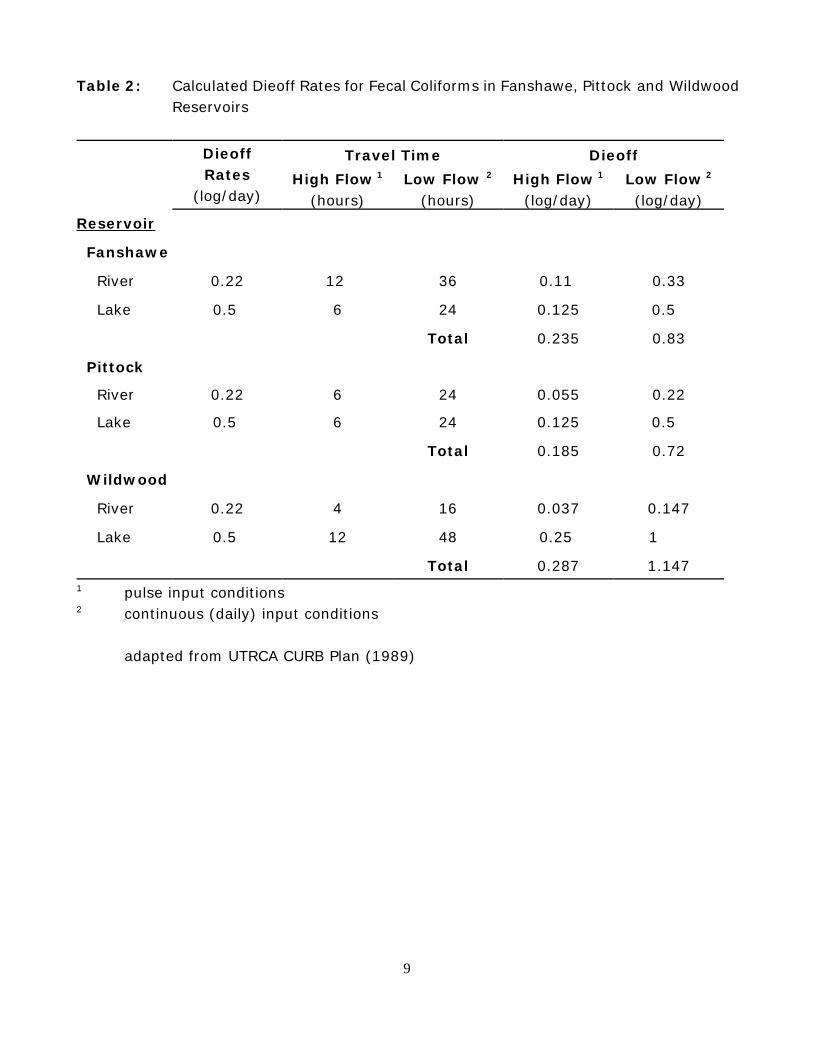
Table 2: Calculated Dieoff Rates for Fecal Coliforms in Fanshawe, Pittock and WildwoodReservoirs
DieoffRates
(log/day)
Travel Time Dieoff
High Flow 1
(hours)Low Flow 2
(hours)High Flow 1
(log/day)Low Flow 2
(log/day)
Reservoir
Fanshawe
River 0.22 12 36 0.11 0.33
Lake 0.5 6 24 0.125 0.5
Total 0.235 0.83
Pittock
River 0.22 6 24 0.055 0.22
Lake 0.5 6 24 0.125 0.5
Total 0.185 0.72
Wildwood
River 0.22 4 16 0.037 0.147
Lake 0.5 12 48 0.25 1
Total 0.287 1.1471 pulse input conditions2 continuous (daily) input conditions
adapted from UTRCA CURB Plan (1989)
9
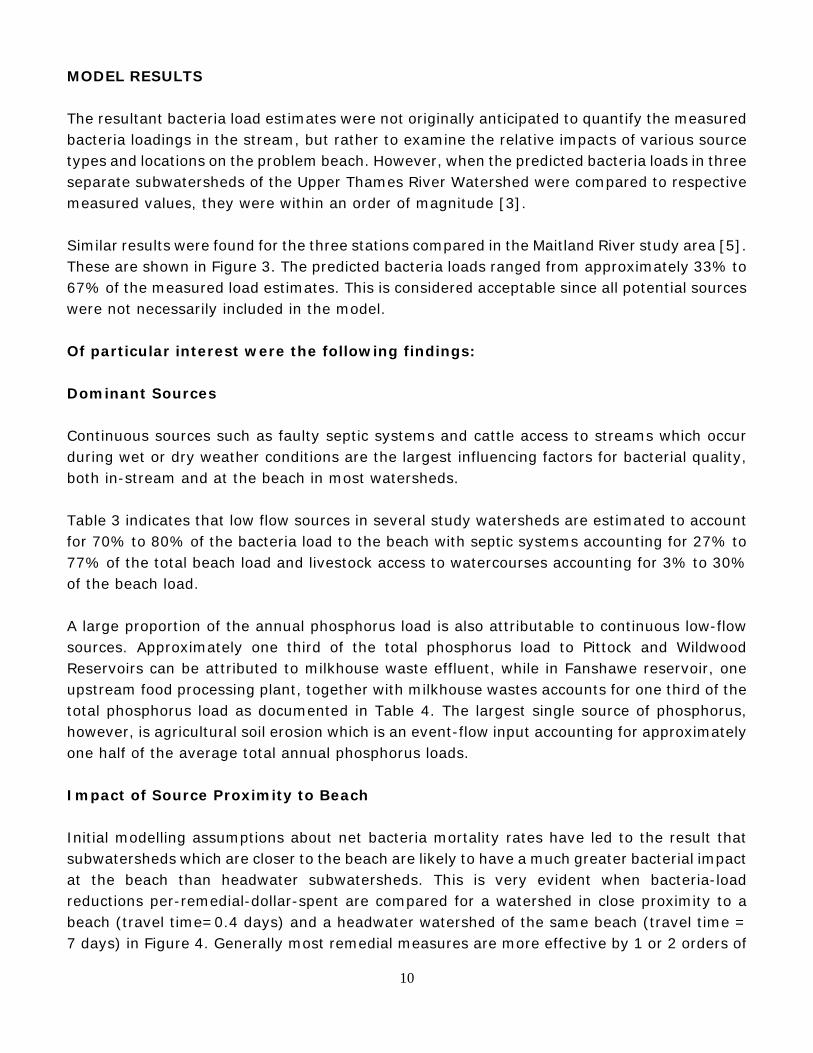
MODEL RESULTS
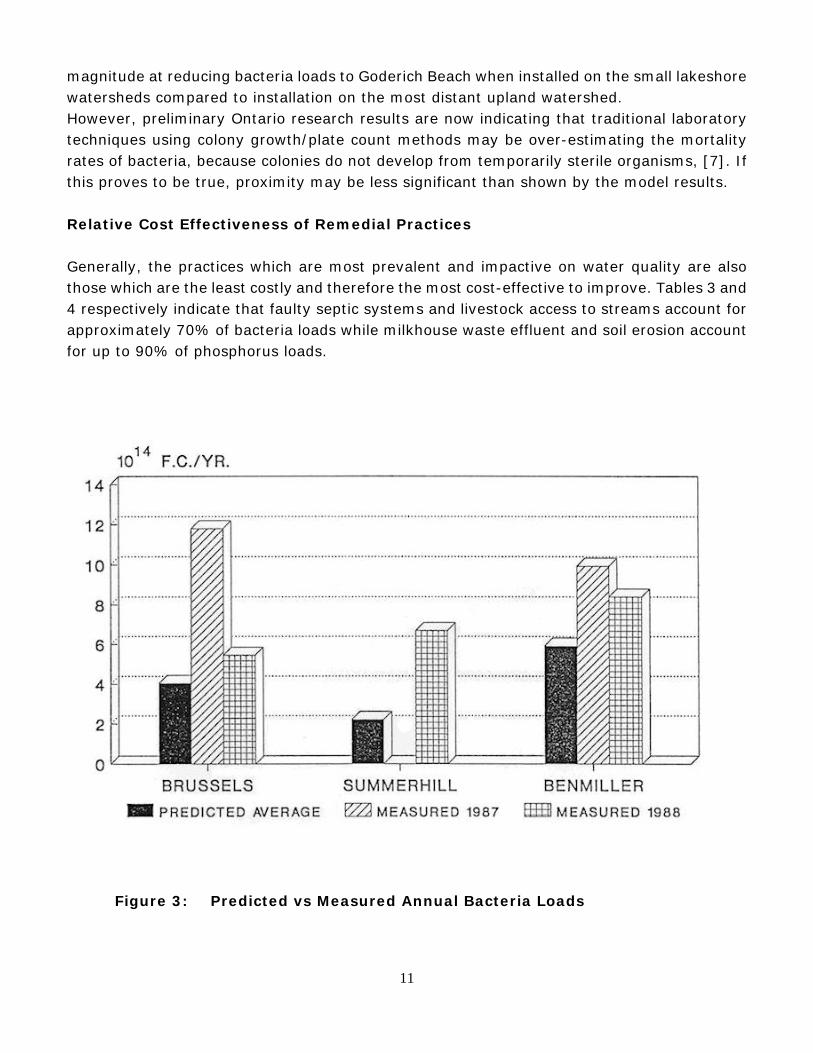
The resultant bacteria load estimates were not originally anticipated to quantify the measuredbacteria loadings in the stream, but rather to examine the relative impacts of various sourcetypes and locations on the problem beach. However, when the predicted bacteria loads in threeseparate subwatersheds of the Upper Thames River Watershed were compared to respectivemeasured values, they were within an order of magnitude [3].
Similar results were found for the three stations compared in the Maitland River study area [5].These are shown in Figure 3. The predicted bacteria loads ranged from approximately 33% to67% of the measured load estimates. This is considered acceptable since all potential sourceswere not necessarily included in the model.
Of particular interest were the following findings:
Dominant Sources
Continuous sources such as faulty septic systems and cattle access to streams which occurduring wet or dry weather conditions are the largest influencing factors for bacterial quality,both in-stream and at the beach in most watersheds.
Table 3 indicates that low flow sources in several study watersheds are estimated to accountfor 70% to 80% of the bacteria load to the beach with septic systems accounting for 27% to77% of the total beach load and livestock access to watercourses accounting for 3% to 30%of the beach load.
A large proportion of the annual phosphorus load is also attributable to continuous low-flowsources. Approximately one third of the total phosphorus load to Pittock and WildwoodReservoirs can be attributed to milkhouse waste effluent, while in Fanshawe reservoir, oneupstream food processing plant, together with milkhouse wastes accounts for one third of thetotal phosphorus load as documented in Table 4. The largest single source of phosphorus,however, is agricultural soil erosion which is an event-flow input accounting for approximatelyone half of the average total annual phosphorus loads.
Impact of Source Proximity to Beach
Initial modelling assumptions about net bacteria mortality rates have led to the result thatsubwatersheds which are closer to the beach are likely to have a much greater bacterial impactat the beach than headwater subwatersheds. This is very evident when bacteria-loadreductions per-remedial-dollar-spent are compared for a watershed in close proximity to abeach (travel time=0.4 days) and a headwater watershed of the same beach (travel time =7 days) in Figure 4. Generally most remedial measures are more effective by 1 or 2 orders of
10
magnitude at reducing bacteria loads to Goderich Beach when installed on the small lakeshorewatersheds compared to installation on the most distant upland watershed.However, preliminary Ontario research results are now indicating that traditional laboratorytechniques using colony growth/plate count methods may be over-estimating the mortalityrates of bacteria, because colonies do not develop from temporarily sterile organisms, [7]. Ifthis proves to be true, proximity may be less significant than shown by the model results.
Relative Cost Effectiveness of Remedial Practices
Generally, the practices which are most prevalent and impactive on water quality are alsothose which are the least costly and therefore the most cost-effective to improve. Tables 3 and4 respectively indicate that faulty septic systems and livestock access to streams account forapproximately 70% of bacteria loads while milkhouse waste effluent and soil erosion accountfor up to 90% of phosphorus loads.
Figure 3: Predicted vs Measured Annual Bacteria Loads
11
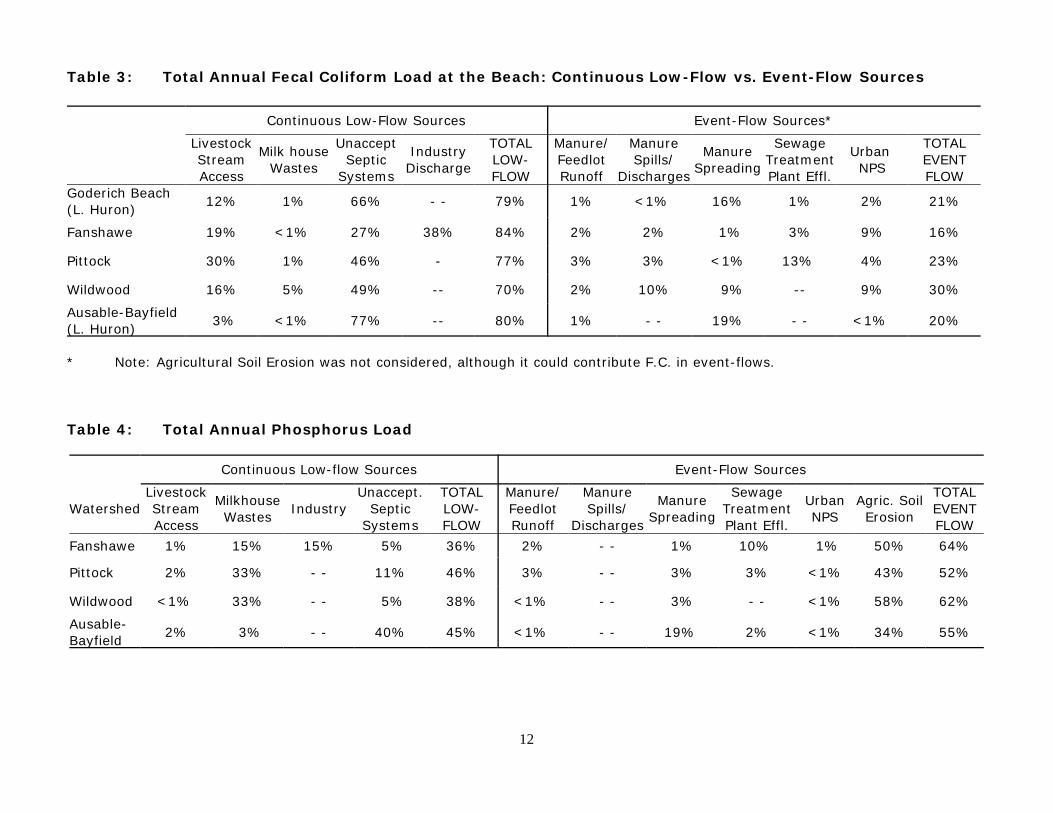
Table 3: Total Annual Fecal Coliform Load at the Beach: Continuous Low-Flow vs. Event-Flow Sources
Continuous Low-Flow Sources Event-Flow Sources*
LivestockStreamAccess
Milk houseWastes
UnacceptSeptic
Systems
IndustryDischarge
TOTALLOW-FLOW
Manure/FeedlotRunoff
ManureSpills/
Discharges
ManureSpreading
SewageTreatmentPlant Effl.
Urban NPS
TOTALEVENTFLOW
Goderich Beach(L. Huron)
12% 1% 66% - - 79% 1% <1% 16% 1% 2% 21%
Fanshawe 19% <1% 27% 38% 84% 2% 2% 1% 3% 9% 16%
Pittock 30% 1% 46% - 77% 3% 3% <1% 13% 4% 23%
Wildwood 16% 5% 49% -- 70% 2% 10% 9% -- 9% 30%
Ausable-Bayfield(L. Huron)
3% <1% 77% -- 80% 1% - - 19% - - <1% 20%
* Note: Agricultural Soil Erosion was not considered, although it could contribute F.C. in event-flows.
Table 4: Total Annual Phosphorus Load
Continuous Low-flow Sources Event-Flow Sources
WatershedLivestockStreamAccess
MilkhouseWastes
IndustryUnaccept.
SepticSystems
TOTALLOW-FLOW
Manure/FeedlotRunoff
ManureSpills/
Discharges
ManureSpreading
SewageTreatmentPlant Effl.
UrbanNPS
Agric. SoilErosion
TOTALEVENTFLOW
Fanshawe 1% 15% 15% 5% 36% 2% - - 1% 10% 1% 50% 64%
Pittock 2% 33% - - 11% 46% 3% - - 3% 3% <1% 43% 52%
Wildwood <1% 33% - - 5% 38% <1% - - 3% - - <1% 58% 62%
Ausable-Bayfield
2% 3% - - 40% 45% <1% - - 19% 2% <1% 34% 55%
12
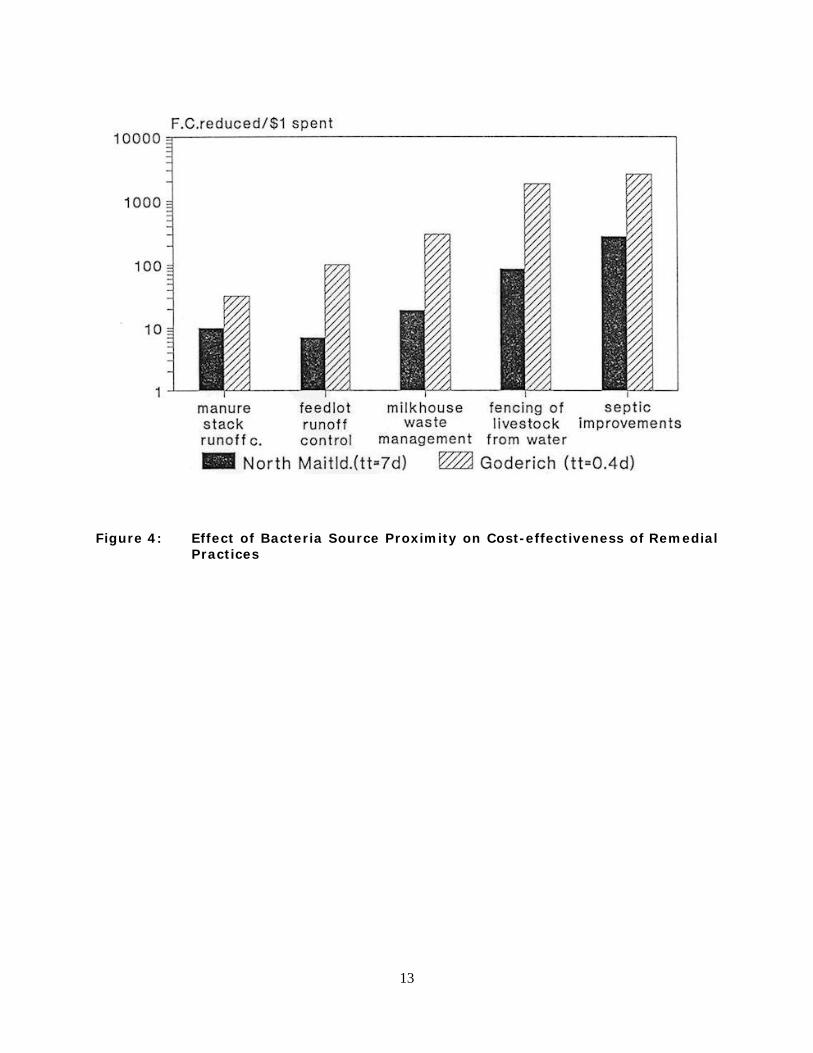
Figure 4: Effect of Bacteria Source Proximity on Cost-effectiveness of RemedialPractices
13

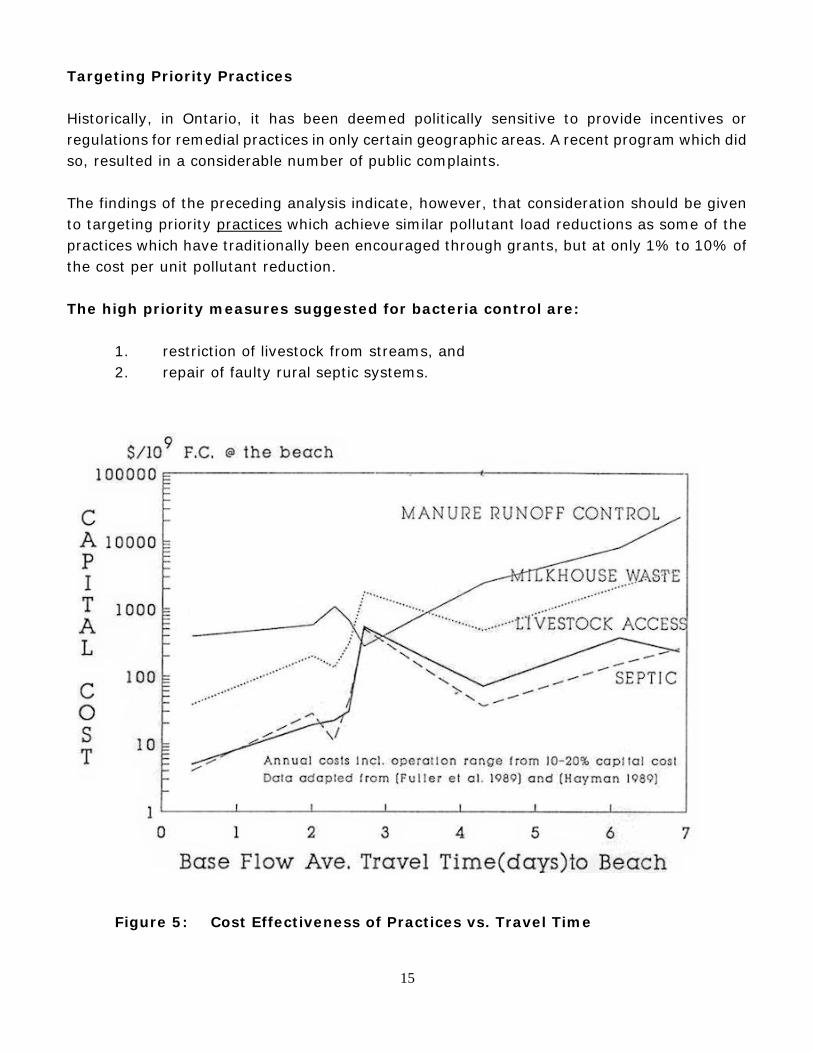
For bacteria load reductions, the most cost-effective measures, generally, are repair of faultyseptic systems, and fencing of livestock from streams. However, travel time from the sourceto the beach in question can have a significant impact as shown in Figure 5. In fact, based onthe model results for the watersheds documented in Figure 5, repair of septic systems andlivestock access control in watersheds with travel times exceeding 6 days becomes lesscost-effective than milkhouse waste treatment for bacteria control in a watershed with aless-than-2 day travel time. A survey conducted in the Maitland study area determined thatavailable storage capacity was not necessarily a consideration when spreading manure inwinter, [5]. Hence, avoidance of winter-spreading may also be a cost-effective measure.
Unfortunately, these most cost-effective solutions for bacteria control have few direct benefitsto agricultural production and hence require some persuasive action by governments.
For phosphorus load reductions, control of milkhouse waste effluent, improvement of industrialdischarges and erosion control (only if targeted) are the most cost-effective solutions. Figure6 documents the findings of the Upper Thames River Conservation Authority regarding therelative annual costs per unit phosphorus reduced for various best-management practices inthe watersheds upstream of Fanshawe, Pittock and Wildwood Reservoirs of the Thames Riversystem.
Impact of Other Local Conditions
It is evident in Figure 5 that local factors other than travel time can also affect thecost-effectiveness of remedial practices by at least an order of magnitude.
Agricultural intensity is one such factor. For example, it is far more cost-effective to fence 60cattle out of a ½ km. long stream than to fence 20 cattle out of a 2 km. long stream.
Other local influencing factors are variability in stream exposure to sunlight and turbidity(which affects bacteria mortality rates), the magnitude, distribution and delivery to the streamof sources within the subwatershed, and the drainage density.
IMPLICATIONS OF STUDY RESULTS ON GOVERNMENT POLICIES
The study findings provide several useful insights for provincial non-point source policydevelopment in the areas of:
1. prioritization of the types of practices to be encouraged,2. where they should be encouraged, and3. the means required to encourage these practices in terms of regulatory
enforcement versus various levels of incentives.
14
Targeting Priority Practices
Historically, in Ontario, it has been deemed politically sensitive to provide incentives orregulations for remedial practices in only certain geographic areas. A recent program which didso, resulted in a considerable number of public complaints.
The findings of the preceding analysis indicate, however, that consideration should be givento targeting priority practices which achieve similar pollutant load reductions as some of thepractices which have traditionally been encouraged through grants, but at only 1% to 10% ofthe cost per unit pollutant reduction.
The high priority measures suggested for bacteria control are:
1. restriction of livestock from streams, and2. repair of faulty rural septic systems.
Figure 5: Cost Effectiveness of Practices vs. Travel Time
15

Figure 6: Relative Cost-Effectiveness of Phosphorus Management Practices
For phosphorus control, the measures suggested are:
1. conservation tillage, (targeted to the most erodible slopes only), and2. milkhouse waste treatment/storage.
Targeting these practices (and inherent topographical features for conservation tillage) shouldresult in a program which is ten to one hundred-fold more cost-effective in terms of unit ofpollutant reduced per dollar spent while recognizing political sensitivities. These prioritypractices also happen to address the most prevalent problems in each watershed.
This is not meant to detract from other potential abatement measures which could benecessary for in-stream water quality. However, emphasis on the more cost-effective practicescould have some obvious benefits, particularly at the downstream beaches.
16
Education/Incentives versus Regulations
Presently, faulty septic systems and discharge of milkhouse wastewater to streams areprosecutable offences under provincial statutes.
Realistically, however, the extent of the potential problems and the lengthy prosecution processmake enforcement extremely impractical. Besides, with good management being an essentialingredient for most rural non-point source abatement measures, enforcing non-voluntaryparticipation would be counter-productive at this time. Conformity should perhaps be aneventuality as proper practices become the noun. Hence, an incentive-based remedial programis envisaged together with an extension/ education program.
Unfortunately, the most cost-effective practices for water quality maintenance are those whichhave little direct benefit to the farm operation or rural dwelling.
Therefore, practices such as milkhouse waste treatment and/or storage, repair of faulty septicsystems, and perhaps restriction of livestock from streams will likely require enhancedsubsidies. Alternatively, compliance of milkhouse waste, septic, and stream watering systemsshould be pre-requisite to receiving grants for the less cost-effective practices which havetraditionally been eligible for non-conditional grants.
Proactive Targeting
In addition to the targeting of priority practices, a further means of targeting, while respectingpolitical sensitivities, is to proactively approach landowners only in the specific watershedsupstream of problem beaches armed with subsidies and educational materials through directcontact and mailings.
Based on the findings presented in this paper, it would be prudent to initially promote theidentified high priority practices in watersheds which are in close proximity to the affectedbeach.
Some latitude would be essential to the local program staff such that practices which arepromoted are geared towards the particular downstream problem or potential problem.
Analysis such as that shown in this paper should be done for each sub-watershed upstream ofa problem beach so that the relative impacts of each source are well understood. It was evidentfrom the model application that local agricultural intensity, as well as stream conditions whichaffect bacteria mortality, can also have considerable impact on the cost-effectiveness of certainremedial practices, potentially raising or lowering it by an order of magnitude.
These local influences speak strongly for an individual watershed approach specific to theproblem beach rather than a generic provincial formula for abatement.
17
REFERENCES
1. Ecologistics 1988, Pollution for Livestock Operations Predictor (PLOP) - A Planning Toolto Evaluate the Pollution Potential of Livestock Operations In Southern Ontario, ForOntario Ministry of the Environment, Toronto.
2. Young, M. 1988, Unpublished report: Summary of Bacteria Survival Study Results,Ontario Ministry of the Environment, Toronto.
3. Hayman, D. 1989, A Clean Up Rural Beaches (CURB) Plan for Fanshawe. Wildwood andPittock Reservoirs Upper Thames River Conservation Authority for Ontario Ministry of theEnvironment, London.
4. Fleming, R. 1988, Manure Storage System Costs. Unpublished, Ontario Ministry ofAgriculture and Food. Clinton, Ontario.
5. Fuller, R and Foran, M. 1989, Clean Up Rural Beaches(CURB) Plan for Lake HuronBeaches in the MVCA-Draft. Maitland Valley Conservation Authority for Ontario Ministryof the Environment, London.
6. Hocking, D. and Dean, D. 1989, Ausable Bayfield Conservation Authority Clean Up RuralBeaches (CURB) Plan. Ausable Bayfield Conservation Authority for the Ontario Ministryof the Environment, London.
7. Palmateer, G. 1989. Unpublished Research: Undertaking microscopic bacteria analysesversus colony growth techniques. Ontario Ministry of the Environment, London.
18
Related Documents