The OIES Review , of Philip Barnes 1990 - Long-Term Energy Supplies

Welcome message from author
This document is posted to help you gain knowledge. Please leave a comment to let me know what you think about it! Share it to your friends and learn new things together.
Transcript

The OIES Review
,
of
Philip Barnes
1990
-
Long-Term Energy Supplies

The contents of this paper are the author's sole responsibility.
They do not necessarily represent the views of the Oxford Institute for
Energy Studies or any of its Members.
Copyright Q 1990
Oxford Institute for Energy Studies
All rights reserved. No part of this publication may be reproduced, stored in a retrieval system, or transmitted in any form or by any means, electronic, mechanical, photocopying, recording, or otherwise, without prior permission of the Oxford Institute for Energy Studies.
This publication is sold subject to the oondition that it shall no!, by way of trade or otherwise, be lent, resold, hired out, or otherwise circulated without the publisher's prior consent in any form of binding or Mver other than that in which it is published and wilhout a similar condition including this condition being imposed on the subsequent purchaser.
ISBN 0 948061 45 6
CONTENTS
EXECUTIVE SUMMARY 1
1. THE RESOURCE BASE: AN ABUNDANCE OF ENERGY?
1.1 Introduction 1.2 Overall Availability 1.3 Solid Fuels 1.4 Natural Gas 1.5 Hydro Electricity and Geothermal 1.6 Nuclear 1.7 Oil 1.8 Oil Shale and Tar Sands
2. OIL: WlTH CONFIDENCE INTO THE TWENTY-FIRST CENTURY?
2.1 Introduction 2.2 Current Developments 2.3 Future Availability
3. COAL: LOW-COST ABUNDANCE, STILL WAITING IN THE WINGS?
3.1 Introduction 3.2 Current Developments 3.3 Future Availability
4. NATURAL GAS: A UTE DEVELOPER
4.1 Introduction 4.2 Current Developments 4.3 Future Availability
7
7 7 9
11 12 12 13 17
19
19 21 24
31
31 32 36
39
39 39 44

5. NUCLEAR POWER: THE LONG SUNSET?
5.1 Introduction 5.2 Current Developments 5.3 Future Availability
6. HYDRO ELECTRICITY: STILL WATERS?
6.1 Introduction 6.2 Current Developments 6.3 Future AvaiIability
47
47 47 50
55
55 56 58

la
lb
IC
Id
le
If
2
APPENDICES
Non-OPEC Oil Availability (Lower Case)
Non-OPEC Oil Availability (Higher Case)
Coal Availability
Natural Gas Availability
Nuclear Availability
Hydro and Geothermal Availability
Abbreviations Approximate Conversion Equivalents

CHARTS
9
10
11
12
13
14
World Energy Reserves
Additional Energy Resources
The Oil Resource Base
Distribution of Proven Oil Reserves
Liquid Fuels Production
Availability of Non-OPEC Oil (Base)
Availability of Non-OPEC Oil (High)
The Hundred Million Tonne Plus Coal Producing Countries
Availability of Coal
Availability of Natural Gas
Orders Placed for Nuclear Capacity
Availability of Nuclear Power
Hydro Electric Capacity under Construction
Availability of Hydro and Geothermal Power
8
10
14
16
20
26
28
33
37
45
48
52
57
61
1
2
3
4
5
6
TABLES
World Production of Liquid Fuels
Non-OPEC Oil Production (Excluding USSR, Eastern Europe and China)
OPEC Oil Production Potential
World Production of Hard and Brown Coal
World Production of Natural Gas
World Production of Hydro and Geothermal Power
22
23
30
31
40
55

EXECUTNE SUMMARY
This paper reviews both the potential and likely availability of d l the major forms of commercial energy over the next twenty years. It is based on assessments of potential and feasible patterns of energy supply development on a country-by country basis. These assessments take into account, amongst other elements, the resources available and the extent and realism of existing plans.
For each energy form, projections are given as an illustrative range related to national and international energy and environmental policies, relative technical costs and the changing pattern of interfuel competition.
The main conclusion of this review is that a substantial amount of conventional energy is available, much of it at technical costs below $20 per boe. Thus, if the size of the resource base were the only major element in determining the potential deveIopment of energy supplies there would be very little to worry about. World energy needs could be met well into the next century even if demand were to grow as fast as in the 1960s.
The availability of the different sources of commercial energy over the long term is undoubtedly influenced by perceptions of the geopolitical distribution as well as the size of the resource base. The resource base is considerable but the nature and extent of regional imbalances are striking. Over 60 per cent of world oil reserves are in the Middle East and more than 70 per cent of coal is concentrated in just three countries. The bulk of unexploited hydro is in developing countries, generally remote from potential demand, and the main gas consuming areas outside the USSR have only 11 per cent of gas reserves. In practice, development over the next twenty years or so will be determined by a whole range of other factors, not least perceptions of price and market behaviour. The amount and age of the production, transportation and distribution capacity actually in place or currently under development and the level of activity feasibIe within national energy policies limits the range of supply available in the medium term. Moreover, there will often be differences between the optimal timing and scope of energy projects and what actually takes place.
In the following chapters, lower and higher cases have been assessed in order to define ranges of potential availability for all the main primary energy sources, taking the above elements into account. They indicate the volume of energy supplies that could be available to meet demand under alternative assumptions on price, energy and environmental policies and interfuel competition.
Each energy source is considered separately. But for all sources of energy, assumptions have been made which explore the supply implications of higher and lower oil prices, faster and slower technological progress in exploration and production, and greater and lesser concern with ‘the environment’.
The impact of these factors on the supply of any particular energy source is not always similar, even in terms of direction. For example, a strong concern for the physical environment will tend to favour gas rather than coal. Many important environmental
O.I.E.S. 1

effects will no doubt have their impact primarily on the demand side rather than the supply side - the imposition of a carbon tax designed to reduce total burning of fossil fuels, for example. But environmental concern wilI also have a greater impact on the cost conditions in the supply of coal than of gas. A given set of assumptions about environmental factors which produced an estimate for economically available gas supplies towards the top end of its range would at the same time tend to push the estimate for coal towards the lower end of its range. Changes in taxation and regulation would also alter the relationship between oil prices and those of competing energy sources. A decision to invest heavily in nuclear power on grounds of national security or prestige would tend to inhibit the availability of scarce capital for investment in, say, new hydro-electric plants.
Thus, for these and other reasons, the higher or lower cases for each energy source cannot simply be ‘added up’ to derive an overall picture. The aim of this paper is to describe supply conditions for individual energy sources.
In practice, separation of ‘demand-side’ from ‘suppIy-side’ influences is often difficult - especially in the cases of gas and coal where the physical potential is so great compared with effective demand. Furthermore, the cost of energy supplies often depends crucially on the extent of the transportation infrastructure, which is in turn dependent primarily on the overall level of demand. For each fuel, therefore, the estimates of likely supplies represent distinctly approximate and pragmatic judgements of the range of supplies which may be reasonably expected to be available under the assumptions of the two cases.
Summary of Supply Projections for Individual Energy Sources
The levels of future energy supply indicated by this review are not forecasts of what will necessarily actually take place. Clearly the development of all the energy sources together at the high or low end of their range is highly unlikely. There are, of course, also many other patterns of development for the individual sources of energy that might have been developed. It is, however, hoped that the projections shown will be an indication of the extent of global energy suppIies that could be available to meet demand as, and where, it develops. They do not imply the need for any extraordinary activity, dramatic changes in investment policies or the development of technology at faster rates than in the past.
(a) oil. The lower case for future non-OPEC oil availability reflects an assumption that oil prices and contractual conditions (including equity participation and upstream taxation) remain much as they were before the Gulf crisis. Technological progress proceeds at the same rate as in the past and there is little change in environmental constraints. Non-OPEC production, outside China and the USSR, reaches a plateau around 1993 and thereafter declines slowly. None the less, production could still be at 23 to 24 mboe/d in the year Zoo0 and just a little under 20 mboe/d ten years later. A second, more optimistic, view assumes that investors and producers expect rising real oil prices over the long term (in the $25-30 per barrel range at the end of the period) with more favourable contractual terms. More importantly, this higher case makes bolder assumptions about the size and rate of development of undiscovered reserves. On this
2 O.I.E.S.
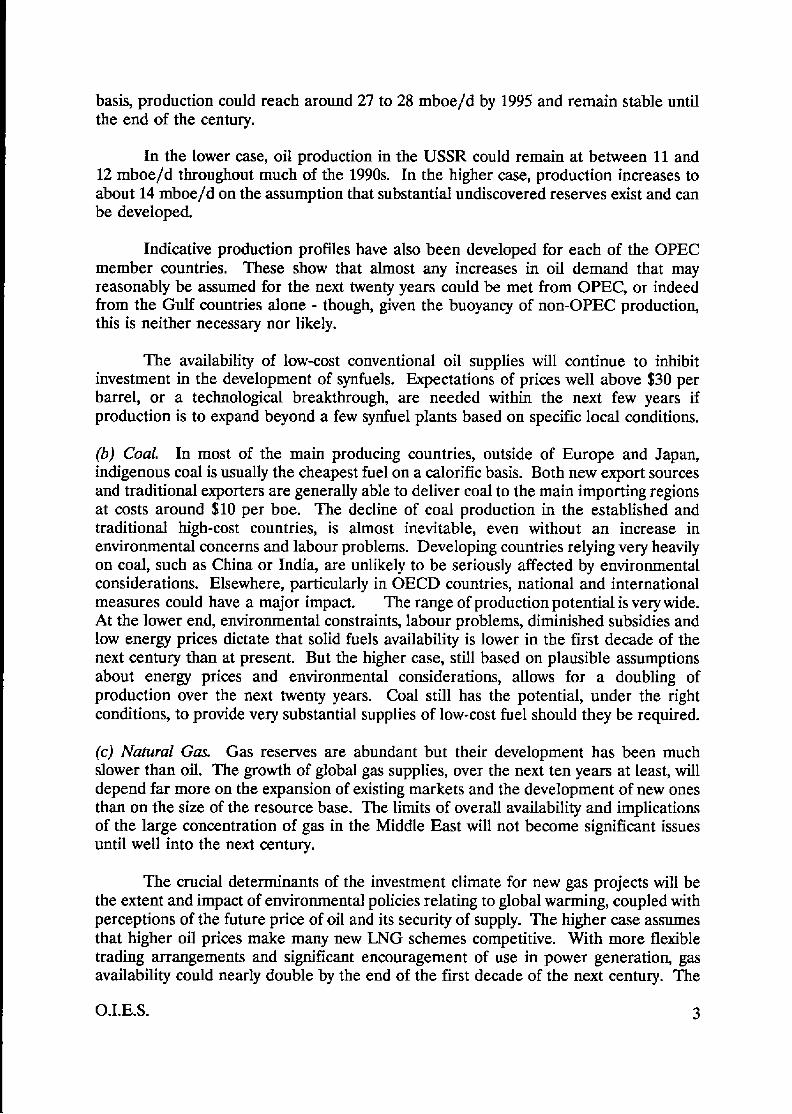
basis, production could reach around 27 to 28 mboe/d by 1995 and remain stable until the end of the century.
In the lower case, oil production in the USSR could remain at between 11 and 12 mboe/d throughout much of the 1990s. In the higher case, production increases to about 14 mboe/d on the assumption that substantial undiscovered reserves exist and can be developed.
Indicative production profiles have also been developed for each of the OPEC member countries. These show that almost any increases in oil demand that may reasonably be assumed for the next twenty years could be met from OPEC, or indeed from the Gulf countries alone - though, given the buoyancy of non-OPEC production, this is neither necessary nor likely.
The availability of low-cost conventional oil supplies wilI continue to inhibit investment in the development of synfuels. Expectations of prices well above $30 per barrel, or a technological breakthrough, are needed within the next few years if production is to expand beyond a few synfuel plants based on specific local conditions.
(b) Coal. In most of the main producing countries, outside of Europe and Japan, indigenous coal is usually the cheapest fuel on a calorific basis. Both new export sources and traditional exporters are generally able to deliver coal to the main importing regions at costs around $10 per boe. The decline of coal production in the established and traditional high-cost countries, is almost inevitable, even without an increase in environmental concerns and labour problems. Developing countries relying very heavily on coal, such as China or India, are unlikely to be seriously affected by environmental considerations. Elsewhere, particularly in OECD countries, national and international measures could have a major impact. The range of production potential is very wide. At the lower end, environmental constraints, labour problems, diminished subsidies and low energy prices dictate that soIid fuels availability is lower in the first decade of the next century than at present. But the higher case, still based on plausible assumptions about energy prices and environmental considerations, allows for a doubling of production over the next twenty years. Coal still has the potential, under the right conditions, to provide very substantial supplies of low-cost fuel should they be required.
(c) Natural Gas. Gas reserves are abundant but their development has been much slower than oil. The growth of global gas supplies, over the next ten years at least, will depend far more on the expansion of existing markets and the development of new ones than on the size of the resource base. The limits of overall availability and implications of the large concentration of gas in the Middle East will not become significant issues until well into the next century.
The crucial determinants of the investment climate for new gas projects will be the extent and impact of environmental policies relating to global warming, coupled with perceptions of the future price of oil and its security of supply. The higher case assumes that higher oil prices make many new LNG schemes competitive. With more flexible trading arrangements and significant encouragement of use in power generation, gas availability could nearly double by the end of the first decade of the next century. The
0.LE.S. 3

proportion of gas supplies coming from developing countries would then be well over 30 per cent compared with under 20 per cent at present. Production at this level will still have depleted only a IittIe over 40 per cent of the world's conventional gas resources and gas will be set to be the growth fuel of the twenty-first century.
(d) Nuclear. Orders for new nuclear capacity peaked in 1974, since when there has been an almost continuous decline. By the 1980s orders were confined to a handful of countries and in 1989 none were placed. Chernobyl helped to accelerate already growing doubts, and the future of nuclear power is now in jeopardy almost everywhere. Apart from the safety aspects, nuclear is increasingly perceived as a high-cost option for power generation.
Unless there are changes in current perceptions and increased rates of growth in electricity demand, the contribution of nuclear to worId energy supplies will virtually stagnate. This will occur despite the substantial amount of capacity still under construction. If nuclear power were eventually to be widely accepted as a relatively safe alternative with which to counter global warming, in addition to faster growth in electricity demand, orders could start picking up again. Even were this change to occur in the middle of the present decade no more than an additional 7 or 8 mboe/d of additional nuclear energy could be expected by the year 2010.
(e) Hydra Although very significant in certain countries and making a greater contribution than nuclear, the contribution of hydro to world energy supplies has remained unspectacular and often unremarked. Most of the practical expansion possibilities in the OECD lie largeIy with the upgrading and renovation of existing sites. The bulk of undeveloped sites are in developing countries and the USSR. In recent years there has been a growing awareness of the problems associated with large-scale hydro schemes and these are inhibiting the development of additional projects. In the long term, the pace of hydro development will depend on the availability of capita1 and the prices of competing energies seen partly in relation to environmental concerns.
Technological advances in high voltage transmission, enabling hydro-power to be sent economicalIy from remote sites, would be of major significance. Depending on the overall assumptions, the incremental supply from hydro and geothermal over the next twenty years could range horn less than 3 mboe/d to over 7 mboe/d.
An Overall Assessment: Exceptional Potential, Even at Moderate Oil Price Levels
It was argued earlier that the development of all the energy sources together at the top or bottom of their ranges is not a realistic assumption. In the very unlikely event that this were to occur, however, total incremental energy supply potential over the next twenty years could, in the compounded higher case, be as much as 80 mboe/d even without oil from OPEC. The scope and diversity of future sources represented by this kind of potential is of great significance to the final consumer particularly when allied with a growing flexibility in energy form and delivery.
It is dearly possible that, despite recent events, energy prices could be at the
4 O.I.E.S.

lower end of, or even fall below, the range we have considered. This would increase demand, reduce the proportion of currently assessed resources which it would be economical to exploit, and reduce the incentive to discover and develop new sources. The very existence of IOW energy prices would, however, indicate that there was no immediate shortage of energy supples. Over time, increases in demand and reduced supplies might cause prices to rise. But the assessments of long-term prospects for energy supplies in this paper, in effect informal ‘supply curves’ for the various energy sources, indicate that prices would not have to rise beyond the price range assumed ($15- 30/boe) for long-term market balance to be achieved.
It is true that energy, and especially oil, supplies may become increasingly concentrated in a small number of countries. But again, any sustained attempt to use such potential economic power by raising prices would call forth further supplies from a wider and increasing flexible range of energy resources, as well as reducing demand growth.
If energy supplies prove to fa11 at the lower end of our estimates this will be because there is insufficient demand to justify their exploitation (or to put it another way, energy prices do not rise sufficiently to provide the incentive to develop new supply sources). It will not be because of any intrinsic physical or other difficulties of supply reflected in rapidly rising costs.
It is important to emphasize that the pragmatic judgements made in both the higher and the lower cases take into account the full range of factors influencing supply, including investment requirements. The conclusion that energy supply is not likely to be heavily constrained over the next twenty years is therefore a strong one. However, it does apply only to likely trends. In the short and medium term, mismatches of demand and supply, whether global or in terms of particular regions or fuels, will inevitably occur and the actual path of prices and consumption will no doubt prove unstable, as in the past.
O.I.E.S. 5

6 O.I.E.S.
1 THE RESOURCE BASE AN ABUNDANCE OF ENERGY?
1.1 Introduction I It is nearly two decades since the exhaustion of the world's energy resources was a major and well publicized topic. Currently the emphasis is placed more on the global environmental problems caused by using too much energy.
Concerns over national resource availability, the international distribution of energy and its long-term cost continue to play a part in policy decisions. However, there is at present little repetition of the fears which emerged in the 1970s, the 1950s and even earlier that energy resources will soon be depleted. This lack of pessimism certainly seems well founded when the sole consideration is the amount of conventional energy available in the world as a whole.
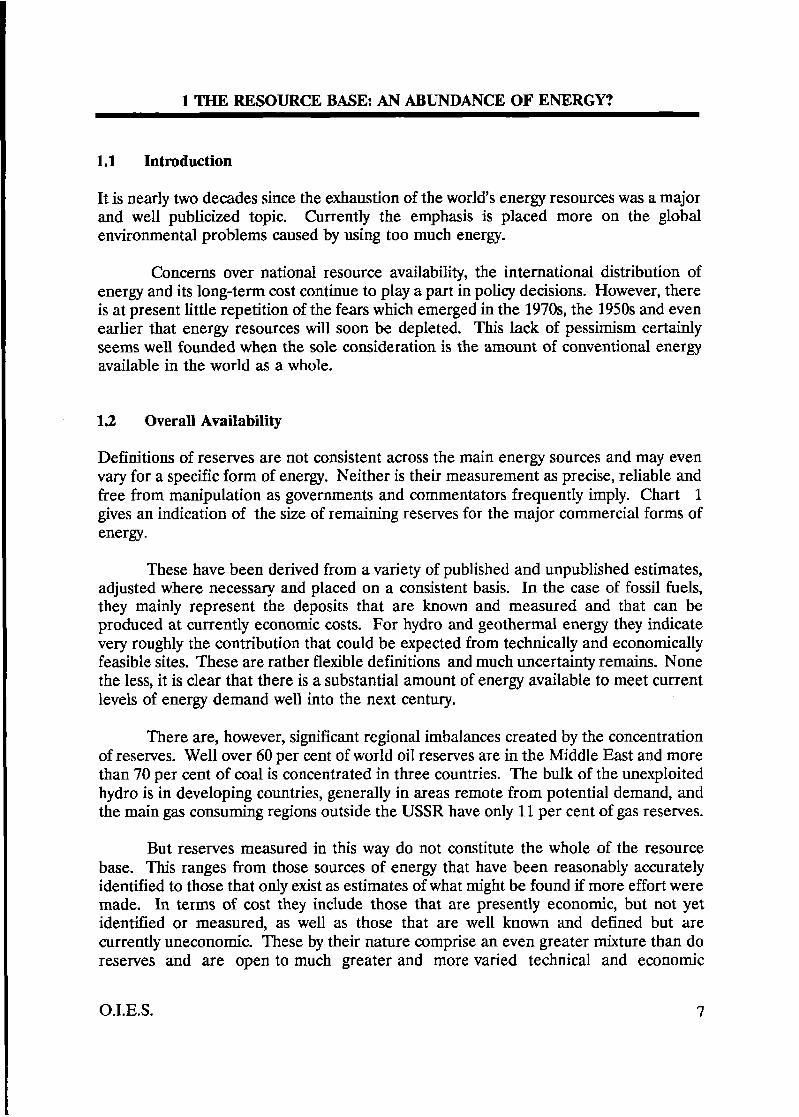
1.2 Overall Availability I Definitions of reserves are not consistent across the main energy sources and may even vary for a specific form of energy. Neither is their measurement as precise, reliable and free from manipulation as governments and commentators frequently imply. Chart 1 gives an indication of the size of remaining reserves for the major commercial forms of energy.
These have been derived from a variety of published and unpublished estimates, adjusted where necessary and placed on a consistent basis. In the case of fossil fuels, they mainly represent the deposits that are known and measured and that can be produced at currently economic costs. For hydro and geothermal energy they indicate very roughly the contribution that could be expected from technically and economically feasible sites. These are rather flexible definitions and much uncertainty remains. None the less, it is clear that there is a substantial amount of energy available to meet current levels of energy demand well into the next century.
There are, however, significant regional imbalances created by the concentration of reserves. Well over 60 per cent of world oil reserves are in the MiddIe East and more than 70 per cent of coal is concentrated in three countries. The bulk of the unexpIoited hydro is in developing countries, generally in areas remote from potential demand, and the main gas consuming regions outside the USSR have only 11 per cent of gas reserves.
But reserves measured in this way do not constitute the whole of the resource base. This ranges from those sources of energy that have been reasonably accurately identified to those that only exist as estimates of what might be found if more effort were made. In terms of cost they include those that are presently economic, but not yet identified or measured, as well as those that are well known and defined but are currently uneconomic. These by their nature comprise an even greater mixture than do reserves and are open to much greater and more varied technical and economic
7
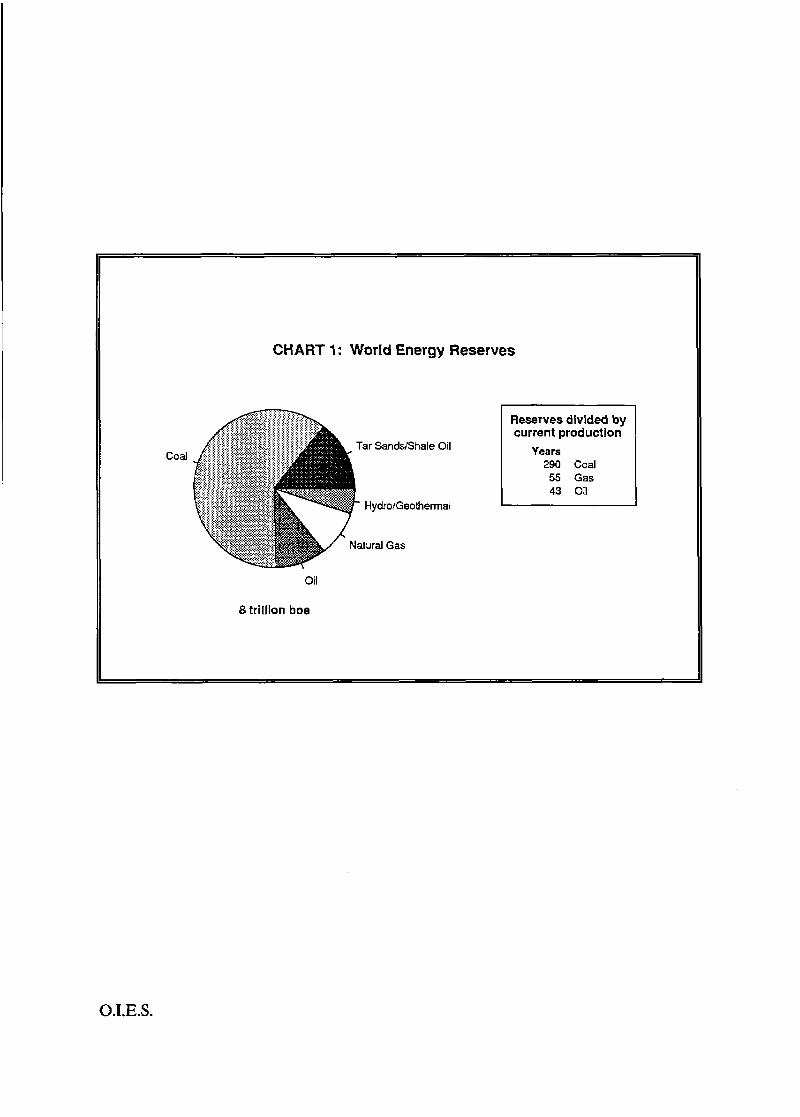
CHART 1 : World Energy Reserves
Tar SanddShale Oil coal
H ydrolGeoherrna1
current production
290 Coal 55 Gas 43 Oil
Years
Oil
8 trillion boe
O.I.E.S.
interpretation.
Over time, these additional resources are converted into proven reserves. Tfiis can be the result of discovery and measurement and improvements in production technologies. Economic and socio-political changes may also increase the price or acceptability of the resource and thus make the cost of its development more acceptable. An indication of the size of these additional resources is given in Chart 2. Once again
coal dominates.
In themselves, these estimates mean very little; differing qualities and cost are not made explicit and there are other potential sources of energy which could well have been included. None the less, they do indicate that there appears to be a very substantial amount of conventional commercial energy available in one form or another. It would be suffkient to last well into the next century through conventional use, even with a reversion to the growth rates of demand common in the sixties.
When each individual resource is examined in more detail some of the potential constraints and opportunities come more clearly into focus.
1.3 Solid Fuels
The resource base is considerably larger than any other fossil fuel and is not likely to represent a problem within any realistic timespan. Coal deposits are widespread and very substantial, although over 90 per cent of hard coal and lignite deposits are concentrated in nine countries and 70 per cent in the USSR, China and the USA.
Exploration for coal deposits in developing countries has been much less intensive than elsewhere and there is every likelihood that new discoveries or upward revisions of existing estimates wil l be made. However, the extent of tonnage already available for trade as well as the overall level of incentives tend at present to inhibit exploration and development activity. Many of the assessments of the resource base are founded on old, incomplete and probably inaccurate material and the cost and quality of the deposits recorded are often uncertain. Coal is not an homogenous product and some reserves which look good on paper would not be readily acceptable, particularly in international trade. On a basis of technical costs, it seem likely that the bulk, approximately 70 per cent, of reserves could be made available at well under $40 per tonne (say approximately $10 per boe) at minehead with perhaps half at $25 per tonne or less. This does not prevent certain areas, in Western Europe particularly, from producing coal from reserves with technica1 costs of over $100 per tonne or over $20 per boe.
A substantial amount of peat is also available which could be exploited commercially in some areas. It is found in all continents and at least SE@ countries have deposits. However, nearly 80 per cent of usable resources are concentrated in four countries; USSR, USA, Canada and Indonesia. The total usable amount of peat is probably equivalent to some 800 to 900 billion boe. Peat is currently used commercially in only a few countries. However, its high weight to heat ratio, water content and other poor qualities mean that it is unlikeIy to be more generally developed except under very
O.I.E.S. 9

CHART 2: Additional Energy Resources
ar SandSEhale Oil
Coal
52 trillion boe
O.I.E.S.
specific and favourable local circumstances.
1.4 Natural Gas
In 1950, world proven reserves of natural gas were estimated at approximately 8 tcm. By 1970, estimates had increased fivefold and by 1980 had reached 80 tcm. Over the last five years proven reserves have increased at 3 per cent per annum with new reserves being added at an annual rate considerably in excess of that of production. Currently, reserves are reported as totalling 113 tan or 730 billion boe. It is possible that 50 per cent or so of this gas is available at technical costs below $10 per boe. Reserves are widely distributed over about eighty countries but 38 per cent is in the USSR and half of this is contained in three super giant fields. One-third of reserves are in the Middle East and North Africa although the extent of these is probably an understatement.
The main consuming areas other than the USSR - namely the USA, Western Europe and Japan - together account for only some 11 per cent of reserves. This mismatch between where the gas is demanded and where low-cost reserves are available is compounded by the low energy density of gas, which contributes to its high transport costs in relation to oil.
At present rates of consumption, globaI gas supplies could be expected to last for about fifty-five years on the basis of current remaining reserves alone.
The size of the overall natural gas resource base is still uncertain, probabIy underestimated, and may well represent a much bigger potential source of remaining energy than oil. AIthough there is a common view that few new giant gas fields will be discovered, previously underexplored basins worldwide could still hold giant or supergiant accumulations. Some of the uncertainty stems from the fact that exploration in the past has not been specifically for gas but concentrated on oil. However, occurrences are not completely independent; in many sedimentary basins, oil and gas accumulations are closely associated and related to the same geological conditions. Thus major gas formations are generally known in basins which have been intensively explored for oil - although there may be deeper formations that have not been sufficiently penetrated. Over the coming years, gas reserves will certainly be augmented by gas from deep exploration in existing fields. Additions to reserves will be encouraged by the growing importance of gas as a clean fuel and increasing interest in additional gas use both in developing countries and by existing major users.
Beyond the conventional sources of natural gas are substantial amounts of relatively expensive unconventional gas from sources such as tight formations, coal bed methane and gas hydrates. While reserves from current conventional gas fields seem unlikely to peak until early next century, this will not be the case for production from the, as yet, undiscovered conventional resources until some decades later. Thus there will be no significant need to develop unconventional gas unless there is a very substantial and sustained increase in gas demand over a lengthy period.
O.I.E.S. 11
1.5 Hydro electricity and Geothermal
Since hydro is a renewable fuel it is not strictly comparable as a resource with fossil fuels. However, its intrinsic potential is limited and can, in theory, be measured more precisely than fossil fuels.
The World Energy Conference in 1980 put the theoretical potential at over 10,000 GW (equivalent to over 200 mboe/d of oil displaced). This is a meaningless figure on its own and the technically usable potential is usually put within the range 2200 to 2900 GW (equivalent to 45 to 65 mboeld). Tt is very uncertain how much of this is actually economic at present but it may be as low as 30 to 40 per cent.
The majority of economic sites have already been exploited in the OECD countries. For example, in Western Europe over 90 per cent of potential capacity is actually in place and operating. Most remaining sites are in the USSR and the developing regions, particularly China, South East Asia and South America.
The economics of hydro development are very site specific and capital intensive. Costs are rising in real terms because most of the attractive sites have already been used and the viability of many of those remaining is doubtful at present.
Hydro projects usually have a long life although silting and other problems can significantly reduce availability. For example, the Tarbela dam in Pakistan could lose 90 per cent of its power through silting over the next fifty years with the result that Pakistan would lose the bulk of its power supplies.
The actual size of the contribution yet to be made by hydro depends on the hydrological conditions and local patterns of electricity demand as well as on interfuel economics. None the less, the world hydro potential remaining to be developed represents at least an additional 35 mboe/d in terms of displaced fossiI fueIs.
The energy resource represented by geothermal power is important in a few specific countries on the volcanic belt. Overall, it could represent a theoretical potential of as much as lo00 GW or 23 mboeld. In practice, with most of the best sites already developed and many practical difficulties, its potential as a resource base in global terms is not very significant.
1.6 Nuclear
In the days when nuclear was regarded as the key energy source for the future, the size of the uranium resource was often considered to be a potential constraint - although the potential from breeder reactors tended to alleviate any really Iong-term threat. The falling away of nuclear orders and the dramatic decline in uranium prices from the highs of the 1970s, combined with the possibility of using mixed oxides, now mean that these worries are somewhat academic. A major revival of nuclear power would, of course, lead to capacity constraints in mines and processing facilities, but these are likely to be only short-lived. In any case, the availability of uranium has generally been understated and
12 O.I.E.S.
its cost overstated. In addition, if fusion and new fission technologies were to be developed significantly, there would be other resource routes to follow.
1.7 Oil
There have been and wilI continue to be many different opinions on how much oil remains to be exploited. Estimates of the size of the oil resource base have grown substantially over the years. Generally these estimates have been based on geological methods of assessment or by historical and statistical interpretation using drilling and discovery data. In a number of cases they have been based soIely on expert opinion.
Estimates of the ultimate size of oil resources made during and just after the Second World War were usually under 600 billion barrels. These now appear rather low in the light of current knowledge and, indeed, are less than cumulative production to date. Throughout the 195Os, estimates tended to put the volume at we11 under 2 trillion barrels. By the 1960s and 1 9 7 0 ~ ~ the present consensus of around 2 to 2.5 trillion barrels of conventional oil had been reached. However, some estimates put it at least 50 per cent higher.
Assessment is largely a subjective process and it appears to be many years since a thorough globaI reassessment has been made in the light of the latest experience and information. Thus, uncertainty seems likely to continue despite the rapidly growing knowledge of world oil occurrences and the potential for increased recovery.
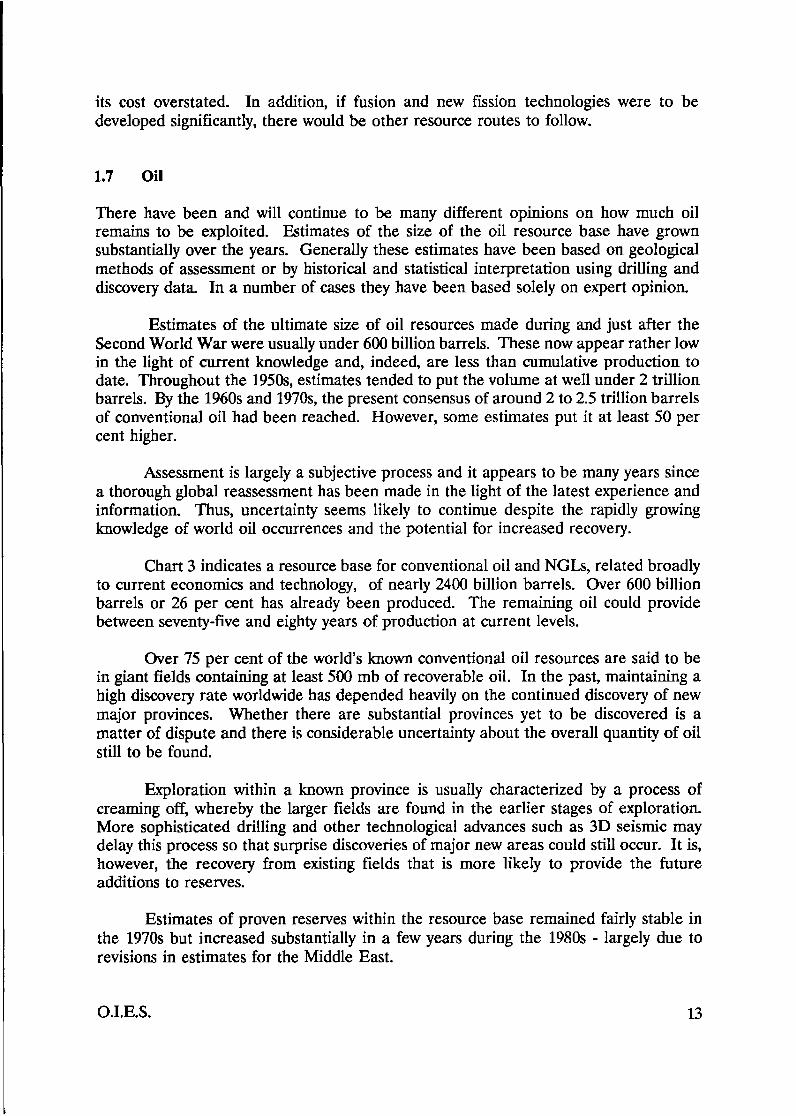
Chart 3 indicates a resource base for conventional oil and NGLs, related broadly to current economics and technology, of nearly 2400 billion barrels. Over 600 billion barrels or 26 per cent has already been produced. The remaining oil could provide between seventy-five and eighty years of production at current levels.
Over 75 per cent of the world's known conventional oil resources are said to be in giant fields containing at least 500 mb of recoverable oil. In the past, maintaining a high discovery rate worldwide has depended heavily on the continued discovery of new major provinces. Whether there are substantial provinces yet to be discovered is a matter of dispute and there is considerable uncertainty about the overall quantity of oil still to be found.
Exploration within a known province is usually characterized by a process of creaming off, whereby the larger fields are found in the earlier stages of exploration. More sophisticated drilling and other technological advances such as 3D seismic may delay this process so that surprise discoveries of major new areas could still occur. It is, however, the recovery from existing fields that is more likely to provide the future additions to reserves.
Estimates of proven reserves within the resource base remained fairly stable in the 1970s but increased substantially in a few years during the 1980s - largely due to revisions in estimates for the Middle East.
O.I.E.S. 13
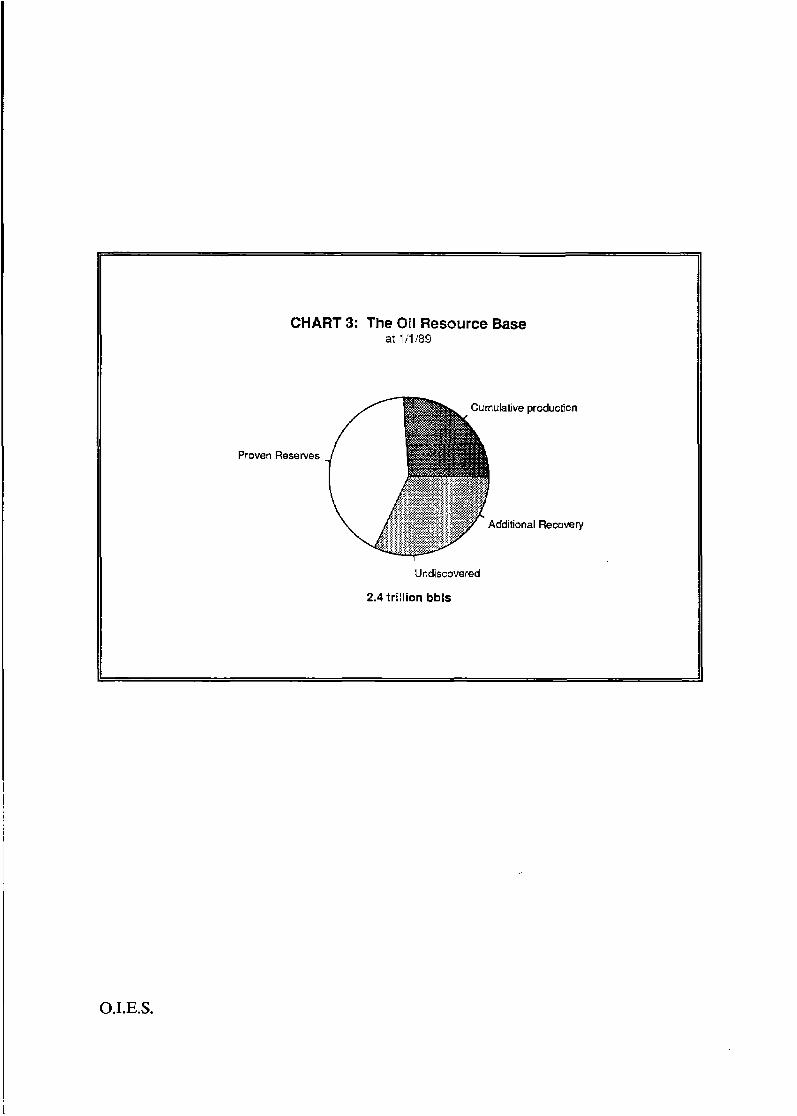
CHART 3: The Oil Resource Base ar lilW9
Cumulative producticn
Proven Reserves
Additional Recovery
Undiscovered
2.4 trillion bbls
0 .I .E. S.
In the past, discoveries have generally tended to be less than production although the published estimates of reserves have scarcely been affected or have actually increased. For many years the reserves to current production ratio was approximately thirty years, although it is now at least forty years for the whole world. Continued expansion has tended to come largely from the enhancement of existing proven reserves. Considerable appreciation has occurred, and will continue to occur as a result of appraisal and development drilling and through revision of recovery efficiency estimates. Certain non-technical reasons are also involved. Thus, proven reserves, particularly from newly discovered fields, are usually found to be an understatement of final recoverable volumes.
Although commercial deposits of oil have been found in around eighty countries, the distribution of reserves remains very concentrated. ApproximateIy 63 per cent are in the Middle East, with an additional 21 per cent in four countries, the USSR, Mexico, USA and Venezuela (see Chart 4).
This well-known concentration of reserves in the Middle East is emphasized by the present reserves to current production ratio for the region of well over 100 years.
The unit technical cost of producing the world's oil resources will continue to vary over time and location. Technological advances are being set against the need to extract oil from increasingly difficult and deep sources and, in some areas, costs arising from environmental considerations. The cost of producing from existing onshore Middle East reserves has been generally under $1 per barrel, whereas the costs of smaller North Sea fields, for example, are around $20. In terms of reserves of oil, perhaps 60 per cent could be obtained at under $10 per barrel with 80 per cent available at under $20. A rough estimate of some 300 billion barrels of oil from enhanced recovery using thermal and chemical methods is included in the resource base. This would involve costs rising sharply upward from $15 to $40 per barrel or so, depending on the sophistication of the process. The technoIogical innovativeness of the industry should mean that these costs would eventually be significantly reduced.
The recoverable conventional oil resources in non-OPEC countries outside China and the former Eastern Bloc are estimated at around 600 billion barrels. Approximately 40 per cent has been produced already. Reserves are presently said to be between 165 to 170 billion barrels. During the last five years estimates of these reserves have increased by nearly 10 per cent, largely through reassessment of existing fields. There have been no significant discoveries of major areas since the early 1 9 8 0 ~ ~ although it is possible that an additional 200 billion barrels of oil may yet be discovered or obtained by enhanced recovery techniques. However, this type of estimate is by its nature very tentative and the actual figure couId be considerably higher or lower.
The chances of opening up new oil provinces comparable to the North Sea in the non-OPEC countries are considered slim. Those countries where exploration has been almost non-existent and where there may be resources tend to be rather unattractive from a technical, political and economic point of view. Although there may be more surprises on the lines of North Yemen and developments such as Papua New Guinea, reappraisal and increased recovery from existing fields seem likely to provide the bulk
0. I. E. S. 15
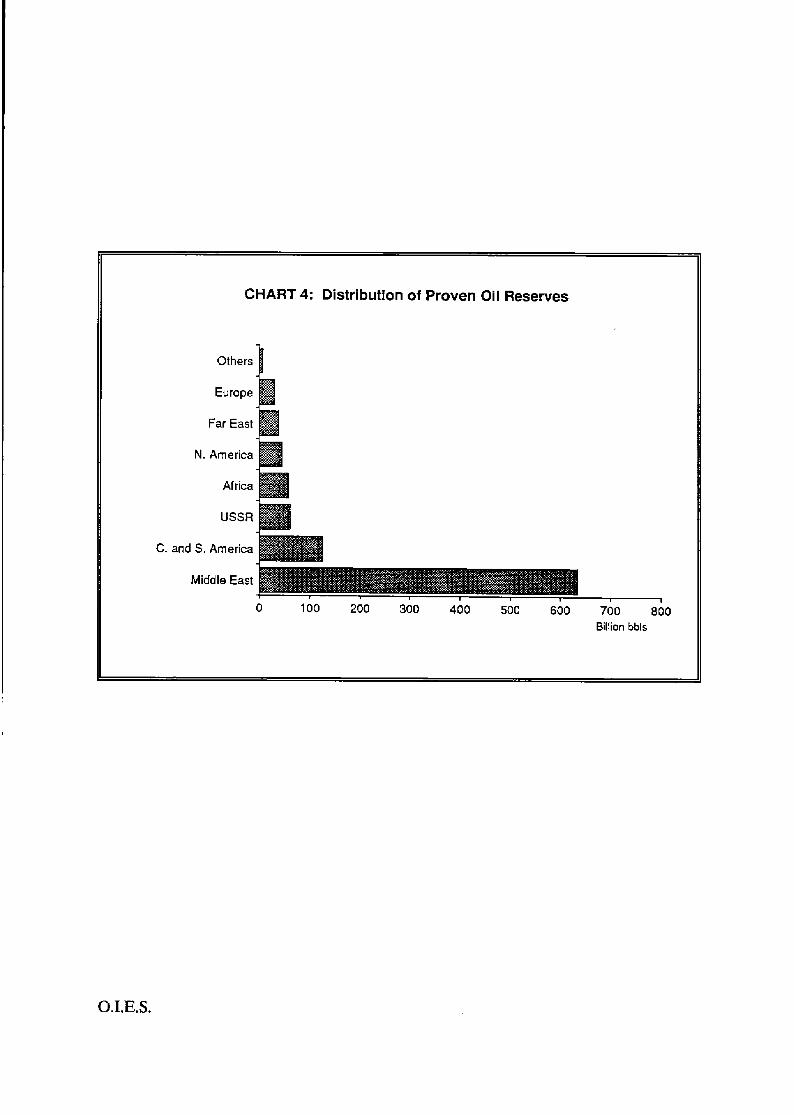
CHART 4: Distribution of Proven Oil Reserves
Others
Europe
Far East
N. America
Africa
USSR
C. and S. America
Middle East
0 100 200 300 460 500 600 700 860 Billion bbls
0. I. E. S.

of future additions to reserves.
1.8 Oil Shale and Tar Sands
In addition to the conventional oil resource base there are shale oils and tar sands which are, apparently, present in recoverable volumes at least comparable to those from conventional oil.
Oil shale is found all over the world but data is erratic and uncertain. As much as 14 trillion barrels of oil of all grades has been indicated. There are, however, only very rough estimates of how much of this enormous volume could actually be produced under any realistic future price regime. Possibly only 25 per cent might eventually be considered feasible. At current prices for conventional oil, scarcely any of even the highest quality deposits can be considered as reserves in the strictest sense.
Tar sands and extra heavy oil represents the most usable of the unconventional oils at current prices. Approximately 70 per cent of the known recoverable resource of tar sands of 440 billion boe is in Canada, the only country where any significant production is taking place. The Orinoco heavy oil belt in Venezuela has at least 60 billion barrels of heavy oil. Small volumes are being marketed already as an emulsion but the overall economics are not dear.
There is great uncertainty about the size, quality and economics of all the unconventional oils, but they do represent a very substantial source of liquid fuel awaiting higher prices or a technological breakthrough.
On the basis of these considerations we have built up, country by country, the estimates of ‘proven reserves’ and ‘potential resources’ depicted in Charts 1-4. From this resource base, energy supplies will be drawn over the next twenty years. How much of each form of energy is actually supplied from these resources will depend on a great variety of conditions including prices, government taxation and regulation, the level and status of capacity in place and under construction, development of energy producing and transporting technologies, political circumstances, and so forth. In the following chapters we map out, OR the basis of higher and lower cases incorporating alternative assumptions about these factors, the potential range of supplies from each energy source which we consider feasible over the next twenty years. The resource base described in the present chapter is adequate to support, in each case, the future volumes indicated for the individual sources of energy. The feasible and likely rates of exploitation of this abundant resource base are developed in subsequent chapters.
O.I.E.S. 17

O.I.E.S.
2 OIL: WITH CONFIDENCE INTO THE TWENTY-FIRST CENTURY?
2.1 Introduction
During much of the 1920s and 1930s oil supplied less than 20 per cent of the world‘s conventional energy needs. However, its role as a transport fuel ensured that it was regarded from the early days as a strategic resource.
The post-war reconstruction period saw cheap and plentiful oil moving rapidly into the industrial and domestic markets that had for so long been dominated by coal. By 1960, global production of oil had reached nearly four times the pre-war level and was meeting 34 per cent of the world’s energy needs. In the 196Us, world oil production continued to grow at an annual average increase of nearly 9 per cent compared with overall energy growth of 6 per cent.
By 1970, oil was meeting nearly half the world demand for primary energy. The world outside China, the USSR and its then satellites, was obtaining nearly 60 per cent of its oil needs from the Persian Gulf. The geographical spread of oil resources, their size and future production potential were of increasing strategic importance and the subject of intense political and economic focus.
The subsequent oil price ‘shocks’ encouraged substitution and conservation of oil. At the same time technological advances were leading to a greater availability of gas and changing patterns of demand were encouraging the wider use of electricity. As a result, oil’s share of primary energy supply had fallen to 38 per cent by 1985 and world production of oil was some 4 mboe/d less than in 1930. In recent years oil production has been increasing again and is WrrentIy close to the peak Ievel of production achieved in 1979. However, its contribution to world energy supplies has fallen slightly.
OiI is relatively cheap to transport and store and has no real rival in terms of flexibility and the range of uses to which it can be put. It is, and seems likely to remain well into the next century, the most desirable of fuels despite the problems associated with its security of supply and environmental impact. How long the world can continue to rely on obtaining adequate supplies of oil, and the levels of future production that might be achieved are perennial questions which are unlikely ever to be answered definitively.
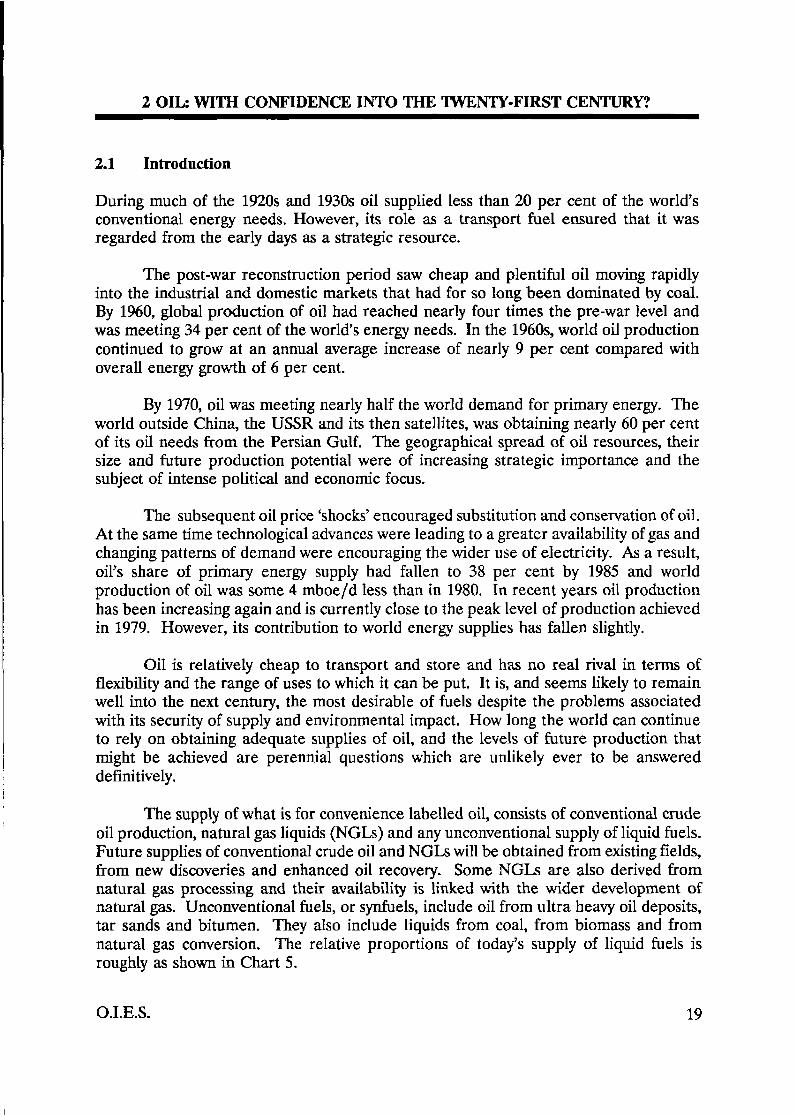
The supply of what is for convenience labelled oil, consists of conventional crude oil production, natural gas liquids (NGLs) and any unconventional supply of liquid fuels. Future supplies of conventional crude oil and NGLs will be obtained from existing fields, from new discoveries and enhanced oil recovery. Some NGLs are aIso derived horn natural gas processing and their availability is linked with the wider development of natural gas. Unconventional fuels, or synfuels, include oil from ultra heavy oil deposits, tar sands and bitumen. They also include liquids from coal, from biomass and from natural gas conversion. The reIative proportions of today’s supply of liquid fuels is roughly as shown in Chart 5.
0. I. E. S. 19
Conventional Crude Oil
Syn Fuels Additional Recovery
atural Gas Liquids
64 million bdoe
O.I.E.S.
CHART 5: Liquid Fuels Productlon
7989
2.2 Current Developments
In Chapter 1 we have discussed the amount of oil that is still available to be exploited on a world-wide basis. While recognizing the great uncertainty involved, if these estimates are accepted the remaining Conventional oil resource would be able to provide around eighty more years of production at current levels.
The technical costs of producing this oil wiIl continue to vary over time and according to location but 60 per cent could perhaps be obtained at under $10 per barrel. In addition, there are comparable volumes of recoverable but largely unexploited unconventional oils.
It is interesting to note the rate at which oil has been used up in the past. It took 109 years from 1859 to 1968 to produce the first 200 billion barreIs, while the second 200 billion barrels were produced and consumed in just ten years. The following ten years or so saw no further acceleration in use and another 200 billion barrels were used up. In Chapter 1 it was established that the estimated size of the proven reserves at any given time is liable to be changed by enhancement and continual reassessment. None the less, proven reserves of conventional oil at the levels currently deemed to be economic would be able to sustain present production for over forty years. Any consideration of future oil supply is, of course, overshadowed by the concentration of low-cost conventional oil reserves in the Middle East and a few OPEC countries. Approximately 63 per cent of currently estimated reserves are in the Middle East with over 50 per cent in Kuwait, Saudi Arabia, Iraq and Iran. The bulk of these reserves has basic technical costs of production of $1 per barrel or less and represents a reserves to production ratio of well over 100 years.
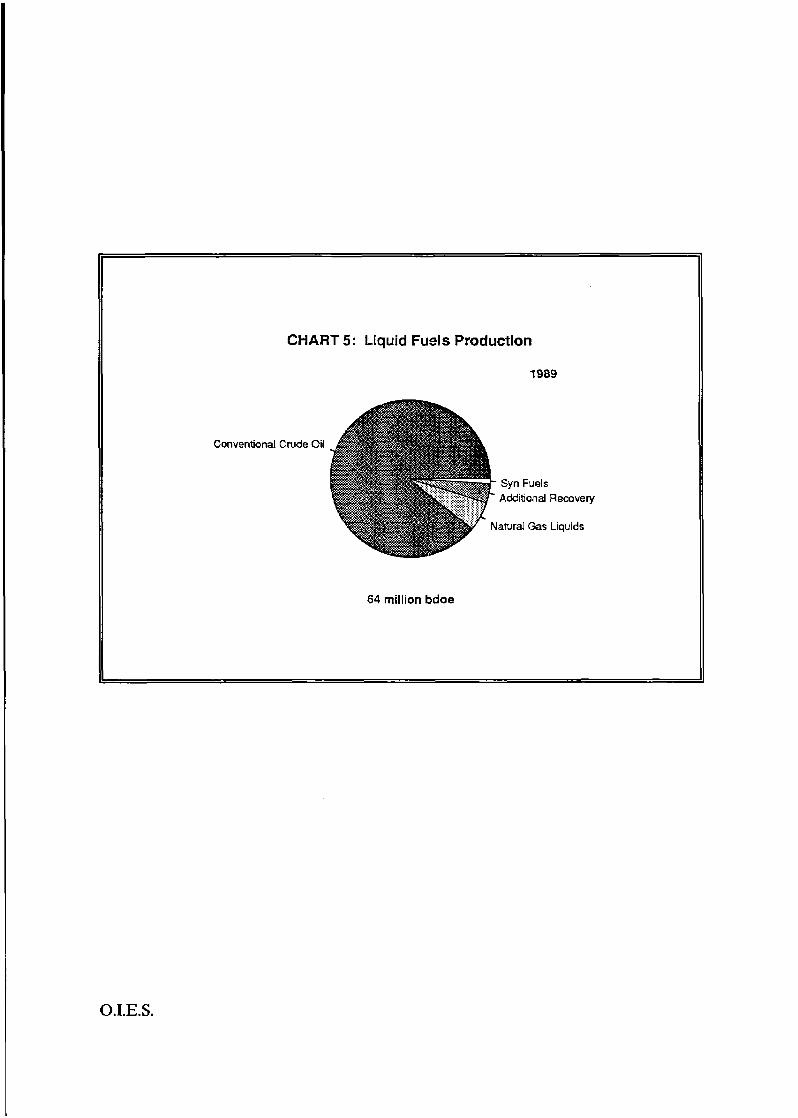
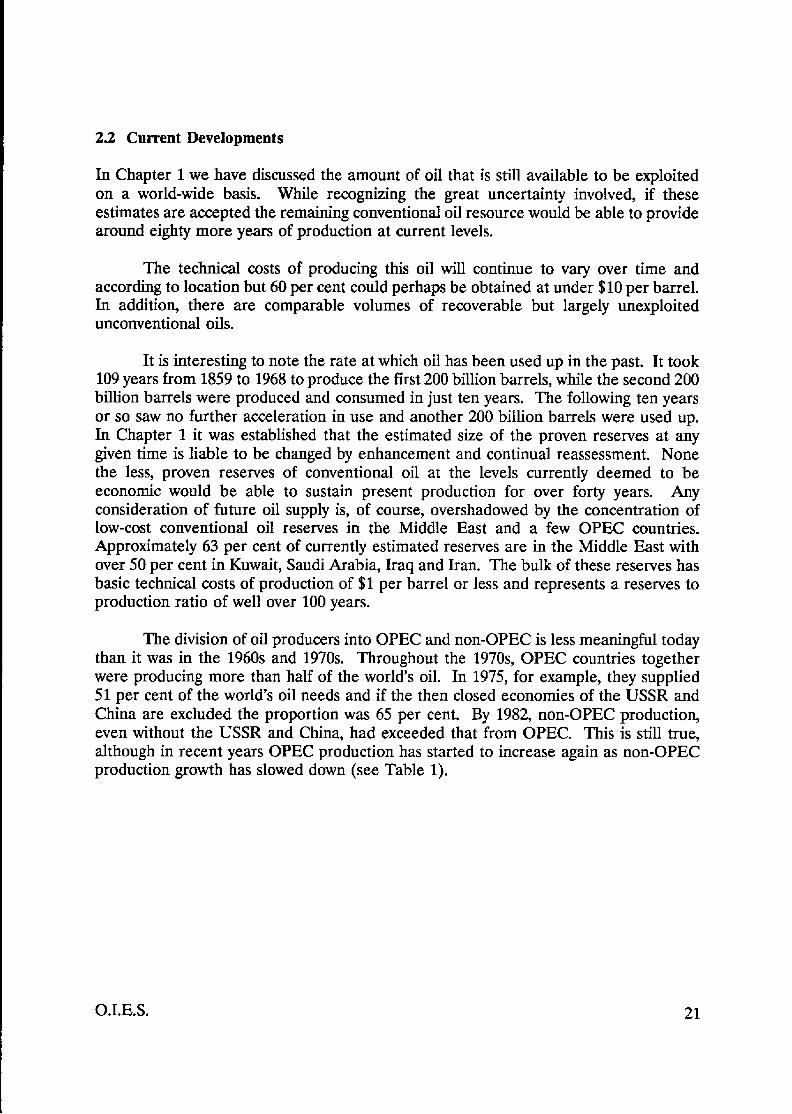
The division of oil producers into OPEC and non-OPEC is less meaningful today than it was in the 1960s and 1970s. Throughout the 1970s, OPEC countries together were producing more than half of the world's oil. In 1975, for example, they supplied 51 per cent of the world's oil needs and if the then closed economies of the USSR and China are excluded the proportion was 65 per cent. By 1982, non-OPEC production, even without the USSR and China, had exceeded that from OPEC. This is still true, although in recent years OPEC production has started to increase again as non-OPEC production growth has slowed down (see Table 1).
O.I.E.S. 21
Table 1: World Production of Liquid Fuels. Million Barrels of Oil Equivalent per Day.
OPEC Non-OPEC USSR/China etc. Total
1960 9 9 3 21
1965 14 11 5 30
1970 24 17 8 49
1975 28 14 12 54
1980 27 20 15 62
1981 23 21 14 58
1982 20 22 14 56
1983 18 23 1s 56
1984 17 24 15 56
1985 16 25 15 56
1986 19 25 15 59
1987 19 25 16 60
1988 21 25 16 62
1989 23 25 16 64
The political distinctions between the two groups have also tended, of late, to become somewhat blurred. There has been at least some pretence at co-operation with OPEC aims by a few non-member countries, while many OPEC members, as has been strikingly demonstrated recently, have very little in common and show little genuine co- operation. However, it is still both valid and convenient to look at the future potential for production in non-OPEC and OPEC groupings. It is the interaction between these groups that should hold the key to any understanding of oil’s overall future contribution to energy supply and the development of energy prices.
22 O.I.E.S.

The enormous long-term supply potential of the Gulf members of OPEC is undoubted. Whether they will be able to regain their once dominant oil supply position will hinge directly on the potential for production in the non-OPEC countries as well as perceptions of their political stability and the future growth of demand for oil. The geo- political and economic influences on the future level on non-OPEC production are increasing rather than diminishing in importance year by year.
China and the USSR are slowly moving out of closed systems that impinged on globd supplies only through their net exports. However, for a variety of reasons it is still more useful to consider their production potentid separately from the other non-OPEC countries.
The history of non-OPEC oil supply has been and still is, dominated by United States production. Production in the Lower 48 states appears to have reached a pIateau in 1985. Decline was hastened by the price collapse of 1986 and production has continued to fall steadily ever since. Despite the apparent weaIth of detail on US oil, the actual size of reserves is not known and whether it is possible to stern the fall in production for some years by means of fiscal and other encouragement is far from clear. On the basis of the reserve levels generally stated, the decline in Lower 48 production can only be prevented for a few years, if at all.
Increased non-OPEC production between the mid-1970s and the mid-1980s was based largely on substantial discoveries in three major areas - the North Sea, Mexico and Alaska (Table 2).
Table 2: Non-OPEC Oil Production (Excluding USSR, Eastern Europe and China). Million Barrels of Oil Equivalent per Day.
USA (Excl Alaska)
1980 8.1 1981 8.0 1982 8.0 1983 8.0 1984 8.2 1985 8.3 1986 7.9 1987 7.4 1988 7.3 1989 6.9
Alaska, Mexico, North Sea
5.9 6.3 7.3 7.6 8.0 8.2 8.0 8.3 8.3 8.1
Others
6.1 6.3 6.5 7.1 7.9 8.4 8.9 9.4 9.6 IO. 1
Total
20.1 20.6 21.8 22.7 24.1 24.9 24.8 25.1 25.2 25.1
O.I.E.S. 23

The development of these areas compensated for the decline in the US Lower 48 states. Outside North America it was the rapid development of the North Sea that helped to raise non-OPEC production to record levels during this period. New major increases in UK North Sea production are unlikely; discoveries and the enhancement of existing fields seem, at best, only able to compensate for the decline in old major fields such as Brent and Forties. Norwegian production does have substantial potential for growth over the next decade and perhaps into the next century, although development is currently constrained by the policies of the Norwegian government. The scope for finding other major producing areas comparable to the North Sea, Mexico and Alaska is generally considered smalI.
Since the mid-1980s in particular, growth in non-OPEC production has come Iargely from a wide range of relatively small developments in individual countries. These include Brazil, Colombia, Angola, Egypt, Oman, Malaysia and the Yemen. Some of these, such as North and South Yemen, were surprises which had been given very little consideration in most assessments of future non-OPEC potential. Few new surprises seem likely. None the less, developments in existing provinces and the potential from known new areas such as Papua New Guinea and the underexplored areas of central Africa and South America could together produce a formidable supply source well in excess of that of the three major areas.
The overwhelming proportion of non-OPEC oil is used by countries that are net importers and therefore have economic and political interests in encouraging new capacity. Although the USA is the largest, they all have an interest in sustaining and developing their indigenous oil resources to the maximum possible. The profitable years of the late 1970s and early 1980s attracted large upstream investment, particularly in the USA and Canada where older fields were rejuvenated by infill drilling and other methods. Although the subsequent decline of oil prices has had some effect on development it has been largeIy offset by a more realistic approach by many governments to foreign investment and involvement.
2.3 Future Availability
Most projections of non-OPEC 02 tend to show production peaking just a few years after the year in which the projection was made. This usually reflects a belief that new additions to capacity are increasingIy unable to compensate for declining US and North Sea production.
In order to appreciate the long-term future of oil supplies from non-OPEC sources, there is little real alternative than to consider the position of each country on an individual basis. For this review, individual assessments were made of the level of each country’s proven reserves, the state of their development and the likelihood of any revision The possibilities for new discoveries and the speed with which they might be developed were also considered, as was the potential for gas liquids or synthetic fuel production. None of these elements can be considered without relating it to the evolving economic and political priorities of the countries concerned within a worldwide context.
24 O.I.E.S.

The country-by-country assessments towards the low end of the range have been made against an assumed perception of oil prices remaining at around $15 to $20 per barrel. This perception of price is more important for the development of new fields where all investment has still to be made than for production from existing fields. Even with new development, however, the rate of upstream take can have a greater effect than price on the pace of development. Reductions in royalties, removal of windfall profit taxes and a generally more welcoming attitude have stimulated activity in the past - even with falling oil prices. In addition technological advances have helped to bring down unit costs which at one time appeared to be rising inexorably. The resuIts reflect an assumption that the combination of oil prices and such ‘terms and conditions’ will remain much as it is at present.
Technology is assumed to improve only at historical rates. Little change in the environmental problems that have precluded finding and developing oil in the frontier areas is expected in this lower case. Conversely, few additional environmental burdens such as higher platform dismantling costs or carbon taxes have been assumed to affect future development (see Chart 6).
The results show overall non-OPEC production reaching a plateau around 1993 and, thereafter, decIining slowly during the later years of the decade. None the less, production could still be at 23 to 24 mboe/d in the year 2000 and just under 20 mboe/d ten years later. (For further details see Appendix la.) At this time, in 2010, production would be declining steadily in all major regions.
Production in North America declines, with Canadian production unable to compensate for the exhaustion of US reserves. Supply potential from Central and South America increases during most of the nineties, largely from Mexico and, to a lesser extent, from Colombia. During most of the decade supplies from the Far East are able to be maintained, by increased capacity in Malaysia and a few smaller producers. Western European production as a whole is also stable to the turn of the century, with production from Norway able to compensate for declining production in the UK and onshore Europe. Production capacity in India and Australia and the non-OPEC countries of the Middle East and Africa declines by the late 1990s.
To sum up, by the turn of the century, only Norway and Mexico amongst the major producers will not be in decline. This view is perhaps as unduly pessimistic as were some of the past projections of the potential from non-OPEC countries. The greatest source of uncertainty is the size of the undiscovered resource base and the potential for higher extraction rates.
Although these estimates do not appear to represent an extravagant view of what could be made available outside OPEC, the problems involved in maintaining such overall production levels should not be underestimated. As early as the end of the present decade about one-third of non-OPEC oil will have to come from fields that have yet to be discovered. Even if the resource is actually in place awaiting discovery, a continued ability and willingness to invest increasing amounts of venture capital can not be taken for granted.
O.I.E.S. 25

50
40
30
20
10
0
CHART 6: Availability of Non-OPEC Oil Base case
1989 1995 2000 2005 201 0
China
USSR
Far East M.E. and Africa W. Europe
C. and S. America
N. America
O.I.E.S.
There are, however, elements which could contribute to a more optimistic picture than that presented in this lower case. Estimates for undiscovered oil may as easily be doubled as halved. Advances in technology such as 3D seismic and horizontal drilling could lead to better discovery and extraction rates. Costs may well continue to fall, resulting in development in more difficult areas and enhanced oil recovery, and some synfuel processes may become more economic. The use of NGLs could also increase much faster than expected as natural gas becomes more widely used in future. In combination with a perception of rising prices and a need for increasing energy imports, the life of production in many countries could be extended considerably. There may even be some surprises in conventional areas.
Our further analysis of the major areas, assuming this kind of climate and making bolder assumptions on the size of undiscovered reserves and rate of development, indicates that a level of around 27 to 28 mboe/d could be maintained through to the end of the century. The early years of the next century will see the start of a slow decline but production should still be above 20 mboe/d in 2010 (see Chart 7).
Much of the increased level of production in the higher case will come from higher discovery and extraction rates and the opening up of frontier areas in North America. Additional tar sands projects in Canada, the revitalization of Mexican production and the development of small and difficult fields in the North Sea will help to increase supply as will the discovery and development of reserves in a number of new areas, particularly in Africa. Additional details are shown in Appendix lb.
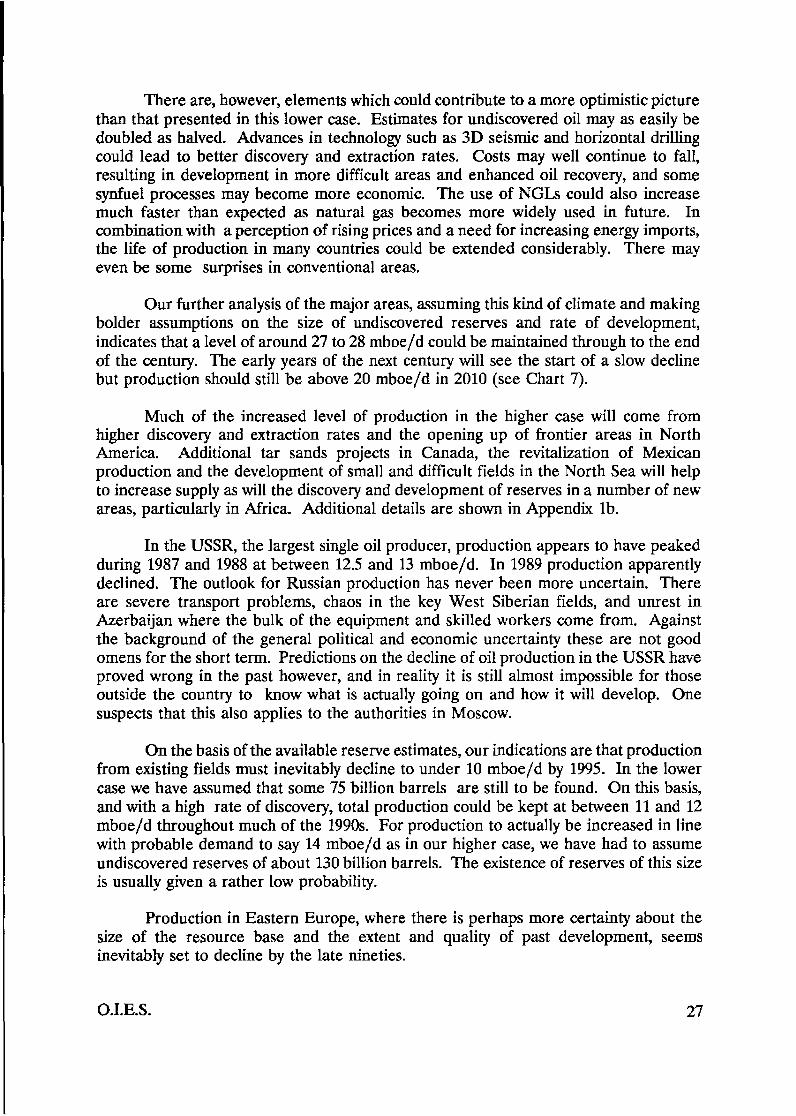
In the USSR, the largest single oil producer, production appears to have peaked during 1987 and 1988 at between 12.5 and 13 mboe/d. In 1989 production apparently declined. The outlook for Russian production has never been more uncertain. There are severe transport problems, chaos in the key West Siberian fields, and unrest in Azerbaijan where the bulk of the equipment and skilled workers come from. Against the background of the general political and economic uncertainty these are not good omens for the short term. Predictions on the decline of oil production in the USSR have proved wrong in the past however, and in reaIity it is still almost impossible for those outside the country to know what is actually going on and how it will develop. One suspects that this also applies to the authorities in Moscow.
On the basis of the available reserve estimates, our indications are that production from existing fields must inevitably decline to under 10 mboe/d by 1995. In the lower case we have assumed that some 75 billion barreIs are still to be found. On this basis, and with a high rate of discovery, total production could be kept at between 11 and 12 mboe/d throughout much of the 1990s. For production to actually be increased in line with probable demand to say 14 mboe/d as in our higher case, we have had to assume undiscovered reserves of about 130 billion barrels. The existence of reserves of this size is usually given a rather low probability.
Production in Eastern Europe, where there is perhaps more certainty about the size of the resource base and the extent and quality of past development, seem inevitably set to decline by the late nineties.
0.LE.S. 27

50
40
30
2c
10
0
CHART 7: Availability of Non-OPEC Oil High case
China
T T -r
1989 1995 2000 2005 2010
USSR
Far East M.E. and Africa
W. Europe
C. and S. America
N. America
O.I.E.S.

As with the USSR, China is also a net exporter of oil and the size of its resource base is highly uncertain. Nevertheless, China does seem to be at an early stage in the development of its potential. Although offshore exploration has proved disappointing in the past, a broader effort may yield greater success. Additional reserves have been found through more intensive development of existing onshore fields and some new discoveries have been made. Production continued to rise throughout the 1980s as it had done in earlier decades in the face of many political and economic vissicitudes. Our estimates, based on very uncertain reserve data indicate that it would be technically feasible for production to increase to around 4 mboe/d by the turn of the century.
The bulk of the world's synfuels production - over 80 per cent - is currently concentrated in Canada, South Africa, Brazil, the USSR and the USA. Except for some Canadian tar sands, very little production anywhere from whatever source is genuinely economic at pre-crisis oil prices. The availability of low-cost conventional oil supplies continues to severely inhibit future investment in alternatives. This is a situation that seem unlikely to change until well towards the late 1990s, if ever. There will probably be a modest expansion of synfuel plants, particularly gas conversion to liquids, on grounds of local expediency or security even if prices stay at present levels. Additional development of tar sands also seems likely. However, unless prices are perceived as moving to at least a sustained $30 per barrel or there is a dramatic technological breakthrough, any future contribution from synfuels will remain very modest. Only a little over 1 mboe/d of synfuels is expected in the lower case.
The potential future production IeveIs of individual OPEC members can be many and vaned in relation to future patterns of oil suppIy and demand, of prices and of overall political and economic acceptability. When OPEC was collectively producing around 25 to 30 mb/d there seems to have been littIe real understanding of the true Ievel of production that could be maintained by the existing or any easily installed infrastructure. However, capacity to produce was said at the time to be well over 10 mb/d more than the actual production level. The ability to rapidly produce substantial increments of oil after some years of low production and the ravages of the Iran/Iraq war must be open to question. This ability is being tested now and may face even more severe tests before long. An indication of the current level of effective capacity is given in Table 3, together with an estimate of the capacity that could reasonably be put in place by the end of the decade.
The actual future level of OPEC production capacity will depend on the ability and wiIlingness of individual OPEC members to make the necessary investment. Disregarding all other aspects and solely on the basis of the size of the resource base, it seems feasible for OPEC as presently constituted eventually to be producing between 45 and 50 rnboe/d well into the next century if it so desired. Nearly 80 per cent of this production would be concentrated in the Gulf. Almost any reasonable level of increase in global oil demand assumed for the next twenty years or more could technically be met by OPEC producers relatively easily - and even by the Gulf States alone - despite declining production elsewhere.
O.I.E.S. 29
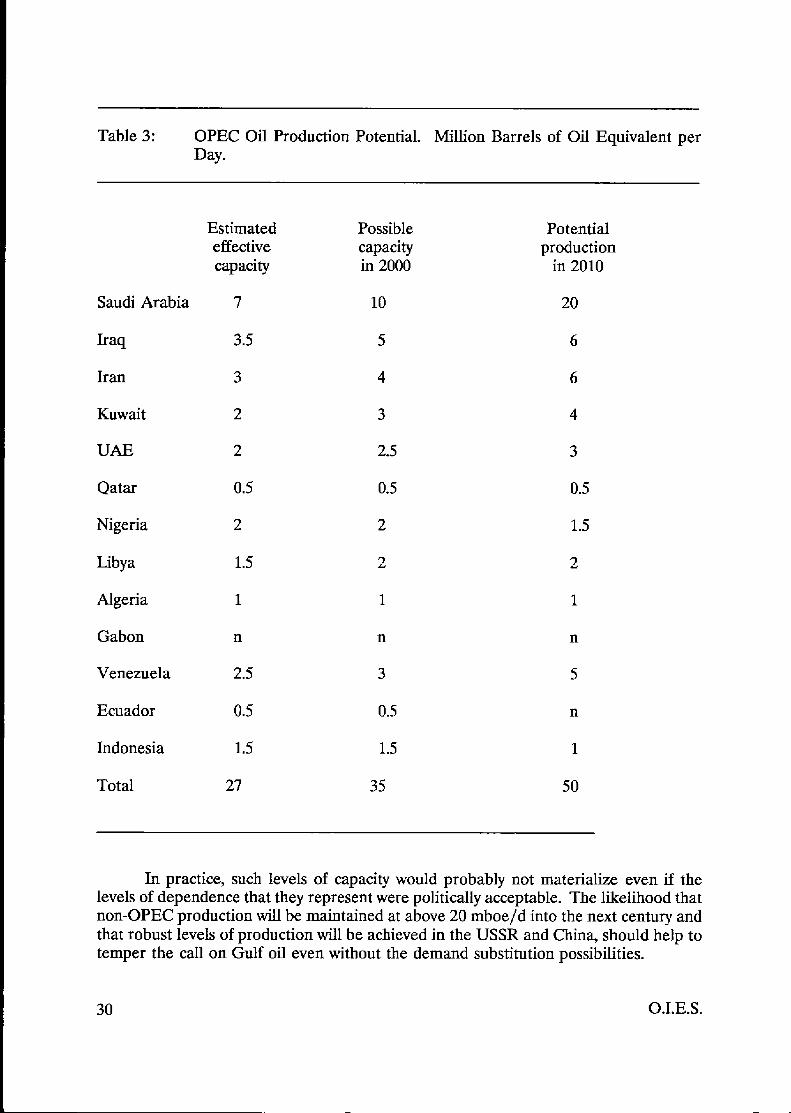
Table 3: OPEC Oil Production Potential. Million Barrels of Oil Equivalent per Day.
Saudi Arabia
Iraq
Iran
Kuwait
UAE
Qatar
Nigeria
Libya
AIgeria
Gabon
Venezuela
Ecuador
Indonesia
Total
Estimated effective capacity
7
3.5
3
2
2
0.5
2
1.5
1
n
2.5
0.5
1.5
27
Po s s i b 1 e capacity in 2000
10
5
4
3
2.5
0.5
2
2
1
n
3
0.5
1.5
35
Potential production
in 2010
20
6
6
4
3
0.5
1.5
2
1
n
5
n
1
50
In practice, such levels of capacity would probably not materialize even if the levels of dependence that they represent were politically acceptable. The likelihood that non-OPEC production will be maintained at above 20 mboe/d into the next century and that robust levels of production will be achieved in the USSR and China, should help to temper the caII on Gulf oil even without the demand substitution possibilities.
30 O.I.E.S.
3 COAL: LOW-COST ABUNDANCE, STILL WAITING IN THE WINGS?
3.1 Introduction
Despite the rapid increase in the use of oil for transport, coal continued to supply over 70 per cent of the world's primary energy needs throughout most of the 1920s and 1930s. Well into the fifties it was the essential ingredient for industrial growth and the main source of fuel for space heating in developed countries.
The actual tonnage of coal produced continued to increase modestly during the 1960s but at a rate well below that of other major fuels. As a result, its share of total world demand for commercial fuels is now around 28 per cent compared with 59 per cent in 1950. The impact of higher oil prices in the seventies led to coal production increasing in line with other fuels and its contribution to global energy supplies remained fairly stable throughout the 1980s.
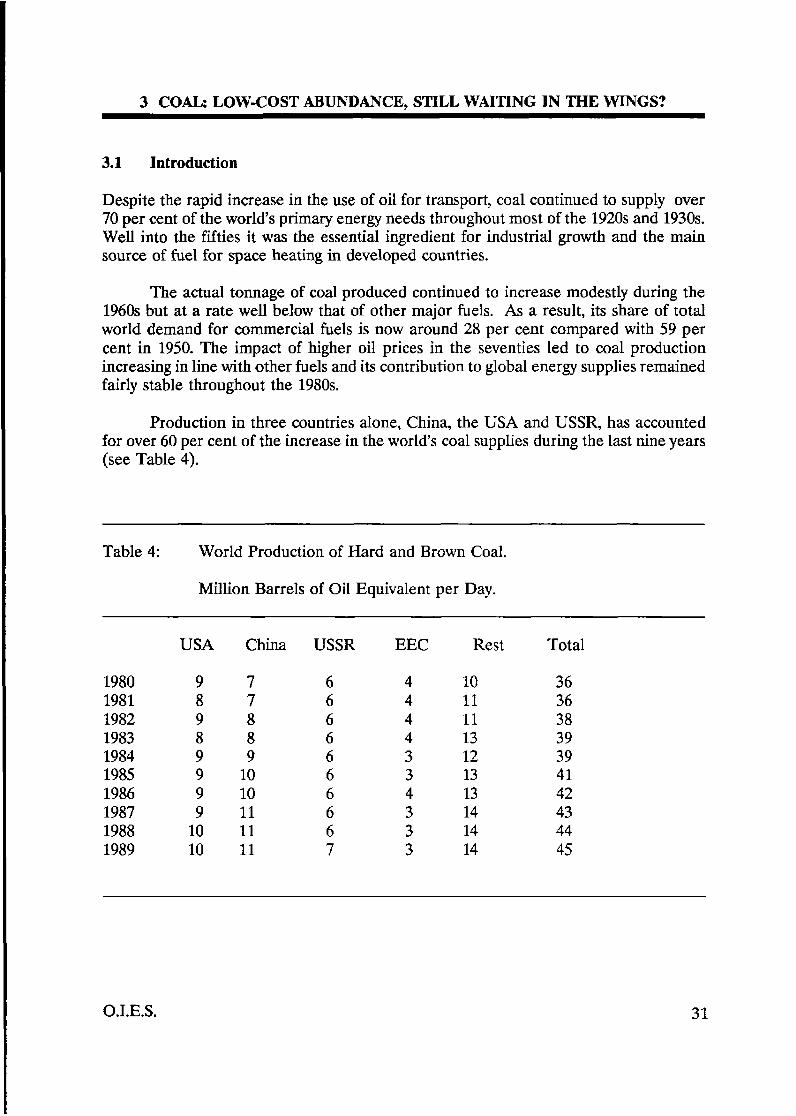
Production in three countries alone, China, the USA and USSR, has accounted for over 60 per cent of the increase in the world's coal suppIies during the last nine years (see Table 4).
Table 4: World Production of Hard and Brown Coal.
Million Barrels of Oil Equivalent per Day.
1980 1981 1982 1983 1984 1985 1986 1987 1988 1989
USA
9 8 9
9 9 9 9
10 10
a
China
7 7 8 8 9
10 10 11 11 11
USSR
6 6 6 6 6 6 6 6 6 7
EEC Rest
4 10 4 11 4 11 4 13 3 12 3 13 4 13 3 14 3 14 3 14
Total
36 36 38 39 39 41 42 43 44 45
O.I.E.S. 31
The rest of the increase was largely from new capacity in the major exporting countries, South Africa and Australia, as well as in India. Production in the high-cost producing countries of Western Europe and Japan, on the other hand, continued to decline.
The many forecasts made in the mid-1970s envisaging a massive revival of coal use and widespread conversion to synthetic fuels have not been fulfilled and some now seem absurdly optimistic. None the less, the reality has been a 50 per cent increase in world production from the level of the early 1970s to the current level of around 3.3 bt of hard coal. Less than 14 mt are used to produce synfuels, almost entirely in South Africa.
Lignite or brown coal is less widely exploited than hard coal but there is substantial availability in a number of countries and production has grown in recent years, particuIarly in West and East Germany. Brown coal has a very high weight to energy ratio and is usually used very dose to the mine in power plants. Some is also made into briquettes and used for domestic heating or in industry, but it scarcely enters into international trade. There is a growing awareness of and unwillingness to accept the severe environmental damage and specific health dangers of brown coal, particularly now in Eastern Europe. This seems likely to result in a reluctance to make new investments and a run down of some capacity, despite the advantage of low cost.
Hard coal is also expensive to transport; freight and handhg for US coal exported to North-West Europe, for example, can represent 30 to 40 per cent of delivered costs. As a result, only some 11 per cent enters into international trade and the biggest producers are also the biggest consumers of coal.
3.2 Current Developments
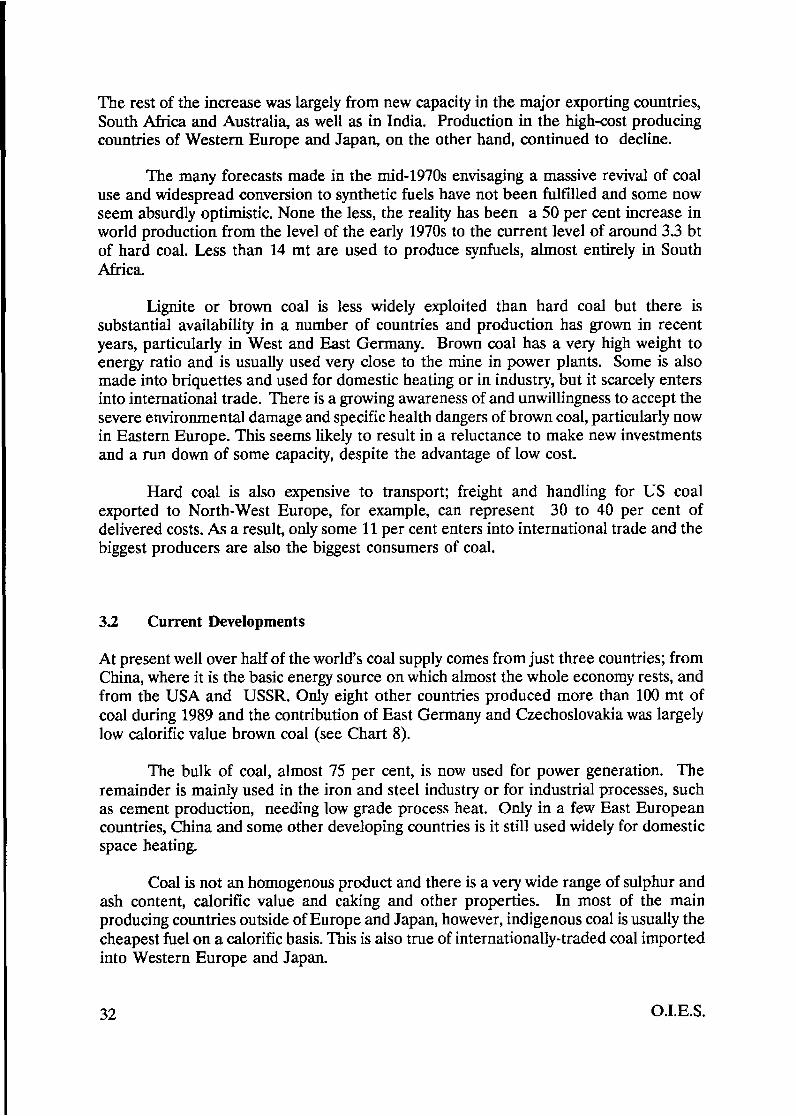
At present well over half of the world’s coal supply comes from just three countries; from China, where it is the basic energy source on which almost the whole economy rests, and from the USA and USSR. Only eight other countries produced more than 100 mt of coal during 1989 and the contribution of East Germany and Czechoslovakia was largely low calorific vaIue brown coal (see Chart 8).
The bulk of coal, almost 75 per cent, is now used for power generation. The remainder is mainly used in the iron and steel industry or for industrial processes, such as cement production, needing low grade process heat. Only in a few East European countries, China and some other developing countries is it still used widely for domestic space heating.
Coal is not an homogenous product and there is a very wide range of sulphur and ash content, calorific value and caking and other properties. In most of the main producing countries outside of Europe and Japan, however, indigenous coal is usually the cheapest fuel on a calorific basis. This is also true of internationally-traded coal imported into Western Europe and Japan.
32 O.I.E.S.
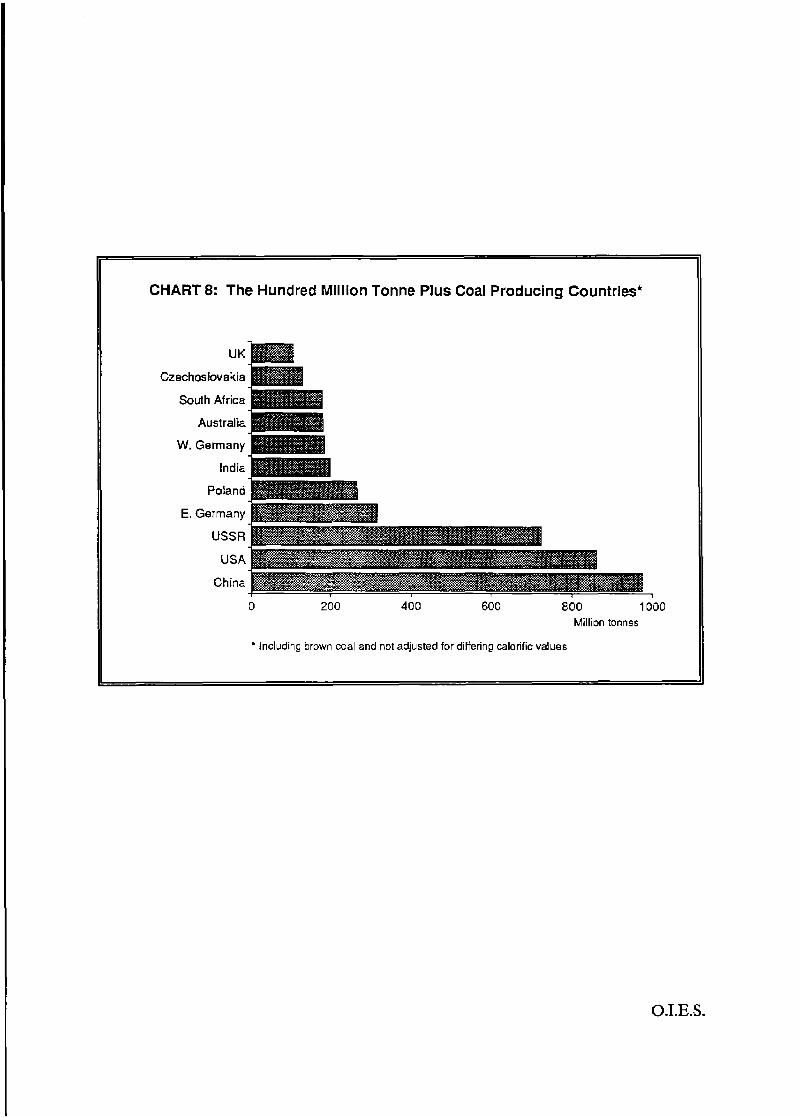
CHART 8: The Hundred Million Tonne Plus Coal Producing Countries'
UK Czechoslovakia
South Africa
Australia
W. Germany
India
Poland
E. Germany
USSR
USA
China
0 200 400 600 BOO 1000 Million tonnes
* hcluding brown mal and not adjusted for dilfering calorific values
O.T.E.S.

Prices for steam coal are related to those of the main competitor, fuel oil, but because of surplus capacity they have often tended in practice to be determined largely by coal-to-coal competition. Production in the high-cost European areas such as France, West Germany, Spain and the UK as well as in Japan, has become increasingly difficult to maintain against competition from lower-cost imported coal. Subsidies given to European and other producers on security and social grounds are substantial. The IEA estimated, for example, that the total subsidy for Belgian coal in 1987, was $96 per tonne. This is a burden that governments and the EEC are becoming much less willing to accept, particularly with the ready and widespread availability of cheaper supplies and the changed economic climate.
Environmental pressures are another actual and potential restriction on future production, particularly affecting coal with a high sulphur content from mines in Spain and the UK. The control of acid rain and particulate emissions could possibly be met using known technology at costs that could still keep cod competitive. Fears of global warming, however, may have a more significant long-term impact on coal use and trade. Any such impact will be felt mainly in the OECD countries. China, and probably also India and the USSR, have little real alternative but to continue to rely heavily on coal to support economic growth.
The decline of coal production in the established and traditional high-cost countries is almost inevitable, even without environmental, labour and other problems. Deep-mined bard coal capacity will continue to be closed down in France, West Germany, Japan, Belgium and the UK. In the UK, some of the closures will be partially offset by the opening up of large-scale lower-cost pits. In West Germany, the extension of the guaranteed price and market for 50 mt of hard coal per annum seems likely to be abolished in the face of pressure from the EEC.
A future revival of production in the traditional coal regions of Western Europe is highly unlikely unless there should be a very significant technological breakthrough in, for example, in situ gasification. In Poland, difficult geological conditions and a depleting resource base combined with a low level of investment will erode production capacity in the 1990s. Amongst the developing countries, India, China and Colombia are currently the most significant producers. As a response to the price rises of the 1970s, a flurry of projects was planned in a number of developing countries in the 1970s and 1980s. However, few have seen any real progress and much of the impetus appears to have been lost in the face of lower oil prices and a growing preference for gas.
International trade in coal currently stands at around 390 mt of which just over half is steam mal. Before the Second World War, trade was dominated by the UK, Germany and the USA. Now, Australia is the largest single exporter of both metallurgical and steam coal followed by the USA and South Africa. Although Poland is currently a major exporter of steam coal, the difficult production conditions and rising domestic demand make it unlikely that this can continue after the mid-1990s.
China has expressed the intention of becoming a major exporter to the Pacific Rim countries, partly with the help of outside investment and expertise. Exports have
34 0. I. E. S.

increased but there have been setbacks in recent years and progress in developing new areas has been slow. Production costs in some Chinese mining regions are high and quality is generally very uncertain. The lack of an adequate transport infrastructure and system of quality control, together with a rising domestic demand, will continue to prove a major handicap over the medium term at least. In the long term, there are extremely ambitious and technically difficult plans to treble production by the year 2020.
New export sources in Venezuela, Colombia and Indonesia, for example, are said to be able to deliver coal to the main importing regions at an equivalent cost of around $10 per boe, with substantial potential for expansion.
Coal is mainly contracted, often from dedicated production capacity, to power plants and large industrial users under long-term agreements with relatively stable prices. However,the short- to medium-term balance of supply and demand, and with it price, fluctuates considerably. This is often the result of logistical or labour problems as well as the opening up or closing down of export capacity. Labour problems, in countries such as Australia, the USA and USSR, tend to be a fact of life in this most labour- intensive of the energy industries. The transport of coal is also subject to intermittent physical restraints, such as iced up or depleted waterways, or railway problems that do not usually affect other energy sources. Shortages and surphes often persist for a few years, mainly because the industry tends to operate on the classic ‘hog cycle’. Producers with heavy sunk costs do not respond quickly to reduced prices and continue to produce as long as their operating costs are covered. For example, the El Cerrejon mines in Colombia, now putting increasing tonnages on to the international market, were planned at a time when international oil prices were much higher than at present and were expected to continue rising.
The balance has swung from shortage in the early 1980s to surplus in the mid- 1980s and then to the present fairly tight situation for good quality coal. However, the coa1 export industry still has considerable short-term flexibility, despite rationalization in Australia and elsewhere during the last couple of years.
In the USA, exports are largely marginal, representing only 10 per cent of the country’s total production. Mines are quicldy brought back into operation and production increased when exports seem likely to earn more than the local market. Although generally a high-cost supplier, the USA can readily act as swing producer to the international market because of its ability to supply large quantities of coal at short notice. This could represent at least an additional 100 to 200 mt, or 1 to 2 mboe/d. Most of the world’s main ports currently have substantial spare capacity for exporting coal, perhaps as much as 300 mt, say around 4 mboe/d during the early 1990s.
Quality requirements for coal are becoming more severe and this probIem will increase in the short to medium term as environmental regulations are made more and more stringent. Only a few years are needed to bring new mines in to production, however, with investment costs lower than most of the alternatives. Thus, in the longer term, with a broad and very substantial resource base to draw on, coal can always be made available as circumstances require.
O.I.E.S. 35

3.3 Future Availability
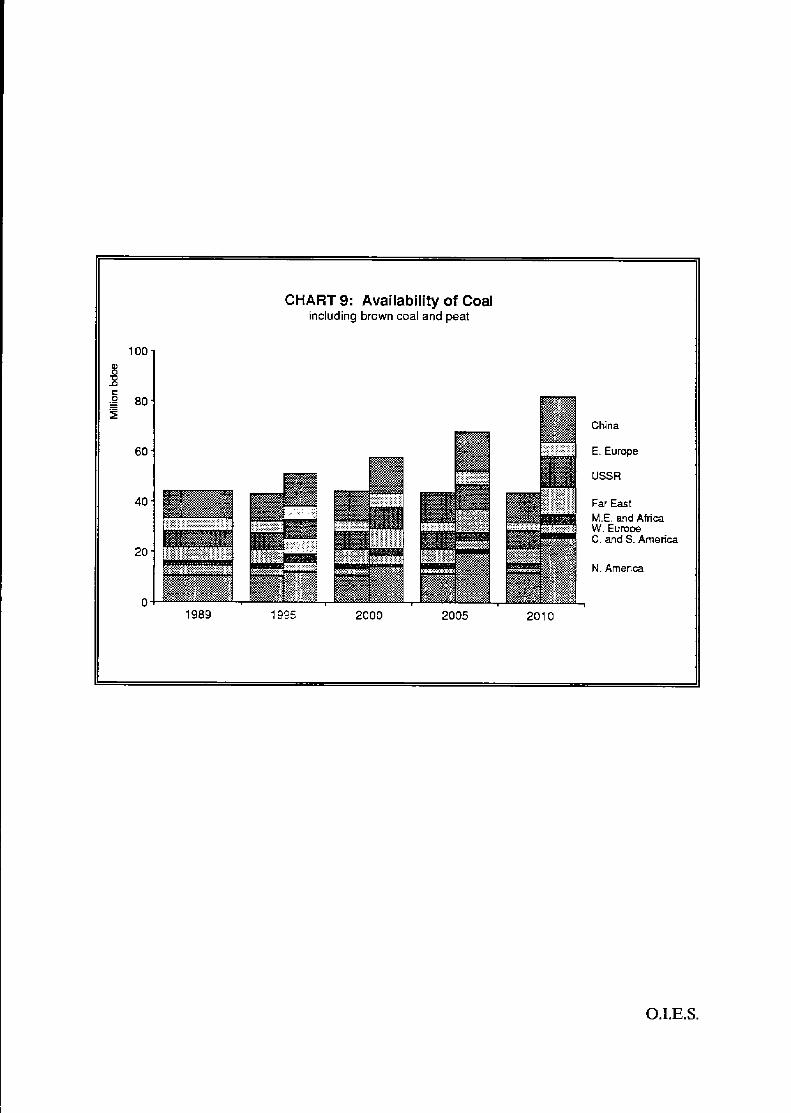
The range of potential availability over the very long term is enormous, greater than that of any other conventional energy source. For the rest of the nineties, and into the early years of the next century, the realities of capacity in place and under construction, national policies, the availability of capital, interfuel competition and environmental constraints, enable the range to be narrowed down. The range of availability shown in Chart 9 is based on a detailed country-by-country assessment of known plans and potential. These are, of course, only a very broad indication of what could be made available given the decision to invest at the appropriate time. The past mismatch of investment decisions and the actual level of need at the time the resultant projects mature seems likely to continue.
The breadth of the range by the year 2010 represents almost as much as the entire production of the world at present. More details on individual regions and countries are given in Appendix IC.
The lower case reflects a number of influences:
Reaction against coal production and use in a number of countries, particularly in the OECD, on environmental grounds.
Labour problems in underground mines and a growing realization that coal mining is a very hazardous and eventually unacceptable occupation.
Increased gas penetration and competition from Orimulsion and Tar Sands.
- Reluctance to subsidize high-cost production in Western Europe.
- Low oil prices, say a long-term perception of $15 per barrel.
- Developing country energy investment channelled away from coal.
Much of the planned investment will be postponed indefinitely and continued ‘rationalization’ of existing facilities is likely to occur. There will be little increase in new capacity in developing countries. European coal, with the exception of some brown coal and some UK hard coal fields, will be allowed to run down but investment in maintaining and replacing capacity elsewhere wiIl be maintained. As a result, the availability of solid fuels will be lower in the first decade of the next century than at present.
The higher supply case reflects several assumptions:
- A future perception of an oil price of at least $25 per barrel, leading to substantially increased new investment in the late 1990s.
36 O.1.E.S.
100 8 x 2 - 80 i C
60
40
20
0
CHART 9: Availability of Coal Including brown coal and peat
W. Eumw C. and S. America
N. America
E. Europe
USSR
Far East M.E. aid Africa
1989 2000 2005 201 0
O.I.E.S.

- The development of low-cost technology to control emissions satisfactorily.
A diminution of the perceived threat from global warming.
Continued but low level of support for European coal.
The feasibility of substantial increases in Western US surface mines.
-
-
-
India, Brazil and other developing countries modernizing their coal industries and expanding production.
Substantial new investment in facilities by the new, as well as the traditional, exporting countries.
- No revival of nuclear power.
Substantial outside investment in the infras.-ucture in China and the USSR - in the late 1990s.
On these assumptions, production capacity increases substantially in all the existing coal-producing regions except Western Europe. The opening up of new facilities in those developing countries with high quality deposits, will make additional tonnages available for international trade. However, the USA will remain the main swing producer.
There are always likely to be short-term shortages of high quality coal at both ends of the range as well as cyclical fluctuations overall. However, in general, the main message is one of a modest short-term surplus with the potential to make available additional tonnage equivalent to 40 mboe/d of low-cost fuel, perhaps within twenty years.
Environmental considerations, perceptions of the long- term security of other preferred fuels and, especially, the overal rate of growth in electricity demand will be the main constraints on realizing this potential.
O.I.E.S.
4 NATURAL GAS A LATE DEVELOPER
4.1 Introduction
As seen in Chapter I, gas reserves are abundant and, overall, probably represent a larger potential source of energy than oil. The development of these reserves has, however, been much slower than oil, largely because of the problems associated with the fundamental characteristics of natural gas. Its low energy intensity makes it more costly and less flexible to transport than oil and it usually needs a substantial base load of demand to make development economic. As a result, over 85 per cent of natural gas is consumed in its country of origin. Another problem, which has always faced the industry is the extent to which governments have played an intrusive and often rigid role. Attempts to treat gas as a scarce and premium fuel, which still linger in some countries, have inhibited its wider development.
Attitudes have changed in recent years and gas is now more commonly regarded as an underutilized source of relatively low-cost energy to be used in a wide range of markets. It is also being increasingly seen as an environmentally sound fuel.
Development in many areas has tended to be constrained by the high capital cost of most supply projects, their relative inflexibility and the lengthy process of development usually involved. Where projects involve international movement and linkage of supply in one country to markets in another then these problems are exacerbated. The nature of the gas industry is such that, perhaps more than any other major source of energy, it is dependent on the socio-economic environment and its perceived stability rather than on resource availability or technological constraints. In a world of perennial uncertainty about energy price and demand the inhibitions on gas development still remain strong.
4 2 Current Developments
In the years just prior to the Second World War, when most gas being used was derived from coal, natural gas supplied some 6 per cent of the world‘s energy needs. By 1960, this proportion had grown to nearly 13 per cent and by 1970 to 18 per cent. In 1960, only 75 per cent of gas produced was being used commercially, the rest was flared or reinjected. By the mid-eighties, commercial use took more than 85 per cent of production but little further improvement appears to have been achieved in recent years.
During the years that followed the first and second ‘oil price shocks’, world production of natural gas levelled off. There were, however, no really sharp drops in production of the kind experienced by oil. In between the ‘price shocks’ and subsequently, steady growth has continued and gas now supplies some 20 per cent of the world’s energy needs.
This somewhat unspectacular growth masks some significant changes in the relative structure of supply and demand. In 1970, the USA was the single largest
O.I.E.S. 39
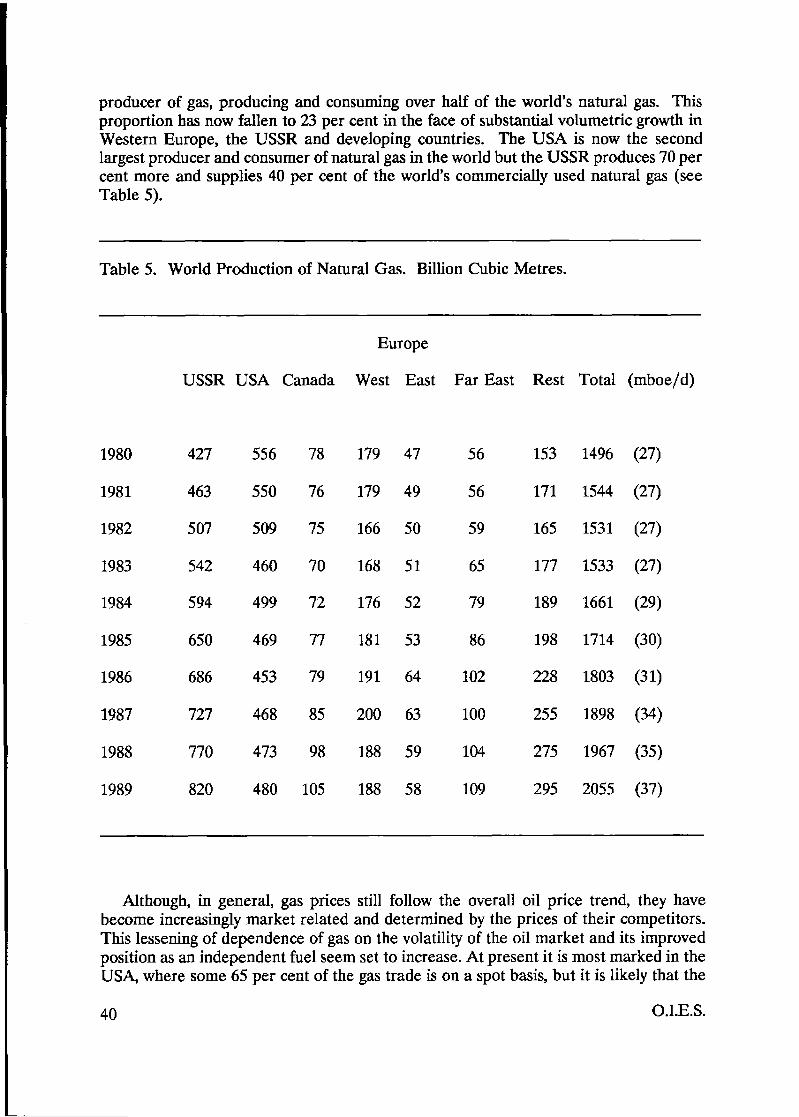
producer of gas, producing and consuming over half of the world's natural gas. This proportion has now fallen to 23 per cent in the face of substantial volumetric growth in Western Europe, the USSR and developing countries. The USA is now the second largest producer and consumer of natural gas in the world but the USSR produces 70 per cent more and supplies 40 per cent of the world's commercially used natural gas (see Table 5).
Table 5. World Production of Natural Gas. Billion Cubic Metres.
1980
1981
1982
1983
1984
1985
1986
1987
1988
1989
USSR USA Canada
427 556
463 550
507 509
542 460
594 499
650 469
686 453
727 $68
770 473
820 480
78
76
75
70
72
77
79
85
98
105
Europe
West East Far East Rest Total (mboeld)
179 47
179 49
166 50
168 51
176 52
181 53
191 64
200 63
188 59
188 58
56
56
59
65
79
86
102
100
104
109
153 1496 (27)
171 1544 (27)
165 1531 (27)
177 1533 (27)
189 1661 (29)
198 1714 (30)
228 1803 (31)
255 1898 (34)
275 1967 (35)
295 2055 (37)
Although, in general, gas prices still follow the overall oil price trend, they have become increasingly market related arid determined by the prices of their competitors. This lessening of dependence of gas on the volatility of the oil market and its improved position as an independent fuel seem set to increase. At present it is most marked in the USA, where some 65 per cent of the gas trade is on a spot basis, but it is likely that the
O.I.E.S. 40
tendency will spread, particularly when the European gas market opens up.
Technical costs of production are usually only a little above those of oil and perhaps 50 per cent of gas reserves could be produced at under $10 per boe. However, it is the gathering of the gas and its transport to the market place that cause the competitive difficulties. The North West Shelf liquefied gas project, for example, has cost some Aus$12 billion and represents the largest single investment ever undertaken in Australia. This corresponds to an investment of some US$30,000 per boe/d of capacity. A new North Sea project wouId now cost around US$ZO,OOO per boe/d. Since this kind of financial burden is too large and the risks too great for a single investor, joint ventures are normally involved. The financial and technical negotiations with government and partners, particularly over major gas export schemes, have often been extremely lengthy in the past. This may change, however, as more projects are completed successfully.
In terms of gas supplied, supplies from most potential LNG schemes will cost between $15 and $30 per boe. Thus the commercial viability of a number of proposed projects was rather uncertain at pre-crisis oil prices.
As Table 5 shows, the USSR and USA dominate worId gas production although some of the fastest growth in recent years has taken place in South East Asia.
In the USA, production capacity still exceeds demand although the much discussed ‘gas bubble’ may have almost disappeared. US production in the Lower 48 states is probably already on a ‘rocky plateau’, although still strongly affected by short- term price fluctuations. Opinions in the USA differ as to whether or not production is already in decIine. Much, of course, depends on the commercial or political stance of those expressing such opinions and consistency has not been their strong point in the past. Future prices will clearly have a bearing on this but, on the basis of known reserves, it seem probable that decline will set in during the mid-1990s. Alaskan reserves have the potential to compensate for this decline, although they are uneconomic for delivery by pipeline to the Lower 48 states at current prices and seem unlikeIy to be tapped for US consumption at least before the turn of the century. Canadian exports could be increased substantially through the present pipeline system and the Free Trade Act should encourage the installation of additional capacity. However, if gas in the frontier areas of the country is not developed, faster depletion of conventional onshore fields could inhibit the long-term supply of gas to the USA There is the possibility of low-cost gas supplies from Mexico. To produce LNG from other potential sources such as Venezuela, Nigeria, South East Asia or Alaska prices of at least $20 per boe would probably be required.
Gas production in Western Europe has only recently regained the record level set in 1979. It is likely that production will remain roughly at current levels throughout the 1990s unless the pull from demand becomes much stronger. Within this overall medium-term stability, onshore production in West Germany, the Netherlands and elsewhere will continue to decline. However, North Sea production from the UK, Denmark, the Netherlands and particularly Norway will counter this trend and make an increasing contribution to supply potential.
O.I.E.S. 41
Actual gas needs in the Western Europe market appear to be adequately covered until the mid-1990s with planned production and the expansion and extension of existing contracted exports. There is spare capacity still available in the USSR export pipelines and prices of Russian gas seem likely to remain competitive with other sources. Additional exports of gas for hard currency will become increasingly necessary to the USSR as restructuring of its economy develops. On the other hand, the opening up of Eastern Europe and the need to substitute for lignite and nuclear power may well lead to an increased indirect call on North Sea production as well as on supplies from outside Europe.
Deregulation of the gas supply system under the 1992 Single Market Act should help improve the overall supply position in Europe by encouraging more spot sales and gas swap deals and giving increased flexibility. In terms of actual consumption, very much hinges on demand and how that develops, but the overall supply potential seems adequate to cover most assumptions on the likely development of demand well into the next century. If additiona1 supplies are made available from the UK, Norway or Algeria they wouId seem likely to be at $15 per boe ($2.5 per mBtu) or more. LNG from further afield would require a price of at Ieast $20 per boe ($3.5 per mBtu).
Japan, the third major gas importing region, has scarcely any natural gas of its own. It too seems to be covered by existing contracts throughout the 1990s, particularly with the advent of the NW Shelf and substantial additional potential in Malaysia and Indonesia as well as in Australia. The present South East Asian suppliers of gas to Japan appear to have enough capacity in hand to cater for any likely increases in demand over the next ten years or so at IOW enough costs to discourage other potential suppliers. In terms of growth in reserves, production and trade, the South East Asian countries, particularly Indonesia, Malaysia and Brunei, will continue to be one of the most dynamic gas-producing areas in the world.
In the past, gas development in South East Asia has been based mainly on the build-up of the export trade. A shift to developing gas for domestic use, as in the Malaysian Peninsular gas network, is gaining momentum but still very slowly. This is partly due to the high cost of the infrastructure, the lack of concentrated demand and in some cases the effects of misguided pricing and taxation policies. The advent of an international gas network in the ASEAN countries will greatly stimulate production and encourage the more efficient use of resources. Potential production in the region seem likely to be more than adequate €or expected domestic needs into the next century even with rising demand from Japan, Taiwan, Korea, Singapore and other importers of the region.
Pakistan has the most developed gas system of any developing country, but is becoming seriously short of indigenous gas and has a substantial measure of suppressed demand. Production could be boosted, but is unlikely to prove adequate to meet the increasing demand. Imports from outside the Indian subcontinent may well be necessary. In India, gas currently plays a much smaller role. Production, and with it demand, will be stimdated by expansion of the gas grid - particularly from the Bombay High field.
42 O.I.E.S.

43
In South America, development has been slow despite substantial and extensive gas reserves. Again, it is partly a question of the high initial capital involved but the strongly nationalistic attitude towards outside help has not always helped. The shrinking of international oil markets has also affected the production of associated gas in Mexico and Venezuela. However, discoveries are increasing, cross border trade is growing and some gas markets are reaching maturity. Thus, given a suitable economic and political cIimate the expansion of production capacity over the next twenty years could be rapid.
Algeria, with its proximity to European markets, spare export capacity and realistic policies, is likely to maintain its dominant position amongst the producers in Africa Libya and Nigeria also have considerable potential as exporters as well as expanding domestic use. Progress is proving very slow in the development of associated gas in Nigeria although the LNG project does finaIIy seem to be getting off the ground.
Although the Middle East is second only to the USSR in the size of its reserve base, it accounts for only 5 per cent of world production. Production actually consumed commercially, as opposed to being flared or reinjected, has increased substantially in recent years despite cuts in the associated crude oil production. The major producers of associated gas are likely to continue to emphasize the development of programmes for the intensified recovery of this gas and for domestic marketing. The Gulf states generally seem set to make gas their main source of domestic energy.
In relation to the enormous resource base in the Middle East, the development, particularly of non-associated gas, is still in its infancy. Certainly for the next twenty years the growth of markets seems likely to remain well below potential production capacity.
Nearly 40 per cent of the world's natural gas reserves are in the USSR and growth in production has been very impressive. It has more than doubled over the last ten years despite formidable difficulties, and official targets have been regularly exceeded. Even so, a production plateau wiII probabIy not be reached until the next century. This could well be at a level twice that of current production. In Western Siberia there is still considerable potential in the existing giant and highly productive fields. In the long term, more difficult areas in Eastern Siberia and Central Asia will have to be tapped to increase overall production and offset decline elsewhere. Much hinges on the USSR's ability to continue to invest and improve technology in a very fluid economic and political situation.
In Eastern Europe, nearly two-thirds of production is concentrated in Romania. However, reserves are virtually exhausted and with only very modest potential elsewhere in Eastern Europe, overall production is set for a continuing decline.
The size of existing reserves and the potential resource base in China imply that much greater use of gas will be made in future. Until recently gas development has been largely ignored in favour of oiI although the doubling of production within the next decade has been considered possible. Growth over the next few years seems likely to be slow and progress will depend largely on the extent to which western technology and capital can be tapped.
O.I.E.S.

43 Future Availability
The growth of world gas production over the next ten years at least will be determined far more by the climate for expanding existing markets and developing new ones than by the size of the resource base. Not until the next century will overall availability and the large Middle Eastern concentration of gas start to be of major significance.
Those countries with large gas reserves and a limited market or limited gas reserves and a large population could eventually benefit from gas liquefaction schemes such as the Shell SMDS or Texaco gasoline-from-gas processes. Generally, however, the costs of these technologies still have to come down or oil prices go up before they become economic. The development of small-scale or offshore LNG facilities and particularly the expansion of the use of gas turbines for electricity generation seem likely to have a more significant effect on stimulating demand and thus production.
In most regions and countries over the period reviewed, the development of productive capacity will be demand led. Thus, the economic health of the economies, particukdy those of the developing countries, and the competitive climate versus other fuels wil l be the paramount influences. The competitive climate for natural gas should be greatly improved by national and international policies to reduce global warming by favouring gas.
Chart 10 gives a broad indication by major regions of the potential indigenous availability of natural gas over the next twenty years. This is based on a country-by- country assessment and more individua1 detail is availabIe in Appendix Id.
The lower case reflects assumptions that:
- Oil prices remain at little more than their pre-crisis level over most of the period.
- There is no major expansion of new LNG and international pipeline facilities.
- The smaller production projects in the North Sea are not developed and the Canadian frontier areas, Alaska, Eastern Siberia, far offshore China and other ‘difficult’ areas remain largely untapped.
Investment in distribution facilities and the encouragement of gas use remain low in the developing countries.
For the higher case to be achieved one would expect that:
- Energy demand overall, particularly in developing countries, is sufficiently buoyant to encourage the development of infrastructure.
44 O.I.E.S.

70
60
50
40
30
20
10
0
CHART IO: Availability of Natural Gas
China
T
1989 1995 2000 2005 201 0
USSR
Far East
M.E. and Africa
W. Europe C. and S. America
N. America
O.I.E.S.
- International gas movements increase substantially as a result of the opening up of global trade barriers and an improvement in the economies of Eastern Europe.
Flexible trading relations and cost breakthroughs help to create a more favourable climate for the overall gas market.
- Oil prices increase in real terms to the $25-30 per barrel range by the end of the period.
- Environmental issues are in the forefront of decision making.
- There is a sharp increase in the rate of penetration of gas into developing country markets through regionally-based schemes and the financial encouragement of international lending institutions.
- Technologicd developments and rising oil prices make gas conversion to liquids economic towards the late 1990s.
Gas is regarded as 'just another commodity' and exploration and production terms and pricing policies become more favourable to new investment.
In the least optimistic case, global production capacity will increase at an annual average growth rate of around 1 per cent to reach some 43 mboe/d by 2010 (2.4 bcm). At the upper end of the range, production capacity in 2010 reaches around 66 mboe/d (3.7 bcm), representing an annual average increase of 3 per cent. Production at this level will still only have depleted little over 40 per cent of the world's conventional gas resources. Depletion rates will be much higher for the USA and, to a lesser extent, Western Europe. In the USA, and possibly North America as a whole, production will definitely be on the downward slope by the turn of the century. Indigenous production elsewhere increases at both ends of the range, but particularly in developing countries and the USSR. The proportion of world gas supplies corning from developing countries for their own use and for international trade is at present only 18 per cent. This could increase to over 30 per cent by the year 2010 in the most favourable case. The USSR's share will remain roughly the same, with those of Western Europe and North America falling.
At the end of the period the geographical location of the resource base will start to be significant when a modest reliance on the Middle East may be necessary to support demand in some importing countries.
There is aIways the possibility that gas penetration will continue to be slow in developing countries and that demand will stagnate in the OECD. However, it is perhaps more likely that the next twenty years will be the period to witness the expansion of gas use on a broad front. Thus, the higher estimates that we have indicated for the end of the period may prove too modest. The late developer will have finally grown up.
O.I.E.S. 46

5 NUCLEAR POWER THE LONG SUNSET?
5.1 Introduction
When nuclear power for commercial electricity generation was introduced some thrty- five years ago it was heralded as a technology of enormous potentid benefit to humankind. The early promises that electricity would become too cheap to meter now ring very hoIlow and it is difficult to find any trace of the old missionary enthusiasm even within the industry; nuclear power lies in the doldrums almost everywhere.
During the sixties, annual orders for new plant outside the USSR and Eastern Europe increased steadily to a peak in 1974 of 53 GW of new capacity, equivalent to 1.5 mboe/d. Thereafter orders declined, despite rising oil prices, although there was a slight and short-lived upturn after the 1979 oil price increases. During the 1980s ordering was confined to a handfu1 of countries, notabIy France and Japan and in 1989 there were no new orders placed anywhere (see Chart 11).
The incidents at Three Mile Island and Chernobyl and to a lesser extent at Windscale have tarnished the image of nuclear as a clean source of energy. Chernobyl particularly, with its widespread effect, seriously damaged public confidence internationally. Both incidents led directly to cancellations, delays and abandonment of projects. However, the rate of ordering was aIready falling before these tragedies, partly because world recession had reduced forecasts of load growth. The accidents helped to accelerate the already growing doubts on nuclear power and to put its whole future in jeopardy.
5.2 Current Developments
At present, nuclear power contributes under 6 per cent to the world’s energy supplies, representing some 9.5 mboe/d. Nuclear generating capacity in place is currently around 336 GW. OECD/IAEA estimates made in 1974 had expected that between 1032 and 1439 GW wouId be in place by 1990 in the ‘non-Communist’ world alone.
Many countries developed ambitious plans for nuclear power in line with the general euphoria and commercial pressure of the time. These have now been abandoned or reduced drastically in almost all countries. Japan, one of the last countries still with substantial growth planned, has cut back its target for the year 2000 from 90GW to 53GW. The USSR has the largest amount of nuclear capacity under construction and planned but the impact of Chernobyl, separatism and a rising green movement have led to numerous delays and cancelIations. Last year the official target for 2000 was reduced from 150GW to 100 GW but even this is unlikely to be achieved. The formerly very substantia1 nuclear programmes of the East European countries are also now in disarray.
There have been no new orders in the USA since 1978 and most developing countries have, in practice, ruled out nuclear projects for the present. France, one of the
0. I. E. S. 47
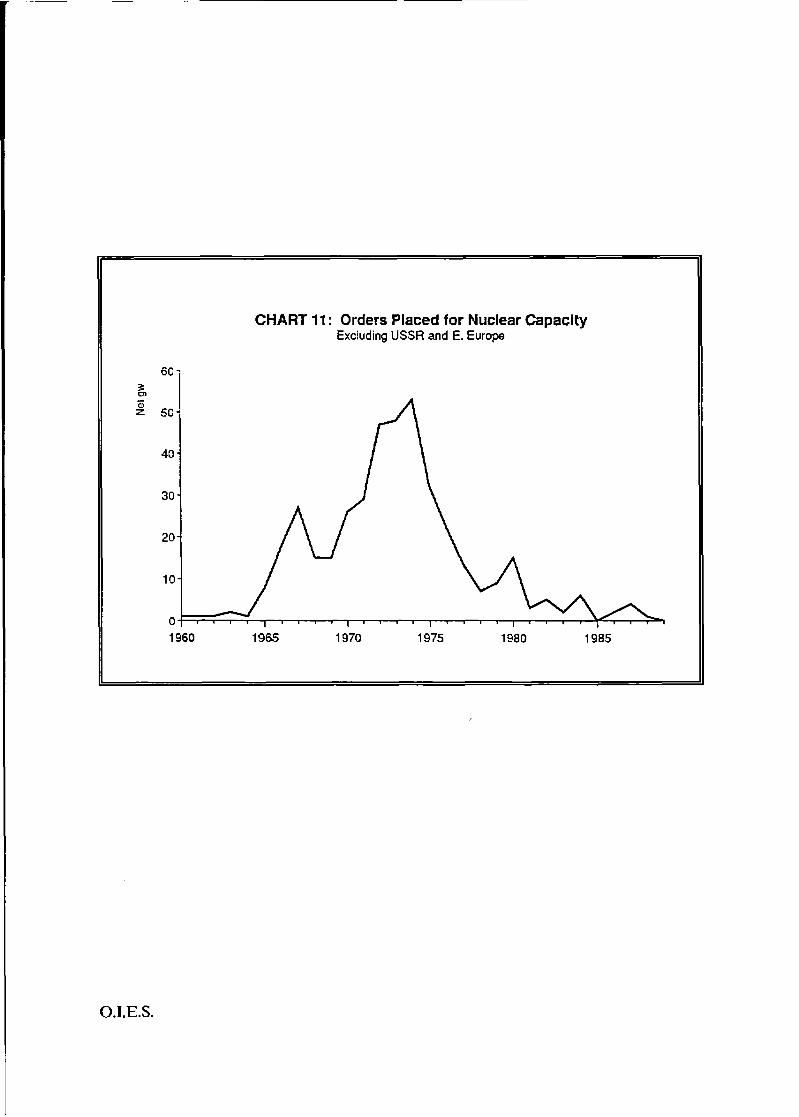
CHART 1 I : Orders Placed for Nuclear Capacity Excluding USSR and E. Europe
60 - I
50-
40 -
30 -
1960 1965 1970 1975 1980 1985
O.I.E.S.
last bastions of nuclear power, is nevertheless moving very slowly on new ordering. In many countries, power sector planning favours what are seen as less capital-intensive, more economic and practical means of generating electricity such as gas turbines.
None the less, in a number of countries nuclear power remains of major significance as a secure indigenous source of energy. In France 75 per cent of electricity is derived from nuclear, in Belgium 66 per cent and in Hungary nearly 50 per cent. In the USA, which is the largest operator of nuclear plants, 2.6 million mboe/d that would otherwise have to come from fossil fuels are provided by nuclear.
There is still some 60 GW of capacity under construction in the world, representing an additional 1.5 mboe/d of energy. Of this, perhaps only 50 GW will actually be completed. Many countries still have ambitious plans in the background and a pro-nuclear lobby determined, at the least, to maintain a public relations front. Even in countries like Sweden, that have officially abandoned their nuclear programme, possibly the general feeling is more one of waiting to see what happens over the next few years than one of complete finality.
Nuclear is increasingly perceived as a high-cost option for power generation. Capital costs, which used to be quoted at a little over $1000 per k W are now quoted as high as $5000 per kW (in comparable dollars). The enormous variation in actual costs, the lack of firm orders and genuine commercial bids, and the imposition of new safety measures make any assessment of the investment needed for nuclear power very uncertain. Operating costs have also increased markedly. In addition, although some countries like Switzerland operate their reactors at consistently high load factors, overall operational performance has been generally disappointing.
Public scrutiny, for example in the period before privatization in the UK, is also revealing the extent of hidden subsidies such as artificially low discount rates and state- funded research. However, the biggest threats to the competitiveness of nuclear power are contained in the potentially enormous but, in reality, largely unknown costs of nuclear waste disposal and eventua1 plant decommissioning.
There is also an increasing awareness of the potential, or possible, health hazards involved in the whole nuclear cycle. This is no longer confined to a few campaigners in wealthy OECD countries but has spread amongst the general public worldwide. Arrogance and an unwillingness on the part of the nuclear industry to understand the fears engendered by nuclear power have helped to aggravate the situation. The growing feeling in both East and West that there is something wrong with nuclear power, combined with high capital costs, has made the ordering of new nuclear capacity a very hazardous and unlikely option for most utiIities.
For the future, however, the picture is not altogether one of gloom. The economics of nuclear power vary enormously between countries and much depends on the availability of indigenous alternatives for base load electricity supply. In some countries nuclear may still be considered competitive with fuel oil at $12 per barrel.
The future rate of growth in electricity demand will have a major influence on
O.I.E.S. 49

whether nuclear plans are revived, particularly in the OECD countries. If electricity growth should continue at recent high levels, then the problems of meeting demand without nuclear would become accentuated. Thus, even Swedish plans to phase out all nuclear generation horn 1995 could be abandoned.
The present emphasis on the dangers of global warming has also led to some reassessment of the future role of nuclear. Both the Brundtland Commission and the UK cabinet have considered it as one of the few options available to reduce the burning of fossil fuels. The Indonesian government is said to be reconsidering nuclear as an option to meet its rapidly growing electricity needs on ‘environmental grounds’. In addition, justification for nuclear projects in a few countries still rests largely on security- of-supply imperatives or on military necessity, with economics playing a minor role.
New technology is increasingly regarded by the nuclear industry as a way out of its troubles. Some work is still continuing on the development of small-scale and fail- safe reactors by, for example General Electric and Westinghouse. While these could eventually bring about greater confidence and make nuclear power more attractive to small systems, much more work is required. Work is also continuing on modular high- temperature, gas-cooled reactors, particularly in Germany. Fast-breeder reactor research is, however, becoming increasingly difficult to justify and much fusion work is now continued only for other applications.
5.3 Future Availability
Although much is known about existing capacity and what is under construction and planned, there are many uncertainties over the actual contribution likely to be made in future. Plant life is usually assumed to be twenty-five years for economic calculations but only a handful of nuclear plants have actually achieved even twenty years of operation. On the other hand in some countries, the USA and UK in particular, the possibility of extending operating life to forty or fifty years is being considered. Concerning the actual completion dates of projects or whether plans will really come to fruition, there is currently more uncertainty than ever before.
Another major uncertainty is the actual Ievel of operations. Load factors on a world basis averaged 66 per cent last year but fluctuate remarkably from country to country and sometimes within countries. In Switzerland the average is around 83 per cent, whereas in Brazil, for example, it is 30 per cent. A range of load factors of between 50 and 80 per cent on current availability would mean a variation of 4 mboe/d in world supplies of energy.
If another nuclear disaster on the scale of Chernobyl were to occur, it could conceivably prevent the construction of any more nuclear plants and lead to the abandonment of those under construction. If this were to happen, but existing plants were kept in operation until they reached the end of their accepted economic life, world nuclear capacity would fall to some 70 per cent of the present level by the year 2010. It would, however, stiIl amount to a fuel supply of 6 mboe/d.
50 O.I.E.S.
Chart 12 is based on a detailed country-by-country assessment of the likely development of nuclear power, taking into account the capacity currently under construction and planned and the decommissioning of existing plant as well as their operating characteristics. It gives a broad indication of a feasible range for the contribution that nuclear might make to world energy supplies until 2010. Detailed results are given in Appendix If.
The lower case reflects a number of assumptions:
- Increasingly poor economics reinforce a growing revulsion against nuclear power in almost aI1 countries.
- In the USA there are no new orders, some plant under construction is cancelled or converted, and decommissioning is speeded up.
- Japan completes all the plant currently under construction but new orders are solely on a replacement basis.
- Most projects under construction elsewhere are completed and run at higher load factors than in the past.
- Only in France, the USSR and China are there any substantial new orders.
- A number of European countries follow Sweden and put into practice plans to completely phase out nuclear power.
The higher case assumes that:
- Energy and electricity prices reflect the higher oil price assumption used throughout this paper.
- There are no major accidents and, with the effects of fossil-fuel burning on the environment becoming a genuine global threat, nuclear is seen as a reIativeIy safe alternative.
- Firm orders are placed in developing countries as pricing and lending policies change and smaller modules become available.
- In the USA modest ordering starts again in the late 1990s as oil and gas supplies become more expensive and imports rise steeply.
- The USSR overcomes its technical and production problems by the mid 1990s and institutes a successful programme of construction.
- East European countries, with scarcely any clean energy resources of their own, are forced back on the nuclear path in co-operation, primarily, with Germany.
O.I.E.S. 51
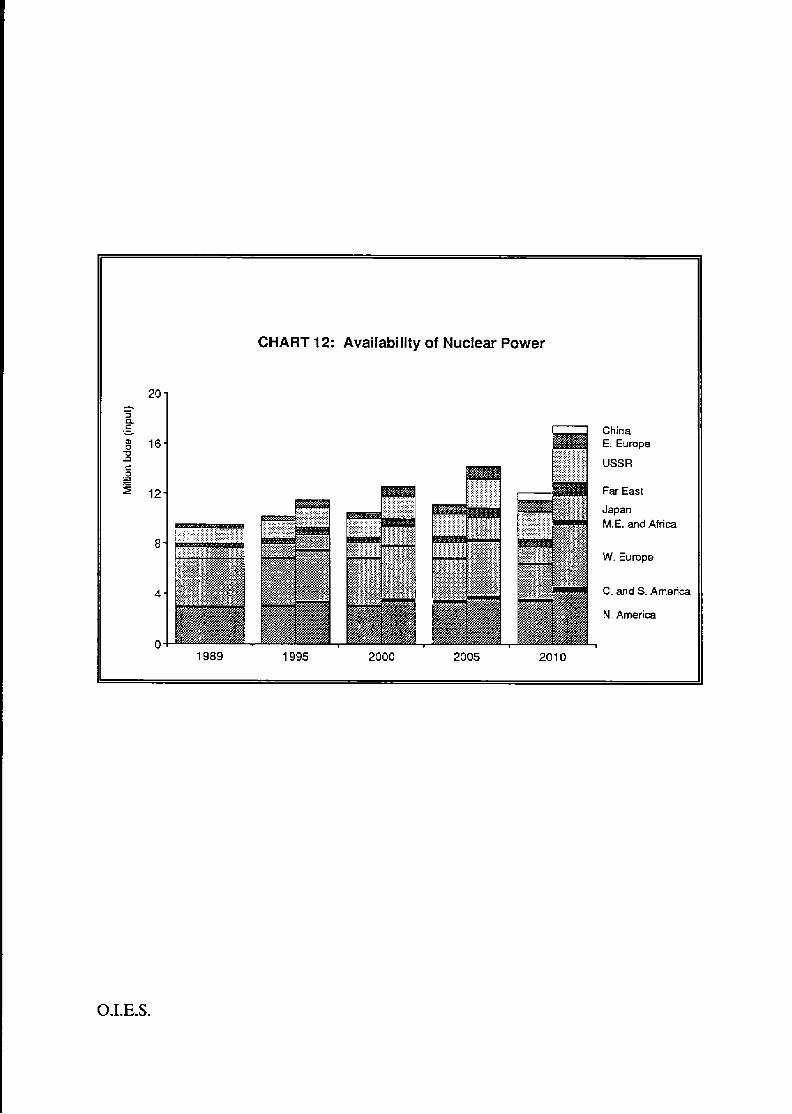
20 I 3
c n .- U
8 16 x C 0 .- - - 5 12
8
4
0
CHART 12: Availabillty of Nuclear Power
.
1989 1995 2000 2005 201 0
China E. Europe
USSR
Far East
Japan M.E. and Africa
W. Europe
C. and S. America
N. America
O.I.E.S.

- China is given substantial support by the West for its nuclear programme as a way of cutting back on coal use.
The lower case shows virtual stagnation on a global scale with only some 1 to 1.5 million mboe/d additional to the current nuclear contribution in 2010. Under the bullish conditions postulated for the higher case, an additional 8 mboe/d could be supplied by nuclear in 2010. There is at present, however, little evidence of change in attitude. The inevitabIe construction delays, if orders were to pick up within a few years, mean that the higher estimate is very close to the technically feasible maximum that could be expected.
O.I.E.S. 53

54 O.I.E.S.

6 HYDRO ELECTRICITY: STILL WATERS?
6.1 Introduction
The use of hydro-power has increased steadily since the late nineteenth century, when it was first used to generate electricity, but its contribution to world energy supplies has remained unspectacular and often unremarked. At present nearly 7 per cent of the global energy supplies is met by hydro although it generates over 20 per cent of the world's electricity. However, this conceals the far more substantial contribution of hydro in a number of individual countries. Norway, where it generates almost 100 per cent of electricity and supplies 60 per cent of primary energy needs, is a prime example.
In the 1950s and 1960s, the construction of new hydro plant took place mainly in the OECD countries and the USSR and 65 per cent of the world's hydroelectricity is generated in these two areas.
Table 6 World Production of Hydro and Geothermal Power.
Million Barrels of Oil Equivalent per Day Input.
1980
1981
1982
1983
1984
1985
1986
1987
1988
1989
North W. USSR America Europe
2.6 2.0 0.9
2.6 2.1 0.9
2.8 2.0 0.8
2.9 2.1 0.9
2.9 2.2 1 .O
2.8 2.1 1.0
2.9 2.0 1.0
2.8 2.2 1.0
2.7 2.2 1.1
3.0 2.3 1.1
Central Far East Rest Total (GW) & s.
America
1.1 1.4 0.6 8.6 (473)
1.1 1.5 0.5 8.7 (494)
1.2 1.5 0.6 8.9 (510)
1.4 1.6 0.5 9.3 (524)
1.4 1.6 0.5 9.6 (544)
1.6 1.6 0.6 9.7 (564)
1.5 1.8 0.6 9.8 (577)
1.5 1.8 0.6 9.9 (589)
1.7 1.8 0.5 10.1 (604)
1.8 1.9 0.4 10.6 (613)
O.I.E.S. 55
I
By the 1970s, investment in hydro projects in developing countries, stimulated in part by the availability of international funding, had begun to take off. The greatest activity in the eighties took place in the South American countries, particularly Brazil.
6.2 Current Developments
There is still some scope for new capacity and additional pumped storage in Western Europe but the overall effect on future energy supplies will be small. In Japan, almost every technically feasible site has already been exploited. Some additional capacity is still available in the USA and Canada although, as in Western Europe, the preservation of existing untamed rivers has political priority. Most of the potential for increasing hydro’s contribution within the OECD countries now lies with the upgrading and refurbishing of existing sites.
The bulk of technically exploitable undeveloped sites are in developing countries and the USSR (see Chapter 1). Thus, any major expansion of hydro’s contribution to world energy supplies will have to come from these areas. About 1700 GW, equivalent to some 30 mboeld, remains theoretically available. This does not, of course, mean that a11 this capacity is, or will ever be, economic to exploit. At present approximately 93 GW of capacity is under construction, of which nearly 75 per cent is being built in developing countries (see Chart 13).
There is often said to be considerable potential for small- scale hydro plants of, say, below lMW, in a number of developed and developing countries. As with large- scale hydro schemes, the specific local conditions are all important. However, it seems clear that to achieve a given level of electricity output small- scale hydro plants will usually be more expensive unless there are subsidies of one kind or another. They may also not be able to compete with other small-scale sources of power. High investment costs, low output and maintenance probIems rule them out in many areas. Where they are tied in with an existing distribution system there are also problems of reliability and load balancing. The estimates of potential are often highly unrealistic if the practicalities are taken into account. Small- scale hydro thus seem unlikely to be anything more than a very minor contributor under very specific conditions.
The substantial theoretical potential of geothermal energy in one form or another has been well publicized. The economics of its development are also highly site specific and varied depending on the physical characteristics of the specific resource in relation to its location and intended use. There is approximately 5GW of geothermal electricity generating capacity currently operating, mainly in the USA and the Philippines. The easy and cheap sites have largely been developed and it seems unlikely that more than lOGW or so will be added globally over the next twenty years. This has been included in our projections of hydro development.
Hydroelectricity has a number of significant advantages. Well planned hydroelectric schemes can, and have, made substantial contributions to the well-being of nations through the exploitation of an indigenous source of clean, and renewable energy. Low operating costs and flexibility make it valuable for meeting peak load whilst it is
56 O.I.E.S.
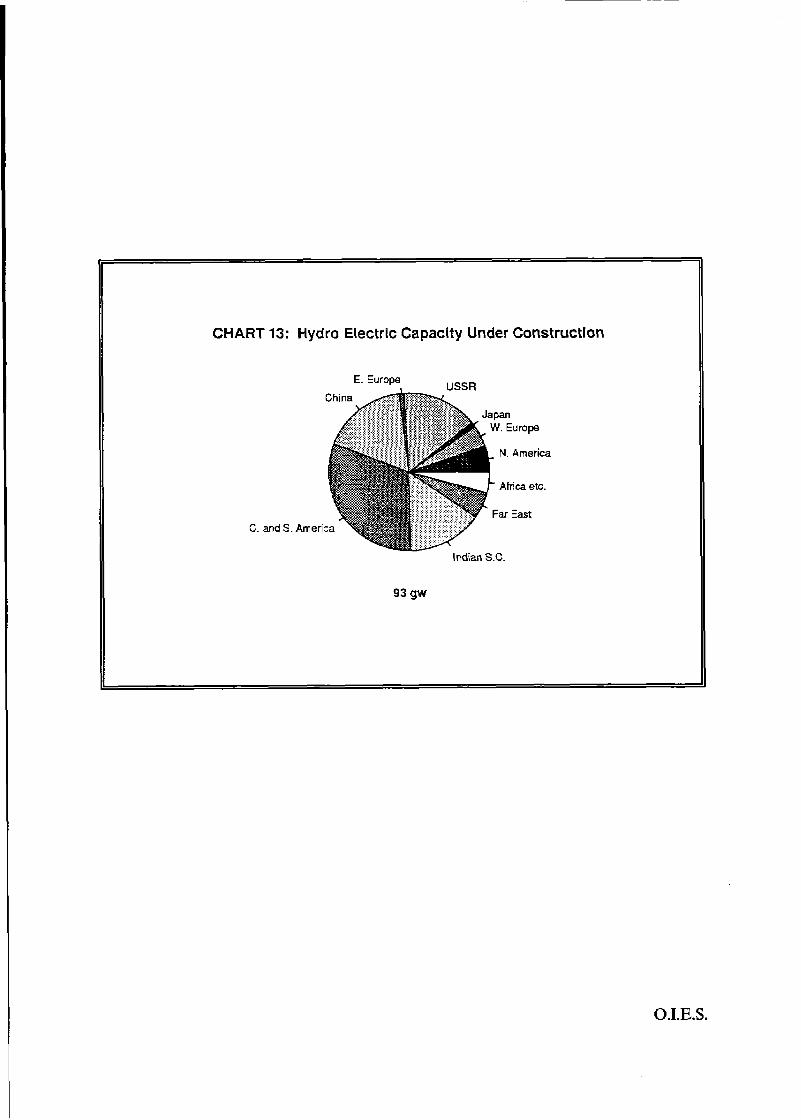
CHART 13: Hydro Electric Capacity Under Constructlon
USSR E. Europe
N. Amer-
Ahca etc.
ar East
- Indian S.C.
93 gw
O.I.E.S.

usually the cheapest source of electricity for base load. The availability of electricity from a hydro pIant may also act as a catalyst for the economic development of a region and there may be other benefits to land usage through irrigation and river control.
In the 1960s, the World Bank and other international lending bodies strongly encouraged the development of hydro resources in developing countries. At that time they were considered competitive even with small gas-fuelled generators. Since the mid- 198Os, large-scale hydro projects have tended to fall out of favour, not least with the World Bank. This is largely because of the growing feeling that smaller modules of less capital- intensive plant, such as gas turbines, are more appropriate where demand growth is uncertain and finance scarce. Awareness of a number of major problems, largely environmental, associated with the development of hydro has also been gathering momentum.
63 Future Availability
Some of the considerations affecting the future development of hydropower and the problems associated with them are:
(9 The initial cost of a hydro project is high and construction takes a long time by comparison with fossil-fuelled generators. This can, initially, put a severe strain on a country’s balance of payments. However, once built, running costs are usually negligible and the effect on balance of payments must eventually be favourable. Two or three moderate-sized dams totalling say 5GW could represent an annual saving on fuel oil imports of some $500 million per annum.
(E)
(iii)
The acquisition of funds for major projects can be very difficult and a source of conflict with protagonists of other forms of energy, as has happened in Brazil.
Costs are very site specific - ranging, for exampIe, from $900 per kW in Colombia to $5000 per kW in Upper Volta. Real costs have been rising because the most attractive sites have already been exploited. Many utilities now consider i t more economic and practical to invest in smaller, low capita1 cost generating units based on indigenous gas.
Silting is causing severe problems in some countries and affecting generating costs. The Tarbela reservoir representing the bulk of Pakistan’s capacity, for example, is already well below planned levels of generation. It is expected to lose 90 per cent of its capacity over the next fifty years.
The availability of cheap and flexible power aids national competitiveness and attracts industry as well as bringing the general benefits of electricity to many areas for the first time. In the USSR, €or example, hydropower was a vital element in the development of Soviet heavy industry. However, in a number of developing countries with a substantial hydro resource,
O.I.E.S.

markets for major outputs of electricity do not exist close to many major sites. The only way a dam can be justified is by the construction of expensive long-distance power lines. Cabora Bassa in Mozambique is an example of a very large project running at a fraction of its rated capacity, not only because political influences have affected its international market, but also because local demand was overestimated.
Fluctuation in rainfall can have a serious effect on output. In Spain, for example, annual variations can make a difference in fueI oil demand of between 40,000 and 100,000 boe/d. Climatic change may eventually affect the economics of some hydro schemes either for better or worse.
(vii) The effect on the environment of a major dam is increasingly becoming a consideration in the competitive decision process. Problems often arise from the need to reconcile the conflicting interests in water use between power needs, agriculture, industry, navigation and tourism. Where international borders are involved as in the Danube projects or those mooted for the Mekong then the problems are likely to prove particularly intractable.
(viii) Soil erosion frequently occurs unless there is adequate reafforestation. The Aswan High dam is a prime example of loss of soil fertility through cutting off the flow of silt which maintained fertility lower down the Nile. It is also an example, through its impact on sardine fishing in the Mediterranean, of the long- distance dangers to fisheries from some schemes.
The cost of population resettlement is often overlooked and can rarely be fully measured in human terms. The Three Gorges project in China will displace some 1.4 million people and submerge 44,000 hectares of the cultivated land that supported them. Problems have also arisen in a number of developing countries with the spread of water-borne disease as a result of dam construction.
Local climate may be affected by new large bodies of water and a possible contribution of CH4 to global warming.
In more prosperous countries such as the USA, Australia and in Scandinavia it has become almost impossible to build new dams on wild and scenic rivers or where rare species are endangered. The recent cancellation of the Danube international project shows the strength of environmental feelings in Eastern Europe.
Nevertheless, many of the potential environmental problems caused by large hydro schemes can be overcome by good planning and management. The environmental advantages of hydro as opposed to fossil fuels that contribute to global warming are now being considered afresh.
O.I.E.S. 59

In the longer term, the pace of hydro development will depend on the availability of capital and the prices of competing fuels seen partly in relation to environmental concerns. Technological advances in high voltage transmission, perhaps through superconductivity, enabling hydro-power to be sent from remote sites over long distances to major markets would be of major significance. Improved computer technology could also help to improve the yield from existing plant.
At present, of the approximately 9OGW of hydro capacity under construction, some 30 per cent is in South America - mainly in two very large projects in Brazil and Venezuela. The bulk of the rest of arrent construction is in other developing countries and the USSR. There are aIso some modest projects in hand in Norway, Canada and the USA and a few other developed countries. Most of the construction in the OECD countries is, however, concentrated on pumped storage.
The timing of many projects under construction is very uncertain and many have a history of lengthy delays. The level at which they will operate is also uncertain as is the actual effective life and long-term capabilities of existing plant. Most countries have plans of different degrees of firmness and with these the uncertainty is even greater.
Chart 14 is based on a detailed country-by-country assessment of hydro and geothermal capacity in place, under construction and planned as well as likely future developments and operating characteristics under average conditions. It gives a broad indication of the contribution that might be made to world energy supplies over the next twenty years. Details for individual countries are given in Appendix If.
The lower case is based on the following assumptions:
- Low fossil fuel prices and greater gas availability, combined with continued uncertainty on electricity growth, make the high capital cost of hydro increasingly unacceptable.
- International lending policies remain very selective towards new hydro projects.
- All sites under construction are completed but some existing plant is abandoned or scaled down.
- There is little new development in OECD countries as environmental pressures increase.
- In developing countries, only the most favourable sites are developed and many existing plans are abandoned.
- Severe silting and cracking lead to reduced utilization in a number of countries.
60 O.I.E.S.

CHART 14: Availability of Hydro and Geothermal Power
I
3 Q t .- - - 2ol n '7 n
hina
USSR
Far East
M.E. and Africa
W. Europe
C. and S. America
N, America
1989 1995 2000 2005 2010
O.I.E.S.
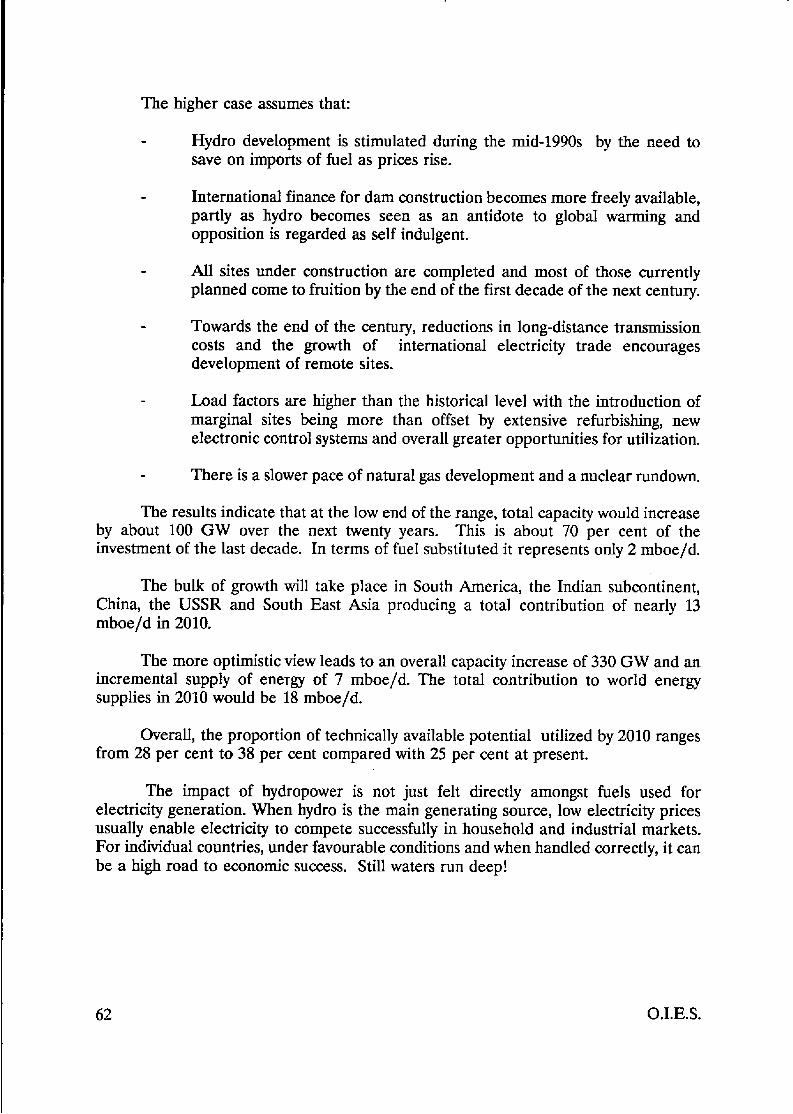
The higher case assumes that:
- Hydro development is stimulated during the mid-1990s by the need to save on imports of fuel as prices rise.
- Internationd finance for dam construction becomes more freely available, partly as hydro becomes seen as an antidote to global warming and opposition is regarded as self indulgent.
- All sites under construction are completed and most of those currently planned come to fruition by the end of the first decade of the next century.
- Towards the end of the century, reductions in long-distance transmission costs and the growth of development of remote sites.
international electricity trade encourages
Load factors are higher than the historical level with the introduction of marginal sites being more than offset by extensive refurbishing, new electronic control systems and overall greater opportunities for utilization.
- There is a slower pace of natural gas development and a nuclear rundown.
The results indicate that at the low end of the range, total capacity would increase by about 100 GW over the next twenty years. This is about 70 per cent of the investment of the last decade. In terms of fuel: substituted it represents only 2 mboe/d.
The bulk of growth will take place in South America, the Indian subcontinent, China, the USSR and South East Asia producing a total contribution of nearly 13 mboe/d in 2010.
The more optimistic view leads to an overall capacity increase of 330 GW and an incremental supply of energy of 7 mboe/d. The total contribution to world energy supplies in 2010 would be 18 mboeld.
OveralI, the proportion of technically available potential utilized by 2010 ranges from 28 per cent to 38 per cent compared with 25 per cent at present.
The impact of hydropower is not just felt directly amongst fuels used for electricity generation. When hydro is the main generating source, low electricity prices usually enable eIectricity to compete successfuHy in household and industrial markets. For individual countries, under favourable conditions and when handled correctly, it can be a high road to economic success. Still waters run deep!
62 O.I.E.S.

Non-OPEC Oil* Availability (Million Barrels of Oil EauivaIent Der Dav) Lower Case
A p p d i x la
1989 199s 2ooo 2005 2010
us 8.a 7.9 6.9 5.6 4.8 Canada 1.8 1.8 1.8 1.6 15
M. America 10.6 9.7 8.7 7.2 6.3
Mexico Argentina
Brazil Colombia
2.8 0.5 0.8 0.4
3.2 0 5
0.8
0 5
3.3 0.4 0.7 0.4
3.4 0.2 0.6
0.4
3.2 0.2 0.6 0.3
Central & South America
UK Norway
4.9
1.9 15
5.4
1.8 2.0
5.2
1.4 24
4.9
1.2 2.1
4.6
1.2 1.9
Others 0.7 0.7 0.6 0 5 0 5
Western Europe 4.1 4 5 4.4 3.8 3.6
Australia 0.6 0.5 0.4 0.3 0.3 Others 0.1 0.1 0.1 0.1 0.1
A u s tra 1 as i a 0.7 0.6 0 5 0.4 0.4
Oman
N. Yemen
Syria
0.6
0.2 0.3
0.7 0.3
0.5
0.6 0.2
0.3
0.4
0.1
0.2
0.3
0.1
0.1
Others 0.1 0.3 0.2 0.2 0.2
Middle East 1.2 1.8 1.3 0.9 0.7
Angola 0 5 05 0.3 0.2 0.2
Tunisia 0.1 0.1 0.2 0.1 0.1 0 t hers 0 5 0.6 0.6 0.6 0.6
Africa 2.0 2.1 1.8 1.4 1.3
EgyPt 0.9 0.9 0.7 05 0.4
Brunei
Malaysia 0.2
0.6
0.2 0.8
0.2
0.7 0.1
0.5
0.1
0.4 Others ll 0.1 0.1 0.2 0.2
Far East 0.8 1.1 1.0 0.8 0.7
India 0.7 0.7 0.6 0.4 0.4
Others 0.1 0.2 0.2 0.3 0.2
0.8 0.9 0.8 0.7 0.6 M E n t inent
25.1 245.1 23.7 20.1 18.2 QZOPEC!
USSR Eastern Europe
12.3
0.3 11.9
0.3
11.4 0.2
10.0 0.2
9.3
0.1
China 2.9 3 5 3.8 3.6 3.3
155 25.7 15.4 13.8 12.7
Total 40.6 41.8 39.1 33.9 30.9
* Includes NGLs and synfuels
O.I.E.S.
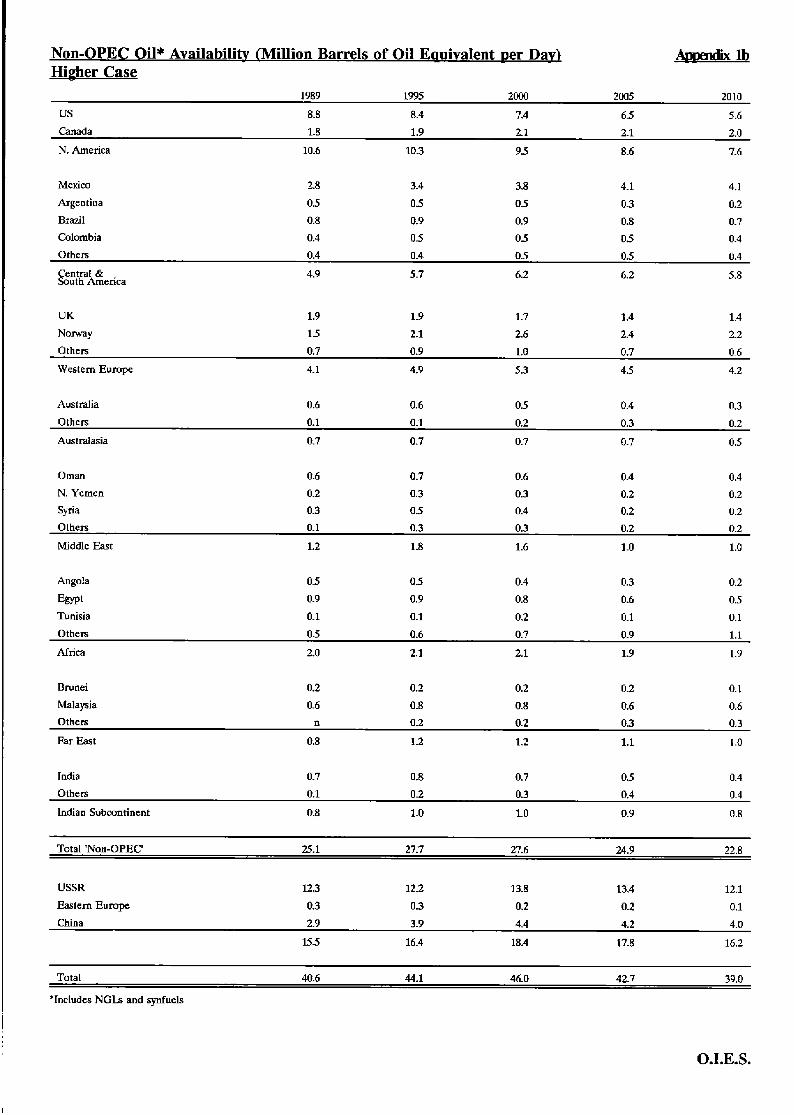
Non-OPEC Oil* Availability (Million Barrels of Oil EauivaIent per Day) AIxmdixlb Higher Case
t
1989 1995 Zoo0 2005 2010
us 8.8 8.4 7.4 65 5.6
N. America 10.6 10.3 95 8.6 7.6
Mexico 2.8 3.4 3.8 4.1 4.1 Argentina 0.5 0 5 05 0.3 0.2 Brazil 0.8 0.9 0.9 0.8 0.7
Colombia 0.4 0 5 05 0 5 0.4 Others 0.4 0.4 0.5 05 0.4
Central & 4.9 5.7 6.2 6.2 5.8 South America
UK Norway
1.9
15 1.9 2.1
1.7 2.6
1.4
2.4
1.4 2.2
Western Europe 4.1 4.9 5.3 4.5 4.2
Australia 0.6 0.6 05 0.4 0.3
Others 0.1 0.1 0.2 0 3 0.2
A u s t ra I a s i a 0.7 0.7 0.7 0.7 0.5
Oman N. Yemen Syria
0.6 0.2 0.3
0.7
0.3
0.5
0.6
0.3
0.4
0.4
0.2 0.2
0.4
0.2 0.2
0 t hers 0.1 0.3 0.3 0.2 0.2
Middle East 1.2 1.8 1.6 1.0 1.0
Angola
E m t Tunisia
05 0.9 0.1
0 5
0.9
0.1
0.4
0.8 0.2
0.3 0.6
0.1
0.2
0.5
0.1
Others 0 5 0.6 0.7 0.9 1.1
Africa 2.0 2.1 2.1 1.9 1.9
Brunei 0.2 0.2 0.2 0.2 0.1 Malaysia 0.6 0.8 0.8 0.6 0.6 Others n 0.2 0.2 0.3 0.3
Far East 0.8 1.2 1.2 1.1 I .O
India 0.7 0.8 0.7 0.5 0.4 Others 0.1 0.2 0 3 0.4 0.4
Indian Subcontinent 0.8 1.0 1.0 0.9 0.8
USSR 12.3 12.2 13.8 13.4 12.1
Eastern Europe 0.3 0.3 0.2 02 0.1 China 2.9 3.9 4.4 4.2 4.0
155 16.4 18.4 17.8 16.2
Total 40.6 44.1 46.0 42.7 39.0
*Includes NGLs and synfuels
O.I.E.S.
Coal Availability* (Million Barrels of OiI Eauivalent Der Dav) Appmdix IC 1989 1995 m 2005 2010
us 9.7 9.7-11.0 98-13.1 10.4-18.2 10.9-24.2
Canada 0.6 0.6-0.8 0.7-1.0 0.7-1.3 0.8-1.6
North America 10.3 10.3-11.8 105-14.1 11.1 - 19 5 11.7-25.8
Mexico 0.1 0.1-0.1 0.1-0.2 0.14.2 0.14.4
Venezuela n-O.1 0.1-0.2 0.143 0.1-0.4
Colombia 0.2 0.20.3 0.20.6 0.24.9 0.21.2
Others 0.1 n n 0.14.2 0.1-0.2
ntral & 0.4 03-05 0.4-1.0 05-1.6 05-2.2 !2 uth America
UK 1.3 0.9-1.2 0.7-1.1 05-1.1 05-1.0 Belgium/Lux n n n n n
West Germany 13 0.s1.1 0.9-1.1 0.7-1.0 0.4-0.9 France 0.1 n-O.1 n-0.1 n4.1 n
Greece 0.2 0.20.2 0.20.3 0 .143 0.1-0.2
Spain 0.3 0.203 0.243 0.1-0.3 0.1-0.2
Turkey 0.2 0.20.2 O.ZO.4 0.24.4 0.245
Yugoslavia 0.3 0.10.3 0.3-0.3 03-03 0.2-0.4
Others n n n-O.l n-0.1 n0.1
Western Europe 3.7 27-3.4 25-3.7 1.9-3.6 15-33
Australia 1.9 1.9-2.2 2.1-2.7 2.1-3.4 2.2-4.1
Others n n-O.l n-O.l n-O.1 n-0.1
Australasia 1.9 1.9-2.3 2.1-2.8 2.1-3.5 2.2-4.2
Middle East n n II n n-O.1
Mozambique n n n n4.1 n-0.3
Zimbabwe 0.1 0.1-0.1 0.1-0.1 0.14.1 0.1-0.3 south Africa 1.8 1.8-2.2 1.&25 1.9-3.0 2.0-3.4
Others n n-0.1 n-0.1 n4.l n-O.1
Africa 1.9 1.9-2.4 1.9-2.7 2.0-3.3 2.14.1
Indonesia n 0.14.1 0.1-0.3 0.145 0.2-0.7
Philippines n n n-0.1 n4.l 11-0.2
Taiwan n n n-O.1 n4.1 n-0.1
S. Korea 0.3 0.34.3 0.20.4 0.2-0.4 0.2-0.3
N. Korea 05 0.54.6 0.6-0.7 050.8 0.5-0.8 Vietnam 0.1 0.14.1 0.1-0.1 0.1-0.1 0.14.3
Mongolia n n n-0.1 l-t-0.l n-0.1
Others 0.2 0.24.2 0.20.2 0.1-0.2 a 4 3
Far East 1.1 1.2-1.3 1.22.0 1.0-2.3 1.0-2.8
India 23 2.3-25 2.32.8 2.4-3.0 2.4-3.6 Pakistan n n 0.1-0.1 0.1-0.1 0.14.2
Others n n n n-O.1 n0 .1
Indian Subcontinent 2.3 2.3-25 2.4-2.9 25-3.2 25-3.9
USSR Eastern Europe China
6.6 6.9-75 7.2-8.7 7.3- 10.0 7.312.3 5.1 4.6-55 4 3 5 5 3.4-55 3.1-55
10.9 11.0-13.0 12.0-14.4 120-lS.6 12.0- 18.3
Total World 44.2 43.1-50.2 445-57.8 43.8-68.1 43.9-825
*Hard coal and lignite
O.I.E.S.

Natural Gas Availabilitv (Million Barrels of Oil Eauivalent per Davl W l d
I989 1995 2ooo 2005 2010
us 85 839.4 8.1-9.0 7.0-8.7 5.18.6 Canada 1.9 2.0-2.3 1.8-2.3 1.5-2.3 15-2.0
N. America 10.4 10.3-11.7 9.9-11.3 85-11.0 6.8-10.6
Mexico 0 5 0.6-0.6 0.6-0.7 0.60.8 0.7-1.1 Argentina 0.4 0.5-05 05-0.7 0.6-0.7 0.74.7
Venezuela 0.4 0.4-0.4 05-0.6 0.6-0.9 0.7-1.1
Others 0.3 0.3-0.4 0.4-05 0.&0.9 O.&l.l
1.6 1.8-1.9 2.0-25 2.4-3.3 2.740 P*L% UK 0.8 0.8-1.0 0.81.0 0.6-1.0 05-1.0 Norway 05 O.M.7 0.8-0.8 1.21.4 1.3-1.8
Netherlands 1.2 1.21.2 1.cb1.2 061.1 0.544 Others 0.8 0.8-1.0 0.7-1.0 0.7-0.9 0.54.8 Western Europe 3.3 3.4-3.9 3.340 3.14.4 2.945
AustraIia 0.3 0.4-0.4 0.445 05-0.6 054.9
Others 0.1 0.142 0.142 0.14.2 0.2-0.3
Australasia 0.4 050.6 050.7 0.6-0.8 0.7-1.2
Iran
Iraq Kuwait Qatar Saudi Arabia
0.4 054.7 0.60.7 0.7-1.0 0.9-1.4
0.1 0.1-0.2 0.20.3 0.2-05 0.3-1.1
0.1 0.1-0.1 0.14.1 0.14.2 0.14.4
0.1 0.14.2 0.1-0.2 0.2-0.3 0.2-0.7
0 5 0.6-0.6 0.6-0.7 0.6-0.8 O.&I.l
UAE 0.4 0.44.4 0.4-0.4 0.445 0.44.7
Others 0.2 024.2 0.203 0.3-0.3 0.3-0.6
Middle East 1.8 2.0-2.4 2.22.7 25-3.6 2.8-6.0
Algeria 0.9 1.0-1.1 1.215 1.3-1.8 1.4-2.0
Egypt 0.1 0.24.2 0.24.3 0.2-0.3 0.2-0.3
Nigeria 0.1 0.14.1 0.14.2 0.2-0.3 0.24.4
Libya 0.1 0.14.2 0.2A.3 0.3-0.4 0.4-05 Others n 0.1-0.1 0.1-0.1 0.2-0.2 0.34.4
Africa 1.2 1.5-1.7 1.8-2.4 2.2 - 3.0 25-3.6
Brunei 0.2 0.2-0.2 0.20.2 0.2-0.2 0.2-0.3
Indonesia 0.7 0.84.8 0.9-1.0 1.1-1.4 1.11.8 Malaysia 0.3 0.3-0.4 0.445 0.4-0.6 0.6-0.9
Others 0.1 0.2-0.2 0.2-0.2 0.2-0.3 0.1-0.4
Far East 1.3 15-1.6 1.7-1.9 1.9-25 2.23.4
India 0.2 0.2-0.3 0.2-0.4 0.4-05 0.4-0.9 Pakistan 0.2 0.3-0.3 O.M.4 0.344 0.20.3 Others 0.2 0.2-0.2 O.M.3 0.345 0.3-0.7
Indian Subcontinent 0.6 0.74.8 0.8-1.1 1.0-1.4 0.9-1.9
USSR Eastern Europe China
14.6 16.C17.8 17.220.6 18.7-23.1 20.1-285
1.1 0.80.8 0.&0.7 0.305 0.24.3
0.3 0.3-0.4 0.4-0.6 0.6-0.9 0.9-2.0
Total World 36.6 38.8-43.6 40.4485 41.8-545 42.7-66.0
bcm 2055 2179-2452 22n2722 2349-3062 2401-3707
O.I.E.S.
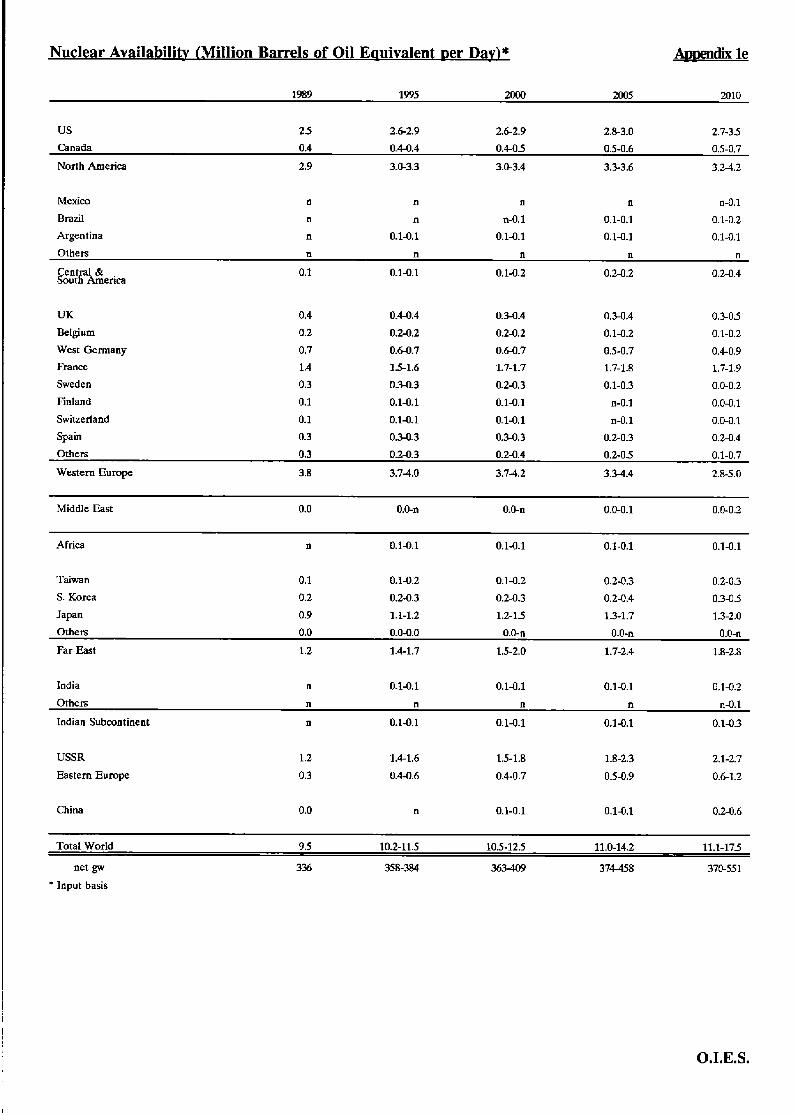
Nuclear Availability (MiIlion Barrels of Oil Eauivalent Der Day)* ADDendix le
1989 1995 2000 2005 2010
us 2 5 2.6-2.9 2.62.9 2.83.0 2.7-35 Canada 0.4 0.4-0.4 0.4-05 0.5-0.6 0.5-0.7
North America 2.9 3.0-3.3 3.s3.4 3.3-3.6 3.M.2
Mexico
Brazil Argentina
n n n n n-O.1
n n n-0.1 0.1-0.1 0.1-0.2
n 0.14.1 0.1-0.1 0.1-0.1 0.14.1
Others n n n n n
Central & 0.1 0.1-0.1 0.1-0.2 0.2-0.2 0.24.4 South America
UK 0.4 0.4-0.4 0.3-0.4 0.3-0.4 0.105 Betgium 0.2 024.2 0.24.2 0.1-0.2 0.1-0.2 West Germany 0.7 0.6-0.7 0.6-0.7 0.5-0.7 0.4-0.9 France 1.4 15-1.6 1.7-1.7 1.7-1.8 1.7-1.9 Sweden 0.3 030.3 0.2-0.3 0.1-0.3 0.0-0.2
Finland 0.1 0.1-0.1 0.14.1 n-0.1 0.0-0.1 Switzertand 0.1 0.1-0.1 0.14.1 n-0.1 0 . 0 . 1
Others 0.3 0.20.3 0.2-0.4 0.2-05 0.1-0.7
Spain 0.3 0.3-0.3 0.3-0.3 0.2-0.3 0.24.4
Western Europe 3.8 3.740 3.74.2 334.4 2.8-5.0
Middle East 0.0 0.0-n 0.O-n 0.0-0.1 0.0-0.2
Africa n 0.14.1 0.1-0.1 0.14.1 0.1-0.1
Taiwan 0.1 0.1-0.2 0.1-0.2 0.2-0.3 0.2-0.3
s. Korea 0.2 0.24.3 0.24.3 0.2-0.4 0.34.5 Japan 0.9 1.1-1.2 1.2-15 13-1.7 1.3-2.0 Others 0.0 0.040 0.0-n 0.0-n 0.0-n
Far East 1.2 1.4-1.7 1.5-2.0 1.7-2.4 1.8-2.8
India n 0.14.1 0.1-0.1 0.14.1 0.14.2
Othen n n n n n-0.1
Indian Subcontinent n 0.1-0.1 0.1-0.1 0.14.1 0.10.3
USSR
Eastern Europe 1.2 1.4-1.6 1.5-1.8 1.8-2.3 2.1-2.7
0.3 0.44.6 0.4-0.7 054.9 0.61.2
China 0.0 n 0.1-0.1 0.1-0.1 0.2-0.6
Total World 9.5 102-11.5 10 5- 12.5 11.b14.2 11.1-175
net gw 336 358-384 363-409 374458 370-551 * Input basis
O.I.E.S.

Hydro and Geothermal Availability 'llion Barrels of Oil Eauivalent per Davl* Appenclixlf
1989 1995 2ooo 2005 2010
us 15 15-15 15-1.6 15-1.6 15-1.6
Canada 15 15-1.6 1.6-1.7 1.7-1.8 1.7 - 2.0
North America 3.0 3.0-3.1 3.1-3.3 3.2-3.4 3.2-3.6
Mexico 0.1 0.1-0.1 0.14.1 0.14.1 0.1-0.2
Venezuela 0.3 0.3-0.4 034.4 0.3-0.4 0.345 Colombia 0.1 0.14.1 0.1-0.2 0.2-0.3 0.20.6
Argentina 0.1 0.24.2 0.2-02 0.24.4 0.3-0.5
Brazil 0.9 1.cL1.0 1.0-1.1 1.1-1.2 1.21.4
Others 0.3 0.34.3 0.3-0.3 0.3-0.4 0.4-0.7
ntral & 1.8 20-2.1 2.0-2.3 2.2-2.8 25-3.9
Norway 0 5 0 5 4 5 05-0.6 0.5-0.6 05-0.6
W. Germany 0.1 0.1-0.1 0.1-0.1 0.1-0.1 0.1-0.1
PEUlCC 0.3 0.3-0.3 0.30.4 0.3-0.4 0 3 0 . 4 Italy 0.2 0.2-0.2 0.2-0.3 0.2-0.3 0.24.3
Austria 0.2 0.2-0.2 0.2-0.2 0.20.2 0.24.2 Sweden 0.4 0.4-0.4 0.4-0.4 0.4-0.4 0.44.4
Switzerland 0.2 0.2-0.2 0.2-0.2 0.2-0.2 0.24.2 Spain 0.2 0.20.3 0.3-0.3 0.10.3 0.34.3 Turkey 0.1 0.1-0.1 0.1-0.1 0.1-0.1 0.1-0.2
Others 0.2 0.2-0.2 0.2-0.3 0.4-0.4 0.4-0.5
Western Europe 2.4 2.425 25-2.9 2.7-3.0 2.7-3.2
Australia 0.1 0.1-0.1 0.1-0.1 0.1-0.1 0.14.1 Other 0.1 0.1-0.1 0.1-0.1 0.1-0.1 0.1-0.2
Australasia 0.2 0.2-0.2 0.2-0.2 0.2-0.2 0.2-0.3
Middle East 0.1 0.1-0.1 0.1-0.1 0.1-0.1 0.1-0.1
Africa 0.2 0.2-0.2 0.2-0.2 0.2-0.3 0.2-0.4
Malaysia n n n n-O.l 0.1-0.1 Indonesia 0.1 0.1-0.1 0.1-0.1 0.1-0.1 0.1-0.1
Japan 0.4 0.4-05 05-0.6 0.5-0.6 05-0.6
Others 0.1 0.1-0.1 0.14.2 0.1-0.2 0.1 - 0.2
Far Eart 0.6 0.60.7 0.7-0.9 0.7-1.0 0.8-1.0
India Pakistan
0.3 O.M.4 0.4-0.5 0.5-0.7 0.6-1.0
0.1 0.1-0.1 0.1-0.1 0.1-0.1 0.1-0.2
Others n n n-O.l n-O.l n-0.1
Indian Subcontinent 0.4 0.4-05 05-0.7 0.6-0.9 0.7- 1.3
USSR Eastern Europe
China Others
1.1 1.21.2 1.21.3 1.3-1.6 1.4-1.9
0.1 0.1-0.1 0.1-0.1 0.14.1 0.14.1
0 5 O.M.7 0.6-1.0 0.7-1.4 0.9-1.9
0.2 0.242 0.20.2 0.242 0.24.3
Total World 10.6 11.CL11.6 11.4-13.2 12.2-15.0 13.0-18.0
net gw 613 637-672 647-726 677-810 720-951
* Input Basis
O.I.E.S.
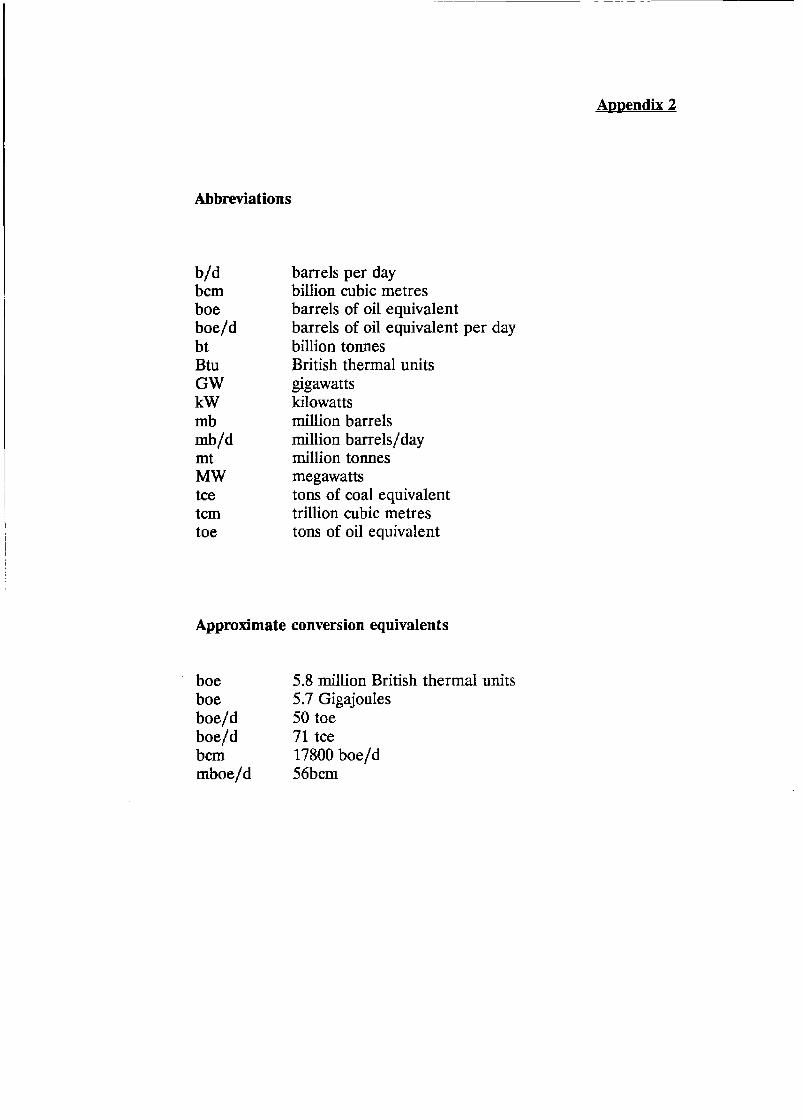
Abbreviations
b/d bcm boe boe/d bt Btu GW kW mb mb/d mt MW tce tcm toe
barrels per day billion cubic metres barrels of oil equivalent barrels of oil equivalent per day billion tonnes British thermal units gigawatts kilowatts million barrels million barrels/day million tonnes megawatts tons of coal equivalent trillion cubic metres tons of oil equivalent
Approximate conversion equivalents
boe boe 5.7 GigajouIes boe/d 50 toe boe/d 71 tce bcm 17800 boe/d mboe/d 56bcm
5.8 million British thermal units
Related Documents