THE OFFICIAL MAGAZINE OF THE UNITED STATES GEOSPATIAL INTELLIGENCE FOUNDATION 2016 ISSUE 4 » HUMAN TRAFFICKING » FUTURE GEOINT LEADERS » OPEN GEOSPATIAL STANDARDS Sophisticated sensors can see things humans can’t. MORE THAN MEETS EYE THE

Welcome message from author
This document is posted to help you gain knowledge. Please leave a comment to let me know what you think about it! Share it to your friends and learn new things together.
Transcript

THE OFFICIAL MAGAZINE OF THE UNITED STATES GEOSPATIAL INTELLIGENCE FOUNDATION
2016 ISSUE 4
» HUMAN TRAFFICKING » FUTURE GEOINT LEADERS » OPEN GEOSPATIAL STANDARDS
Sophisticated sensors can see things humans can’t.
MORE THAN MEETS
EYETHE

MORE THAN MEETS
BY MATT ALDERTON
12 | TRA JECTORYMAGAZINE.C OM ll 2016 ISSUE 4
THANKS TO DIVERSE REMOTE SENSING PHENOMENOLOGY, SOPHISTICATED SENSORS CAN SEE THINGS HUMANS CAN’T. GEOINT’S NEXT CHALLENGE: TURNING SPECTRAL SCIENCE INTO ACTIONABLE INSIGHT.

USGIF.ORG kk TRA JECTORY | 13
he human body is a marvelous machine. Its largest organ—the skin—contains approximately 5 million touch receptors capable of telling hot from cold, wet from
dry, and hard from soft. It also has a tongue with up to 10,000 taste buds discerning sweet, sour, salty, bitter, and savory; an auditory system with more than 25,000 minuscule hairs translating tiny vibrations into noise, music, and conversation; and eyes, which comprise more than 2 million working parts that together can distinguish approximately 10 million colors. Still, the human body has limitations. For every
sight its eyes can see, there are exponentially more that remain indiscernible, invisible, and otherwise imperceptible. >
IMAG
E CO
UR
TESY
OF
HAR
RIS
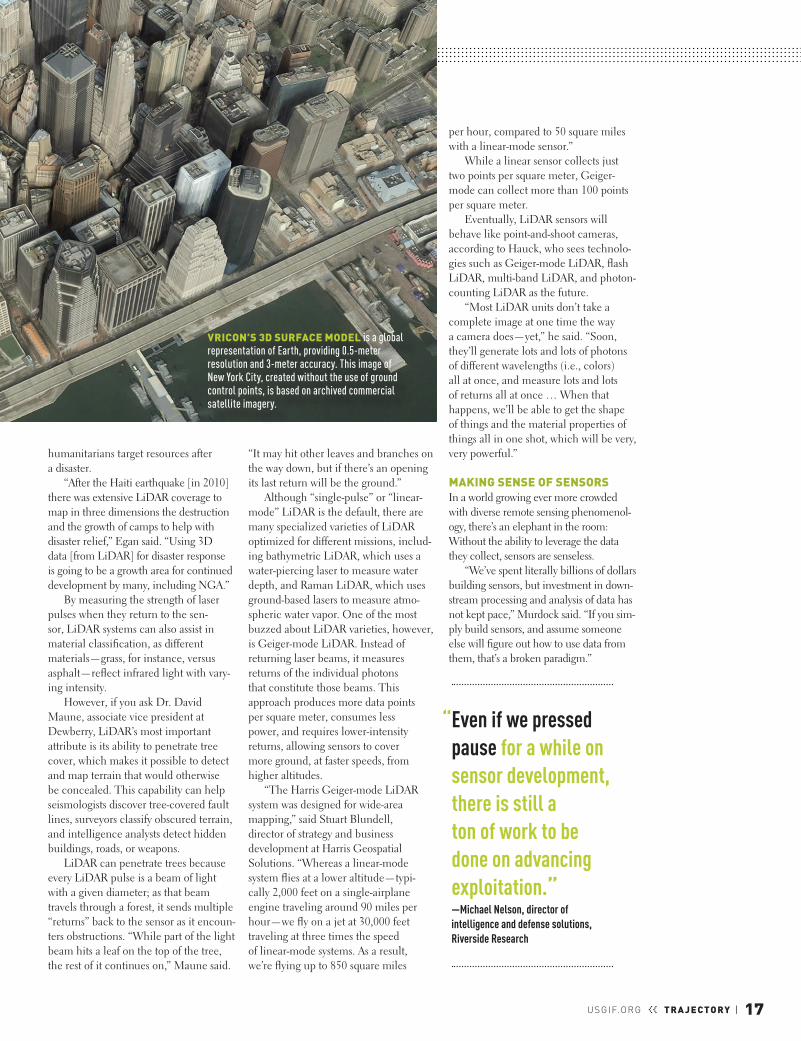
A linear LiDAR sensor collects two points per square meter, but Geiger-mode (used to create this image of downtown Charlotte, N.C.) can collect more than 100 points per square meter.

what the new and different types of sensors allow us to do—is determine what things are by seeing things in a way the naked eye can’t.”
SENSORS’ ASCENSIONBefore phenomenology, there was photography, according to remote sensing expert Daniel Ngoroi, a geospatial team leader at Woolpert. Ngoroi traces modern sensors back to NASA’s 1969 Apollo 9 space mission, during which astronauts took the first multispectral terrain photographs from space. By making the case for multispectral orbital imagery, Apollo 9 influenced the 1972 launch of Landsat 1, the world’s first civil Earth-observation satellite and—thanks to a sensor spanning four spectral bands—its first multispectral imaging satellite.
“[The first Landsat satellites] were designed from a multispectral point of view because people … realized there are vast expanses of the electromag-netic spectrum that we ought to be taking advantage of to see information we can’t see with our own eyes,” Ngoroi said.
The proliferation of diverse remote sensing phenomenology catalyzed by Landsat 1 was further stimulated by
the 1992 passage of the Land Remote Sensing Policy Act and the dawn of the Information Age. The former accelerated sensor innovation through commercialization by spawning companies like DigitalGlobe, whose WorldView satellites embody the move-ment to develop new and more powerful sensors for commercial customers.
“DigitalGlobe began developing … sensors with spectral bands for really unique applications,” said Dr. Kumar Navulur, senior director of global strategy programs at DigitalGlobe, cit-ing the development of DigitalGlobe’s WorldView-1, -2, -3, and -4 satellites. Launched in 2007, 2009, 2014, and planned for 2016, respectively, each was outfitted with progressively more sophisticated sensors for applications in industries such as agriculture, forestry, and mining.
Equally important was the digital revolution, which enabled sensor evolu-tion through advances in data storage, processing, and communication. The revolution brought sensors out of the laboratory and into real life.
“Twenty years ago … these national assets were so important that govern-ments would spend billions of dollars on them. Today, that same kind of power is available in the private sector, to civilian
Remote sensing—taking images of Earth from land, sea, air, and space—is one way humans can transcend their five senses to learn more about the world. By augmenting senses with sensors, remote sensing supersedes biology in favor of physics to unlock distinguishing information about people, places, and things. The product is intelligence. The objective, however, is intervention.
For decades, the information returned by remote sensing platforms was restricted to literal images in black and white or color. The invention of synthetic aperture radar (SAR) in 1951, however, commenced a new era in sensor innova-tion. Along with electro-optical cameras and SAR—which can acquire imagery at night and penetrate clouds and fog—modern remote sensing platforms are bedazzled with a litany of sensors that exploit increasingly diverse phenomenol-ogy capable of seeing and sensing things never before possible.
“Just taking pictures in black and white or panchromatic provides a really limited set of information,” explained Dr. Michael Egan, head of the Spectral Research Pod at the National Geospa-tial-Intelligence Agency (NGA). “What we really want to be able to do—and
14 | TRA JECTORYMAGAZINE.C OM ll 2016 ISSUE 4
“ With thermal infrared you can tell whether a truck or tank engine is on, whether a building is occupied, or whether an aircraft on a runway has just landed.” —Robert Zitz, vice president and strategic account executive, Leidos
THIS PLANIMETRIC TOPOGRAPHIC MAP of Oregon’s Crooked Creek is a LiDAR image Woolpert created for the U.S. Geological Survey and the Federal Emergency Management Agency.
IMAG
E CO
UR
TESY
OF
WO
OLP
ERT

USGIF.ORG kk TRA JECTORY | 15
Theia sensors—mounted on the Inter-national Space Station—cover three and four bands, respectively, while its Deimos-1 and Deimos-2 satellites cover three and five bands, respectively. Urthe-Cast’s future plans include UrtheDaily, a constellation of eight electro-optical satellites that will provide daily coverage across six bands.
Of all the bands multispectral sen-sors can capture, visible bands are the most common. Perhaps the most useful, however, are invisible bands, such as near-infrared (NIR) bands, according to Navulur, who said agriculture and for-estry are two standout applications since vegetation—including trees, plants, and crops—has a particularly strong signa-ture in NIR imagery.
“For example, when we developed our WorldView-2 satellite, one of eight bands that we derived was a band called the ‘red edge’ band, which allows us to identify whether vegetation is healthy or
unhealthy,” explained Navulur, noting photosynthesis causes NIR energy to bounce off healthy vegetation but pass through unhealthy vegetation, mak-ing it easy to identify plants affected by drought or disease. That kind of informa-tion is valuable not only to farmers and forest managers, but also to governments and militaries.
“We’re using [multispectral data] to address food and water security issues by doing agricultural assessments and trend analysis to determine whether there’s agricultural expansion at a country level or agricultural failure that could be an indicator for potential civil unrest down the road,” Avila said.
Along with forests and farmland, the reflection of NIR energy—or lack thereof—makes it easy to distinguish manmade structures, bare earth, water, and shadows, all of which can help analysts answer questions about land composition and usage. Or in the case
agencies, and even to the world’s poorest countries,” said Dr. Michael Hauck, exec-utive director of the American Society for Photogrammetry & Remote Sensing (ASPRS). “It’s really remarkable.”
SPECTRAL SOLUTIONSHistory is one requisite subject for grasping diverse remote sensing phe-nomenology. Science is another.
“Remote sensing at its heart is really applied physics,” said USGIF Vice President of Professional Develop-ment Dr. Darryl Murdock. “You have to understand physics to understand remote sensing.”
Most modern sensors are designed to exploit the full range of the electro-magnetic spectrum, the basic premise of which is this: Everything in the uni-verse—the sun, the Earth, and even the human body—continuously emits energy in the form of electromagnetic radiation. This energy varies in frequency and wavelength, from radio waves with low frequencies and large wavelengths to gamma rays with high frequencies and small wavelengths. Because all objects emit, reflect, and absorb electromagnetic energy differently, capturing it allows analysts to glean information not revealed in literal images.
“Being able to observe how materials react or behave in different portions of the electromagnetic spectrum allows us to make determinations and inferences about what’s happening on the ground,” explained Dr. Frank Avila, a senior scientist in NGA’s Office of Sciences and Methodologies. “For example, WorldView-3 gives us data across 16 [spectral bands] that we can use to look at the same portion of the ground. Each one gives us a slightly different piece of information, which together may be able to give us a complete picture.”
The spectrum can be spliced into infinite “bands,” the majority of which are invisible to the naked eye. Sensors that read approximately 10 or fewer visible and invisible bands are known as multispectral, those that read between 10 and 20 superspectral, and those that read more than 20 hyperspectral.
DigitalGlobe’s just-launched World-View-4 will sense across five spectral bands, while Planet’s Dove satellites sense across four. UrtheCast’s Iris and
LANDSAT CELEBRATES 50 YEARSThe U.S. Geological Survey’s Landsat program celebrated its 50th anniversary in September—marking half a century since then Secretary of the Interior Stewart Udall announced the Department of the Interior was launching Project EROS (Earth Resources Observation Satellites). Landsat 1—originally called the Earth Resources Technology Satellite (ERTS)—launched in 1972 as the world’s first civil Earth-observation satellite and first multispectral imaging satellite, paving the way for diverse remote sensing phenomenology.
Since then, seven more Landsat satellites have launched, collectively capturing millions of photos of Earth, and inspiring decades of remote sensing professionals.
“When I decided to come into this field, it was because I saw a Landsat image and was blown away that you could get a good image of the planet from space,” said Daniel Ngoroi, a geospatial team leader at Woolpert.
With each iteration, the Landsat program incorporates new remote sensing technologies. Landsat 8, launched in 2013, carried two instruments: the Operational Land Imager, which included refined heritage bands and new bands such as a deep blue band for coastal/aerosol studies and a shortwave infrared band; and a Thermal Infrared Sensor with two thermal bands. Landsat 9 is expected to launch in December 2020 and carry on the program’s legacy of monitoring the planet from new perspectives.
Force-sponsored mission that concluded in December 2013.
Up and down the spectrum, the possibilities are at once overwhelming and exciting.
“Eventually, we’ll get to practical-use ultraspectral sensors … with millions of discrete bands,” continued Zitz, who said ultraspectral sensors will be able to distinguish seemingly identical objects manufactured at the same time by identify-ing their one-of-a-kind spectral fingerprint. “It is being proven in the labs right now.”
LET THERE BE LIDARConversations about remote sensing phenomenology may begin with space, but that’s not where they end. Case in point: light detection and ranging, or LiDAR, whose chief advantages over spectral sensors are the ability to map 3D elevation and to penetrate tree cover.
Unlike passive sensors that measure electromagnetic energy emitted or reflected by external objects, LiDAR is an active sensor that emits and measures its own energy from an internal source: a laser—typically in the NIR band. Because of the power required to operate them, LiDAR sensors must be flown from aerial rather than space-based platforms. The sensors send laser pulses to the ground, where they bounce off buildings, vehicles, rocks, and earth before returning.
“What’s measured is the time it takes for the pulse to travel from the sensor to the object you were shooting, and then bounce back to the sensor,” explained Ngoroi, who said the resulting measure-ment is used in 3D terrain mapping to calculate elevation. “That time is what gives you elevation.”
Each LiDAR pulse is recorded as a three-dimensional point on a map; col-lectively, millions of points in the same vicinity constitute a 3D point cloud that can be interpreted as an object.
According to Ngoroi, elevation data can be used for applications such as flood modeling and emergency response. For example, the State of Indiana commis-sioned Woolpert to conduct a statewide LiDAR survey of its buildings to improve its E911 system. Knowing a building’s elevation, the state theorizes, will help emergency responders save lives.
“If someone’s calling for help from a cellphone, you can’t tell if they’re on the ground floor of a building or the 12th floor,” Ngoroi said. “If you use LiDAR to map buildings and provide that data to emergency responders, they’ll know which fire truck with which kind of lad-der to bring based on the height of the buildings in that area.”
The same information could help law enforcement and the military determine line of sight when planning operations, architects orient build-ings for maximum solar exposure, and
of Vricon, build digital terrain models for applications such as hydrology, geol-ogy, defense, construction, and disaster management.
“In order to generate bare-earth ter-rain models as accurately and precisely as we can, we use the multispectral bands out of imagery from Digital-Globe’s satellites … to automatically classify and identify vegetation and buildings so we can remove them from the scene,” said Vricon Vice President Isaac Zaworski.
While multispectral sensors are appropriate for general inquiries, super-spectral and hyperspectral sensors—like those on Landsat 8, WorldView-3, and NASA’s EO-1, whose sensors detect 11, 16, and 220 bands, respectively—are best for detailed inquiries.
“With superspectral and hyper-spectral bands you get much finer information,” remarked Navulur, who said the most valuable bands on super-spectral and hyperspectral sensors are those that measure shortwave infrared (SWIR) light, which sits above NIR light on the electromagnetic spectrum. “With shortwave infrared you can move from general—‘Is there agricul-ture?’—to be specific: ‘What type of agriculture is it? Is it coffee? Is it corn? Is it soybeans?’”
SWIR bands can also distinguish among types of trees, minerals, and building materials. They can pen-etrate smoke, smog, fog, and dust, as can another type of band common to superspectral and hyperspectral sensors: thermal infrared, which detects electro-magnetic energy from heat instead of light. Both SWIR and thermal infrared sensors can be leveraged by firefighters to find hotspots during wildfires, and thermal infrared can be used by war-fighters to track the enemy.
“With thermal infrared you can tell whether a truck or tank engine is on, whether a building is occupied, or whether an aircraft on a runway has just landed,” said Robert Zitz, vice presi-dent and strategic account executive at Leidos. It also can be used to detect heat signatures for missile defense. For example, Leidos’ Commercially Hosted Infrared Payload sensor collected more than 300 terabytes of data on more than 200 thermal events during an Air
16 | TRA JECTORYMAGAZINE.C OM ll 2016 ISSUE 4
IMAGE COURTESY OF VRICON
USGIF.ORG kk TRA JECTORY | 17
“It may hit other leaves and branches on the way down, but if there’s an opening its last return will be the ground.”
Although “single-pulse” or “linear-mode” LiDAR is the default, there are many specialized varieties of LiDAR optimized for different missions, includ-ing bathymetric LiDAR, which uses a water-piercing laser to measure water depth, and Raman LiDAR, which uses ground-based lasers to measure atmo-spheric water vapor. One of the most buzzed about LiDAR varieties, however, is Geiger-mode LiDAR. Instead of returning laser beams, it measures returns of the individual photons that constitute those beams. This approach produces more data points per square meter, consumes less power, and requires lower-intensity returns, allowing sensors to cover more ground, at faster speeds, from higher altitudes.
“The Harris Geiger-mode LiDAR system was designed for wide-area mapping,” said Stuart Blundell, director of strategy and business development at Harris Geospatial Solutions. “Whereas a linear-mode system flies at a lower altitude—typi-cally 2,000 feet on a single-airplane engine traveling around 90 miles per hour—we fly on a jet at 30,000 feet traveling at three times the speed of linear-mode systems. As a result, we’re flying up to 850 square miles
per hour, compared to 50 square miles with a linear-mode sensor.”
While a linear sensor collects just two points per square meter, Geiger-mode can collect more than 100 points per square meter.
Eventually, LiDAR sensors will behave like point-and-shoot cameras, according to Hauck, who sees technolo-gies such as Geiger-mode LiDAR, flash LiDAR, multi-band LiDAR, and photon-counting LiDAR as the future.
“Most LiDAR units don’t take a complete image at one time the way a camera does—yet,” he said. “Soon, they’ll generate lots and lots of photons of different wavelengths (i.e., colors) all at once, and measure lots and lots of returns all at once … When that happens, we’ll be able to get the shape of things and the material properties of things all in one shot, which will be very, very powerful.”
MAKING SENSE OF SENSORSIn a world growing ever more crowded with diverse remote sensing phenomenol-ogy, there’s an elephant in the room: Without the ability to leverage the data they collect, sensors are senseless.
“We’ve spent literally billions of dollars building sensors, but investment in down-stream processing and analysis of data has not kept pace,” Murdock said. “If you sim-ply build sensors, and assume someone else will figure out how to use data from them, that’s a broken paradigm.”
humanitarians target resources after a disaster.
“After the Haiti earthquake [in 2010] there was extensive LiDAR coverage to map in three dimensions the destruction and the growth of camps to help with disaster relief,” Egan said. “Using 3D data [from LiDAR] for disaster response is going to be a growth area for continued development by many, including NGA.”
By measuring the strength of laser pulses when they return to the sen-sor, LiDAR systems can also assist in material classification, as different materials—grass, for instance, versus asphalt—reflect infrared light with vary-ing intensity.
However, if you ask Dr. David Maune, associate vice president at Dewberry, LiDAR’s most important attribute is its ability to penetrate tree cover, which makes it possible to detect and map terrain that would otherwise be concealed. This capability can help seismologists discover tree-covered fault lines, surveyors classify obscured terrain, and intelligence analysts detect hidden buildings, roads, or weapons.
LiDAR can penetrate trees because every LiDAR pulse is a beam of light with a given diameter; as that beam travels through a forest, it sends multiple “returns” back to the sensor as it encoun-ters obstructions. “While part of the light beam hits a leaf on the top of the tree, the rest of it continues on,” Maune said.
“ Even if we pressed pause for a while on sensor development, there is still a ton of work to be done on advancing exploitation.” —Michael Nelson, director of intelligence and defense solutions, Riverside Research
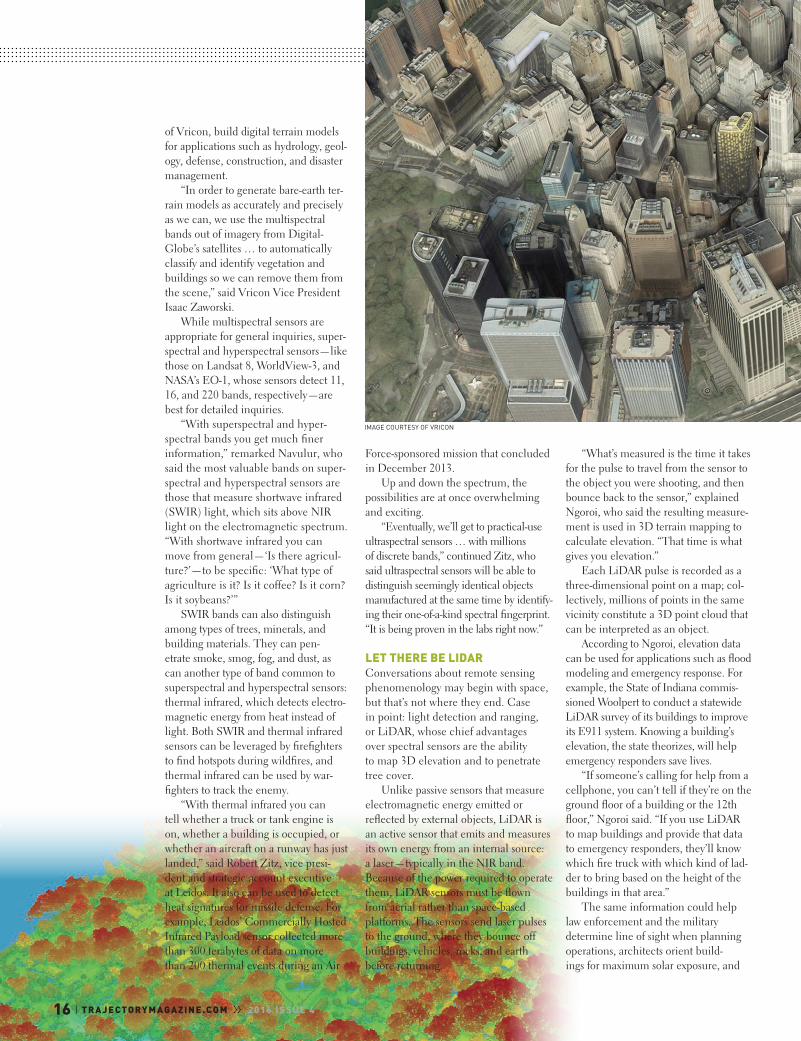
VRICON’S 3D SURFACE MODEL is a global representation of Earth, providing 0.5-meter resolution and 3-meter accuracy. This image of New York City, created without the use of ground control points, is based on archived commercial satellite imagery.

Vricon’s “The Globe in 3D” and Harris’ ENVI geo-spatial analytics software are solutions on the forefront of machine learning. To power its large-scale 3D mapping products, the former is build-ing a fully automated data processing engine capable of continuously ingesting and correlating data from virtually any available sensor. Based on the principles of stereo pho-togrammetry, Vricon’s engine extracts relevant features from disparate images, then mixes and matches them to create accurate 3D models.
“As a byproduct of the fact that we’re trying to generate the most accurate 3D representation of the static scene in any given location, our algorithms are essentially identifying anything that is changing in that entire scene,” Zaworski said.
ENVI’s image processing software automates feature extraction and change detection in much the same way. Going forward, its goal is to refine its algorithms to perform on a larger scale and at a finer resolution, according to Rebecca Lasica, enterprise sales manager for Har-ris Geospatial Solutions, which acquired ENVI in 2015. “Instead of analyzing an image, for example, we’ll be analyzing a whole country,” she said. “Likewise, we’ll be able to look not just forensically back in time, but also at trends that help us predict [future change] accurately enough to take action.”
Better algorithms and sophisticated machine learning will go a long way toward helping users tame an over-whelming amount of remote sensing data. The magic bullet that will help them fully exploit sensors’ capabilities, however, is data fusion, or multi-source integration.
“Multi-source integration is a huge area of research and application develop-ment because each type of sensor has its own strengths or weaknesses,” Nelson said. “If I have to turn off four of my five senses I am greatly restricted, but if I can use them all I’m fully functional.”
Added Lasica, “Taking different modalities and putting them together can build a picture that’s greater than
the sum of its parts. For example, a grower may have some [multispectral] imagery that reveals information about the health of their crops. But they might also be co-collecting LiDAR that gives them information about the height of those crops. Putting those data sets together allows you to cross-reference the health of a plant with the height of a plant, giving a three-dimen-sional picture about when the harvest might be ready.”
It sounds easier than it is.“Each phenomenology is different
… at the data level; combining them in a way that’s meaningful takes time and effort,” continued Nelson, adding that complementary images from disparate platforms and sensors have not only different electromagnetic characteristics, but also different geographic and tempo-ral parameters that make amalgamation difficult. “Even routine things like how to get [complementary] data sets into the same analyst’s bucket at the same time are challenging. You have to have awareness, for example, that there were four sensors that collected on a given target; then you have to get all four data sets together and make sure your analyst is appropriately trained to exploit each of those modalities.”
As sensors get smaller, more powerful, and more energy-efficient—shattering current size, weight, and power constraints—data fusion will be able to take place not only on the back end, à la Vricon and ENVI, but also on the front end. That will make multi-sensor integration easier, according to Blundell.
“The best way to register multi-sensor information is to collect it at the same time in a miniaturized fashion from multi-sensor pods,” he said.
Exactly when and how diverse remote sensing phenomenology will be fused is anyone’s guess. What’s clear, however, is that sensors will continue to mine new frontiers of physics that surpass the limits of human biology.
“This is not going to slow down,” Nelson concluded. “As platforms become easier and cheaper to launch, the prevalence of sensors in the com-mercial world is only going to accelerate. Commercial remote sensing is a growing global phenomenon.”
Turning spectral capabilities into strategic insights requires the GEOINT Community to solve several critical challenges, the first of which is data processing and exploitation.
“Even if we pressed pause for a while on sensor development, there is still a ton of work to be done on advancing exploitation,” said Michael Nelson, director of intelligence and defense solu-tions at Riverside Research.
Added Phil Downen, vice president of government programs at Urthe-Cast, “It’s widely recognized that the deluge of data from sensors is increas-ing exponentially … The tradecraft bottleneck, however, is no longer computing resources, storage resources, or downlink and backhaul. The real challenge now is the geo-analytics—the algorithms, equations, and heuris-tics that are brought to bear on an ever-increasing diversity of raw data to extract information from it.”
To that end, UrtheCast and other hosts of remote sensing data—including NGA—are divining in-house processing solutions with algorithms that can auto-matically extract features from imagery and notify analysts of temporal changes and trends, allowing them to supply cus-tomers with insights derived from pixels instead of the pixels themselves.
“We don’t have enough analysts to review all the imagery we’re going to be getting in the very near future, so one of the things we’re looking at now is how we can best use … machine learning and neural networks to make sense of all that data,” Avila said.
18 | TRA JECTORYMAGAZINE.C OM ll 2016 ISSUE 4
THIS HYPERSPECTRAL IMAGE processed with ENVI highlights geological and mineral values. ENVI can fuse multiple data modalities—radar, LiDAR, SAR, optical, hyperspectral, multispectral, stereo, thermal, and acoustic—to create geospatial products.
IMAGE COURTESY OF HARRIS
Related Documents