The Office of Highway Policy Information Highway Information Seminar September 2018

Welcome message from author
This document is posted to help you gain knowledge. Please leave a comment to let me know what you think about it! Share it to your friends and learn new things together.
Transcript
The Office of Highway Policy InformationHighway Information SeminarSeptember 2018

Office Organizational Chart
2
Motor Fuel and Highway Finance
Emiliano LopezMike DoughertyClarissa SmithBrian LomaxDawn EdwardsHelen DavidsonVacantVacant
Highway System Performance
Chris AllenRob RozyckiTom RoffRon EricksonRonald Vaughn, PMPJustin Clarke, AICPVacantSeemeen Hashem1
Travel Monitoring and Surveys
Dr. Tianjia Tang, PESteven JessbergerDanny Jenkins, PEDr. Patrick Zhang, PEVacantVacantApara Banerjee1
1 – Indicates contractor

Our Mission1) To serve as the national source of surface
transportation data.2) Provide the U.S. DOT, Congress, and transportation
community with accurate information products in a timely manner.
3) To inform the development and implementation of, and serve as the foundation for decisions, policies, legislation, programs, and performance goals.
4) Constantly strive to improve the quality, efficiency, and effectiveness of highway data collection and analysis on travelers and the physical, operational and financial condition of our transportation system.
Abo
ut th
e O
ffice
3

Our Data Programs• National Performance Management Research Data System• Highway Performance Monitoring System• National Household Travel Survey• Certified Public Road Mileage• Motor Vehicle Registration• Heavy Vehicle Use Tax• Traffic Monitoring• Weigh-in-Motion• Highway Finance• Licensed Drivers• Recovery Act• Toll Facilities• Tax Evasion• Motor Fuel
Abo
ut th
e O
ffice
4
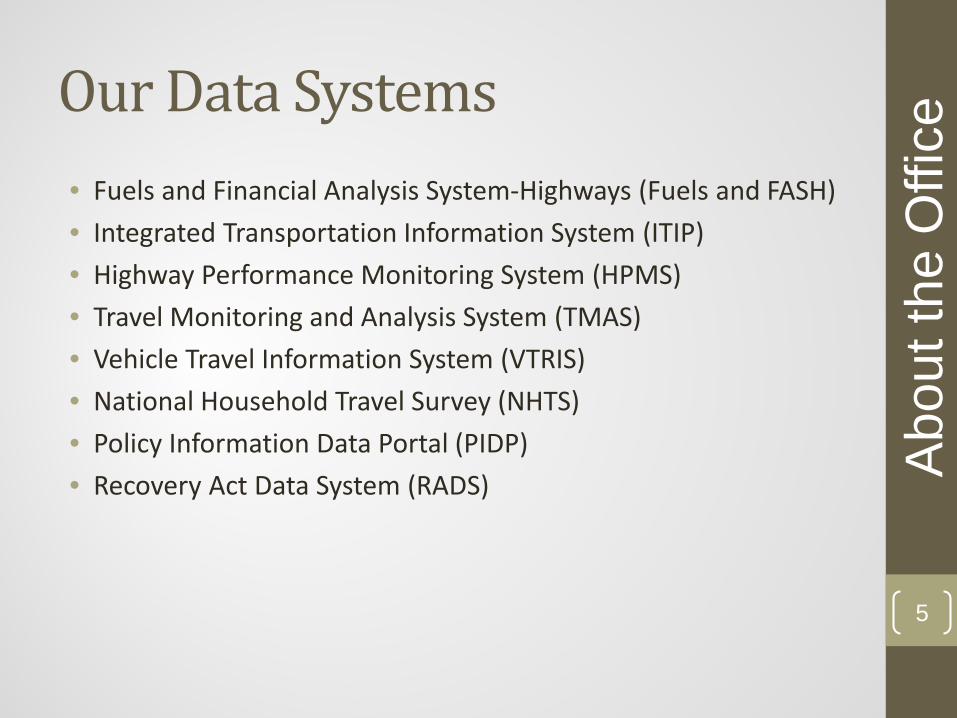
Our Data Systems• Fuels and Financial Analysis System-Highways (Fuels and FASH)• Integrated Transportation Information System (ITIP)• Highway Performance Monitoring System (HPMS)• Travel Monitoring and Analysis System (TMAS)• Vehicle Travel Information System (VTRIS)• National Household Travel Survey (NHTS)• Policy Information Data Portal (PIDP)• Recovery Act Data System (RADS) A
bout
the
Offi
ce
5

Key FHWA Business Uses• Apportionment of Federal-aid Funds• Performance Measurement• FHWA Reports• Development of new programs and initiatives• Wide variety of information products
Use
s of
Our
Dat
a
6

Apportionment• Process for Distributing Highway Trust Fund (HTF) dollars
to States• Legislated by formula• Driven by data submitted by State data providers,
specifically:• Lane-miles• Annual VMT• Highway Trust Fund contributions U
ses
of O
ur D
ata
7

Performance Measures• FHWA program offices are the “goal champions” responsible
for determining performance measures• OHPI role is to help determine availability, quality, and
suitability of existing data for use• For some measures OHPI analyzes the data• Want to avoid multiple data collections of same data • Our emphasis is “collect once, use often”
Use
s of
Our
Dat
a
8

Agency Performance Measures• Highway-Related Fatalities per 100 Million VMT• Highway-Related Injuries per 100 Million VMT• % of VMT on NHS with IRI < 170• % of STRAHNET Miles with IRI < 170• Annual Hours of Delay• Congested Travel U
ses
of O
ur D
ata
9

FHWA Reports• To Congress• To U.S. DOT• Office publications • Monthly trend reports• Special reports, briefs, and analysis
Use
s of
Our
Dat
a
10

Reports to CongressConditions & Performance Report• Extent of System• Roadway Condition• System Performance• Funding Sources
• Federal, State, Local, Other• Expenditures by:
• Improvement Type & Funding Source Use
s of
Our
Dat
a
11

Office Publications
Use
s of
Our
Dat
a
12

Monthly Reports
Use
s of
Our
Dat
a
13

Traffic Volume Trends (TVT) Report
14
Use
s of
Our
Dat
a

TVT Report• Routinely covers over 6,500 counting sites around the US.• Thanks to more states reporting on time and states continuing
to add locations.• Over 2,800 people that have subscribed to the TVT page in
GovDelivery.• All subscribers automatically get an e-mail once a new report
has been posted.• In August 2018
• 2nd highest number of hits (over 52,700)• 7th highest number of visitors (over 6,300) Of all FHWA web pages, not including FHWA home page.
• 2016 Highway Statistics 62nd w/ 1,840 visitors and 1,400 hits 15
Use
s of
Our
Dat
a

Focus on Data...• Data Quality• Open Data
• https://data.transportation.gov/• Data Dictionary• Data Visualizations
• National initiatives• Performance Measures• Safety Data• Data Quality• Data Integration
• National Data Groups• Federal Geographic Data Committee• DOT Open Data Working Group• AASHTO/SCOP Data Subcommittee• TRB Data Section
• FHWA Data Governance: https://www.fhwa.dot.gov/datagov/16
Nat
iona
l Per
spec
tive

Characteristics of Quality Data
• Accurate• Timely• Complete• Meets expectations • Consistent across States
Focu
s A
reas
17
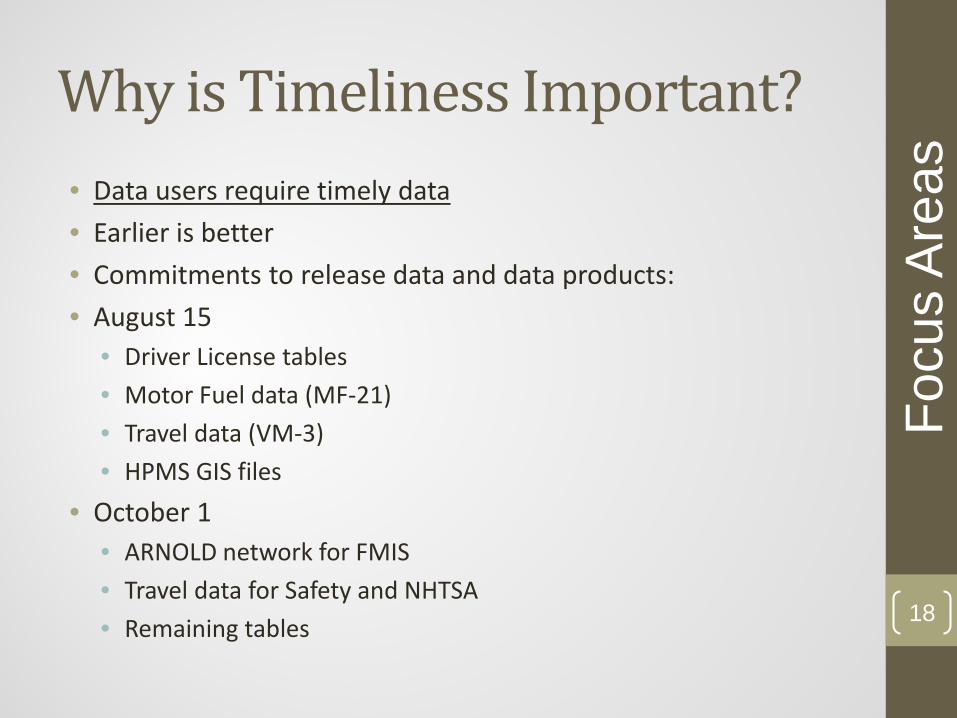
Why is Timeliness Important?• Data users require timely data• Earlier is better• Commitments to release data and data products:• August 15
• Driver License tables• Motor Fuel data (MF-21)• Travel data (VM-3)• HPMS GIS files
• October 1• ARNOLD network for FMIS• Travel data for Safety and NHTSA• Remaining tables 18
Focu
s A
reas
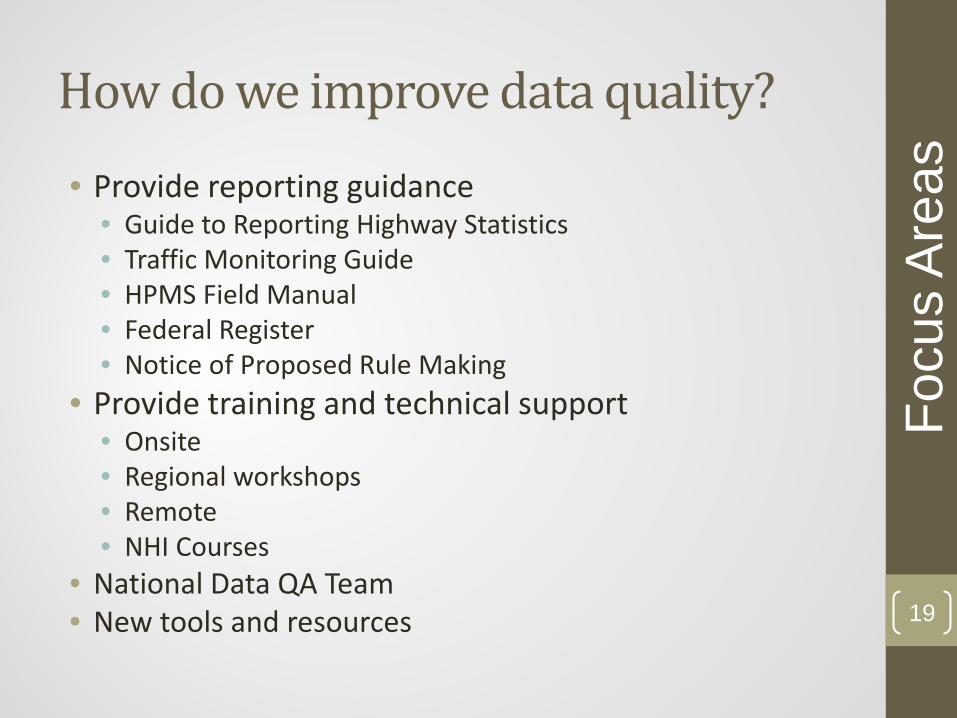
How do we improve data quality?
• Provide reporting guidance• Guide to Reporting Highway Statistics• Traffic Monitoring Guide• HPMS Field Manual• Federal Register• Notice of Proposed Rule Making
• Provide training and technical support• Onsite• Regional workshops• Remote• NHI Courses
• National Data QA Team• New tools and resources
Focu
s A
reas
19

Data Quality - HPMS Pavement Report Cards
20
Focu
s A
reas

Data Quality - HPMS Scorecard
21
Focu
s A
reas
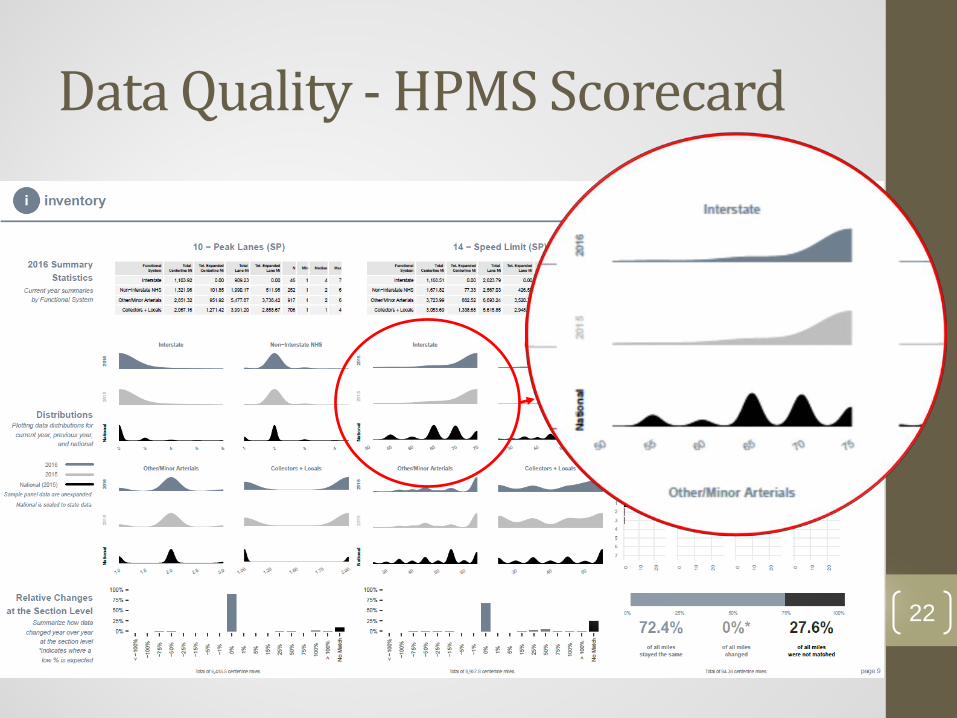
Data Quality - HPMS Scorecard
22

Data Quality - HPMS Scorecard
23
Focu
s A
reas

Data Quality - HPMS Scorecard
Focu
s A
reas
Presenter
Presentation Notes
A simultaneous look at completeness and quality. This figure shows the states in the context of the complete range for both scores, and shows that they are relatively tightly constrained.

Data Quality - HPMS Scorecard
Focu
s A
reas
Presenter
Presentation Notes
A simultaneous look at completeness and quality. This figure is labeled with the states for reference.
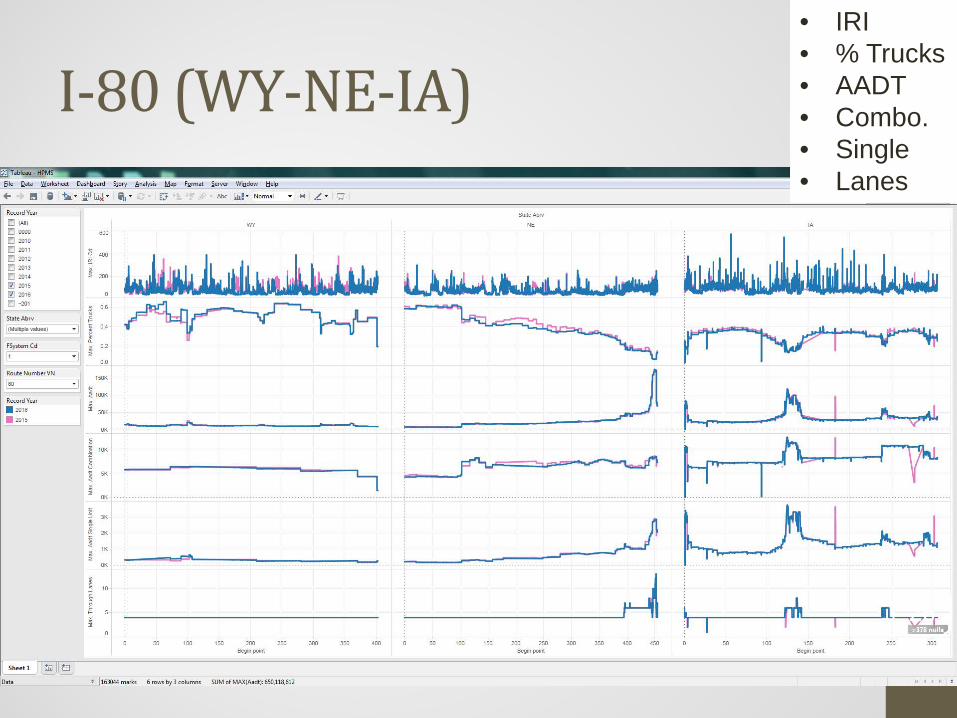
I-80 (WY-NE-IA)
26
• IRI• % Trucks• AADT• Combo.• Single• Lanes

I-10 (CA-AZ-NM-TX)
27
• IRI• % Trucks• AADT• Combo.• Single• Lanes
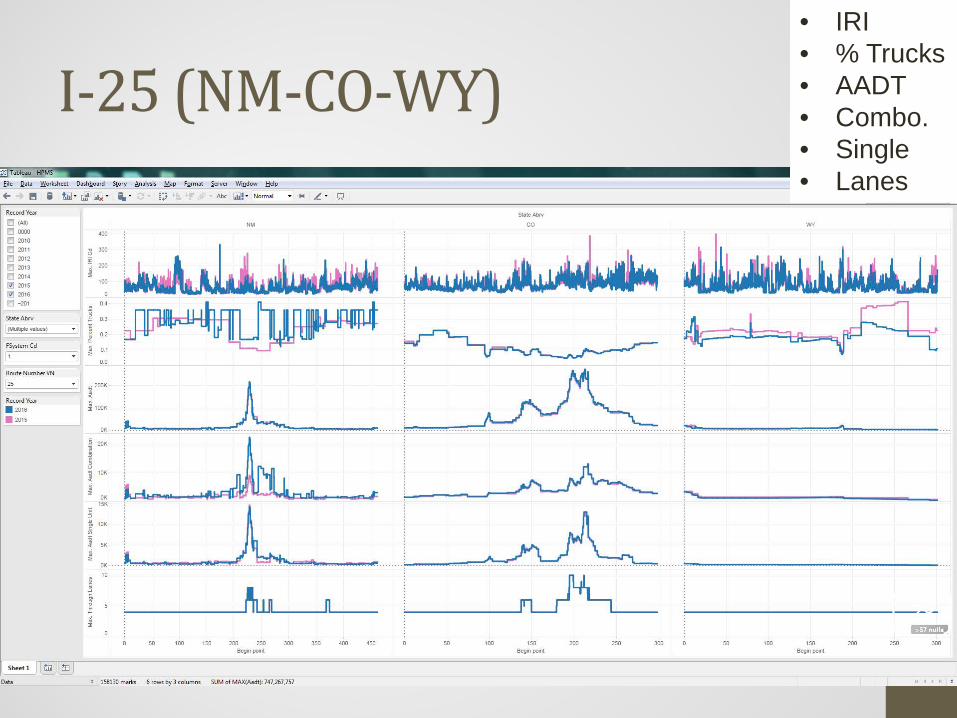
I-25 (NM-CO-WY)
28
• IRI• % Trucks• AADT• Combo.• Single• Lanes

I-95(CT-RI-MA-NH-ME)
29
• IRI• % Trucks• AADT• Combo.• Single• Lanes

Open Data• Access to:
• Data systems• Documentation• Visualizations/Analysis• Resources
• Coming soon:• Online FHWA Data Dictionary• Select data• Data visualizations
30
Focu
s A
reas

Data Dictionary
31
Focu
s A
reas

Online Data
32
Focu
s A
reas

Visualizations & Dashboards
33
Focu
s A
reas

Major Initiatives• National Household Travel Survey (NHTS)• HPMS Reassessment• Highway Finance Reassessment• Performance Management (TPM)• Safety Data Initiative (SDI)• NPMRDS• Special Tabulations
• VMT Forecasts• Transportation Analysis Framework• TMAS Data• Performance Network
• Integrated Transportation Information System (ITIP)• Policy Information Data Portal (PIDP)• Data Visualization Center (DVC)• Factoids• Knowledge Center
Focu
s A
reas
34

NHTS
Focu
s A
reas
35

Observed Speed – National Average on Rural and Urban Interstate System
36
69.6
60.363.4
53.8
0
10
20
30
40
50
60
70
Rural Posted SpeedLimit
Rural ObservedSpeed
Urban PostedSpeed Limit
Urban ObservedSpeed
Spee
d (m
ph)
Focu
s A
reas
Presenter
Presentation Notes
For rural Interstate, t(13%) lower than the speed limit. For urban Interstate, (15%) lower than the speed limit.

Observed Speed by Hour of the Day
37
45
47
49
51
53
55
57
59
61
63
12 a
m1
am2
am3
am4
am5
am6
am7
am8
am9
am10
am
11 a
m12
pm
1 pm
2 pm
3 pm
4 pm
5 pm
6 pm
7 pm
8 pm
9 pm
10 p
m11
pm
Spee
d (m
ph)
Urban, Weekday Urban, Weekend Rural, Weekday Rural, Weekend
Focu
s A
reas
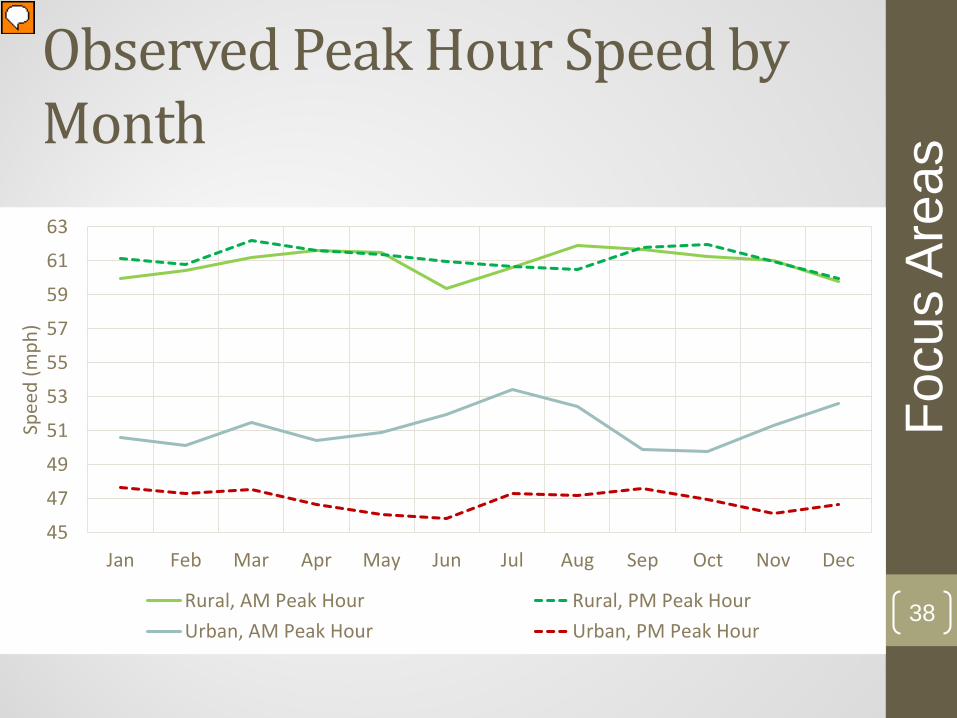
Observed Peak Hour Speed by Month
38
45
47
49
51
53
55
57
59
61
63
Jan Feb Mar Apr May Jun Jul Aug Sep Oct Nov Dec
Spee
d (m
ph)
Rural, AM Peak Hour Rural, PM Peak HourUrban, AM Peak Hour Urban, PM Peak Hour
Focu
s A
reas
Presenter
Presentation Notes
.

Annual Average Speed on Interstate during PM Peak Hour 5:00 pm – 6:00 pm
39
Focu
s A
reas

40
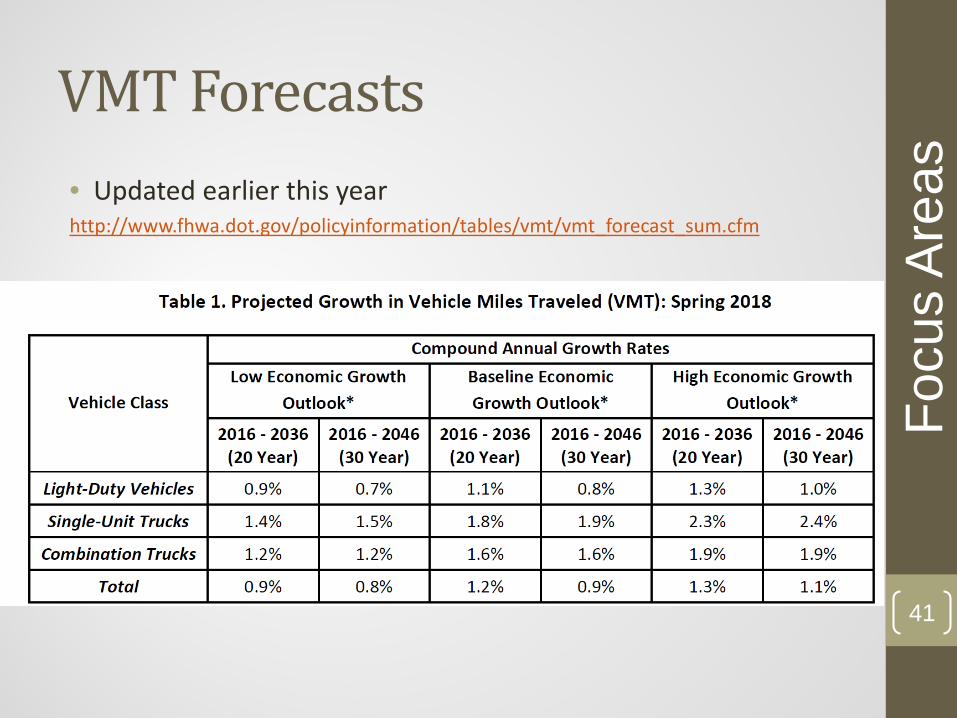
VMT Forecasts• Updated earlier this yearhttp://www.fhwa.dot.gov/policyinformation/tables/vmt/vmt_forecast_sum.cfm
41
Focu
s A
reas

Long Distance Travelhttp://www.fhwa.dot.gov/policyinformation/analysisframework/
Website includes:• Traffic Analysis Framework – Final Report• 2008 and 2040 Trip Tables for:
• Bus• Rail• Air• Auto (business)• Auto (non-business)
• Trips greater than 100 miles• County (or equivalent) to county level
42
Focu
s A
reas

Data Integration• Most FHWA data systems are moving to the MS Azure cloud• Including the FHWA data warehouse (ITIP)• Expanding integration with other FHWA and US DOT data systems• SQL Server based, includes :
• Informatica• 1Spatial• ArcGIS• Alteryx• Power BI• Tableau• R• SQL
• Forthcoming web portal for accessing, analyzing, and visualizing data• Possibly use Socrata to make data available through
data.transportation.gov website 43
Focu
s A
reas

Safety Data Initiative
• Solving for Safety Data Visualization Challenge• Rural Speed Pilot Project• Waze Data Pilot• FARS Visualization• SDI Social Media Factoids• Rural Non-Occupants Pilot
44
Focu
s A
reas

Data Visualization Center (DVC)
45
Focu
s A
reas
46
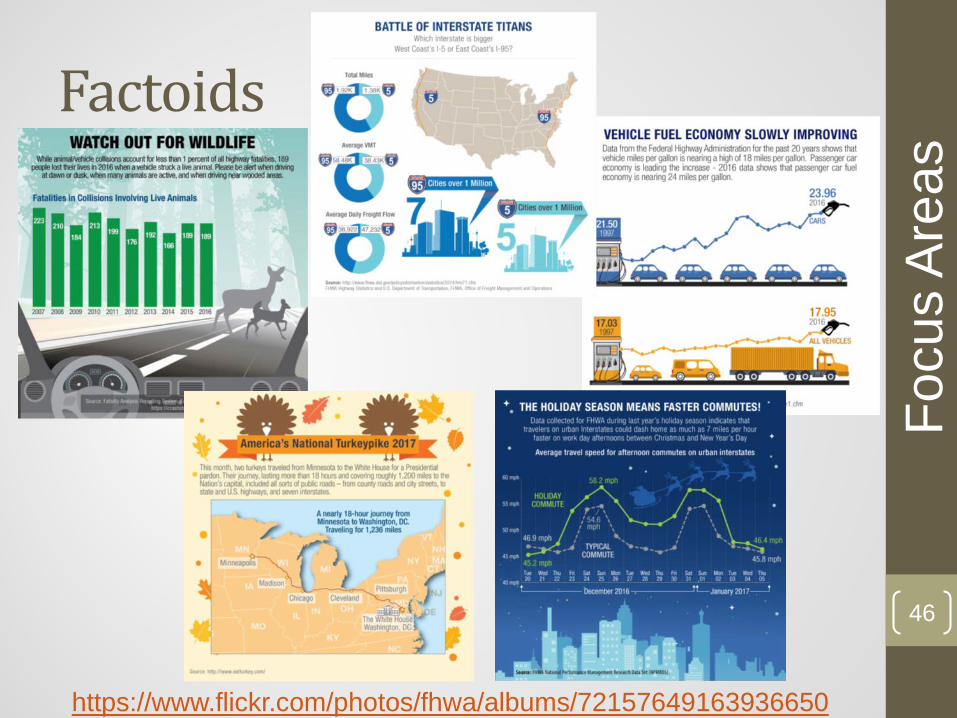
Factoids
Focu
s A
reas
https://www.flickr.com/photos/fhwa/albums/72157649163936650

Knowledge Center
http://www.fhwa.dot.gov/policyinformation/knowledgecenter/• Staff created reference and training videos
• Motor Fuel Reporting (1)• Vehicle Registrations (3)• Highway Travel (6)• Heavy Vehicle Use Tax (1)
• Coming Soon• Highway Finance• Driver Registration• HPMS• Talking Traffic
47
Focu
s A
reas

Office Websitehttp://www.fhwa.dot.gov/policyinformation/
Focu
s A
reas
48

Thank You!
49
Related Documents