The OECD Better Life Initiative: How's Life? and the Measurement of Well-being Martine Durand (OECD) Conal Smith (OECD) Paper Prepared for the IARIW Session at the 2013 World Statistics Conference Sponsored by the International Statistical Institute Hong Kong, August 26, 2013 Session 103: IARIW Session on the Measurement of Well-being Time: Monday, August 26, 15:30-17:45

Welcome message from author
This document is posted to help you gain knowledge. Please leave a comment to let me know what you think about it! Share it to your friends and learn new things together.
Transcript
The OECD Better Life Initiative: How's Life? and the
Measurement of Well-being
Martine Durand (OECD)
Conal Smith (OECD)
Paper Prepared for the IARIW Session
at the 2013 World Statistics Conference
Sponsored by the International Statistical Institute
Hong Kong, August 26, 2013
Session 103: IARIW Session on the Measurement of Well-being
Time: Monday, August 26, 15:30-17:45

Martine Durand, OECD Chief Statistician and Director of Statistics
1
THE OECD BETTER LIFE INITIATIVE: HOW’S LIFE? AND THE MEASUREMENT OF
WELL-BEING
MARTINE DURAND
OECD Chief Statistician and Director of Statistics Directorate
IARIW Session on the measurement of well-being– ISI, Hong-Kong, August 2013
Preliminary, Not to Be Quoted
Abstract
This paper presents the OECD framework for defining and measuring well-being developed as part of the
OECD Better Life Initiative launched in 2011. The first pillar of the Better Life Initiative is a report entitled
How’s Life? which measures well-being in OECD and partner countries by looking at eleven dimensions
that matter to people’s lives. These dimensions pertain to both material conditions and quality of life. The
framework also recognises the importance of considering the sustainability of current well-being, i.e. the
capacity of key assets to generate well-being over time. This framework builds on previous OECD work
and various conceptual and empirical approaches of well-being. The selection of indicators under each
dimension has relied on international standards on measurement, and has been made in consultation with
OECD experts and National Statistical Offices of OECD member countries. A distinction is made between
headline indicators, i.e. indicators that are deemed to be of sufficiently good quality which can be used for
monitoring well-being over time and across countries, and secondary indicators that provide
complementary evidence. The paper also discusses the pros and cons of various approaches for presenting
and disseminating the How’s Life? information on multidimensional well-being to different audiences --
including the OECD Better Life Index, the second pillar of the OECD Better Life Initiative, which consists
of an interactive web tool that allows users to compare countries’ performance based on their own
preferences of what matters most to them in terms of well-being. The paper ends with a discussion on
progress made in developing measures of well-being and outlines the statistical agenda ahead to improve
existing indicators and develop new ones.

Martine Durand, OECD Chief Statistician and Director of Statistics
2
Introduction
Are our lives getting better, and if they are, how do we know? How can we measure improvements in well-
being, not just economic growth? Is well-being shared fairly among different groups in society, such as the
youth and the elderly, men and women, and how can we be sure that actions to achieve better lives today
are not undermining tomorrow’s well-being? The question of how to measure well-being and societal
progress is one that the OECD has been addressing for more than a decade, resulting in the OECD Better
Life Initiative in 2011. The Better Life Initiative focuses on the aspects of life that matter to people and
that, together, shape their lives. It comprises a regularly updated set and an analysis of well-being
indicators, published in How’s Life? and an interactive web application, the Better Life Index (see below).
It also includes a number of methodological and research projects to improve the information base towards
a better understanding of well-being trends and their drivers.1
While work on well-being and progress originated in academic and policy circles, measuring well-being is
now a prominent item on the agenda of many statistical offices. This reflects the wide-spread recognition
that well-being statistics are critical for informing policy-making on a regular and systematic basis on a
range of aspects that matter to the life of ordinary people. Over the past few years, many countries have
launched their own initiatives to measure well-being (see www.wikiprogress.org for a comprehensive
rolling review of existing initiatives).
Several of these initiatives were presented at a series of OECD regional conferences and the 4th OECD
World Forum on Statistics, Knowledge and Policy that took place in New Delhi in October 2012. The large
and increasing number of such initiatives demonstrates the interest globally for indicators and analysis that
go beyond GDP. They also show a strong convergence in conceptual frameworks and indicators used (see
Annex 1).
A framework for measuring well-being
Figure 1 presents the conceptual framework used by the OECD to define and measure well-being in its
Better Life Initiative (see Box 1 for more details). The framework distinguishes between current and future
well-being. Current well-being is measured in terms of outcomes achieved in the two broad domains:
material living conditions (income and wealth, jobs and earnings, housing conditions) and quality of life
(health status, work-life balance, education and skills, social connections, civic engagement and
governance, environmental quality, personal security and life satisfaction). Future well-being is assessed
by looking at some of the key resources that drive well-being over time and that are persistently affected
by today’s actions: these drivers can be measured through indicators of different types of ‘capital’.
Building on best practices for measuring well-being and progress, the recommendations from the Stiglitz-
Sen-Fitoussi report2, as well as on consultations with international experts and with National Statistical
1 More information on these projects can be found at www.oecd.org/progress.
2 In 2008, Former French President Nicolas Sarkozy established the Commission on the Measurement of
Economic Performance and Social Progress chaired and coordinated by Professors Joseph Stiglitz,
Amartya Sen and Jean-Paul Fitoussi. In September 2009 the Commission published a report that included
around 30 recommendations on how to improve measures of well-being and progress (Stiglitz et al., 2009).
How’s Life? draws on many of these recommendations.

Martine Durand, OECD Chief Statistician and Director of Statistics
3
Offices represented in the OECD Committee on Statistics, the OECD well-being framework for measuring
current well-being has four distinctive features:
First, it focuses on people (i.e. individuals and households), their situation and how they relate to
others in the community where they live and work. Focusing on people, rather than on the
economy, is important as there may be differences between the economy-wide assessment of a
country and the well-being experiences of individuals and households.
Second, it concentrates on well-being outcomes as opposed to well-being inputs or outputs as
outcomes provide the best direct information on people’s lives. For instance it focuses on
people’s satisfaction with water rather than how much has been spent on providing clean water or
how many miles of water pipe have been laid.
Third, it considers the distribution of well-being in the population alongside average
achievements, in particular disparities across age groups, gender and individuals’ socio-economic
backgrounds.
Lastly, it looks at both objective and subjective aspects of well-being, as personal experiences
and assessments of life circumstances provide important supplementary information to more
objective measures of these circumstances.
Figure 1. The OECD well-being conceptual framework
Source: OECD (2011), How’s Life? Measuring Well-Being, OECD Publishing,

Martine Durand, OECD Chief Statistician and Director of Statistics
4
Box 1. Conceptual underpinnings of the OECD well-being framework
From a normative perspective, the OECD well-being framework builds on the capabilities approach proposed by Sen, 1985 (see also Alkire and Sarwar, 2009, Anand et al., 2009 and Anand et al., 2011). This approach is based on a multidimensional definition of well-being where both what people do, such as having a good job or expressing their political voice (their functioning) and people’s freedom to choose that functioning (their capabilities) matter. The capabilities approach differs from so-called ‘welfarist approaches’, which focus solely on well-being achievements, irrespective of the conditions under which outcomes are achieved (i.e. ignoring the set of opportunities given to each person to achieve those outcomes).
The OECD well-being framework stresses that functionings and capabilities matter to the same degree, recognising the importance of individual agency and freedom in choosing the life one wants to live. For instance the OECD framework encompasses education, health and social connections as these dimensions are instrumental to choosing a good life. According to this perspective, increasing well-being means expanding the opportunities that people have to live their life according to their objectives and values.
The OECD framework constitutes one way to operationalise the capabilities approach and make it measurable through indicators that can be collected and used by policy-makers and National Statistical Offices to monitor well-being conditions in the population and their evolution over time. Operationalising the framework means firstly, selecting a list of basic and universal functionings and capabilities and, second, identifying the specific indicators measuring each of them. In terms of functionings and capabilities, the OECD defines well-being in the domains of material living conditions and quality of life, in line with a large body of literature and research (e.g. Stiglitz et al., 2009 for a review; Sen, 1998; Nussbaum, 2011).
From a conceptual perspective, the OECD approach is similar to that developed by the UNDP for its Human Development Index (HDI). However, the OECD approach expands the scope of the HDI, as it encompasses additional dimensions to the three considered by the UNDP (i.e. income, health and education), whose focus has traditionally been on developing countries.
Source: adapted from Boarini R. and Mira D’Ercole (2013), “Going Beyond GDP: an OECD perspective”, Fiscal Studies Special Issue on Well-Being, September 2013
As mentioned above, material living conditions and quality of life are broken down into eleven dimensions,
namely: income and wealth; jobs and earnings; housing; health; work- life balance; education; social
connections; civic engagement; environmental conditions; personal security; and subjective well-being.
The rationale for selecting these dimensions is as follows:
income and wealth measure the economic resources that people can use today or in the future to
satisfy various human needs and wants and that protect against vulnerabilities and risks of
various types;
both the availability and quality of jobs are relevant for people’s well-being, not only because
quality jobs increase people’s command over resources but also because these jobs offer the
opportunity to fulfil one’s own ambitions, to develop skills and abilities, to feel useful to society
and to build self-esteem;
access to housing and the quality of housing satisfy people’s basic needs. Beyond their intrinsic
importance, they are also important determinants of health and subjective well-being, as well as
of social connections and access to jobs and public services;

Martine Durand, OECD Chief Statistician and Director of Statistics
5
physical and mental health is important in itself for people’s well-being but also for allowing
them to perform a range of personal and social activities that also contribute to their well-being;
education and skills can be seen as both a basic need and an aspiration of all humans, as well as
being instrumental to achieve many other economic and non-economic well-being outcomes;
work-life balance is important for people’s well-being in terms of family life; more generally,
the amount of time that people can devote to leisure, personal care and to other non-work
activities help individuals remain healthy and productive;
civic engagement matters, as having political voice in the society where people live allows them
to have a say in political decisions that affect their lives and to contribute to deliberations that
shape the well-being of communities; similarly, good governance is needed to translate people’s
voice into policies that support their aspirations for a good life;
social connections are valuable in themselves as many people report that the most pleasurable
activities are performed with others; but they are also instrumental to achieve a number of other
important goals such as finding a job, or support in case of need;
the quality of the natural environment where people live and work is important in its own right
but it also matters for people’s health and their ability to undertake a number of activities (e.g.
raising children, social life, etc.);
for the same reasons, living in a secure environment, i.e. where the risks of being robbed or
assaulted are low, is important to generate well-being;
Finally, besides objective aspects of living conditions and quality of life, it is crucial to consider
how people feel about their life and experience – their subjective well-being.
The eleven dimensions described above can be considered as universal, i.e. as possibly relevant to people
living in all societies. However, their relative importance will vary across individuals and countries. People
living in different countries and communities may attach varying importance to different dimensions,
reflecting their own priorities. In addition, countries may adjust this framework to better reflect the well-
being of their population (e.g. some dimensions may be merged or relabelled or complemented with
additional country-specific dimensions - e.g. Italy includes culture as one of 12 dimensions included in its
national well-being indicator BES (Benessere Equo sostenible) (www.misuredelbenessere.it/). More
importantly, the selection of indicators used to monitor achievements in these dimensions may also differ
to reflect specific country conditions, history and challenges. In other terms, the framework proposed
above is not meant to be a straitjacket for countries willing to pursue their own national initiatives in this
field. Rather it should be viewed as a framework that provides a benchmark for meaningful international
comparisons.

Martine Durand, OECD Chief Statistician and Director of Statistics
6
Selecting Indicators
The OECD well-being framework shown in Figure 1 has guided the selection of indicators. Critical criteria
considered for the selection of indicators have been the following:
they should capture well-being achievements at the individual or household level;
they should measure well-being outcomes, rather than means of achieving them;
they should allow disaggregation, so as to assess the well-being of different population groups;
and iv)
they should gauge the joint distributions of achievements, e.g. whether a person with a
disadvantage in one dimension also experiences poor outcomes in another.
The headline indicators have also been chosen so as to fulfil standard statistical requirements, such as:
face validity, i.e. they should offer an intuitive measure of the concept at hand);
focus on summary outcomes rather than to more specific components;
being amenable to change and sensitive to policy interventions; being comparable across
countries;
being commonly used and accepted as well-being measures within the statistical and academic
communities;
providing large country coverage; and
being based on data collection that are fairly frequent and timely (see OECD 2011 for more
details on these criteria).
The first edition of How’s Life? in 2011 distinguished between headline indicators, i.e. indicators that are
deemed to be of sufficiently good quality and can be used for monitoring well-being over time and across
countries, and secondary indicators that provide complementary evidence (e.g. indicators covering more
specific aspects of the dimension at hand, with more limited country coverage, or based on sources that
were deemed to be less reliable than in the case of headline indicators). In 2011, headline indicators for
each dimension included:
Income and Wealth: Household net adjusted disposable income per person; Household net
financial wealth per person
Jobs and Earnings: Employment rate; Long-term unemployment rate; Average annual earnings
per employee
Housing Conditons: Number of rooms per person; Dwellings lacking basic facilities

Martine Durand, OECD Chief Statistician and Director of Statistics
7
Health Status: Life expectancy at birth; Self-reported health status
Work-life balance: Employees working very long hours; Time devoted to leisure and personal
care
Education and Skills: Educational attainment; Students’ cognitive skills
Social Connections: Social network support
Civic Engagement and Governance: Voter turn-out; Consultation on rule-making
Environmental Quality: Air quality
Personal Security: Intentional homicides; Self-reported victimisation
Subjective Well-Being: Life satisfaction
Five new headline indicators will be included in the 2013 edition of How’s Life? (to be published in
October) to complement or improve the indicators used in 2011:
Housing costs as a measure of affordability of housing.
Education expectancy as a measure of the educational opportunities for children who are in
school today.
Satisfaction with water quality, as a measure of people’s satisfaction with one specific aspect of
the environment (i.e. water) that is not captured by the headline indicator measuring air quality.
Short job tenure as a measure of employment security and stability.
Adult competencies as a measure of the cognitive skills of the adult population.
The headline indicators used in How’s Life? meet, to different degrees, a number of quality criteria, such as
conceptual and policy relevance, quality of the underlying data, comparability of the concepts and survey
questions used, and frequency of compilation. The selection has been made in consultation with OECD
experts and National Statistical Offices of OECD countries. While the set of selected indicators represent,
in the view of the OECD, the best current available proxies for outcomes in the eleven dimensions of well-
being, these indicators do not necessarily meet all the criteria above. In particular, in those cases where
existing official data are deemed to be not fully comparable across countries, How’s Life? uses data from
non-official sources. These non-official sources have well-known limitations in terms of sample size,
sampling frames, mode of data collection, etc.; they have the advantage, however, of covering a wide range
of countries and of relying on a harmonised questionnaire applied in a large number of countries.3 The
indicators based on non-official sources have to be considered as “place holders” until better and more
3 For instance the Gallup World Poll, or the European Social Survey.

Martine Durand, OECD Chief Statistician and Director of Statistics
8
comparable official statistics in these fields are developed. Results based on these non-official data have to
be interpreted with caution.
Assessing well-being through a dashboard of indicators
The definition of well-being adopted by the OECD is multi-dimensional. Traditionally, multidimensional
concepts have been assessed either through a set of indicators (dashboard), or through a composite or
synthetic index. Composite indices are however often criticised for the loss of information that goes with
them, as well as for arbitrary assumptions in the weighting that has to be applied to the different
dimensions and their sub-elements to arrive at a single index figure (see Stiglitz et al., 2009, Fleurbaey
2009 for a review).
A further challenge with composite or synthetic indexes relates to the level at which aggregation takes
place. Synthetic indices that aggregate well-being outcomes at the individual level are conceptually better
than composites that aggregate country-level averages of well-being outcomes, as they allow to take into
account the joint distribution of outcomes at individual level (e.g. whether people at the bottom of the
income distribution also experience the lowest achievements in terms of health, skills, etc.) as well as
weights based on individuals’ preferences (see Schokkaert and Decanq 2013 for a discussion). However
this type of synthetic indexes can only be constructed if individual-level data as well as country-level data
are available from the same survey. Given the lack of such information for a majority of countries, How’s
Life’s? does not construct a composite or synthetic index but rather presents a dashboard of twenty-four
headline indicators.4
While the dashboard approach has the advantage of presenting separate information for each well-being
dimension, making possible to assess which dimensions drive the overall well-being performance of
countries, it comes with some costs, namely a more complex picture to communicate and an absence of
information on interrelations across well-being outcomes.
To address some of these limitations, How’s life? summarises the information from the 24 headline
indicators (measuring average outcomes in the population5) using a “traffic light” convention (Table 1).
Traffic lights show how countries compare on the 11 well-being dimensions. According to this approach,
the top 20% of countries are given green lights, the middle 60% are given orange lights and the bottom
20% are given red lights.
4 While the Better Life Index (BLI, see below) addresses the issue of arbitrary weights by allowing users to
create their own composite index by weighting the various dimensions according to which they consider
more important for their well-being, the BLI is not reflective of the joint distribution of outcomes at
individual level as it aggregates indicators at country level.
5 For the sake of simplicity the traffic light table is done based on the How’s Life? headline indicators for the
total population (e.g. educational attainment) or expressed on average terms (e.g. average household
income). Therefore the traffic light reflects the distribution of well-being outcomes across the population to
a very limited extent. How’s Life? presents information on the distribution of outcomes for some of the
indicators that can be broken down for specific groups of the population.

Martine Durand, OECD Chief Statistician and Director of Statistics
9
Table 1. An overview of headline well-being indicators
“Circles” denotes countries in the top two deciles, “diamonds” those in the bottom two deciles, “triangles” those in the six intermediate deciles
Source: OECD calculations
Social
connections
Subjective well-
being
Household Net
Adjusted
Disposable
Income
Household Net
Financial WealthEmployment rate Personal earnings Job Tenure
Long-term
unemployment
rate
Number of rooms
per person
Housing
expenditure
Dwellings without
basic facilities
Employees
working very long
hours
Time non workedLife expectancy at
birth
Self-reported
health
Educational
attainment
Education
expectancy
Students'cognitive
skills
Competences in
the adult
population
Social network
support
Consultation on
rule-makingVoter turn-out
Satisfaction with
water qualityAir pollution
Reported
homicides
Self-reported
victimisationLife Satisfaction
Years 2010 2010 2011 2011 2011 2011 2011 2011 2011 2011 Around 2000 2011 2011 2010 2010 2009 2009 2012 2008 Around 2011 2012 2009 2010 2010 2012
Australia
Austria
Belgium
Brazil
Canada
Chile
Czech Republic
Denmark
Estonia
Finland
France
Germany
Greece
Hungary
Iceland
Ireland
Israel
Italy
Japan
Korea
Luxembourg
Mexico
Netherlands
New Zealand
Norway
Poland
Portugal
Russian federation
Slovak Republic
Slovenia
Spain
Sweden
Switzerland
Turkey
United Kingdom
United States
Environmental quality Personal security
Material Living Conditions Quality of Life
Income and wealth Jobs and earnings Housing Work and life balance Health status Education and skills Civic engagement and governance

Martine Durand, OECD Chief Statistician and Director of Statistics
10
The traffic lights show that overall:
Switzerland, Australia, Nordic European countries, as well as Canada, New Zealand and United
Kingdom are among the top-performers.
United States, Ireland, Luxembourg, Austria, Belgium, Finland, Germany, France, Japan, Korea,
Spain, Czech Republic, Italy, Slovak Republic, Israel, Poland and Portugal display average
performance.
Turkey, Brazil, Mexico, Estonia, Hungary, Greece and Chile are among the countries with a
relatively low performance.
Well-being performance may be the result of various and often interrelated factors and in general countries
display different strengths and weaknesses in the various well-being dimensions. Countries may achieve an
equally good overall well-being performance by performing well (or not) in different dimensions, as shown
by Figure 2. For instance Australia and Canada do very well overall, yet Australia does better than Canada
in the civic engagement and governance dimension but less so in income and wealth and in work-life
balance. Similarly, Nordic European countries are champions in work- life balance and health status, but
do less well than Switzerland and Canada in terms of income and wealth. Countries with the same overall
well-being performance (i.e. with more than one third of orange lights) can also differ in terms of
performance in the various well-being dimensions. For instance, Germany appears to do better than France
in education and skills but performs less well in health.
Figure 2. Strengths and weaknesses vary across countries
Countries with high overall well-being performance
0.00
1.00
2.00
3.00
4.00
5.00
6.00
7.00
8.00
9.00
10.00
Income and wealth
Jobs and earnings
Housing
Work and life balance
Health status
Education and skillsSocial connections
Civic engagement and governance
Environmental quality
Personal security
Subjective well-being
Australia
New Zealand
United Kingdom
Canada
0.00
1.00
2.00
3.00
4.00
5.00
6.00
7.00
8.00
9.00
10.00
Income and wealth
Jobs and earnings
Housing
Work and life balance
Health status
Education and skillsSocial connections
Civic engagement and
governance
Environmental quality
Personal security
Subjective well-being
Denmark
Iceland
Norway
Sweden
Switzerland
Martine Durand, OECD Chief Statistician and Director of Statistics
11
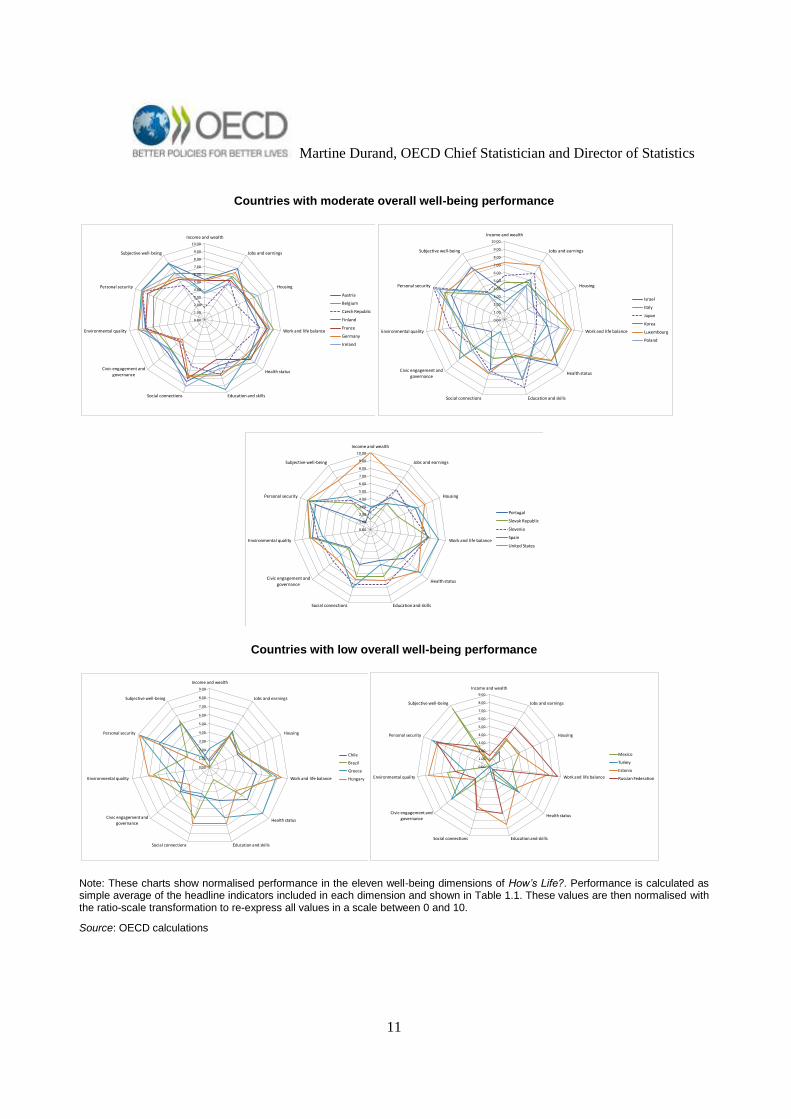
Countries with moderate overall well-being performance
Countries with low overall well-being performance
Note: These charts show normalised performance in the eleven well-being dimensions of How’s Life?. Performance is calculated as simple average of the headline indicators included in each dimension and shown in Table 1.1. These values are then normalised with the ratio-scale transformation to re-express all values in a scale between 0 and 10.
Source: OECD calculations
0.00
1.00
2.00
3.00
4.00
5.00
6.00
7.00
8.00
9.00
10.00
Income and wealth
Jobs and earnings
Housing
Work and life balance
Health status
Education and skillsSocial connections
Civic engagement and
governance
Environmental quality
Personal security
Subjective well-being
Austria
Belgium
Czech Republic
Finland
France
Germany
Ireland
0.00
1.00
2.00
3.00
4.00
5.00
6.00
7.00
8.00
9.00
10.00
Income and wealth
Jobs and earnings
Housing
Work and life balance
Health status
Education and skillsSocial connections
Civic engagement and
governance
Environmental quality
Personal security
Subjective well-being
Israel
Italy
Japan
Korea
Luxembourg
Poland
0.00
1.00
2.00
3.00
4.00
5.00
6.00
7.00
8.00
9.00
10.00
Income and wealth
Jobs and earnings
Housing
Work and life balance
Health status
Education and skillsSocial connections
Civic engagement and
governance
Environmental quality
Personal security
Subjective well-being
Portugal
Slovak Republic
Slovenia
Spain
United States
0.00
1.00
2.00
3.00
4.00
5.00
6.00
7.00
8.00
9.00
Income and wealth
Jobs and earnings
Housing
Work and life balance
Health status
Education and skillsSocial connections
Civic engagement and governance
Environmental quality
Personal security
Subjective well-being
Chile
Brazil
Greece
Hungary
0.00
1.00
2.00
3.00
4.00
5.00
6.00
7.00
8.00
9.00
Income and wealth
Jobs and earnings
Housing
Work and life balance
Health status
Education and skillsSocial connections
Civic engagement and
governance
Environmental quality
Personal security
Subjective well-being
Mexico
Turkey
Estonia
Russian Federation

Martine Durand, OECD Chief Statistician and Director of Statistics
12
Disseminating results to, and interacting with, the public: The OECD Better Life Index
The Better Life Index (BLI) has been designed to disseminate the results of How’s Life? to a wide audience
and to involve people in the discussion on well-being and, through this process, to learn what matters the
most to them. The Better Life Index (Figure 2) is an interactive tool that allows users to set their own
weights on the eleven dimension of the OECD well-being framework. The web application allows users to
see how countries’ average achievements compare based on one’s own personal priorities in life, and to
share one’s index and choices of weights with other people in their networks and with the OECD.
Figure 2. The OECD Better Life Index web application
Note: The screenshot shows the BLI visualisation. Countries are represented by flowers with eleven petals, corresponding to the eleven well-being dimensions (see Figure 1.2). Users can rate these dimensions by using the control panel in the right-hand side of the screen. When dimensions are rated, flowers change size to reflect the importance attributed by users. At the same time, countries move up (down) if they perform well or (poorly) in the dimension of well-being that users rate the highest. Source: The OECD Better
Life Index, www.betterlifeindex.org.
Since its launch in May 2011, the BLI has been visited by more than 2.5 million people from all over the
world. Around 42 000 indices have been shared with the OECD. The information gathered from these
users, shows that on average what matters most to them is life satisfaction, health and education (Figure 3).

Martine Durand, OECD Chief Statistician and Director of Statistics
13
Figure 3. Feedback from users of OECD Better Life Index, May 2013
weights
Source: The OECD Better Life Index, www.betterlifeindex.org
The How’s Life? Statistical Agenda: progress since 2011
1. An important goal of How’s Life? is to identify priorities for the statistical agenda ahead, and to
track progress over time with respect to this agenda. The first edition of How’s Life? had identified a
number of issues to tackle for developing better metrics in each of the well-being dimensions. While many
of the challenges identified in 2011 still remain, significant progress has been achieved in some of them. In
particular:
Income and wealth: In June 2013, the OECD released internationally agreed Guidelines for
producing Micro Statistics on Household Wealth, which address the common conceptual,
definitional and practical problems that countries face in producing such statistics, and aim to
improve the comparability of the currently available country data. A companion report proposes a
framework to support the Joint Analysis of Micro-Statistics on Household Income, Consumption
and Wealth as three separate but interrelated dimensions of people’s economic well-being. In
addition, an OECD-Eurostat Expert Group to measure Disparities in a National Account
framework (EG DNA) launched in 2011, recently completed an in-depth comparison of various
components of household income, consumption and wealth between micro and macro sources,
and developed a set of experimental household accounts providing information on the
6.0%
6.5%
7.0%
7.5%
8.0%
8.5%
9.0%
9.5%
10.0%
10.5%
11.0%

Martine Durand, OECD Chief Statistician and Director of Statistics
14
distribution of income, consumption and saving among types of households that are consistent
with National Accounts’ totals.
Jobs and earnings: The recent release of the ILO Manual on concepts and definitions of Decent
Work indicators (ILO, 2012) marks a significant step forward in the statistical agenda on
employment quality. The manual provides a detailed description of indicators to be developed for
monitoring the progress made in the implementation of the ILO Decent Work Agenda, as well as
methodological and practical guidelines for producing and using these indicators. Similarly, the
UNECE, in collaboration with Eurostat and the ILO, is developing operational guidelines for
measuring the various dimensions included in its framework for Measuring Quality of
Employment (UNECE, 2010). However, despite these conceptual and methodological
advancements, no internationally comparable database on employment quality exists yet. Chapter
5 describes the challenges of measuring employment quality and a number of statistical gaps in
this field. Another important initiative in the field of jobs and earnings is that undertaken by the
ILO to revise the ICLS (International Conference of Labour Statisticians) standards. This
revision, that will be completed at the end of 2013, will lead to better measures of unpaid work
and of marginal attachment to the labour force.
Health Status: The UNECE-WHO-Eurostat City taskforce on measuring health status (known as
the Budapest Initiative) and the Washington Group on disability statistics reached an agreement
on a limited set of (six) questions to measure “functioning”. This may become the basis for
international comparisons of morbidity and allow to study the links between morbidity and
broader quality of life issues. These questions have been recommended by the UN statistical
commission for use in the context of the 2020 population censuses, but implementation will have
to be promoted and monitored if they are to provide a common benchmark for comparable
measures of people’s health status. In addition, a European Health Interview Survey (EHIS) will
be carried out in 2014 in the EU: this will provide harmonised survey data at national and at EU
level on perceived health status and disability, health determinants and health care (including
unmet needs).
Education: The new Programme for the International Assessment of Adult Competencies
(PIAAC) carried out by the OECD collects a set of comparable data that will assist governments
in assessing, monitoring and analysing the level and distribution of skills among the adult
population, as well as the use of skills in different contexts. This new survey represents a major
advancement in measuring skills but also in providing together the information needed to
understand what drives their accumulation and how skills affect people’s well-being more
widely.
Work-life balance: A Task Force on Time Use Surveys was established by the Conference of
European Statisticians (CES) in November 2010, with the objective to develop guidelines and
compilations of best practices to help countries carrying out time use surveys, and to improve the
comparability of their results. These guidelines, released in June 2013, focus on areas where the
statistical community has expressed a particular need for further guidance, including: i) policy
relevance of time use surveys; ii) availability and comparability of key statistical measures of
time use; iii) periodicity of time use surveys; iv) the use of light and full-scale time use diaries;
and v) activity classification.
Martine Durand, OECD Chief Statistician and Director of Statistics
15
Environmental quality: The System of Environmental-Economic Accounts (SEEA), a joint
undertaking of an international taskforce which included the UN Statistical Division, Eurostat,
the OECD, the IMF, the World Bank and several National Statistical Offices, has been endorsed
as International Statistical Standards by the United Nations Statistical Commission in 2012.
SEEA proposes a systemic approach to account for the linkages between the environment and the
economy, and for addressing some of the socioeconomic aspects of this relationship.6
Subjective well-being: In March 2013, the OECD released a set of Guidelines on Measuring
Subjective Well-Being. The Guidelines provide recommendations on collecting, publishing, and
analysing subjective well-being data. The Guidelines also outline how measures of subjective
well-being can be relevant for policy-making, and why national statistical agencies have a critical
role to play in enhancing the usefulness of existing measures. The Guidelines also include
prototype survey modules on subjective well-being that national and international agencies can
use in their households surveys. Also in 2013 an ad-hoc module of the EU-SILC (EU Statistics
on Living Conditions and Income) on subjective well-being was carried out on the topic of
subjective-well-being in the EU: this will provide harmonised survey data at EU level and at EU
country national level (and for most countries also at sub-national level) on a number of
subjective variables related to overall life experience. These subjective well-being variables will
be collected at the same time than an information on governance and basic rights, material living
conditions, mental health, productive and values activities, leisure and social interactions, natural
and living environment, economic and physical safety, making it possible to study the joint
distribution of achievements in all these various dimensions.
Conclusions
2. This paper has presented the OECD well-being framework that underpins the Better Life
Initiative, noting the consultation with OECD countries and international experts in designing it. The paper
has also introduced the well-being indicators, highlighting the criteria behind their selection and how they
will evolve over time. The indicators are presented in the form of “traffic lights” that summarise countries’
overall well-being performance, as measured by the How’s Life? headline indicators. In conclusion, the
chapter has discussed the statistical advancements made on measuring well-being since the previous
edition of How’s Life? in 2011. Significant progress has been made especially in the areas of income and
wealth, education, environmental quality of life and subjective well-being. In these areas, efforts should be
sustained over time, especially as regards the implementation of the new measurement frameworks that
ought to translate into a systematic collection of comparable metrics. In the other well-being areas, many
statistical challenges still remain.
6 The SEEA central framework incorporates four set of accounts: i) flow accounts; ii) stock accounts; iii)
activity/purpose accounts; and iv) accounts that adjust the SNA economic accounts to reflect the impact of
economic activity on environment. Also see Chapter 6 on Measuring the Sustainability of Well-being.

Martine Durand, OECD Chief Statistician and Director of Statistics
16
ANNEX 1. RECENT NATIONAL INITIATIVES ON MEASURING WELL-BEING AND
PROGRESS
While work on well-being and progress originated in academic or policy circles (e.g. Club de Rome,
the OECD Global Project, etc.), the notion of well-being is now prominent on the agenda of many National
Statistical Offices (NSOs). Selected recent projects undertaken by NSOs or governments include:
Australia: The Australian Bureau of Statistics (ABS) published its first Measures of Australia's
Progress (MAP) in 2002, with updates in 2010 and 2012. In 2011, ABS carried out an extensive
community consultation (MAP 2.0) to improve MAP. This consultation involved individuals,
community leaders and experts to provide guidance on the goals and aspirations of Australians.
The feedback collected through a series of conferences, web-consultations and panels exposed
some of the gaps in the picture provided by the indicators previously used in the MAP initiative,
and led to the identification of “governance” as a new domain of progress. The outcomes of this
consultation have subsequently been used by ABS to improve the statistical framework used to
measure progress and the refreshed MAP will be released in November 2013.
Austria: In 2012, Statistik Austria launched a new dataset (How’s Austria?) comprising 30
headline indicators in three areas: material wealth, quality of life and environmental
sustainability. In the same year, the Ministry of Economy together with the Austrian Research
Institute WIFO published a study (Mehr als Wachstum, “More than Growth”), which
complemented the OECD How’s Life indicators set with additional indicators on domains
indentified as especially relevant by Austrian people. In interviews, Austrians were asked to rate
the importance of indicators and dimensions for their own well-being, with the indicators
aggregated accordingly to derive a composite index of Austrian well-being.
France: Since the publication of the Stiglitz-Sen-Fitoussi Report, the French National Statistical
Office (Institut national de la statistique et des études économiques, INSEE) has introduced
quality of life variables in existing household surveys and has introduced a specific multi-modal
survey on quality of life. This survey enabled, for the first time, joint measurement of all the
objective and subjective quality of life dimensions recommended in the Stiglitz-Sen-Fitoussi
Report (Stiglitz et al., 2009).
Italy: In 2011 the Italian National Statistical Office (Istituto nazionale di statistica, ISTAT) and
the National Council on the Economy and Labour (CNEL) established a joint “Steering Group on
the Measurement of Progress in Italian Society”, including representatives from firms, trade
unions and civil society. The Group developed a multi-dimensional framework for measuring
“equitable and sustainable well-being” (BES - benessere equo e sostenibile), building on an open
consultation with experts, the civil society and citizens (through surveys and on-line) to indentify
the dimensions of well-being that are most relevant for the Italian society. The Group published
its report in 2013 and indicators will be systematically updated by ISTAT.

Martine Durand, OECD Chief Statistician and Director of Statistics
17
Mexico: the national statistical office of Mexico (Instituto Nacional de Estadística Geografía e
Informática, INEGI) has developed better well-being statistics in three ways. First, by promoting
discussions on the subject through seminars and conferences organised with many regional
partners. Second, by including new questions on subjective well-being in a range of existing
surveys (household income and expenditure survey, time use survey, consumer confidence and
public perception survey). Third, by promoting the use of the new set of well-being indicators in
policy-making.
Portugal: Statistics Portugal (Instituto Nacional de Estatistica) has recently started to develop a
well-being index which will be released at the end of 2013. Since 2012 Statistics Portugal is also
updating annually its 80 Sustainable Development Indicators.
United Kingdom: in 2010 the UK Prime Minister invited the National Statistician to run a
‘National Debate’ asking citizens “What matters?”. This initiative was run by the Office of
National Statistics’ (ONS) Measuring National Well-Being programme, which included setting
up online and offline platforms to interact with people and organisations on the questions that
could help measure the country’s progress. More than 34,000 contributions were made, with
initial findings from the national debate and consultation published in June 2011. In July 2012 the
ONS released the first annual subjective well-being estimates and a revised set of domains and
measures. In November 2012 the first annual report on 'Life in the UK - 2012' and the national
well-being 'wheel' which included the well-being indicators were published. The ONS measures
of national well-being combined with the Department for Environment, Food and Rural Affairs
(DEFRA) Sustainable Development Indicators show what UK citizens value as a nation and the
type of society they want to pass on to future generations. Scotland Performs measures and
reports on progress of government in Scotland in creating a more successful country, with
opportunities for all to flourish through increasing sustainable economic growth. Scotland
Performs offers accountability based on national priorities set out in the National Performance
Framework.
Many international initiatives have also been carried out at international level, for instance:
At European level, the European Statistical System Committee (ESSC) has established a
Sponsorship Group on Measuring Progress, Well-being and Sustainable Development that
follows up on the recommendations from the “GDP and Beyond Communications” and the
Stiglitz-Sen-Fitoussi Commission report. Building on some of the recommendations of the
Sponsorship, the ESSC has further developed a set of Quality of Life (QoL) indicators for the
EU. The indicators are seen as a first attempt in combining data from several sources for
measuring Quality of Life in the EU and will be refined and complemented with additional
indicators, as results from new ad-hoc modules in existing surveys become available (e.g. the
module on subjective well-being in the EU-SILC 2013) and further methodological work is
developed7.
7 For European countries see also http://epp.eurostat.ec.europa.eu/portal/page/portal/quality_life/links#5
Martine Durand, OECD Chief Statistician and Director of Statistics
18
At the European Level the EU’s Europe 2020 Strategy also establishes a number of targets
for jobs and smart, sustainable and inclusive growth. These indicators are supported by
specific headline indicators that allow monitoring progress in the strategy targets.
WHO/Euro has created an expert group on measurement and target-setting for well-being in
Europe. Its overarching aim is to provide advice on how to assist in setting targets on well-
being, as a part of the overarching targets of the European Health 2020 policy.
Sources: Australian Bureau of Statistics, Measure of Progress Summary Indicators, /www.abs.gov.au/AUSSTATS/[email protected]/mf/1370.0.55.001?opendocument#from-banner=LN; The French National Statistical Office (Institut national de la statistique et des études économiques) (INSEE): http://www.insee.fr/fr/themes/document.asp?ref_id=ip1428; Stasistik Austria, Statistics Austria, http://www.statistik.at/, How’s Austria?, http://www.statistik.at/web_en/statistics/hows_austria/index.html, Italian National Statistical Office (l'Istituto nazionale di statistica) (ISTAT) and the National Council on the Economy and Labour (CNEL), Steering Group on the Measurement of Progress in Italian Society, http://en.istat.it/salastampa/comunicati/non_calendario/20101227_00/Cnel_EN.pdf; Office of National Statistics, United Kingdom, Measuring National Well-being programme, www.ons.gov.uk/ons/guide-method/user-guidance/well-being/publications/measuring-what-matters--national-statistician-s-reflections-on-the-national-debate-on-measuring-national-well-being.pdf; National statistical office of Mexico (Instituto Nacional de Estadística Geografía e Informática) (INEGI) http://www.inegi.org.mx/ ; Statistics Portugal (Instituto Nacional de Estatistica) http://www.ine.pt/xportal/xmain?xpid=INE&xpgid=ine_main , European Statistical System Committee (ESSC) European Commission, Beyond GDP,. Measuring Progress and true wealth, and the well-being of nations, www.beyond-gdp.eu/, accessed 22 July 2013; Eurostat, Quality of Life Indicators, http://epp.eurostat.ec.europa.eu/portal/page/portal/quality_life/introduction\, accessed 22 July 2013; World Health Organization, Europe, Measurement of and target-setting for well-being: an initiative by the WHO Regional Office for Europe www.euro.who.int/en/what-we-publish/abstracts/measurement-of-and-target-setting-for-well-being-an-initiative-by-the-who-regional-office-for-europe, accessed 22 July 2013.
Martine Durand, OECD Chief Statistician and Director of Statistics
19
REFERENCES
Alkire S. and M.B. Sarwar (2009), “Multidimensional measures of poverty and well-being” Oxford
Poverty and Human Development Initiative, Oxford Dept of International Development,
University of Oxford
Anand P., M. Durand and J. Heckman (2011) “The Measurement of Progress – some achievements and
challenges”, Journal of the Royal Statistical Societies, Vol. 174, pp. 851-855
Anand P., G. Hunter, I. Carter, K. Dowding, F. Guala and M. van Hees (2009) “The development of
capability indicators”, Journal of Human Development Capabilities, number 10, pp. 125-152
BES (Benessere Equo sostenible), www.misuredelbenessere.it/index.php?id=38,
Boarini R. and Mira D’Ercole (2013), “Going Beyond GDP: an OECD perspective”, Fiscal Studies Special
Issue on Well-Being, September 2013
European Commission, Beyond GDP,. Measuring Progress and true wealth, and the well-being of nations,
www.beyond-gdp.eu/, accessed 22 July 2013.
Official Journal of the European Union, Commission Regulation (EU) No 62/2012 of 24 January 2012 ,
implementing Regulation (EC) No 1177/2003 of the European Parliament and of the Council
concerning Community statistics on income and living conditions (EU-SILC) as regards the 2013
list of target secondary variables on well-being, http://eur-
lex.europa.eu/LexUriServ/LexUriServ.do?uri=OJ:L:2012:022:0009:0015:EN:PDF
Eurostat, Quality of Life Indicators,
http://epp.eurostat.ec.europa.eu/portal/page/portal/quality_life/introduction\, accessed 22 July 2013.
Fleurbaey M. (2009), “Beyond GDP – The Quest for a Measure of Social Welfare”, Journal of Economic
Literature, 47 (4)
Fleurbaey M. (2006), “Capabilities, Functionings and Refined Functionings”, Journal of Human
Development, 7/3, pp. 299-310
ISTAT (L'Istituto nazionale di statistica) (Italian National Statistical Office) Steering Group on the
Measurement of Progress in Italian Society,
http://en.istat.it/salastampa/comunicati/non_calendario/20101227_00/Cnel_EN.pdf.

Martine Durand, OECD Chief Statistician and Director of Statistics
20
Nussbaum M., (2011), Creating Capabilities. The Human Development Approach, Harvard University
Press
OECD (2013), OECD Framework for Statistics on the Distribution of Household Income, Consumption
and Wealth, OECD Publishing.
OECD (2013), OECD Guidelines for Micro Statistics on Household Wealth, OECD Publishing.
(OECD(2012), 4th OECD World Forum on Statistics, Knowledge and Policy: Measuring Well-Being for
Development and Policy Making, Highlights and conclusions,
/www.oecd.org/site/worldforumindia/OECD-World-Forum-2012-India-proceedings.pdf
OECD (2011), How’s Life? Measuring Well-Being, OECD Publishing.
OECD (2013), How’s Life? Measuring Well-Being, OECD Publishing, forthcoming
OECD (2009), Doing Better for Children, OECD Publishing.
Sen, A. (1998), Development as Freedom, Oxford University Press, Oxford.
Sen A. (1985), Commodities and capabilities,: North-Holland Publishing, Amsterdam
Schokkaert E. and K. Decanq (2013), “Beyond GDP: Measuring Progress in Europe”,
www.kuleuven.be/euroforum/viewpic.php?LAN=E&TABLE=DOCS&ID=857
Stiglitz , J. E., A. Sen and J-P. Fitoussi (2009), Mismeasuring Our Lives: Why GDP Doesn’t Add Up, the
report by the Commission on the Measurement of Economic Performance and Social Progress, The
New Press.
Related Documents