THE NUTRITIONAL DEMANDS OF EGG PRODUCTION IN FEMALE ZEBRA FINCHES (TAENIOPYGIA GUTTATA) By David William Donnaii Thesis for degree of PhD University of Glasgow, September, 1993 Department of Zoology University of Glasgow Glasgow G12 8QQ

Welcome message from author
This document is posted to help you gain knowledge. Please leave a comment to let me know what you think about it! Share it to your friends and learn new things together.
Transcript
THE NUTRITIONAL DEMANDS OF EGG PRODUCTION IN FEMALE ZEBRA FINCHES (TAENIOPYGIA GUTTATA)
By
David William Donnaii
Thesis for degree of PhD University of Glasgow, September, 1993
Department of Zoology University of Glasgow Glasgow G12 8QQ
ProQuest Number: 13834028
All rights reserved
INFORMATION TO ALL USERS The quality of this reproduction is dependent upon the quality of the copy submitted.
In the unlikely event that the author did not send a com p le te manuscript and there are missing pages, these will be noted. Also, if material had to be removed,
a note will indicate the deletion.
uestProQuest 13834028
Published by ProQuest LLC(2019). Copyright of the Dissertation is held by the Author.
All rights reserved.This work is protected against unauthorized copying under Title 17, United States C ode
Microform Edition © ProQuest LLC.
ProQuest LLC.789 East Eisenhower Parkway
P.O. Box 1346 Ann Arbor, Ml 48106- 1346

GLASGOW T UNIVERSITY Ilib r a r y 1
SUMMARY
Egg production is a demanding process for female birds. A number of studies have shown
that body condition declines during breeding and reserves of lipid and protein are depleted.
The aims of this study were to measure the relative contributions of exogenous and
endogenous nutrients to the formation of eggs by captive female Zebra Finches and to
investigate the transfer of material from the body reserves to the developing eggs.
Analysis of eggs revealed that there was little change in egg size or composition between
the eggs of a clutch. On average the eggs contain 58.3mg of lipid, 134.8mg of protein and
17.8mg of calcium. The amino acid composition of egg proteins was similar to that in
domestic hens. The mean clutch size for the colony was 5.2 ± 0.9 eggs. The onset of
ovarian development was detected at around Day -4 of the laying cycle (ovulation of first
egg on Day 0). Similarly, the oviduct grows rapidly from Day -4 to Day -1, then it declines
in weight as the clutch is laid. Taking the above information into account the investment of
protein and lipid in the clutch was calculated. Demand for egg nutrients increases rapidly
from Day -4. Peak protein demand occurs on Day 1 of the cycle and for lipid on Day 0,
after this demand gradually falls as the eggs are laid.
The consumption and the nutritional value of seed was measured during the period of egg
formation in an attempt to estimate the use of exogenous nutrients. There was no
measurable increase in seed consumption by breeding pairs of Zebra Finches from day to
day of the laying cycle. However, a marked increase in the consumption of cuttlefish bone
was recorded. Comparing the composition of a clutch of five eggs and the food consumed
at the time of their formation it was clear that the diet could not meet demand for egg
protein or amino acids. There is a possibility that during egg formation there is an increase
in digestive efficiency to liberate more nutrients from the diet. However, this would lead to
relatively little protein becoming available. In terms of energy available the diet could go
some way towards satisfying demands for lipid. Calcium for the eggshells could be
supplied from the diet alone.
The body reserves of protein and lipid were investigated during the period of egg
formation. The lean dry weight and lipid of the pectoral muscle, ovary, oviduct and total
carcass was measured, together with the dry weight of the leg muscles, heart, liver, gut and
gizzard. There was a decline in the lean dry weight of the pectoral muscles equivalent to
15% of the protein in a five-egg clutch. The total carcass lean dry weight declined also by
an amount equal to 76.8% of the protein in a five-egg clutch. The timing of this decline
closely matched the demand for egg protein. Other organs, except the heart, followed a
similar pattern of decline across the laying period.
There is a decline in body lipid by 61% of the amount found in females at the start of the
laying cycle. This amounts to much more than the lipid content of a clutch of five eggs. The
bulk of this lipid is lost from lipid depots. Intramuscular lipid declines but the amount
involved is relatively insignificant.
Ash weight of the carcass showed no significant change and the calcium content of the ash
was the same in post and pre-breeding females.
In considering the budgeting of nutrients for the eggs;
Body reserves of protein decline by an amount equivalent to 74.6% of the total reproductive
requirement (eggs plus oviduct). If there is an increase in digestive efficiency of the order
seen in a previous study then up to 15.2% of protein could come from the diet. The
remainder could be made available by a decrease in female activity that would free protein
from metabolism for reproduction.
It is possible that the diet can make a significant contribution to lipid needed for the eggs. In
addition, the body reserves of lipid fall by an amount much greater than that found in the
eggs. This surplus of lipid indicates that as well providing for the eggs themselves the lipid
reserves may act as an energetic buffer to offset the extra demands of egg production.
Calcium is likely to be obtained entirely from the diet. There was no evidence to suggest
reserves were used.
The pectoral muscle was investigated in more detail. Direct measurement of the protein
content of sarcoplasmic and myofibrillar fractions of muscle revealed a similar pattern of
decline in both fractions to that seen in lean dry weight. Also, the total amount of measured
protein lost by the pectoral muscle was close to the loss of lean dry weight, indicating that
lean dry weight is a good indirect measure of protein in muscle. Gel filtration analysis of
the sarcoplasmic fraction revealed three proteins, two of which were tentatively identified
as myoglobin and haemoglobin. The remainder, of high molecular weight appeared to be
responsible for the bulk of the decline in sarcoplasmic protein.
Isotope labelled methionine was used to provide evidence that protein from the body
reserves is transferred directly to the developing eggs. There was a significant difference in
the isotope content of the pectoral muscle and oviduct between breeding and non-breeding
females suggesting a higher turn-over of protein in the breeding birds. Secondly, isotope
was detected in the eggs. Protein demand is highest while the first eggs of the clutch are
being formed. As the clutch progresses the demand for protein diminishes and this is
reflected in the distribution of the isotope through the clutch. There was more isotope in the
eggs at the beginning of the clutch than those laid last. Also, at the start of the clutch,
protein from the reserves seems to be of most importance to the yolk and at the end of the
clutch to the albumen.

DECLARATION
I declare that the work presented in this dissertation has been completed by myself unless
otherwise acknowledged in the text.
David W Donnan
21 September 1993
ACKNOWLEDGEMENTS
I would like to thank my supervisor, Dr David C Houston, for the help and guidance he has given me and, above all, for the patience and understanding he has shown while waiting for the completion of this thesis. Many thanks are due to Dr Ian D Hamilton for providing much welcome advice and assistance with the biochemistry. Also to Jim Jardine for the amino acid analysis.
Thanks are also due to the technical staff in the Zoology Department for a great deal of assistance in the lab and for looking after the finches. Mrs Liz Denton provided assistance with and access to the Apple Mac for creating the figures.
It has been a great pleasure to work alongside my fellow post-graduates at the Zoology Dept including Jayne Tiemey, Gwenda Hughes, Nigel Barton, Chris Thomas, Graham Austin, John Uttley, Wylie Horn, Paul Walton, Phil Smith. In particular I would like to thank Mark Bolton for advice and discussion at several stages of the project.
My parents and my wife's parents have provided a great deal of support and care over the last few years and it has been very much appreciated.
Finally, the two people who have suffered most from my continual absence and preoccupation are my wife, Audrey, and my son Mark. Without them I could not have completed this thesis and I would like to dedicate it to them both. Thank you.
v
CONTENTSPAGE
Summary......................................................................................................................... iDeclaration....................................................................................................................ivAcknowledgements........................................................................................................vContents.........................................................................................................................vi
CHAPTER 1 - General Introduction.............................................................................1Table 1.1................................................................................................7
CHAPTER 2 - Nutritional investment in the eggs of female Zebra Finches
2.1 Introduction..................................................................................................8
2.2 Materials and Methods...............................................................................11
2.2.1 Analysis of eggs..................................................................................112.2.2 Amino acid analysis of eggs...............................................................122.2.3 Calcium content of shell.....................................................................122.2.4 Ovary and Oviduct Development.......................................................13
2.3 Results........................................................................................................ 14
2.3.1 Analysis of eggs..................................................................................142.3.2 Calcium content of shell.....................................................................142.3.3 Amino acid analysis of eggs...............................................................152.3.4 Ovarian follicle growth.......................................................................152.3.5 Lipid and protein content of ovary.....................................................162.3.6 Lipid and protein content of oviduct..................................................172.3.7 Nutritional investment in a five-egg clutch........................................17Tables 2.1 to 2.5........................................................................................... 19Figures 2.1 to 2.5..........................................................................................24
2.4 Discussion..................................................................................................29
2.4.1 Analysis of eggs..................................................................................292.4.2 Development of the ovary..................................................................302.4.3 Development of the oviduct................................................................312.4.4 Nutritional investment in a five-egg clutch....................................... 32
CHAPTER 3 - Lipid, protein and calcium consumption of Zebra Finches during breeding
3.1 Introduction.............................................................................................. 33
3.2 Materials and Methods. 35
3.2.1 Comparison of food intake by males and females............................ 353.2.2 Comparison of food intake by breeding and
non-breeding pairs.............................................................................. 363.2.3 Nutritional value of seed and cuttlefish bone...................................363.2.3.1 Lipid content of seed....................................................................... 363.2.3.2 Protein content of seed.................................................................... 373.2.3.3 Amino acid analysis of panicum millet..........................................383.2.3.4 Calcium content of panicum millet and cuttlefish
bone................................................................................................ 38
3.3 Results........................................................................................................40
3.3.1 Comparison of food intake by males and females............................403.3.2 Comparison of food intake by breeding and
non-breeding pairs...............................................................................403.3.3 Loss of weight from cuttlefish bone.................................................. 413.3.4 Nutritional value of seed and cuttlefish bone....................................413.3.4.1 Lipid and protein content of seed................................................... 413.3.4.2 Amino acid analysis of panicum millet.......................................... 423.3.4.3 Calcium content of panicum millet and cuttlefish
bone................................................................................................. 42Tables 3.1 to 3.3...........................................................................................43Figures 3.1 to 3.5..........................................................................................46
3.4 Discussion..................................................................................................51
3.4.1 Food intake of males and females..................................................... 513.4.2 Food intake of breeding and non-breeding pairs............................... 513.4.3 Nutritional value of seed and cuttlefish bone.................................... 53Tables 3.4 to 3.5........................................................................................... 58
CHAPTER 4 - Changes in body lipid, protein and calcium content of female Zebra Finches during breeding.
4.1 Introduction................................................................................................60
4.2 Materials and Methods.............................................................................. 62
4.2.1 Dissection procedure........................................................................... 624.2.2 Lean dry weight and lipid content of pectoral
muscles................................................................................................ 634.2.3 Lean dry weight and lipid content of carcass.....................................634.2.4 Ash weight and calcium content of carcass........................................64
4.3 Results....................................................................................................... 65
4.3.1 Changes in pectoral muscle condition during eggformation............................................................................................. 65
4.3.2 Lean dry weight of carcass................................................................. 674.3.3 Dry weights of organs..........................................................................674.3.4 Ash weight and calcium content of carcass........................................ 684.3.5 Lipid content of pectoral muscles and carcass................................... 68Figures 4.1 to 4.12.........................................................................................70
4.4 Discussion................................................................................................88
4.4.1 Changes in body reserves: Protein...................................................... 884.4.2 Changes in body reserves: Lipid........................................................ 904.4.3 Changes in body reserves: Calcium.................................................... 914.4.4 The budgeting of endogenous and exogenous
nutrients during egg production.......................................................... 914.4.4.1 Lipid..................................................................................................924.4.4.2 Protein...............................................................................................93
CHAPTER 5 - Changes in lipid and protein content of the pectoral flight muscles of female Zebra Finches during breeding.
5.1 Introduction................................................................................................96
5.2 Materials and methods...............................................................................98
5.2.1 Collection of material for analysis...................................................... 985.2.2 Analysis of pectoral muscle tissue...................................................... 985.2.3 Analysis of the water soluble extract of pectoral
muscle by gel filtration........................................................................995.2.4 Protein content of water and alkali soluble
extracts of pectoral muscle.................................................................100
5.3 Results...................................................................................................... 101
5.3.1 Protein content of the water soluble and alkalisoluble extracts of pectoral muscle....................................................101
5.3.2 Gel filtration analysis of water soluble extractof pectoral muscle..............................................................................103
Figures 5.1 to 5.7......................................... 105
5.4 Discussion................................................................................................ 115
5.4.1 Loss of protein from water soluble and alkalisoluble extracts of pectoral muscle....................................................115
5.4.2 Gel filtration of the water soluble extract ofpectoral muscle................................................................................... 116
5.4.3 Conclusion......................................................................................... 117
CHAPTER 6 - The transfer of isotope labelled material from body tissue to the developing eggs of breeding female Zebra Finches.
6.1 Introduction..............................................................................................118
6.2 Materials and methods.............................................................................120
6.2.1 Dissection and analysis of tissue.......................................................1206.2.2 Conversion of counts per minute (CPM) to
disintegrations per minute (DPM).....................................................1216.2.3 Comparison of breeding and non-breeding females........................ 1226.2.4 Isotope uptake and decline in non-breeding
females................................................................................................1236.2.5 Distribution of isotope in the eggs.....................................................123
6.3 Results......................................................................................................124
6.3.1 Incorporation of isotope in the tissues.............................................. 1246.3.2 Decline of isotope in the tissues with time....................................... 1256.3.3 Comparison of breeding and non-breeding females........................ 1266.3.4 Occurance of isotope in the eggs.......................................................126Table 6.1......................................................................................................128Figures 6.1 to 6.8.........................................................................................129
6.4 Discussion................................................................................................137
6.4.1 Incorporation of isotope in the tissues.............................................. 1376.4.2 Decline of isotope in the tissue with tim e........................................ 1376.4.3 Differences between breeding and non-breeding
females................................................................................................1386.4.4 Occurance and distribution of isotope in eggs................................. 1396.4.5 Conclusions........................................................................................140
CHAPTER 7 - General Discussion..........................................................................142
References.................................................................................................................. 151Scientific names of birds mentioned in the text........................................................164
ix
CHAPTER 1
GENERAL INTRODUCTION
The production of a clutch of eggs by a female bird is a demanding process. In the past,
many studies have concentrated on the energetic demands of reproduction (eg Ricklefs,
1974). The daily energy requirement for egg laying can range from 29% of basal metabolic
rate in raptors to 135% in waterfowl. However, daily protein requirements can be even
more pronounced, being in raptors 86% above maintenance requirement and up to 230% in
waterfowl, gulls and terns (Robbins, 1981 and 1983). These demands, above the level of
normal requirements, vary from species to species depending on the clutch size and relative
size of the eggs, the rate at which they are laid, and the growth of the ovarian follicles and
oviduct prior to laying (Astheimer, 1986, Robbins, 1983). There is also considerable
variation in egg composition across species depending on the mode of development of the
chick. The eggs of those with precocial young have an average yolk content of 37%,
compared to 22% for altricial species (Robbins, 1983, Blem, 1990, Birkhead & Nettleship,
1984, Carey, 1983). The larger yolk of precocial species enables longer incubation and a
relatively advanced chick at hatching.
The nutrients that are used for the production of eggs may be derived from food intake
(exogenous) or they may be supplied from reserves that the female already possesses
(endogenous). There is little known, however, about the relative importance and budgeting
of these avenues in avian reproduction (Walsberg, 1983).
Table 1.1 records those species whose protein and lipid reserves have been investigated
during the egg laying period. They show a spectrum from total reliance on reserves to no
use of them at all. For example, the female Adelie Penguin does not eat for two to three
weeks before and during laying thus all nutrients must be derived from reserves (Astheimer
& Grau, 1985). Similarly, the Lesser Snow Goose relies entirely on endogenous sources for
egg production. They produce a clutch without having to feed when they arrive at their
Arctic breeding grounds (Ankney & Maclnnes, 1978).
1
In other birds the reliance on reserves is not so obvious but in the Canada and Brant Goose
reserves of protein from the body of females are lost that are approximately equivalent to
the amount required by the clutch (Raveling, 1979, Ankney, 1984). In a granivorous
passerine, the Red-billed Quelea, it is thought that protein for the eggs is supplied partly
from depletion of reserves and partly from food intake (Jones & Ward, 1976).
In contrast with the above, female Mallard Ducks use some of their lipid reserves while
breeding but show only a slight loss in body protein reserves and so most of the protein for
the eggs comes from intensi ve foraging for protein rich food items (Krapu, 1981). The
Wood Duck shows no use of protein reserves at all and gets all the protein it needs from the
diet but, like the Mallard, their lipid reserves are important during egg production
(Drobney, 1980).
Finally, an example of a bird that seems to require no endogenous nutrients to produce eggs
is the Brown-headed Cowbird (Ankney & Scott, 1980). These birds can apparently obtain
all the necessary nutrients from food eaten at the time of laying. It is worth noting that
while there is no decline in the Cowbirds' body protein levels across the entire breeding
period there is a small, but significant, decline while the eggs are being laid.
As mentioned above, the additional protein requirements of egg production are, in many
cases, relatively higher than energy requirements. In a number of studies protein, rather than
energy, is thought to be the limiting factor for ovigenisis (Jones & Ward, 1976, Raveling,
1979, Fogden and Fogden, 1979, Houston et al, 1983, Drobney & Fredrickson, 1985).
In most of the studies in Table 1.1 protein has not been measured directly. Instead, a protein
index based on the lean dry weight of muscle, corrected for body size, has been used. Lipids
are extracted by solvents and the remainder is taken as being representative of protein. In
the light of recent work this assumption is not unreasonable. In a study of the House
Sparrow the decline of lean dry weight of the flight muscle was highly correlated with a
direct measure of protein in the muscle (Jones, M.M, 1991). Therefore, decline in muscle
lean dry weight is likely to reflect loss of protein and not some other non-lipid material.
2
It is unlikely that the decline in protein reserves seen in so many studies in Table 1.1 is to
meet extra energetic demands due to egg production. Protein is not generally viewed as an
energy store and its breakdown is complex and inefficient. Unlike lipid and carbohydrate,
toxic by-products result from the breakdown process (Blem, 1990). Protein yields little
energy as a substrate, only 4.3 kcal/g in birds (Schmidt-Nielsen, 1979). Many of the birds in
the table have large lipid reserves which would be more efficient to use for energy.
However, it has been suggested that the use of protein reserves during reproduction is to
supply protein directly to the developing eggs (Kendall et al, 1973, Schifferli, 1980, Jones
& Ward, 1976).
There is some evidence to suggest that protein reserves may be utilised to meet a specific
nutritional demand for amino acids. This has been suggested before (eg Kendall et al, 1973,
Krementz, 1984). Eggs are known to contain some amino acids in unusually high
concentrations particularly the sulphur amino acids, cysteine and methionine (Harvey,
1970). In a recent study of Lesser Black-backed Gulls supplementary feeding experiments
involving laying birds were done. Those given additional protein in the form of fish did not
show any difference in their eggs, compared to control birds. However, those given an
equivalent protein mass in the form of cooked eggs produced significantly larger eggs. This
suggests that the quality of protein available is important not just quantity (Bolton et al,
1992). Poultry are known to have increased egg production when fed diets supplemented by
methionine, tryptophan and lysine (Fisher, 1976). Even when protein is not in short supply
in a bird's diet there may therefore be a need for certain limiting amino acids and these
might be supplied from protein reserves.
Lipid reserves may be used for transfer to developing eggs, as is undoubtedly the case with
the Lesser Snow Goose and the Adelie Penguin (Ankney & Machines, 1978, Astheimer &
Grau, 1985). In other cases the reason for lipid reserve depletion is not so clear cut. In some
studies it has been observed that lipid reserves are used to provide energy that allows a
change of feeding behaviour. In the Mallard Duck (Krapu, 1981) and the Wood Duck
(Drobney, 1980) the female turns her attention to protein rich food items at the expense of
the lipid reserves. Similarly, the passerine Grey-backed Camaroptera switches from energy
rich seeds to protein rich food items and may fuel this by utilising lipid reserves to cover the
3
energy deficit (Fogden & Fogden, 1979). In the Red-billed Quelea, a switch of diet to
include calcium rich items for shell production was observed. Again, this would reduce
energy intake that could then be compensated for by the decline in lipid reserves (Jones &
Ward, 1976). In those studies in Table 1.1 that did not use protein reserves all, except the
Cowbird and the White-bellied Swiftlet, made use of lipid reserves during the breeding
period.
This study used a captive colony of Zebra Finches to examine the nutritional demand of egg
production, in particular the budgeting of protein, lipid (fat) and calcium. The study had the
following aims;
To determine the extent and timing of the nutritional demand for egg production in female
Zebra Finches by measuring the growth of the oviduct and ovarian follicles from the resting
state plus the protein, lipid and calcium content of an average clutch of eggs. Amino acid
composition of the eggs was also determined.
To measure food intake during the reproductive period and to compare this to the non
breeding state. In addition, to measure the nutritional value of the diet (ie exogenous
nutrients) including amino acid composition. Such measurements of food intake can only
be made adequately in the controlled conditions of a laboratory.
To measure any change in body reserves of protein, lipid and calcium (ie endogenous
nutrients) by examining the carcasses of birds at various stages of the reproductive cycle
compared to non-breeding birds using, not only traditional techniques of lipid extraction,
but also direct measurement of protein in muscles.
From the above, to assess the relative importance of endogenous and exogenous nutrients in
relation to the demand for these nutrients during egg formation by female Zebra Finches.
Finally, by the use of isotopes, to determine if there is direct transfer of material from the
body reserves of laying female Zebra Finches to the developing eggs.
4
The Zebra Finch is a convenient bird to use for such a laboratory study where controlled
conditions are necessary to measure such parameters as food intake. They will breed readily
in captivity if favourable conditions are maintained. The use of body reserves during
breeding has not been previously demonstrated in this species. However, it is a species
where reserves might be expected to play a role. In the wild, the Zebra Finch lives in the
semi-arid regions of Australia and even while breeding exists on a diet almost entirely of
grass seed which is low in protein content (Zann & Straw, 1984, Morton & Davies, 1983).
The Zebra Finch is unlikely to be able to meet reproductive protein demand from the diet
alone.
The Zebra Finch colony was maintained as follows;
The temperature throughout was maintained at 23 ± 2°C and the lighting regime was 14:10
light/dark. The cages in which birds involved in experiments were kept and those breeding
for stock were all identical, measuring 60x50x40cm arranged in pairs with a removable
partition between them. Food, Haith's Foreign Finch Mix, and water were replenished daily.
In addition, cuttlefish bone and grit were available in the cage and replaced when necessary.
Non-breeding birds were kept in flight aviaries. The sexes were always kept separated
unless being used for breeding or experiments. In addition to the normal seed diet the birds
in the flight cages were given a food supplement to maintain them in good condition. This
was Haith's Conditioning Food which has a higher protein content than the normal finch
mix. Except during feeding trials (see Chapter 3) ICI Forest Bark was used as a litter on the
bottom of the cages. This was replaced as necessary but not during experiments. All birds
were fitted with numbered leg rings so that each individual's history could be recorded.
For breeding, cages were fitted with a nest box, approximately 12.5cm square. The lid of
the nest box was hinged to allow examination of the contents. T he bottom of the nest box
was covered by a layer of wood shavings and nesting material (dried and fresh grass)
provided in the cage. For the experiments that required birds to breed, a technique was
developed to encourage the highest rate of successful pairings. Birds were selected from the
flight cages and weighed. Those of less than 12g were rejected as experience indicated that
these birds were unlikely to breed. Pairs of males and pairs of females were placed in
adjacent cages separated by the partition. They were left for about a week and then the
5
partition was removed and the birds allowed to mix. The partition was then replaced so that
a breeding pair occupied each cage. Copious nesting material was then provided in the cage
and a little put into the nest box to encourage nest-building behaviour.
6
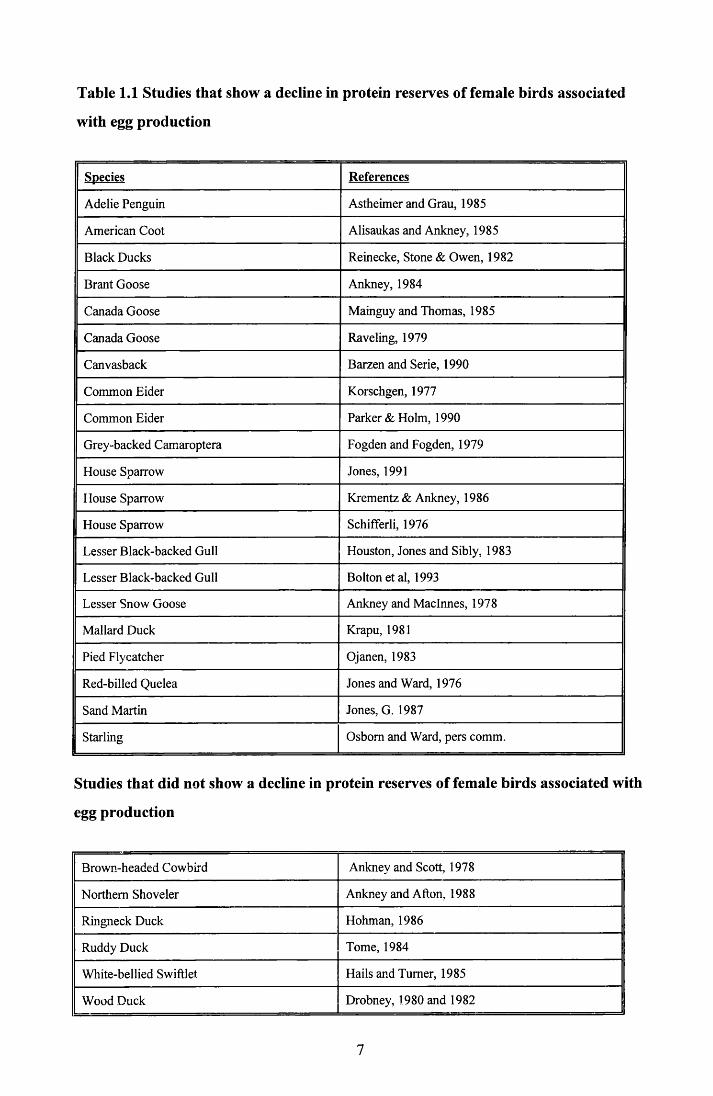
Table 1.1 Studies that show a decline in protein reserves of female birds associated
with egg production
Species References
Adelie Penguin Astheimer and Grau, 1985
American Coot Alisaukas and Ankney, 1985
Black Ducks Reinecke, Stone & Owen, 1982
Brant Goose Ankney, 1984
Canada Goose Mainguy and Thomas, 1985
Canada Goose Raveling, 1979
Canvasback Barzen and Serie, 1990
Common Eider Korschgen, 1977
Common Eider Parker & Holm, 1990
Grey-backed Camaroptera Fogden and Fogden, 1979
House Sparrow Jones, 1991
House Sparrow Krementz & Ankney, 1986
House Sparrow Schifferli, 1976
Lesser Black-backed Gull Houston, Jones and Sibly, 1983
Lesser Black-backed Gull Bolton et al, 1993
Lesser Snow Goose Ankney and Maclnnes, 1978
Mallard Duck Krapu, 1981
Pied Flycatcher Ojanen, 1983
Red-billed Quelea Jones and Ward, 1976
Sand Martin Jones, G. 1987
Starling Osbom and Ward, pers comm.
Studies that did not show a decline in protein reserves of female birds associated with
egg production
Brown-headed Cowbird Ankney and Scott, 1978
Northern Shoveler Ankney and Alton, 1988
Ringneck Duck Hohman, 1986
Ruddy Duck Tome, 1984
White-bellied Swiftlet Hails and Turner, 1985
Wood Duck Drobney, 1980 and 1982
7
CHAPTER 2 - NUTRITIONAL INVESTMENT IN THE EGGS OF FEMALE
ZEBRA FINCHES
2.1 INTRODUCTION
The purpose of this chapter is to examine the total and daily nutritional investment made
by female Zebra Finches producing a clutch of eggs. The extent of the investment will be a
function of egg mass, clutch size, nutrient content, the interval between successive eggs
and the length of the rapid phase of ovarian follicle growth (Astheimer, 1986, Walsberg,
1983). I shall attempt to investigate each of these factors in relation to the female Zebra
Finch.
It is useful, at this point, to consider the process of egg formation itself The Zebra Finch
like most other birds suppresses the development of the right ovary (Phillips et al, 1985).
Only the left ovary develops and it is to be found at the anterior part of the body cavity,
suspended from the dorsal body wall by a peritoneal fold. The ovary initially contains
millions of oocytes, the majority of which degenerate. Only a small number of the original
will mature and ovulate. Oocytes that do develop must first be incorporated into an ovarian
follicle. This follicle is necessary to support the oocyte which will grow so large that its
own cell membrane alone would rupture. In addition, this follicle extracts yolk material
from the blood and transfers it to the oocyte. The yolk material is produced by the liver.
As the follicle approaches its maximum size and is ready to ovulate it secretes
progesterone that promotes the final development of the oviduct and induces copulatory
and nest-building behaviour. At ovulation the follicle ruptures and the oocyte passes into
the body cavity from where it enters the oviduct. The post-ovulatory follicle regresses over
a few days and is resorbed by the ovary. The oviduct is held in place by dorsal and ventral
ligaments and during the period leading up to ovulation it has grown rapidly from its
resting state. The oviduct only develops when the female is in breeding condition as its
growth depends on the secretion of hormones by the ovary.
The oocyte enters the first part of the oviduct, the infundibulum where it is fertilised and
the first of the layers of albumen are laid down around the yolky zygote. The zygote then
passes to the longest portion of the oviduct, the magnum, where most of the albumen is
deposited. Next, the egg enters the isthmus and membranes are laid down that give the egg
its shape. The last part of the oviduct is the shell gland or uterus. At first water is passed
into the albumen resulting in a doubling of its mass, then the outer membrane becomes
progressively calcified forming the shell. Once this process is complete the bird can lay the
egg (Lofts & Murton, 1973, Phillips et al, 1985).
In passerines, such as the Zebra Finch, the period of rapid follicular growth is likely to be
of the order of 3-4 days (Calder, 1974). The entire egg white and shell is produced in the
twenty four hour period following ovulation (Walsberg, 1983).
There is great variation in the composition of birds eggs among species and this has been
well documented (eg Sotherland & Rahn, 1987). The percentage of yolk in an egg varies
with precocity of the young (Ricklefs, 1977). The Zebra Finch is an altricial species and
Sotherland & Rahn (1987) predicted yolk in such species approximated 20% of the total
egg and its water content about 80%. Rahn et al. (1975) showed egg mass (Mg) as an
allometric function of body mass (Mb);
Me = 0.277Mb° 77
This would predict an egg of about 12.5% of the body weight of a Zebra Finch. There is, of
course, substantial variation around these averages but it provides an estimate to work with.
Laying a clutch of eggs is a demanding process for a female bird, particularly for those of
small body mass (Blem, 1990). While there has been much work on the energetics of egg
production, relatively little attention has been payed to the nutrient aspects of reproduction
in wild species. Robbins (1983) notes that while daily energy requirements for egg laying
range from 29% of basal metabolic rate to 135%, the estimated daily protein requirement
increases from 86% of the maintainance allowance to 230% for corresponding groups of
birds. On this basis he questions the almost exclusive emphasis of many avian biologists on
9

understanding the energy parameters. Therefore, in this chapter I present data based on the
analysis of the egg constituents of the clutch, and use this to consider the nutritional
investment in egg production, in total and on a daily basis.
10
2.2 MATERIALS AND METHODS
2.2.1 Analysis of eggs
Pairs of Zebra Finches were introduced and allowed to breed. The nest-boxes were
monitored daily between 0900 and 1000. Any eggs that had been laid were removed and
replaced with a plaster dummy. The eggs were small and required delicate handling to
prevent breakage. In most other studies, the eggs were boiled in order to harden the
contents so that yolk and albumen may be easily separated (Birkhead & Nettleship, 1984,
Schifferli, 1976). Initial trials using this technique with Zebra Finch eggs had a very high
breakage rate while the samples were boiling, leading to a loss of albumen material from
the egg. An alternative method, therefore, was developed that caused little breakage with
the delicate finch eggs.
Each egg had a small hole made at the airspace and was then placed in a 100°C oven for
one hour. The hole in the airspace allowed the expanding gas to escape thus preventing the
egg from bursting. This process hardened the egg contents to facilitate the easy separation
of the shell, yolk and albumen. An incision was made with a scalpel blade along the long
axis of the egg and the shell could be removed in two halves. The albumen was then
removed from around the yolk, taking care not to mix the two. The shell, yolk and albumen
were placed on pre-weighed, marked aluminium containers and then placed in an oven at
70°C. The samples were weighed to 0.000lg at intervals until constant weight was
obtained. This was called the Dry Weight.
The lipid content of the yolk and albumen was obtained by extraction with chloroform in a
Soxhlet extractor. The dried yolk and albumen was wrapped in 15cm diameter filter paper
and the ends stapled shut. The packets were placed into a 70°C oven until constant weight
was obtained and then placed in the Soxhlet extractor with chloroform for 8 hours. After
this extraction the packets were again dried at 70°C to constant weight. The lipid content of
the sample was equivalent to the difference in the dry weights of the packets before and
after extraction.
11
Therefore, for each egg, values for the Dry Weight of shell, yolk and albumen and also the
Lipid Weight and Lean Dry Weight (LDW) of the yolk and albumen were obtained. Of the
lean dry weight of eggs 95% is estimated to be protein and only 5% is carbohydrate
(Sotherland & Rahn, 1987, Romanoff & Romanoff, 1949) and I have assumed these values
apply to Zebra Finch eggs.
2.2.2 Amino acid analysis of eggs
Four eggs were obtained for amino acid analysis. The eggs were heated at 100°C for an
hour to harden the contents. The yolk and the albumen were then separated and freeze
dried to constant weight. The dried albumen was powdered using a mortar and pestle.
Lipid was extracted from the yolk using chloroform solvent in a Soxhlet apperatus by the
same technique as before. The lipid free yolk was then powdered using a mortar and
pestle. Two eggs were analysed by Dr. I. D. Hamilton and Mr. J. Jardine at the
Biochemistry Department, Glasgow University and two eggs were analysed by Dr. J.
McNab at The Institute of Grassland and Animal Production, Roslin. The analyses were
performed using the same technique and thus the results were pooled.
2.2.3 Calcium content of shell
The shells from three four-egg clutches were placed in pre-weighed and dried crucibles and
ashed at 650°C in a muffle furnace for 21 hours. The crucibles were removed from the
furnace and allowed to cool in a desiccator before weighing to 0.000lg on a Precisa
A80-200 electronic balance. The ash was powdered and a sample of 0.0200g taken for
analysis by atomic absorption spectrophotometry. 20mg of ash was dissolved in 4ml of 8N
hydrochloric acid, to which 2ml of 2N nitric acid was added. Deionised water was used to
wash the solution through filter paper into a 50ml measuring cylinder. The solution was
then made up to 40ml with deionised water. This "stock" solution and was then stored in
polythene bottles until analysis.
Standards were made up using BDH Spectrasol calcium nitrate solution to give a range
from 0 to 5ppm. In order to bring the "stock" solutions within this range a further 1:50
dilution was required with deionised water to which lanthanum chloride was added to
comprise 0.2% of the solution. The lanthanum is necessary to relieve the suppression of Ca
12
emission that is caused by certain non-dissociable salts, particularly phosphate. The
lanthanum preferentially binds these leaving the Ca free (Wilson & Goulding, 1986).
Therefore, the final dilution of 1:50 was made by taking 0.5ml of "stock", adding 0.05ml of
La solution and making it up to 25ml with deionised water. This was done with two
aliquots of the "stock" solution and each was measured in duplicate. All measurements
were taken on a Phillips PU9200 Atomic Absorption Spectrophotometer.
2.2.4 Ovary and oviduct development
During the study, birds were taken at various stages of the laying cycle to allow analysis of
the carcass. The ovary and oviducts of all of these birds were removed for anlaysis (see
Dissection Procedure, Chapter 4).
When the ovary was in situ, the size of any developing follicles was measured to the
nearest 0.05mm using calipers. The larger follicles can vary in shape considerably.
Therefore, three different measurements were recorded for each and the mean taken as the
diameter. Post-ovulatory follicles were noted if they were present. The ovary was then
removed taking care not to include surrounding tissue (see Chapter 4).
Depending on the experiment that the bird was taken for, some of the ovaries were kept in
70% alcohol and some were frozen. The frozen ovaries were later oven dried at 70°C to
constant weight and measured to 0.000 lg. Neutral lipid was then extracted by chloroform
in a Soxhlet extractor and the lean dry weight and lipid weight obtained.
The ovaries in alcohol were examined again under a xlO dissecting microscope to ensure
that the presence or absence of post-ovulatory follicles had been correctly identified when
the dissection was performed. Using the same technique as the frozen samples, a dry
weight and lean dry weight was obtained. However, lipid values from these samples were
not used as some lipid was lost from the follicles during storage in alcohol.
The oviducts were removed from the females and were treated in the same manner as the
ovaries. A dry weight, lean dry weight and lipid weight were obtained as above. Whenever
an oviduct contained an egg, the egg was removed before the oviduct was analysed.
13
2.3 RESULTS
2.3.1 Analysis of eggs
Unless otherwise stated, all means presented hereafter are given with standard deviation. 21
clutches of eggs were analysed giving a total of 105 eggs. Their mean clutch size was 5.0 ±
0.9, n = 21. The mean clutch size recorded for all females during the study from November
1987 until July 1990 was 5.2 ± 0.9, n = 120. The mean egg fresh weight was 1.098 ±
0.092g, n = 36, the mean length 15.4 ± 1.1mm, n = 36 and the mean breadth 11.0 ± 0.4mm,
n = 36.
Table 2.1 presents the results for the analysis of the eggs. The albumen of Zebra Finch eggs
contained little or no detectable lipid using the method employed. The lipid content of the
yolk represents 53.3% of the yolk dry weight. Estimated mean carbohydrate and protein
content is 4.2mg and 79.4mg in the albumen and 2.6mg and 48.6mg in the yolk
(Sotherland and Rahn, 1987).
In some bird species there is a decline in egg size during the laying of the clutch, for
example the coot (Alisaukas & Ankney, 1985). Analysis by Oneway Anova showed that
there were no differences in composition between the eggs of a clutch, except for shell
weight (Table 2.2). I also tested for within-clutch differences in four-egg and five-egg
clutches separately, by repeated measures ANOVA, because if only the last eggs to be laid
were lighter then this effect could be masked when considering different clutch sizes
together. However, when analysed separately there were no significant differences in
clutch composition, except for shell weight in four-egg clutches (Table 2.3). A Tukey
multiple range test on the four-egg clutches indicated that the shell of Egg 4 was
significantly lighter than the shell of the first egg laid. The same was not true of five-egg
clutches where there was no significant difference between the components of any of the
eggs.
2.3.2 Calcium content of shell
The mean dry weight of 12 shells chosen at random for this analysis was 52.5 ± 5.8mg, this
being not significantly different from the 54.1 ± 8.6mg mean dry weight of all the eggshells
14
given in Table 2.1 (t1]0 = 1.145, p > 0.05). The results of this analysis are shown in Table
2.4. The mean value for calcium content of Zebra Finch eggs in this study was 17.8 ±
2.8mg of calcium.
With the mean clutch size for the study colony being 5.2 eggs, 89.0mg of calcium is
required for the total clutch. Each egg is in the oviduct for one day only, and part of that
time is required to deposit the albumen. Therefore, the calcium must be laid down in less
than 24 hours.
2.3.3 Amino acid analysis of eggs
Table 2.5 shows the results of the amino acid analysis on four whole eggs with the amino
acid composition of the domestic hen for comparison. These are presented as percentage of
total amino acid content. While 11 of the amino acids are present in similar proportions
differences can be seen in 7. The most marked differences are seen in alanine and
isoleucine.
2.3.4 Ovarian follicle growth
Of all the females that were taken at the time of laying, 13 were found to be at the stage
where the first yolk of a clutch had been ovulated (called here, Day 0). These birds were
found to have an egg in the oviduct and only one post-ovulatory follicle. The mean
diameter of the oviduct egg yolk and the remaining enlarging follicles on the ovary is
shown in Figure 2.1. Zebra Finches lay one egg per day and so the measurements are
indicative of daily growth increments, i.e. the largest follicle represented the size of a
follicle on Day -1, the next largest Day -2 and so on. Developing follicles prior to Day -4
were difficult to distinguish from undeveloped follicles which had a mean diameter of 1.3
± 0.1mm, n=237.1 defined a follicle as enlarging if it had a diameter of at least 1.85mm
and was yellow and not white.
This follicle growth curve allowed all pre-breeding females to be assigned to the correct
period in their laying cycle by measuring the largest follicle and checking for the absence
of post-ovulatory follicles. The stage in the laying cycle reached by birds that were laying,
or had laid, was determined by; the number of eggs they had laid, the number and size of
15
the ovarian follicles and a count of post-ovulatory follicles to check whether an
additional egg might have been laid but then had been broken and eaten.
The Mean follicle diameters were converted to volume (4/3 nr3). This assumes that the
follicles were exactly spherical, which they were not, but the method gave a reasonable
estimate. Figure 2.2a shows the increasing volume of a single follicle. Figure 2.2b shows
the combined volume of ovarian follicles during the production of an average 5 egg clutch
and illustrates the time scale of nutrient demand for yolk formation. Demand increases
rapidly from Day -4 to Day 0 where it peaks, then declines less rapidly to Day 4 when the
last follicle is ovulated.
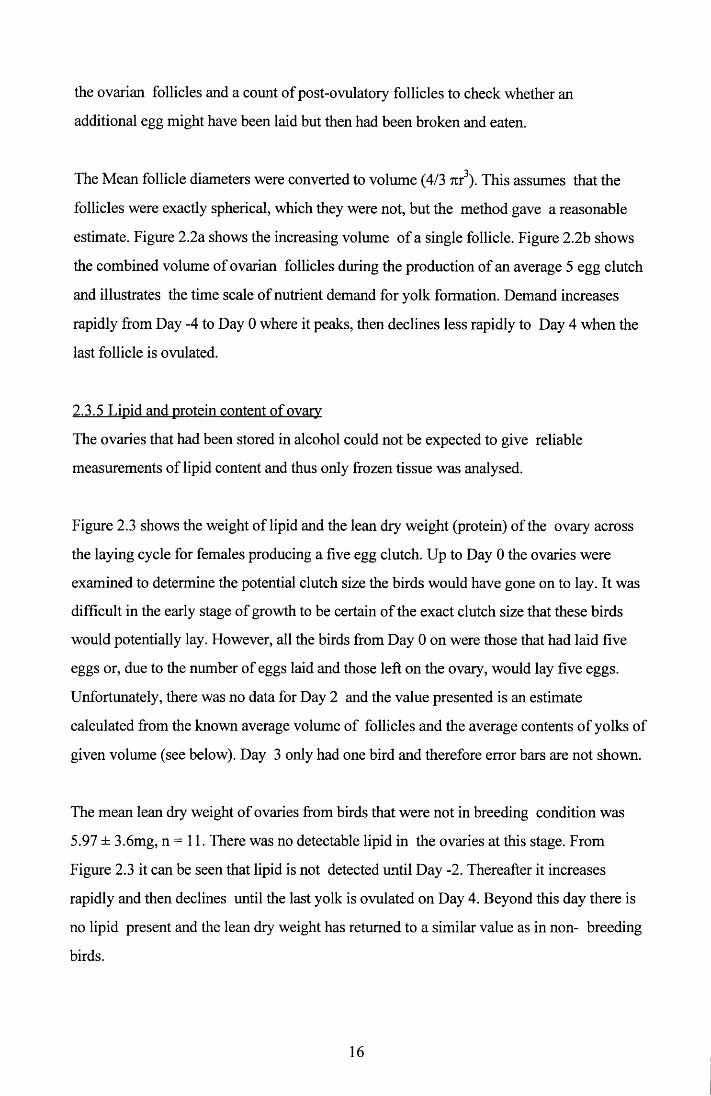
2.3.5 Lipid and protein content of ovary
The ovaries that had been stored in alcohol could not be expected to give reliable
measurements of lipid content and thus only frozen tissue was analysed.
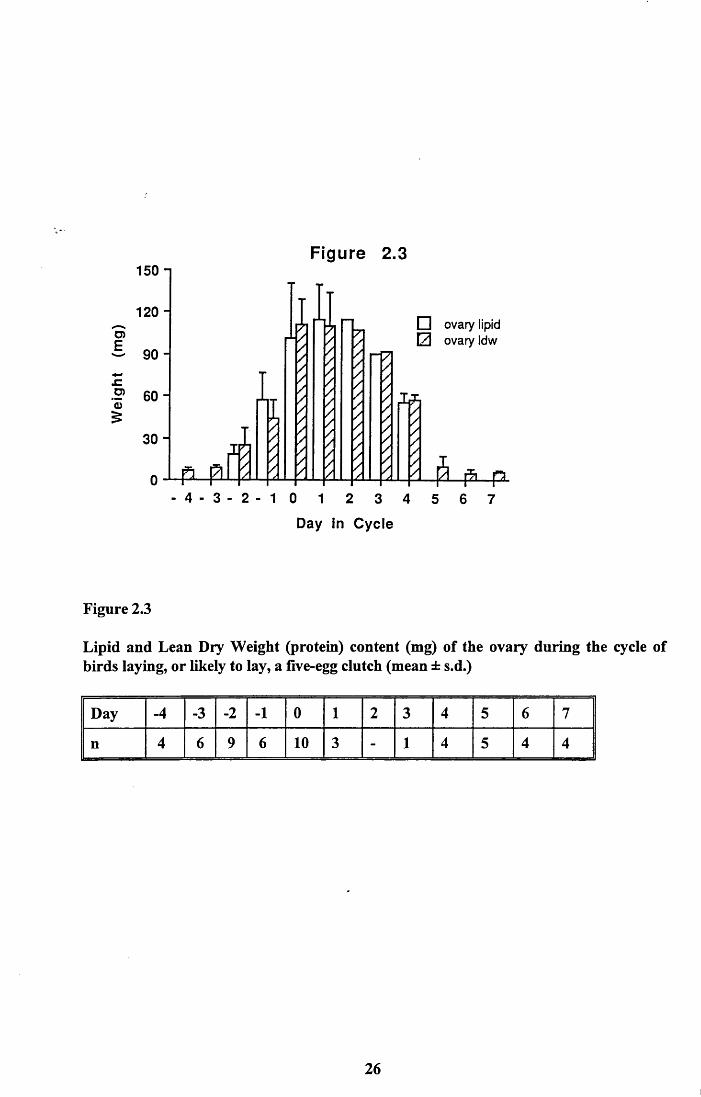
Figure 2.3 shows the weight of lipid and the lean dry weight (protein) of the ovary across
the laying cycle for females producing a five egg clutch. Up to Day 0 the ovaries were
examined to determine the potential clutch size the birds would have gone on to lay. It was
difficult in the early stage of growth to be certain of the exact clutch size that these birds
would potentially lay. However, all the birds from Day 0 on were those that had laid five
eggs or, due to the number of eggs laid and those left on the ovary, would lay five eggs.
Unfortunately, there was no data for Day 2 and the value presented is an estimate
calculated from the known average volume of follicles and the average contents of yolks of
given volume (see below). Day 3 only had one bird and therefore error bars are not shown.
The mean lean dry weight of ovaries from birds that were not in breeding condition was
5.97 ± 3.6mg, n = 11. There was no detectable lipid in the ovaries at this stage. From
Figure 2.3 it can be seen that lipid is not detected until Day -2. Thereafter it increases
rapidly and then declines until the last yolk is ovulated on Day 4. Beyond this day there is
no lipid present and the lean dry weight has returned to a similar value as in non- breeding
birds.
16
As the tissue of the ovary itself does not increase in weight virtually all of the increase in
both lipid and protein that occurs in the ovary during egg formation is due to deposition in
the developing follicles. Also, from the dissections of post-laying females it was evident
that surplus follicles were not enlarged and subsequently resorbed. An undeveloped ovary
does not contain any measurable lipid and thus the change of a follicle's colour from white
to yellow is a good indication that it is starting to develop.
2.3.6 Lipid and protein content of the oviduct
As with the ovary, only the frozen samples were used for this analysis. Figure 2.4 shows
the mean oviduct lean dry weight through the egg laying period of birds laying a five-egg
clutch. The data presented are for the 13 birds which contained an egg in their oviduct and
those that laid, or were going to lay, a five-egg clutch. Data for Day 2 of the laying cycle
was not available, Day 1 and 3 are based only on one bird each. The analysis did not reveal
any detectable lipid in the oviduct at any time.
Again it can be seen that the increase in the oviduct's mass is significant and very rapid,
resulting in a ten fold increase in just 3 days. The oviduct grows until Day -1 when it is
ready to receive the first egg. After Day 0 the oviduct begins to regress. The consequence of
this is that protein from the oviduct is available for other uses from this day on. This may be
of some importance to egg formation. Assuming a linear decline in the tissue of the oviduct
from Day 0 to Day 5 on which the last egg was laid, a minimum of 14.12mg of protein per
day could be made available.
2.3.7 Nutritional investment in a five-egg clutch
From the above data it was possible to estimate the investment of lipid, protein and calcium
on each day of the cycle for a five-egg clutch including the growth of the oviduct. The
investment required for the clutch is less than the full cost as I am not considering factors
such as the energetic cost of egg synthesis here. Rather I am illustrating the difference in
nutrients required between each day and the next of the laying cycle.
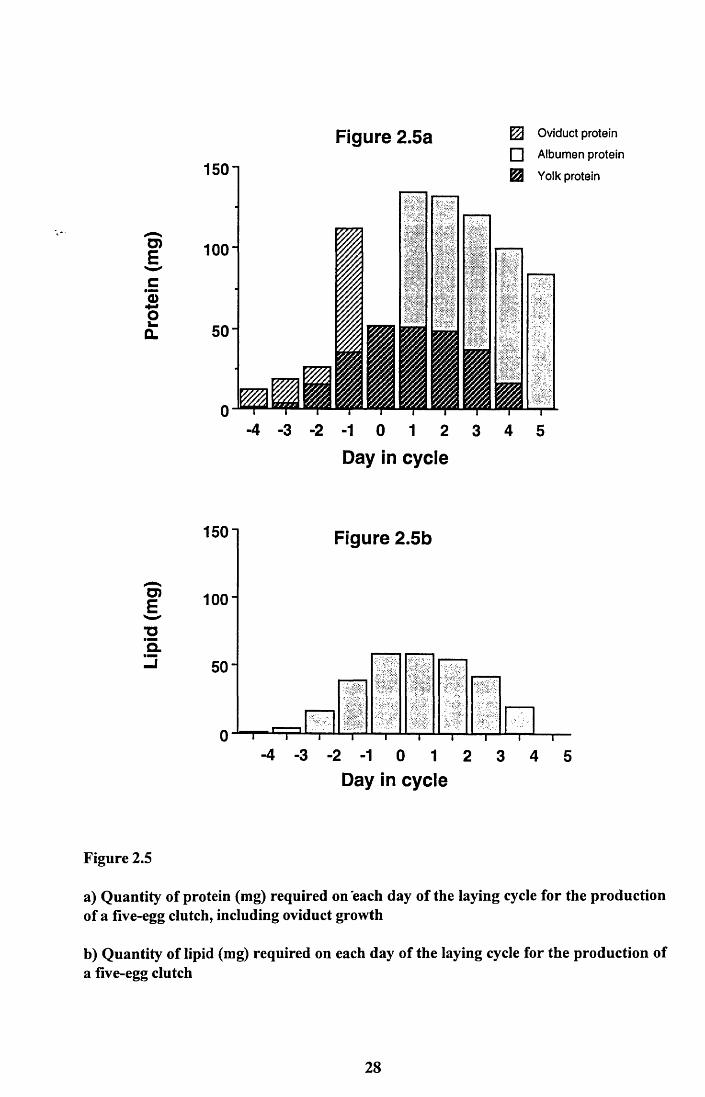
Figure 2.5a shows the daily investment of protein required for a clutch of five eggs and the
growth of the oviduct. The amount of protein needed for the yolks increases each day to
17
reach a peak on Day 0. This is the day on which most growing follicles are present on the
ovary. Beyond this day the amount of yolk protein needed daily declines as each follicle
reaches maximum size and is ovulated. The pattern for albumen protein investment is very
different. The eggs are laid daily and only one egg is in the oviduct at any one time, thus a
similar amount of albumen protein is required each day from Day 1 until the clutch is
complete. The oviduct grows rapidly from its resting state to a size that is capable of
accepting the first ovum. Most of the growth appears to occur between Days -2 and -1 and
then growth stops. This leads to a slight discontinuity on Day 0 as no further growth of the
oviduct occurs yet albumen protein is not required until after the first egg is ovulated. From
this point on the oviduct is actually decreasing in protein content (see Figure 2.4) and this
could be providing protein for the developing eggs. The significance of this will be
discussed later in Chapter 4.
Figure 2.5b illustrates the daily investment of lipid, which is required by the yolk only. The
pattern is, therefore, similar to that for protein with a steady increase in demand for lipid as
the follicles grow followed by a steady decline as each is ovulated. The peak of demand is
reached on Day 0.
As mentioned above the demand for calcium is a steady 17.8mg (Table 2.4) per day from
Day 1 to Day 5.
18
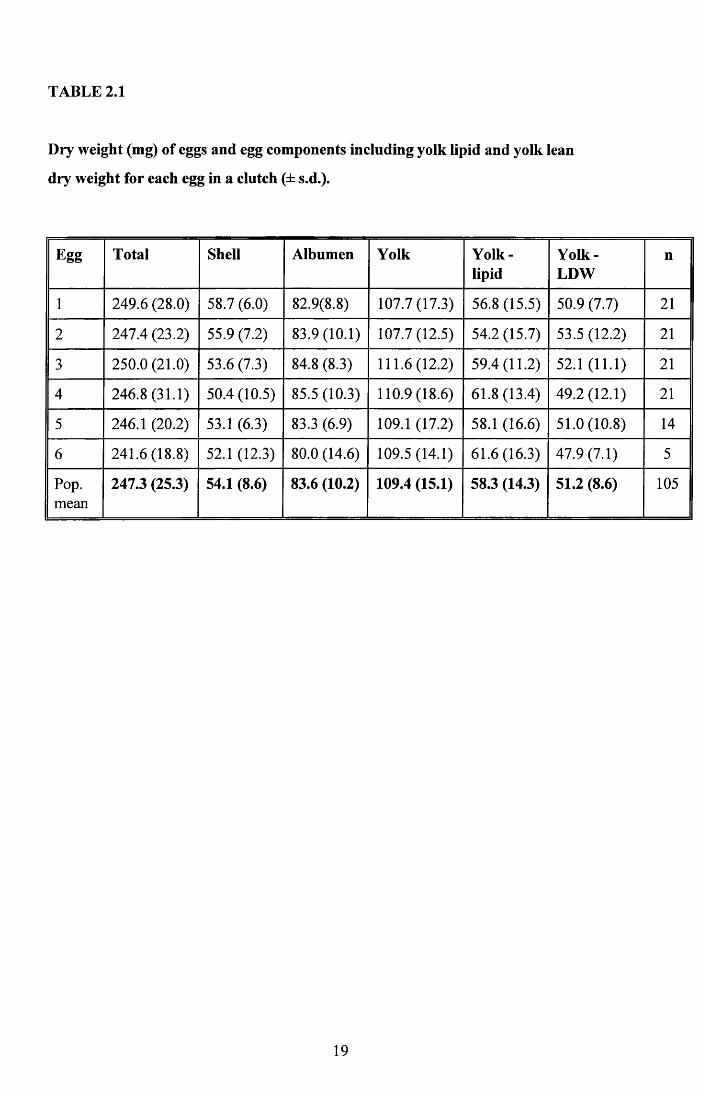
TABLE 2.1
Dry weight (mg) of eggs and egg components including yolk lipid and yolk lean
dry weight for each egg in a clutch (± s.d.).
Egg Total Shell Albumen Yolk Yolk-lipid
Yolk-LDW
n
1 249.6 (28.0) 58.7 (6.0) 82.9(8.8) 107.7(17.3) 56.8(15.5) 50.9 (7.7) 2 1
2 247.4 (23.2) 55.9 (7.2) 83.9(10.1) 107.7(12.5) 54.2(15.7) 53.5 (12.2) 2 1
3 250.0 (21.0) 53.6 (7.3) 84.8 (8.3) 1 1 1 .6 ( 1 2 .2 ) 59.4(11.2) 52.1 (11.1) 2 1
4 246.8(31.1) 50.4(10.5) 85.5(10.3) 110.9(18.6) 61.8 (13.4) 49.2(12.1) 2 1
5 246.1 (20.2) 53.1 (6.3) 83.3 (6.9) 109.1 (17.2) 58.1 (16.6) 51.0(10.8) 14
6 241.6(18.8) 52.1 (12.3) 80.0 (14.6) 109.5(14.1) 61.6(16.3) 47.9 (7.1) 5
Pop.mean
247.3 (25.3) 54.1 (8.6) 83.6 (10.2) 109.4 (15.1) 58.3 (14.3) 51.2 (8.6) 105
19
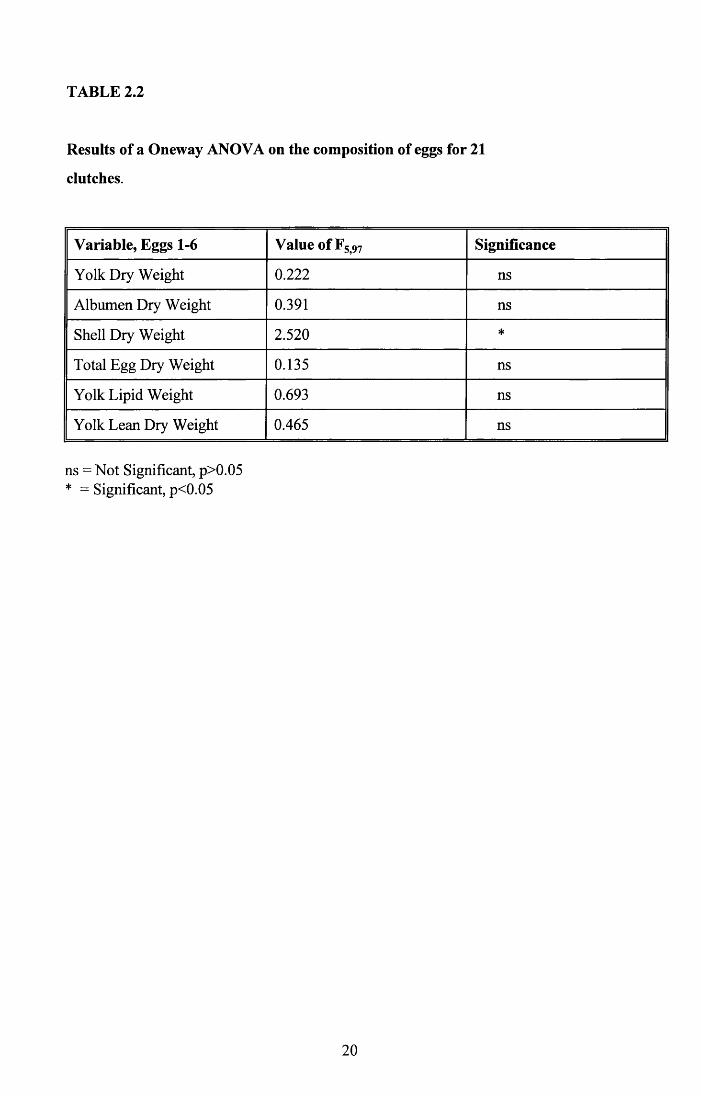
TABLE 2.2
Results of a Oneway ANOVA on the composition of eggs for 21
clutches.
Variable, Eggs 1-6 Value ofF5>97 Significance
Yolk Dry Weight 0 . 2 2 2 ns
Albumen Dry Weight 0.391 ns
Shell Dry Weight 2.520 *
Total Egg Dry Weight 0.135 ns
Yolk Lipid Weight 0.693 ns
Yolk Lean Dry Weight 0.465 ns
ns = Not Significant, p>0.05 * = Significant, p<0.05
20
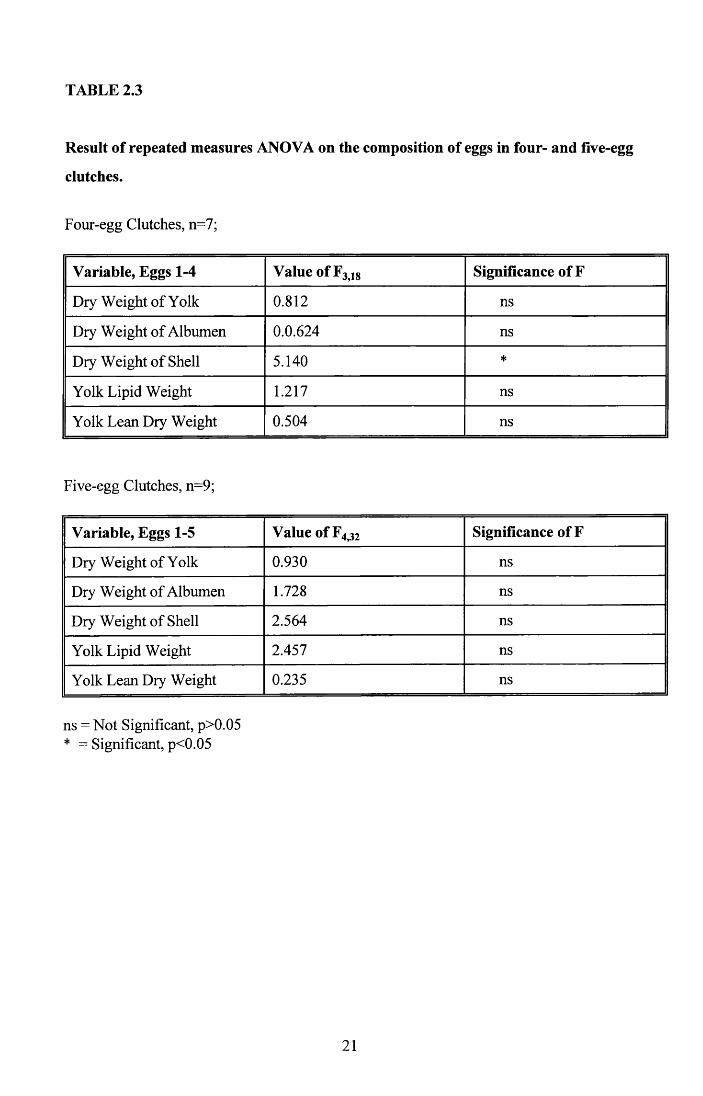
TABLE 2.3
Result of repeated measures ANOVA on the composition of eggs in four- and five-egg
clutches.
Four-egg Clutches, n=7;
Variable, Eggs 1-4 Value of F3>18 Significance of F
Dry Weight of Yolk 0.812 ns
Dry Weight of Albumen 0.0.624 ns
Dry Weight of Shell 5.140 *
Yolk Lipid Weight 1.217 ns
Yolk Lean Dry Weight 0.504 ns
Five-egg Clutches, n=9;
Variable, Eggs 1-5 Value of F4>32 Significance of F
Dry Weight of Yolk 0.930 ns
Dry Weight of Albumen 1.728 ns
Dry Weight of Shell 2.564 ns
Yolk Lipid Weight 2.457 ns
Yolk Lean Dry Weight 0.235 ns
ns = Not Significant, p>0.05 * = Significant, p<0.05
21
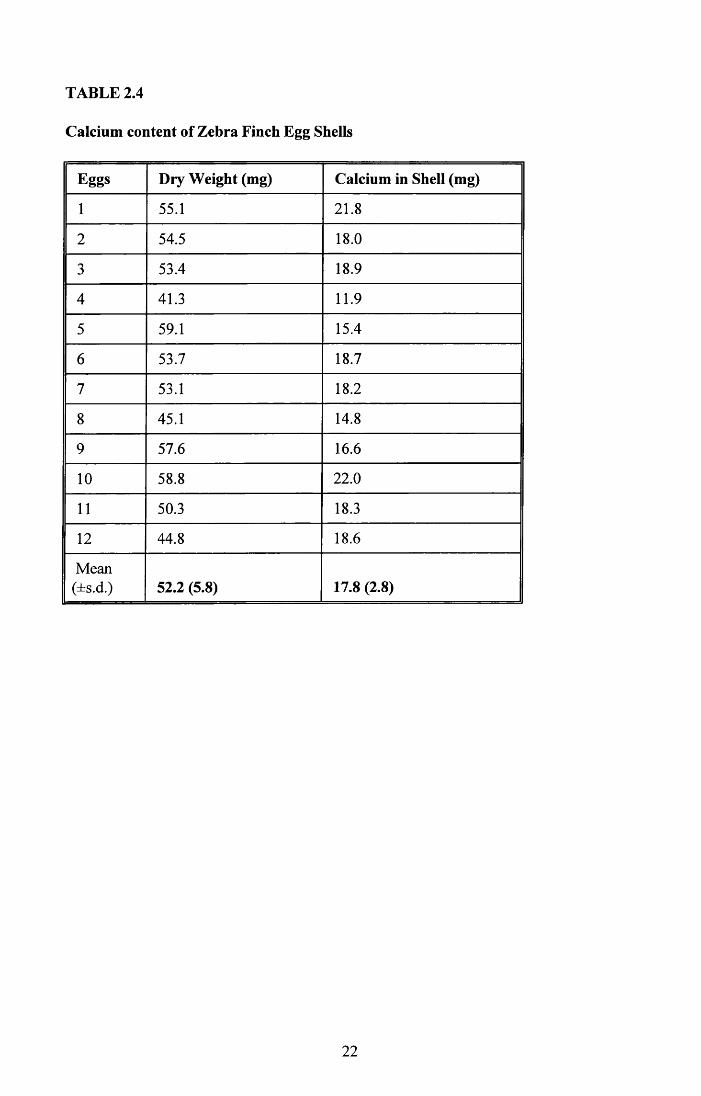
TABLE 2.4
Calcium content of Zebra Finch Egg Shells
Eggs Dry Weight (mg) Calcium in Shell (mg)
1 55.1 2 1 . 8
2 54.5 18.0
3 53.4 18.9
4 41.3 11.9
5 59.1 15.4
6 53.7 18.7
7 53.1 18.2
8 45.1 14.8
9 57.6 16.6
1 0 58.8 2 2 . 0
1 1 50.3 18.3
1 2 44.8 18.6
Mean(±s.d.) 52.2 (5.8) 17.8 (2.8)
22
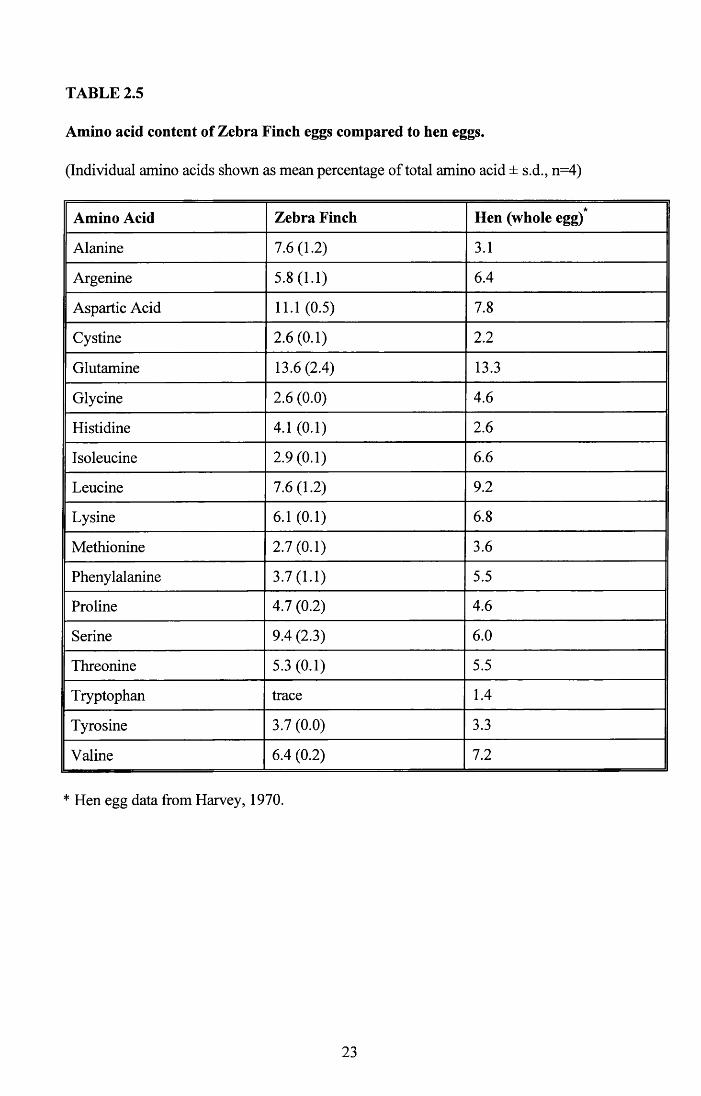
TABLE 2.5
Amino acid content of Zebra Finch eggs compared to hen eggs.
(Individual amino acids shown as mean percentage of total amino acid ± s.d., n=4)
Amino Acid Zebra Finch★
Hen (whole egg)
Alanine 7.6 (1.2) 3.1
Argenine 5.8 (1.1) 6.4
Aspartic Acid 11.1 (0.5) 7.8
Cystine 2 . 6 (0 .1 ) 2 . 2
Glutamine 13.6(2.4) 13.3
Glycine 2 . 6 (0 .0 ) 4.6
Histidine 4.1 (0.1) 2 . 6
Isoleucine 2.9 (0.1) 6 . 6
Leucine 7.6 (1.2) 9.2
Lysine 6 . 1 (0 . 1 ) 6 . 8
Methionine 2.7 (0.1) 3.6
Phenylalanine 3.7 (1.1) 5.5
Proline 4.7 (0.2) 4.6
Serine 9.4 (2.3) 6 . 0
Threonine 5.3 (0.1) 5.5
Tryptophan trace 1.4
Tyrosine 3.7 (0.0) 3.3
Valine 6.4 (0.2) 7.2
* Hen egg data from Harvey, 1970.
23
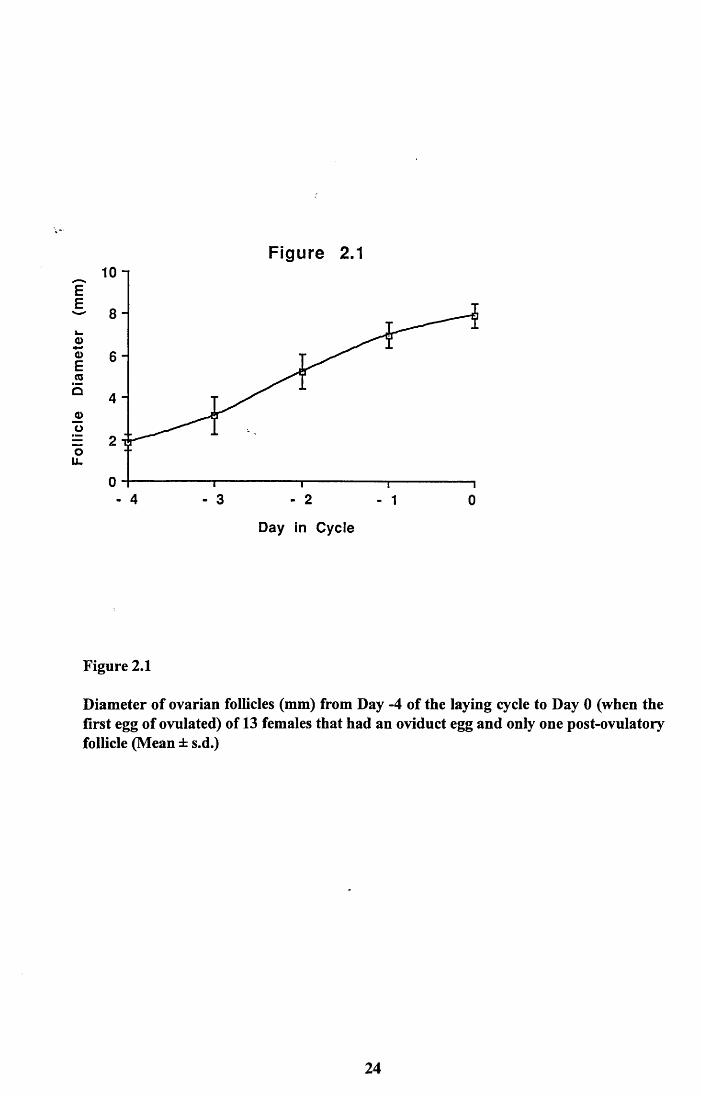
Figure 2.110 n
EE
k.<D©E(05oooLL
- 4 3 2 01
Day in C yc le
Figure 2.1
Diameter of ovarian follicles (mm) from Day -4 of the laying cycle to Day 0 (when the first egg of ovulated) of 13 females that had an oviduct egg and only one post-ovulatory follicle (Mean ± s.d.)
24
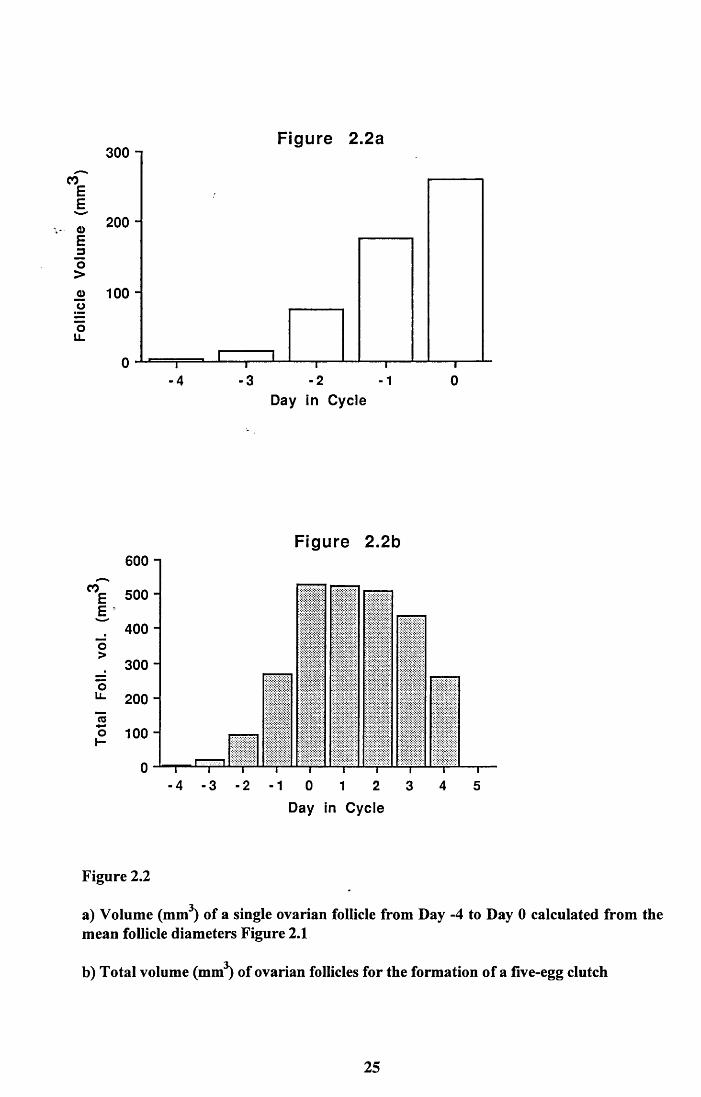
Figure 2.2a300 i
200 "<DE------------------------------------------------------ ----------J3O>o 100 "
o ______________________________ _______
ou.
0 i I i 1 I 1------------ 1------ 1— *-------r-4 -3 -2 -1 0
Day in C y c le
Figure 2.2b600 -
c*rE 500 -E ’
400 “o>
300 "
Foil
200 "(0o\- 100 -
0 I ' i i— i— i— i—a—i— i—LL“ i—— r-4 -3 -2 -1 0 1 2 3 4 5
Day In C y c le
Figure 2.2
a) Volume (mm3) of a single ovarian follicle from Day -4 to Day 0 calculated from the mean follicle diameters Figure 2.1
b) Total volume (mm3) of ovarian follicles for the formation of a five-egg clutch
25
150 nFigure 2.3
U)E
& 60 Ho
120 -
90-
30 H
0 P _ 0 fjI
I/////
//////////////
7]/////////////
7]/////////////
- Z .
□ ovary lipid□ ovary Idw
/////// *
4 - 3 - 2 - 1 0 1Day in C y c le
Figure 2.3
Lipid and Lean Dry Weight (protein) content (mg) of the ovary during the cycle of birds laying, or likely to lay, a five-egg clutch (mean ± s.d.)
Day -4 -3 -2 -1 0 1 2 3 4 5 6 7
n 4 6 9 6 10 3 - 1 4 5 4 4
26
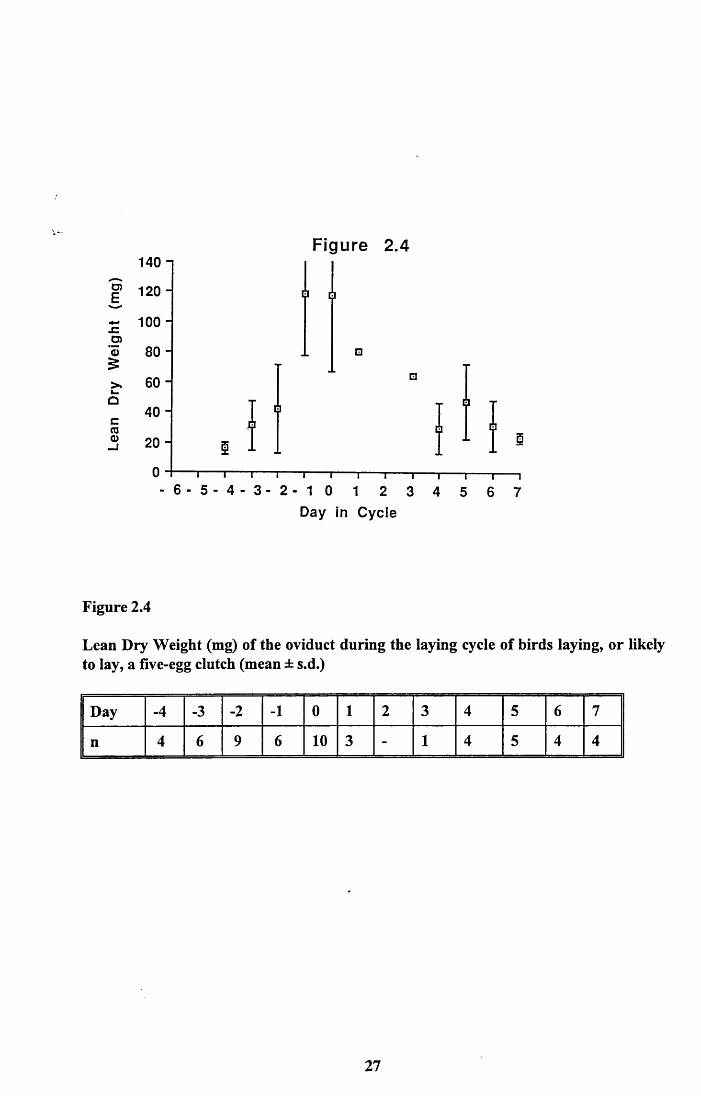
Figure 2.4140 n
120 -
- 100 - oo 80 - £>. 60- k.Q
40-
20 -
6 - 5 - 4 - 3 - 2 - 1 0 1 2 3 4Day in C y c le
Figure 2.4
Lean Dry Weight (mg) of the oviduct during the laying cycle of birds laying, or likely to lay, a five-egg clutch (mean ± s.d.)
Day -4 -3 -2 -1 0 1 2 3 4 5 6 7
n 4 6 9 6 10 3 - 1 4 5 4 4
27
o>E,c
’a>
oQ.
1501
100 "
50"
Figure 2.5a £ 3 Oviduct protein
□ A lbum en protein
Yolk protein
-4 - 3 - 2 - 1 0 1 2
Day in cycle3 4 5
150 "I Figure 2.5b
O)E■u‘q .
100 -
50"
0 i 'I i i 1 i — r—̂— i—-4 -3 -2 -1 0 1 2 3 4 5
Day in cycle
Figure 2.5
a) Quantity of protein (mg) required on each day of the laying cycle for the production of a five-egg clutch, including oviduct growth
b) Quantity of lipid (mg) required on each day of the laying cycle for the production of a five-egg clutch
28
2.4 DISCUSSION
The purpose of this chapter is to establish what investment the female Zebra Finch makes
in her clutch. To do this the required parameters were investigated; clutch size, contents of
the eggs, laying interval and the duration of the rapid growth phase of ovarian follicles
(Walsberg, 1983). With these it is possible to determine the extent and the timing of the
investment.
2.4.1 Analysis of eggs
The analysis of 105 eggs revealed that the eggs laid by female Zebra Finches in this study
were not unusual for small passerines. Rahn et al (1975) estimated an egg of approximately
12.5% of body weight for altricial passerines. In fact the mean egg weight in this study was
1.098g which is 7.2% of the mean female body weight and the Zebra Finch egg is,
therefore, representative in size for an altricial species. In addition, the predicted water
content was 80% (Sotherland and Rahn, 1987) and the actual value was 77.5%. The mean
egg weight of 1.098g is slightly heavier than those in the study of El-Wailly (1966) who
recorded 0.98g as a mean egg weight. The clutch size in the same study was slightly less
also, being 3.9 eggs compared to 5.0 eggs in this analysis. A possible reason for this
difference is that the diet provided by El-Wailly (1966) was not seed but a powdered
poultry pellet feed. Another possible cause may have been that the females in this study
were considerably heavier, at 15.25 ± 0.19g (n = 110) compared to 12.8g (El-Wailly, 1966).
Analysis of the eggs by sequence of laying (Table 2.1) did not reveal any significant
change in egg weight with sequence. This is not unusual, the Pied Flycatcher, which is of
comparible size to a Zebra Finch, does not display any decline of egg size in its mean 6.3
egg clutch (Ojanen, 1983).
A decline in egg mass with laying sequence has been recorded for some species, e.g. Coot
(Alisaukas and Ankney, 1985), Herring Gull (Parsons, 1976). Krementz (1984) noted a
trend towards decreasing egg size with sequence in the House Sparrow. In some other
species of passerine egg mass tends to increase with laying sequence, for instance the
Bengalese Finch (Coleman & Whittal, 1990) and the Tree Swallow (Wiggins, 1990), which
29
may be a strategy to counter differences in the size of nestlings following asynchronous
hatching.
It was found that for Zebra Finches that laid a four egg clutch, the shell of the last egg was
significantly lighter than the shell of the first egg (Table 2.3). This did not occur in larger
clutches and suggests that in birds laying smaller than average clutches, the ability to
provide calcium for the eggshell might be limited for the last eggs.
The lipid content of the eggs was 58.3mg, protein content was 128.1 mg, carbohydrate
content (estimated) 6 .8 mg and calcium content 17.8mg.
The carbohydrate content of eggs is generally ignored by authors due to its relative
insignificance (2.7% of dry egg weight)(Alisaukas and Ankney, 1985, Houston et al, 1983,
Krementz, 1984, Murphy, 1986, Schifferli, 1976). Of the material left after the extraction of
lipid, Lean Dry Weight, 95% of this is estimated to be protein and only 5% carbohydrate
(Sotherland & Rahn, 1987).
In the Zebra Finch egg lipid was confined to the yolk and none was measured in the
albumen. Murphy (1986) and Schifferli (1976) found the same for the eggs of Eastern
Kingbirds and House Sparrows respectively. The yolk was 56.6% of egg dry weight
excluding the shell, and its lipid content was 30.2% of the dry weight of the egg excluding
the shell. These values are typical of altricial species (Carey, 1983, Murphy, 1986).
2.4.2 Development of the Ovary
Investigation of the rate of follicular development revealed that the period of rapid growth
in Zebra Finches lasts four days. No developing follicles were identifiable prior to Day -4
(Figure 2.1). The rapid growth phase has been cited for various species of passerines as
between 2-3 and 5 days. For example the Pied Flycatcher is recorded at 4 days (Ojanen,
1983), House Sparrow, 4 days (Krementz, 1984, Schifferli, 1976). King (1973) points out
that the maximum rate of investment by a female in her clutch is attained only when the
clutch size is five eggs or more, the laying interval is daily and the yolk is deposited over
30
four days. The Zebra Finches in this study were fulfilling all of these criteria and therefore
they would have reached the maximum rate of investment while producing their eggs.
I estimated that the ovary minus its developing follicles contained no lipid. The Pied
Flycatcher is recorded as having very little lipid in the developing ovary, only 4.6%
(Ojanen, 1983). However, this may have been an over-estimate because a petroleum
ether-chloroform solvent mixture was used for lipid extraction. Dobush, et al.(1985)
indicated that such a mixture will remove non-lipid material from tissue. This gives an
artificially high measure of lipid content. Solvents used alone do not tend to do this. I
assumed, therefore, that all of the lipid extracted from developing ovaries was from the
follicles and not the tissue of the ovary itself.
2.4.3 Development of the oviduct
The oviduct increases in weight very rapidly (Figure 2.4) at the same time as the ovary.
Lean dry weight undergoes a ten fold increase over just three days with the majority of
growth during Day -2 to -1. Between Day -1 and 0 the weight does not change and the
oviduct is ready to accept the first yolk. From this day on the oviduct loses weight.
Although from Day 0 to Day 4 I have little data I think I am justified in assuming that the
oviduct declines in a more or less constant manner (see below). This decrease in weight
could potentially provide up to 14.12mg of protein per day, Day 0 to 5 .1 could detect no
lipid in the oviduct and therefore I have assumed that the increase in lean dry weight is due
to protein. Several species of bird display a similar pattern of oviduct growth during the
pre-laying stage followed by a significant decline to the end of laying; House sparrow
(Krementz, 1984, Schifferli, 1976), Brant (Ankney, 1984), Mallard Duck (Krapu, 1981),
Canvasback Duck (Barzen and Serie, 1990) and the Pied Flycatcher (Ojanen, 1983).
It has been suggested that the oviduct may act as a storage organ for protein during
reproduction (Krementz and Ankney, 1986). The possible consequence of this will be
discussed later.
31

2.4.4 Nutritional investment in a five-egg clutch
Having investigated the criteria that are of importance to nutrient demand during egg
production (egg contents, clutch size, laying interval, and the length of the rapid growth
phase of follicular development) it was possible to construct a daily budget for protein,
lipid (Figure 2.5a and b) and calcium. The results reveal that when laying a five-egg clutch
the female experiences a rapid increase in demand for protein and lipid as the follicles on
the ovary grow and the oviduct increases in size. This gives maximal demands for lipid on
Day 0 and protein on Day 1. Thereafter the demands drop off each day as the eggs are laid.
This nutrient budget is directly comparible with estimates of energy investment required
for egg production in other passerines; House Sparrow (Krementz and Ankney, 1986),
Pied Flycatcher (Ojanen, 1983).
This nutrient budget, in relation to food intake and nutrient reserve dynamics will be
discussed more fully later.
32
CHAPTER 3 - LIPID, PROTEIN AND CALCIUM CONSUMPTION OF ZEBRA
FINCHES DURING BREEDING
3.1 INTRODUCTION
Egg production is a major nutritional investment. In terms of energy the estimated peak
daily cost of egg production ranges from 37-55% of basal metabolism (BM) in some
passerine species to 160-216% of BM in ducks and the Brown Kiwi (Walsberg, 1983). The
manner in which nutrients are acquired for ovogenesis is not fully understood for most
wild birds. There are three possible routes; an increase in dietary intake, the use of internal
stores or reducing allocations to other activities. For no species has the relative importance
of all three of these avenues been determined (Walsberg, 1983).
There are extensive examples of each of these three potential routes to be found in previous
studies of birds. An increase of 175% in the time spent foraging by the laying female
compared to the male during the same period has been described for the Mallard Duck
(Dwyer et al, 1979). In White-crowned Sparrows the difference was 11% (Hubbard, 1978).
As mentioned above it is to be expected that an Anseriform would require a greater
increase than a Passerine because of the difference in relative energetic costs of egg
production between the two groups.
There are a number of studies that have investigated the role of energy/nutrient stores in
ovogenesis. Laying female Wood Ducks lose body lipid equivalent to 8 8 % of the energetic
requirements of egg production (Drobney, 1980) and female Mallards loose up to 25% of
their body weight in lipid during the pre-laying and laying period (Krapu, 1981). Body
reserves of protein may be the limiting factor in egg production in Canada Geese as they
are depleted by roughly the same amount as is required for the eggs (Raveling, 1979). A
similar role for nutrient reserves in clutch formation is also suggested for the Lesser Snow
Goose (Ankney & Maclnnes, 1978).
Finally, reduction in the locomoter activity of the female at the time of egg formation has
also been documented. The female Willow Flycatcher allocates 13% less energy to activity
33
during the laying period than does the male (Ettinger & King, 1980). This reduction
appears to compensate for synthetic costs with the result that the female's daily
expenditure averages 5% less during the laying period than does the male's.
The aim of this chapter is to investigate the daily intake of female Zebra Finches during
egg production compared to non-breeding females. Having done this the nutritional content
of the diet will be measured so that a budget of nutrient intake can be constructed for each
day of the laying cycle. Budgeting of nutrients during egg production from food eaten
(exogenous nutrients) will be discussed in relation to nutrients derived from body reserves
(endogenous nutrients) in Chapter 4.
In the wild, Zebra Finches inhabit a wide variety of habitats throughout mainland
Australia, from arid regions to farmland. The feeding ecology of wild populations has been
studied by Serventy (1971), Davies (1977), Morton and Davies (1983) and Zann and Straw
(1984). Zebra finches are predominantly granivorous and there is little evidence of
insectivory, even while breeding (Zann and Straw, 1984). The species is considered to be
an opportunistic breeder, responding to a combination of rainfall and temperature to initiate
breeding (Davies, 1977).
The Zebra Finch has also been widely used in the laboratory, partly due to its ability to
breed throughout the year. The energetics of egg laying and incubation by captive Zebra
Finches has been studied by El-Wailly (1966) and the energetics of incubation by Vleck
(1981).
34
3.2 MATERIALS AND METHODS
A series of feeding trials were used to measure the food intake of Zebra Finches during the
egg producing period. Initially I compared separate pairs of males and females to see if
there were any major differences in the food intake of the two sexes. I then compared pairs
of mixed sex, some of which bred and some of which did not.
The experiments were carried out in cages modified to allow the collection of uneaten seed
and the temperature was maintained at 23°C ± 2°C. Efficiency of food utilisation is
maximal at 24.4°C for Zebra Finches (El-Wailly, 1966).
3.2.1 Comparison of food intake by males and females.
This initial trial was designed to establish if there was any difference between the food
intake of males and females. This was necessary because when looking at the intake of
breeding birds it would not be possible to keep the sexes separate.
The normal cages were modified slightly to allow the collection of all uneaten seed. When
finches eat seed, they manipulate it in their bill to remove the husk, and in the process
some seed is dropped. It was important that all spilt seed and husk was collected as well as
the uneaten seed in the dish so that consumption was not overestimated. This was achieved
by the fitting of a layer of Benchcoate to the base of the cage from which all uneaten seed
could be swept. The cages also had a sheet of clear perspex attached to the open front of
the cage to prevent seed and husk being lost by that route.
The birds were provided with a single seed diet (panicum millet, Panicum miliacum)
instead of their usual mixed seed diet. This was done to allow easier interpretation of the
results by preventing preferential selection of seeds from a mixture, which is known to
occur (Diaz, 1990). The change of diet to a single seed was not thought to be of great
significance to the birds. In studies of wild finches it was found that they tend to specialise
on one variety of seed and that this accounts for most of the seed eaten (Morton and
Davies, 1983, Zann and Straw, 1984). In addition, the seeds eaten in the wild are very
similar to the millet supplied and in some cases are of the same genus, Panicum.
35
Three pairs of males and three pairs of females were used in this trial for 10 days. The birds
were put into the cage and a known weight of seed provided daily. The seed, spilt seed and
husk were weighed each day at the same time plus or minus one hour. The weight of the
cuttlefish bone was also recorded daily.
3.2.2 Comparison of food intake by breeding and non-breeding pairs
The food consumption of breeding and non-breeding pairs was measured in a similar way,
each pair being provided with a known weight of seed and cuttlefish bone each day.
Because dried grass had to be supplied for nesting material, the spilt seed was collected by
passing the contents of the cage base through a 5mm sieve to separate the seed from the
nesting material. The weight of seed and cuttlefish bone consumed was measured each day.
The nestbox was checked regularly for eggs. All eggs were immediately removed after
laying and replaced with a plaster dummy. This was done because occasionally the birds
will eat their eggs and this would have obviously influenced their food consumption.
When eggs were eaten before the dummy was provided that trial was abandoned and the
previous results ignored. The male and female were first kept in adjacent cages for seven
days before being introduced. Food consumption was monitored from the day of
introduction. Those pairs that produced a clutch were followed until seven days after the
last egg was laid. Those that did not breed were followed for ten days and used as a control.
3.2.3 Nutritional value of seed and cuttlefish bone
Lipid, protein and calcium levels were measured in the panicum millet and lipid and
protein only in the foreign finch mix. All analysis was done on dehusked seed because the
finches remove the husk from the seed before ingesting it. This was done by lightly
grinding the seed in a pestle and mortar and blowing off the husk.
3.2.3.1 Lipid content of seed
Lipid content of the seed was obtained by soxhlet extraction of the dried sample using
chloroform, following the technique described for eggs in Chapter 2.
36
3.2.3.2 Protein content of seed
Dehusked panicum millet and mixed seed were dried at 50°C to constant weight and then
powdered with a pestle and mortar. 1,0g aliquots were digested in 10.0ml of 0.3M sodium
hydroxide (NaOH) at 37°C until the powder had completely dissolved. For each sample
two 1.0ml aliquots of digest were taken and a dilution of 1:10 made with 0.3M NaOH.
The protein content of each sample was measured using a modification of the Lowry
protein estimation (Lowry et al, 1957).
Reagents
Solution A - 2% NaC0 3 in 0.1 M NaOH
Solution B -1% CuS0 4
Solution C - 2% K.Na.tartrate
Solution D - 100ml of A + 1ml of B + 1ml of C (in that order).
Folin's reagent.
Technique
1 - 100 pi of sample added to 3ml of solution D, while mixing. Incubate at room
temperature for 1 0 minutes.
2 - Add 0.3ml of half strength Folin's reagent while mixing. Incubate for 30minutes at
room temperature.
3 - Read in a spectrophotometer at 750nm in a quartz cuvette.
Standards
Standards were made using bovine serum albumen (BSA). A stock solution of 2 mg/ml
BSA was used to make standards of 0, 10,20, 30 and 40 pg/lOOml. Estimations of protein
content in unknown samples were made by converting 750nm readings to pg protein
/100pl using the equation derived from the standard curve (Figure 3.1).
mg of protein / 100ml assay = Absorbancv at 750nm - 0.0020.006
37
3.2.3.3 Amino acid analysis of panicum millet
Amino acid analysis was carried out on the panicum millet only. Dehusked seed was freeze
dried and powdered using a pestle and mortar. 1 .0 0 g samples of powdered seed were sent
for analysis by Dr. I.D. Hamilton and Mr. J. Jardine of the Biochemistry Department,
University of Glasgow and also by Dr. J. McNab at the Institute of Grassland and Animal
Production, Roslin. The results obtained from both were very similar and so I have
combined them.
3.2.3.4 Calcium content of panicum millet and cuttlefish bone
The technique used to determine calcium content was the same as that described in Chapter
2 for egg shells. The following slight differences were made in the preparation of the
samples before the analysis.
Calcium content was measured only for the panicum millet. Six samples of seed were
dehusked and then dried at 70°C to constant weight. They were then placed in pre-weighed
crucibles and ashed at 650°C for 6 hours in a muffle furnace. The crucibles were allowed to
cool in a desiccator before weighing to 0.000lg. The ash was then powdered and samples
of 0.0500g taken for analysis. Each sample was prepared as follows;
1- The 50mg of ash was dissolved in 10ml of 8 N hydrochloric acid.
2- 5ml of nitric acid was added.
3- Deionised water was used to wash the solution through filter paper into a 100ml
volumetric flask.
4- The solution was made up to 100ml with deionised water. This was called the "stock"
solution and was stored in polythene bottles until analysis.
Standards were prepared as in Chapter 2 and the same analysis procedure followed. The
final solution for analysis was 0.04ml of Lanthanum chloride made up to 20ml with the
"stock" solution. Two aliquots of "stock" from each seed sample were prepared and read in
duplicate on the spectrophotometer.
38
Samples of cuttlefish bone were also analysed for their calcium content. 10 pieces of
cuttlefish bone were selected at random. The samples were dried at 70°C to constant
weight and then placed in pre-weighed crucibles and ashed at 650°C for 21 hours in a
muffle furnace. A 0.0500g sample of ash was taken from each and they were prepared
exactly as described for the seed. However, before the final reading, the "stock" solution
required a 1:50 dilution and the addition of lanthanum chloride. 0.50ml of the stock was
taken with 0.05ml of lanthanum chloride and made up to 25ml with deionised water. This
was done twice with aliquots from the "stock" solution and each was read in duplicate on
the spectrophotometer.
39
3.3 RESULTS
3.3.1 Comparison of food intake by males and females
Three pairs of males and three pairs of females were monitored for 10 days. Table 3.1
shows the results. Male birds consumed about 7.6% more seed each day than females
(1=2.26, d.f.=58, p=0.03).
I then compared the individual pairs by one way ANOVA and a Tukey multiple range test.
This identified one pair of males that had a significantly higher mean seed consumption
than the other pairs. The other two male pairs were not significantly different to the female
pairs. This means that the significant result in the t-test is caused by only one of the male
pairs.
A study performed by an honours student, Rachel Fairly (pers. comm.), using the same
procedure showed no difference between the seed consumption of male and female pairs (
t9 4 =0 . 1 8 2 , n.s.).
Therefore, in most cases there is no significant difference in the seed intake of male and
female birds.
3.3.2 Comparison of food intake by breeding and non-breeding pairs
Figure 3.2 shows the combined means for 11 pairs that were introduced but did not
produce a clutch. Oneway ANOVA detected no difference in the daily means for the
eleven pairs, F9 84=1.310, p=0.244, not significant.
The mean seed consumption for this trial was 5.8 ± 1.2g per pair per day, n=94. Assuming
that both sexes consumed equal quantities, each bird ate 2.9g/day when not breeding.
Figure 3.3 shows the mean daily seed consumption for 9 breeding pairs. As the different
pairs did not begin to lay on the same day, the results were compiled from the day that the
first egg was laid. Generally, the birds laid about a week after introduction, therefore I
could only plot pre-laying data back to Day - 6 for all the pairs. The daily seed consumption
40
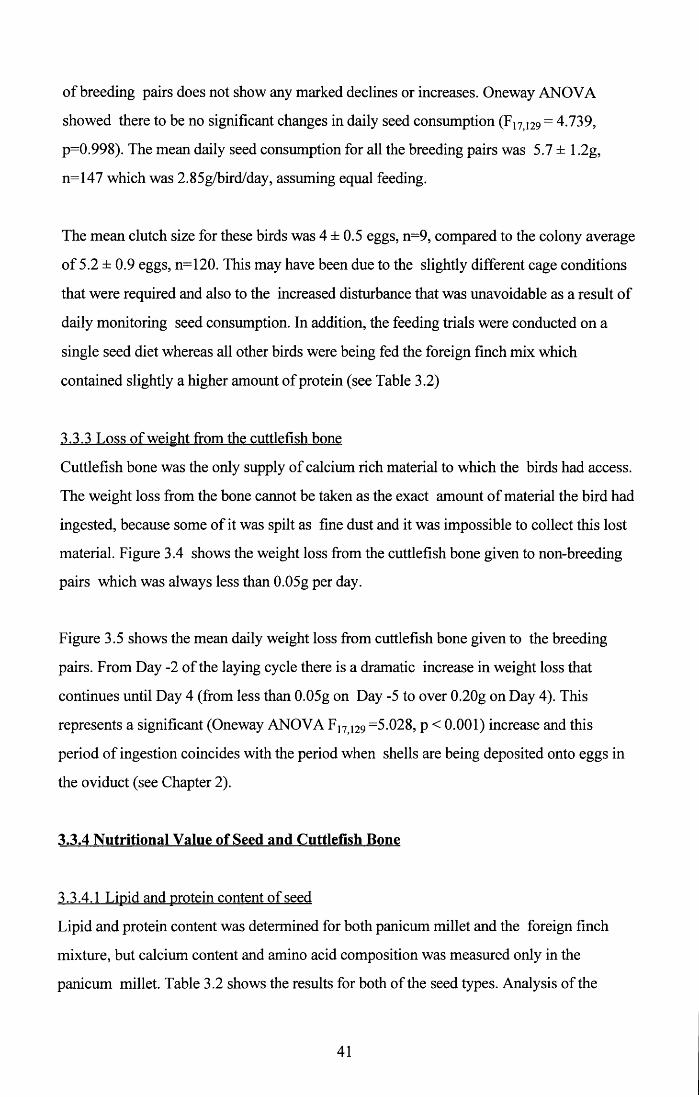
of breeding pairs does not show any marked declines or increases. Oneway ANOVA
showed there to be no significant changes in daily seed consumption (F17>129 = 4.739,
p=0.998). The mean daily seed consumption for all the breeding pairs was 5.7 ± 1.2g,
n=147 which was 2.85g/bird/day, assuming equal feeding.
The mean clutch size for these birds was 4 ± 0.5 eggs, n=9, compared to the colony average
of 5.2 ± 0.9 eggs, n=120. This may have been due to the slightly different cage conditions
that were required and also to the increased disturbance that was unavoidable as a result of
daily monitoring seed consumption. In addition, the feeding trials were conducted on a
single seed diet whereas all other birds were being fed the foreign finch mix which
contained slightly a higher amount of protein (see Table 3.2)
3.3.3 Loss of weight from the cuttlefish bone
Cuttlefish bone was the only supply of calcium rich material to which the birds had access.
The weight loss from the bone cannot be taken as the exact amount of material the bird had
ingested, because some of it was spilt as fine dust and it was impossible to collect this lost
material. Figure 3.4 shows the weight loss from the cuttlefish bone given to non-breeding
pairs which was always less than 0.05g per day.
Figure 3.5 shows the mean daily weight loss from cuttlefish bone given to the breeding
pairs. From Day -2 of the laying cycle there is a dramatic increase in weight loss that
continues until Day 4 (from less than 0.05g on Day -5 to over 0.20g on Day 4). This
represents a significant (Oneway ANOVA F]7129 =5.028, p < 0.001) increase and this
period of ingestion coincides with the period when shells are being deposited onto eggs in
the oviduct (see Chapter 2).
3.3.4 Nutritional Value of Seed and Cuttlefish Bone
3.3.4.1 Lipid and protein content of seed
Lipid and protein content was determined for both panicum millet and the foreign finch
mixture, but calcium content and amino acid composition was measured only in the
panicum millet. Table 3.2 shows the results for both of the seed types. Analysis of the
41
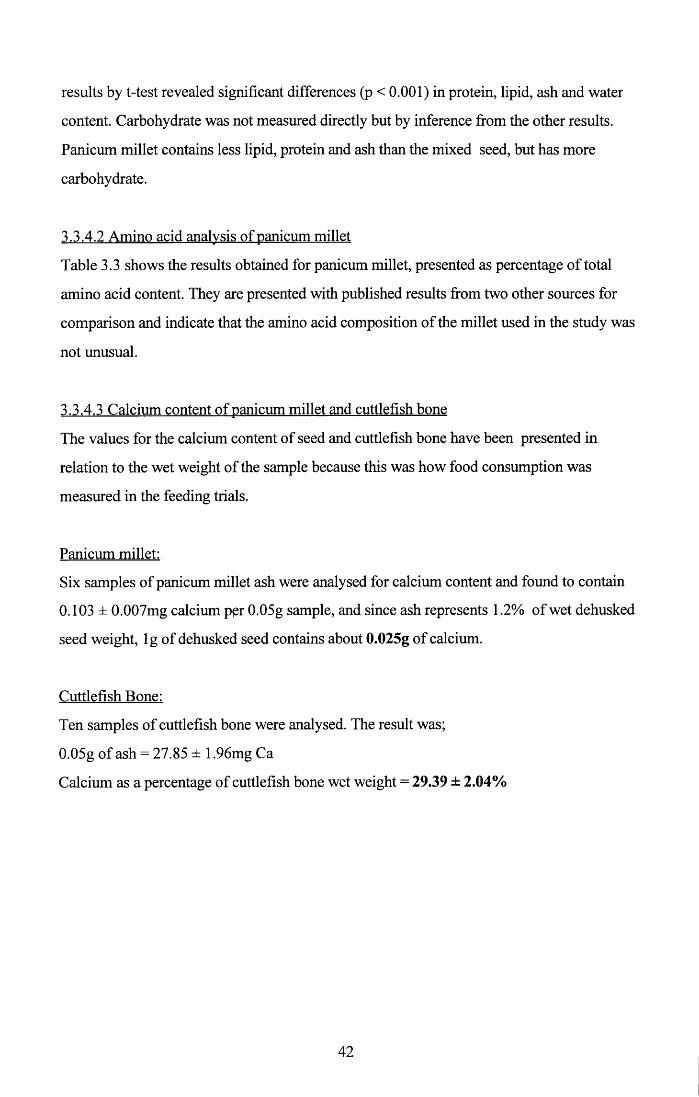
results by t-test revealed significant differences (p < 0.001) in protein, lipid, ash and water
content. Carbohydrate was not measured directly but by inference from the other results.
Panicum millet contains less lipid, protein and ash than the mixed seed, but has more
carbohydrate.
3.3.4.2 Amino acid analysis of panicum millet
Table 3.3 shows the results obtained for panicum millet, presented as percentage of total
amino acid content. They are presented with published results from two other sources for
comparison and indicate that the amino acid composition of the millet used in the study was
not unusual.
3.3.4.3 Calcium content of panicum millet and cuttlefish bone
The values for the calcium content of seed and cuttlefish bone have been presented in
relation to the wet weight of the sample because this was how food consumption was
measured in the feeding trials.
Panicum millet:
Six samples of panicum millet ash were analysed for calcium content and found to contain
0.103 ± 0.007mg calcium per 0.05g sample, and since ash represents 1.2% of wet dehusked
seed weight, lg of dehusked seed contains about 0.025g of calcium.
Cuttlefish Bone:
Ten samples of cuttlefish bone were analysed. The result was;
0.05g of ash = 27.85 ± 1.96mg Ca
Calcium as a percentage of cuttlefish bone wet weight = 29.39 ± 2.04%
42
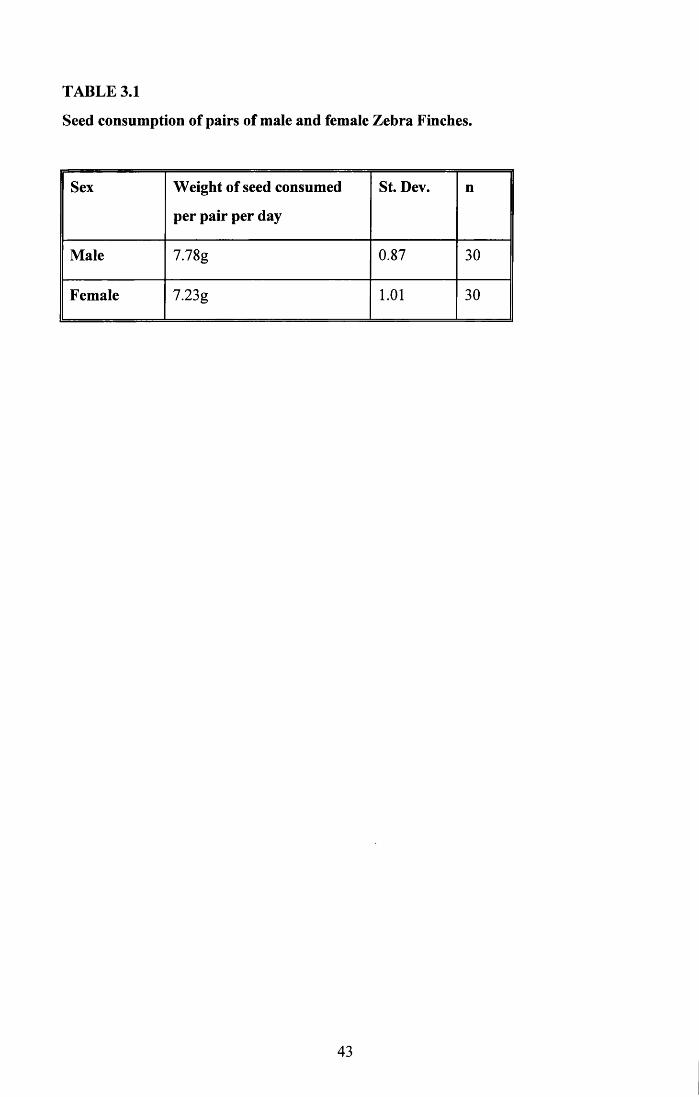
TABLE 3.1
Seed consumption of pairs of male and female Zebra Finches.
Sex Weight of seed consumed
per pair per day
St. Dev. n
Male 7.78g 0.87 30
Female 7.23g 1.01 30
43
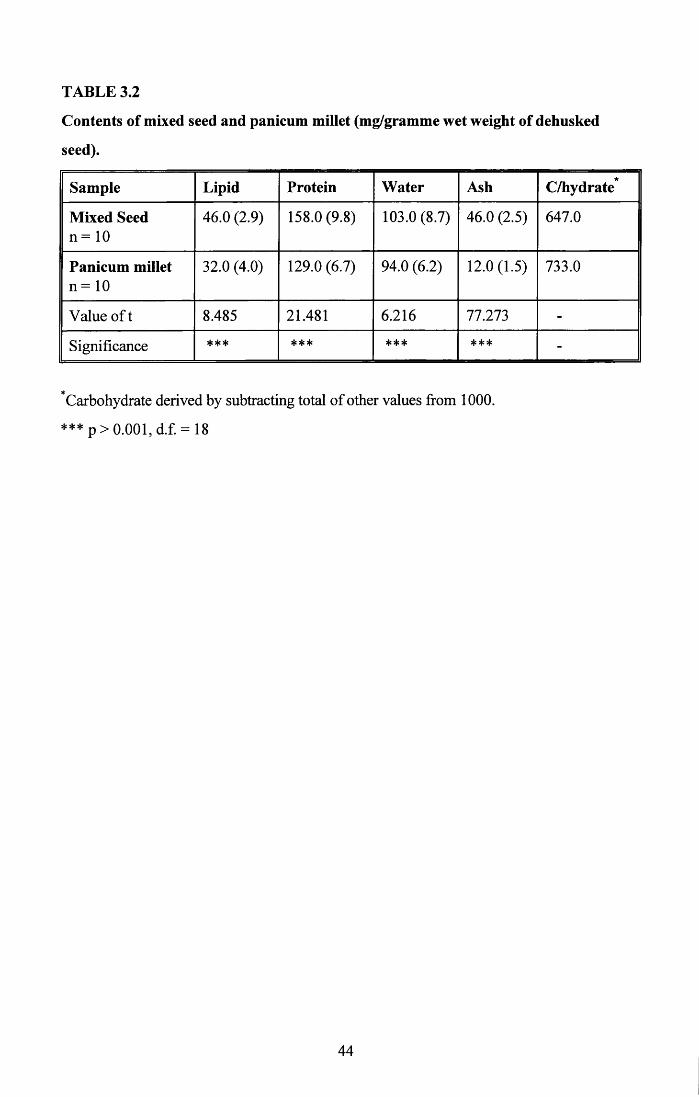
TABLE 3.2
Contents of mixed seed and panicum millet (mg/gramme wet weight of dehusked
seed).
Sample Lipid Protein Water Ash*
C/hydrate
Mixed Seedn = 10
46.0 (2.9) 158.0 (9.8) 103.0 (8.7) 46.0 (2.5) 647.0
Panicum milletn = 10
32.0 (4.0) 129.0 (6.7) 94.0 (6.2) 12.0(1.5) 733.0
Value of t 8.485 21.481 6.216 77.273 -
Significance *** *** *** *** -
^Carbohydrate derived by subtracting total of other values from 1000.
*** p> 0.001, d.f. = 18
44
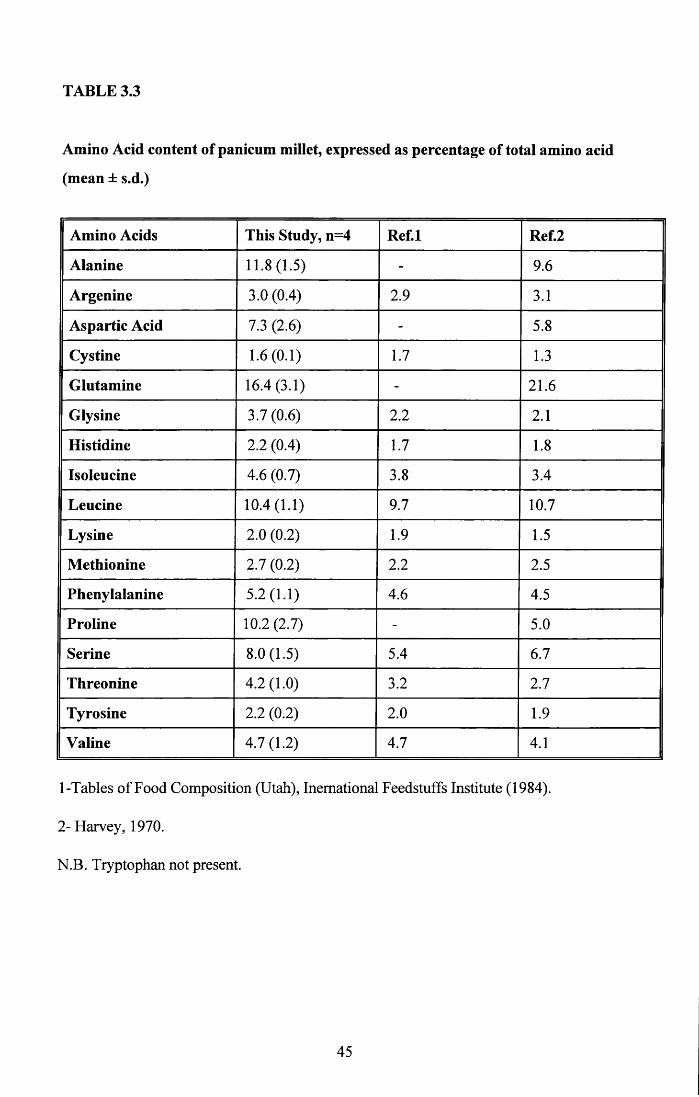
TABLE 3.3
Amino Acid content of panicum millet, expressed as percentage of total amino acid
(mean ± s.d.)
Amino Acids This Study, n=4 Ref.l Ref.2
Alanine 11.8(1.5) - 9.6
Argenine 3.0 (0.4) 2.9 3.1
Aspartic Acid 7.3 (2.6) - 5.8
Cystine 1.6 (0.1) 1.7 1.3
Glutamine 16.4 (3.1) - 21.6
Glysine 3.7 (0.6) 2.2 2.1
Histidine 2.2 (0.4) 1.7 1.8
Isoleucine 4.6 (0.7) 3.8 3.4
Leucine 10.4(1.1) 9.7 10.7
Lysine 2.0 (0.2) 1.9 1.5
Methionine 2.7 (0.2) 2.2 2.5
Phenylalanine 5.2 (1.1) 4.6 4.5
Proline 10.2 (2.7) - 5.0
Serine 8.0 (1.5) 5.4 6.7
Threonine 4.2 (1.0) 3.2 2.7
Tyrosine 2.2 (0.2) 2.0 1.9
Valine 4.7 (1.2) 4.7 4.1
1-Tables of Food Composition (Utah), Inemational Feedstuffs Institute (1984).
2- Harvey, 1970.
N.B. Tryptophan not present.
45
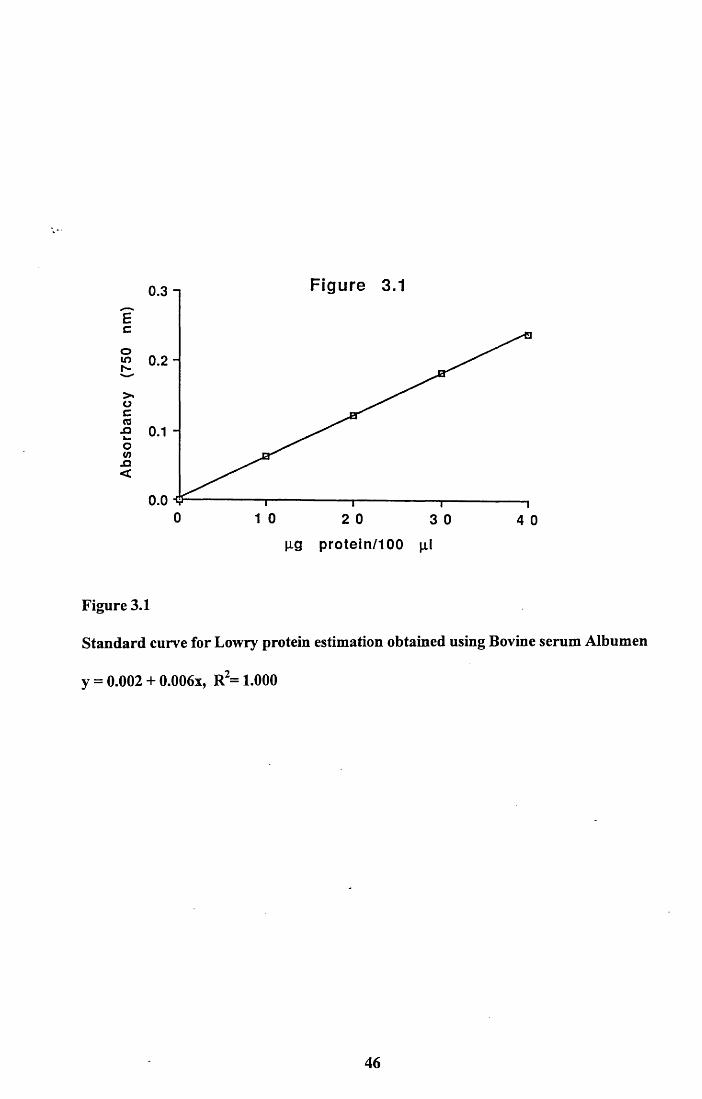
Figure 3.10.3
Ec
>*oc(0■S 0.1owx*<
0.00 1 0 2 0 3 0 4 0
p g p r o t e in /1 0 0 pi
Figure 3.1
Standard curve for Lowiy protein estimation obtained using Bovine serum Albumen
y = 0.002 + 0.006x, R2= 1.000
46
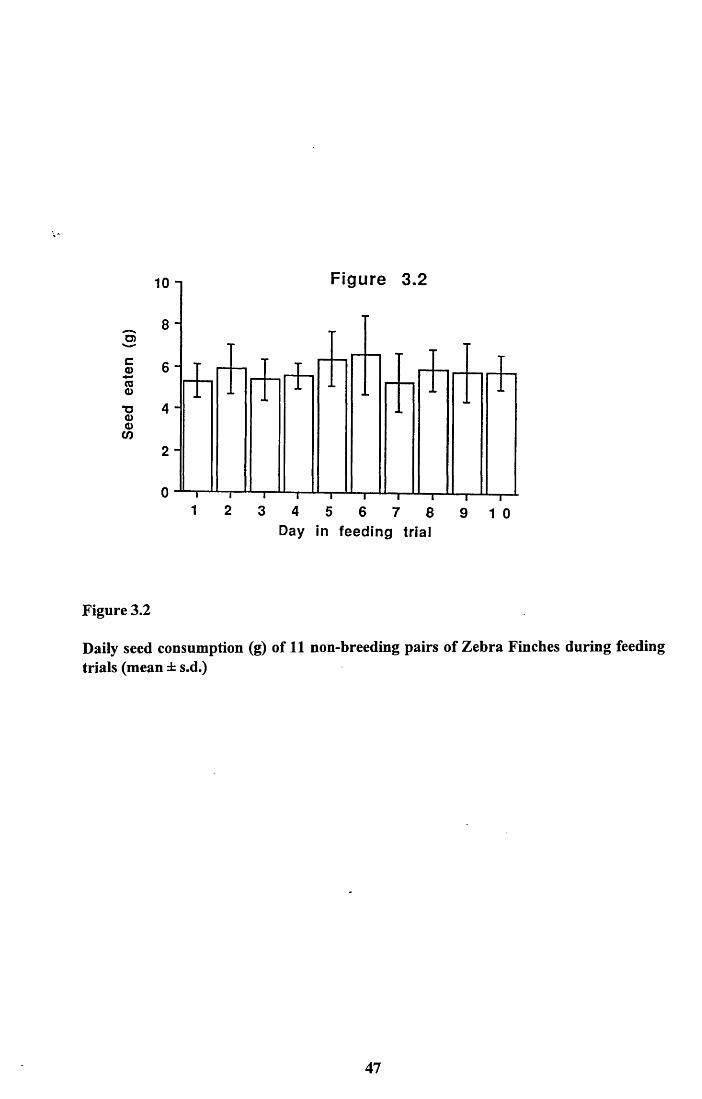
10 n Figure 3.2
o>c<Dcaa>■oo<D
CO
8 -
6 -
4 -
2 -
03 4 5 6 7 8
Day in f e e d in g trial
”i r9 1 0
Figure 3.2
Daily seed consumption (g) of 11 non-breeding pairs of Zebra Finches during feeding trials (mean ± s.d.)
47
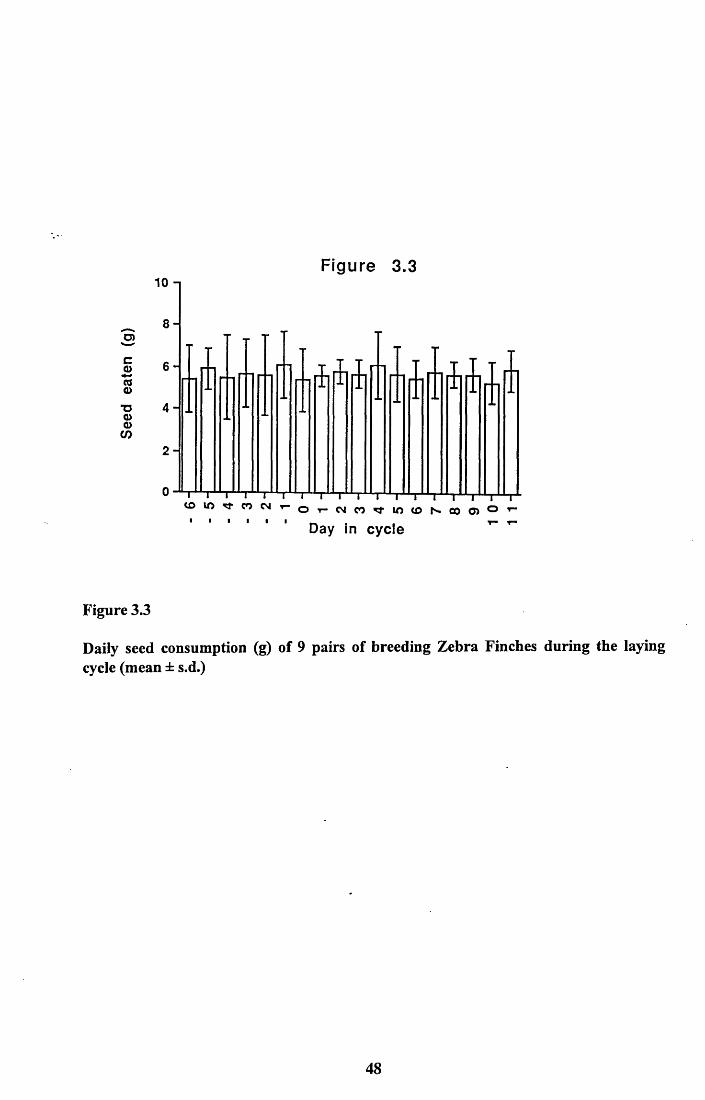
o>coTOQ>TJG>a>CO
10 - I
8 -
Figure 3.3
6 -
4-
2 - 1
li i i i r" r" i r ' r " i" i ” i ■■ i ■■ i" i ■ ■ i< 0 I O r r t * ) N r O r N n ^ i n ( f l |S<c00) o r
Day in c y c l e
Figure 3.3
Daily seed consumption (g) of 9 pairs of breeding Zebra Finches during the laying cycle (mean ± s.d.)
48
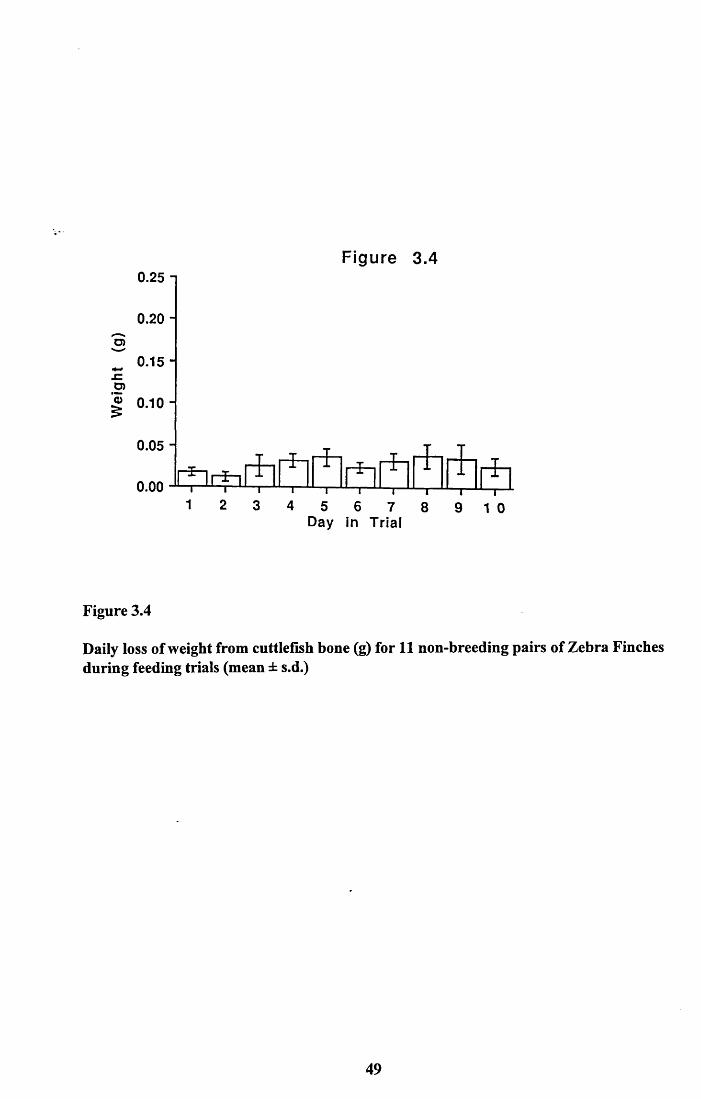
Figure 3.40.25 -
0.20 "c>
0.15 “JZo>a>£ 0.10 -
0.05 -
0.00 -I
4 5 6 7 8 9 1 0Day in Trial
Figure 3.4
Daily loss of weight from cuttlefish bone (g) for 11 non-breeding pairs of Zebra Finches during feeding trials (mean ± s.d.)
49
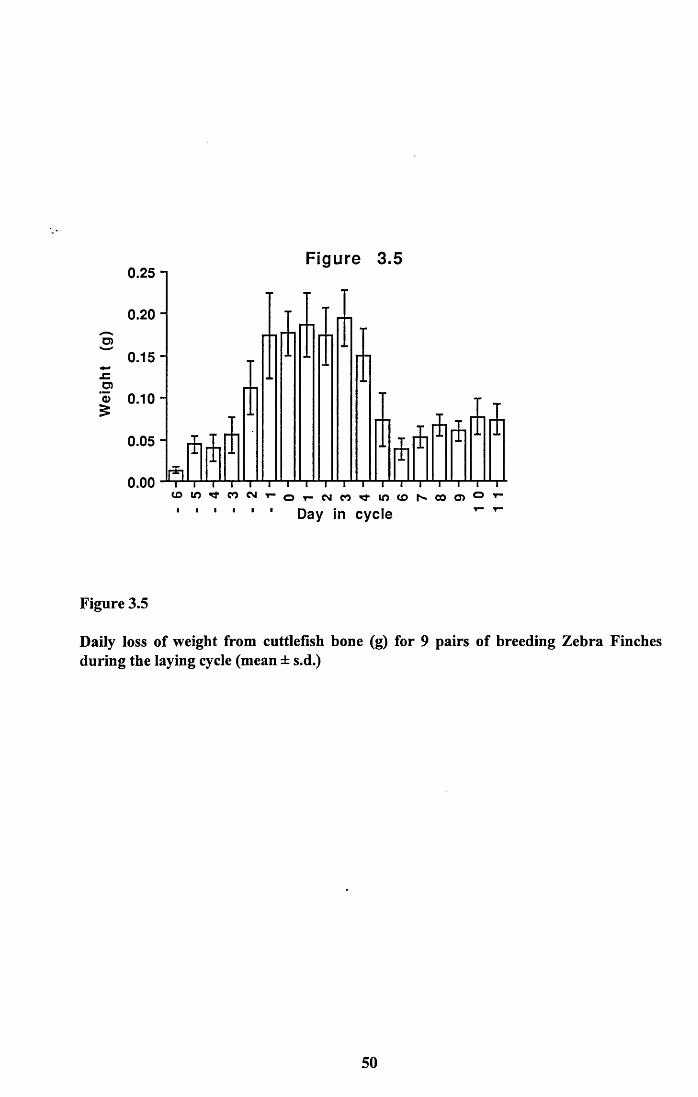
O)
o>
0.25 n
0.20 -
0.15 '
o 0.10
0.05 H
f l
Figure 3.5
itit i t t i
0 .0 0 i 111 “ i - i i i i i i i i i i i i i i il Oi n ^ n Nr 0 rCJn^in(flf<>COC)Or
' 1 ' ■ ■ ■ Day in c y c l e
Figure 3.5
Daily loss of weight from cuttlefish bone (g) for 9 pairs of breeding Zebra Finches during the laying cycle (mean ± s.d.)
50
3.4 DISCUSSION
3.4.1 Food intake of males and females
The results of the feeding trial to compare the daily seed consumption of male and female
Zebra Finches, showed no consistent significant difference between the sexes. El-Wailly
(1966) also reported no difference in the consumption of food by the different sexes of
Zebra Finch.
3.4.2 Food intake of breeding and non-breeding pairs
Comparing the consumption of breeding and non-breeding pairs did not reveal any
significant increase or decrease during the period of egg formation (Figures 3.2 and 3.3).
Mean non-breeding seed consumption was 5.8 ± 1.2g per day per pair, which is 2.9g per
bird. For breeding pairs the value was 5.7 ± 1,2g day per pair, or 2.85g bird.
These values compare well with the 3.0g per day consumption recorded for captive Zebra
Finches by Calder (1964). Wild Zebra Finches have an estimated seed consumption of 5.3g
per day when non-breeding (Zann and Straw, 1984). Although this figure is probably an
over-estimate it does reflect the difference in energy requirements of captive and free
ranging birds.
Prior to migration the Yellow Wagtail doubles its body weight. Most of this increase is due
to the deposition of fat but it is also partly due to hypertrophy of the flight muscles. During
this build up of weight there is no evidence of hyperphagia and little of diet change (Fry et
al, 1972). Therefore, the Zebra Finch is not exceptional in meeting a major nutritional
demand without increasing food intake.
There are three possibilities that might explain why a female Zebra Finch can produce a
clutch of eggs yet not increase her overall food intake;
1- The efficiency of digestion may be increased so that for a given quantity of food, more
nutrients are extracted.
51
2- Activity may be reduced while the eggs are forming so that energy saved in this way
may be diverted to the eggs.
3- The female may rely entirely on stored nutrient reserves to produce her clutch.
There is evidence to suggest that the first of these explanations may play some role.
El-Wailly (1966) described an increase in food consumption during egg laying compared
to a control period. In addition, the efficiency of food utilisation was significantly higher
during the egg laying period than the control or for males and females that were separated.
Control pairs were 77.8% efficient and nest-building/egglaying pairs 81.2% efficient (at
24°C). If the same were happening in my study then the finches could have liberated a
small amount of additional nutrients for egg production without increasing seed
consumption. The birds were receiving seed ad libitum and so there was no constraint on
the amount of seed that could be eaten. Foraging time was not a factor as the birds did not
need to forage as such and so would have been able to eat the same quantity of seed
regardless of reproductive state.
The second possibility, that females decrease their activity while forming eggs has been
discussed in previous studies. Fogden and Fogden (1979) failed to catch any female
Camaropteras at the time when they would have had eggs at the early stages of
development. They suggested that this may have been due to females remaining inactive in
order to prevent damage to newly forming shells. However, Schifferli (1976) investigated
this possibility in House Sparrows and found that eggs were not vulnerable to damage
caused by activity even when the shells were very thin. Therefore, fear of damage to the
eggs is unlikely to be the reason for reduced activity. The activity of breeding and
non-breeding Zebra Finches was investigated by an undergraduate student, Michael Glover
(pers. comm.), using the study colony. Electrically triggered perches recorded movements
of the birds and provided an index of activity over set time periods. This technique found a
significant difference in activity between breeding and control pairs. This difference was
expected during the incubation period, from about Day 2 (Vleck, 1981). Interestingly, there
was also substantially less activity recorded in breeding pairs during egg-laying; 4367 ±
173 perch movements compared to 10873 ± 703 perch movements of control pairs (t70=
52
8.11, p < 0.0001). Therefore, a reduction of activity by the female, if that occurs, during the
period when demands for egg production are high may be used to reduce overall energy
expenditure and release nutrients for the eggs that would otherwise be used for routine
metabolism.
The third possibility, that females do not rely on exogenous nutrients at all, but use
endogenous, stored nutrients will be fully discussed in Chapter 4. The use of endogenous
nutrients for egg production has been documented in a range of birds (see references in
Chapter 1) to varying degrees, from providing for the entire clutch in the Lesser Snow
Goose (Ankney and Machines, 1978) to not being used at all, as in the Cowbird (Ankney
and Scott, 1980).
3.4.3 Nutritional value of seed and cuttlefish bone
The major components of single millet and Foreign Finch mix were measured and the
results presented in Table 3.2. These results indicated that the Foreign Finch mix contained
higher proportions of lipid and protein. This difference is due to the fact that the mixture is
made up of seeds that have differing proportions of lipid and protein; some are protein rich,
some lipid rich (Diaz, 1990). All seeds provided for the finches were, however,
predominantly carbohydrate with only a small proportion of lipid and protein (3.2%,
12.9% and 4.5%, 15.8% for panicum millet and mixed seed diet respectively). A study of
the small, granivorous passerine, the white-crowned Sparrow, indicated that a diet
containing at least 8% protein would meet the maintenance requirements of many small
birds (Murphy, 1993a). The requirement for egg production is presumably higher than this
and in laying domestic fowl it is known that the diet should contain 17% protein (Nesheim
et al, 1979), however it should be remembered that the hen is a non-determinate layer and
has been selectively bred for as high an output of eggs as possible.
Of the three main nutrients being followed in this study; lipid, protein and calcium, what
then is the contribution that exogenous supplies make to egg production in the Zebra
Finch?
53
Lipid and Protein
The results of the feeding trial did not reveal any evidence of increased food intake
associated with the production of eggs. Similarly, in a study of the Bengalese Finch,
Coleman & Whittall (1990) reported that egg weight was not correlated with food intake,
which did not increase during egg-laying. Therefore, only by reducing their activity or by
increasing digestive efficiency, compared to non-breeding rates, could breeding Zebra
Finches make nutrients available for egg production.
Using the figures for the change in digestive efficiency from non-breeding to breeding
Zebra Finches published by El-Wailly (1966), I calculated the amount of nutrients that
such an increase would liberate. This calculation is only intended to illustrate the order of
magnitude of nutrients made available by enhanced digestive efficiency. I am also making
the assumption that energy and protein absorption efficiencies are similar. At 24.4°C the
digestive efficiency of non-breeding birds in El-Wailly's study was 77.8%. This increased
to 81.2% in breeding birds. Brody (1945) gave the efficiency of the conversion of dietary
nutrients to egg nutrients as 77%.
My feeding trial was conducted using a single millet, the contents of which were
determined (see above). Table 3.4 shows the difference in availability that such an increase
in digestive efficiency would make from the mean daily seed consumption of 2.85g. The
amount of extra protein potentially released in this way (12.5mg) would only represent
9.3% of the protein content of a Zebra Finch egg (from Table 2.1). It is not as easy when
considering lipid because lipids can be synthesised from carbohydrates. It is more
convenient, therefore, to consider them both in terms of energy. In order to do this I have
used the following figures for energetic value;
Lipid 9.0 to 9.5 kcal/g
Carbohydrate 4.0 to 4.5 kcal/g (Blem, 1990)
The range of values that this estimate would give is;
Lipid 0.003 x 9.0 to 0.003 x 9.5 = 0.027 to 0.028 kcal
54
Carbohydrate 0.071 x 4.0 to 0.071 x 4.5 = 0.284 to 0.320 kcal
In total this is a difference of between 0.311 and 0.348 kcal per day from the 2.85g of seed.
In terms of energy, the lipid content of one egg is;
0.0583 x 9.0 to 0.0583 x 9.5 = 0.525 to 0.554 kcal
Therefore, the extra energy released by the increase of digestive efficiency would represent
59.2% to 63.0% of that required for lipid in an egg. These figures do not, however, take into
account the conversion efficiency of changing dietry nutrients to egg nutrients which will
not be 100%. Thus these figures are likely to be overestimates. Nvertheless, it appears that
an increase of digestive efficiency at the time of egg production could potentially make a
significant contribution to the lipid content of the eggs. The same is not true for protein.
The low level of protein in the diet means that the increase of digestive efficiency would
play a smaller role.
The values in Table 3.4 are likely to be underestimates of the amount of nutrients made
available from the diet. El-Wailly (1966) fed his birds a powdered animal feed rather than
seed and so efficiences for seed, which is the Zebra Finch's natural diet, may be higher.
Shuman, et al. (1989) measured digestive efficiencies for four passerine granivores and for
millet efficiency ranged from 84.8% to 92.1%. Calder (1964) estimated that the digestive
efficiencies of non-breeding Zebra Finches was only 66%. Therefore, the potential
difference between non-breeding and breeding efficiency may be even greater than that
seen in El-Wailly's (1966) study.
Using the results of the amino acid analysis of both the eggs (Table 2.5) and the seed (Table
3.3) it is possible for a comparison to be made of demand for the eggs and supply in the
diet. Table 3.5 shows the total amino acid requirements for a clutch of five eggs and the
total amount of amino acids available from seed consumed over the seven days that protein
demands are highest (Day -1 to Day 5, Chapter 2). This indicates that the amount of cystine
needed for the eggs could not be met from the diet. This calculation, however, does not take
account of either maintenance requirements or the utilisation efficiency of dietary amino
55
acids. In a study of essential amino acid requirements for maintenance in White-crowned
Sparrows, Murphy (1993b) concluded that it would be advisable to assume utilisation
efficiencies of no more than 75%. On this basis there would not be enough cystine or lysine
in the diet of the Zebra Finches in this study to produce their eggs. In addition, it is also
likely that arginine and histidine would be in short supply from the diet for egg formation.
Despite the potential for an increase in the digestive efficiency of the female while she is
forming eggs, it is clear that this route alone is not sufficient to provide all the required
nutrients. Due to the low protein content of the diet there is a deficiency that could not be
overcome without exploiting other sources. In this study, the female finches are not
producing a clutch of eggs from exogenous nutrients alone.
Calcium
The quantity of calcium that the female can obtain from seed is very small. Only 0.025mg
of calcium per gramme of dehusked seed is available, and of this only 50 - 60% will be
absorbed by the bird (MacLean, 1974). Only 0.04mg of calcium is available from the 2.85g
of seed that is eaten daily. Each shell requires 17.8mg of calcium.
Calcium must therefore be obtained from another source. In the domestic fowl, medullary
bone acts as a calcium store which is drawn upon during egg formation (Simkiss, 1961).
The other source of calcium is from calcium rich food items. The deliberate selection of
such items has been well documented for various species of bird at laying time. Lemming
teeth and bones were found in the guts of laying female Sandpipers (Calidris spp.) but not
in the gut of non-laying females (MacLean, 1974). Similarly Jones (1976) found
calcareous grit, snail and egg shell in the guts of female Quelea quelea that were actively
forming eggshells but not in non-breeding birds. Fragments of snail shell are found
predominantly in the guts of laying House Sparrows but to a much lesser extent in those of
non-breeding birds (Schifferli, 1976, Krementz, 1984). In all of these studies dietry intake
of calcium was thought to be the major contributor of calcium to the shells. Wild Zebra
Finches are known to include snail shell in their diet (Zann and Straw, 1984).
56
In this study, cuttlefish bone was the calcium rich food item available to the birds. Loss of
weight from the cuttlefish bone was monitored daily as an index of consumption. The loss
of weight cannot be interpreted as actual consumption but it does closely reflect the
changes in attention that the finches paid to it.
Figures 3.4 and 3.5 illustrate the difference in consumption by non-breeding and breeding
pairs. The non-breeding pairs maintained a more or less constant level of consumption, less
than 0.05g per day. The breeding pairs, however, displayed a significant increase from
about Day -3. This level of consumption remained high (about 400% of the non-breeding
level) from Day -1 to Day 4, then dropping back to a lower level. The timing of this
increase coincides very well with the requirement for calcium for eggshell deposition,
which occurs daily from when the first egg is ovulated on Day 0. This pattern closely
resembles that found in Sandpipers (MacLean, 1974) and Quelea quelea (Jones, 1976),
where the peak of occurance of calcium rich food items was in females that were actively
secreting shell material.
While the male must account for some of the consumption, perhaps half of the
non-breeding level, I believe it was the female that accounted for the increase seen in
breeding pairs. Only 1.9% of breeding male Sandpiper stomachs contained lemming teeth
or bones compared to 38% of females (MacLean, 1974).
The mean calcium content of ten samples of cuttlefish bone was 29.39 ± 2.04%. If the
females consumed only 0.15g of cuttlefish bone from Day -1 to Day 4, and only 50% of its
calcium was available from digestion (MacLean, 1974), then 22mg of calcium would
potentially have been available on each of these days. 17.8mg of calcium is required for
each egg, therefore, ingested cuttlefish bone could easily meet this requirement.
In conclusion, it appears that while the female Zebra Finches in the feeding trial could
probably meet the calcium requirment for egg production from ingested supplies, it is
unlikely that protein requirements can be met by the diet alone. The diet may also make a
significant contribution to lipid requirements.
57
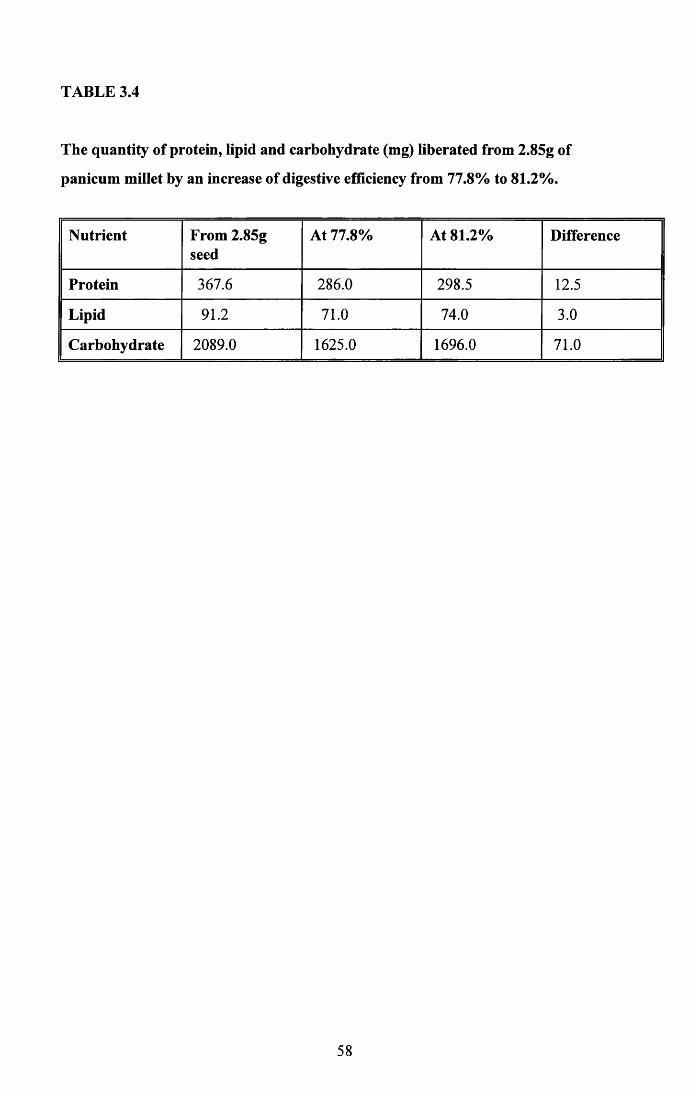
TABLE 3.4
The quantity of protein, lipid and carbohydrate (mg) liberated from 2.85g of
panicum millet by an increase of digestive efficiency from 77.8% to 81.2%.
Nutrient From 2.85g seed
At 77.8% At 81.2% Difference
Protein 367.6 286.0 298.5 12.5
Lipid 91.2 71.0 74.0 3.0
Carbohydrate 2089.0 1625.0 1696.0 71.0
58
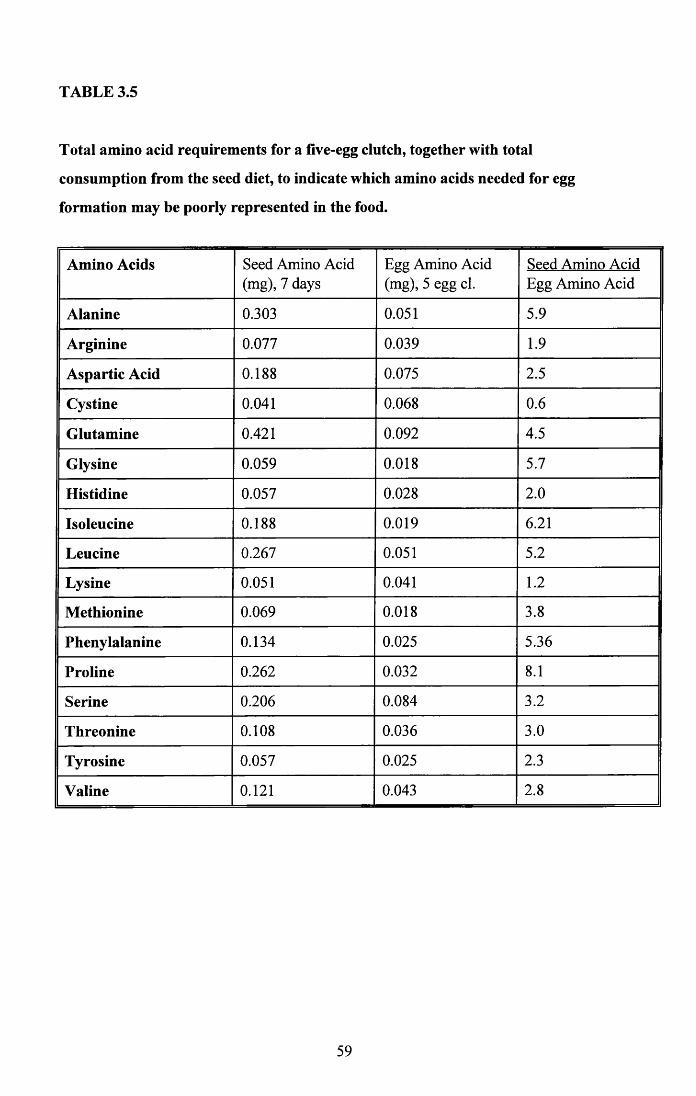
TABLE 3.5
Total amino acid requirements for a five-egg clutch, together with total
consumption from the seed diet, to indicate which amino acids needed for egg
formation may be poorly represented in the food.
Amino Acids Seed Amino Acid (mg), 7 days
Egg Amino Acid (mg), 5 egg cl.
Seed Amino Acid Egg Amino Acid
Alanine 0.303 0.051 5.9
Arginine 0.077 0.039 1.9
Aspartic Acid 0.188 0.075 2.5
Cystine 0.041 0.068 0.6
Glutamine 0.421 0.092 4.5
Glysine 0.059 0.018 5.7
Histidine 0.057 0.028 2.0
Isoleucine 0.188 0.019 6.21
Leucine 0.267 0.051 5.2
Lysine 0.051 0.041 1.2
Methionine 0.069 0.018 3.8
Phenylalanine 0.134 0.025 5.36
Proline 0.262 0.032 8.1
Serine 0.206 0.084 3.2
Threonine 0.108 0.036 3.0
Tyrosine 0.057 0.025 2.3
Valine 0.121 0.043 2.8
59
CHAPTER 4 - CHANGES IN BODY LIPID, PROTEIN AND CALCIUM CONTENT
OF FEMALE ZEBRA FINCHES DURING BREEDING
4.1 INTRODUCTION
This chapter considers the changes which occur in body reserves of protein, lipid and
calcium during the period of egg production in female Zebra Finches. Previous studies
have shown considerable differences in the extent to which body reserves are used by
different species of bird. In the case of protein condition the Introduction Table 1.1 listed
studies from the Lesser Snow Goose (Ankney and Maclnnes, 1978), which shows a
substantial loss of protein reserves during egg formation, through to the White-bellied
Swiftlet (Hails & Turner, 1985) which shows no loss of body protein.
In addition, those species that do utilise their reserves do not, in general, use them evenly.
For instance the Northern Shoveler will deplete its fat reserves during egg production while
not reducing the overall protein reserve because it gets adequate protein from its diet
(Ankney & Afton, 1988). Quelea and Camaroptera females, however, deplete their protein
reserves while their lipid deposits remain high (Jones & Ward, 1976, Fogden & Fogden,
1979).
The Zebra Finch is predominantly a granivore (Zann and Straw, 1984) and as such it has a
diet that is relatively poor in protein and fat but rich in carbohydrate. The diet of wild
Zebra Finches does not include a significant insect intake although the diet of breeding
females has not been studied in detail (Zann and Straw, 1984, Morton and Davies, 1983).
Other tropical granivores such as the Quelea (Jones and Ward, 1976) and the Camaroptera
(Fogden and Fogden, 1979) are known to use reserves of both lipid and protein during the
breeding period. The Zebra Finch is not dissimilar to the above two species in its life
history and so is likely to have to use body reserves when under the stress of reproduction.
The previous chapters have dealt with, firstly, the nutritional investment in egg production
and, secondly, the diet of the female during this period to estimate how much of the cost
can be met by exogenous resources. This chapter aims to estimate the role that body
60
reserves play in meeting the cost of egg production and, in relation to food intake, produce
a budget of how egg production demands are met by the female Zebra Finch.
61
4.2 MATERIALS AND METHODS
In order to investigate changes in body reserves of protein, lipid and calcium associated
with egg formation, females were taken for carcass analysis. Pre-laying females were
obtained by introducing a female to a male for two to three days. If courtship behaviour
and nest building activity was shown the female would be taken one, two or three days
after this started in order to get birds at various stages of the egg formation period. These
birds were placed accurately in the laying cycle by examination of their reproductive tract
(see Chapter 2). Other females were taken during the egg-laying period and post-laying
females were obtained on the day the last egg of the clutch was laid. Post-laying females
were taken specifically for carcass analysis and also from experiments where the eggs were
required.
4.2.1 Dissection procedure
All birds were killed using either chloroform (CC14) or carbon dioxide (C02). Chloroform
was used at the beginning of the study but was replaced by C 02 because it is less
hazardous to handle. Weight (to 0.0 lg) was recorded immediately, and the following
external measurements taken with vernier calipers (to 0.05mm);
Wing Length - carpal joint to end of primary flight feathers.
Body Length - on horizontal surface with head extended, tip of bill to end of tail feathers.
Wing Span - with wings extended, tip to tip.
Leg - with foot folded back, from joint of tibiotarsus and tarsometatarsus to the end of the
tarsometatarsus.
Head and Bill - tip of bill to back of skull.
Bill Length - tip of bill to nasofrontal hinge.
62
Bill Depth - base of lower mandible to upper mandible at nasofrontal hinge.
Skull Width - at its widest point.
Radius/Ulna Length - from joint with humerus to carpal joint.
At this point the majority of birds were frozen for analysis at a later date. The full
dissection was carried out on the birds after thawing at room temperature for one to two
hours. Firstly, the pectoral muscle blocks were removed (I am using the term pectoral
muscle block to refer to the pectoralis major and supracoracoideus). In most birds the left
pectoral muscle block was used for biochemical analysis and the right for lean dry weight
determination (see below). Two internal skeletal measurements were then taken, the
Stemum-Coracoid (from the abdominal tip of the sternum to the end of the coracoid) which
is essentially the length of the pectoral muscle, plus the keel length (from the abdominal
tip of the sternum to the end of the keel where it joins the furcula).
The rib cage was removed and the following organs taken for dry weight determination;
the heart, liver, gizzard, gut (from gizzard to cloaca) and the leg muscles of the tibiotarsus
were dissected out, taking care not to include any adjacent fat bodies. The omentum was
also removed, this being the large fat body in the abdomen. The samples were dried at 70°C
to dry weight (0.00lg) and then returned to the carcass also. Ovary and oviduct were also
removed and examined for breeding condition as described in Chapter 2.
4.2.2 Lean dry weight and lipid content of pectoral muscle
The right muscle block was dried to constant weight (0.000lg) at 70°C. Lipid was
extracted using chloroform in a Soxhlet apparatus (see Chapter 2). Lean dry weight was
recorded after redrying the samples and lipid content was taken as the dry weight minus the
lean dry weight.
4.2.3 Lean drv weight and lipid content of carcass
The carcass was dried to constant weight (0.00lg) at 70°C and together with the dried
organs the lipid was extracted using chloroform in a soxhlet apparatus as above. Total lean
63
dry weight of the carcass was obtained by adding the lean dry weight of the right pectoral
muscle, multiplied by two, to the carcass lean dry weight (reproductive tissue weights were
not included).
4.2.4 Ash weight and calcium content of carcass
When the carcasses were lipid free an ash weight was obtained for each. The carcasses
were placed in pre-dried and weighed crucibles and ashed in a muffle furnace at 650°C for
8 hours. The crucibles were removed from the furnace and allowed to cool in a dessicator
before weighing to 0.0001 g. An ash weight index that corrected for body size was
calculated by dividing the ash weight by the stemum-coracoid length. This measure of size
was used as it proved to be the one that explained most of the variation in body size (see
Results).
Ash from five pre-breeding and five post-breeding birds was selected for calcium analysis.
The carcass ash was powdered using a pestle and mortar and then treated in the same
manner as the analysis of eggshell and cuttlefish bone previously described. A 1:10
dilution of the carcass ash "stock" solution was necessary to bring it onto the calibration
curve. The final dilution for analysis included 0.5ml "stock" solution and 0.05ml
lanthanum chloride made up to 25ml with deionised water.
64
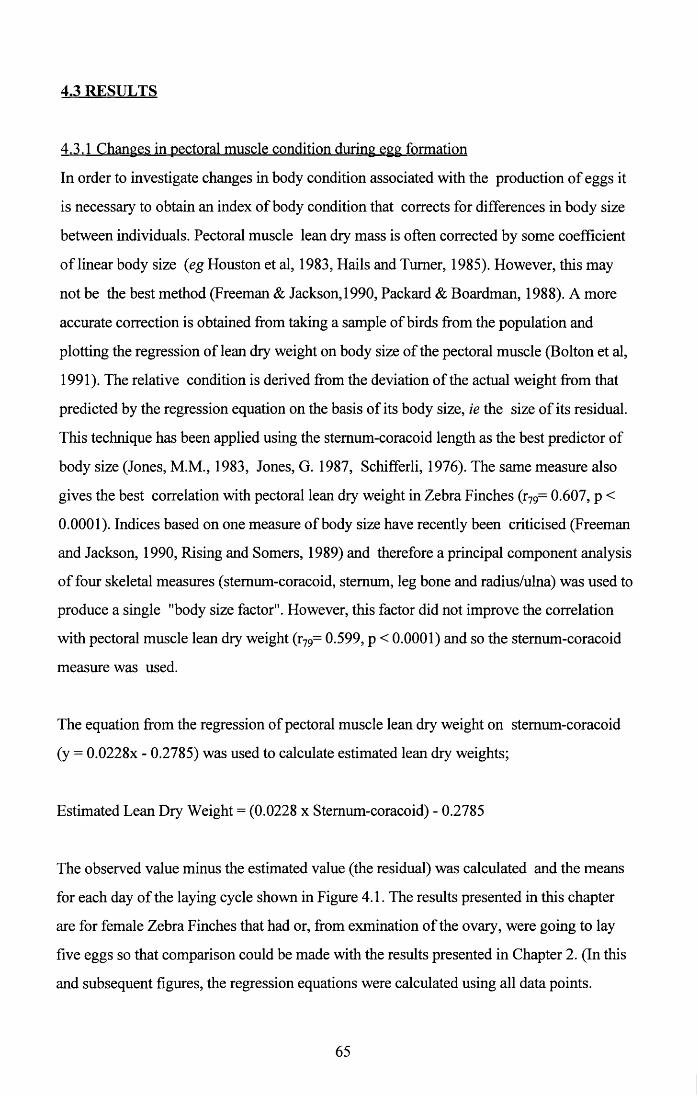
4.3 RESULTS
4.3.1 Changes in pectoral muscle condition during egg formation
In order to investigate changes in body condition associated with the production of eggs it
is necessary to obtain an index of body condition that corrects for differences in body size
between individuals. Pectoral muscle lean dry mass is often corrected by some coefficient
of linear body size (eg Houston et al, 1983, Hails and Turner, 1985). However, this may
not be the best method (Freeman & Jackson, 1990, Packard & Boardman, 1988). A more
accurate correction is obtained from taking a sample of birds from the population and
plotting the regression of lean dry weight on body size of the pectoral muscle (Bolton et al,
1991). The relative condition is derived from the deviation of the actual weight from that
predicted by the regression equation on the basis of its body size, ie the size of its residual.
This technique has been applied using the stemum-coracoid length as the best predictor of
body size (Jones, M.M., 1983, Jones, G. 1987, Schifferli, 1976). The same measure also
gives the best correlation with pectoral lean dry weight in Zebra Finches (r79= 0.607, p <
0.0001). Indices based on one measure of body size have recently been criticised (Freeman
and Jackson, 1990, Rising and Somers, 1989) and therefore a principal component analysis
of four skeletal measures (stemum-coracoid, sternum, leg bone and radius/ulna) was used to
produce a single "body size factor". However, this factor did not improve the correlation
with pectoral muscle lean dry weight (r79= 0.599, p < 0.0001) and so the stemum-coracoid
measure was used.
The equation from the regression of pectoral muscle lean dry weight on stemum-coracoid
(y = 0.0228x - 0.2785) was used to calculate estimated lean dry weights;
Estimated Lean Dry Weight = (0.0228 x Stemum-coracoid) - 0.2785
The observed value minus the estimated value (the residual) was calculated and the means
for each day of the laying cycle shown in Figure 4.1. The results presented in this chapter
are for female Zebra Finches that had or, from exmination of the ovary, were going to lay
five eggs so that comparison could be made with the results presented in Chapter 2. (In this
and subsequent figures, the regression equations were calculated using all data points.
65
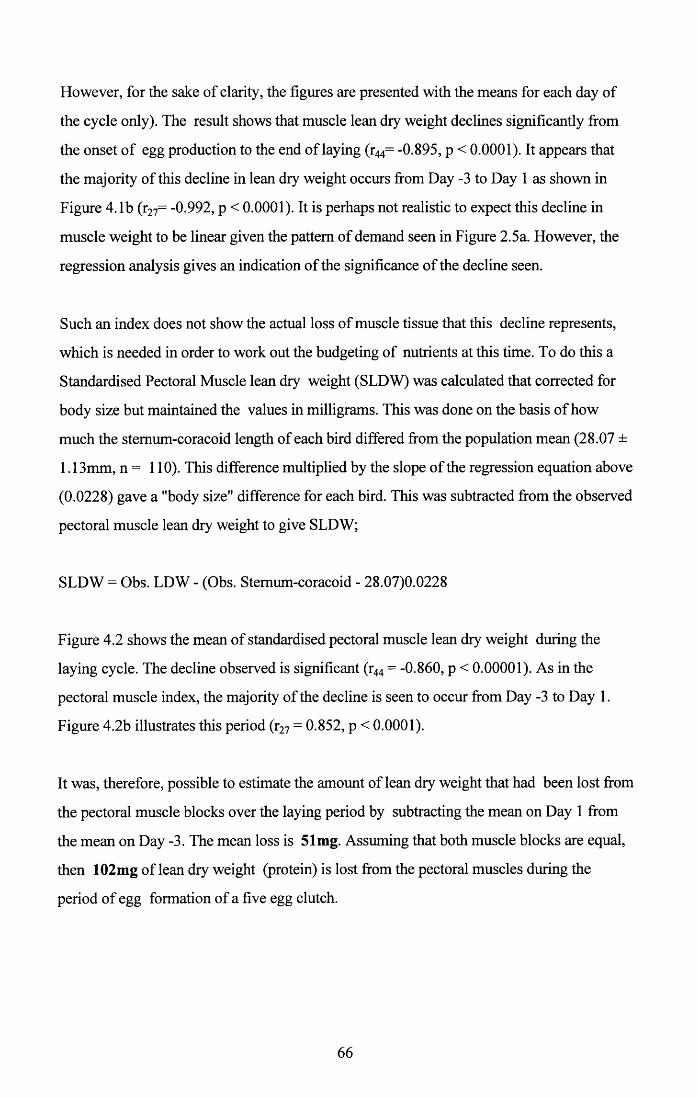
However, for the sake of clarity, the figures are presented with the means for each day of
the cycle only). The result shows that muscle lean dry weight declines significantly from
the onset of egg production to the end of laying (r44= -0.895, p < 0.0001). It appears that
the majority of this decline in lean dry weight occurs from Day -3 to Day 1 as shown in
Figure 4.1b (r27= -0.992, p < 0.0001). It is perhaps not realistic to expect this decline in
muscle weight to be linear given the pattern of demand seen in Figure 2.5a. However, the
regression analysis gives an indication of the significance of the decline seen.
Such an index does not show the actual loss of muscle tissue that this decline represents,
which is needed in order to work out the budgeting of nutrients at this time. To do this a
Standardised Pectoral Muscle lean dry weight (SLDW) was calculated that corrected for
body size but maintained the values in milligrams. This was done on the basis of how
much the stemum-coracoid length of each bird differed from the population mean (28.07 ±
1.13 mm, n = 110). This difference multiplied by the slope of the regression equation above
(0.0228) gave a "body size" difference for each bird. This was subtracted from the observed
pectoral muscle lean dry weight to give SLDW;
SLDW = Obs. LDW - (Obs. Stemum-coracoid - 28.07)0.0228
Figure 4.2 shows the mean of standardised pectoral muscle lean dry weight during the
laying cycle. The decline observed is significant (r44 = -0.860, p < 0.00001). As in the
pectoral muscle index, the majority of the decline is seen to occur from Day -3 to Day 1.
Figure 4.2b illustrates this period (r27 = 0.852, p < 0.0001).
It was, therefore, possible to estimate the amount of lean dry weight that had been lost from
the pectoral muscle blocks over the laying period by subtracting the mean on Day 1 from
the mean on Day -3. The mean loss is 51 mg. Assuming that both muscle blocks are equal,
then 102mg of lean dry weight (protein) is lost from the pectoral muscles during the
period of egg formation of a five egg clutch.
66
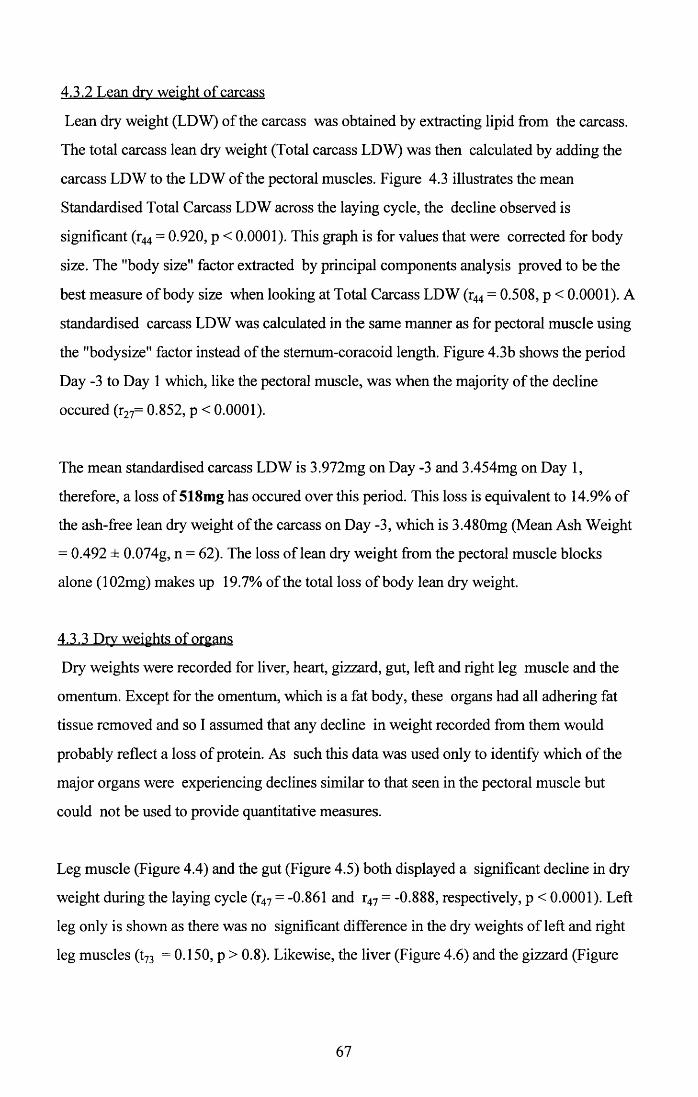
4.3.2 Lean dry weight of carcass
Lean dry weight (LDW) of the carcass was obtained by extracting lipid from the carcass.
The total carcass lean dry weight (Total carcass LDW) was then calculated by adding the
carcass LDW to the LDW of the pectoral muscles. Figure 4.3 illustrates the mean
Standardised Total Carcass LDW across the laying cycle, the decline observed is
significant (r44 = 0.920, p < 0.0001). This graph is for values that were corrected for body
size. The "body size" factor extracted by principal components analysis proved to be the
best measure of body size when looking at Total Carcass LDW (r44 = 0.508, p < 0.0001). A
standardised carcass LDW was calculated in the same manner as for pectoral muscle using
the "bodysize" factor instead of the stemum-coracoid length. Figure 4.3b shows the period
Day -3 to Day 1 which, like the pectoral muscle, was when the majority of the decline
occured (r27= 0.852, p < 0.0001).
The mean standardised carcass LDW is 3.972mg on Day -3 and 3.454mg on Day 1,
therefore, a loss of 518mg has occured over this period. This loss is equivalent to 14.9% of
the ash-free lean dry weight of the carcass on Day -3, which is 3.480mg (Mean Ash Weight
= 0.492 ± 0.074g, n = 62). The loss of lean dry weight from the pectoral muscle blocks
alone (102mg) makes up 19.7% of the total loss of body lean dry weight.
4.3.3 Dry weights of organs
Dry weights were recorded for liver, heart, gizzard, gut, left and right leg muscle and the
omentum. Except for the omentum, which is a fat body, these organs had all adhering fat
tissue removed and so I assumed that any decline in weight recorded from them would
probably reflect a loss of protein. As such this data was used only to identity which of the
major organs were experiencing declines similar to that seen in the pectoral muscle but
could not be used to provide quantitative measures.
Leg muscle (Figure 4.4) and the gut (Figure 4.5) both displayed a significant decline in dry
weight during the laying cycle (r47 = -0.861 and r47 = -0.888, respectively, p < 0.0001). Left
leg only is shown as there was no significant difference in the dry weights of left and right
leg muscles (t73 = 0.150, p > 0.8). Likewise, the liver (Figure 4.6) and the gizzard (Figure
67
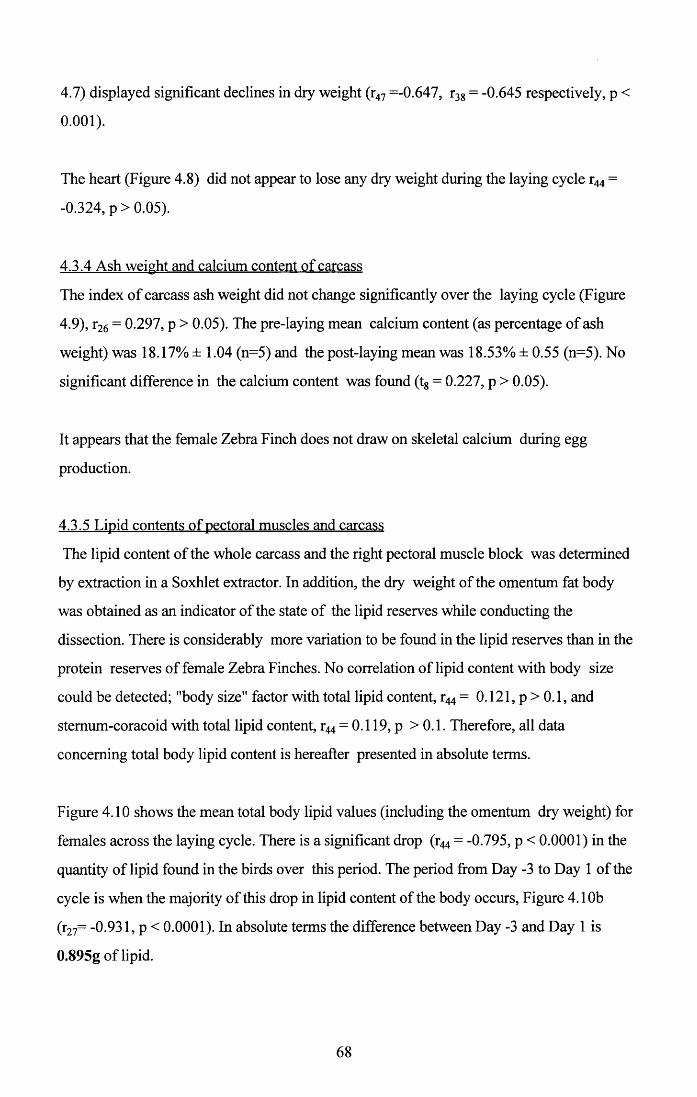
4.7) displayed significant declines in dry weight (r47 =-0.647, r38 = -0.645 respectively, p <
0 .001).
The heart (Figure 4.8) did not appear to lose any dry weight during the laying cycle r44 =
-0.324, p > 0.05).
4.3.4 Ash weight and calcium content of carcass
The index of carcass ash weight did not change significantly over the laying cycle (Figure
4.9), r26 = 0.297, p > 0 .05). The pre-laying mean calcium content (as percentage of ash
weight) was 18.17% ± 1.04 (n=5) and the post-laying mean was 18.53% ± 0.55 (n=5). No
significant difference in the calcium content was found (t8 = 0.227, p > 0.05).
It appears that the female Zebra Finch does not draw on skeletal calcium during egg
production.
4.3.5 Lipid contents of pectoral muscles and carcass
The lipid content of the whole carcass and the right pectoral muscle block was determined
by extraction in a Soxhlet extractor. In addition, the dry weight of the omentum fat body
was obtained as an indicator of the state of the lipid reserves while conducting the
dissection. There is considerably more variation to be found in the lipid reserves than in the
protein reserves of female Zebra Finches. No correlation of lipid content with body size
could be detected; "body size" factor with total lipid content, r44 = 0.121, p > 0.1, and
stemum-coracoid with total lipid content, r44 = 0.119, p >0.1. Therefore, all data
concerning total body lipid content is hereafter presented in absolute terms.
Figure 4.10 shows the mean total body lipid values (including the omentum dry weight) for
females across the laying cycle. There is a significant drop (r44 = -0.795, p < 0.0001) in the
quantity of lipid found in the birds over this period. The period from Day -3 to Day 1 of the
cycle is when the majority of this drop in lipid content of the body occurs, Figure 4.10b
(r27= -0.931, p < 0 .0001). In absolute terms the difference between Day -3 and Day 1 is
0.895g of lipid.
68
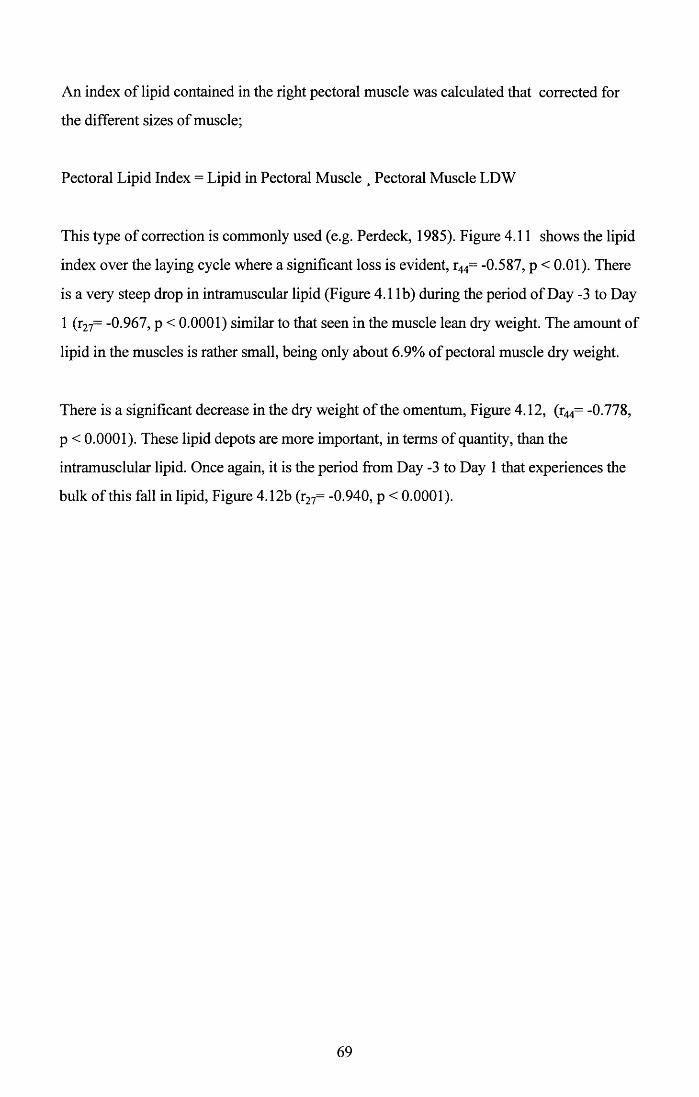
An index of lipid contained in the right pectoral muscle was calculated that corrected for
the different sizes of muscle;
Pectoral Lipid Index = Lipid in Pectoral Muscle , Pectoral Muscle LDW
This type of correction is commonly used (e.g. Perdeck, 1985). Figure 4.11 shows the lipid
index over the laying cycle where a significant loss is evident, r44= -0.587, p < 0.01). There
is a very steep drop in intramuscular lipid (Figure 4.1 lb) during the period of Day -3 to Day
1 (r27= -0.967, p < 0.0001) similar to that seen in the muscle lean dry weight. The amount of
lipid in the muscles is rather small, being only about 6.9% of pectoral muscle dry weight.
There is a significant decrease in the dry weight of the omentum, Figure 4.12, (r44= -0.778,
p < 0.0001). These lipid depots are more important, in terms of quantity, than the
intramusclular lipid. Once again, it is the period from Day -3 to Day 1 that experiences the
bulk of this fall in lipid, Figure 4.12b (r27= -0.940, p < 0.0001).
69
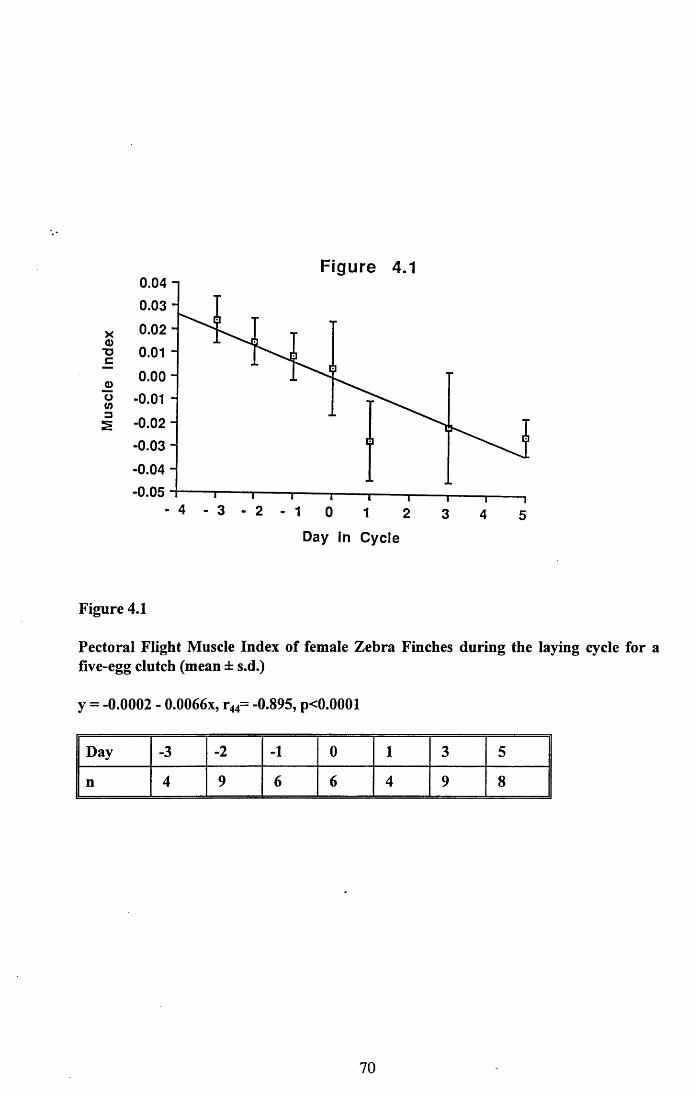
Figure 4.10.04 0.03
x 0.02 o■o 0.01
0 °*00 8 - 0.011 -0.02
-0.03 - -0.04 - -0.05 -
- 4 - 3 - 2 - 1 0 1 2 3 4 5Day in C y c le
Figure 4.1
Pectoral Flight Muscle Index of female Zebra Finches during the laying cycle for a five-egg clutch (mean ± s.d.)
y = -0.0002 - 0.0066x, r44= -0.895, p<0.0001
Day -3 -2 -1 0 1 3 5
n 4 9 6 6 4 9 8
70
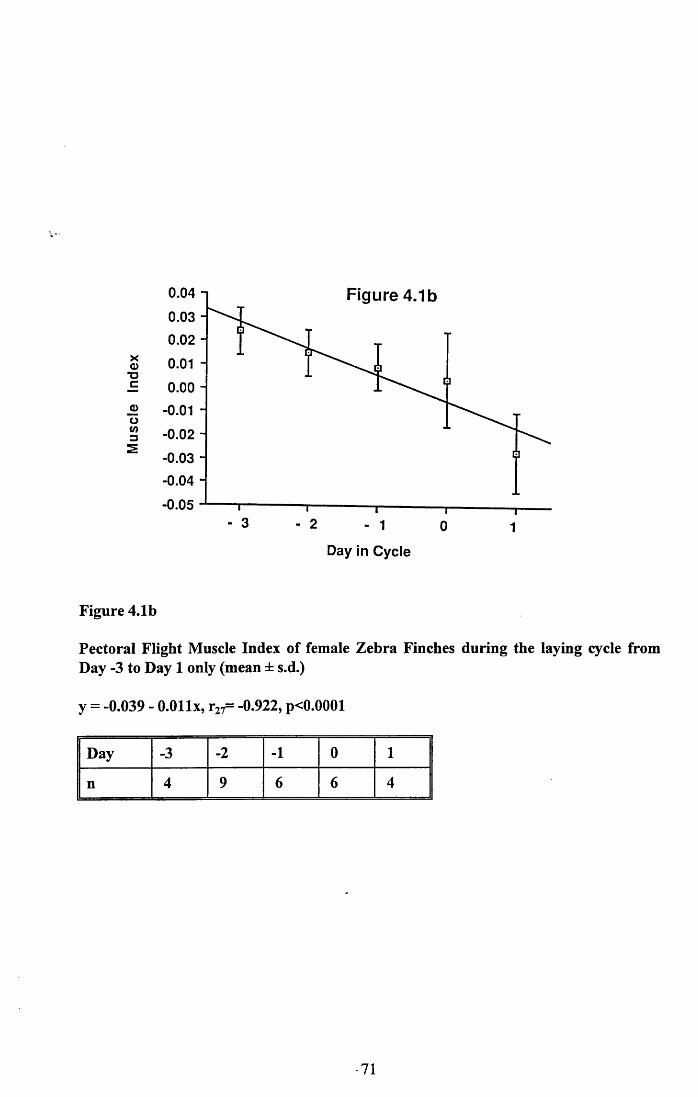
0.040.030.02
xoT3JE 0.00i> -0.01 o </>3S -0.03
-0.04 -0.05
Figure 4.1b
0.01
- 0.02
3 2 - 1 0 1
Day in C ycle
Figure 4.1b
Pectoral Flight Muscle Index of female Zebra Finches during the laying cycle from Day -3 to Day 1 only (mean ± s.d.)
y = -0.039 - O.Ollx, r27= -0.922, p<0.0001
Day -3 -2 -1 0 1
n 4 9 6 6 4
•71
Figure 4.2400 io£ 380 -JZ
360 "<D
£* 340 -Qc(0<D 320 "
3004 - 3 - 2 - 1 0 1 2 3 4 5
Day in C y c le
Figure 4.2
Standardised Pectoral Muscle Lean Dry Weight of female Zebra Finches during the laying cycle of a five-egg clutch (mean ± s.d.)
y = 359.71 - 5.982x, r44= -0.860, p<0.0001
Day -3 -2 -1 0 1 3 5
n 4 9 6 6 4 9 8
72
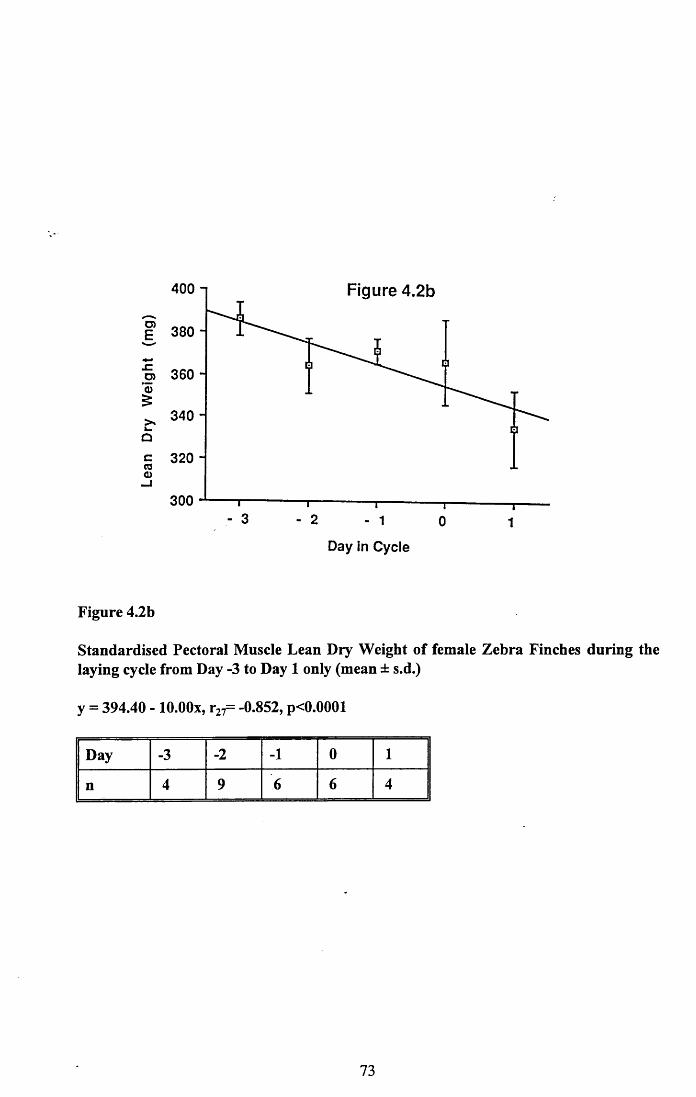
400 Figure 4.2b
E 380
"o) 360 'o &>, 340 oc 320 (0 o _1
3003 - 2 - 1 0 1
Day in Cycle
Figure 4.2b
Standardised Pectoral Muscle Lean Dry Weight of female Zebra Finches during the laying cycle from Day -3 to Day 1 only (mean ± s.d.)
y = 394.40 - lO.OOx, r27= -0.852, p<0.0001
Day -3 -2 -1 0 1
n 4 9 6 6 4
73
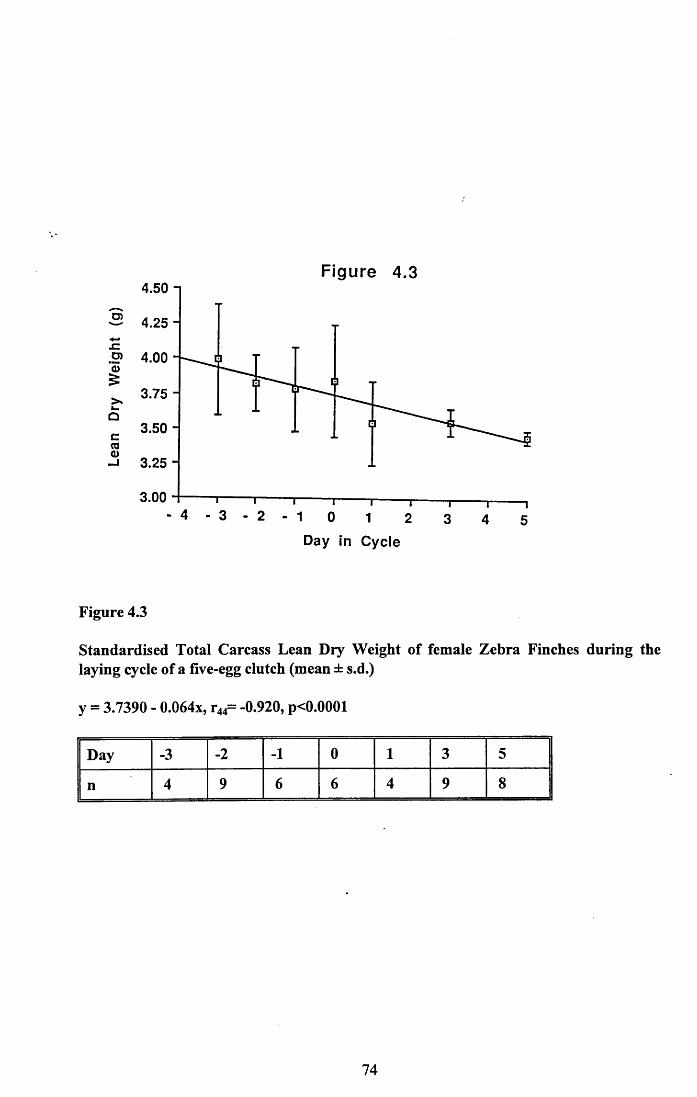
Figure 4.34.50 i
2 4.25 -
.2> 4.00 -Q>5X 3 75 -Qc 3.50 - ra<D-J 3.25 -
3.00
Day in C y c le
Figure 4.3
Standardised Total Carcass Lean Dry Weight of female Zebra Finches during the laying cycle of a five-egg clutch (mean ± s.d.)
y = 3.7390 - 0.064x, r44= -0.920, p<0.0001
Day -3 -2 -1 0 1 3 5
n 4 9 6 6 4 9 8
74
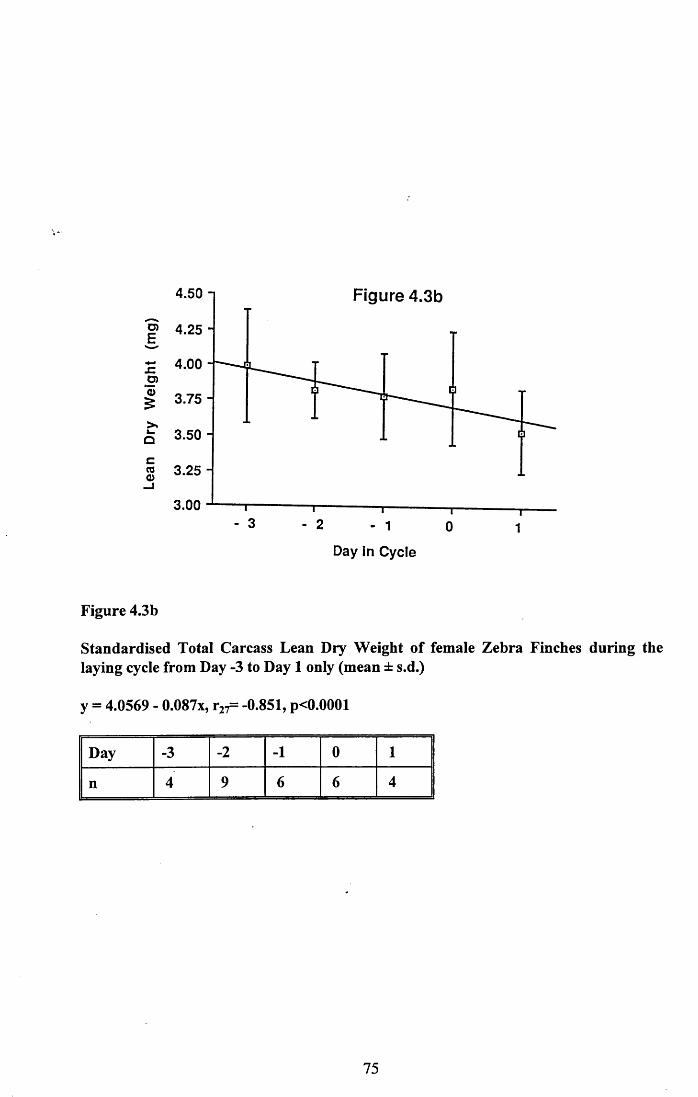
4.50 Figure 4.3b
4.25
~ 4.00o>§ 3.75
q 3.50c0> 3.25
3.003 - 2 1 0 1
Day in Cycle
Figure 4.3b
Standardised Total Carcass Lean Dry Weight of female Zebra Finches during the laying cycle from Day -3 to Day 1 only (mean ± s.d.)
y = 4.0569 - 0.087x, r27= -0.851, p<0.0001
Day -3 -2 -1 0 1
n 4 9 6 6 4
75
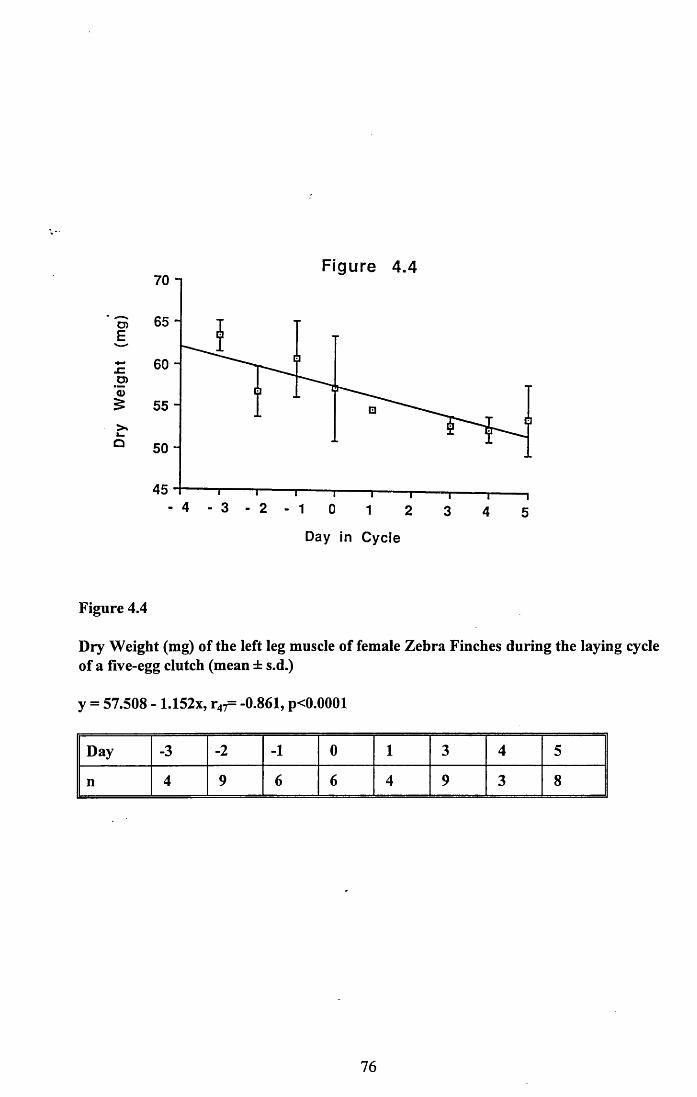
Figure 4.4
- 60 -D)"5£ 55 -
Q 50 -
- 4 - 3 2 - 1 0 1 2 3 4 5Day in C y c le
Figure 4.4
Dry Weight (mg) of the left leg muscle of female Zebra Finches during the laying cycle of a five-egg clutch (mean ± s.d.)
y = 57.508 - 1.152x, r47= -0.861, p<0.0001
Day -3 -2 -1 0 1 3 4 5
n 4 9 6 6 4 9 3 8
76
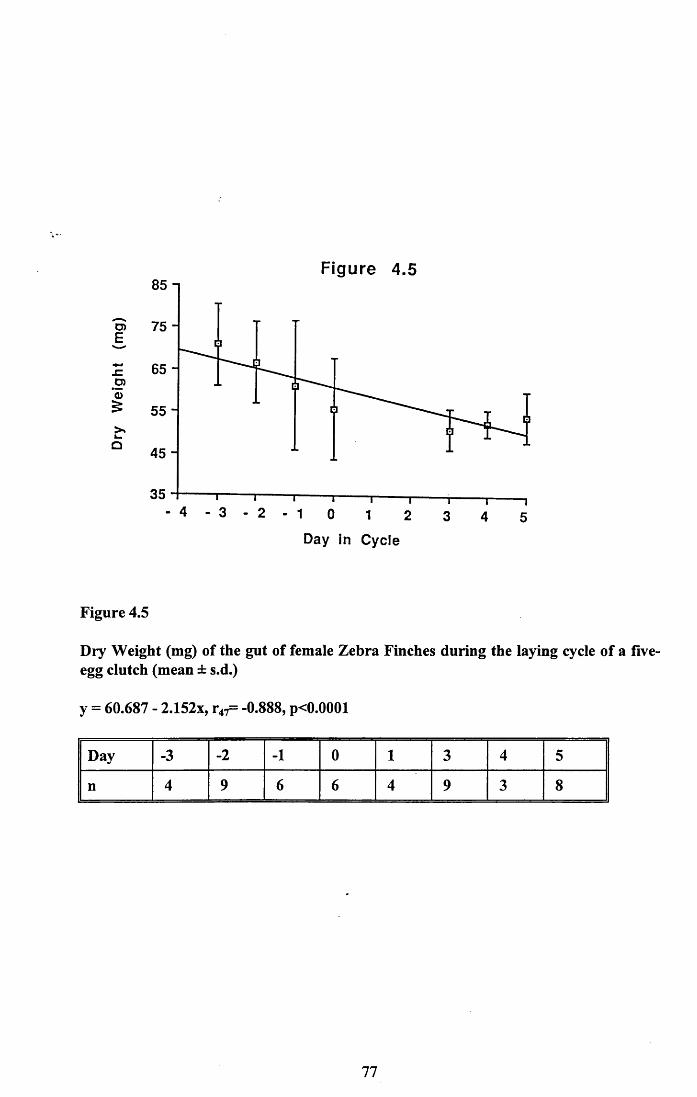
Figure 4.585 n
o> 75 - E
Z 65 -o>o^ 55">*k.
45 -
35
Day in C y c le
Figure 4.5
Dry Weight (mg) of the gut of female Zebra Finches during the laying cycle of a five- egg clutch (mean ± s.d.)
y = 60.687 - 2.152x, r47= -0.888, p<0.0001
Day -3 -2 -1 0 1 3 4 5
n 4 9 6 6 4 9 3 8
77
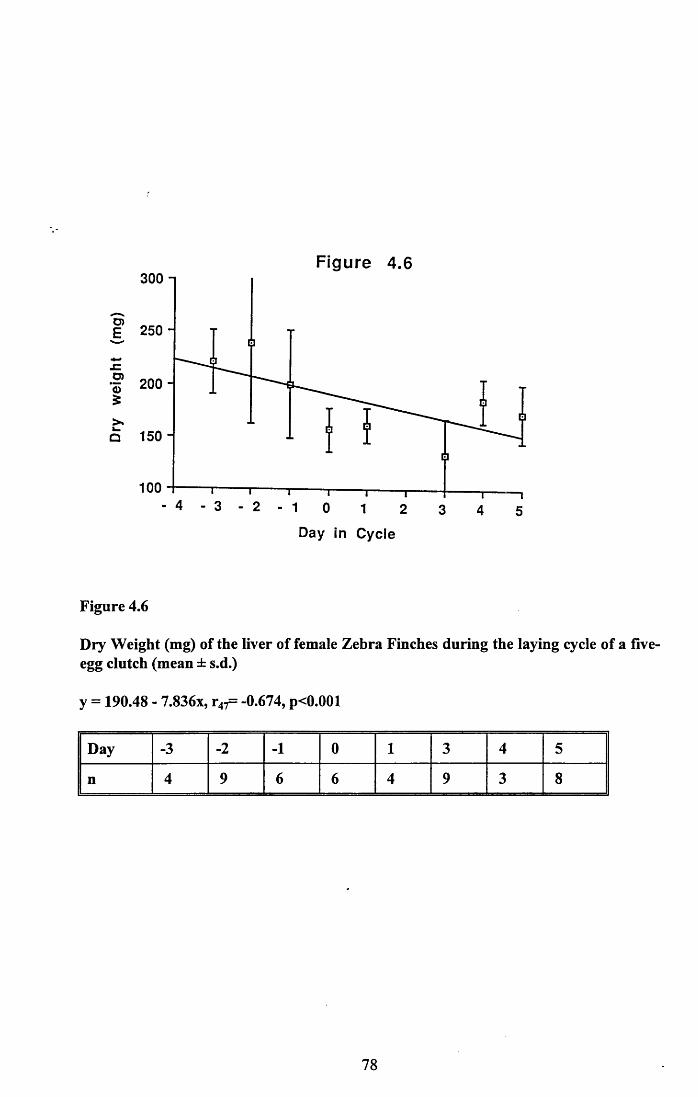
300 -iFigure 4.6
E 250 -
4-*JZ•s 200 - £>»k.Q 150 -
100
Day in C y c le
Figure 4.6
Dry Weight (mg) of the liver of female Zebra Finches during the laying cycle of a five- egg clutch (mean ± s.d.)
y = 190.48 - 7.836x, r47= -0.674, p<0.001
Day -3 -2 -1 0 1 3 4 5
n 4 9 6 6 4 9 3 8
78
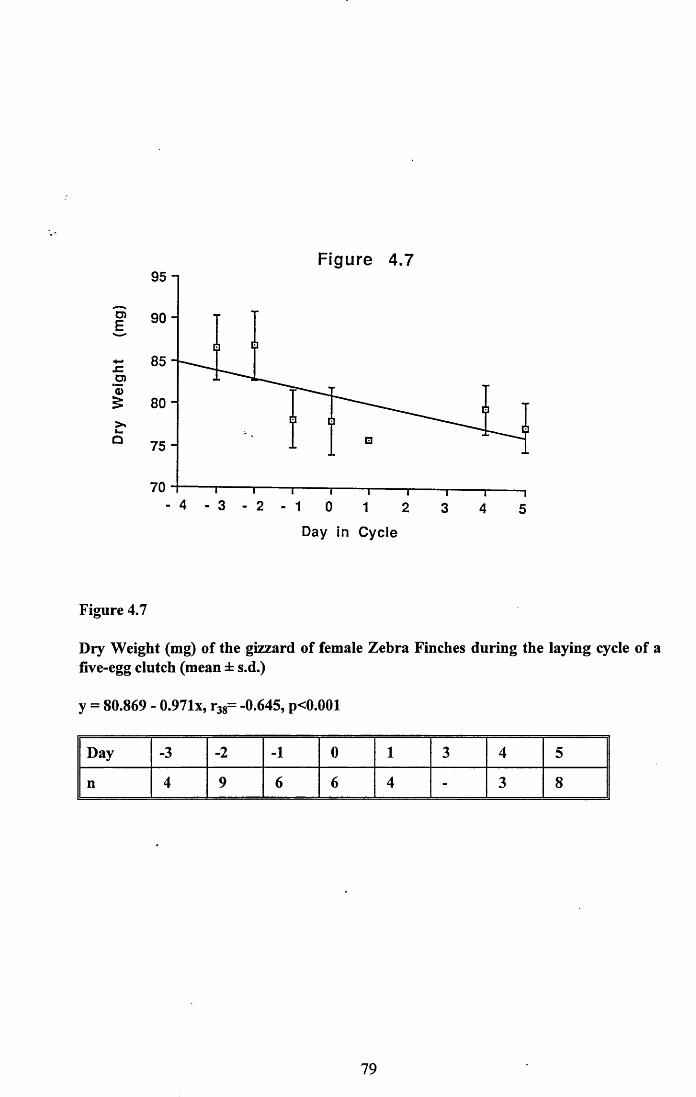
Figure 4.795 n
|> 90 -
u>o£ 80 -
a 75 -
4 3 2 1 0 1 2 3 4 5Day in C y c le
Figure 4.7
Dry Weight (mg) of the gizzard of female Zebra Finches during the laying cycle of a five-egg clutch (mean ± s.d.)
y = 80.869 - 0.971x, r38= -0.645, p<0.001
Day -3 -2 -1 0 1 3 4 5
n 4 9 6 6 4 - 3 8
79
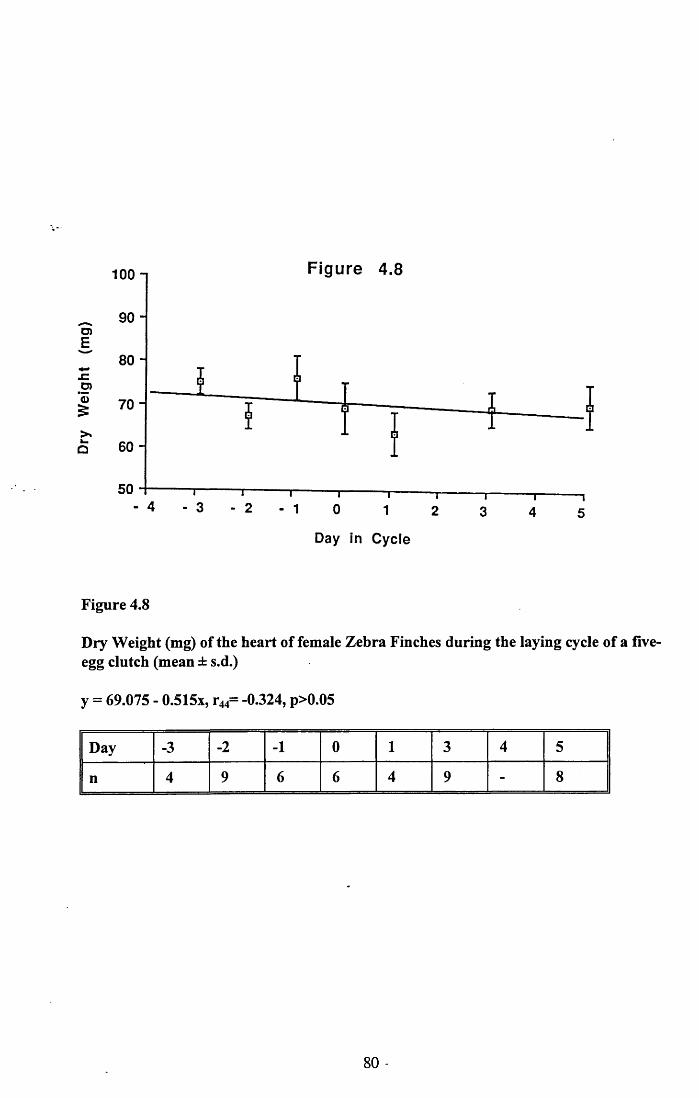
Figure 4.8100 i
9 0 -O)E
80 -x:o>o£ 7 0 -
60 -o
Day in C y c le
Figure 4.8
Dry Weight (mg) of the heart of female Zebra Finches during the laying cycle of a five- egg clutch (mean ± s.d.)
y = 69.075 - 0.515x, r44= -0.324, p>0.05
Day -3 -2 -1 0 1 3 4 5
n 4 9 6 6 4 9 - 8
80 -
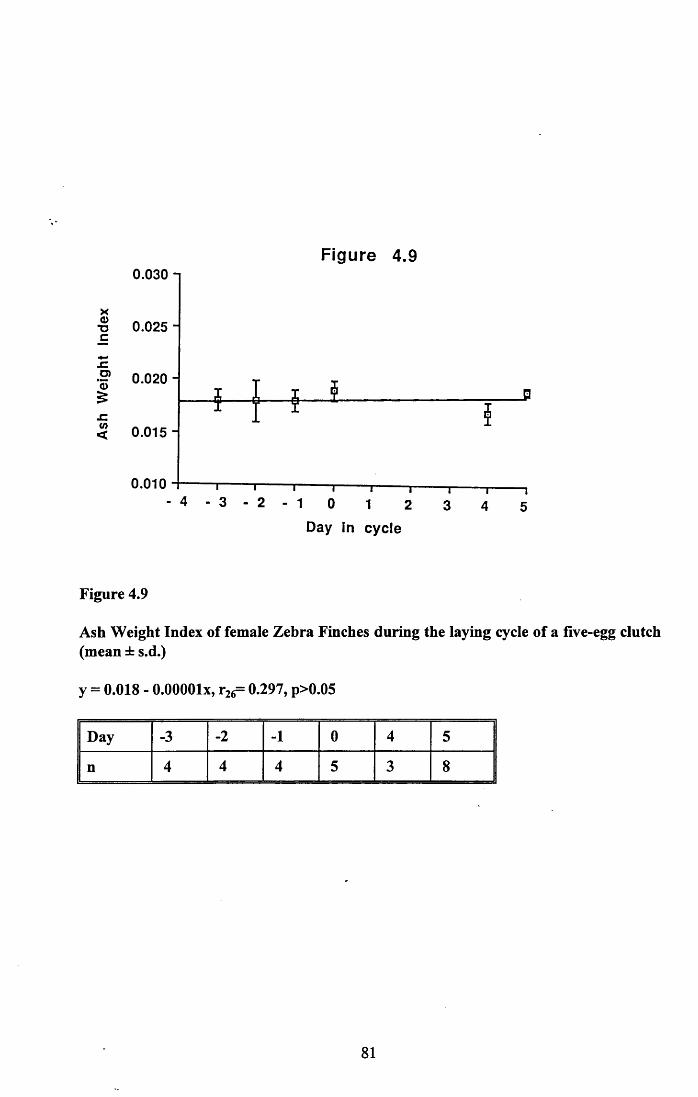
0.030 n
x■S 0.025 c
Figure 4.9
JC~ 0.020 H£x:< 0.015
0.010- 4 - 3 - 2 - 1 o 1 2
Day in c y c l e
Figure 4.9
Ash Weight Index of female Zebra Finches during the laying cycle of a five-egg clutch (mean ± s.d.)
y = 0.018 - O.OOOOlx, r26= 0.297, p>0.05
Day -3 -2 -1 0 4 5
n 4 4 4 5 3 8
81
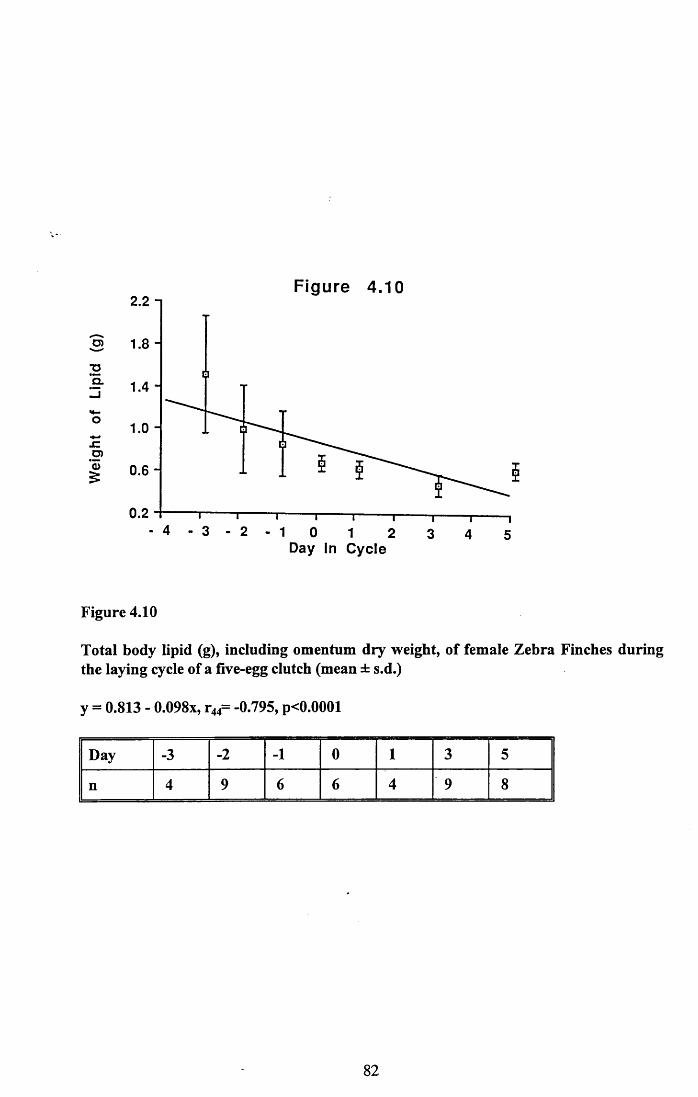
Figure 4.102.2 n
o>
_l
oJCu>*Q >
£ 0.6 -
0.2- 4 - 3 - 2 - 1 0 1 2 3 4 5
Day in C y c le
Figure 4.10
Total body lipid (g), including omentum dry weight, of female Zebra Finches during the laying cycle of a five-egg clutch (mean ± s.d.)
y = 0.813 - 0.098x, r44= -0.795, p<0.0001
Day -3 -2 -1 0 1 3 5
n 4 9 6 6 4 9 8
82
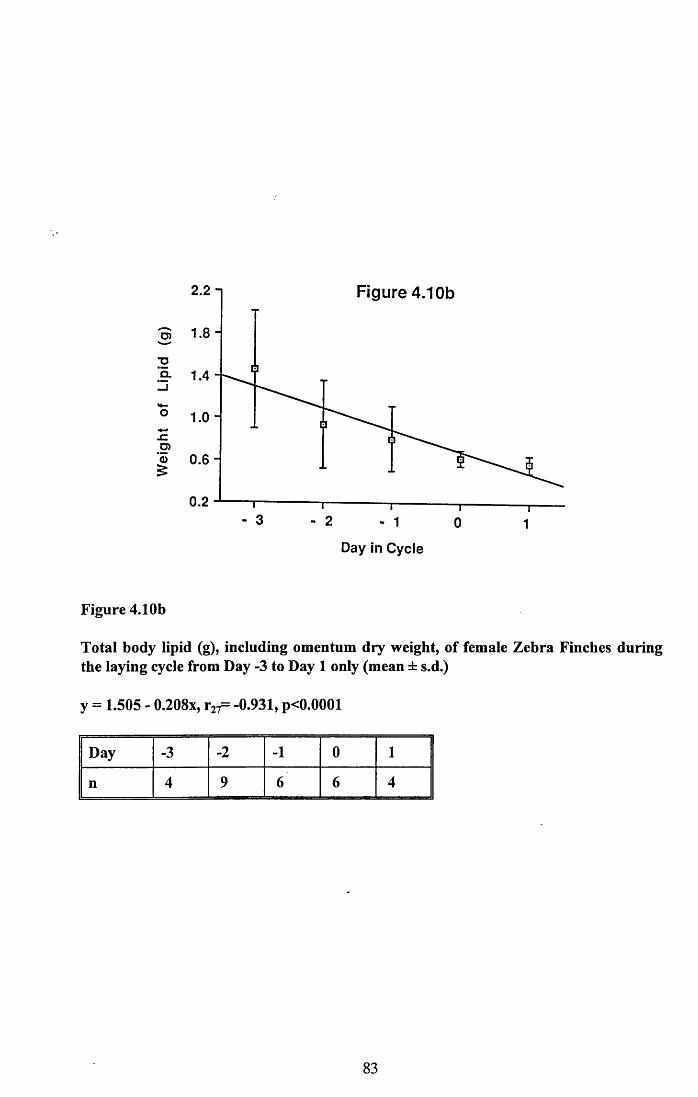
2.2 n Figure 4.10b
O
_J
o
-CD)o 0.6 -
0.2- 3 2 - 1 0 1
Day in Cycle
Figure 4.10b
Total body lipid (g), including omentum dry weight, of female Zebra Finches during the laying cycle from Day -3 to Day 1 only (mean ± s.d.)
y = 1.505 - 0.208x, r27= -0.931, p<0.0001
Day -3 -2 -1 0 1
n 4 9 6 6 4
83
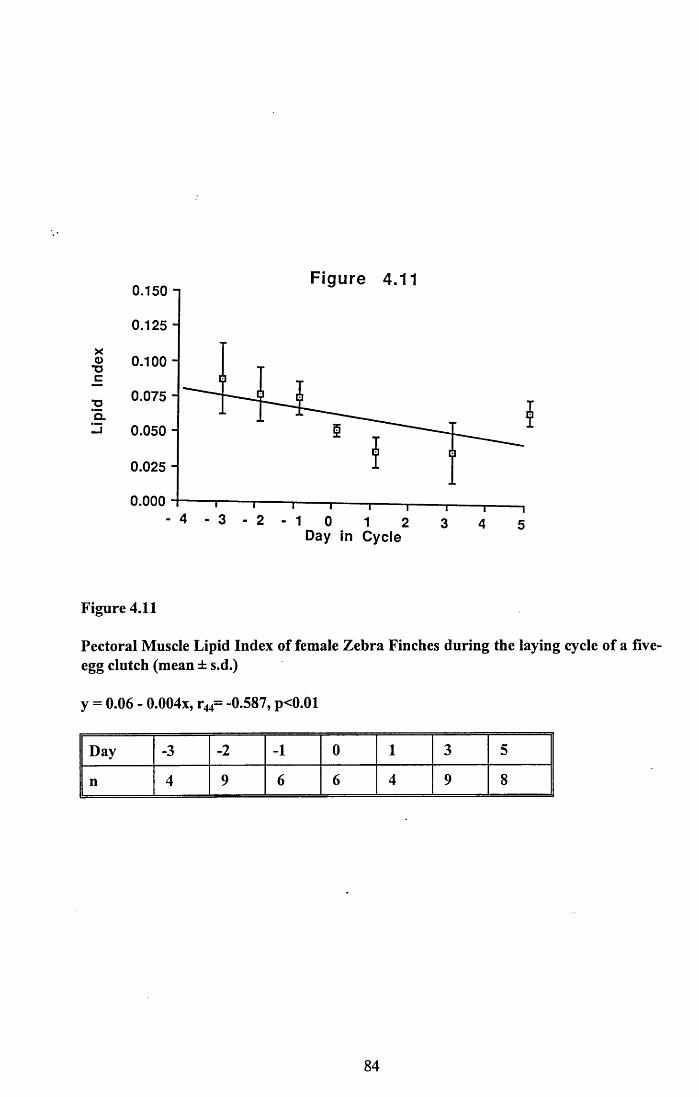
Figure 4.110.150
0.125x<DTJC
0.100
0.075
0.050_i
0.025
0.000
Day in C y c le
Figure 4.11
Pectoral Muscle Lipid Index of female Zebra Finches during the laying cycle of a five- egg clutch (mean ± s.d.)
y = 0.06 - 0.004x, r44= -0.587, p<0.01
Day -3 -2 -1 0 1 3 5
n 4 9 6 6 4 9 8
84
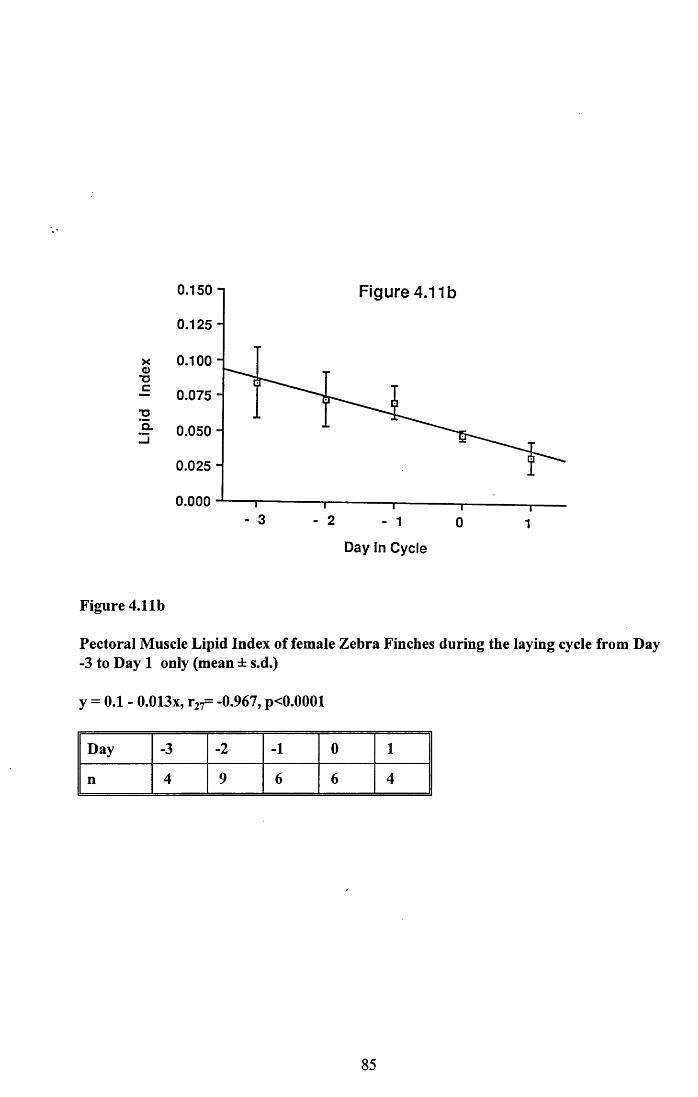
0.150 n Figure 4.11b
0.125 -
0.100x<D"ac 0.075
0.050
0.025
0.000
Day in Cycle
Figure 4.11b
Pectoral Muscle Lipid Index of female Zebra Finches during the laying cycle from Day -3 to Day 1 only (mean ± s.d.)
y = 0.1 - 0.013x, r27= -0.967, p<0.0001
Day -3 -2 -1 0 1
n 4 9 6 6 4
85
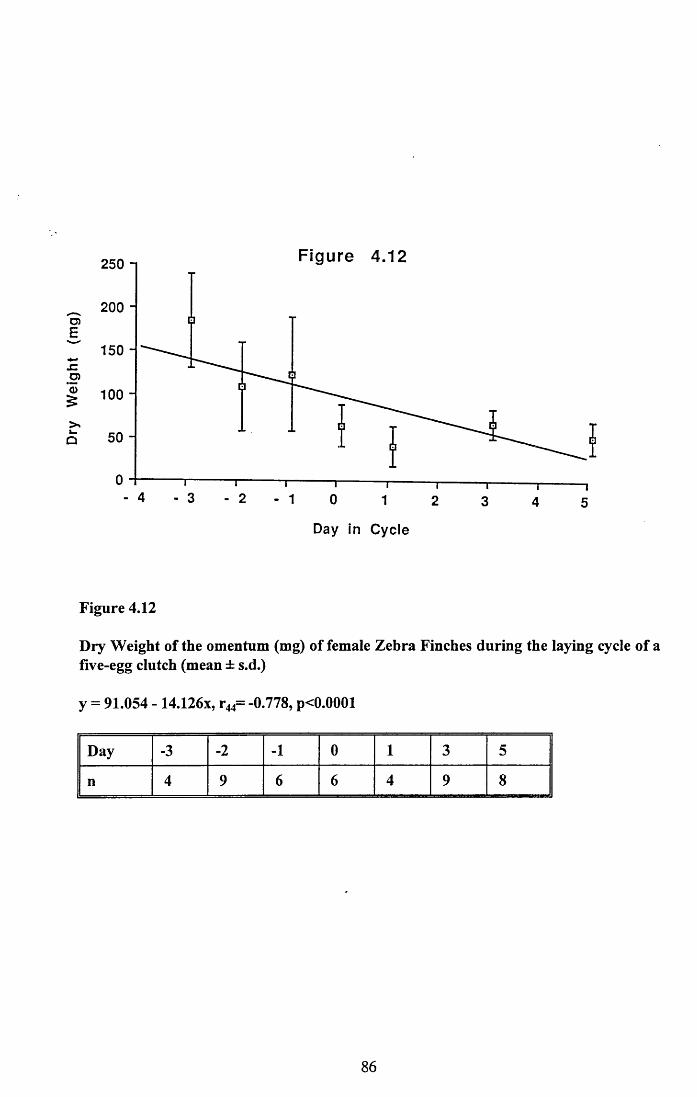
Figure 4.122 5 0 i
_ 200 -
D)E
" 1 5 0 -4-«szO)^ 100 -
5 0 -Q
4 3 2 1 0 1 2 3 4 5
Day in C y c le
Figure 4.12
Dry Weight of the omentum (mg) of female Zebra Finches during the laying cycle of a five-egg clutch (mean ± s.d.)
y = 91.054 - 14.126x, r44= -0.778, p<0.0001
Day -3 -2 -1 0 1 3 5
n 4 9 6 6 4 9 8
86
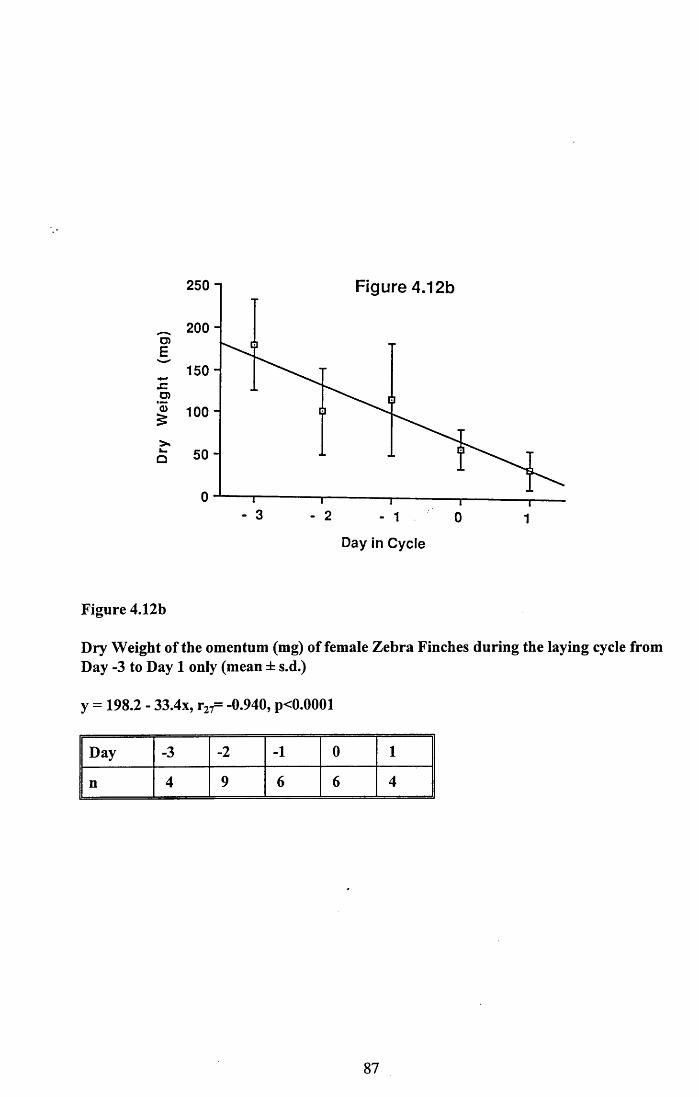
250 Figure 4.12b
_ 200 U)E~ 1 5 0 *-•szo>I 100
Q
3 2 1 0 1
Day in C ycle
Figure 4.12b
Dry Weight of the omentum (mg) of female Zebra Finches during the laying cycle from Day -3 to Day 1 only (mean ± s.d.)
y = 198.2 - 33.4x, r27= -0.940, p<0.0001
Day -3 -2 -1 0 1
n 4 9 6 6 4
87
4.4 DISCUSSION
4.4.1 Changes in body reserves: Protein.
As in previous studies, the pectoral flight muscle (pectoralis major and supracoracoideus)
was used as an index of changes in reserves of protein during the laying cycle. The results
indicate that there is a significant decline in the protein condition of the female Zebra Finch
under the stress of breeding (Figure 4.1 & 4.1b). In addition, an absolute value for the
amount of protein that this decline represented was obtained (Figure 4.2 & 4.2b). This was
a loss of 5 lmg from the right pectoral muscle block. Assuming equality with the left side,
then a total of 102mg was lost from the pectoral muscles. This quantity represents 15% of
the total protein content of a five-egg clutch (674mg, Chapter 2). The timing of this decline
is significant also as from Day -3 to Day 1 it corresponds to the rapid increase in demand
for egg nutrients occuring at this time (see Chapter 2). This pattern is similar to that seen in
the Red-billed Quelea and the Grey-backed Camaroptera, both of which experience a
decline in their flight muscle lean dry weight during the three days leading up to the laying
of the first egg (Jones & Ward, 1976, Fogden & Fogden, 1979). In a study of the House
Sparrow, the total protein content of the pectoral muscles was at maximum on Day -2 of the
cycle and declined to Day 2 (Jones, M.M., 1991). This pattern is identical to that seen in the
Zebra Finch but is on different days because the Sparrow lays a slightly smaller clutch. As
in the Zebra Finch, this drop in the muscle protein content of the House Sparrow closely
matches the pattern of demand for egg nutrients which increase rapidly from Day -3 to
reach a peak on Day 0 (Krementz & Ankney, 1986).
The lean dry weight of the muscles declined by 13% of their weight at the commencement
of the laying cycle. This value compares well with the 16% drop in flight muscle weight
recorded in the Quelea (Jones & Ward, 1976). While appearing to be small this value
represents almost half of the difference in muscle lean dry weight between Quelea in peak
condition and those that had died of starvation.
In general, the pectoralis major and the supracoracoideus between them represent the
largest single mass of muscle to be found on flying birds (George & Berger, 1966). The
Zebra Finches in this study had a mean wet pectoral muscle mass of 3.012 ± 0.018g, n =
46, which is 19.8% of the whole body mean wet weight of 15.25 ± 0.19g, n = 110. The
flight muscles represent a substantial part of any potential reserve of protein.
In addition to the pectoral muscles there was also a significant decline in the lean dry
weight of the entire carcass (minus reproductive tissue), Figure 4.3, r44 = -0.920, p <
0.0001. The pattern of decline is similar to that seen in the pectoral muscles, occuring
largely from Day -3 to Day 1 (Figure 4.3b). The total loss of protein, calculated from the
difference between the mean on Day -3 and Day 1, was 518mg. Of this the 102mg from the
flight muscle makes up 19.7%. The mean total loss of protein from the body over the
laying period of 518mg, represents 76.8% of the protein content of a 5 egg clutch. The
significant loss of dry weight from the leg muscle (Figure 4.4) provides evidence that the
flight muscle is not the only muscle group undergoing a decline during the laying period.
Muscle is not a static tissue. In humans the protein turnover rate in skeletal muscle is 12%
per day and it plays a vital role in maintaining blood amino acid homeostasis (Spargo et
al.,1979). Millward (1970) reported that the skeletal muscles play the dominant role in the
overall protein metabolism. In the breast muscle of domestic hens the rate of synthesis of
new protein is as high as 20.4% per day (Hiramoto et al, 1989). Therefore it appears that
the skeletal muscle system may have the potential to act as the major component of the
body's protein reserves which may be drawn upon when the bird is under nutritional stress,
as when producing eggs.
It was not just the muscles that were contributing to the loss of lean dry weight from the
carcass. Evidence obtained from the dry weights of various organs suggested that other
organs are important also. The gut (Figure 4.5), the liver (Figure 4.6) and the gizzard
(Figure 4.7) all showed significant loss of dry weight across the laying cycle. Several other
studies have implicated the role of organs other than muscle in potentially making protein
available for egg production. The Black Duck (Reinecke et al, 1982), the Mallard Duck
(Krapu, 1981) and the Lesser Snow Goose (Ankney & Machines, 1978) all have a
significant loss of lean dry weight from the gizzard associated with egg production. The
Brant Goose has a significant loss of lean dry weight from the gizzard and liver (Ankney,
1984). Some of the above birds do not feed while producing eggs and weight loss from the
89
gut is likely when it is not in use, however, the Zebra Finch continues to feed during the egg
formation period. The heart (Figure 4.8) does not experience any loss of dry weight.
In addition, as shown in Chapter 2, the oviduct undergoes a decline in lean dry weight,
potentially releasing material that may be used for egg production. In the female Zebra
Finch this decline amounted to a total of about 70mg lean dry weight. Krementz & Ankney
(1986) suggested that in the House Sparrow also, the oviduct acted as a storage organ for
protein that is used in egg formation.
4.4.2 Changes in body reserves: Lipid.
Lipid (fat) reserves in the female Zebra Finch also decline under the stress of breeding
(Figure 4.10, r44 = -0.795, p < 0.0001). As with protein reserves it can be seen that the bulk
of this decline occurs from Day -3 to Day 1. The overall decline in absolute terms was
895mg. The total lipid requirement for a clutch of five eggs is 291.5mg (Chapter 2).
Clearly, the loss of lipid from reserves can easily provide for the entire clutch but this
suggests the lipid reserves may play a role in egg production beyond supplying the eggs
themselves. In the studies of Quelea (Jones & Ward, 1976) and Camaroptera (Fogden &
Fogden, 1979) it was suggested that the lipid reserve was used to fuel a change in the
foraging strategy of the birds. This meant a switch from energy rich seeds to insects
(Quelea) or to calcium rich food items (Camaroptera). The fat reserves could be drawn
upon to make up for the deficit in energy intake.
Most of the stored lipid in birds is found in discrete sub-cutaneous depots (Blem, 1990) and
the results indicate that these depots are utilised by the female when she is producing eggs.
The dry weight of one of the fat bodies, the omentum, decreased significantly (Figure 4.12,
r44 = -0.778, p < 0.0001). The lipid levels in the pectoral muscle, which constitute 6.9% of
the muscle dry weight, are small by comparison but also decline significantly (Figure 4.11,
r44 = -0.587, p < 0.0001). This level of lipid in the muscle is usual for passerines. The lipid
content of pectoral muscle in the Sand Martin, for instance, is 7.9% (Jones, G., 1987).
Intramuscular lipid was positively correlated with muscle lean dry weight in Eared Grebes
when muscle condition was improving in preparation for migration (Gaunt et al, 1990).
90
In all of the lipid measures taken the timing of the decline was similar to that seen in the
lean dry weight of pectoral muscle and the body as a whole, occuring between Day -3 and
Day 1 (Figures 4.10b, 4.1 lb and 4.12b). This is the period when lipid is being laid down in
the developing yolks. Demand for lipid increases rapidly from about Day -4 and is maximal
on Day 0 (Figure 2.5b).
The overall decline of lipid from the carcass as a whole was 61% of the level recorded on
Day -3. This represents a significant usage of lipid reserves. The final level of lipid
reserves of 0.570 ± 0.080g is much lower than the mean level of lipid found in
non-breeding females, 1.021 ± 0.186g, n = 24. The difference and more must be recovered
between breeding attempts. Indeed, in females immediately prior to breeding the mean lipid
content of the carcass was 1.5 ± 0.6g.
4.4.3 Change in body reserves: Calcium.
Calcium reserves are known to be drawn upon by many species of bird for shell
production. The domestic fowl utilises medullary bone for this purpose (Simkiss, 1975)
and to a lesser extent the House Sparrow does also (Krementz, 1983). Being a small bird,
the potential for the use of the skeleton as a site for storing calcium in the Zebra Finch is
reduced. The total calcium requirement for a five egg clutch is 89mg (Chapter 2). The
mean ash weight of a Zebra Finch is 492 ± 9 mg of which only 18.3 ± 0.6% is calcium.
This makes the total calcium reserve of a female Zebra Finch 90mg. Supplying calcium for
a clutch from bone calcium stores would require a 100% increase in calcium which is
highly unlikely. The results suggest that there is little evidence for storage and/or use of
calcium reserves for reproductive purposes. The ash weight index did not change
significantly during the cycle (Figure 4.9, r26 = 0.297, p > 0.05). Also, the calcium content
of the ash of pre-laying females is no different to that in post-laying females (t8 = 0.227, p
> 0.05). Female Zebra Finches do not appear to draw upon their reserves of calcium when
producing a clutch of eggs.
4.4.4 The budgeting of endogenous and exogenous nutrients during egg production
Chapter 2 considered the costs, in terms of protein, lipid and calcium of the production of a
clutch of Zebra Finch eggs. In Chapter 3 the diet of the birds while forming eggs was
91
investigated. An estimate of the contribution that the diet made to the clutch was also
calculated. In this Chapter the role of body reserves has been studied. By bringing these
elements together it is possible to estimate a budget of exogenous and endogenous sources
of material for egg production and their relative importance. For this budget I have used a
five-egg clutch because the mean clutch size for the colony was 5.2 ± 0.9, n = 120, and the
data in this chapter and Chapter 2 was based on females laying five-egg clutches.
4.4.4.1 Lipid
The lipid content of an egg is 58.3mg (Table 2.1). This is 291.5mg for a five-egg clutch.
The energetic value of this is; 2.624 to 2.769 kcal.
The total decline in lipid reserves resulted in a loss of 895mg of lipid. Using the values for
energy content shown earlier, 9.0 to 9.5 kcal/g (Blem, 1990), the total energy that this could
provide is; 8.055 to 8.502 kcal.
In Chapter 3 I estimated that an increase of digestive efficiency, of the order described by
El-Wailly (1966), could provide up to 63% of the lipid content of an egg.
It would appear, therefore, that the lipid requirements of the clutch can easily be met by the
female finch, even from reserves alone. The excess of loss may be due to the female
drawing upon the lipid reserves for energy to fuel normal metabolism and the demands of
egg formation. In wild granivorous birds lipid reserves are thought to be critical during
breeding. Jones and Ward (1976) reported dead female Quelea around breeding colonies
after cold nights. These birds had very low lipid reserves. It was suggested that lipid
reserves provided an important energetic buffer for the extra demands of egg formation and
related behaviour. These birds had run their reserves so low that they had insufficient to
survive an unusually cold night. In the artificial conditions of the experimental Zebra Finch
colony where energy requirements for normal activity are much reduced, the levels of fat
reserves are probably never reduced to the extent that the birds are in any danger. It is likely
that the fat reserves of wild Zebra Finches are never as high as those seen in the captive
birds.
92
4.4A.2 Protein
The total protein content (lean dry weight of yolk and albumen) of a clutch of 5 eggs is
674mg.
In Chapter 2 the mass of the oviduct was shown to decline from Day 1 to Day 5 of the
laying cycle. This could potentially provide 70mg of protein (10.4% of egg protein). The
other body reserves, as described above, could potentially provide 518 mg (76.8%). This is
based on the decline of lean dry weight in muscles and other organs. Including the oviduct,
the total protein that could potentially be available for egg formation and assuming a 100%
conversion efficiency, is 588mg (87.2% of egg requirement). I am aware of no studies
which give the conversion efficiency of endogenous nutrients to egg nutrients. Astheimer &
Grau (1985) used a figure of 75% for their study of Adelie Penguins. The conversion of
exogenous nutrients into egg nutrients has been given as 77% (Brody, 1945). Krementz &
Ankney (1985) assumed 100% efficiency and pointed out that their estimates were liberal
and Alisaukas & Ankney (1985) also assumed 100% in the absence of any empirical
alternative. It is reasonable, therefore, to assume that the efficiency of conversion of
endogenous nutrients is at least 77% as the costs associated with protein accumulation and
the conversion of digestible carbohydrates to lipid at the time of storage should not be
incorporated in the costs at the time of laying.
The other cost of egg formation is the growth of the oviduct. The total protein (lean dry
weight) needed for this was 113.8mg. When taking this into consideration, the decline in
body protein reserves could provide a maximum of 74.6% of the total protein for eggs and
oviduct.
Finally, the contribution that the diet makes to the budget. This is limited by the fact that
seed is a relatively protein poor food. Based on El-Wailly's (1966) figures for increased
digestive efficiency I estimated that an extra 12mg of protein could be liberated each day. If
this was sustained for the ten days of the egg formation period a total of 120mg (15.2% of
egg plus oviduct) would potentially be available.
93
This gives a total of 708mg which is 89.9% of the protein required for a clutch of five eggs
and the growth of the oviduct.
This leaves a deficit of just over 10% to be accounted for. There are some possible
explanations for this. As mentioned earlier it is possible that the digestive efficiency of the
birds may have been much higher than the estimate of El-Wailly (1966) and thus the
protein available from the diet would be higher. In poultry it is known that when protein is
at or below minimum levels the efficiency of absorption increases (Nesheim et al, 1979).
Secondly, breeding pairs of Zebra Finches displayed a much lower level of activity
compared to control pairs (see Chapter 3). This has been reported for other species, for
example, the Camaroptera (Fogden & Fogden, 1979). It is possible that this leads to
reduced energy and possibly protein metabolism that allows extra resources to be directed
to egg production.
In the feeding trials the mean clutch size of pairs involved was 4.0 ± 0.5 eggs, whereas the
colony mean was 5.2 ± 0.9 eggs. The total protein contained in 4 eggs plus the oviduct
growth was 653mg. In this case the protein from the diet and body reserves would have
been enough to meet the demand. A possible reason for the birds in the feeding trial laying
a smaller clutch was that these birds were fed a single seed diet during the experiment
compared to the mixed seed that the birds were usually fed. The single seed diet had only
69.6% of the protein available in the mixed seed.
It is apparent, however, that protein reserves play a crucial role in supplying protein for egg
production in female Zebra Finches.
Calcium reserves play little or no role in supplying the developing egg shells. Therefore, all
of the calcium that is required for the eggs is derived from exogenous sources. The
substantial increase in weight loss from the cuttlefish bone and the timing of the increase
support this conclusion.
In summary, therefore, it appears that female Zebra Finches are heavily reliant on
endogenous reserves of protein for egg production. 74.6% of the total protein requirement
94
for eggs and oviduct could potentially be obtained from body reserves assuming 100%
conversion efficiency. All of the lipid requirements could be met from reserves also. Lipid
reserves may also be drawn upon to allow changes in feeding strategy or behaviour when
the diet alone cannot provide sufficient. Finally, calcium for the eggs seems to be derived
entirely from exogenous sources because the size of the Zebra Finch does not allow for a
useful storage capacity of this nutrient.
95
CHAPTER 5 - CHANGES IN LIPID AND PROTEIN CONTENT OF THE
PECTORAL FLIGHT MUSCLES OF FEMALE ZEBRA FINCHES
DURING BREEDING
5.1 INTRODUCTION
The preceding chapter presented data indicating that body reserves are playing the major
role in supplying protein for the developing eggs of female Zebra Finches. The aim of this
chapter is to look more closely at the flight muscles to determine how much and from
where in the muscle, protein is being lost.
In common with other studies concerning the changes in body condition associated with
breeding (e.g. Alisaukas & Ankney, 1985, Ankney & Maclnnes, 1978, Jones & Ward,
1976, Krementz & Ankney, 1986) a simple technique involving the extraction of lipid by a
solvent and the calculation of the lean dry weight was used in the previous chapter. This
technique generally assumes that lean dry weight is representative of protein content. In
studies on the House Sparrow, Jones, M.M. (1979, 1980 and 1991), used a more
sophisticated technique to directly measure the protein content of the flight muscle. As the
sarcoplasm has been suggested as a possible site for the storage of protein in birds (Kendall
et al, 1973) it was necessary to investigate if the decline in lean dry weight observed in the
Zebra Finch was caused by a decline of the myofibrillar portion of the muscle or the
sarcoplasm, or both. The technique described by Jones, M.M. (1980) allowed this
distinction to be made.
In addition to this, work conducted on the Starling (Osbom & Ward, unpublished data)
revealed a high molecular weight protein in the sarcoplasm which declined under the stress
of breeding, while other detected proteins did not. Amino acid analysis of this protein
suggested that the tyrosine, methionine and cysteine content declined faster than the
decline in total protein content. It has been proposed that one possible reason for the use of
body protein in the production of eggs could be to supply certain amino acids that might be
limiting in the diet (Schifferli, 1976). There is some potential for this to be a factor with the
Zebra Finch as they eat a diet that is relatively low in protein.
96

The purpose of this chapter was to obtain an accurate measure of the decline in protein
from the pectoral flight muscles of female Zebra Finches while producing eggs. Secondly,
it was necessary to identify to what extent each portion of the muscle, sarcoplasm or
myofibrillar, was contributing to this observed decline. Thirdly, as there was some
evidence to suggest the sarcoplasm as the site of a possible protein store, and indeed of a
specific storage protein, the sarcoplasmic extract of the flight muscle was examined by the
process of gel filtration.
97
5.2 MATERIALS AND METHODS
5.2.1 Collection of material for analysis.
Samples of pectoral muscle were obtained as recorded in Chapter 4. In most cases only the
left pectoral muscle block was used. However, in some cases both muscles had to be used
for biochemical analysis and therefore no lean dry weight of muscle was obtained and the
carcass not used for body reserve estimation. Sample sizes are not, therefore, exactly the
same as those in Chapter 4.
As before, pre-breeding females were those that had not laid any eggs but possessed
developing follicles. These were allocated to the correct day in the laying cycle following
the technique described in Chapter 2. All other birds used were those that had laid or would
lay (confirmed by examination of the ovary) a five-egg clutch.
5.2.2 Analysis of pectoral muscle tissue
Once the muscle was removed from the bird, it was immediately weighed (to 0.00 lg).
Using a scalpel it was chopped coarsely and 1.00g of the chopped muscle taken for the
analysis. The remainder was refrozen and retained.
The 1.00g of muscle from the left pectoral muscle block was placed in a glass tube
suspended in ice, with 4ml of 0.25M sucrose in 60mM tris, pH 7.5. The muscle was then
homogenised using an Ultra-turax homogeniser for a total of 60 seconds. This was done in
twelve 5 second bursts with 35 seconds cooling between each burst to prevent excessive
heat build up which could denature proteins. The resulting homogenate was placed into two
15ml Corex tubes that had been pre-weighed to 0.000lg. The homogenate was centrifuged
at 10,000rpm at 4°C for 1 hour in an MSE 18 centrifuge (8 x 50ml head).
The supematent was refered to as the Water soluble extract and was taken to represent
the contents of the sarcoplasm. The volume of recovered supematent was recorded (to
0. lml) and 2ml of this extract was used for gel filtration (see below), the remainder for
direct protein determination.
98
The pellet in each of the corex tubes had 2ml of 0.3M sodium hydroxide added and the
pellet resuspended using a glass rod shaped to fit the centirifuge tubes. This was then
incubated at 37°C for an hour and then spun at 10,000rpm in an MSE 18 centrifuge (8 x
50ml head) for 30 minutes. The supematent collected this time was refered to as the Alkali
soluble extract and is taken to represent the myofibrillar portion of the muscle. The
volume recovered was measured to 0.01ml. The tubes containing the pellet were dried at
100°C to constant weight at 0.000 lg. This gave the dry weight of the Insoluble material
of the muscle, which is likely to be mostly collagen (Jones, M.M., 1980).
The water and alkali soluble extracts were then stored frozen in eppendorf vials until
analysis.
5.2.3 Analysis of the water soluble extract of pectoral muscle by gel filtration
When the water soluble extract was being prepared a 2ml sample was immediately taken
for gel filtration analysis. The sample was kept chilled at all times and the analysis
performed at a constant temperature of 4°C.
The gel filtration column used was filled with LKB Ultrogel ACA 34 and had a bed
dimension of 87.5cm x 2.6cm. A 60mM tris buffer at pH 7.5 was used throughout,
pumping at 30ml per hour. The eluted buffer was monitored at 280nm by an LKB UVCord
spectrophotometer. A pen recorder provided a permanent record of each sample, recording
absorption at 280nm against time. In this way a characteristic trace for each sample was
obtained. Material could be collected in the eluted buffer by means of a fraction collector
set to take 5ml fractions. These samples were then read at 280nm on an LKB Ultrospec
spectrophotometer to identify those which were to be kept.
A gel filtration calibration kit supplied by Pharmacia Fine Chemicals was used for
molecular weight determination of the fractions collected. The column used was calibrated
using aldolase, catalase, ferritin and Blue Dextran 2000. Manufacturer's instructions were
followed throughout to produce a calibration curve that allowed molecular weight to be
calculated from the elution volume of the unknown peak. The procedure is as follows;
99
1 - A Kav value for each of the above proteins is calculated using the equation;
Kav = (Ve - V0) - (Vt - V0) Equation 5.1
Ve = elution volume for each protein
V0 = column void volume = elution volume of Blue Dextran 2000
Vt = total gel bed volume
2 - Using semi-logarithmic graph paper, the Kav value for each of the protein standards (on
the linear scale) against the corresponding molecular weight (on the logarithmic scale).
of ferritin, catalase and aldolase was 0.15, 0.26 and 0.41 respectively.
3 - The regression equation can be calculated from the graph and used to convert elution
volumes to molecular weight. The equation obtained was;
log Molecular Weight = -1.676(K^.) + 5.860 (Equation 5.2^
5.2.4 Protein content of water and alkali soluble extracts of pectoral muscle
The protein content of each of the extracts was calculated using the same technique used in
Chapter 3 for protein content of seed. Standards were made using 2mg/ml bovine serum
albumen (BSA) and a standard curve plotted as before, which allowed conversion of
measured absorbancy at 750nm to jug of protein per lOOpl.
Each sample was diluted 1:50 using 0.1M sodium hydroxide to bring the samples within
the calibration range. lOOpl aliquots of the diluted sample were assayed in duplicate
throughout.
100
5.3 RESULTS
5.3.1 Protein content of the water soluble and alkali soluble extracts of pectoral muscle
The technique used to analyse the muscle produced two fractions of the pectoral muscle;
the water soluble extract was representative of the proteins found in the sarcoplasm and the
alkali soluble extract was representative of the proteins of the contractile elements of the
muscle (Jones M. M., 1979). The protein content of each extract from 56 female Zebra
Finches was measured. Figure 5.1 shows the mean values for sarcoplasm protein over the
laying cycle, up to Day 5 when the last egg was laid (As in Chapter 4 all figures show
means with standard deviation for each day of the laying cycle. The regression equations
were calculated from all data points). The decline in protein content is significant, r54= -
0.865, p < 0.0001. In common with the results for pectoral muscle lean dry weight, the
decline in protein content occurs mostly from Day -3 to Day 1 (Figure 5.1b), r44= -0.976, p
< 0 .0001.
A very similar pattern was found for the myofibrillar protein (Figure 5.2), r54 = -0.862,p <
0.0001, over the whole cycle and from Day -3 to Day 1 (Figure 5.2b), r^= -0.982, p <
0 .0001 .
The timing of both of the declines is similar and the combined mean values for protein in
both of the extracts is shown in Figure 5.3, r54 = -0.873, p < 0.0001. Figure 5.3b shows the
period Day -3 to day 1, r44= -0.993, p < 0.0001. The dry pellet of residual material from
each of the muscles was weighed to determine if any component of the muscle other than
the protein was also declining. The mean dry weight of the pellets on each of the days
across the laying cycle (Figure 5.4) does not decline at all, r54 = -0.338, p > 0.05.
Therefore, it appears that it is only protein that is being lost from the flight muscles during
the laying cycle and this implies that the decline in the measured lean dry weight (Chapter
4) is due to levels of protein.
The absolute values of protein that these declines represented were calculated so that the
relative importance of the sarcoplasmic and myofibrillar extracts in supplying protein
could be determined;
101
Water Soluble Extract
The following calculation was used to estimate the average quantity of protein that was
lost from the water soluble extract of the flight muscles of the 56 birds used. The
calculation was made using mean values and as such is intended only to provide a mean
figure so that a comparison between sarcoplasmic and myofibrillar protein could be made.
Difference in mean, Day -3 to Day 5 = 25.4 -11.4 = 14 pg/lOOpl
Mean recovery of extract = 2.5 ± 0.02 ml, n=56
Mean wet weight of right pectoral muscle = 1.500 ± 0.01 Og, n=l 10
0.25ml of the extract was diluted to 12.5ml and lOOpl aliquots of this dilution were
assayed. Therefore, the quantity of protein in 0.25ml of extract is;
(12.5/0.1) x 14.0 = 1750pl = 1.75mg
The mean recovery of extract was 2.5ml, therefore the total sarcoplasmic protein obtained
from 1.00g of muscle was;
(2.5/0.25) x 1.75 = 17.5mg
The total pectoral muscle (both left and right side) therefore loses;
(1.500 x 2) x 17.5 = 5 2 .5 m g of sarcoplasm protein.
Alkali Soluble Extract
Exactly the same calculation was used to estimate the amount of protein that the
myofibrillar part of the muscle would have lost over the laying period.
Difference in Mean, Day -3 to Day 5 = 27.1 -15.9 = 11.2 pg/100pl
Mean recovery of extract = 3.9 ± 0.01 ml, n=56.
102
Applying the above calculation to these figures gives the following;
Protein in 1.00g of muscle = 21.84mg
Protein in total flight muscle = (1.5x2)x21.84 = 65.52mg
The combined loss of sarcoplasm and myofibrillar protein from the flight muscles is
118.02mg.
5.3.2 Gel filtration analysis of water soluble extract of pectoral muscle
The water soluble extract was passed through an Ac A 34 gel that separated the contents on
the basis of their molecular weight. The eluted buffer was monitored at 280nm with the
spectrophotometer zeroed on the tris buffer used. This meant that a distinctive trace was
produced for each sample on the pen plotter as it was eluted. Figure 5.5a and b show
examples of typical traces obtained for the Zebra Finch water soluble extract. Figure 5.5a is
from a female immediately prior to laying condition and Figure 5.5b is a post-laying
female.
A number of peaks are defined and were labelled 1 to 3. The absorbancy at 280nm (A280)
of each peak was recorded for each of the birds analysed in this way (33). However, it was
found that only the first of these peaks (Peak 1) declined during the laying cycle
(r31 = -0.828, p < 0.0001), while Peak 2 and Peak 3 did not change significantly (r31=
0.097, p 0.05, r31— 0.074, p ^ 0.05, respectively). Figure 5.6a-c shows the mean A28g of
Peak 1, 2 and 3 during the laying cycle.
Figure 5.7 is the period of Day -3 to Day 1 of Peak 1 absorbancy at 280nm (r25= -0.941 ,P <
0.0001). The major part of the decline in A280 came during this period in common with the
measured protein content of this fraction of the pectoral muscle (Figure 5.1b).
The Kav values for the three peaks were determined so that molecular weight could be
estimated using the equation (Equation 5.2) obtained from the calibration curve. Peak 1 lay
very close to the exclusion limit of the column with a mean of 0.05 ± 0.001, n=33. This
meant that it must have a molecular weight of over 400,000 but an accurate estimate is not
dependable when that close to the limit.
103
Peak 2 had a mean of 0.65 ± 0.02, n=33. This gives a molecular weight of 59,000. Peak
2 also absorbed heavily when read at 418nm whereas the other peaks did not. It is likely
that Peak 2 is avian haemoglobin, the human equivalent has a similar molecular weight of
approximately 64,500 (Stryer, 1981).
Peak 3 had a mean K^, of 0.99 ± 0.02,n=33, giving a molecular weight of around 16,000. It
is likely that this is myoglobin. Human myoglobin has a similar molecular weight of
17,900 (Stryer, 1981).
104
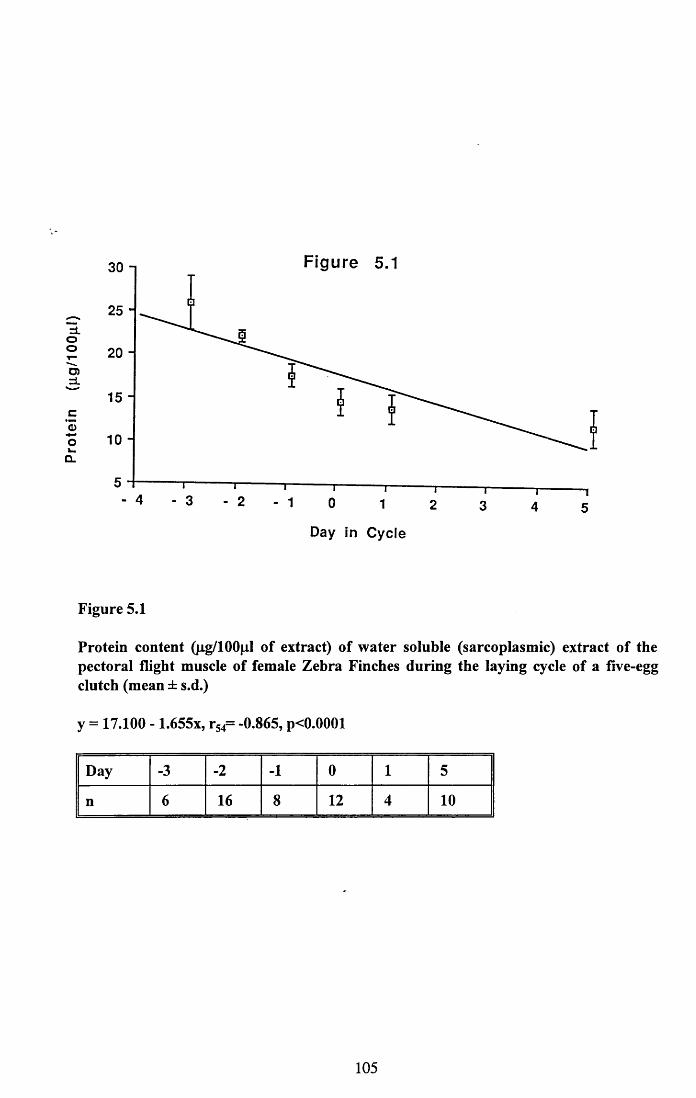
Figure 5.13 0 -i
2 5 -
20 -
o>=11 5 -
10 -
CL
Day in C y c le
Figure 5.1
Protein content (pg/100pl of extract) of water soluble (sarcoplasmic) extract of the pectoral flight muscle of female Zebra Finches during the laying cycle of a five-egg clutch (mean ± s.d.)
y = 17.100 - 1.655x, r54= -0.865, p<0.0001
Day -3 -2 -1 0 1 5
n 6 16 8 12 4 10
105
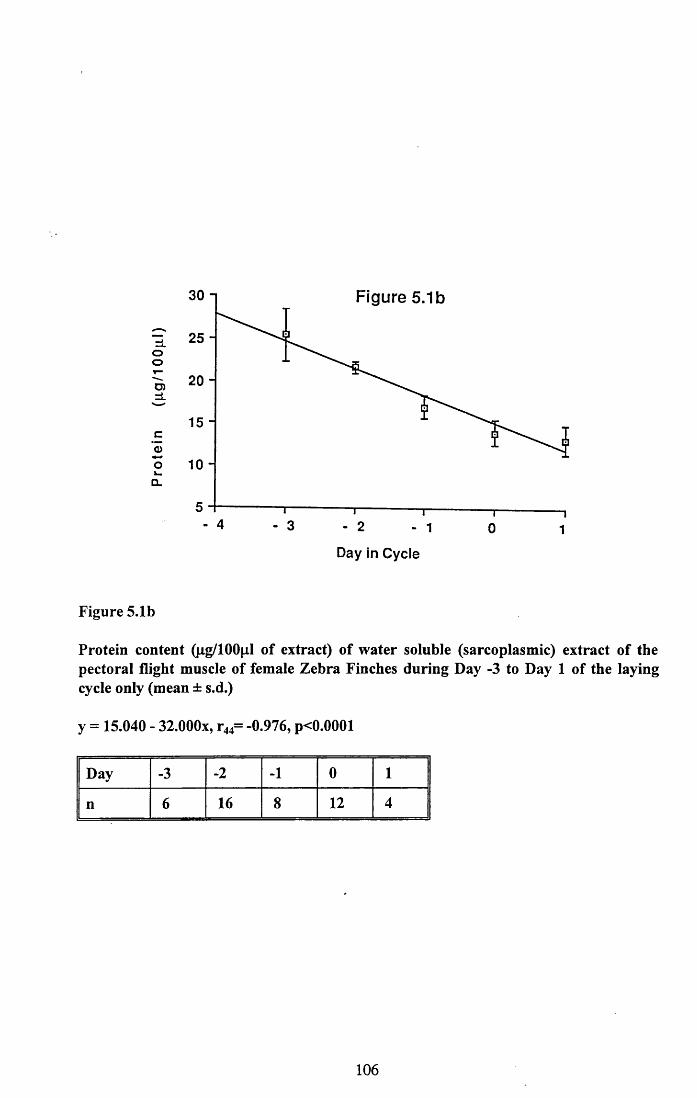
30 Figure 5.1b
25 -noo20 -o=±
15 -cook_
CL
- 4 - 3 2 1 0 1
Day in Cycle
Figure 5.1b
Protein content (pg/100|al of extract) of water soluble (sarcoplasmic) extract of the pectoral flight muscle of female Zebra Finches during Day -3 to Day 1 of the laying cycle only (mean ± s.d.)
y = 15.040 - 32.000x, r44= -0.976, p<0.0001
Day -3 -2 -1 0 1
n 6 16 8 12 4
106
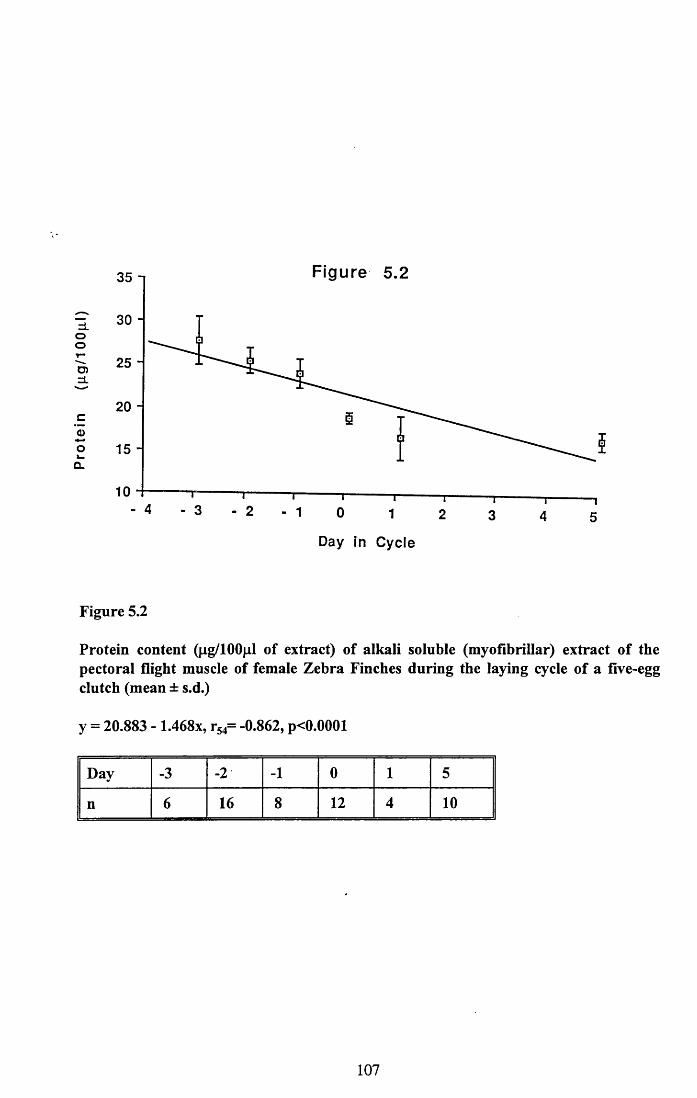
35 n Figure 5.2
zLooT“D>zL
cooL.
CL
10
30 -
25 -
20 -
15 -
- 4 - 3 - 2 - 1 0 1
Day in C y c le
Figure 5.2
Protein content Qig/100pl of extract) of alkali soluble (myofibrillar) extract of the pectoral flight muscle of female Zebra Finches during the laying cycle of a five-egg clutch (mean ± s.d.)
y = 20.883 - 1.468x, r54= -0.862, p<0.0001
Day -3 -2 -1 0 1 5
n 6 16 8 12 4 10
107
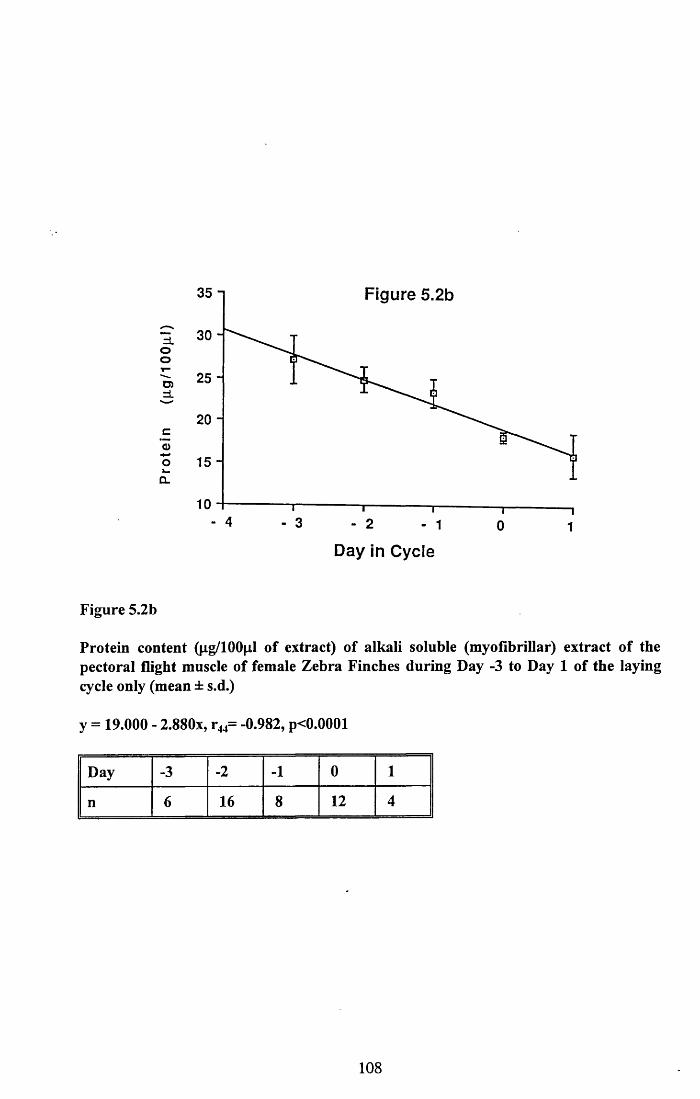
Figure 5.2b35 “|
30 -ztoo25 -u>=L
2 0 -
c©
15 -ok.
CL
4 3 2 1 0 1
Day in Cycle
Figure 5.2b
Protein content (|j.g/l00jj.I of extract) of alkali soluble (myofibrillar) extract of the pectoral flight muscle of female Zebra Finches during Day -3 to Day 1 of the laying cycle only (mean ± s.d.)
y = 19.000 - 2.880x, r44= -0.982, p<0.0001
Day -3 -2 -1 0 1
n 6 16 8 12 4
108
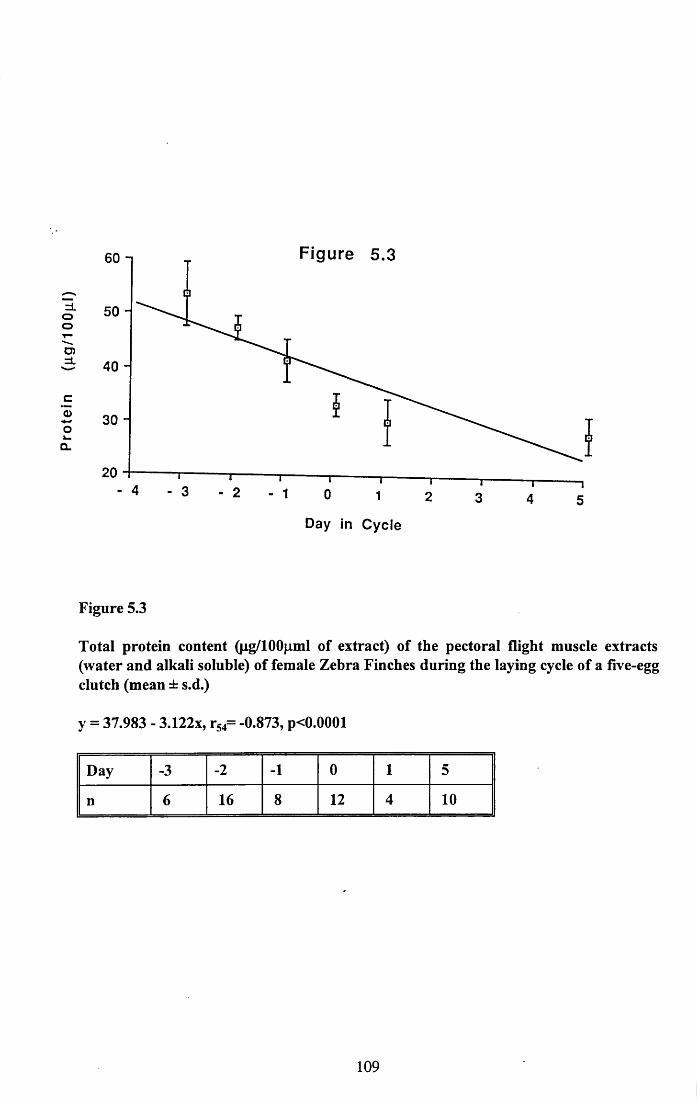
Pro
tein
(^
ig/1
00p.
l)
Figure 5.360 n
50 -
40 -
30 -
Day in C y c le
Figure 5.3
Total protein content (pg/lOOpml of extract) of the pectoral flight muscle extracts (water and alkali soluble) of female Zebra Finches during the laying cycle of a five-egg clutch (mean ± s.d.)
y = 37.983 - 3.122x, r54= -0.873, p<0.0001
Day -3 -2 -1 0 1 5
n 6 16 8 12 4 10
109
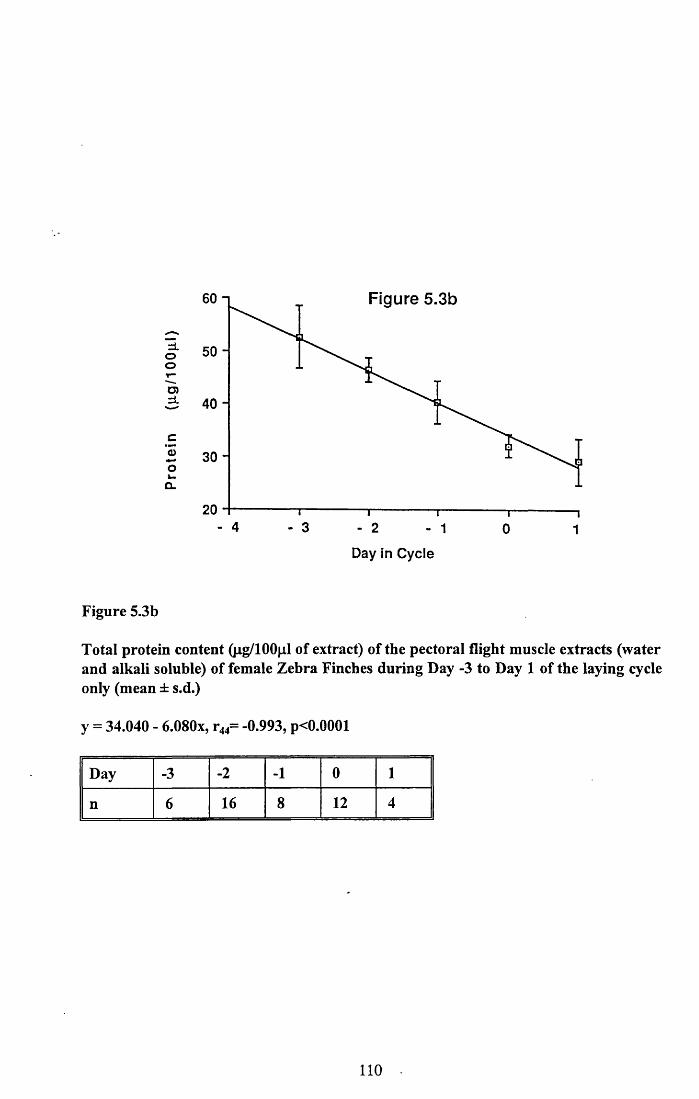
=LOOY“D)=1
C
ooI—Q.
Figure 5.3b
5 0
4 0
3 0
204 - 3 2 1 0 1
Day in Cycle
Figure 5.3b
Total protein content (pg/100(il of extract) of the pectoral flight muscle extracts (water and alkali soluble) of female Zebra Finches during Day -3 to Day 1 of the laying cycle only (mean ± s.d.)
y = 34.040 - 6.080x, r44= -0.993, p<0.0001
Day -3 -2 -1 0 1
n 6 16 8 12 4
110
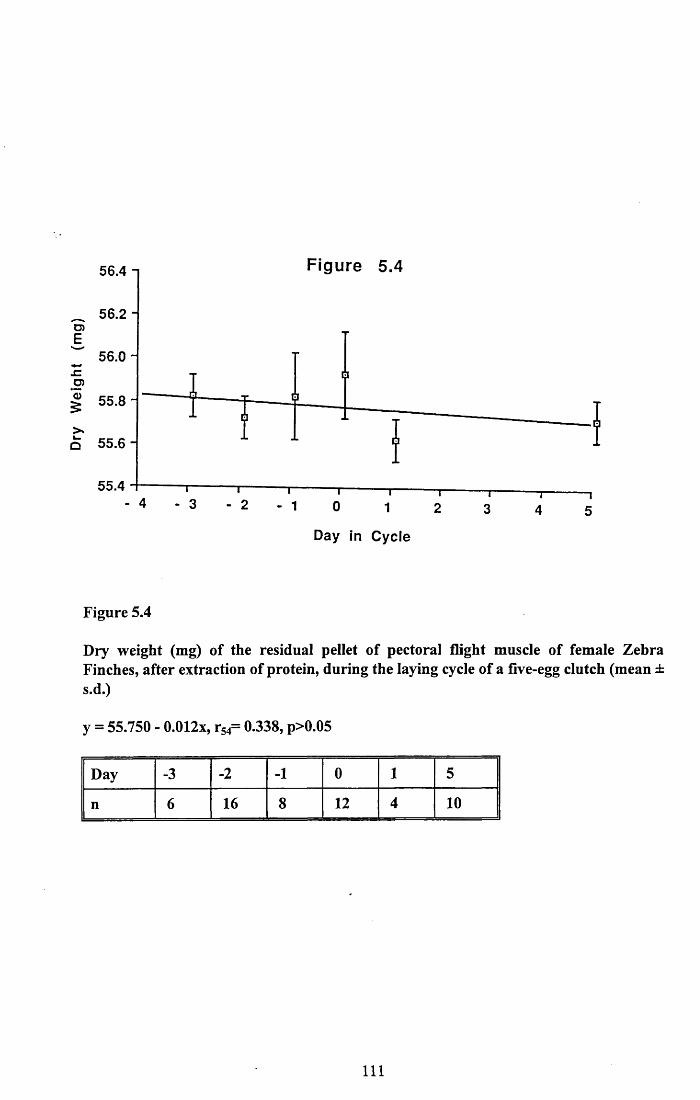
Figure 5.456.4 n
_ 56.2 -05Ew 56.0- sz.05
| 55.8 -
>*Q
55.4
Day in C y c le
Figure 5.4
Dry weight (mg) of the residual pellet of pectoral flight muscle of female Zebra Finches, after extraction of protein, during the laying cycle of a five-egg clutch (mean ± s.d.)
y = 55.750 - 0.012x, r54= 0.338, p>0.05
Day -3 -2 -1 0 1 5
n 6 16 8 12 4 10
111
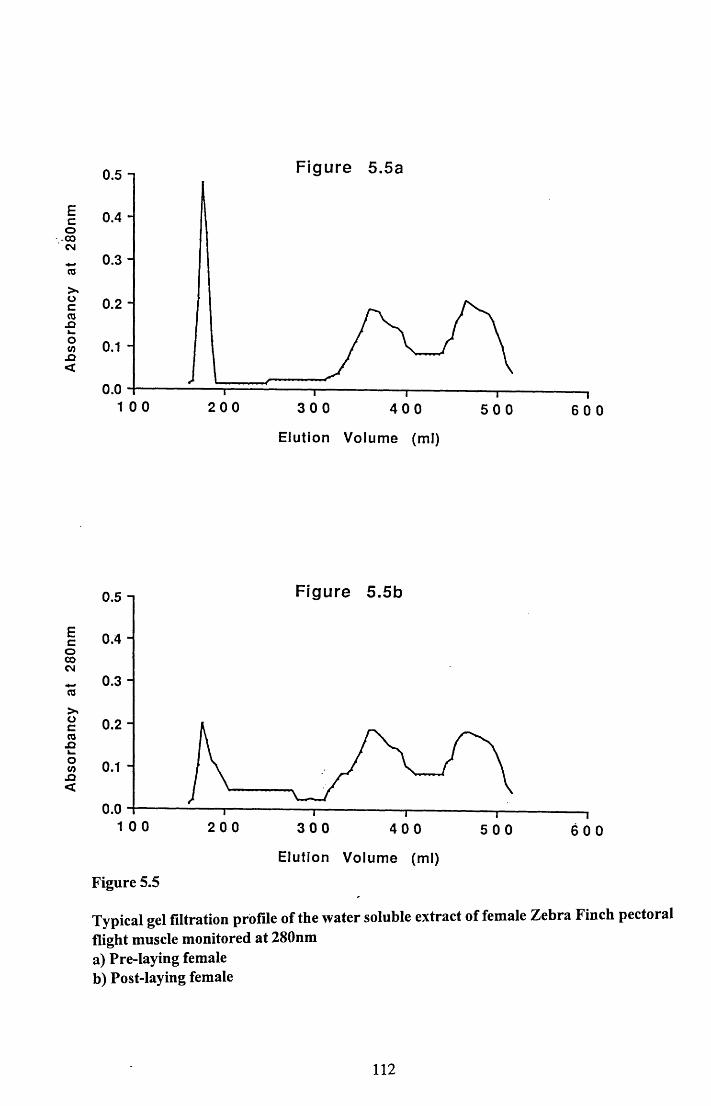
Abs
orba
ncy
at
280n
m
Abs
orba
ncy
at 28
0nm
Figure 5.5a0 . 5 n
0 . 4 -
0 . 3 -
0.2 -
0.0 — i—
3 0 0— i—
4 0 0
i2 0 0
— i—
5 0 0
E lut ion V o l u m e (ml)
Figure 5.5b0 . 5 -i
0 . 4 "
0 . 3 -
0.2 -
0.01 0 0 2 0 0 3 0 0 4 0 0 5 0 0 6 0 0
E lut ion V o l u m e (ml)
Figure 5.5
Typical gel filtration profile of the water soluble extract of female Zebra Finch pectoral flight muscle monitored at 280nma) Pre-laying femaleb) Post-laying female
112
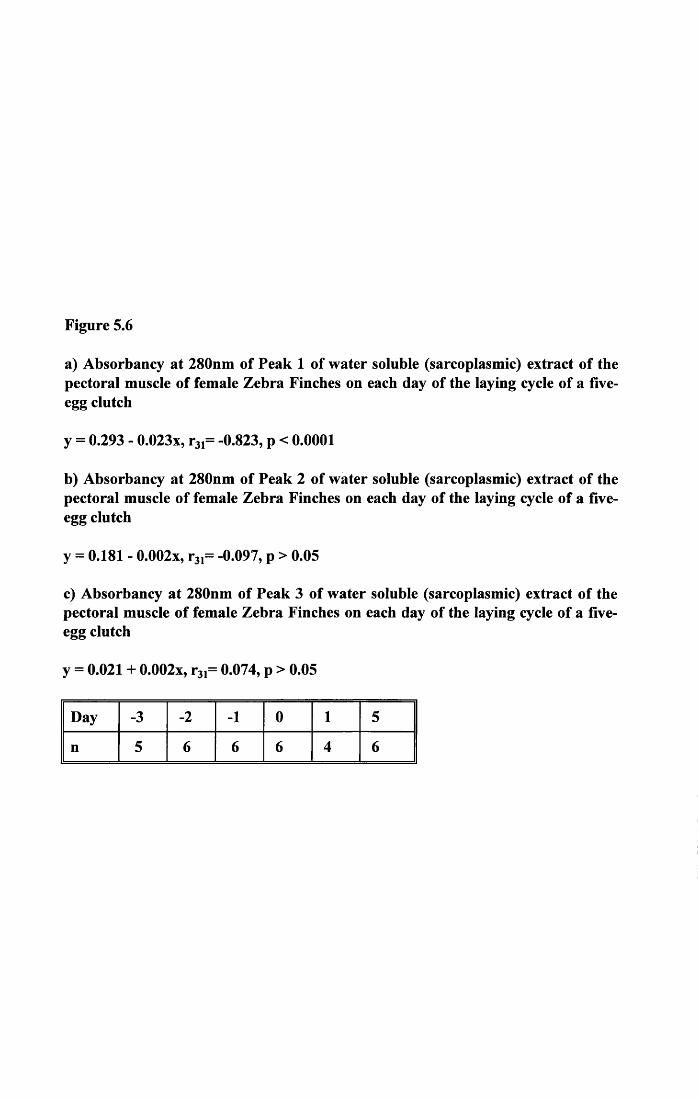
Figure 5.6
a) Absorbancy at 280nm of Peak 1 of water soluble (sarcoplasmic) extract of the pectoral muscle of female Zebra Finches on each day of the laying cycle of a five- egg clutch
y = 0.293 - 0.023x, r31= -0.823, p < 0.0001
b) Absorbancy at 280nm of Peak 2 of water soluble (sarcoplasmic) extract of the pectoral muscle of female Zebra Finches on each day of the laying cycle of a five- egg clutch
y = 0.181 - 0.002x, r31= -0.097, p > 0.05
c) Absorbancy at 280nm of Peak 3 of water soluble (sarcoplasmic) extract of the pectoral muscle of female Zebra Finches on each day of the laying cycle of a five- egg clutch
y = 0.021 + 0.002x, r31= 0.074, p > 0.05
Day -3 -2 -1 0 1 5
n 5 6 6 6 4 6
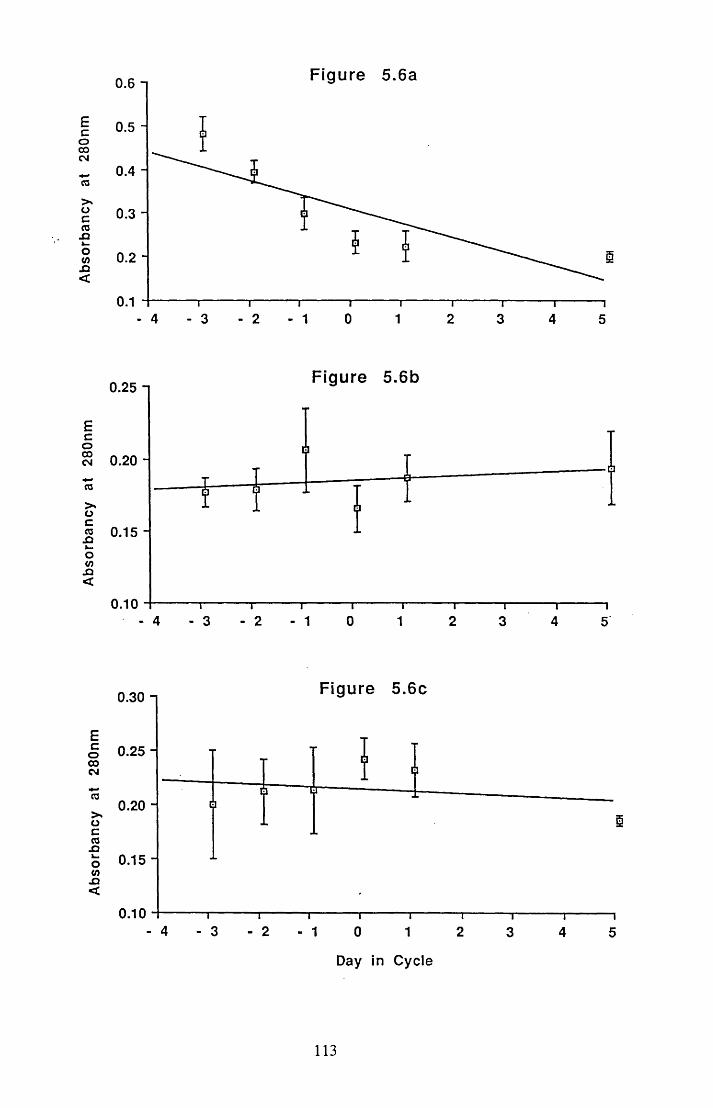
Abs
orba
ncy
at 28
0nm
A
bsor
banc
y at
280n
m
Abs
orba
ncy
at 28
0nm
Figure 5.6a0.6 i
0.5 -
0.4 -
0.3 -
0.2 "
0.104 3 2 2 3- 1 1 4 5
Figure 5.6b0.25 n
0.20 -
0.15 -
0.104 3 2 01 2 31 4 5
Figure 5.6c0.30 n
0.25 -
0.20 “
0.15 -
0.104 3 2 0- 1 1 2 3 4 5
Day in C y c le
113
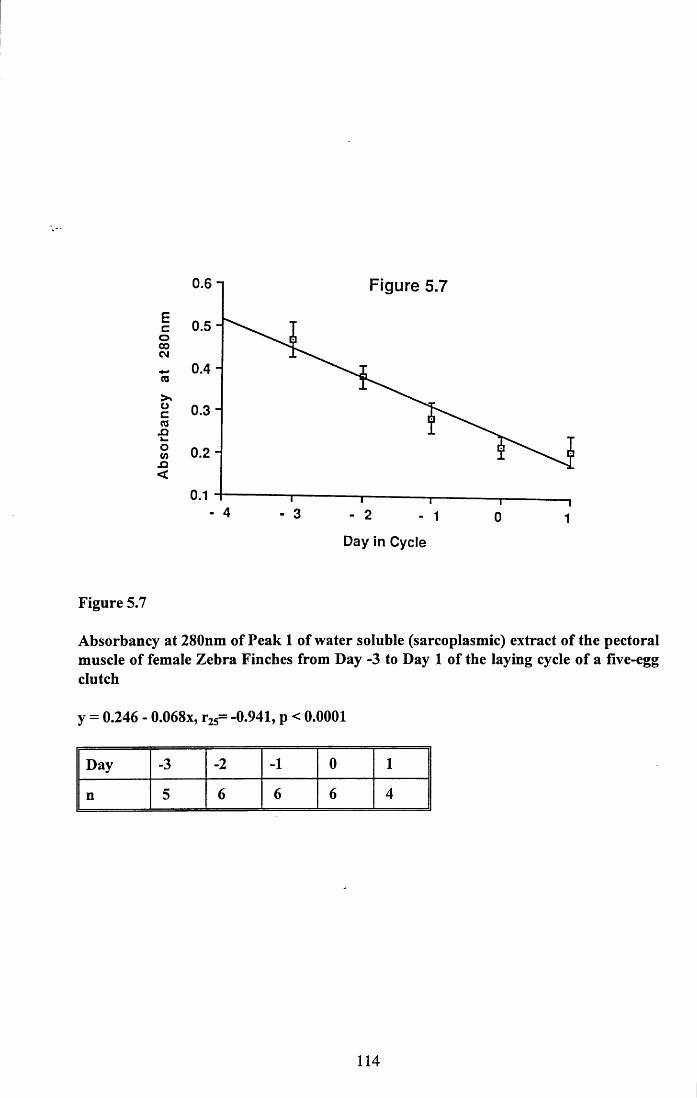
0.6 i Figure 5.7
I 0.5 - o 00 CM
~ 0.4 -(0
0.3 -
5> 0.2 ” x><
0.1 -
Day in Cycle
Figure 5.7
Absorbancy at 280nm of Peak 1 of water soluble (sarcoplasmic) extract of the pectoral muscle of female Zebra Finches from Day -3 to Day 1 of the laying cycle of a five-egg clutch
y = 0.246 - 0.068x, r25= -0.941, p < 0.0001
Day -3 -2 -1 0 1
n 5 6 6 6 4
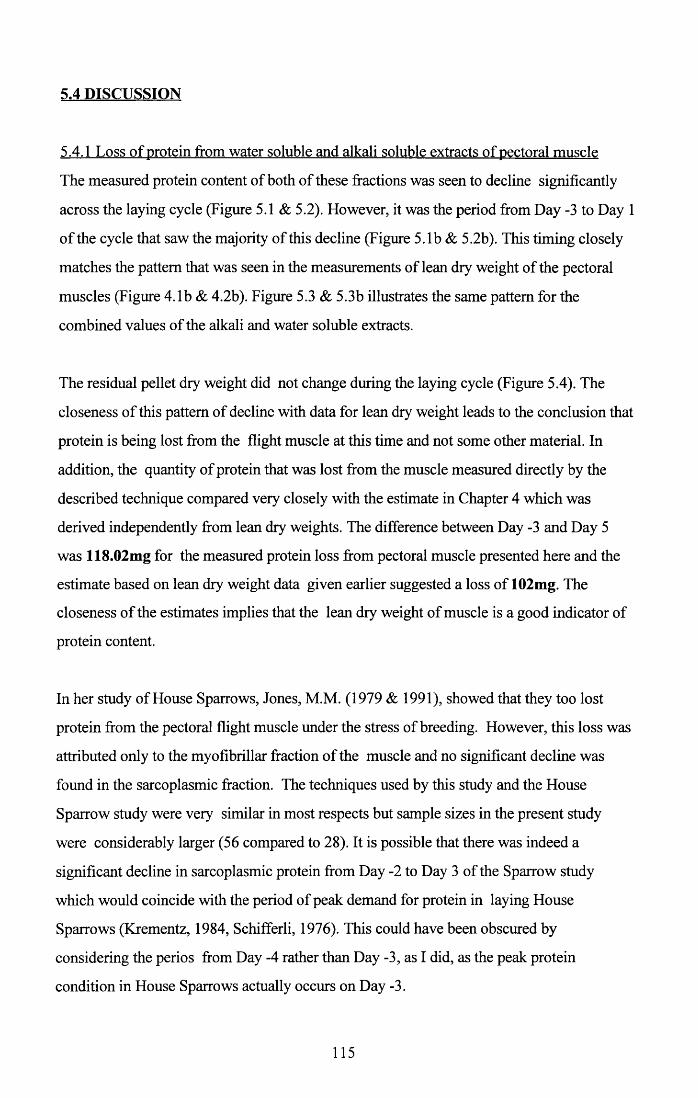
5.4 DISCUSSION
5.4.1 Loss of protein from water soluble and alkali soluble extracts of pectoral muscle
The measured protein content of both of these fractions was seen to decline significantly
across the laying cycle (Figure 5.1 & 5.2). However, it was the period from Day -3 to Day 1
of the cycle that saw the majority of this decline (Figure 5.1b & 5.2b). This timing closely
matches the pattern that was seen in the measurements of lean dry weight of the pectoral
muscles (Figure 4.1b & 4.2b). Figure 5.3 & 5.3b illustrates the same pattern for the
combined values of the alkali and water soluble extracts.
The residual pellet dry weight did not change during the laying cycle (Figure 5.4). The
closeness of this pattern of decline with data for lean dry weight leads to the conclusion that
protein is being lost from the flight muscle at this time and not some other material. In
addition, the quantity of protein that was lost from the muscle measured directly by the
described technique compared very closely with the estimate in Chapter 4 which was
derived independently from lean dry weights. The difference between Day -3 and Day 5
was 118.02mg for the measured protein loss from pectoral muscle presented here and the
estimate based on lean dry weight data given earlier suggested a loss of 102mg. The
closeness of the estimates implies that the lean dry weight of muscle is a good indicator of
protein content.
In her study of House Sparrows, Jones, M.M. (1979 & 1991), showed that they too lost
protein from the pectoral flight muscle under the stress of breeding. However, this loss was
attributed only to the myofibrillar fraction of the muscle and no significant decline was
found in the sarcoplasmic fraction. The techniques used by this study and the House
Sparrow study were very similar in most respects but sample sizes in the present study
were considerably larger (56 compared to 28). It is possible that there was indeed a
significant decline in sarcoplasmic protein from Day -2 to Day 3 of the Sparrow study
which would coincide with the period of peak demand for protein in laying House
Sparrows (Krementz, 1984, Schifferli, 1976). This could have been obscured by
considering the perios from Day -4 rather than Day -3, as I did, as the peak protein
condition in House Sparrows actually occurs on Day -3.
115
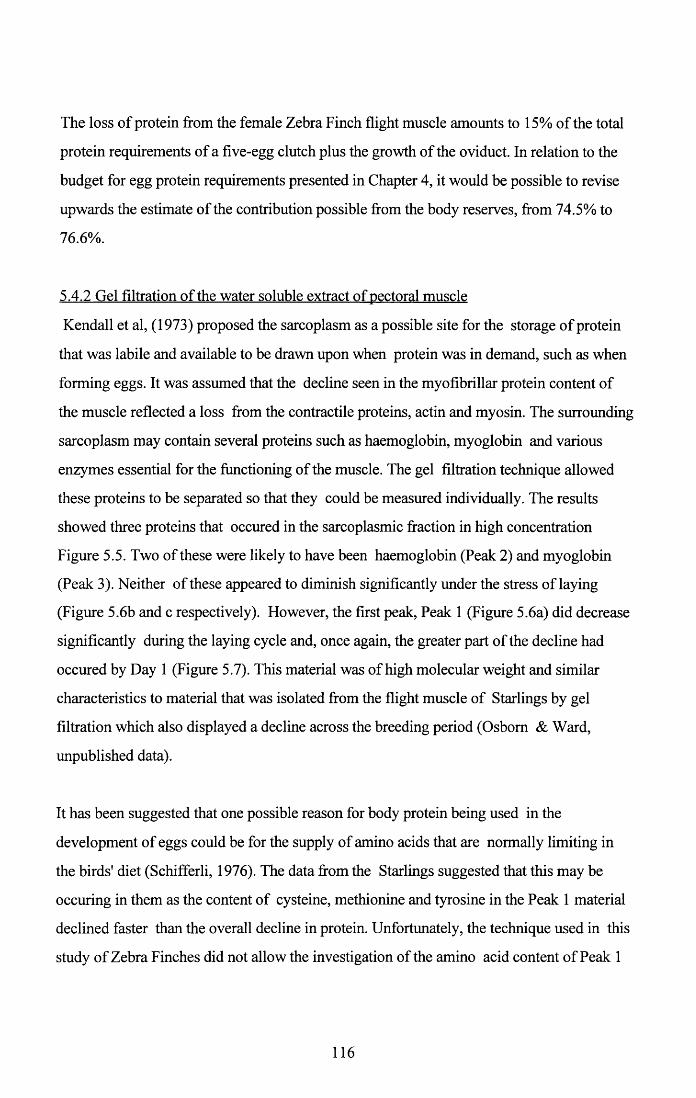
The loss of protein from the female Zebra Finch flight muscle amounts to 15% of the total
protein requirements of a five-egg clutch plus the growth of the oviduct. In relation to the
budget for egg protein requirements presented in Chapter 4, it would be possible to revise
upwards the estimate of the contribution possible from the body reserves, from 74.5% to
76.6%.
5.4.2 Gel filtration of the water soluble extract of pectoral muscle
Kendall et al, (1973) proposed the sarcoplasm as a possible site for the storage of protein
that was labile and available to be drawn upon when protein was in demand, such as when
forming eggs. It was assumed that the decline seen in the myofibrillar protein content of
the muscle reflected a loss from the contractile proteins, actin and myosin. The surrounding
sarcoplasm may contain several proteins such as haemoglobin, myoglobin and various
enzymes essential for the functioning of the muscle. The gel filtration technique allowed
these proteins to be separated so that they could be measured individually. The results
showed three proteins that occured in the sarcoplasmic fraction in high concentration
Figure 5.5. Two of these were likely to have been haemoglobin (Peak 2) and myoglobin
(Peak 3). Neither of these appeared to diminish significantly under the stress of laying
(Figure 5.6b and c respectively). However, the first peak, Peak 1 (Figure 5.6a) did decrease
significantly during the laying cycle and, once again, the greater part of the decline had
occured by Day 1 (Figure 5.7). This material was of high molecular weight and similar
characteristics to material that was isolated from the flight muscle of Starlings by gel
filtration which also displayed a decline across the breeding period (Osborn & Ward,
unpublished data).
It has been suggested that one possible reason for body protein being used in the
development of eggs could be for the supply of amino acids that are normally limiting in
the birds' diet (Schifferli, 1976). The data from the Starlings suggested that this may be
occuring in them as the content of cysteine, methionine and tyrosine in the Peak 1 material
declined faster than the overall decline in protein. Unfortunately, the technique used in this
study of Zebra Finches did not allow the investigation of the amino acid content of Peak 1
116
material because not enough of it was recovered for the analysis to be successful. More
work is therefore necessary to further characterise this material.
5.4.3 Conclusion
The results of the biochemical analysis of pectoral flight muscle suggest that the loss of
lean dry weight during the laying cycle is due to a loss of protein. If this protein was
available to the eggs then it could potentially supply up to 15% of the protein content of a
five-egg clutch and the development of the oviduct.
Both the myofibrillar and sarcoplasmic fractions of the flight muscle lose protein. Further
analysis of the sarcoplasmic fraction revealed one particular protein that declined while the
others did not.
This trend is likely to be followed by the other muscles as it was found that leg muscle also
declined in weight at the same time as pectoral muscles (Figure 4.4). The total decline of
body lean dry weight will be due mainly to the skeletal muscles and as shown above this
loss is probably protein.
What then was the fate of the protein being lost from the muscles? It is known that muscle
is not a static tissue. The turnover of protein in human skeletal muscle has been measured
at 12% per day (Spargo et al, 1979). The concept of protein being transferred from one
muscle to another has also been discussed. In studies of geese during their moult it was
suggested that the decline in the protein content of the flight muscles during the flightless
period allowed hypertrophy of the leg muscles. These displayed a corresponding increase
in weight (Ankney, 1984). The possibility exists, therefore, that protein from the skeletal
muscles in the breeding female Zebra Finches was being transfered directly to developing
eggs. The purpose of the following chapter was to demonstrate if such a process was
occuring.
117
CHAPTER 6 - THE TRANSFER OF ISOTOPE LABELLED MATERIAL FROM
BODY TISSUE TO THE DEVELOPING EGGS OF BREEDING
FEMALE ZEBRA FINCHES
6.1 INTRODUCTION
In the preceding chapters it has been shown that when female Zebra Finches produce a
clutch of eggs there is a decline in their lipid and protein condition. One possible
explanation for this may be the direct transfer of nutrients from the body tissues to the
developing eggs. This would be instead of, or in addition to, nutrients derived from the food
intake.
This use of endogenous nutrients has been suggested before (eg Jones and Ward, 1976,
Ankney and Machines, 1978, Jones, G., 1987, Jones, M.M.,1991). In Chapter 4 it was
shown that in female Zebra Finches, body reserves of protein could play a major role in
supplying the developing eggs providing up to 74.5% of the protein required for a five-egg
clutch including that required for the growth of the oviduct.
There is not, however, any evidence that this direct transfer actually occurs. The purpose of
this chapter was to investigate the use of radioisotopes to demonstrate the transference of
proteins from the tissue of female Zebra Finches to the developing eggs.
35 35The amino acid methionine containing the sulphur isotope Sulphur ( S) was used. This
isotope is relatively safe to handle and has a 87.4 day half life which is long enough to
make it suitable. The amino acid Cysteine also contains sulphur but was not considered
suitable for this purpose because on oxidation the sulphur atom is lost (Stryer, 1981). This
does not occur in methionine and, therefore, more of the isotope was likely to be
incorporated into proteins in the bird. Also, cysteine can be synthesised from methionine,
but not vice versa. As mentioned in Chapter 3, cysteine and methionine may be among the
amino acids limiting in the diet of the Zebra Finch. It may, therefore, be expected to be
involved in transferance from tissues to the eggs.
118
In this way it was hoped that labelled amino acid ingested by a female Zebra Finch some
days before the start of breeding would be incorporated into proteins in its own tissue. Once
breeding was initiated and the birds were on an unlabelled diet, any isotope that could
subsequently be detected in eggs laid would provide evidence that direct transfer from
tissues to the eggs does occur.
119
6.2 MATERIALS AND METHODS
Each bird was given a total 2 microcuries (pCi) dose comprising five daily doses of 0.4 pCi35 Sulphur-methionine. The required amount of labelled amino acid was diluted in 0.05ml of
distilled water and this was introduced directly into the birds' stomach via a narrow bore
silicon tube fitted to a syringe. All birds were killed with C 02 eleven days after the final
dose.
6.2.1 Dissection and analysis of tissue
The dissection of the bird and the analysis of the tissue was carried out as swiftly as
possible. The external measurements were recorded (see Chapter 4) then the left pectoral
muscles were removed. The right pectoral muscles were retained frozen and the sternum
and stemum-coracoid lengths were recorded. Other tissues for analysis were removed
where appropriate (see below). The ovary was exposed and the diameter of enlarged
follicles and the presence of post-ovulatory follicles in the ovary were recorded to allow the
allocation of the bird to the correct day in the reproductive cycle. The ovary and oviduct
were then removed for analysis.
The tissues were weighed in glass vials and distilled water added in the ratio of 1ml to lg
wet weight of tissue. The larger tissues, such as muscle, were homogenised by Ultra-turax
for 10 seconds, whilst the smaller tissues, such as ovary, needed only to be chopped
coarsely with scissors or a scalpel. Amersham NCS tissue solubiliser was then added, the
volume being six times that of the tissue/water homogenate. The samples were incubated at
50°C until the solution became clear, which usually took about eight hours. The pH was
reduced to pH6-7 with glacial acetic acid added dropwise. 1ml aliquots were then taken for
analysis. For most samples the dilutions involved led to each aliquot containing 0.05g wet
weight of tissue. Some samples, however, weighed less than 0.05g (eg the undeveloped
ovaries). In such cases the technique was modified by dissolving the whole tissue in 1ml of
tissue solubiliser (the minimum amount required to be effective). This meant that duplicates
were not available. All results are corrected as for 0.05g wet weight of tissue.
120
Each 1ml aliquot was put into a plastic scintillation vial and 9ml of Amersham OCS
scintillation fluid added. The vials were shaken and then kept in the dark overnight to allow
the effects of chemiluminescence to abate. All samples were then counted on a Phillips
PU4700 liquid scintillation counter for ten minutes.
Analysis of eggs differed slightly from the procedure for other tissues. In the first
experiment the whole egg contents were analysed. Each egg was cracked into a glass vial
and 5ml of tissue solubiliser was added in which the eggs readily dissolved at room
temperature. The clear solution was neutralised to pH6-7 with glacial acetic acid and 1ml
aliquots taken. 9ml of scintillation fluid was added and the samples were then counted as
described above.
In the second experiment eggs were separated into yolk and albumen. A small hole was
pierced in the air space at the top of the egg and then it was placed in an oven at 100°C for
an hour. Once the contents had hardened the yolk was separated from the surrounding
albumen. 3ml of tissue solubiliser was added to the samples and kept at room temperature
until the solution was clear. Glacial acetic acid was used to neutralise to pH6-7 and then
lml aliquots were taken for analysis as described above.
6.2.2 Conversion of counts per minute fCPMf to disintegrations per minute fDPlVfi
In order to compare the different samples it was necessary to convert the counts per minute
(CPM) value, measured by the scintillation counter, to disintegrations per minute (DPM). A
major disadvantage of scintillation counting is that of quenching, where chemical
interference with the scintillant can result in a depression of the scintillation reading. Each
sample may be affected to a different degree. This makes it necessary to determine the
counting efficiency of the samples at various levels of quenching. Standardisation of my
samples was achieved by the Channels Ratio technique which is less time consuming than
other methods but is suited to even high levels of quenching. As the level of chemical
quenching increases in the sample the effect on the scintillant is to alter the amplitude of the
energy content of the light pulses, and if readings are taken at two energy levels the effect
of increased quenching is to shift the spectrum towards the lower channel. The ratio of
121
counts over two channels can therefore be used to determine the level of quenching from
the construction of a calibration curve.
A standard was prepared using 14Carbon of a known activity, 1900 disintegrations per
minute per ml (DPM/ml). 1ml of standard was added to 9ml of scintillation fluid, as used
throughout the experiments. This was counted for 10 minutes in the scintillation counter
and counts per minute (CPM) and the channels ratio (CR) values recorded. Using
chloroform as a quenching agent I added 50 pi increments to the standard, giving values of
CPM and CR for each from Opl to 200ml and then lOOpl increments from lOOpl to 1200p.
By comparing the CPM recorded at each increment with the known activity of 1900 DPM,
a percentage efficiency for each was calculated. Plotting the channels ratio against the
percentage efficiency gave a quench curve, the regression equation of which could be used
to convert CPM to DPM (Figure 6.1)
Regression equation; y = 89.396 - 87.089x, R2]5= 0.995 Equation 6.1
x = channels ratio, y = % Efficiency = (CPM/DPM x 100)
This gives the equation;
DPM = CPM + (0.894 - 0.871 CR) Equation 6.2
6.2.3 Comparison of breeding and non-breeding females
The intention of this experiment was firstly to determine whether there were differences in
the amount of labelled material present in body tissues between females that had laid a
clutch of eggs and a control group who had not. Secondly, did the eggs that were laid
contain detectable levels of isotope?
Twenty-eight females were dosed with isotope as described above. Fourteen were
introduced to males and allowed to breed. The nest boxes were inspected regularly and
whenever an egg was found it was removed, marked with pencil and replaced with a plaster
dummy. The remaining fourteen females were kept in similar conditions but were not
122
allowed to breed. All birds were taken on the eleventh day after the final dose. The birds
were dissected as described and the pectoral muscle, liver, ovary and oviduct plus whole
eggs were analysed.
6.2.4 Isotope uptake and decline in non-breeding females
The aims of this experiment were to determine how much of the total 2pCi dose of isotope
was incorporated into the tissue by the day after the last dose of 0.4pCi and, secondly, to
determine the rate of loss of labelled material from the tissue of non-breeding birds during
the subsequent eleven days of the experiment.
Twenty-three females had isotope administered. Three were taken on the day after the last
dose, three on the fourth day after and three on the eighth day. The results from the 14 non
breeding females in the first experiment were used for the eleventh day values.
The tissues analysed were pectoral muscle, leg muscle (as described in Chapter 4), ovary
and oviduct. The leg muscle was analysed to allow a comparison of two different muscles
to see if differences in muscle metabolic rates were reflected in the amount of labelled
material lost or incorporated. Liver was not analysed as logistical constraints meant that
four tissue types were the maximum that could be analysed in each experiment.
6.2.5 Distribution of isotope in the eggs
The aim of this experiment was to determine where in the egg labelled material was being
deposited, the yolk or the albumen. Ten females were given the 2pCi dose and then
introduced to a mate and allowed to produce a clutch of eggs. The nest boxes were
monitored for eggs and those found were removed, marked with pencil and replaced with a
plaster dummy. The yolk and albumen were separated and analysed separately.
123
6.3 RESULTS
For the sake of clarity the results are presented in an order slightly different from the order
in which the experiments were actually done. First, I shall consider the uptake and decline
of isotope in non-breeding females, secondly, the differences between non-breeding and
breeding females. Finally, the results from analysis of the eggs are presented. All means are
given with standard deviation.
6.3.1 Incorporation of isotope in the tissue
Three birds were taken on the day after the last dose of isotope was given. The total dose
was 2pCi. By considering the mean level of isotope in the four tissues analysed it was
possible to estimate roughly how much of the total dose had been incorporated. The isotope
was contained in methionine and as such it was targeted at incorporation into proteins. I
therefore used the mean wet body weight minus the main non-protein components (ash and
fat) from the results in Chapter 4 for this estimation.
Calculation:
Mean DPM/0.05g for Pectoral muscle,
leg muscle, ovary and oviduct = 2612±531
Mean (n=109) lean/ash free body weight of female = 13.4 ± 1.4g
DPM/g = 20 x 2612 = 52240,
Therefore, DPM/female = 13.4 x 52240 = 700016 DPM (divide by 60)
= 11667 DPSecond
1 DPsecond = 1 Bequerel (Bq), therefore =11.667 kBq per bird
lpCi = 37kBq, therefore, 11.667/37 = 0.32 pCi
Percentage of total dose incorporated in bird = 0.32/2 x 100 = 16%
124
Therefore, an estimated 16% of the isotope administered became incorporated in tissue one
day after the final dose. This amount of incorporation gave easily measurable levels of
labelled material in the tissue. Control samples of tissues from non-dosed birds gave a mean
background reading of 22.4 ± 2.9 DPM/0.05g wet tissue (n=16).
6.3.2 Decline of isotope in tissue with time
All four tissues analysed displayed a decline in the level of isotope present over the 11 day
period after the isotope had been administered. All figures show only the mean and
standard deviation for each day but regression statistics were calculated from all data points.
Figure 6.2 shows a significant decline (r21 = - 0.986, p < 0.0001) in isotope level in pectoral
muscle. The amount lost was 62.1% of the total present immediately after dosing.
Activity in the leg muscle one day after, four days after and eight days after the final dose is
shown in Figure 6.3 (r7 = -0.940, p < 0.05). Whereas pectoral muscle had lost 1031
DPM/0.05g (34.9%) by the eighth day, leg muscle had lost significantly less, 514
DPM/0.05g (18.2%), t4 = 2.875, p < 0.05. The amount of isotope in the two muscle types
was, initially, similar (t4 = 0.792, p > 0.05). The implication of this result is that labelled
material was being lost from the pectoral muscle more rapidly than from the leg muscle.
The oviduct (Figure 6.4) contained much less labelled material immediately after dosing
than the muscles (1836 ±155 DPM/0.05g)(t4 = 7.844, p < 0.001). The proportion of
labelled material lost over the 11 days (61.0%) was similar to that lost from the pectoral
muscles (62.1%), r2i= -0.993, p < 0.0001.
The ovary (Figure 6.5) contained similar levels of labelled material to the muscles at the
start of the experiment (t4 = 0.142, p >0.05) but the percentage lost up to the eleventh day
was much higher, at 82.5% (r21= -0.938, p < 0.0001), than for any of the other tissues.
The loss of labelled material from tissue would be expected because of two factors. Firstly,
the isotope decays radioactively and, secondly, normal protein turnover in tissues would
lead to some loss. In order to estimate the relative importance of isotope decay I used the
125
35 S decay tables (Amersham, 1990) to calculate the expected loss of activity by this means
during the experiment. Using values for pectoral muscle as an example;
Total loss of activity = 2956 - 1120 = 1836 DPM/0.05g
Ten days of radioactive decay would result in activity of;
*0.924 x 2956 = 2731 DPM/0.05g35(* From Amersham decay tables for sulphur)
Therefore the loss due to decay is;
2956 - 2731 = 225 DPM/0.05g
This value is only 12.2% of the total loss. Therefore, the majority of the loss of labelled
material from tissue is probably due to factors other than isotope decay.
6.3.3 Comparison of non-breeding and breeding females
Table 6.1 presents isotope levels in the four tissues analysed; pectoral muscle, liver, oviduct
and ovary. There was a significant difference between the two groups in pectoral muscle35and oviduct but not in ovary or liver. There was, therefore, a greater loss of S methionine
from muscle and oviduct tissue of breeding birds than from the tissues of non-breeders.
6.3.4 Occurrence of isotope in the eggs
In the first experiment whole egg contents were analysed. Fourteen females were
introduced to males and six pairs produced a five-egg clutch and eight pairs laid six-egg
clutches. As the amount of isotope in the female was declining daily (see above) it was
necessary to correct for this when considering the eggs in their laying sequence. The first
egg laid had a larger quantity of isotope available to it than the next egg and so on through
the clutch. Taking into account the four tissues in which decline was measured, I corrected
for a decline in availability of isotope of 5.6% per day (the mean decline of the four tissues
over ten days was 56%). It was also assumed that there was no decline in egg size through
the clutch, as was the case in the clutches analysed in Chapter 2.
126
The results showed that there were measurable quantities of isotope present in all the eggs.
In addition, there was a significant decline in the level of isotope in subsequent eggs as the
clutch advanced (in both clutch sizes); five egg (Figure 6.6) r28 = -0.991, p <0.0001 and six
egg (Figure 6.7) r46= -0.971, p <0.0001.
In the second series of eggs isotope levels were analysed in the yolk and the albumen. Of
the ten pairs introduced only six produced a clutch and all of these were five-egg clutches.
As with the eggs above there was an overall decline in isotope content from the beginning
of the clutch to the end. Figure 6.8 shows the percentage of isotope for each egg found in
the yolk and the albumen. This shows that while the proportion of isotope found in the yolk
declines through the clutch (r28= -0.861, p < 0.0001), the albumen, however, has an
increasing proportion as the clutch advances (r28= 0.861, p < 0.0001).
Therefore, material containing the isotope (ie that which is sourced from the body reserves
and not from the diet) is more important in the yolk at the beginning of the clutch and in the
albumen at the end of the clutch.
127
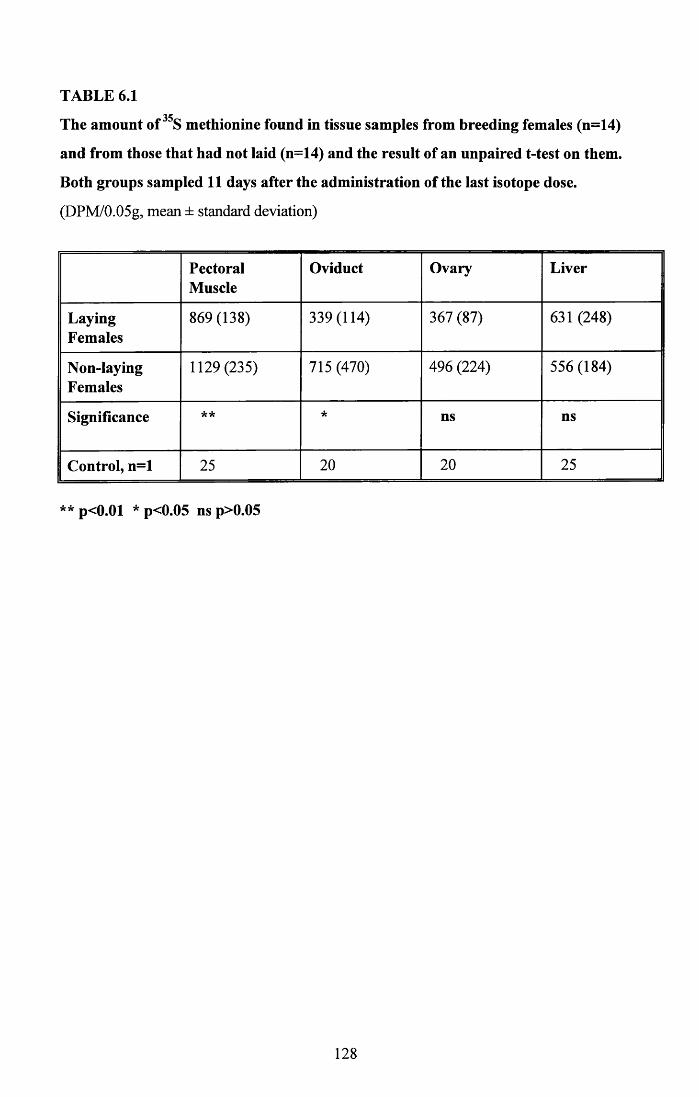
TABLE 6.135The amount of S methionine found in tissue samples from breeding females (n=14)
and from those that had not laid (n=14) and the result of an unpaired t-test on them.
Both groups sampled 11 days after the administration of the last isotope dose.
(DPM/0.05g, mean ± standard deviation)
PectoralMuscle
Oviduct Ovary Liver
LayingFemales
869(138) 339 (114) 367 (87) 631(248)
Non-layingFemales
1129(235) 715 (470) 496 (224) 556(184)
Significance ** * ns ns
Control, n=l 25 20 20 25
** p<0.01 * p<0.05 ns p>0.05
128
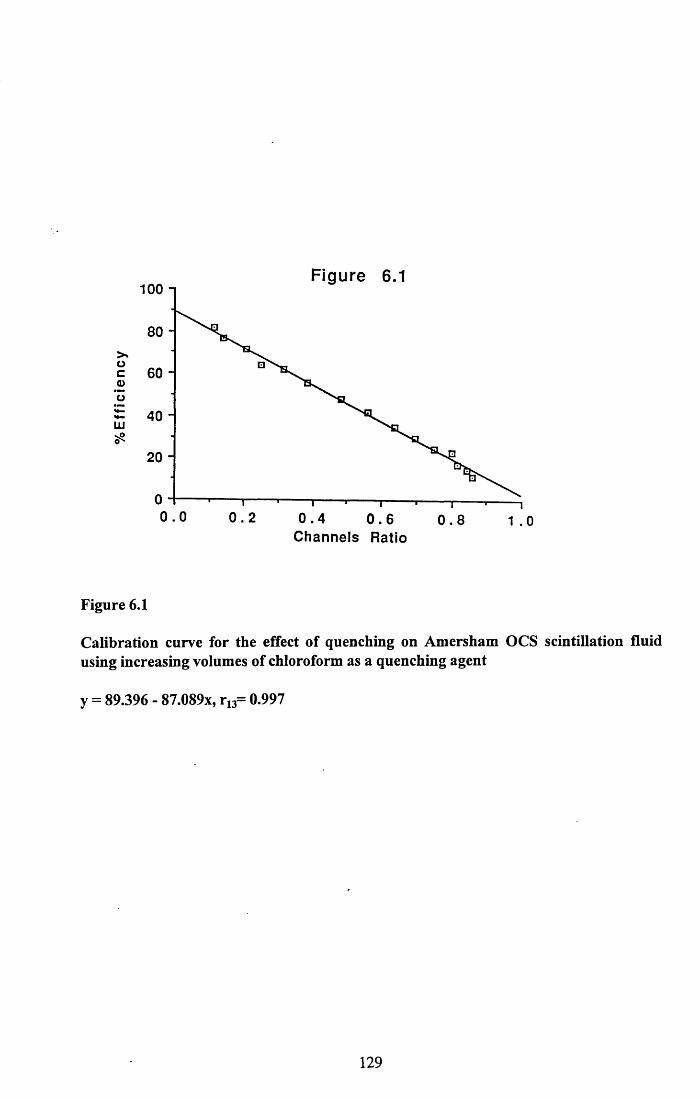
100 nFigure 6.1
80 ->*ocoo
60 -
S= 40 -LUvO
20 -
0 . 0 0 . 2 0 .4 0 . 6 0 . 8 1 . 0C h a n n e l s Rat io
Figure 6.1
Calibration curve for the effect of quenching on Amersham OCS scintillation fluid using increasing volumes of chloroform as a quenching agent
y = 89.396 - 87.089x, r13= 0.997
129
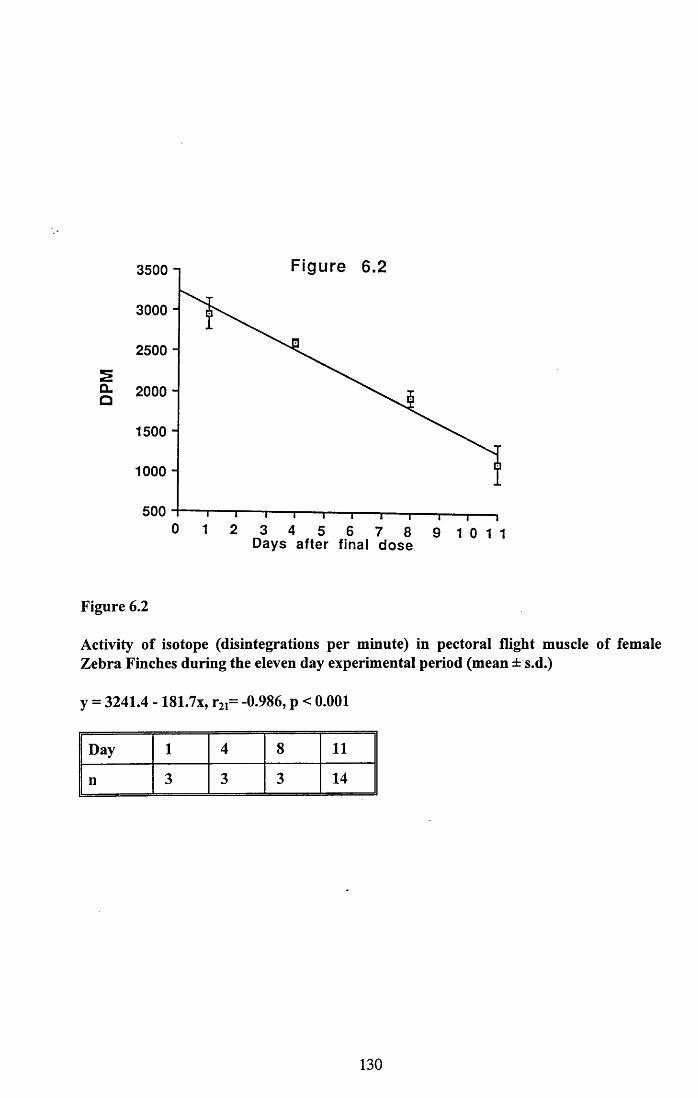
Figure 6.23500 n
3000 -
2500 -
2Q.Q 2000 -
1500 "
1000 -
5000 1 2 3 4 5 6 7 8
D a y s after final d o s e9 1 0 11
Figure 6.2
Activity of isotope (disintegrations per minute) in pectoral flight muscle of female Zebra Finches during the eleven day experimental period (mean ± s.d.)
y = 3241.4 - 181.7x, r21= -0.986, p < 0.001
Day 1 4 8 11
n 3 3 3 14
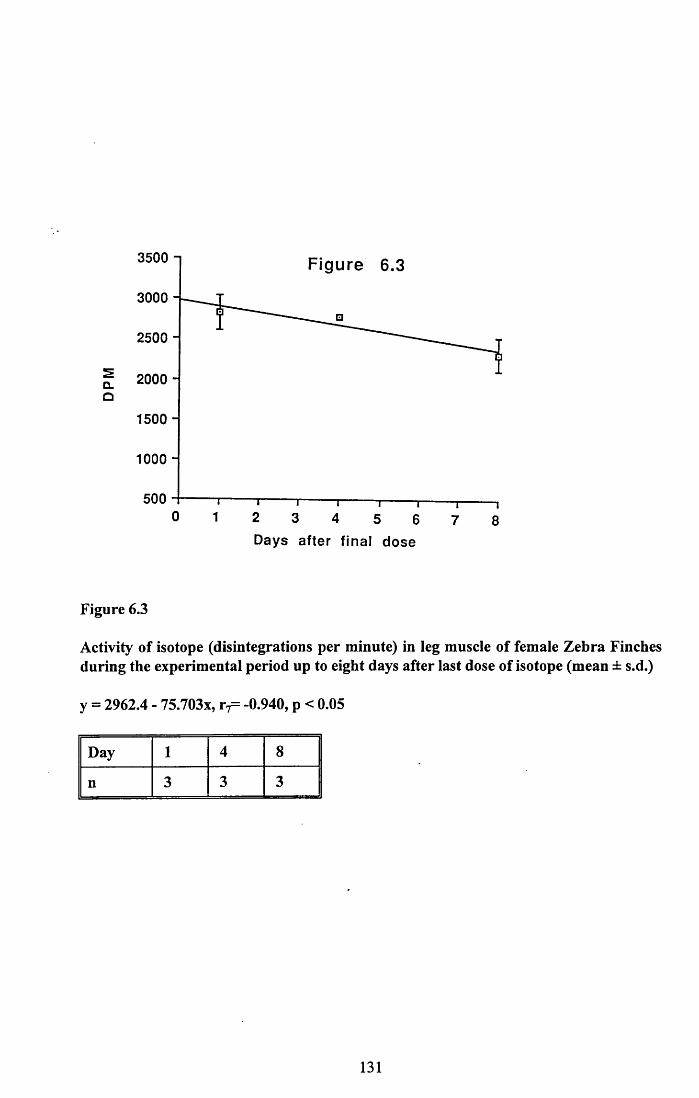
3500 n Figure 6.3
3000 “
2500 -
2 2000 -CLo
1500 -
1000 -
500 i i i i------- 1-------1-------1------- 10 1 2 3 4 5 6 7 8
D a y s after final d o s e
Figure 6.3
Activity of isotope (disintegrations per minute) in leg muscle of female Zebra Finches during the experimental period up to eight days after last dose of isotope (mean ± s.d.)
y = 2962.4 - 75.703x, rf= -0.940, p < 0.05
Day 1 4 8
n 3 3 3
131
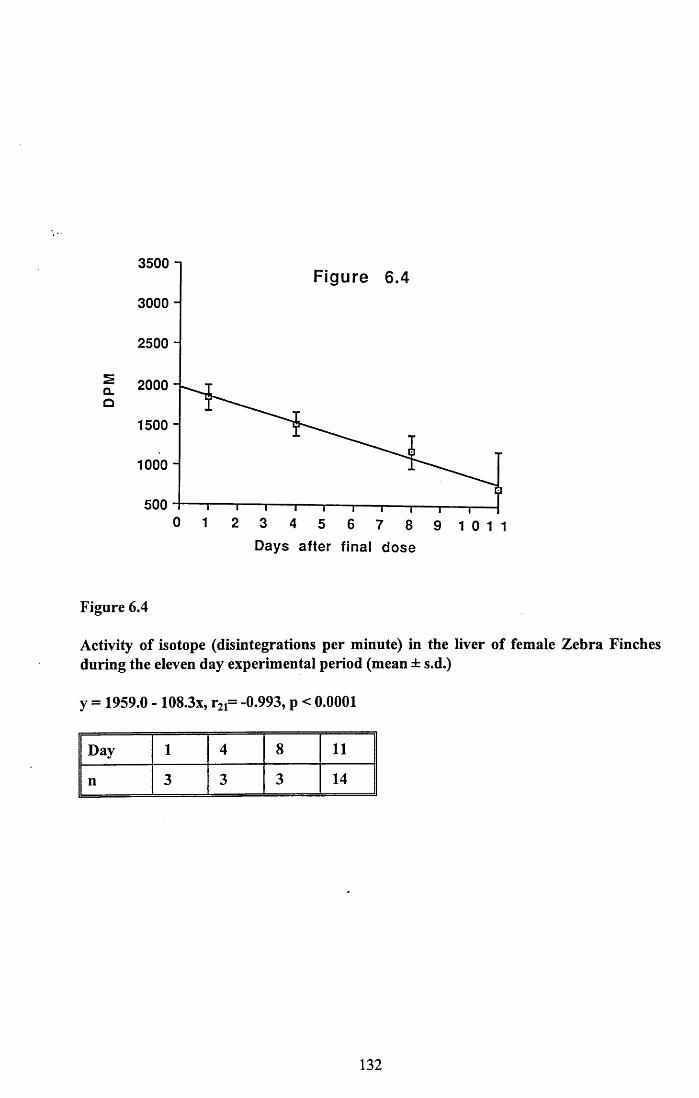
3 5 0 0 -iFigure 6.4
3 0 0 0 -
2 5 0 0 -
2 2000 -Q_Q
1 5 0 0 "
1000 -
5 0 0
0 1 2 3 4 5 6 7 8 9 1 0 1 1
D a y s after final d o s e
Figure 6.4
Activity of isotope (disintegrations per minute) in the liver of female Zebra Finches during the eleven day experimental period (mean ± s.d.)
y = 1959.0 - 108.3x, r21= -0.993, p < 0.0001
Day 1 4 8 11
n 3 3 3 14
132
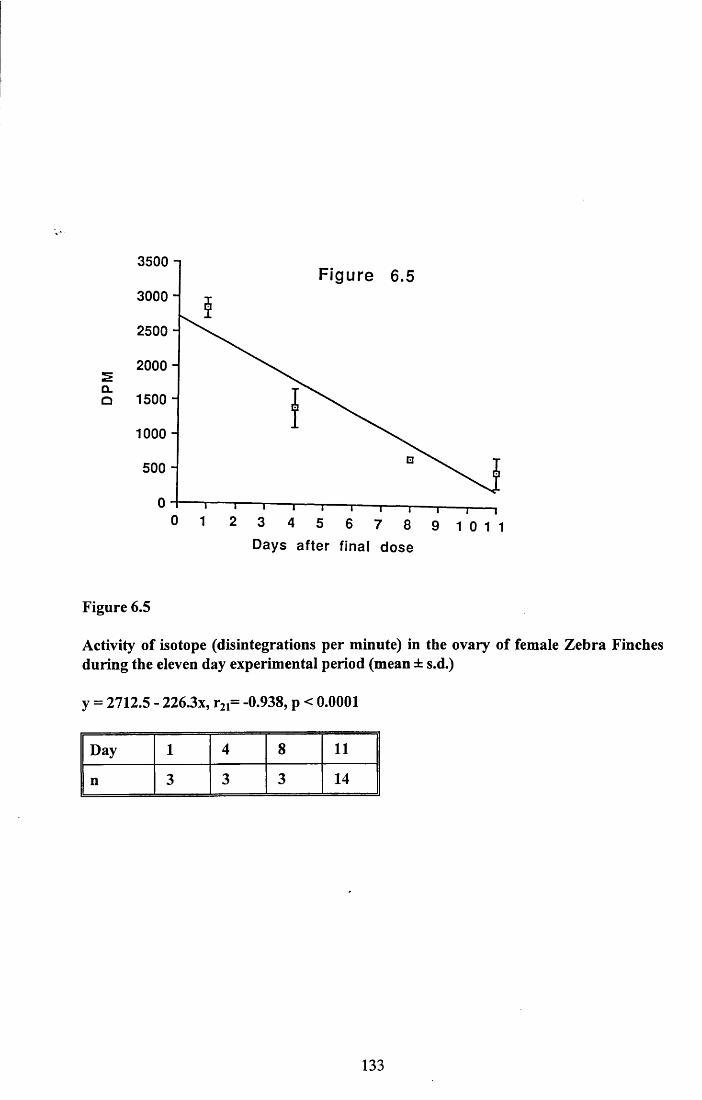
3500 nFigure 6.5
3000 -
2500 -
2000 -
Q_Q 1500 "
1000 -
500 -
D a y s after final d o s e
Figure 6.5
Activity of isotope (disintegrations per minute) in the ovary of female Zebra Finches during the eleven day experimental period (mean ± s.d.)
y = 2712.5 - 226.3x, r21= -0.938, p < 0.0001
Day 1 4 8 11
n 3 3 3 14
133
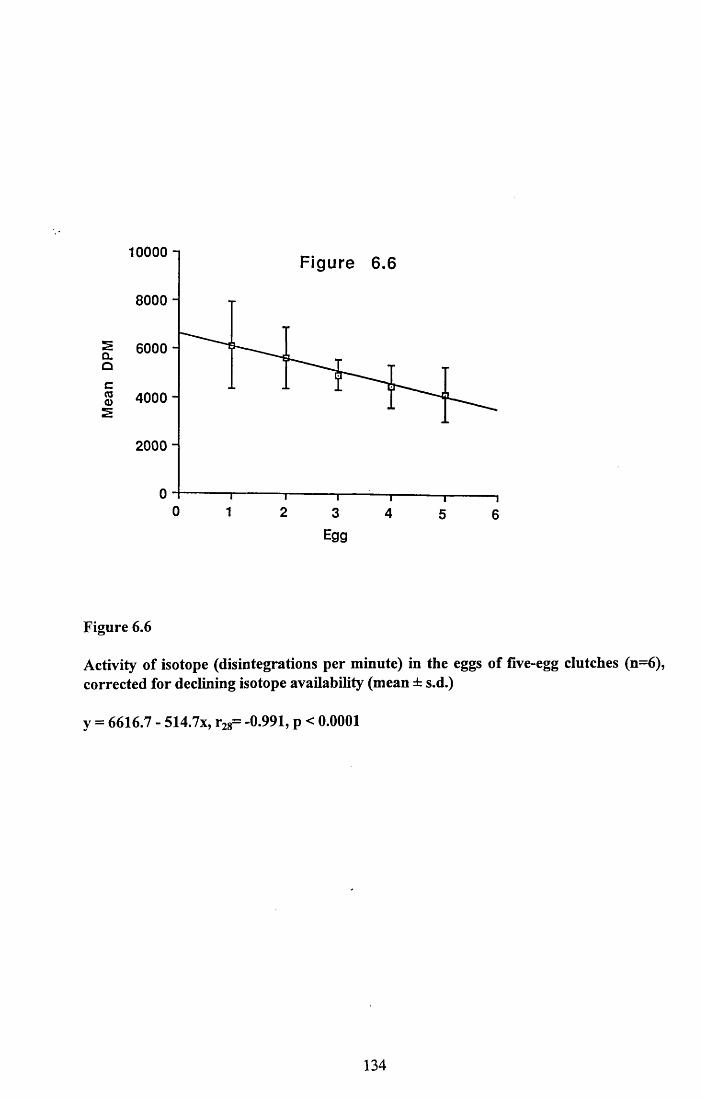
10000 -IFigure 6.6
8000 -
2Q.Q6000 -
cCOo2
4000 -
2000 -
0 H i “i i i-------------- 1--------------1
0 1 2 3 4 5 6Egg
Figure 6.6
Activity of isotope (disintegrations per minute) in the eggs of five-egg clutches (n=6), corrected for declining isotope availability (mean ± s.d.)
y = 6616.7 - 514.7x, r28= -0.991, p < 0.0001
134
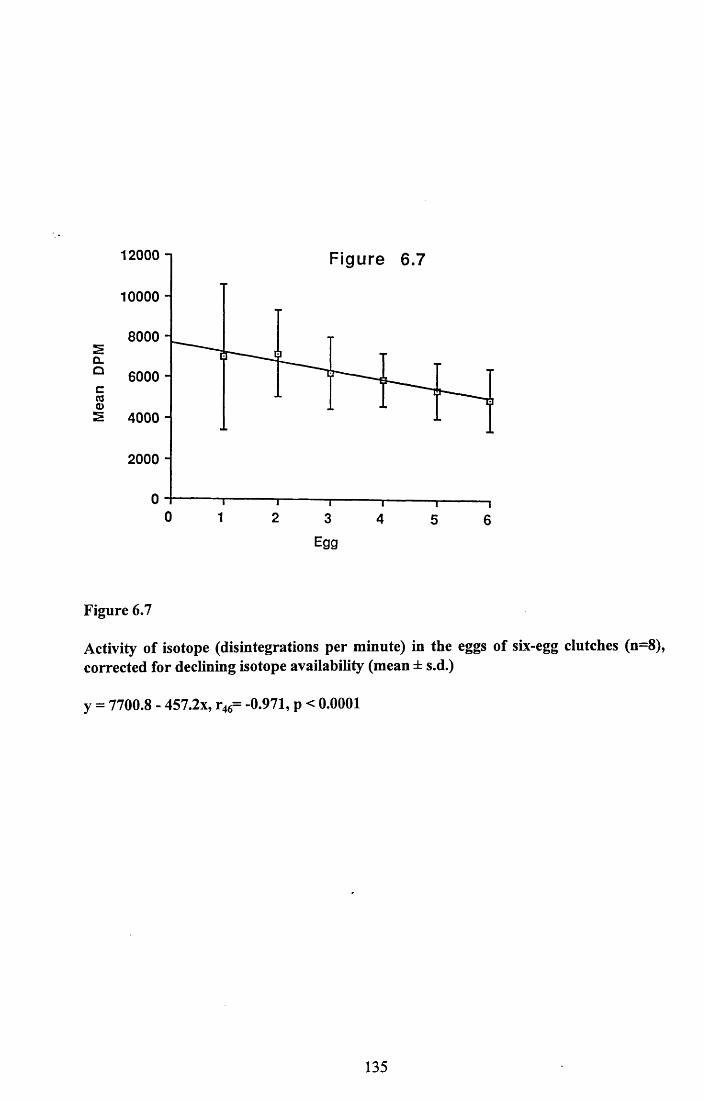
12000 n Figure 6.7
10000 -
8000 -2CLQ 6000 -cOSos 4000 ~
2000 "
0 1 2 3 4 5 6Egg
Figure 6.7
Activity of isotope (disintegrations per minute) in the eggs of six-egg clutches (n=8), corrected for declining isotope availability (mean ± s.d.)
y = 7700.8 - 457.2x, r46= -0.971, p < 0.0001
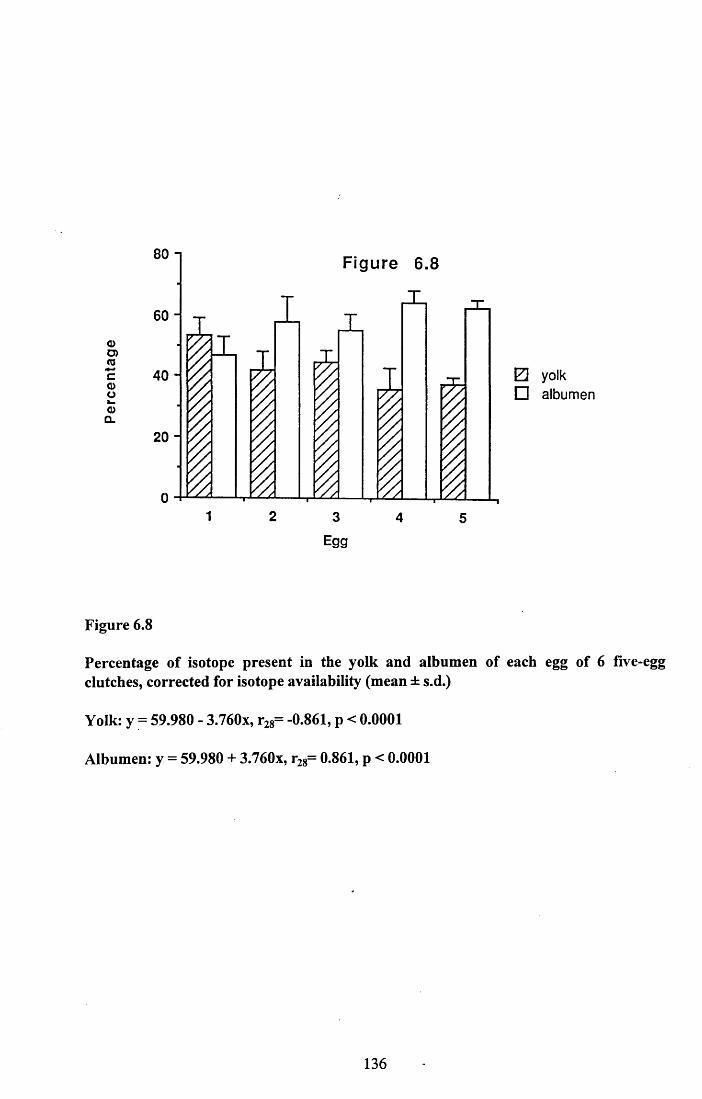
<DO)(0cook_o
CL
Figure 6.8
60 -
40 -
20 -
1 2 3 4 5
E3 yolk □ album en
Egg
Figure 6.8
Percentage of isotope present in the yolk and albumen of each egg of 6 five-egg clutches, corrected for isotope availability (mean ± s.d.)
Yolk: y = 59.980 - 3.760x, r28= -0.861, p < 0.0001
Albumen: y = 59.980 + 3.760x, r28= 0.861, p < 0.0001
136
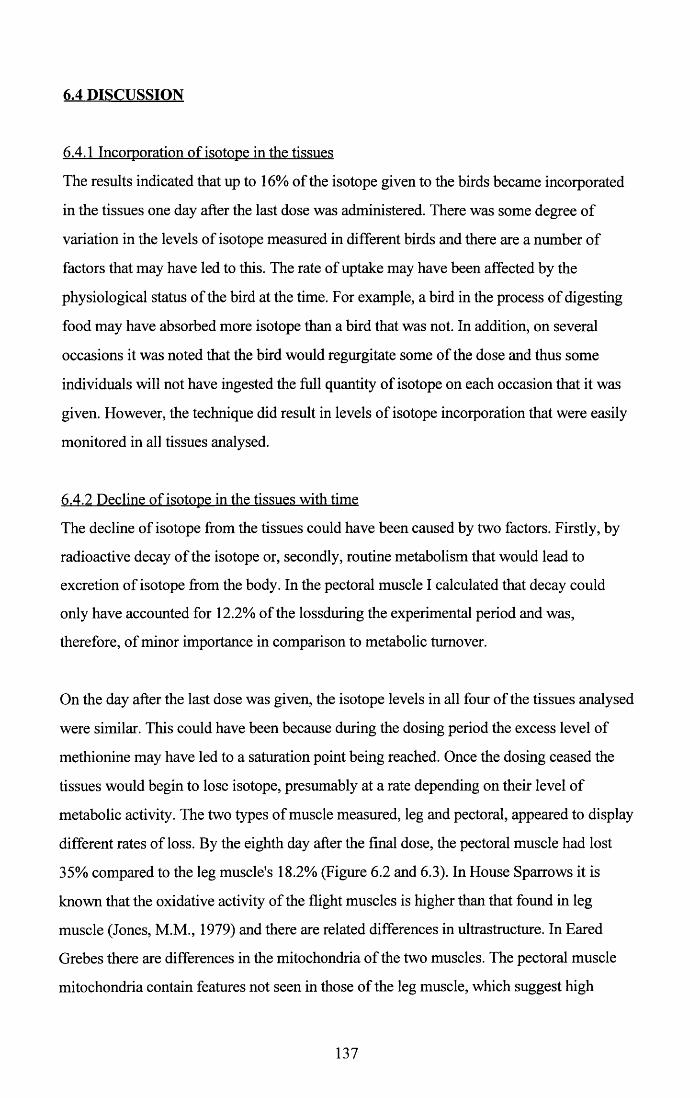
6.4 DISCUSSION
6.4.1 Incorporation of isotope in the tissues
The results indicated that up to 16% of the isotope given to the birds became incorporated
in the tissues one day after the last dose was administered. There was some degree of
variation in the levels of isotope measured in different birds and there are a number of
factors that may have led to this. The rate of uptake may have been affected by the
physiological status of the bird at the time. For example, a bird in the process of digesting
food may have absorbed more isotope than a bird that was not. In addition, on several
occasions it was noted that the bird would regurgitate some of the dose and thus some
individuals will not have ingested the full quantity of isotope on each occasion that it was
given. However, the technique did result in levels of isotope incorporation that were easily
monitored in all tissues analysed.
6.4.2 Decline of isotope in the tissues with time
The decline of isotope from the tissues could have been caused by two factors. Firstly, by
radioactive decay of the isotope or, secondly, routine metabolism that would lead to
excretion of isotope from the body. In the pectoral muscle I calculated that decay could
only have accounted for 12.2% of the lossduring the experimental period and was,
therefore, of minor importance in comparison to metabolic turnover.
On the day after the last dose was given, the isotope levels in all four of the tissues analysed
were similar. This could have been because during the dosing period the excess level of
methionine may have led to a saturation point being reached. Once the dosing ceased the
tissues would begin to lose isotope, presumably at a rate depending on their level of
metabolic activity. The two types of muscle measured, leg and pectoral, appeared to display
different rates of loss. By the eighth day after the final dose, the pectoral muscle had lost
35% compared to the leg muscle's 18.2% (Figure 6.2 and 6.3). In House Sparrows it is
known that the oxidative activity of the flight muscles is higher than that found in leg
muscle (Jones, M.M., 1979) and there are related differences in ultrastructure. In Eared
Grebes there are differences in the mitochondria of the two muscles. The pectoral muscle
mitochondria contain features not seen in those of the leg muscle, which suggest high
137
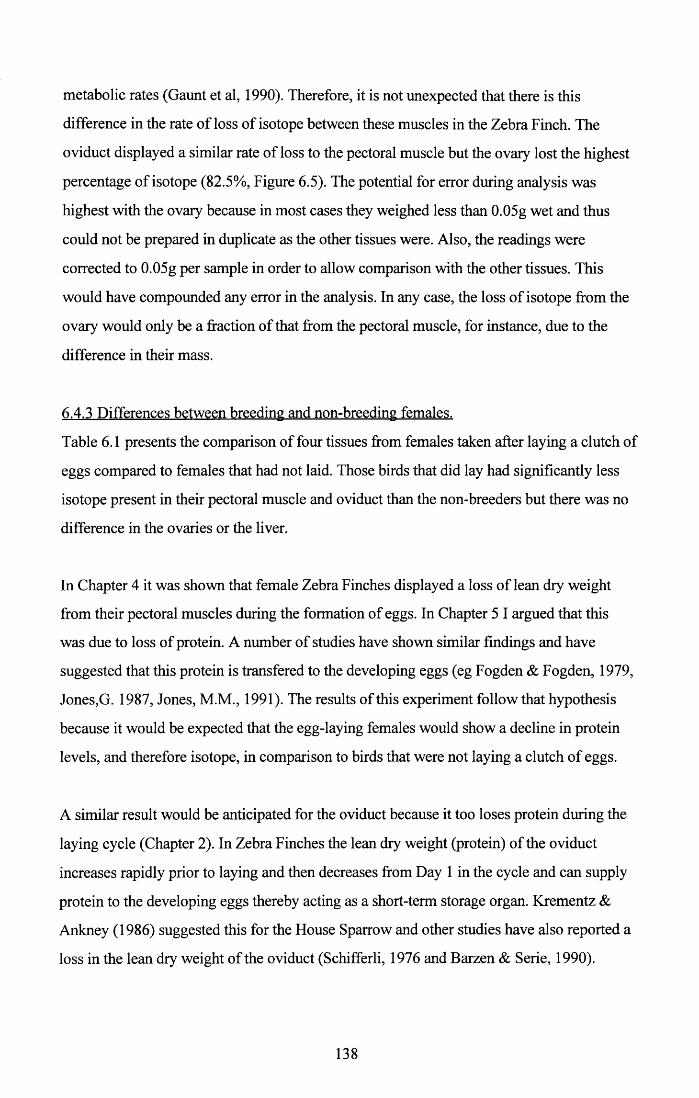
metabolic rates (Gaunt et al, 1990). Therefore, it is not unexpected that there is this
difference in the rate of loss of isotope between these muscles in the Zebra Finch. The
oviduct displayed a similar rate of loss to the pectoral muscle but the ovary lost the highest
percentage of isotope (82.5%, Figure 6.5). The potential for error during analysis was
highest with the ovary because in most cases they weighed less than 0.05g wet and thus
could not be prepared in duplicate as the other tissues were. Also, the readings were
corrected to 0.05g per sample in order to allow comparison with the other tissues. This
would have compounded any error in the analysis. In any case, the loss of isotope from the
ovary would only be a fraction of that from the pectoral muscle, for instance, due to the
difference in their mass.
6.4.3 Differences between breeding and non-breeding females.
Table 6.1 presents the comparison of four tissues from females taken after laying a clutch of
eggs compared to females that had not laid. Those birds that did lay had significantly less
isotope present in their pectoral muscle and oviduct than the non-breeders but there was no
difference in the ovaries or the liver.
In Chapter 4 it was shown that female Zebra Finches displayed a loss of lean dry weight
from their pectoral muscles during the formation of eggs. In Chapter 5 I argued that this
was due to loss of protein. A number of studies have shown similar findings and have
suggested that this protein is transfered to the developing eggs (eg Fogden & Fogden, 1979,
Jones,G. 1987, Jones, M.M., 1991). The results of this experiment follow that hypothesis
because it would be expected that the egg-laying females would show a decline in protein
levels, and therefore isotope, in comparison to birds that were not laying a clutch of eggs.
A similar result would be anticipated for the oviduct because it too loses protein during the
laying cycle (Chapter 2). In Zebra Finches the lean dry weight (protein) of the oviduct
increases rapidly prior to laying and then decreases from Day 1 in the cycle and can supply
protein to the developing eggs thereby acting as a short-term storage organ. Krementz &
Ankney (1986) suggested this for the House Sparrow and other studies have also reported a
loss in the lean dry weight of the oviduct (Schifferli, 1976 and Barzen & Serie, 1990).
138
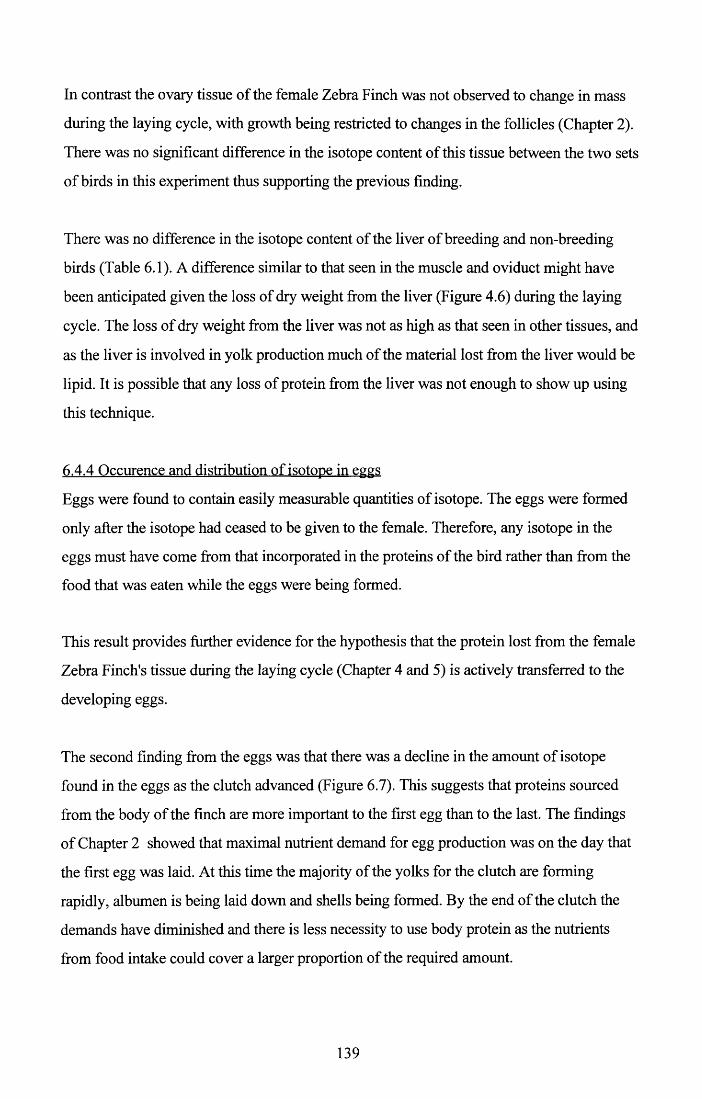
In contrast the ovary tissue of the female Zebra Finch was not observed to change in mass
during the laying cycle, with growth being restricted to changes in the follicles (Chapter 2).
There was no significant difference in the isotope content of this tissue between the two sets
of birds in this experiment thus supporting the previous finding.
There was no difference in the isotope content of the liver of breeding and non-breeding
birds (Table 6.1). A difference similar to that seen in the muscle and oviduct might have
been anticipated given the loss of dry weight from the liver (Figure 4.6) during the laying
cycle. The loss of dry weight from the liver was not as high as that seen in other tissues, and
as the liver is involved in yolk production much of the material lost from the liver would be
lipid. It is possible that any loss of protein from the liver was not enough to show up using
this technique.
6.4.4 Occurence and distribution of isotope in eggs
Eggs were found to contain easily measurable quantities of isotope. The eggs were formed
only after the isotope had ceased to be given to the female. Therefore, any isotope in the
eggs must have come from that incorporated in the proteins of the bird rather than from the
food that was eaten while the eggs were being formed.
This result provides further evidence for the hypothesis that the protein lost from the female
Zebra Finch's tissue during the laying cycle (Chapter 4 and 5) is actively transferred to the
developing eggs.
The second finding from the eggs was that there was a decline in the amount of isotope
found in the eggs as the clutch advanced (Figure 6.7). This suggests that proteins sourced
from the body of the finch are more important to the first egg than to the last. The findings
of Chapter 2 showed that maximal nutrient demand for egg production was on the day that
the first egg was laid. At this time the majority of the yolks for the clutch are forming
rapidly, albumen is being laid down and shells being formed. By the end of the clutch the
demands have diminished and there is less necessity to use body protein as the nutrients
from food intake could cover a larger proportion of the required amount.
139
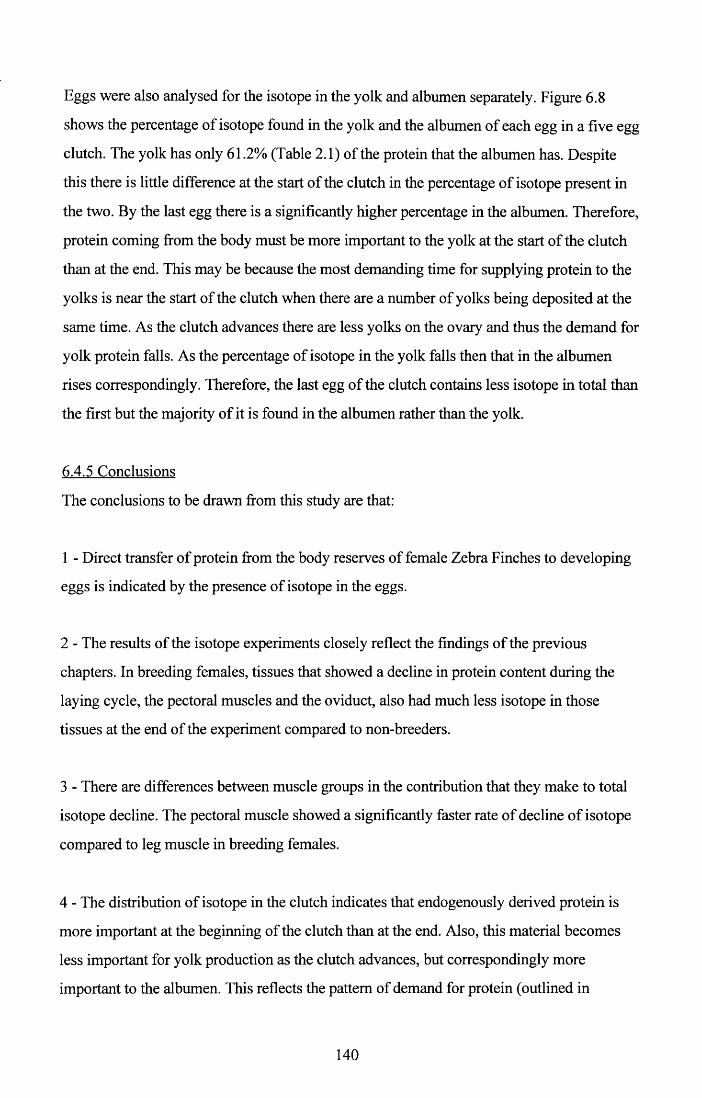
Eggs were also analysed for the isotope in the yolk and albumen separately. Figure 6.8
shows the percentage of isotope found in the yolk and the albumen of each egg in a five egg
clutch. The yolk has only 61.2% (Table 2.1) of the protein that the albumen has. Despite
this there is little difference at the start of the clutch in the percentage of isotope present in
the two. By the last egg there is a significantly higher percentage in the albumen. Therefore,
protein coming from the body must be more important to the yolk at the start of the clutch
than at the end. This may be because the most demanding time for supplying protein to the
yolks is near the start of the clutch when there are a number of yolks being deposited at the
same time. As the clutch advances there are less yolks on the ovary and thus the demand for
yolk protein falls. As the percentage of isotope in the yolk falls then that in the albumen
rises correspondingly. Therefore, the last egg of the clutch contains less isotope in total than
the first but the majority of it is found in the albumen rather than the yolk.
6.4.5 Conclusions
The conclusions to be drawn from this study are that:
1 - Direct transfer of protein from the body reserves of female Zebra Finches to developing
eggs is indicated by the presence of isotope in the eggs.
2 - The results of the isotope experiments closely reflect the findings of the previous
chapters. In breeding females, tissues that showed a decline in protein content during the
laying cycle, the pectoral muscles and the oviduct, also had much less isotope in those
tissues at the end of the experiment compared to non-breeders.
3 - There are differences between muscle groups in the contribution that they make to total
isotope decline. The pectoral muscle showed a significantly faster rate of decline of isotope
compared to leg muscle in breeding females.
4 - The distribution of isotope in the clutch indicates that endogenously derived protein is
more important at the beginning of the clutch than at the end. Also, this material becomes
less important for yolk production as the clutch advances, but correspondingly more
important to the albumen. This reflects the pattern of demand for protein (outlined in
140

Chapter 2) which is maximal on Day 1, the day that the first egg is laid. Similarly, yolk
protein demand is maximal on this day and thus endogenous protein is likely to be of most
importance at this time.
141
CHAPTER 7
GENERAL DISCUSSION
The production of a clutch of eggs is a demanding process for a female Zebra Finch. The
nutrients that are required for the eggs must be found from one, or a combination, of three
routes. They may come from a) the diet or b) from the female's reserves or c) from
changes in activity that free nutrients otherwise used in metabolism for egg production
(Walsberg, 1983). This study was concerned largely with the role of the two former
mechanisms.
It was found that the diet alone was unable to meet all of the requirements for the
production of a five-egg clutch (Chapter 3). This was true for protein in particular. There
was no evidence of hyperphagy in females in the process of forming eggs. One possible
way by which extra nutrients from the diet could be obtained, therefore, was by an increase
in digestive efficiency, as observed in breeding female Zebra Finches by El-Wailly (1966).
Using El-Wailly's figures I calculated that if such an increase occurred it would result in the
liberation of relatively little protein for egg production (Table 3.4). The situation for lipid
was better, as the seeds are largely carbohydrate, but there was still a deficit. Calcium
requirements, however, were probably met largely by dietary intake (see below).
This study was conducted entirely within a laboratory environment which was necessary to
allow reliable measurement of food intake. During the feeding trials there was no
opportunity for the birds to switch their diet from seeds to other, protein rich, food items.
This sort of behaviour has been recorded in other, wild passerines. In the period leading up
to laying the Grey-backed Camaroptera changes from its predominantly graniverous diet to
start feeding on insects (Fogden & Fogden, 1979). However, studies of wild Zebra Finches
have indicated that even when breeding their diet remains almost entirely of seeds (Zann &
Straw, 1984, Morton & Davies, 1983). The Zebra Finches in this study had food available
ad libitum and thus the requirement for foraging was minimal. It is, therefore, possible that
Zebra Finches in the wild can obtain additional dietary nutrients during egg formation by
increasing their foraging effort.
142
But in this study it would appear that the bulk of protein for egg production is derived
endogenously. Chapters 4 and 5 showed that there was a significant decline in the protein
reserves of breeding female Zebra Finches to the extent that up to 74% of the protein in a
five-egg clutch could be supplied from this source. It was significant also that the timing of
this decline, which occurred largely from Day -3 to Day 1 of the laying cycle, matched
closely the period of rapid follicle growth and the peak of egg protein demand, which was
on Day 1.
The concept of protein reserves in one part of the body being built up and then depleted
again is not unusual. In studies of rats, for instance, protein reserves are estimated to make
up more than 20% of total body protein and these reserves can be reversibly depleted and
repleted (Allison & Wannemacher, 1965). Of all the tissues that may be involved it is the
skeletal muscle that forms the largest part of the protein reserves. Skeletal muscle is highly
mobile, with a protein turnover rate two to three times that seen in the liver, and it plays a
crucial role in overall protein metabolism (Millward, 1970, Spargo et al, 1979).
Skeletal muscle, and in particular the pectoral flight muscles, are a highly important
element of the protein reserves of the female Zebra Finch. The pectoral flight muscles
undergo atrophy at the time of egg formation (Figures 4.1,4.1b, 5.3, 5.3b). The measured
loss of protein from these muscles alone could provide up to 15% of the protein of a five-
egg clutch. The whole skeletal system is probably utilised for protein but the pectoral flight
muscles are most important by virtue of the fact that they are by far the largest muscle
group and also the most metabolically active (Jones, 1979, George & Berger, 1966). A
study of Eared Grebes revealed differences between the structure of flight muscle and leg
muscle. These differences were in relation to the mitochondria and suggested adaption of
the flight muscle to rapid hypertrophy and atrophy (Gaunt et al, 1990). In the female Zebra
Finch other organs, including the gut (Figure 4.5), the liver (Figure 4.6) and gizzard (Figure
4.7), contribute to the decline of total body protein during breeding. But the heart (Figure
4.8) showed no such decline in weight. Other studies have produced similar results for
changes in organs associated with egg-laying. For example in a study of Northern
Shovelers, Ankney and Afton (1988) measured no significant difference between pre-laying
and laying females' heart weight. Korschgen (1977) and Ankney & Machines (1978)
143
reported a significant decline in the size of the gizzards of Eider and Lesser Snow Geese
during breeding.
In previous studies that detected a decline in protein condition associated with egg
production (Table 1.1) it was generally assumed that this protein could become available
for egg formation. Therefore, in Chapter 6 an attempt was made using isotope labelled
amino acids to demonstrate the transfer of material from the body of the female Zebra Finch
to the developing eggs. The results of these experiments provide evidence that this is, in
fact, what is happening. At the end of the experimental period, the pectoral muscle of
breeding female Zebra Finches contained significantly less isotope than those Finches that
did not breed (Table 6.1). In addition, isotope was present in the eggs and the distribution of
the isotope within the eggs (and through the clutch) was consistent with previous findings
for the timing of protein demand during egg formation ie most isotope was present in the
eggs when protein demand was at its highest and protein from the body reserves would be
most needed.
Having established that endogenous protein is of importance to breeding Zebra Finches the
flight muscle was investigated in more detail. Kendall et al (1973) looked at the structure of
Quelea flight muscle before and after laying. On the basis that sarcoplasm reduced in size
while contractile elements did not they suggested that the sarcoplasm may be the location
for a store of labile protein to be drawn upon under stress. In this study (Chapter 5)
biochemical techniques were employed to measure both sarcoplasmic and contractile
protein. It was found that both elements of muscle were involved in the decline of overall
muscle protein (Figures 5.1 and 5.2). This direct measure of protein lost from the pectoral
muscle during the breeding period was almost equal to the decline of lean dry weight of the
muscle (Chapter 4). This backs up the assumption in previous studies that lean dry weight is
a good, indirect measure of protein content. Jones, M.M. (1991 & 1979) found that only the
contractile element of House Sparrow pectoral muscle declined in relation to breeding. The
sarcoplasm proteins declined but this was not significant. Eared Grebes undergo a pectoral
muscle atrophy of up to 50% and there is no evidence of change in overall ultrastructure,
rather all of the muscle fibres become smaller (Gaunt et al, 1990).
144
It was possible to analyze the composition of the sarcoplasmic element further by gel
filtration. This separated the individual proteins and it was found that one high molecular
weight protein displayed a significant decline whereas two others remained relatively
consistent (Figure 5.6). This result was similar to the findings of unpublished work on the
sarcoplasmic fraction of the pectoral muscles of breeding Starlings (Osbom & Ward, pers
comm.). Therefore, there is some evidence within the sarcoplasm that a protein of high
molecular weight is lost in preference to others, but the status of the various alkali soluble
protein is not known. This high molecular weight protein in the sarcoplasm is worthy of
further investigation and characterisation.
Why do birds use stored protein during the production of their eggs and what benefits might
accrue from such a strategy? Firstly, there is a range in the level of dependency on the use
of stored protein. Some birds, by virtue of their life history, require to form all of their eggs
from reserves. The Lesser Snow Goose (Ankney & Maclnnes, 1978) and the Adelie
Penguin (Astheimer & Grau, 1985) both have to do this as they are unable to feed
immediately prior to breeding. At the opposite end of the spectrum are birds that do not
utilise reserves of protein at all. The White-bellied Swiftlet appears to rely entirely on its
diet to supply protein for eggs (Hails & Turner, 1985). In between these ends of the
spectrum are those birds that use endogenous reserves of protein in conjunction with
protein from the diet. For example, the American Coot loses protein equivalent to 80% of
that required by the clutch (Alisauskas & Ankney, 1985) and the Red-billed Quelea obtains
protein partly from its diet and partly from reserves (Jones & Ward, 1976). This use of
endogenous protein may simply balance that available from the diet but there is some
evidence that it may be important in supplying specific nutrients, most probably amino
acids.
In the Lesser Black-backed Gull it has been shown that there is a positive correlation
between the number of eggs laid and the level of flight muscle protein in females at the start
of breeding (Bolton et al, 1993 and Houston et al, 1983). Further studies have demonstrated
that this gull's clutch size can be depressed by protein, but not energy, limitation. Secondly,
in an experiment using supplementary food, those breeding birds that received additional
egg protein in the form of cooked egg showed an increase in the size of eggs laid. However,
145
those that were fed supplementary general protein (fish) did not produce larger eggs
(Bolton, et al 1992). In general, eggs contain relatively high levels of certain amino acids,
including the sulphur containing amino acids, cystine and methionine (Harvey, 1970). The
egg of the Zebra Finch is not dissimilar to that of the domestic hen (Table 2.5) and studies
of hens have shown that their egg production can be enhanced by increased methionine,
lysine or tryptophan intake (Fisher, 1976). In Table 3.5 I compared the total amount of each
amino acid needed for a five-egg clutch with the amount available from the total quantity of
seed eaten each day over seven days. This indicated that cystine would be in deficit.
In addition, when taking into consideration the likely utilisation efficiencies of dietry amino
acids (no more than 75%, Murphy 1993b), it is likely that both cystine and lysine
requirements could not be met and that argenine and histidine would also be in very short
supply.
The Zebra Finch exists on a diet that is protein poor. As mentioned previously, the Zebra
Finch is predominantly graniverous even, as far as is known, under the stress of breeding
(Zann & Straw, 1984). Other granivores will change their diet during egg formation to
include more protein-rich items when necessary, for example the Grey-backed Camaroptera
(Fogden & Fogden, 1979) and the House sparrow (Krementz, 1984). One possible reason
why the Zebra Finch is so firmly graniverous is that in arid conditions small birds more
readily attain favourable states of water balance on a seed diet than larger birds (MacMillen,
1990).
Even those birds that do not have a typically protein deficient diet may benefit from the use
of protein reserves in egg production. Developing and utilising protein reserves may give
the ability to lay larger eggs or perhaps larger and/or earlier clutches than the food supply at
the time of egg formation would allow. Murphy (1986) found correlations between the
body condition of female Eastern Kingbirds and their egg composition (especially in
relation to lipid). It has been demonstrated that egg size has implications for chick size,
growth and probability of fledging (Schifferli, 1973, Nisbet, 1978, Bolton, 1991). In
addition, Furness (1983) showed that Great Skua chicks hatched from large eggs will
remain larger during subsequent development. In Herring Gulls (Parsons, 1970), Common
and Roseate Tems (Nisbet, 1978) chicks hatching from large eggs show a higher survival
146
rate than those that hatch from small eggs, although parental quality can be a factor in the
survival of chicks regardless of egg size (Bolton, 1991). However, in the Lesser Black-
backed Gull, Bolton et al (1993) found that there was no relationship between body
condition of females and egg size but body condition was important for determination of
clutch size. It has previously been suggested that female body condition acts as a proximate
factor to trigger the onset of the rapid follicular development phase of egg production and
also to determine the number of follicles that will be ovulated (Jones & Ward, 1976,
Fogden & Fogden, 1979, Houston et al, 1983 and Jones, M.M., 1991). Drent & Daan, 1980,
put forward hypotheses to explain the possible relationships that may exist between food
supply, female body condition and clutch size. They offered two models by which the
monitoring of body reserve accumulation might be used for the timing of breeding and
determination of clutch size. Firstly, there is the “Capital” model where clutch size and the
timing of breeding is determined by the date on which a particular threshold is reached.
Secondly, there is the “Income” model where it is the rate of accumulation, measured
against a number of fixed thresholds, that is important.
Recent experimental field studies have provided evidence of the importance of body
condition in relation to breeding. Bolton et al (1993) thought that the results of their study
of Lesser Black-backed Gulls supported Drent & Daan’s “income” model. The provision of
supplementary protein to the breeding females led to an increase in clutch size but had no
effect on laying date. In addition, there was no significant correlation between clutch size
and the timing of laying among the supplementary fed birds. They suggested that their
results were evidence of a causal link between body condition and clutch size, thus
providing a possible mechanism by which clutch size can be adjusted to the available food
supply in a given year or area or to individual foraging performance. Similarly, studies of
Tengmalm’s Owl (Korpimaki, 1987 &1989 and Korpimaki & Hakkarainen, 1991)
concluded that clutch size is predominantly determined in this species by food supply
during the period leading up to breeding and mediated by female body condition.
There are other occasions in the life history of birds, in addition to breeding, where there
may be benefits from the accumulation of body reserves and the subsequent use of
endogenous protein. In migratory birds lipid is the major energy substrate (Blem, 1990).
147
However, hypertrophy of flight muscle is also recorded. For example, the Grey Catbird
undergoes hypertrophy of its flight muscle by up to 35%, with all the major components of
the muscle contributing to the increase (Marsh, 1984). This augmentation of the pectoralis
mass could make a significant contribution to flight performance however it may also be of
significance once the bird reaches its migratory destination. In a study of migratory
shorebirds Davidson & Evans (1986) found that the degree of increase in muscle mass prior
to birds departing for their breeding grounds was unnecessary if considered from the
standpoint of the power requirements of flight alone. In addition, they found no correlation
between muscle size and the lipid content of fat individuals, which does not support the
theory of a response by the muscles to the need for more power to carry the increased load
of lipid. Their conclusion was that muscle hypertrophy in pre-migratory shorebirds was a
method for storing protein for use primarily to enhance the chances of survival at the
migratory destination in the face of unpredictable food availability. They estimated that this
store could provide between one fifth and one half of the protein needed to form a clutch of
eggs.
Moult is another part of the life cycle of birds where there is a requirement for protein. Most
species obtain the energy and protein necessary for the production of new feathers from
their diet (Blem, 1990). In a similar fashion to the use of endogenous protein in
reproduction there are a range of examples of the use of endogenous protein for the moult.
Some birds such as the Macaroni and Rockhopper Penguin are not able to feed during their
moult and thus obtain all the necessary nutrients endogenously (Williams et al, 1977). It is
thought that Redhead duck may use pectoral muscle protein in the formation of new
feathers but cannot fully meet demand from this source (Bailey, 1985). At the other end of
the spectrum to the penguins mentioned above is the Brant Goose which actually
experiences an increase in the mass of muscle protein during the moulting period (Ankney,
1984).
The second major component of eggs considered in this study was lipid. Lipid reserves in
the female Zebra Finch also underwent a significant decline during egg production (Figure
4.10). The extent of this decline was larger than the amount of lipid that is found in a five-
egg clutch. Unlike protein, the diet may also be able to make a significant contribution to
148
the lipid content of eggs as lipids can be readily formed from the carbohydrate content of
seeds. In other studies it has been suggested that during the period of egg formation the diet
may be changed to include protein rich food items and/or calcium rich items for shells. The
lipid reserves are utilised partly to fuel this change in feeding strategy (Krementz &
Ankney, 1986, Schifferli, 1980, Jones & Ward, 1976, Fogden & Fogden, 1979). It is most
likely that reserves of lipid act as an energetic buffer helping reduce the effect of lowered
energy intake as a result of changes in behaviour or feeding strategy necessary for egg
production. The Zebra Finches in this study displayed a marked change in feeding
behaviour during breeding also. In Chapter 2 it was shown that weight loss from cuttlefish
bone in the cages increased by as much as 400%. The implication of this is that Zebra
Finches obtain all calcium for their eggs exogenously. In the wild this may result in a
change of foraging strategy similar to that seen in House Sparrows (Krementz, 1984) and
Quelea (Jones & Ward, 1976).
The use of lipid reserves may also be of importance by helping to spread the energetic cost
of egg production over a longer period. For instance, in the female American Coot, the use
of reserve lipid and protein effectively reduced the required energy intake on Day 0 from
35% to 15% above that needed concurrently for daily energy expenditure (Alisauskas &
Ankney, 1985).
Finally, the third nutrient to be examined during this study was calcium. As mentioned
above, the occurrence of calcium rich food items in the diet of laying birds is often noted
(eg Krementz, 1984, Schifferli, 1976 and MacLean, 1974). Medullary bone can act as a
store of calcium that will be drawn upon when the shell of the egg is being deposited. This
can happen in even relatively small birds such as the House Sparrow where both stored and
dietary calcium are used (Krementz, 1984). However, in this study there was no evidence
that stored calcium was important (Figure 4.9) whereas there was a concerted effort to
obtain calcium from the diet, from calcium-rich cuttlefish bone (Figure 3.5).
The final conclusions of this study are;
149
Female Zebra Finches have the ability to draw upon their reserves of protein for the
production of eggs, largely because their diet is deficient in protein.
Reserves of protein may act as a reservoir of amino acids to supplement those that may be
limiting in the diet.
Skeletal muscles, and in particular the pectoral flight muscles, are perhaps the most
important element of the protein store but other organs such as the gut and the liver also
play a role.
Both sarcoplasmic and myofibrillar proteins are involved in the decline of muscle protein
during egg formation. A single, high molecular weight protein accounts for most of the
decline of sarcoplasm protein.
Isotope experiments provide evidence that proteins are transferred directly to the
developing eggs.
Lipid reserves also undergo a decline. The quantity of lipid lost from reserves greatly
exceeds that found in the eggs. It is likely that reserve lipid is important not only for egg
formation but to meet other energetic demands associated with egg formation.
Calcium requirements appear to be met from the diet alone. There was no evidence of the
use of stored calcium.
150
REFERENCES
Alisauskas, R.T. and Ankney, C.D. (1985). Nutrient reserves and the energetics of
reproduction in American Coot. Auk, 102, 133-144.
Allison, J.B. and Wannemacher, R.W. (1965), The concept and significance of labile
and over-all protein reserves of the body. Am. J. Clin. Nutr., 16,445-452.
Ankney, C.D. (1984). Nutrient reserve dynamics of breeding and moulting Brant. Auk,
101,361-370.
Ankney, C.D. and Afton, A.D. (1988). Bioenergetics of breeding Northern Shovelers:
Diet, nutrient reserves, clutch size and incubation. Condor, 90,459-472.
Ankney, C.D. and Scott, D.M. (1980). Changes in nutrient reserves and diet of
breeding Brown-headed Cowbirds. Auk, 97, 684-696.
Ankney, C.D. and Maclnnes, C.D. (1978). Nutrient reserves and reproductive
performance of female Lesser Snow Geese. Auk, 95,459-471.
Astheimer, L.B. (1986). Egg formation in the Cassiris Auklet. Auk, 103, 682-693.
Astheimer, L.B. and Grau, C.R. (1990). A comparison of yolk growth rates in seabird
eggs. Ibis, 132, 380-394.
Astheimer, L.B. and Grau, C.R. (1985). The timing and energetic consequences of egg
formation in the Adelie Penguin. Condor, 87,256-268.
Baggot, G.K. (1975), Moult, flight muscle "hypertrophy" and premigratory lipid
deposition of the juvenile willow warbler, Phylloscopus trochilus. J. Zool. Lond. 175,
299-314.
151
Bailey, R.O. (1979), Methods of estimating total lipid content in the Redhead Duck,
Athya americana, and an evaluation of condition indices. Can. J. Zool. 57, 1830-1833.
Bailey, R.O. (1985), Protein reserve dynamics in post-breeding adult male Redheads,
Condor, 87, 23-32.
Bairlein, F. (1985), Efficiency of food utilisation during fat deposition in the long
distance garden Warbler, Sylvia borin. Oecologia, 68, 118-125.
Barzen, J.A. and Serie, J.R. (1990), Nutrient reserve dynamics of breeding
Canvasbacks. Auk, 107, 75-85.
Benkman, C.W. and Pullman, H.R. (1988), The comparative feeding rates of North
American Sparrows and Finches. Ecology, 69, 1195-1199.
Birkhead, M. (1984), Variation in the weight and composition of Mute Swan, Cygnus
olor, eggs. Condor, 86, 489-490.
Birkhead, T.R. and Nettleship, D.N. (1984), Egg size, composition and offspring
quality in some Alcidae (Aves: Charadriiformes) . J. Zool. Lond. 202, 177-194.
Blem, C.R. (1990), Avian energy storage. In Current Ornithology, Vol. 7, Edited by
D.M. Power, Plenum, New York, p. 59-113.
Boag, P.T. (1987), Effects of nestling diet on growth and adult size of Zebra Finches,
Poephila guttata. Auk, 104, 155-166.
Bolton, M. (1991), Determinants of chick survival in the Lesser Black-backed Gull:
relative contributions of egg size and parental quality. J. Anim. Ecol., 60, 949-960.
152
Bolton, M., Monaghan, P. and Houston, D.C. (1991), An improved technique for
estimating pectoral muscle protein condition from body measurements of live gull, Ibis,
133, 264-270.
Bolton, M., Houston, D.C. and Monaghan, P. (1992), Nutritional constraints on egg
formation in the Lesser Black-blacked Gull: an experimental study. J. Anim. Ecol., 61,
521-532.
Bolton, M., Monaghan, P. and Houston, D.C. (1993), Proximate determination of
clutch size in lesser black-backed gulls: the roles of food supply and body condition.
CanJ.Zool., 71, 273-279.
Brody, S. (1945), Bioenergetics and growth. Reinholt Publ. Corp., New York.
Calder, W.A. (1964), Gaseous metabolism and water relations of the Zebra Finch
Taeniopygia castanotis. Physiol. Zool., 37,400-413.
Calder, W.A. (1974), Consequences of body size for avian energetics. In Avian
Energetics, Edited by R.A. Paynter, Jr, Publ. Nuttall Omithol. Club No. 15, Cambridge,
MA, p. 86-151.
Carey, C. (1983), Structure and function of avian eggs. In Current Ornithology, Vol. 1,
Edited by R.F. Johnson, Plenum, New York, p. 69-103.
Carr, R.A. and Zann, R.A. (1986), The morphological identification of domesticated
Zebra Finches, Poephila guttata, (Passeriformes: Estrilidae), in Australia. Aus. J. Zool.,
34, 439-448.
Clayton, N.S. and Birkhead, T.R. (1989), Consistency in the scientific name of the
Zebra Finch. Auk, 106, 750.
153
Coleman, R.M. and Whittal, R.D. (1990), Variation in egg weight in the Bengalese
Finch (Lonchura striata var. domesticci). Can. J. Zool, 68, 272-275.
Comar, C.L. and Driggers, J.C. (1949), Secretion of radioactive calcium in the hen's
egg. Science, 109, 282.
Davidson, N.C., and Evans, P.R. (1986), Prebreeding accumulation of fat and muscle
protein by arctic-breeding shorebirds. In Acta XIX Congressus Intemationalis
Omithologica. Vol. 1. Edited by H. Ouellet. University of Ottowa Press, Ottowa, Ont.,
pp342-351.
Davidson, N.C., Evans, P.R. and Uttley, J.D. (1986), Geographical variation of
protein reserves in birds; pectoral muscle mass of Dunlins, Calidris alpina, in winter. J.
Zool. Lond., 208, 125-133.
Davies, S.J.J.F. (1977), The timing of breeding by the Zebra Finch, Taeniopygia
castanotis, at Mileura, Western Australia. Ibis, 119, 369-372.
Diaz, M. (1990), Interspecific patterns of seed selection among granivorous passerines:
effects of seed size, seed nutritive value and bird morphology. Ibis, 132, 467-476.
Dobush, G.R., Ankney, C.D. and Krementz, D.G. (1985); the effect of apparatus,
extraction time and solvent type on lipid extractions of Snow Geese. Can. J. Zool., 63,
1917-1920.
Drent, R. & Daan, S. (1980), The prudent parent: energetic adjustments in avian
breeding. Ardea, 68, 225-252.
Drobney, R.D. (1980) Reproductive bioenergetics of Wood Ducks. Auk, 97,480-490.
Drobney, R.D. (1982), Body weight and composition changes and adaptions for
breeding in Wood Ducks. Condor, 84, 300-305.
154
Drobney, R.D. and Fredrickson, L.H. (1985), Protein acquisition: A possible
proximate factor limiting clutch size in Wood Ducks, Wildfowl, 36, 122-128.
Dwyer, T.J., Krapu, G.L. and Janke, D.M. (1979), Use of prairie pothole habitat by
breeding Mallards. J. Wildl. Mgmt., 43, 526-531.
El-Wailly, A.J. (1966), Energy requirements for egg laying and incubation in the Zebra
Finch, Taeniopygia castanotis, Condor, 68, 582-594.
Ettinger, A.O. and King, J.R. (1980), Time and energy budgets of the Willow
Flycatcher, Empidonox traillii, during the breeding season. Auk, 97, 533-546.
Fisher, C. (1976), Protein in the diets of the pullet and laying bird. Protein Metabolism
and Nutrition, Edited by D.J.A. Cole, K.N. Boorman, P.J. Buttery, D. Lewis, R.J. Neale
and H. Swan, Butterworths, London, p. 323-352.
Fogden, M.P.L. and Fogden, P.M. (1979), The role of fat and protein reserves in the
annual cycle of the Grey-backed Camaroptera in Uganda (Aves: Sylvidae). J.Zool.Lond,
189, 233-258.
Freeman, S. and Jackson, W.M. (1990), Univariate metrics are not adequate to
measure avian body size. Auk, 107, 69-74.
Fry, C.H., Ferguson-Lees, I.J. and Dowsett, R.J. (1972), Flight muscle hypertrophy
and ecophysiological variation of Yellow Wagtail, Motacilla flava, at Lake Chad.
J.Zool.Lond, 187, 293-306.
Furness, R.W. (1983). Variations in size and growth of great skua Catharacta skua
chicks in relation to adult age, hatching date, egg volume, brood size and hatching
sequence. J.Zool. Lond., 199, 101-116.
155
Gaunt, A.S., Hikada, R.S., Jehl, J.R. and Fenbert, L. (1990), Rapid atrophy and
hypertrophy of an avian flight muscle. Auk, 107, 649-659.
Gauthier, G. and Bedard, J. (1985), Fat reserves and condition indices in Greater
Snow Geese. Can.J.Zool., 63, 331-333.
George, J.C. and Berger, A.J. (1966), Avian myology, Academic Press, London.
Hails, C.J. and Turner, A.K. (1985), The role of fat and protein during breeding in the
White-bellied Swiftlet (Collocalia esculenta). J.Zool.Lond206, 469-484.
Hanson, A.R., Ankney, C.D. and Dennis, D.G. (1990), Body weight and lipid reserves
of American Black Ducks and Mallards during Autumn. Can. J. Zool., 68, 2098-2104.
Harvey, D. (1970), Tables o f the amino acids in foods andfeedingstujfs, 2nd edn.
Technical Communication No. 19, Commonwealth Bureau of Animal Nutrition,
Scotland.
Hatchwell, B.J. and Pellatt, J. (1990), Intraspecific variation in egg composition and
yolk formation in the Common Guillemot (Uria aalge). J.Zool.Lond, 220, 279-286.
Hepp, G.R., Kennamer, R.A. and Harvey, W.F. (1990), Incubation as a reproductive
cost in female Wood Ducks. Auk, 107, 756-764.
Hirons, G.M., Hardy, A.R. and Stanley, P.I. (1984), Body weight, gonad
development and moult in the Tawny Owl (Strix aluco). J.Zool.Lond., 202 ,145-164.
Hohman, W.L. (1986), Changes in body weight and body composition of breeding
Ring-necked Ducks (Aythya collaris). Auk, 103,181-188.
Hohman, W.L. and Taylor, T.S. (1986), Indices of fat and protein for Ring-necked
ducks. J. Widl.Manage., 50(2), 209-211.
156
Hornfeldt, B. and Eklund, U. (1990) The effect of food on laying date and clutch size
in Tengmalm's Owl, Aegolius funereus. Ibis, 132, 395-406.
Houston, D.C., Jones, P.J. and Sibley, R.M. (1983), The effect of female body
condition on egg laying in Lesser Black-backed Gulls. J.Zool.Lond., 200, 509-520.
Johnson, D.H., Krapu, G.L., Rienecke, R.J. and Jorde, D.G. (1985) An evaluation
of condition indices for birds. J. Wildl. Manage., 49(3), 569-575.
Jones, G. (1987), Body condition changes of Sand Martins (Riparia riparia) during
breeding, and a comparison with fledgling condition. J.Zool.Lond., 213, 263-281.
Jones, M.M. (1979), Studies on the pectoralis muscle (pars thorascicus) of the House
Sparrow (Passer domesticus). DPhil Thesis, Dept, of Anatomy, St Thomas Medical
School.
Jones, M.M. (1980), Nocturnal loss of muscle protein from House Sparrows (Passer
domesticus). J.Zool.Lond., 192, 33-29.
Jones, M.M. (1991), Muscle protein loss in laying House Sparrows. Ibis, 133, 193-198.
Jones, P.J. (1976), The utilisation of calcarious grit by laying Quelea quelea. Ibis, 118,
575-576.
Jones, P.J. and Ward, P. (1976), The level of reserve protein as the proximate factor in
controlling the timing of breeding and clutch size in Red-billed Quelea, Quelea quelea.
Ibis, 118, 547-574.
Kallander, H. (1974), Advancement of laying of Great Tits by the provision of food.
Ibis, 116, 365-367.
157
Kendall, M.D., Ward, P. and Bacchus, S. (1973), A protein reserve in the pectoralis
major muscle of Quelea quelea. Ibis, 115, 600-601.
Kerr, K.C., Ankney, C.D. and Millar, J.S. (1982) The effect of drying temperature on
extraction of petroleum ether soluble fats of small birds and mammals. Can. J. Zool., 60,
470-472.
King, J.R. (1973), Energetics of reproduction in birds. In Breeding biology o f birds,
Edited by D. S. Famer, Natl. Acad. Sci., Washington DC, p78-107.
Korpimaki, E. (1987), Clutch size, breeding success and brood size experiments in
Tengmalm’s Owl Aegolius funereus: a test of hypotheses. Ornis Scand, 18,277-284.
Korpimaki, E. (1989), Breeding performance in Tengmalm’s Owl Aegolius funereus:
effects of supplementary feeding in a peak vole year. Ibis, 131, 51-56.
Korpimaki, E. & Hakkarainen, H. (1991) Fluctuating food supply affects the clutch
size of Tengmalm’s Owl independent of laying date. Oecologia, 85, 543-552.
Korschgen, C.E. (1977), Breeding stress of female Eiders in Maine. J. Wildl. Mgmt.,
41, 360-373.
Krapu, G.L. (1981), The role of nutrient reserves in Mallard reproduction. Auk, 98, 29-
38.
Krementz, D.G. (1984), Bioenergetics of breeding House Sparrows. Unpublished PhD
Thesis, Univ. of Western Ontario.
Krementz, D.G. and Ankney, C.D. (1986), The bioenergetics of egg production by
female House Sparrows. Auk, 103, 299-305.
158
Lowry, O.H., Roseborough, N.J., Farr, A.L. and Randall, R.J. (1951), Protein
measurement with the Folin-Phenol reagent. J.Biol.Chem., 193, 265-275.
Mainguy, S.K. and Thomas, V.G. (1985), Comparison of body reserve build-up in
several groups of Canada Geese. Can. J.Zool., 6 3 ,1765-1772.
MacLean, S.F. (1974), Lemming bones as a source of calcium for Arctic Sandpipers
(Calidris spp). Ibis, 116, 552-557.
MacMillen, R.E. (1990), Water economy of granivorous birds: a predictive model.
Condor, 92, 379-392.
Marsh, R.L. (1984), Adaptions of the Grey Catbird, Dumetella carolinensis, to long
distance migration: flight muscle hypertrophy associated with elevated body mass.
Physiol.Zool., 57(1), 105-117.
Millward, D.J. (1970), Protein turnover in skeletal muscle. II. The effect of starvation
and a protein-free diet on the synthesis and catabolism of skeletal muscle proteins in
comparison to liver. Clin.Sci., 39, 591-603.
Morton, S.R. and Davies, P.M. (1983), Food of the Zebra Finch (Poephila guttata) and
an examination of granivory in the birds of the Australian arid zone. Aust.J.Zool., 8,
235-243.
Murphy, M.E. (1993a), The protein requirement for maintenance in the White-
crowned Sparrow, Zonotrichia leucophrys gambelii. Can. J. Zool., 71, 2111-2120.
Murphy, M.E. (1993b), The essential amino acid requirements for maintenance in the
White-crowned Sparrow, Zonotrichia leucophrys gambelii. Can. J. Zool., 71, 2121-
2130.
159
Murphy, M.E. and King, J.R. (1984), Sulphur amino acid nutrition during moult in the
White-crowned Sparrow. 2. Nitrogen and sulphur balance in birds fed graded levels of
the sulphur containing amino acids. Condor, 86, 324-332.
Murphy, M.T. (1986), Body size and condition, timing of breeding and aspects of egg
production in Eastern Kingbirds. Auk, 106,465-476.
Nesheim, M.C., Austic, R.E., and Card, L.E. (1979), Poultry Production (12th
Edition). Lea and Febiger, Philadelphia.
Nisbet, I.C.T. (1978), Dependence of fledging success on egg size, parental
performance and egg composition among common and Roseate tems, Sterna hirundo
and S', dougali. Ibis, 120,207-215.
Ojanen, M. (1983), Egg development and the related nutrient reserve depletion in the
Pied Flycatcher, Ficedula hypoleuca. Ann. Zool. Fenn., 20, 293-300.
Packard, G.C. and Boardman, T.J. (1988), The misuse of ratios, indices and
percentages in ecophysiological research. Physiol. Zool., 61, 1-9.
Parker, H. and Holm, H. (1990), Patterns of nutrient and energy expenditure in female
Common Eiders nesting in the high Arctic. Auk, 107, 660-668.
Parsons, J. (1970), Relationship between egg size and post-hatching chick mortality in
the herring gull Larus argentatus. Nature, 228, 1221-1222.
Parsons, J. (1976), Factors determining the number and size of eggs laid by the Herring
Gull. Condor, 78, 481-492.
Perdeck, A.C. (1985), Methods of predicting fat reserves in the Coot. Ardea, 73, 139-
146.
160
Rahii, H., Paganelli, C.V., and Ar, A. (1975). Relation of avian egg weight to body
weight. Auk, 92, 750-765.
Raveling, D.G. (1979), The annual cycle of body composition of Canada Geese with
special reference to control of reproduction. Auk, 96, 234-252.
Reinecke, K.J., Stone, T.L. and Owen (1982), Seasonal carcass composition and
energy balance of female Black Ducks in Maine. Condor, 84,420-426.
Ricklefs, R.E. (1977), Composition of eggs of several bird species, Auk, 94, 350-356.
Ricklefs, R.E. (1974), Energetics of reproduction in birds, In Avian Energetics, Edited
by R.A. Paynter, Jr, Publ. Nuttall Omithol. Club No. 15, Cambridge, MA, p. 152-297.
Rising, J.D. and Somers, K.M. (1989), The measurement of overall body size in birds.
Auk, 106, 666-674.
Robbins, C.T. (1981), Estimation of the relative protein cost of reproduction in birds.
Condor, 83, 177-179.
Robbins, C.T. (1983), Wildlife Feeding and Nutrition, Academic Press, Lond.
Romanoff, A.L. and Romanoff, A.J. (1949), The Avian Egg, John Wiley and Sons,
New York.
Schifferli, L. (1973), The effect of egg weight on the subsequent growth of nesting great
tits Parus major. Ibis, 115, 549-558.
Schifferli, L. (1976), Factors affecting weight and conditions in the House Sparrow
particularly when breeding. Unpublished PhD Thesis, Univ. of Oxford.
161
Schifferli, L. (1980), Changes in the fat reserves in female House Sparrows Passer
domesticus during egg laying. In Proceedings o f the Seventeenth International
Ornithological Congress, Berlin, West Germany, p. 1129-1135.
Schmidt-Nielsen, K. (1979), Animal Physiology: Adaption and Environment,
Cambridge University Press, London.
Serventy, D.L. (1971), Biology of desert birds. In Avian biology, Vol. 1, Edited by
Famer, D.S. and King, J.R., p. 287-339.
Shuman, T.W., Robel, R.J., Zimmerman, J.L. and Kemp, K.E. (1989) Variance in
digestive efficiencies of four sympatric avian granivores. Auk, 106, 324-326.
Simkiss, K. (1961), Calcium metabolism and avian reproduction. Biol. Rev., 36, 321
367.
Sotherland, P.R. and Rahn, H. (1987) On the composition of bird eggs. Condor, 89,
48-65.
Spargo, E., Pratt, O.E. and Daniel, P.M. (1979), Metabolic functions of skeletal
muscles of man, mammals, birds and fishes: a review. J. Roy. Soc. Med., 72, 921-925.
Stryer, L. (1981), Biochemistry, 2nd Edition. W.H. Freeman, San Fransisco.
Tome, M.W. (1984), Changes in nutrient reserves and organ size of female Ruddy
Ducks breeding in Manitoba. Auk, 101, 830-837.
Vleck, C.M. (1981), Energetic cost of incubation in the Zebra Finch. Condor, 83, 229-
237.
Walsberg, G.E. (1983), Avian Ecological Energetics, In Avian Biology, Vol.7, Edited
by D.S. Famer, J.R. King and K.C. Parkes, Academic Press, London, p. 161-220.
162
Wiggins, D.A. (1990), Sources of variation in egg mass of Tree Swallows, Tachycineta
bicolor. Ornis Scand., 21, 157-160.
Williams, A.J., Siegfried, W.R., Burger, A.E. and Berruti, A. (1977), Body
composition and energy metabolism of moulting Eudyptid penguins. Comp. Biochem.
Physiol., 56, 27-30.
Wilson, K. and Goulding, K.H. (1986), Principles and techniques o f practical
biochemistry, Third edition. Edward Arnold, London.
Zann, R. and Straw, B. (1984), Feeding ecology and breeding of Zebra Finches in
farmland in Northern Victoria. Aus. Wildl. Res., 11, 533-552.
163
Scientific names of birds mentioned in the text
Adelie penguin
American coot
Bengalese finch
Black duck
Brant goose
Brown-headed cowbird
Brown kiwi
Cananda goose
Canvasback
Common eider
Common tem
Eared grebe
Eastern kingbird
Great skua
Grey-backed camaroptera
Grey Catbird
Herring gull
House sparrow
Lesser black-backed gull
Lesser snow goose
Macaroni penguin
Mallard duck
Northern shoveler
Pygoscelis adeliae
Fulica americana
Lonchura striata var. domestica
Anas rubripes
Branta bernicla
Molothrus ater
Apteryx australis
Branta canadensis
Ay thy a valisineria
Somateria mollissima
Sterna hirundo
Podiceps nigricollis
Tyrannus tyrannus
Catharacta skua
Camaroptera brevicaudata
Dumetella carolinensis
Larus argentatus
Passer domesticus
Larus fuscus
Anser caerulescens
Eudyptes chrysolophus
Anas platyrhynchos
Anas clypeata
164
Pied flycatcher
Red-billed quelea
Redhead Duck
Ring-necked duck
Rockhopper penguin
Roseate tem
Ruddy duck
Sand martin
Starling
Tengmalm’s Owl
Tree swallow
White-bellied swiftlet
White-crowned Sparrow
Wood duck
Yellow wagtail
Zebra finch
Ficedula hypoleuca
Quelea quelea
Aythya americana
Aythya collaris
Eudyptes chrysocome
Sterna dougali
Oxyura jamaicensis
Riparia riparia
Sturnus vulgaris
Aegolius funereus
Tachycineta bicolor
Collacalia esculenta
Zonotrichia leucophrys
Aix sponsa
Motacilla flava
Taeniopygia guttata
165
Related Documents


![Nutritional Doc- word Water, Egg Yolks, Distilled and Cider Vinegar, Salt, Spice, Calcium Disodium, EDTA added to )rotect flavor], Panko [Bleached Wheat Flour, Dextrose, Yeast, Salt],](https://static.cupdf.com/doc/110x72/5aacbc7a7f8b9a8d678d41cb/nutritional-doc-water-egg-yolks-distilled-and-cider-vinegar-salt-spice-calcium.jpg)