DRAFT INDIANA TEACHER LICENSING EXAM 2000 TESTING REPORT THE INDIANA PROFESSIONAL STANDARDS BOARD THE NTE CORE BATTERY TESTS THE PRAXIS I: ACADEMIC SKILLS ASSESSMENT THE PRAXIS II: SPECIALTY AREA TESTS TESTING YEARS 1998-1999 INDIANA PROFESSIONAL STANDARDS BOARD Dr. Ray Graves, Transition Coordinator Dr. Judy Miller, Consultant, PreService Education Dr. Bet Kotowski, Director of PreService Education AND Gary Tatlock, Educational Information System Department of Education

Welcome message from author
This document is posted to help you gain knowledge. Please leave a comment to let me know what you think about it! Share it to your friends and learn new things together.
Transcript

DRAFT
INDIANA TEACHER LICENSING EXAM
2000 TESTING REPORT
THE INDIANA PROFESSIONAL STANDARDS BOARD
THE NTE CORE BATTERY TESTS
THE PRAXIS I: ACADEMIC SKILLS ASSESSMENT
THE PRAXIS II: SPECIALTY AREA TESTS
TESTING YEARS 1998-1999
INDIANA PROFESSIONAL STANDARDS BOARD
Dr. Ray Graves, Transition Coordinator Dr. Judy Miller, Consultant, PreService Education Dr. Bet Kotowski, Director of PreService Education
AND Gary Tatlock, Educational Information System
Department of Education

1
TABLE OF CONTENTS Indiana Teacher Licensing Examinations* Page 2-3 Chronology
4 Core Battery Results Total Scores for 1998-1999
5 Core Battery First Time Examinees for 1998-99
6-7 Core Battery Ethnic Data (Total Scores) for 1998-99
8 Praxis I PPST Total Scores for 1998-1999
9 Praxis I PPST First Time Examinees for 1998-1999 10-11 Praxis I PPST Ethnic Data (Total Scores) for 1998-1999
12 Praxis I CBT Total Scores for 1998-1999
13 Praxis I CBT First Time Examinees for 1998-1999
14-15 Praxis I CBT Ethnic Data (Total Scores) for 1998-1999
16-27 Praxis II Specialty Area Test Results for 1998-1999
28 Comparison of Indiana Means for Core Battery 1998-1999 and National Average Performance Range
29 Comparison of Indiana Means for Praxis I and National Average
Performance
30 Comparison of Indiana Means for Specialty Area Test 1998 – 1999 and 1997 - 1998 and the National Average Performance Range
*From the Praxis Series, prepared by Educational Testing Service (ETS).

2
CHRONOLOGY
1984 Passage of legislation requiring Indiana Teacher Licensing Testing 1985 Implementation of the NTE Core Battery (Communication Skills,
Professional Knowledge, and General Knowledge) 1986 Implementation of the Specialty Area Tests including both NTE and ITTP 1988 Update of Specialty Area Tests with nine NTE tests replacing ITTP tests
and Adjustment of Specialty Area Test scores in English Language and Literature, math, and music following re-validation of those tests
1990 Validation Studies for fourteen Specialty Area Tests to replace ITTP tests
for updating testing program 1991 Spring: Legislation passed providing for a special kind of limited license
subject to examinee meeting requirements. 1991 Fall: Implementation of thirteen Specialty Area Tests to replace ITTP test;
elimination of six ITTP tests from program because of low incidence licensing.
1991 Winter - 1992 Spring: Indiana participants in multistate review of The
Praxis Series: Professional Assessments for Beginning Teachers, sponsored by Educational Testing Service.
1992-93 New standard setting study for German exam. Preparation for the Praxis
Series. 1993-94 Standard setting studies were conducted for eleven Praxis Stage II
Specialty Area Tests. 1994-95 Standard setting studies were conducted for seven Praxis II Specialty Area
Tests. 1995 After July, U.S. History, World Civilization, and Teaching Students with Mild Disabilities were dropped for budget reasons.
1996 Spring: There was a meeting of Praxis II Math test panelists and the Math Advisory Group to discuss appropriateness of test to Math standards.

3
1997 Spring: 1) There was a meeting of Praxis II English, Science, and Social
Studies test panelists and the English, Science and Social Studies Advisory Groups to discuss appropriateness of tests to their respective standards.
2) Educational Testing Service dropped Teaching Deaf/Hard of Hearing Test in April 3) Legislation was passed paving the way for the new assessment plan.
1997 Fall: Standard Setting Study for Praxis I: the Pre-Professional Skills Tests in Reading, Writing, and Math was completed. 1998 Spring: Qualifying scores for Praxis I: the Pre-Professional Skills Tests
were approved by the Board. 1999 Spring: Transition to new tests for Elementary Education, English, and
Social Studies. 2000 Spring: 100 Indiana Students participate in field testing of INTASC Test for Teaching Knowledge (TTK)
Fall: 1) Qualifying score for 12 Content Area Tests approved by Board 2) Standard Setting Studies conducted for Biology, Chemistry, Physics and Special Education K-12. 3) Content Area Tests for Social Studies discontinued by ETS 4) Core Battery Tests discontinued by ETS
4
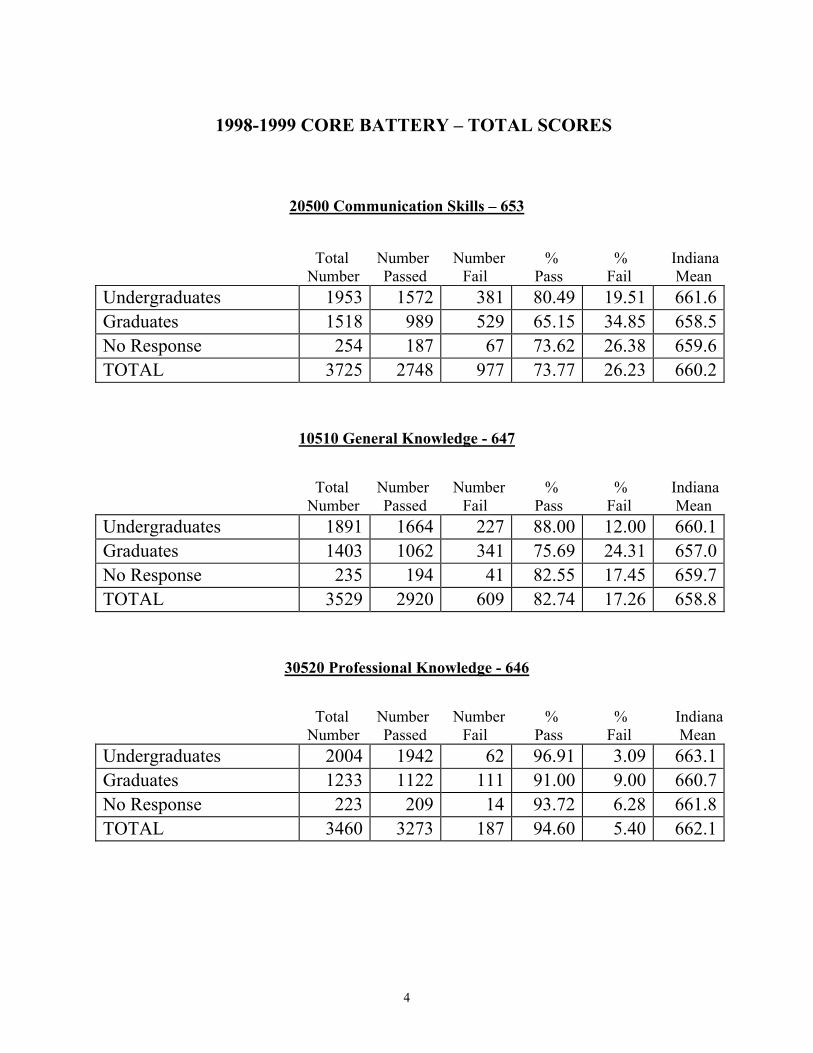
1998-1999 CORE BATTERY – TOTAL SCORES
20500 Communication Skills – 653
Total Number Number % % Indiana Number Passed Fail Pass Fail Mean
Undergraduates 1953 1572 381 80.49 19.51 661.6 Graduates 1518 989 529 65.15 34.85 658.5 No Response 254 187 67 73.62 26.38 659.6 TOTAL 3725 2748 977 73.77 26.23 660.2
10510 General Knowledge - 647 Total Number Number % % Indiana Number Passed Fail Pass Fail Mean
Undergraduates 1891 1664 227 88.00 12.00 660.1 Graduates 1403 1062 341 75.69 24.31 657.0 No Response 235 194 41 82.55 17.45 659.7 TOTAL 3529 2920 609 82.74 17.26 658.8
30520 Professional Knowledge - 646 Total Number Number % % Indiana Number Passed Fail Pass Fail Mean
Undergraduates 2004 1942 62 96.91 3.09 663.1 Graduates 1233 1122 111 91.00 9.00 660.7 No Response 223 209 14 93.72 6.28 661.8 TOTAL 3460 3273 187 94.60 5.40 662.1

5
1998-1999 FIRST TIME EXAMINEES
20500 Communication Skills – 653 Total Number Number % % Indiana Number Passed Fail Pass Fail Mean
Undergraduates 1631 1437 194 88.11 11.89 663.7 Graduates 982 820 162 83.50 16.50 663.3 No Response 191 166 25 86.91 13.09 662.8 TOTAL 2804 2423 381 86.41 13.59 663.5
10510 General Knowledge - 647 Total Number Number % % Indiana Number Passed Fail Pass Fail Mean
Undergraduates 1707 1581 126 92.62 7.38 661.6 Graduates 1037 937 100 90.36 9.64 661.6 No Response 205 183 22 89.27 10.73 662.1 TOTAL 2949 2701 248 91.59 8.41 661.6
30520 Professional Knowledge - 646 Total Number Number % % Indiana Number Passed Fail Pass Fail Mean
Undergraduates 1970 1920 50 97.46 2.54 663.3 Graduates 1109 1064 45 95.94 4.06 662.4 No Response 205 197 8 96.10 3.90 662.8 TOTAL 3284 3181 103 96.86 3.14 663.0

6
1998-1999 ETHNIC ONLY – TOTAL SCORES
20500 Communication Skills – 653
Total Number Number % % Indiana Number Passed Fail Pass Fail Mean
Black 216 81 135 37.50 62.50 650.8 Chicano 55 30 25 54.55 45.45 653.9 Indian 12 5 7 41.67 58.33 655.1 Asian 27 13 14 48.15 51.85 652.8 Puerto Rican 18 4 14 22.22 77.78 649.1 Other Hispanic 28 10 18 35.71 64.29 651.2 White 3262 2524 738 77.38 22.62 661.1 Other 35 20 15 57.14 42.86 656.9 *No Response 72 61 11 84.72 15.28 663.2 TOTAL 3725 2748 977 73.77 26.23 660.2
10510 General Knowledge - 647 Total Number Number % % Indiana Number Passed Fail Pass Fail Mean
Black 198 80 118 40.40 59.60 645.9 Chicano 47 33 14 70.21 29.79 651.2 Indian 4 4 0 100.00 0.00 663.0 Asian 22 17 5 77.27 22.73 654.5 Puerto Rican 14 5 9 35.71 64.29 643.0 Other Hispanic 22 10 12 45.45 54.55 646.6 White 3112 2681 431 86.15 13.85 659.9 Other 36 24 12 66.67 33.33 655.2 *No Response 74 66 8 89.19 10.81 663.5 TOTAL 3529 2920 609 82.74 17.26 658.8

7
1998-99 30520 Professional Knowledge - 646
Total Number Number % % Indiana Number Passed Fail Pass Fail Mean
Black 136 101 35 74.26 25.74 652.7 Chicano 47 41 6 87.23 12.77 656.1 Indian 6 6 0 100.00 00.00 665.3 Asian 21 20 1 95.24 4.76 658.4 Puerto Rican 10 4 6 40.00 60.00 647.6 Other Hispanic 18 12 6 66.67 33.33 648.9 White 3117 2990 127 95.93 4.07 662.8 Other 33 30 3 90.91 9.09 660.3 *No Response 72 69 3 95.83 4.17 663.9 TOTAL 3460 3273 187 94.60 5.40 662.1

8
1998-1999 Praxis I Academic Skills Assessment
710 PPST Reading Qualifying Score = 176
Total Number Number % % Indiana Number Passed Fail Pass Fail Mean
Undergraduates 1131 712 419 62.95 37.05 177.3 Graduates 176 130 46 73.86 26.14 179.5 No Response 55 37 18 67.27 32.73 177.5 TOTAL 1362 879 483 64.65 35.46 177.6
720 PPST Writing Qualifying Score = 172
Total Number Number % % Indiana Number Passed Fail Pass Fail Mean
Undergraduates 1109 872 237 78.63 21.37 174.6 Graduates 174 149 25 85.63 14.37 175.9 No Response 58 46 12 79.31 20.69 175.1 TOTAL 1341 1067 274 79.57 20.43 174.8
730 PPST Mathematics Qualifying Score = 175
Total Number Number % % Indiana Number Passed Fail Pass Fail Mean
Undergraduates 1128 721 407 63.92 36.08 176.9 Graduates 186 120 66 64.52 35.48 177.9 No Response 52 34 18 65.38 34.62 177.2 TOTAL 1362 875 491 64.06 35.94 177.0

9
1998-1999 FIRST TIME EXAMINEES
710 PPST Reading – 176
Total Number Number % % Indiana Number Passed Fail Pass Fail Mean
Undergraduates 1176 766 410 65.14 34.86 177.6 Graduates 185 141 44 76.22 23.78 179.9 No Response 60 44 16 73.33 26.67 178.3 TOTAL 1421 95 470 66.92 33.08 177.9
720 PPST Writing – 172
Total Number Number % % Indiana Number Passed Fail Pass Fail Mean
Undergraduates 1168 931 237 79.71 20.29 174.7 Graduates 184 160 24 86.96 13.04 176.0 No Response 63 52 11 82.54 17.46 175.2 TOTAL 1415 1143 272 80.78 19.22 174.9
730 PPST Mathematics – 175
Total Number Number % % Indiana Number Passed Fail Pass Fail Mean
Undergraduates 1173 771 402 65.73 34.27 177.3 Graduates 192 131 61 68.23 31.77 178.8 No Response 58 40 18 68.97 31.05 177.4 TOTAL 1423 942 481 66.20 33.80 177.5

10
1998-99 ETHNIC ONLY – TOTAL SCORES
710 PPST Reading – 176
Total Number Number % % Indiana Number Passed Fail Pass Fail Mean
Black 44 18 26 40.91 59.09 173.6 Chicano 9 4 5 44.44 55.56 173.2 Indian 4 4 0 100.00 0.00 179.0 Asian 13 2 11 15.38 84.62 172.5 Puerto Rican 1 1 0 100.00 0.00 183.0 Other Hispanic 16 5 1 83.33 16.67 178.7 White 1254 826 428 65.87 34.13 177.8 Other 10 6 4 60.00 40.00 177.3 *No Response 21 13 8 61.90 38.10 177.4 TOTAL 1362 879 483 64.54 35.46 177.6
720 PPST Writing – 172
Total Number Number % % Indiana Number Passed Fail Pass Fail Mean
Black 44 27 17 61.36 38.64 172.9 Chicano 11 7 4 63.64 36.36 174.1 Indian 5 5 0 100.00 0.00 176.8 Asian 11 4 7 36.36 63.64 170.3 Puerto Rican 1 1 0 100.00 0.00 180.0 Other Hispanic 6 6 0 100.00 0.00 173.5 White 1233 992 241 80.45 19.55 174.9 Other 11 9 2 81.82 18.18 176.0 *No Response 19 16 3 84.21 15.79 174.6 TOTAL 1341 1067 274 79.57 20.43 174.8

11
1998-99
730 PPST Mathematics – 175
Total Number Number % % Indiana Number Passed Fail Pass Fail Mean
Black 48 15 33 31.25 68.75 171.2 Chicano 12 6 6 50.00 50.00 173.6 Indian 4 4 0 100.00 0.00 181.3 Asian 9 2 7 22.22 77.78 171.9 Puerto Rican 1 0 1 0.00 100.00 173.0 Other Hispanic 7 6 1 85.71 14.29 176.3 White 1251 822 429 65.71 34.29 177.3 Other 14 8 6 57.14 42.86 174.1 *No Response 20 12 8 60.00 40.00 176.5 TOTAL 1366 875 491 64.06 35.94 177.0

12
1998-99 Praxis I Academic Skills Assessment
711 CBT Reading Qualifying Score = 323
Total Number Number % % Indiana Number Passed Fail Pass Fail Mean
Undergraduates 778 655 123 84.19 15.81 327.6 Graduates 289 248 41 85.81 14.19 328.0 No Response 41 40 1 97.56 2.44 329.4 TOTAL 1108 943 165 85.05 14.95 327.7
721 CBT Writing Qualifying Score = 318
Total Number Number % % Indiana Number Passed Fail Pass Fail Mean
Undergraduates 738 623 115 84.42 15.58 322.2 Graduates 257 212 45 82.49 17.51 322.8 No Response 42 39 3 92.86 7.14 324.0 TOTAL 1037 874 163 84.28 15.72 322.4
731 CBT Mathematics Qualifying Score = 320
Total Number Number % % Indiana Number Passed Fail Pass Fail Mean
Undergraduates 769 553 216 71.91 28.09 323.7 Graduates 282 191 91 67.73 32.27 323.5 No Response 43 35 8 81.40 18.60 325.7 TOTAL 1094 779 315 71.21 28.79 323.7

13
1998-99 FIRST TIME EXAMINEES
711 CBT Reading – 323
Total Number Number % % Indiana Number Passed Fail Pass Fail Mean
Undergraduates 915 791 124 86.45 13.55 327.9 Graduates 326 286 40 87.73 12.27 328.5 No Response 43 41 2 95.35 4.65 329.2 TOTAL 1284 1118 166 87.07 12.93 328.1
721 CBT Writing – 318
Total Number Number % % Indiana Number Passed Fail Pass Fail Mean
Undergraduates 833 718 115 86.19 13.81 322.6 Graduates 277 238 39 85.92 14.08 323.4 No Response 45 41 4 91.11 8.89 324.2 TOTAL 1155 997 158 86.32 13.68 322.9
731 CBT Mathematics – 320
Total Number Number % % Indiana Number Passed Fail Pass Fail Mean
Undergraduates 835 629 206 75.33 24.67 324.4 Graduates 302 215 87 71.19 28.81 324.1 No Response 46 36 10 78.26 21.74 325.0 TOTAL 1183 880 303 74.39 25.61 324.3

14
1998-99 ETHNIC ONLY – TOTAL SCORES
711 CBT Reading – 323
Total Number Number % % Indiana Number Passed Fail Pass Fail Mean
Black 76 53 23 69.74 30.26 324.7 Chicano 15 10 5 66.67 33.33 325.4 Indian 2 2 0 100.00 0.00 329.5 Asian 11 10 1 90.91 9.09 328.5 Puerto Rican 6 5 1 83.33 16.67 321.5 Other Hispanic 5 5 0 100.00 0.00 329.0 White 975 843 132 86.46 13.54 328.0 Other 17 14 3 82.35 17.65 327.8 *No Response 1 1 0 100.00 0.00 323.0 TOTAL 1108 943 165 85.11 14.89 327.7
721 CBT Writing – 318
Total Number Number % % Indiana Number Passed Fail Pass Fail Mean
Black 66 42 24 63.64 36.36 319.5 Chicano 18 12 6 66.67 33.33 318.7 Indian 2 2 0 100.00 0.00 320.5 Asian 9 6 3 66.67 33.33 322.1 Puerto Rican 5 1 4 20.00 80.00 316.6 Other Hispanic 6 3 3 50.00 50.00 319.5 White 911 793 118 87.05 12.95 322.8 Other 19 15 4 78.95 21.05 321.7 *No Response 1 0 1 0.00 100.00 317.0 TOTAL 1037 874 163 84.28 15.72 322.4

15
731 CBT Mathematics – 320
Total Number Number % % Indiana Number Passed Fail Pass Fail Mean
Black 77 38 39 49.35 50.65 318.9 Chicano 18 7 11 38.89 61.11 316.8 Indian 2 0 2 0.00 100.00 315.5 Asian 9 7 2 77.78 22.22 324.6 Puerto Rican 5 0 5 0.00 100.00 312.2 Other Hispanic 5 1 4 20.00 80.00 317.4 White 959 712 247 74.24 25.76 324.4 Other 18 14 4 77.78 22.22 322.5 *No Response 1 0 1 0.00 100.00 305.0 TOTAL 1094 779 315 71.21 28.79 323.7

16
1998-1999 NTE SPECIALTY AREA TESTS
First Time Examinees Only
20010 – Education in the Elementary School Qualifying Score = 520
Total Number Number % % Mean Number Passed Fail Pass Fail Score
Undergraduates 1727 1678 49 97.16 2.84 634.7 Graduates 599 570 29 95.16 4.84 621.3 No Response 82 82 0 100.00 0.00 629.8 TOTAL 2408 2330 78 96.76 3.24 631.2
10020 – Early Childhood Education Qualifying Score = 510
Total Number Number % % Mean Number Passed Fail Pass Fail Score
Undergraduates 77 77 0 100.00 0.00 664.2 Graduates 31 31 0 100.00 0.00 650.6 No Response 5 5 0 100.00 0.00 640.0 TOTAL 113 13 0 100.00 0.00 659.4
20030 – Biology and General Science Qualifying Score = 560
Total Number Number % % Mean Number Passed Fail Pass Fail Score
Undergraduates 14 14 0 100.00 0.00 645.7 Graduates 14 12 2 85.71 14.29 640.7 No Response 2 2 0 100.00 0.00 670.0 TOTAL 30 28 2 93.33 6.67 645.0

17
10040 – English Language and Literature
Qualifying Score = 500
Total Number Number % % Mean Number Passed Fail Pass Fail Score
Undergraduates 208 201 7 96.63 3.37 592.0 Graduates 137 121 16 88.32 11.68 592.2 No Response 24 21 3 87.50 12.50 578.8 TOTAL 369 343 26 92.95 7.05 591.2
10050 – Technology Education Qualifying Score = 590
Total Number Number % % Mean Number Passed Fail Pass Fail Score
Undergraduates 13 11 2 84.62 15.38 644.6 Graduates 8 6 2 75.00 25.00 617.5 No Response 2 2 0 100.00 0.00 690.0 TOTAL 23 19 4 82.61 17.39 639.1
10060 – Mathematics Qualifying Score = 530
Total Number Number % % Mean Number Passed Fail Pass Fail Score
Undergraduates 148 138 10 93.24 6.76 650.3 Graduates 70 65 5 92.86 7.14 618.6 No Response 16 15 1 93.75 6.25 643.8 TOTAL 234 218 16 93.16 6.84 640.4

18
10080 – Social Studies Qualifying Score = 520
Total Number Number % % Mean Number Passed Fail Pass Fail Score
Undergraduates 18 15 3 83.33 16.67 600.0 Graduates 17 17 0 100.00 0.00 619.4 No Response 3 3 0 100.00 0.00 630.0 TOTAL 38 35 3 92.11 7.89 611.1
10090 – Physical Education Qualifying Score = 540
Total Number Number % % Mean Number Passed Fail Pass Fail Score
Undergraduates 80 78 2 97.50 2.50 648.8 Graduates 74 71 3 95.95 4.05 646.4 No Response 15 14 1 93.33 6.67 622.0 TOTAL 169 163 6 96.45 3.55 645.3
10100 – Business Education Qualifying Score = 480
Total Number Number % % Mean Number Passed Fail Pass Fail Score
Undergraduates 19 19 0 100.00 0.00 638.4 Graduates 39 39 0 100.00 0.00 643.1 No Response 4 4 0 100.00 0.00 652.5 TOTAL 62 62 0 100.00 0.00 642.3

19
10110 – Music Education Qualifying Score = 510
Total Number Number % % Mean Number Passed Fail Pass Fail Score
Undergraduates 94 93 1 98.94 1.06 640.5 Graduates 34 33 1 97.06 2.94 647.1 No Response 10 10 0 100.00 0.00 619.0 TOTAL 138 136 2 98.55 1.45 640.6
10120 – Home Economics Qualifying Score = 540
Total Number Number % % Mean Number Passed Fail Pass Fail Score
Undergraduates 14 12 2 85.71 14.29 607.9 Graduates 17 16 1 94.12 5.88 644.1 No Response 4 4 0 100.00 0.00 625.0 TOTAL 35 32 3 91.43 8.57 627.4
10130 – Art Education Qualifying Score = 510
Total Number Number % % Mean Number Passed Fail Pass Fail Score
Undergraduates 48 47 1 97.92 2.08 645.4 Graduates 45 42 3 93.33 6.67 643.3 No Response 3 3 0 100.00 0.00 646.7 TOTAL 96 92 4 95.83 4.17 644.5

20
10170 – French
Qualifying Score = 520
Total Number Number % % Mean Number Passed Fail Pass Fail Score
Undergraduates 13 10 3 76.92 23.08 615.4 Graduates 14 10 4 71.43 28.57 598.6 No Response 2 1 1 50.00 50.00 530.0 TOTAL 29 21 8 72.41 27.59 601.4
20180 – German Qualifying Score = 490
Total Number Number % % Mean Number Passed Fail Pass Fail Score
Undergraduates 11 7 4 63.64 36.36 510.9 Graduates 7 7 0 100.00 0.00 664.3 No Response 0 0 0 0.00 0.00 000.0 TOTAL 18 14 4 77.78 22.22 570.6
10190 – Spanish Qualifying Score = 500
Total Number Number % % Mean Number Passed Fail Pass Fail Score
Undergraduates 35 32 3 91.43 8.57 575.1 Graduates 39 36 3 92.31 7.69 601.5 No Response 2 2 0 100.00 0.00 670.0 TOTAL 76 70 6 92.11 7.89 591.2

21
10200 – Intro to the Teaching of Reading
Qualifying Score = 510
Total Number Number % % Mean Number Passed Fail Pass Fail Score
Undergraduates 16 15 1 93.75 6.25 644.4 Graduates 8 8 0 100.00 0.00 642.5 No Response 1 1 0 100.00 0.00 680.0 TOTAL 25 24 1 96.00 4.00 645.2
10220 – Speech Communication Qualifying Score = 490
Total Number Number % % Mean Number Passed Fail Pass Fail Score
Undergraduates 26 26 0 100.00 0.00 674.2 Graduates 10 10 0 100.00 0.00 690.0 No Response 4 4 0 100.00 0.00 645.0 TOTAL 40 40 0 100.00 0.00 675.3
10230 – Biology Qualifying Score = 510
Total Number Number % % Mean Number Passed Fail Pass Fail Score
Undergraduates 61 61 0 100.00 0.00 689.0 Graduates 96 92 4 95.83 4.17 711.5 No Response 17 17 0 100.00 0.00 681.8 TOTAL 174 170 4 97.70 2.30 700.7

22
20240 – Chemistry
Qualifying Score = 460
Total Number Number % % Mean Number Passed Fail Pass Fail Score
Undergraduates 34 26 8 76.41 23.53 527.1 Graduates 43 31 12 72.09 27.91 534.4 No Response 11 10 1 90.91 9.09 602.7 TOTAL 88 67 21 76.14 23.86 540.1
30260 – Physics Qualifying Score = 400
Total Number Number % % Mean Number Passed Fail Pass Fail Score
Undergraduates 12 10 2 83.33 16.67 505.8 Graduates 11 11 0 100.00 0.00 522.7 No Response 5 5 0 100.00 0.00 676.0 TOTAL 28 26 2 92.86 7.14 542.9
10310 – Library Media Specialist Qualifying Score = 530
Total Number Number % % Mean Number Passed Fail Pass Fail Score
Undergraduates 4 4 0 100.00 0.00 685.0 Graduates 15 15 0 100.00 0.00 694.7 No Response 4 4 0 100.00 0.00 730.0 TOTAL 23 23 0 100.00 0.00 699.1

23
10320 – Education of Students With Mental Retardation
Qualifying Score = 560
Total Number Number % % Mean Number Passed Fail Pass Fail Score
Undergraduates 21 18 3 85.71 14.29 616.2 Graduates 25 18 7 72.00 28.00 602.8 No Response 2 2 0 100.00 0.00 645.0 TOTAL 48 38 10 79.17 20.83 610.4
10370 – Teaching Students With Emotional Disturbance Qualifying Score = 540
Total Number Number % % Mean Number Passed Fail Pass Fail Score
Undergraduates 25 24 1 96.00 4.00 671.2 Graduates 14 13 1 92.86 7.14 665.0 No Response 0 0 0 0.00 0.00 0 TOTAL 39 37 2 94.87 5.13 669.0
10380 – Teaching Students With Learning Disabilities Qualifying Score = 430
Total Number Number % % Mean Number Passed Fail Pass Fail Score
Undergraduates 114 114 0 100.00 0.00 639.6 Graduates 46 45 1 97.83 2.17 611.1 No Response 2 2 0 100.00 0.00 610.0 TOTAL 162 161 1 99.38 0.62 631.2

24
20390 – Psychology
Qualifying Score = 480
Total Number Number % % Mean Number Passed Fail Pass Fail Score
Undergraduates 45 45 0 100.00 0.00 649.6 Graduates 51 50 1 98.04 1.96 654.5 No Response 4 4 0 100.00 0.00 645.0 TOTAL 100 99 1 99.00 1.00 651.9
10430 – General Science Qualifying Score = 450 and 360 (Physical Science)
Total Number Number % % Mean Number Passed Fail Pass Fail Score
Undergraduates 61 61 0 100.00 0.00 639.0 Graduates 60 59 1 98.33 1.67 642.2 No Response 13 13 0 100.00 0.00 639.2 TOTAL 134 133 1 99.25 0.75 640.4
20530 – Pre-Kindergarten Education Qualifying Score = 390
Total Number Number % % Mean Number Passed Fail Pass Fail Score
Undergraduates 32 32 0 100.00 0.00 724.4 Graduates 14 14 0 100.00 0.00 759.3 No Response 1 1 0 100.00 0.00 650.0 TOTAL 47 47 0 100.00 0.00 733.2
25
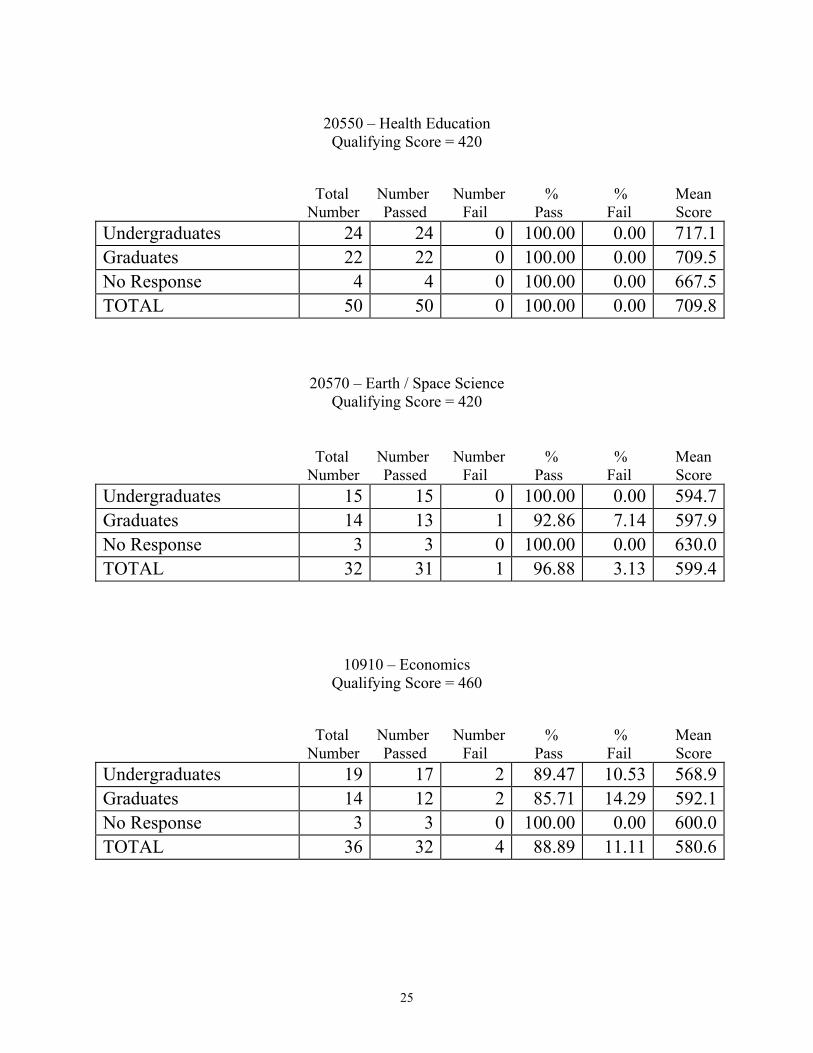
20550 – Health Education
Qualifying Score = 420 Total Number Number % % Mean Number Passed Fail Pass Fail Score
Undergraduates 24 24 0 100.00 0.00 717.1 Graduates 22 22 0 100.00 0.00 709.5 No Response 4 4 0 100.00 0.00 667.5 TOTAL 50 50 0 100.00 0.00 709.8
20570 – Earth / Space Science Qualifying Score = 420
Total Number Number % % Mean Number Passed Fail Pass Fail Score
Undergraduates 15 15 0 100.00 0.00 594.7 Graduates 14 13 1 92.86 7.14 597.9 No Response 3 3 0 100.00 0.00 630.0 TOTAL 32 31 1 96.88 3.13 599.4
10910 – Economics Qualifying Score = 460
Total Number Number % % Mean Number Passed Fail Pass Fail Score
Undergraduates 19 17 2 89.47 10.53 568.9 Graduates 14 12 2 85.71 14.29 592.1 No Response 3 3 0 100.00 0.00 600.0 TOTAL 36 32 4 88.89 11.11 580.6

26
30920 – Geography
Qualifying Score = 520
Total Number Number % % Mean Number Passed Fail Pass Fail Score
Undergraduates 54 52 2 96.30 3.70 649.4 Graduates 27 25 2 92.59 7.41 674.8 No Response 6 6 0 100.00 0.00 671.7 TOTAL 87 83 4 95.40 4.60 658.9
10930 – Government / Political Science Qualifying Score = 390
Total Number Number % % Mean Number Passed Fail Pass Fail Score
Undergraduates 94 94 0 100.00 0.00 664.5Graduates 81 81 0 100.00 0.00 684.4No Response 15 15 0 100.00 0.00 656.7TOTAL 190 190 0 100.00 0.00 672.4
20950 – Sociology Qualifying Score = 440
Total Number Number % % Mean Number Passed Fail Pass Fail Score
Undergraduates 40 40 0 100.00 0.00 663.5Graduates 45 45 0 100.00 0.00 672.7No Response 8 8 0 100.00 0.00 660.0TOTAL 93 93 0 100.00 0.00 667.6

27
1998 – 1999 New Tests – Praxis II Specialty Area Tests
1101 – Elementary Education: Curriculum, Instruction, and Assessment Qualifying Score = 143
Total Number Number % % Mean Number Passed Fail Pass Fail Score
Undergraduates 33 33 0 100.00 0.00 176.8Graduates 38 35 3 92.11 7.89 175.2No Response 6 6 0 100.00 0.00 183.2TOTAL 77 74 3 96.10 3.90 176.5
10041 – English Language. Literature & Composition: Content Knowledge
Qualifying Score = 153
Total Number Number % % Mean Number Passed Fail Pass Fail Score
Undergraduates 3 3 0 100.00 0.00 180.3 Graduates 6 5 1 83.33 16.67 182.0 No Response 3 3 0 100.00 0.00 189.7 TOTAL 12 11 1 91.67 8.33 183.5
10081 – Social Studies Content Knowledge Qualifying Score = 147
Total Number Number % % Mean Number Passed Fail Pass Fail Score
Undergraduates 8 7 1 87.50 12.50 166.0 Graduates 8 7 1 87.50 12.50 159.8 No Response 1 0 1 0.00 100.00 145.0 TOTAL 17 14 3 82.35 17.65 161.8

28
Indiana/National Means 1998-99 and 1997-98
Core Battery
FIRST TIME EXAMINEES ONLY QS Test Name 1998-99 1997-98 National Average Indiana Indiana Performance Mean Mean Range * 653 Communication 660.2 663.9 654-667 QS Test Name 1998-99 1997-98 National Average Indiana Indiana Performance Mean Mean Range * 647 General Knowledge 658.8 661.3 650-664 QS Test Name 1998-99 1997-98 National Average Indiana Indiana Performance Mean Mean Range * 646 Professional Knowledge 662.1 662.7 655-670 *Calculated on college freshmen, sophomores and juniors, from October 1995 – July 1998. From “Understanding Your Praxis Scores,” 1998-99.

29
Indiana/National Means 1998-1999
Praxis I
FIRST TIME EXAMINEES ONLY
QS Test Name 1998-99 National Average Indiana Performance Mean Range * 176 PPST Reading 177.6 174-182 323 CBT Reading 327.7 325-331 QS Test Name 1998-99 National Average Indiana Performance Mean Range * 172 PPST Writing 174.8 173-178 318 CBT Writing 322.4 320-326 QS Test Name 1998-99 National Average Indiana Performance Mean Range * 175 PPST Mathematics 177.0 173-183 320 CBT Mathematics 323.7 320-329 *Calculated on college freshmen, sophomores and juniors, from October 1996 – July 1999. From “Understanding Your Praxis Scores,” 1999-2000.

30
Indiana/National Means 1998-1999
Specialty Area Tests
FIRST TIME EXAMINEES ONLY
QS Test Name 1998-99 1997-98 National Average Mean Mean Performance Range* 510 Art Education 634.0 633.4 580-690 510 Biology 696.4 699.2 610-760 560 Biology & General Science 646.9 667.1 590-690 480 Business Education 642.3 640.0 590-670 460 Chemistry 522.5 539.0 490-630 510 Early Childhood Education
(K-3) 659.7 654.7 610-700
420 Earth/Space Science 599.4 556.9 570-700 460 Economics 566.7 582.5 490-630 520 Education in the Elementary
School 629.7 633.0 590-670
143 Elementary Education Curriculum
174.8 ---- 169-188
560 Education of Students with Mental Retardation (Severe Disabilities)
602.0 626.3 580-670
500 English Language & Literature 580.9 586.2 540-650 153 English, Language (new) 183.3 ---- 166-188 520 French 590.0 620.0 550-690 450 General Science (for Secondary
General and Physical Science) 640.0 624.2 560-710
520 Geography 654.0 646.2 600-720 490 German 554.3 578.8 530-690 390 Government/Political Science 671.8 683.9 630-750 420 Health Education 709.8 690.6 640-750 540 Home Economics 622.8 645.5 600-690 510 Intro. To the Teaching of
Reading 645.2 630.0 620-700
530 Library Media Specialist 699.1 697.3 640-710 530 Mathematics 633.4 636.9 550-660 510 Music Education 640.9 648.5 560-680 540 Physical Education 636.2 636.3 580-670 400 Physics 531.9 579.6 470-620 390 Pre-Kindergarten Education 733.8 721.3 680-770

31
(for Pre-K/Early Childhood) 480 Psychology 649.7 650.2 590-710 520 Social Studies 602.9 602.1 550-650 147 Social Studies:Content
Knowledge 160 158-179
440 Sociology 665.1 653.4 610-720 500 Spanish 577.4 569.1 520-650 490 Speech Communication 675.3 640.7 `610-720 540 Teaching Students w/Emotional
Disturbance 664.4 681.1 620-730
430 Teaching Students w/Learning Disabilities
630.8 626.9 600-720
590 Technology Education 639.1 663.5 620-690 *Calculated on college seniors, college graduates, graduate students or holders of master’s or doctoral degrees. *From “Understanding Your Praxis Scores,” 1999-2000 (or 1998-1999 for tests no longer offered)
Related Documents


