The Northeast Image Source: http://www.destinationbride.com/destination-weddings/usa/northeast Michal Adut and Tess Wendel GO 222

The Northeast Image Source: Michal Adut and Tess Wendel GO 222.
Dec 19, 2015
Welcome message from author
This document is posted to help you gain knowledge. Please leave a comment to let me know what you think about it! Share it to your friends and learn new things together.
Transcript

The Northeast
Image Source: http://www.destinationbride.com/destination-weddings/usa/northeast
Michal Adut and Tess WendelGO 222

Political culture:Individualistic States
Source, Daniel Elazar, Political Cultures of the US
Individual Political Culture Dominant Mixed with Others

Population DensityPERCENT URBAN
United States
79%
CT 87.7%
MA 91%
NJ 94.4%
NY 87.5%
2000 Census of Population and Housing, Population and Housing Unit Counts PHC-3

Population GrowthPopulation Growth: Percent Change April
2000-J uly 2006
0.064
0.037
0.029
0.017
0.014
0 0.02 0.04 0.06 0.08
U.S.
NJ
CT
NY
MA
Sta
te
Percent
Population Growth in Northeast States is Lagging
USA Today Population growth
Source U.S. Census Bureau: State and County QuickFacts. Last Revised: Friday, 25-Jul-2008 15:42:30 EDT

Population: Size of Northeastern States
Largest States
Est. Population (2007)
CT 29th 3,502,309
MA 14th 6,449,755
NJ 11th 8,685,920
NY 3rd 19,297,729
Source: Population Division, U.S. Census Bureau Release Date: December 27, 2007

Poverty
0
2
4
6
8
10
12
14
16
NY US MA NJ CT
Percent of People Below the Poverty Line
Poverty Rate National Ranking
CT 48
MA 42
NJ 47
NY 14
Source: U.S. Census Bureau,2006 American Community Survey;R1701. Percent of People Below Poverty Level in the Past 12 Months(For Whom Poverty Status is Determined): 2006using American FactFinder;

New York: Poverty and Growth
Source: Wikipedia http://en.wikipedia.org/wiki/New_York

High Income and Economic Prosperity
Source: Except as noted, U.S. Bureau of Economic Analysis, Survey of Current Business, April 2007, and earlier issues. See also<http://www.bea.gov/regional/spi>.
Per Capita Income 2006
0
10,000
20,000
30,000
40,000
50,000
60,000
U.S. NY (5) MA (3) NJ (2) CT (1)

High Tech States
Source: 2002 New Economy Index
Technology Ranking
MA 1
NJ 6
CT 7
NY 10
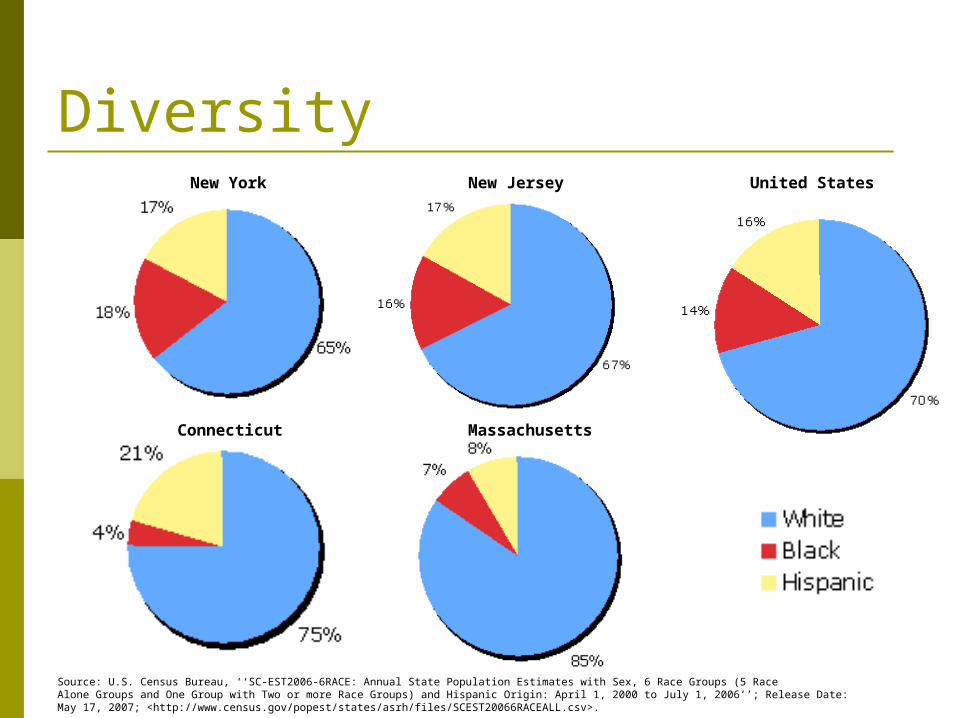
Diversity
Source: U.S. Census Bureau, ‘‘SC-EST2006-6RACE: Annual State Population Estimates with Sex, 6 Race Groups (5 RaceAlone Groups and One Group with Two or more Race Groups) and Hispanic Origin: April 1, 2000 to July 1, 2006’’; Release Date:May 17, 2007; <http://www.census.gov/popest/states/asrh/files/SCEST20066RACEALL.csv>.
New York
Connecticut
United StatesNew Jersey
Massachusetts

Source: Annual Social and Economic Supplement to the 2003 Current Population Survey http://www.epodunk.com/top10/collegeDiploma/index.html
Percent of Pop. (age 25+) with a Bachelors Degree in 2003
0
5
10
15
20
25
30
35
40
U.S. NY NJ CT MA
U.S.NYNJCTMA
Higher Education Levels

Source: NEA Research report, Rankings & Estimates: Rankings of the States 2003 and Estimates of School Statistics 2004
0
2,000
4,000
6,000
8,000
10,000
12,000
14,000
NY CT NJ MA U.S.
Current Expenditures per K-12 Student 2003-2004
State Spending on Education

Crime Levels
0
50
100
150
200
250
300
350
400
450
500
CT (37) NJ (26) NY (22) MA (20 U.S.
Estimated Violent Crimes per 100,000 people
Source: U.S. Federal Bureau of Investigation, Crime in the United States, annual. See also Table 301, Statistical Abstract of the United States, 2008.
Related Documents