The North Sea ecosystem Background report Phase 1 Living North Sea Initiative IMSA Amsterdam March 2011 LNS128_DEF

Welcome message from author
This document is posted to help you gain knowledge. Please leave a comment to let me know what you think about it! Share it to your friends and learn new things together.
Transcript
The North Sea ecosystem Background report Phase 1 Living North Sea Initiative IMSA Amsterdam March 2011 LNS128_DEF
Copyright IMSA Amsterdam Niets uit deze uitgave mag worden verveelvoudigd en/of openbaar gemaakt zonder
toestemming van IMSA Amsterdam; Not to be copied or transferred in any form without permission of IMSA Amsterdam.
2
Colophon Written by Janne van den Akker Researcher
Checked by Anne-Mette Jørgensen Director Projects
Approved by Wouter van Dieren President
Date Version/reference
21 March 2011 Version for external Review Committee (ref. LNS128_D50)
25 March 2011 Version after incorporation of comments Review Committee (ref. LNS128_DEF)
© IMSA Amsterdam The North Sea ecosystem
LNS128 3
Contents Executive summary ................................................................................................................................. 5 1. Introduction .......................................................................................................................................... 9 2. North Sea: main system characteristics and issues.....................................................................11
2.1. Main system characteristics......................................................................................................11 2.2. North Sea issues, an overview.................................................................................................14
3. Abiotic factors determining the ecosystem (physical oceanography)....................................16
3.1. Climate, water temperature, salinity and depth..................................................................16 3.2. Currents, waves, tides, stratification and fronts ..................................................................16 3.4. Sediments and locations of hard substrate ...........................................................................19 3.5. Seabed habitat map .................................................................................................................... 22
4. Biotic factors........................................................................................................................................24
4.1. An introduction to ecosystem quality, assessments and the ecosystem approach......24 4.2. Biodiversity of the North Sea...................................................................................................25 4.3. Plankton........................................................................................................................................31 4.4. Benthic species and larger invertebrates ...............................................................................32 4.5. Fish................................................................................................................................................. 34 4.6. Birds...............................................................................................................................................35 4.7. Marine mammals........................................................................................................................ 36 4.8. Plants and algae .......................................................................................................................... 38
5. External impacts (including future developments)....................................................................40
5.1. Fisheries ........................................................................................................................................40 5.2. Climate change: increased seawater temperatures and ocean acidification.................. 45 5.3. Pollution and waste from offshore and land-based sources .............................................49 5.4. Eutrophication............................................................................................................................. 50 5.5. Wind energy ................................................................................................................................ 52 5.6. Shipping........................................................................................................................................54 5.7. Oil and gas production..............................................................................................................55 5.8. Other impacts and issues ..........................................................................................................58
6. The ecosystem quality of the North Sea today............................................................................60
6.1. Graphic representation of human impacts on different ecosystem components .........60 6.2. Which pressures are having the largest impact? .................................................................62 6.3. Discussion and conclusions about North Sea quality status.............................................64 6.4. Our preliminary conclusions about the ecosystem quality of the North Sea................66 6.5. Directions for improving the ecosystem quality .................................................................66
© IMSA Amsterdam The North Sea ecosystem
LNS128 4
7. Conclusions .........................................................................................................................................68
7.1. Conclusions about the characteristics of the North Sea ecosystem .................................68 7.2. Conclusions on the ranking of external factors....................................................................68 7.3. Conclusions about the quality of the North Sea ecosystem ..............................................69
8. References and interviews ...............................................................................................................72 Appendix I. Historic maps................................................................................................................... 76 Appendix II. Background on (the assessment of) “ecosystem quality” and “biodiversity” .78 Appendix III. Possible research questions Phase 2 .........................................................................84 Appendix IV. Detailed substrate map and legends........................................................................85 Appendix V. Details habitat map EUSeaMap ................................................................................. 88 Appendix VI. Calculation of percentage of natural hard substrates in the North Sea ...........95 Appendix VII. Lists of threatened species and habitats (from OSPAR QSR 2010).................. 98 Appendix VIII. Some trials to project oil and gas platforms in other maps............................100 Appendix IX. Background on abiotic factors .................................................................................102 Appendix X. Background on species and habitats present in the North Sea .........................105 Appendix XI. Background on external human influences..........................................................111 Appendix XII. McGlade (2002) about the North Sea quality status..........................................115 Appendix XIII. Status of OSPAR Ecological Quality Objectives (EcoQOs) ............................116 Appendix XIV. Quotes from OSPAR QSR 2010 on which conclusions of Chapter 6 are based..................................................................................................................................................................118
© IMSA Amsterdam The North Sea ecosystem
LNS128 5
Executive summary
The quality of the North Sea ecosystem is negatively affected by many external pressures, such as fisheries, pollution and climate change. The Living North Sea Initiative (LiNSI) aims to investigate whether the decommissioning of oil and gas platforms can be a possible catalyst in achieving a good ecosystem quality. This process requires a good insight into the North Sea ecosystem structure and the way in which various human activities have an effect on the ecosystem. This background report (the result of desktop research and interviews with experts) contributes to providing that insight. It comprises a compilation and analysis of information from many different sources, including reports and articles. Its objectives are: • to promote the understanding of the North Sea ecosystem • to discuss the relative impact of various human activities on the ecosystem, including
the effects of oil and gas production • to discuss the ecosystem quality, and • to indicate important knowledge gaps.
Key findings about the characteristics of the North Sea ecosystem
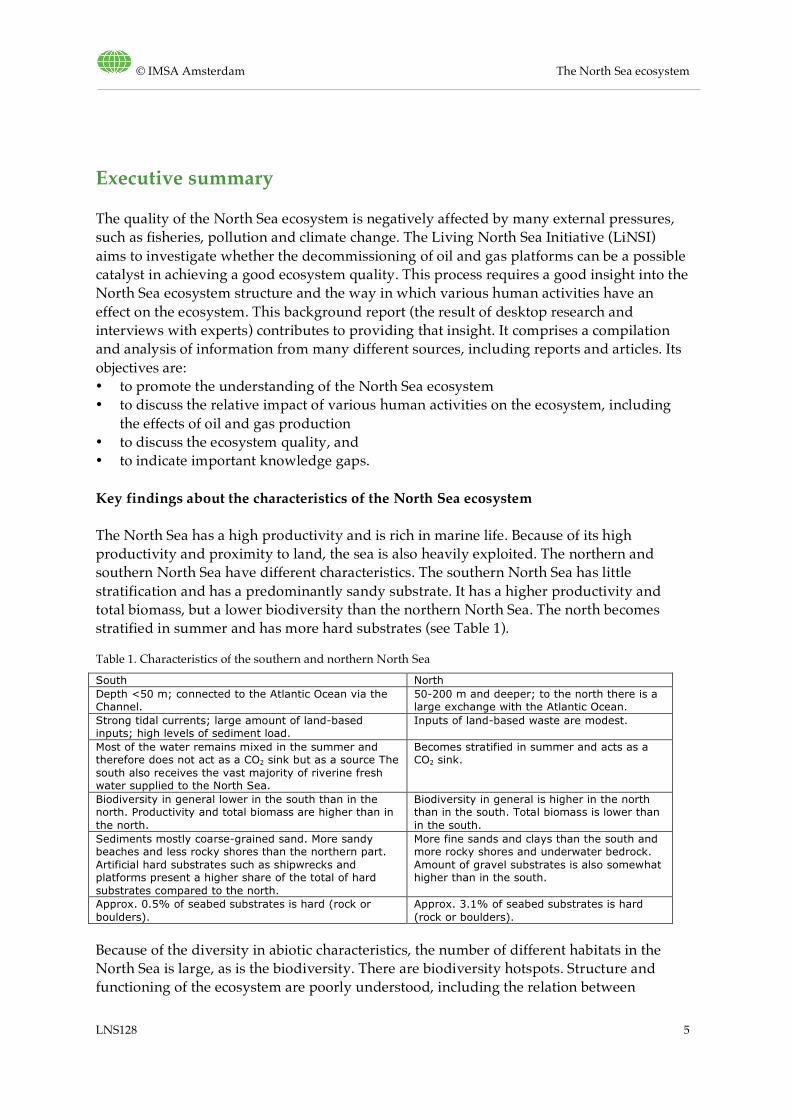
The North Sea has a high productivity and is rich in marine life. Because of its high productivity and proximity to land, the sea is also heavily exploited. The northern and southern North Sea have different characteristics. The southern North Sea has little stratification and has a predominantly sandy substrate. It has a higher productivity and total biomass, but a lower biodiversity than the northern North Sea. The north becomes stratified in summer and has more hard substrates (see Table 1). Table 1. Characteristics of the southern and northern North Sea
South North Depth <50 m; connected to the Atlantic Ocean via the Channel.
50-200 m and deeper; to the north there is a large exchange with the Atlantic Ocean.
Strong tidal currents; large amount of land-based inputs; high levels of sediment load.
Inputs of land-based waste are modest.
Most of the water remains mixed in the summer and therefore does not act as a CO2 sink but as a source The south also receives the vast majority of riverine fresh water supplied to the North Sea.
Becomes stratified in summer and acts as a CO2 sink.
Biodiversity in general lower in the south than in the north. Productivity and total biomass are higher than in the north.
Biodiversity in general is higher in the north than in the south. Total biomass is lower than in the south.
Sediments mostly coarse-grained sand. More sandy beaches and less rocky shores than the northern part. Artificial hard substrates such as shipwrecks and platforms present a higher share of the total of hard substrates compared to the north.
More fine sands and clays than the south and more rocky shores and underwater bedrock. Amount of gravel substrates is also somewhat higher than in the south.
Approx. 0.5% of seabed substrates is hard (rock or boulders).
Approx. 3.1% of seabed substrates is hard (rock or boulders).
Because of the diversity in abiotic characteristics, the number of different habitats in the North Sea is large, as is the biodiversity. There are biodiversity hotspots. Structure and functioning of the ecosystem are poorly understood, including the relation between
© IMSA Amsterdam The North Sea ecosystem
LNS128 6
organisms and oceanography. This makes an assessment of ecosystem quality more difficult. The North Sea ecosystem is rather unique in that it is a large area of shallow sea (apart from the most northern part) with large parts of sandy substrate. This poses the (in this report still unanswered) question whether additional hard substrates such as oil and gas platforms should be seen as positive because they add a habitat that is not abundant, or negative because the large amount of sandy substrate is part of what makes the North Sea unique. The nature of the sediment is, however, not the only factor determining fauna distribution; aspects such as water temperature, salinity and tidal stress also play an important role.
Key findings on the ranking and trends of external factors
A full ranking of the impact of the different sectors and activities in the North Sea cannot yet be made. From OSPAR (2010) and other sources it is clear that fisheries (trawling and other types of fisheries) have the largest impact. However, there are signs that this impact is decreasing. Sand dredging is less damaging than fisheries but more damaging than oil and gas exploration, and expected to increase. The oil and gas sector is one of a fairly large group of moderate impacts and expected to decrease because of decommissioning. Next to negative impacts, it has the positive impact of adding a hard substrate habitat that is otherwise quite rare in major parts of the North Sea, especially in the south. Furthermore, the total impact of the oil and gas sector is expected to decrease because of decommissioning. Other decreasing impacts are pollution and eutrophication, while the effects of tourism, offshore renewable energy and mariculture are expected to increase. The different effects of shipping show a mixed picture. Climate change is also having an important impact and this factor is increasing. Seawater warming is causing biodiversity to change; changing wind forces alter stratification. Ocean acidification, if worsening, is a most threatening effect of the increase in atmospheric CO2 concentration. The OSPAR Quality Status Report 2010 concludes: “The main pressures on North Sea biodiversity and ecosystem health are the removal of target and non-target species, loss of and damage to habitats, the introduction of non-native species, obstacles to species migration and poor water quality. All can act in synergy with or be exacerbated by climate change.”
Key findings about the quality of the North Sea ecosystem
OSPAR is developing an ecosystem quality status assessment system, but it is not yet complete. Therefore, OSPAR has only formulated a quality status assessment per ecosystem component and not for the North Sea as a whole. The status was only assessed as good for seals and the deeper deep-sea habitats. Shallow sediment habitats scored poor; all other components scored moderate (fish, seabirds, rock and biogenic reef habitats, shelf sediment habitats and the upper part of deep sea habitats). Given the many moderate-
© IMSA Amsterdam The North Sea ecosystem
LNS128 7
scoring ecosystem components, we assume the North Sea as a whole is also in a moderate state. ”Ecosystem quality” in the above does not yet contain information about ecosystem functioning. The functional aspects of the ecosystem are much less well monitored than aspects like the abundance of protected species. In other words: we now know that the ecosystem quality is only moderate and not good, but we don’t know whether this also means that the ecosystem functions less well than it used to do. Therefore we can't judge whether there is a loss of resilience, ecosystem stability or ecosystem services. The OSPAR Quality Status Report 2010 does not make any general statement about the trend in quality of the North Sea ecosystem. However, it does mention a number of observations. • Species and habitats that used to be abundant in the past are now declining. But this
does not necessarily mean that the biodiversity is in decline. At the same time many new species have colonized the North Sea, introduced by ballast water or migrating from the south because of seawater warming. Additionally, humans have created new habitats and some of the human pressures show trends towards improvement. The Quality Status Report does not pronounce upon the net change in biodiversity. Because of the many new species, it is likely that biodiversity in the North Sea is merely changing, or perhaps even increasing. The fact remains, however, that it is mostly the more vulnerable habitats and the more vulnerable, long-lived species which make high demands upon their environment, that are in decline. Because of this, OSPAR righteously pays much attention to the conservation of these species and habitats. We found one author who concludes there has been a decline in biodiversity and especially in trophic stability. She suggests the latter could be indicative of a trend towards decreasing resilience.
• Human pressures are large, and the quality of the ecosystem is now worse than it used to be some decennia ago. Some human pressures are further increasing, but there are others that are decreasing. Therefore, at this moment it is hardly possible to give an indication as to whether the quality of the ecosystem is in a net decline or not.
We estimate that the North Sea ecosystem has been in decline over the past decennia (especially since the start of large-scale trawling and industrial fishing); that the situation is still very serious (many endangered and declining species and habitats; a moderate total quality assessment score); but that there are signs of improvement on certain aspects. Research in the coming years will have to show whether the decline in species and habitats also means a degradation of the ecosystem as a whole or not (including loss of ecosystem functions and/or decreasing resilience and loss of ecosystem services), and whether the decline is now perhaps slowing down. Is the present state of the North Sea reason for concern and, as a consequence, action? We think so. The direct negative effects of the human pressures on the ecosystem already are a good reason to aim for a decrease of these human pressures. Given the many changes observed, plus the threat of global warming and ocean acidification, the risk of a deteriorated ecosystem functioning and loss of services is real. After this first phase of research, our impression is that the OSPAR process of assessment, using the Ecosystem approach and the set of EcoQOs, is useful and should be supported.
© IMSA Amsterdam The North Sea ecosystem
LNS128 8
However, it may be that we want to take certain actions in the scope of the LiNSI project before the final assessment, necessary for the EU Marine Strategy Assessment, is finalised. How to handle this should be discussed before starting Phase 2, in order to prevent starting off research while the OSPAR process is to deliver the answers in a later stage. Other important research questions for Phase 2 are the following. • Are there consequences of human pressures and climate change for ecosystem
functioning and ecosystem services? And what are the consequences of causing further damage or of not improving the quality of the system?
• Can we reach a reasonable level of consensus about the impact of the various human activities and about solutions from an ecosystem perspective?
© IMSA Amsterdam The North Sea ecosystem
LNS128 9
1. Introduction
The quality of the North Sea ecosystem is negatively affected by many external pressures, such as fisheries, pollution and climate change. The Living North Sea Initiative (LiNSI) aims to investigate whether the decommissioning of oil and gas platforms can be a possible catalyst in achieving a good ecosystem quality. This process requires a good insight into the North Sea ecosystem structure and the way in which the various human activities in and around the sea have an effect on the ecosystem. This background report contributes to providing that insight. The report comprises a compilation and analysis of information from many different sources, including reports and articles. Its scope is threefold: • to promote the understanding of the North Sea ecosystem • to discuss the relative impact of various human activities on the ecosystem, including
the effects of oil and gas production, and • to discuss the ecosystem quality. For the Inventory Phase of LiNSI, a total of four background documents have been produced. The other three are: • Decommissioning of North Sea oil and gas facilities – An introductory assessment of
potential impacts, costs and opportunities; Background report Phase 1 Living North Sea Initiative (LNS200, IMSA Amsterdam, 2011b)
• Ecosystems associated with North Sea oil and gas facilities and the impact of decommissioning options – With attention for local and regional effects; Background report Phase 1 Living North Sea Initiative (LNS214, IMSA Amsterdam, 2011c)
• North Sea legal and policy framework – A dynamic document; Background report Phase 1 Living North Sea Initiative (LNS130, IMSA Amsterdam, 2011d).
Detailed information on decommissioning, law and regulation, and about ecosystems around hard substrates can be found in these three reports.
Problem description
The North Sea is a relatively rich temperate sea because it receives nutrients from land run-off and from oceanic inflow from the Atlantic. A large part of the sea is shallow and receives much light. Its high productivity and the proximity of land make it economically important and heavily exploited. In some of its coastal areas there are more than 500 people per km2, and intensive farming covers up to 70% of the land that drains into the North Sea (OSPAR, 2010). Several studies, for example the recent OSPAR Quality Status Report (OSPAR, 2010), indicate that the quality of the North Sea ecosystem has deteriorated over the past century, largely as a result of human pressures. If we want to repair and limit the damage to the ecosystem and take a new route of more careful use of the sea, we need to have a good insight in the structure and functioning of the ecosystem and the ways in which it is impacted by human activities.
© IMSA Amsterdam The North Sea ecosystem
LNS128 10
Objectives
• To provide a brief introduction into relevant ecological aspects of the North Sea ecosystem, including its structure and functioning, with extra attention for seabed substrates and hard habitats because of the relation with decommissioning of oil and gas platforms.
• To give an overview of the most important external human influences on the ecosystem, and explain their impact.
• To estimate the trends in these human influences and give a rough estimation of which impacts are relatively large.
• To discuss whether the North Sea ecosystem is of “good quality” or not. • To indicate important knowledge gaps.
Study approach and research questions
The input for this study consisted of desktop research and interviews with experts. Questions that are discussed are: What are the characteristics of the North Sea ecosystem? Which habitats does it provide for which species? Is the ecosystem in a “healthy” state? How does this relate to the “Good Environmental Status” in the European Marine Strategy Framework Directive? Which external factors have a negative impact? What are the most important issues, trends and future perspectives, especially with regard to biodiversity and nature values? How certain are we about the development of the trends? What are important areas with regard to nature and biodiversity?
Report outline
After a brief overview of system characteristics and issues in Chapter 2, we discuss the abiotic factors of the ecosystem in more detail in Chapter 3. Chapter 4 deals with the biotic factors (and their interaction with the abiotic environment) and has a special section about the concepts of ecosystem quality and biodiversity. Chapter 5 describes the external impacts to the North Sea ecosystem including possible future developments. Chapter 6 discusses the ecosystem quality of the North Sea as a whole and the trends that can be observed. It includes a preliminary graphic representation of the parts of the ecosystem on which the various human activities have their main influence, and a discussion on which external impacts are largest. In Chapter 7 conclusions are drawn. The report ends with a number of appendices, among which a list of remaining knowledge gaps after Phase 1.
Main information source
One report has been a major source of information for this background report: the OSPAR Quality Status Report 2010 (or “QSR”). This report is intended to provide a major component of the initial assessment that EU Member States are required to prepare under the EU Marine Strategy Framework Directive. The QSR 2010 examines all aspects of human influence on the seas in the OSPAR area, of which the North Sea is one, including contaminants, nutrient pollution, the effects of human activities such as the offshore oil and gas industry and offshore wind farms, and emerging threats like climate change.
© IMSA Amsterdam The North Sea ecosystem
LNS128 11
2. North Sea: main system characteristics and issues
2.1. Main system characteristics
A unique, biodiverse and productive ecosystem
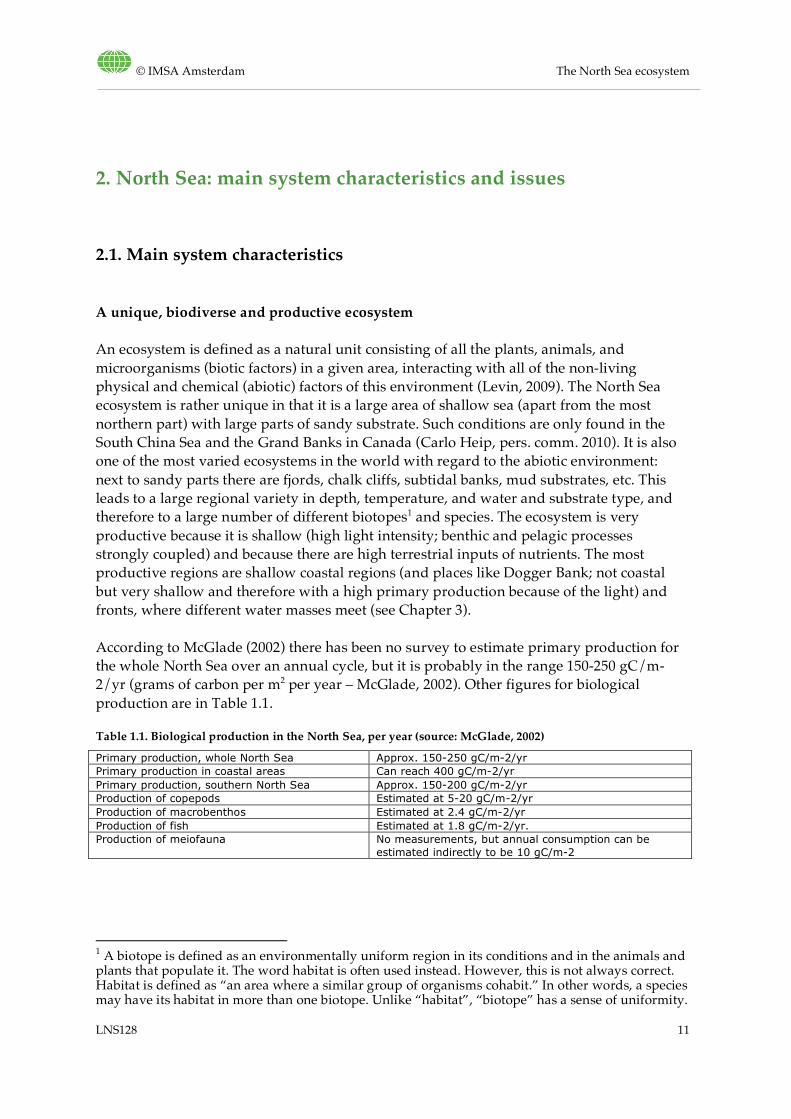
An ecosystem is defined as a natural unit consisting of all the plants, animals, and microorganisms (biotic factors) in a given area, interacting with all of the non-living physical and chemical (abiotic) factors of this environment (Levin, 2009). The North Sea ecosystem is rather unique in that it is a large area of shallow sea (apart from the most northern part) with large parts of sandy substrate. Such conditions are only found in the South China Sea and the Grand Banks in Canada (Carlo Heip, pers. comm. 2010). It is also one of the most varied ecosystems in the world with regard to the abiotic environment: next to sandy parts there are fjords, chalk cliffs, subtidal banks, mud substrates, etc. This leads to a large regional variety in depth, temperature, and water and substrate type, and therefore to a large number of different biotopes1 and species. The ecosystem is very productive because it is shallow (high light intensity; benthic and pelagic processes strongly coupled) and because there are high terrestrial inputs of nutrients. The most productive regions are shallow coastal regions (and places like Dogger Bank; not coastal but very shallow and therefore with a high primary production because of the light) and fronts, where different water masses meet (see Chapter 3). According to McGlade (2002) there has been no survey to estimate primary production for the whole North Sea over an annual cycle, but it is probably in the range 150-250 gC/m-2/yr (grams of carbon per m2 per year – McGlade, 2002). Other figures for biological production are in Table 1.1. Table 1.1. Biological production in the North Sea, per year (source: McGlade, 2002)
Primary production, whole North Sea Approx. 150-250 gC/m-2/yr Primary production in coastal areas Can reach 400 gC/m-2/yr Primary production, southern North Sea Approx. 150-200 gC/m-2/yr Production of copepods Estimated at 5-20 gC/m-2/yr Production of macrobenthos Estimated at 2.4 gC/m-2/yr Production of fish Estimated at 1.8 gC/m-2/yr. Production of meiofauna No measurements, but annual consumption can be
estimated indirectly to be 10 gC/m-2
1 A biotope is defined as an environmentally uniform region in its conditions and in the animals and plants that populate it. The word habitat is often used instead. However, this is not always correct. Habitat is defined as “an area where a similar group of organisms cohabit.” In other words, a species may have its habitat in more than one biotope. Unlike “habitat”, “biotope” has a sense of uniformity.
© IMSA Amsterdam The North Sea ecosystem
LNS128 12
As a whole, the North Sea ecosystem has a high production but also a high total biomass and a high biodiversity. There are also several biodiversity hotspots; these will be discussed in Chapter 4.2. Biodiversity has been decreasing since the Middle Ages, especially since the start of industrialised fishing in the early 20th century (WWF, 2010). Apart from having a high production and high biodiversity, the North Sea ecosystem functions as a CO2 buffer and it has a role in climate regulation. Knowledge about the biodiversity of the marine ecosystems of the OSPAR area and its interactions with ocean dynamics and human activities is still limited (OSPAR, 2010).
Size and borders
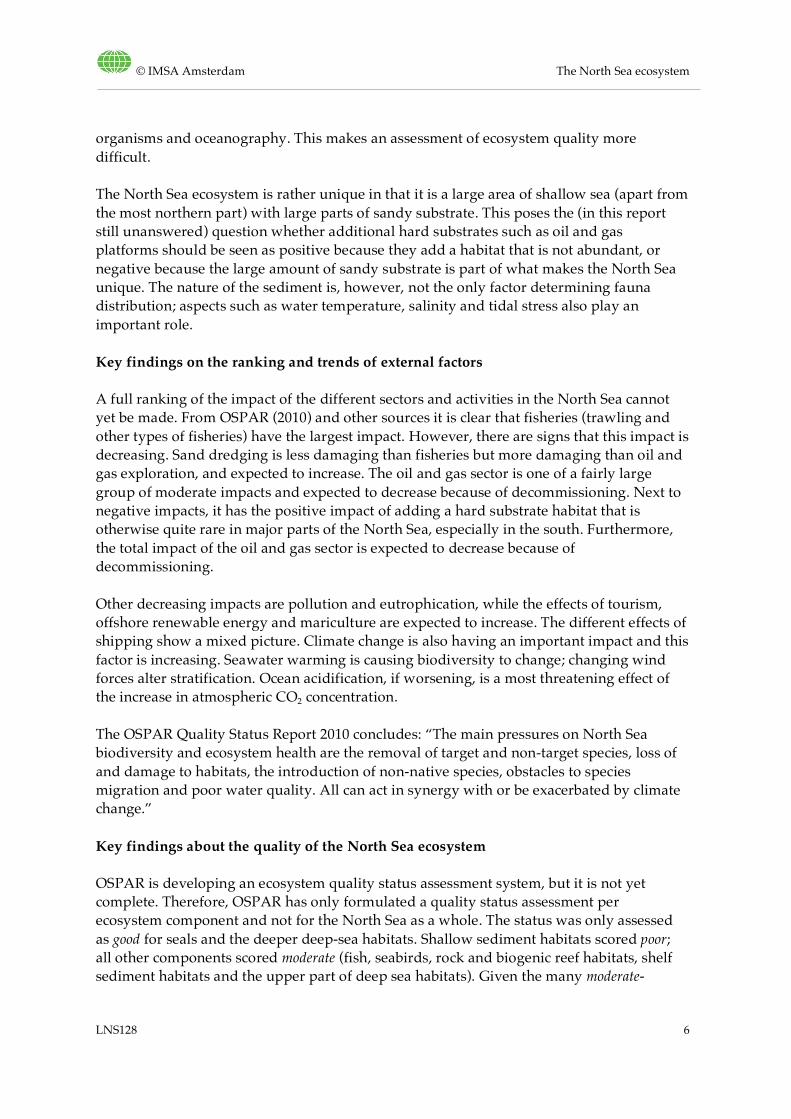
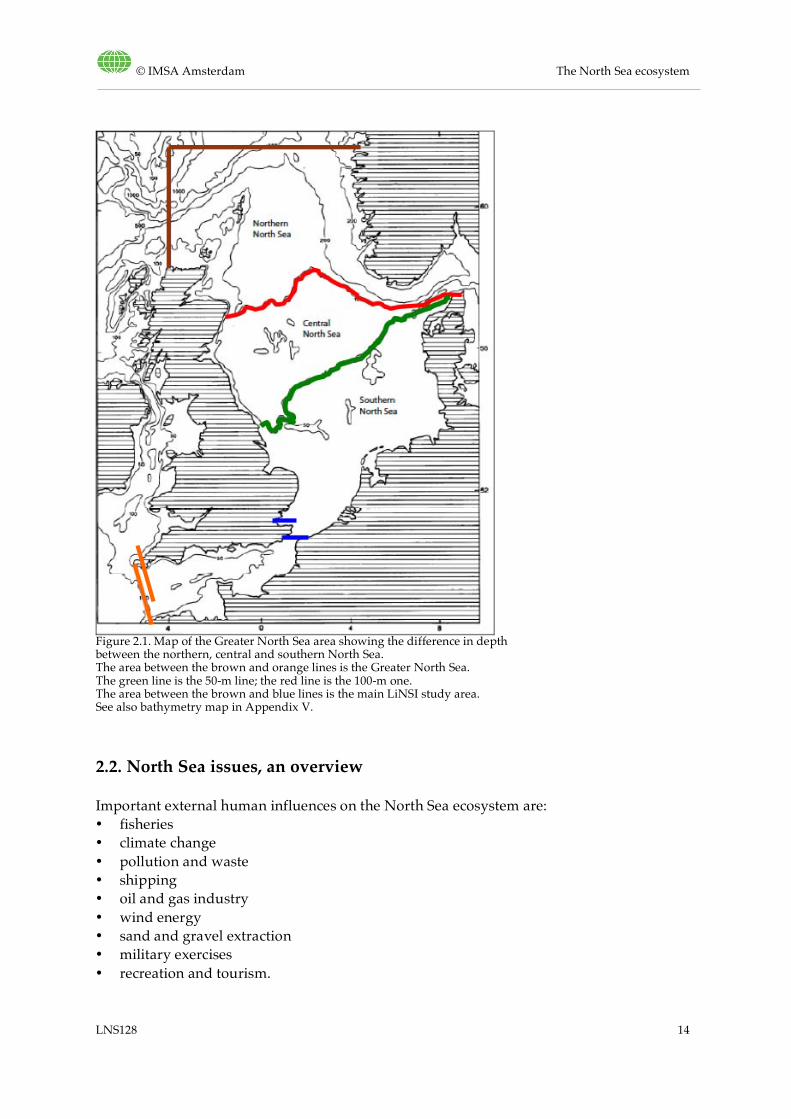
The great majority of data in this LiNSI background report come from either the OSPAR Quality Status Reports (2000 and 2010) or from McGlade (2002). These three sources define the North Sea as “Greater North Sea” (or “OSPAR Region II”) and “North Sea Large Marine Ecosystem” respectively. This means they include the English Channel, Skagerrak and Kattegat, and a small area to the northeast of the Shetland Islands. Other authors often define the North Sea as without the extra areas mentioned (one could call this the “North Sea proper”). In this background report we have decided to use the definition of OSPAR and McGlade, unless explicitly stated otherwise. The Greater North Sea measures 740,000 km2 and has a volume of 94,000 km3. (The North Sea proper measures approx. 575,300 km2 (ICES, fish map, downloaded 2011)). The east and west borders of the North Sea are the coastline of Great Britain and the European Continent. The northern border is defined as a vertical line from North-Scotland to a spot to the right of the Faroe Islands, and then horizontally to Norway (at 62°N). The southern border is the French coastline until the end of the English Channel. See Figure 2.1 for a map. In the LiNSI project the Channel and Kattegat do not get major attention because there are no oil and gas installations. The main LiNSI study area is also shown in Figure 2.1. There are eight countries bordering the North Sea: the United Kingdom, Norway, Denmark, Sweden, Germany, the Netherlands, Belgium and France.
North and south are different
The northern and the southern North Sea differ in several aspects. In this study we distinguish two main regions. • The southern North Sea, with a depth up to approximately 50 m, including the Dogger
Bank. • The northern North Sea, from 50 m down to the continental slope. In the northern
North Sea there are parts with even much larger depths; the Norwegian trench reaches to 270 m and the Skagerrak to 700 m.
In some studies, and also in IMSA Amsterdam (2011c) the transitional zone from 50 to 100 m depth is discussed separately as “central North Sea”. This is shown in Figure 2.1. Another bathymetry map (in colour) is included in Appendix V. As the great majority of reports and papers that served as input for our report use a north-south division (or no division at all), we do not discuss the central part separately.
© IMSA Amsterdam The North Sea ecosystem
LNS128 13
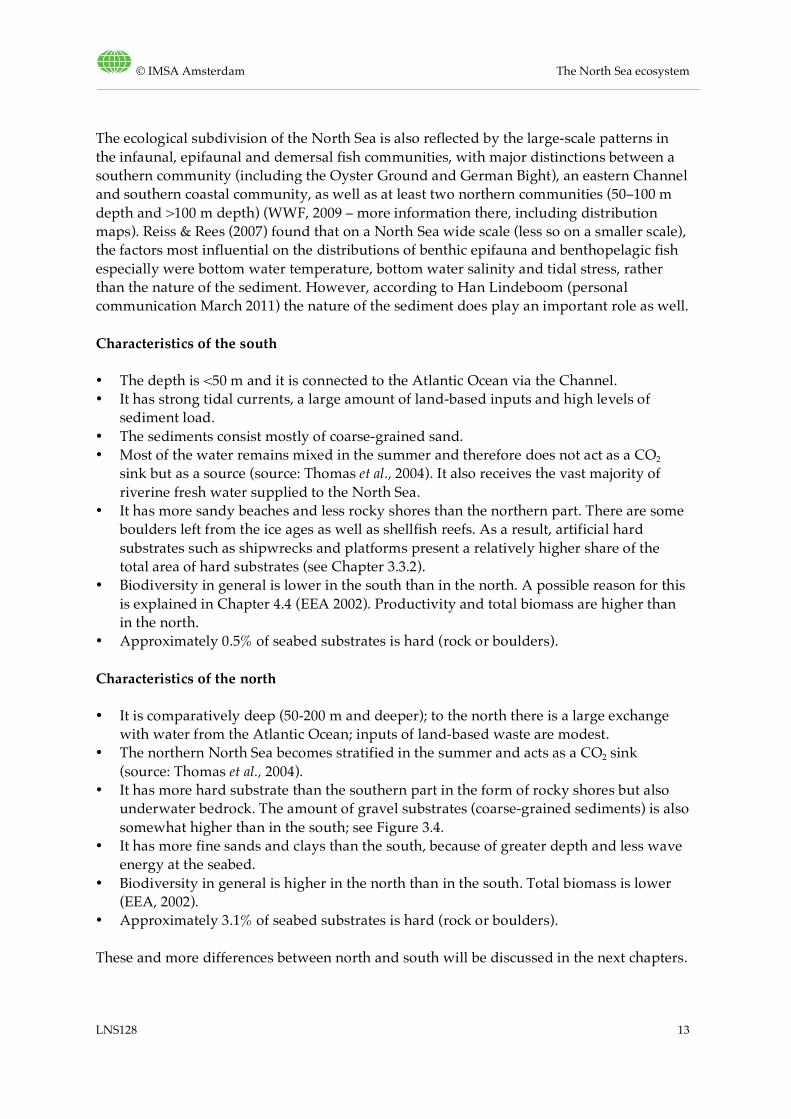
The ecological subdivision of the North Sea is also reflected by the large-scale patterns in the infaunal, epifaunal and demersal fish communities, with major distinctions between a southern community (including the Oyster Ground and German Bight), an eastern Channel and southern coastal community, as well as at least two northern communities (50–100 m depth and >100 m depth) (WWF, 2009 – more information there, including distribution maps). Reiss & Rees (2007) found that on a North Sea wide scale (less so on a smaller scale), the factors most influential on the distributions of benthic epifauna and benthopelagic fish especially were bottom water temperature, bottom water salinity and tidal stress, rather than the nature of the sediment. However, according to Han Lindeboom (personal communication March 2011) the nature of the sediment does play an important role as well.
Characteristics of the south
• The depth is <50 m and it is connected to the Atlantic Ocean via the Channel. • It has strong tidal currents, a large amount of land-based inputs and high levels of
sediment load. • The sediments consist mostly of coarse-grained sand. • Most of the water remains mixed in the summer and therefore does not act as a CO2
sink but as a source (source: Thomas et al., 2004). It also receives the vast majority of riverine fresh water supplied to the North Sea.
• It has more sandy beaches and less rocky shores than the northern part. There are some boulders left from the ice ages as well as shellfish reefs. As a result, artificial hard substrates such as shipwrecks and platforms present a relatively higher share of the total area of hard substrates (see Chapter 3.3.2).
• Biodiversity in general is lower in the south than in the north. A possible reason for this is explained in Chapter 4.4 (EEA 2002). Productivity and total biomass are higher than in the north.
• Approximately 0.5% of seabed substrates is hard (rock or boulders).
Characteristics of the north
• It is comparatively deep (50-200 m and deeper); to the north there is a large exchange with water from the Atlantic Ocean; inputs of land-based waste are modest.
• The northern North Sea becomes stratified in the summer and acts as a CO2 sink (source: Thomas et al., 2004).
• It has more hard substrate than the southern part in the form of rocky shores but also underwater bedrock. The amount of gravel substrates (coarse-grained sediments) is also somewhat higher than in the south; see Figure 3.4.
• It has more fine sands and clays than the south, because of greater depth and less wave energy at the seabed.
• Biodiversity in general is higher in the north than in the south. Total biomass is lower (EEA, 2002).
• Approximately 3.1% of seabed substrates is hard (rock or boulders). These and more differences between north and south will be discussed in the next chapters.
© IMSA Amsterdam The North Sea ecosystem
LNS128 14
Figure 2.1. Map of the Greater North Sea area showing the difference in depth between the northern, central and southern North Sea. The area between the brown and orange lines is the Greater North Sea. The green line is the 50-m line; the red line is the 100-m one. The area between the brown and blue lines is the main LiNSI study area. See also bathymetry map in Appendix V.
2.2. North Sea issues, an overview
Important external human influences on the North Sea ecosystem are: • fisheries • climate change • pollution and waste • shipping • oil and gas industry • wind energy • sand and gravel extraction • military exercises • recreation and tourism.
© IMSA Amsterdam The North Sea ecosystem
LNS128 15
Of all these external factors, fisheries have the biggest impact; they may even be the primary driving force of the ecosystem (Sherman & Hempel, 2009, even state that they are “the driving force”) – in the sense that fisheries are a major factor determining ecosystem structure, energy flows and functions. There are signs that fishing pressure is now declining, but its negative influence remains very large (see paragraph 5.1). Climate change is a threat the effects of which are likely to become increasingly visible: the North Sea is the second fastest warming large marine ecosystem in the world, only after the Baltic Sea (Sherman & Hempel, 2009). Climate change leads to shifts in temperature zones, oxygen depletion zones and ocean acidification, all impacting marine organisms. Other important North Sea issues are pollution and waste (plastic, toxins, nitrate from agricultural land leading to eutrophication, etc.), shipping (ballast water, accidents), oil and gas industry, wind energy, sand dredging, defence exercises and some smaller impacts, all explained in more detail in Chapter 5. Some impacts are increasing (sand dredging, wind energy); some decreasing (eutrophication, some other forms of pollution); while some vary (shipping causes less water pollution but more air pollution, more noise and collisions with sea mammals). Chapter 5 explains what work has already been done with regard to assessing the relative weight of the various external impacts on different parts of the ecosystem. The greatest pressure from humans in the North Sea is in the eastern and southern parts of the region (OSPAR, 2010). Many of the external impacts are closely interlinked. A good example is the case of the British kittiwake decrease. Kittiwakes (Rissa tridactyla, or “drieteenmeeuw” in Dutch) are a common bird around the North Sea. In the UK, oceanographic change, warming seawaters and increased fishing pressure on the main prey of the birds (sandeel) seem2 to have worked together to strongly decrease bird numbers. It is therefore also very difficult to establish a clear linking mechanism with fisheries or with climate change. OSPAR (2010) gives a good description of this case in box 10.5. Apart from external pressures, other issues that play a role in the North Sea are the complex definition and calculation of “biodiversity” (see 4.1 and Appendix II), the difficulty to distinguish between the large natural variability and long-term human-induced changes, and the fragmentation of research data. The movement of water masses in the North Sea is very complex. This is one reason that makes the North Sea difficult to study. There are a lot of ecological data, but mostly on very specialised topics. A detailed study of the food web structure is not available. However, fish data are available (from the fisheries sector and fisheries research); the impact of climate change is being researched with increasing intensity; and there is a good knowledge of benthic fauna and birds, but a relatively poor knowledge of sea mammals. Furthermore, the knowledge available is not always in relation to the system as a whole. See also Chapter 5.8 about lack of data.
2 Not all scientists are fully convinced of these relationships. Pers. Comm. Ian Boyd, March 2011.
© IMSA Amsterdam The North Sea ecosystem
LNS128 16
3. Abiotic factors determining the ecosystem (physical oceanography)
The biodiversity in a marine ecosystem is strongly influenced by the abiotic environment, because this determines for a large part conditions such as the availability of nutrients, breeding grounds and the timing of life cycles. In other words, abiotic factors determine which species can find a habitat on which locations. They also have a large influence on plankton, the basis of the marine ecosystem. Abiotic factors that are of large importance are substrate, depth, chemical composition of the water, tides and currents (as these bring waters with different composition and temperature into the North Sea and influence – via stratification or mixing – nutrient availability), the presence of fronts, and atmospheric variability. McGlade (2002) and ICES (2006) give a very complete explanation of these complex abiotic features and processes that strongly influence biodiversity. The paragraphs below present a short overview. The chapter ends with a “predictive habitat map” of the North Sea seabed. The influences of the changing climate on abiotic aspects of the North Sea ecosystem are included in Appendix III (Possible research questions for Phase 2).
3.1. Climate, water temperature, salinity and depth
The North Sea (except the deep Norwegian coastal waters) belongs to the cool-temperate Boreal biogeographic zone. This region has a temperate climate with four seasons. Surface water temperatures vary between 0 and 20 °C, depending on the season and the part of the sea, with less variation in the North. In the open sea salinity is quite constant (32-34.5 promille). In coastal areas the variation is much greater: Skagerrak 25-34 promille and Wadden Sea less than 30 promille. Like temperature, salinity varies at annual, seasonal and decadal scales. Temperature and salinity (and their variability) influence the species of organisms that are present, because different species are adapted to different salt concentrations and temperature ranges. Bottom water temperatures and bottom water salinity, together with tidal stress have been found by Reiss & Rees (2007) to be the factors most influential on the distributions of benthic epifauna and benthopelagic fish, even more important than the nature of the sediment. The largest part of the North Sea is on the continental shelf, with a mean depth of 90 m. The Norwegian trench is an exception, with a maximum depth of 725 m (EEA 2002).
3.2. Currents, waves, tides, stratification and fronts
Water movements in the North Sea are complex. There are oceanic influences from the north and south. There is a seasonal cycle, but periods of years occur which deviate from the normal pattern, for example due to the North Atlantic Oscillation. Apart from tides and wind, also bottom topography influences these circulation patterns. Circulation patterns, in
© IMSA Amsterdam The North Sea ecosystem
LNS128 17
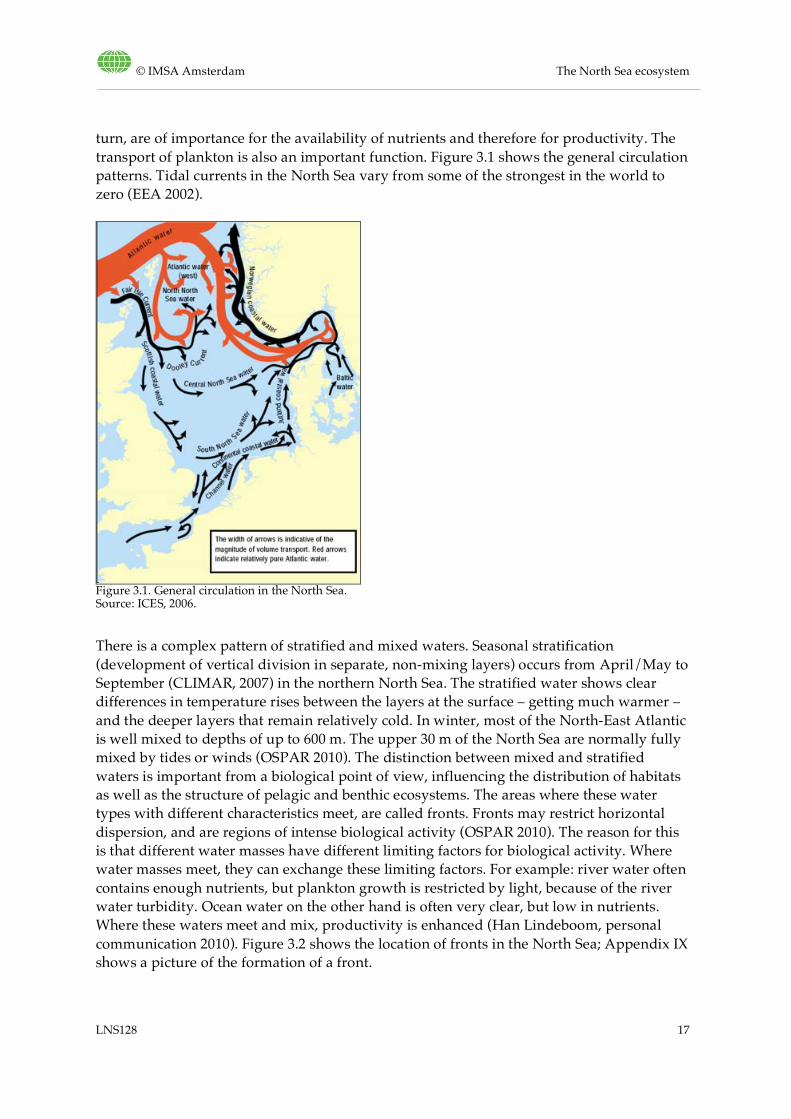
turn, are of importance for the availability of nutrients and therefore for productivity. The transport of plankton is also an important function. Figure 3.1 shows the general circulation patterns. Tidal currents in the North Sea vary from some of the strongest in the world to zero (EEA 2002).
Figure 3.1. General circulation in the North Sea. Source: ICES, 2006.
There is a complex pattern of stratified and mixed waters. Seasonal stratification (development of vertical division in separate, non-mixing layers) occurs from April/May to September (CLIMAR, 2007) in the northern North Sea. The stratified water shows clear differences in temperature rises between the layers at the surface – getting much warmer – and the deeper layers that remain relatively cold. In winter, most of the North-East Atlantic is well mixed to depths of up to 600 m. The upper 30 m of the North Sea are normally fully mixed by tides or winds (OSPAR 2010). The distinction between mixed and stratified waters is important from a biological point of view, influencing the distribution of habitats as well as the structure of pelagic and benthic ecosystems. The areas where these water types with different characteristics meet, are called fronts. Fronts may restrict horizontal dispersion, and are regions of intense biological activity (OSPAR 2010). The reason for this is that different water masses have different limiting factors for biological activity. Where water masses meet, they can exchange these limiting factors. For example: river water often contains enough nutrients, but plankton growth is restricted by light, because of the river water turbidity. Ocean water on the other hand is often very clear, but low in nutrients. Where these waters meet and mix, productivity is enhanced (Han Lindeboom, personal communication 2010). Figure 3.2 shows the location of fronts in the North Sea; Appendix IX shows a picture of the formation of a front.
© IMSA Amsterdam The North Sea ecosystem
LNS128 18
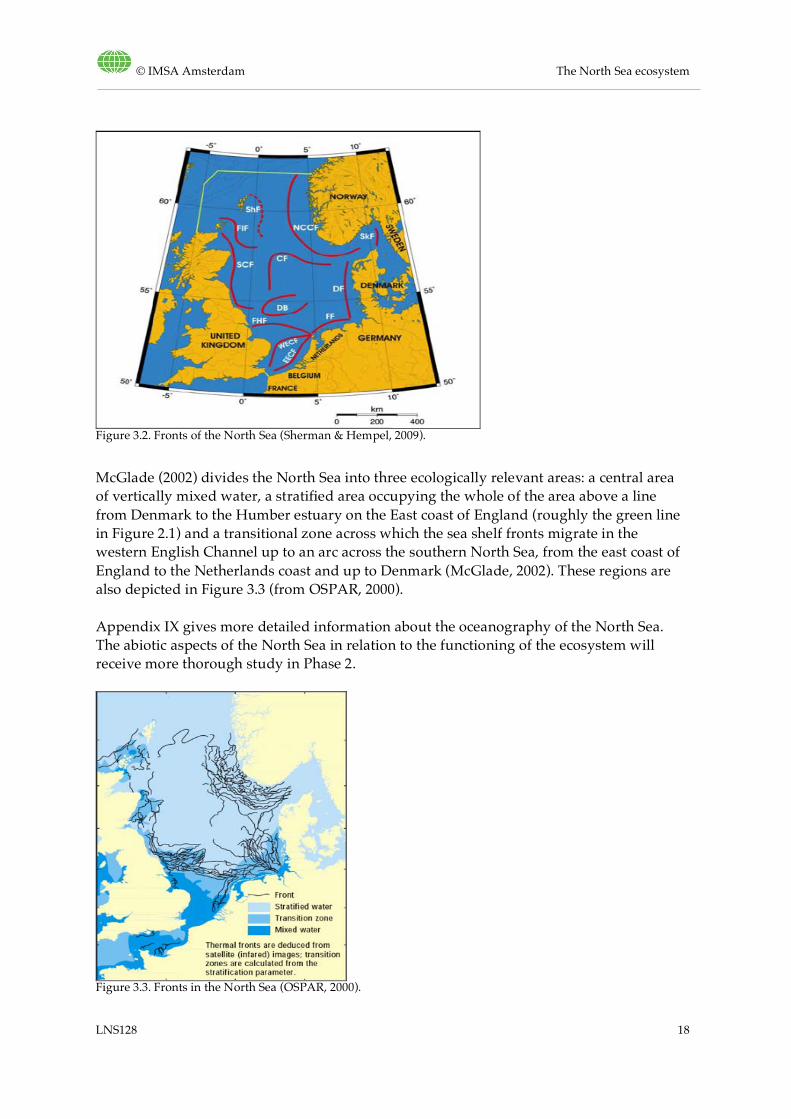
Figure 3.2. Fronts of the North Sea (Sherman & Hempel, 2009).
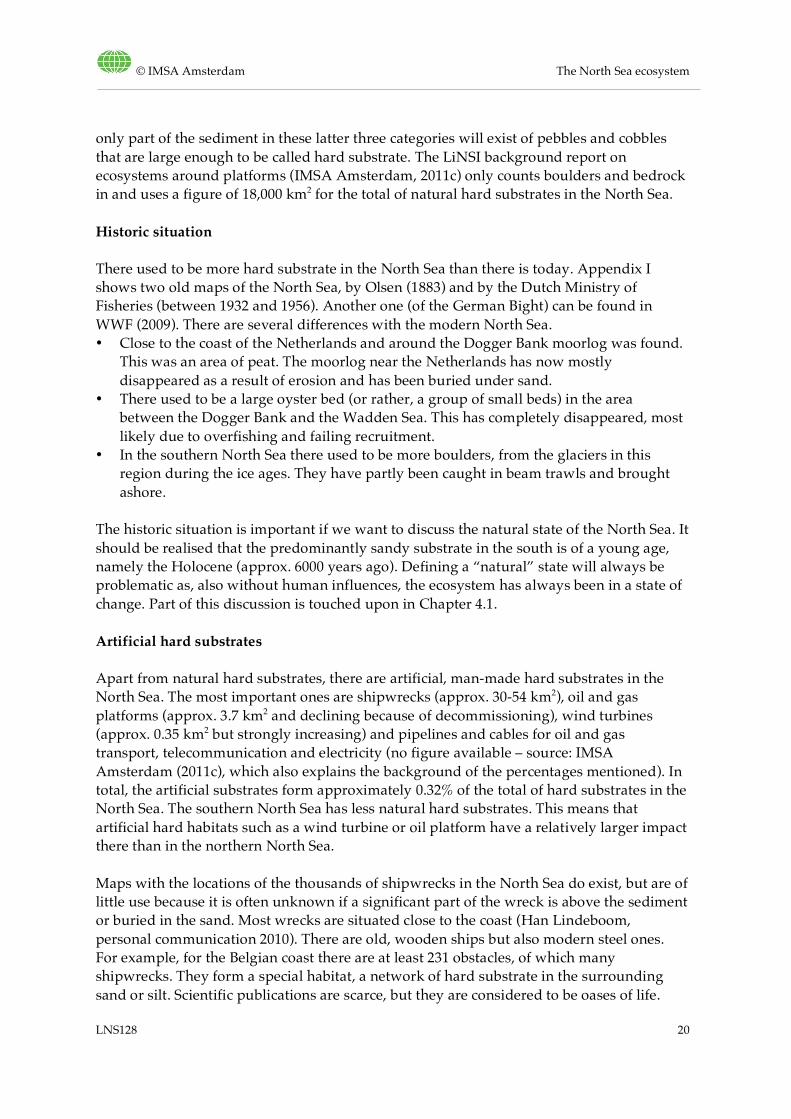
McGlade (2002) divides the North Sea into three ecologically relevant areas: a central area of vertically mixed water, a stratified area occupying the whole of the area above a line from Denmark to the Humber estuary on the East coast of England (roughly the green line in Figure 2.1) and a transitional zone across which the sea shelf fronts migrate in the western English Channel up to an arc across the southern North Sea, from the east coast of England to the Netherlands coast and up to Denmark (McGlade, 2002). These regions are also depicted in Figure 3.3 (from OSPAR, 2000). Appendix IX gives more detailed information about the oceanography of the North Sea. The abiotic aspects of the North Sea in relation to the functioning of the ecosystem will receive more thorough study in Phase 2.
Figure 3.3. Fronts in the North Sea (OSPAR, 2000).
© IMSA Amsterdam The North Sea ecosystem
LNS128 19
3.4. Sediments and locations of hard substrate
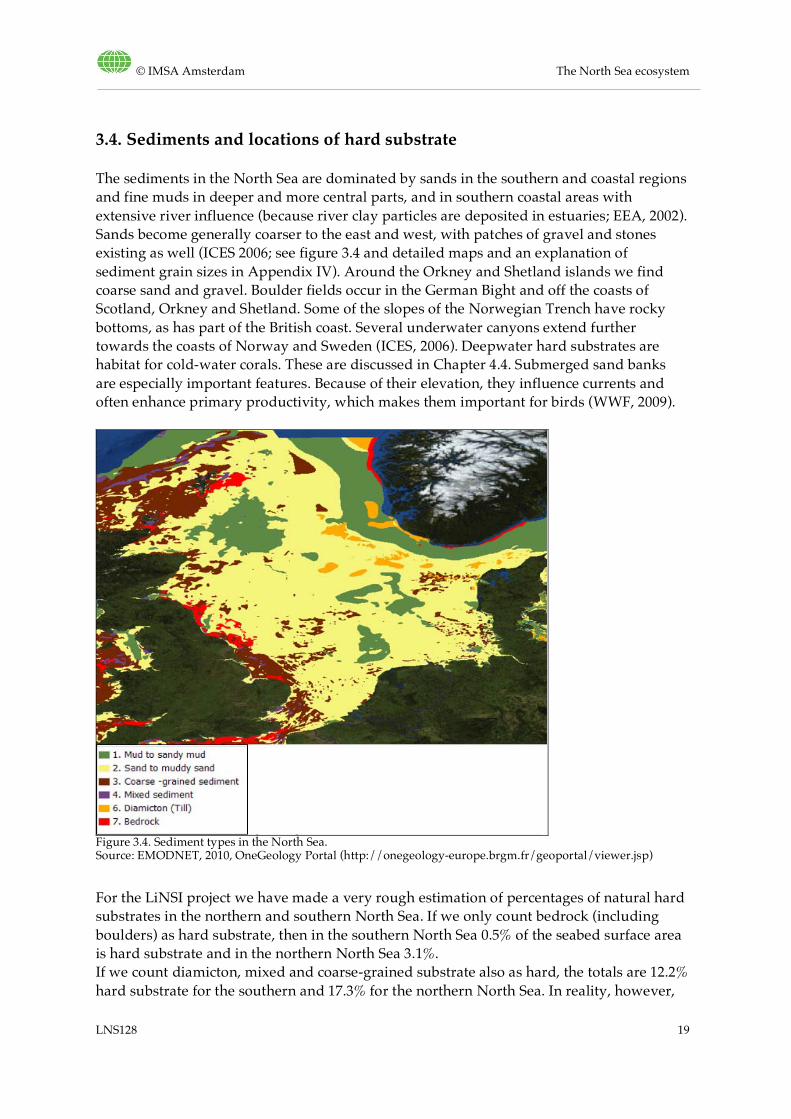
The sediments in the North Sea are dominated by sands in the southern and coastal regions and fine muds in deeper and more central parts, and in southern coastal areas with extensive river influence (because river clay particles are deposited in estuaries; EEA, 2002). Sands become generally coarser to the east and west, with patches of gravel and stones existing as well (ICES 2006; see figure 3.4 and detailed maps and an explanation of sediment grain sizes in Appendix IV). Around the Orkney and Shetland islands we find coarse sand and gravel. Boulder fields occur in the German Bight and off the coasts of Scotland, Orkney and Shetland. Some of the slopes of the Norwegian Trench have rocky bottoms, as has part of the British coast. Several underwater canyons extend further towards the coasts of Norway and Sweden (ICES, 2006). Deepwater hard substrates are habitat for cold-water corals. These are discussed in Chapter 4.4. Submerged sand banks are especially important features. Because of their elevation, they influence currents and often enhance primary productivity, which makes them important for birds (WWF, 2009).
Figure 3.4. Sediment types in the North Sea. Source: EMODNET, 2010, OneGeology Portal (http://onegeology-europe.brgm.fr/geoportal/viewer.jsp)
For the LiNSI project we have made a very rough estimation of percentages of natural hard substrates in the northern and southern North Sea. If we only count bedrock (including boulders) as hard substrate, then in the southern North Sea 0.5% of the seabed surface area is hard substrate and in the northern North Sea 3.1%. If we count diamicton, mixed and coarse-grained substrate also as hard, the totals are 12.2% hard substrate for the southern and 17.3% for the northern North Sea. In reality, however,
© IMSA Amsterdam The North Sea ecosystem
LNS128 20
only part of the sediment in these latter three categories will exist of pebbles and cobbles that are large enough to be called hard substrate. The LiNSI background report on ecosystems around platforms (IMSA Amsterdam, 2011c) only counts boulders and bedrock in and uses a figure of 18,000 km2 for the total of natural hard substrates in the North Sea.
Historic situation
There used to be more hard substrate in the North Sea than there is today. Appendix I shows two old maps of the North Sea, by Olsen (1883) and by the Dutch Ministry of Fisheries (between 1932 and 1956). Another one (of the German Bight) can be found in WWF (2009). There are several differences with the modern North Sea. • Close to the coast of the Netherlands and around the Dogger Bank moorlog was found.
This was an area of peat. The moorlog near the Netherlands has now mostly disappeared as a result of erosion and has been buried under sand.
• There used to be a large oyster bed (or rather, a group of small beds) in the area between the Dogger Bank and the Wadden Sea. This has completely disappeared, most likely due to overfishing and failing recruitment.
• In the southern North Sea there used to be more boulders, from the glaciers in this region during the ice ages. They have partly been caught in beam trawls and brought ashore.
The historic situation is important if we want to discuss the natural state of the North Sea. It should be realised that the predominantly sandy substrate in the south is of a young age, namely the Holocene (approx. 6000 years ago). Defining a “natural” state will always be problematic as, also without human influences, the ecosystem has always been in a state of change. Part of this discussion is touched upon in Chapter 4.1.
Artificial hard substrates
Apart from natural hard substrates, there are artificial, man-made hard substrates in the North Sea. The most important ones are shipwrecks (approx. 30-54 km2), oil and gas platforms (approx. 3.7 km2 and declining because of decommissioning), wind turbines (approx. 0.35 km2 but strongly increasing) and pipelines and cables for oil and gas transport, telecommunication and electricity (no figure available – source: IMSA Amsterdam (2011c), which also explains the background of the percentages mentioned). In total, the artificial substrates form approximately 0.32% of the total of hard substrates in the North Sea. The southern North Sea has less natural hard substrates. This means that artificial hard habitats such as a wind turbine or oil platform have a relatively larger impact there than in the northern North Sea. Maps with the locations of the thousands of shipwrecks in the North Sea do exist, but are of little use because it is often unknown if a significant part of the wreck is above the sediment or buried in the sand. Most wrecks are situated close to the coast (Han Lindeboom, personal communication 2010). There are old, wooden ships but also modern steel ones. For example, for the Belgian coast there are at least 231 obstacles, of which many shipwrecks. They form a special habitat, a network of hard substrate in the surrounding sand or silt. Scientific publications are scarce, but they are considered to be oases of life.
© IMSA Amsterdam The North Sea ecosystem
LNS128 21
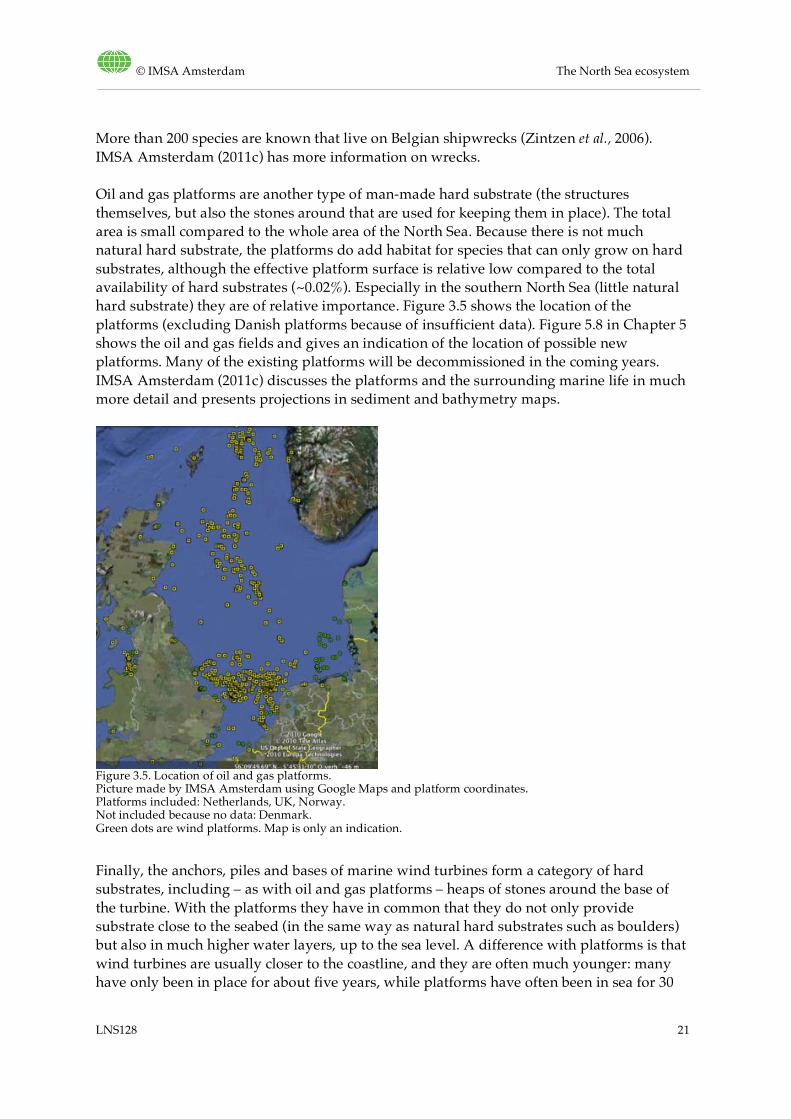
More than 200 species are known that live on Belgian shipwrecks (Zintzen et al., 2006). IMSA Amsterdam (2011c) has more information on wrecks. Oil and gas platforms are another type of man-made hard substrate (the structures themselves, but also the stones around that are used for keeping them in place). The total area is small compared to the whole area of the North Sea. Because there is not much natural hard substrate, the platforms do add habitat for species that can only grow on hard substrates, although the effective platform surface is relative low compared to the total availability of hard substrates (~0.02%). Especially in the southern North Sea (little natural hard substrate) they are of relative importance. Figure 3.5 shows the location of the platforms (excluding Danish platforms because of insufficient data). Figure 5.8 in Chapter 5 shows the oil and gas fields and gives an indication of the location of possible new platforms. Many of the existing platforms will be decommissioned in the coming years. IMSA Amsterdam (2011c) discusses the platforms and the surrounding marine life in much more detail and presents projections in sediment and bathymetry maps.
Figure 3.5. Location of oil and gas platforms. Picture made by IMSA Amsterdam using Google Maps and platform coordinates. Platforms included: Netherlands, UK, Norway. Not included because no data: Denmark. Green dots are wind platforms. Map is only an indication.
Finally, the anchors, piles and bases of marine wind turbines form a category of hard substrates, including – as with oil and gas platforms – heaps of stones around the base of the turbine. With the platforms they have in common that they do not only provide substrate close to the seabed (in the same way as natural hard substrates such as boulders) but also in much higher water layers, up to the sea level. A difference with platforms is that wind turbines are usually closer to the coastline, and they are often much younger: many have only been in place for about five years, while platforms have often been in sea for 30
© IMSA Amsterdam The North Sea ecosystem
LNS128 22
years or more. As a result, the ecosystems attached to platforms are also older than those on wind turbines. On the other hand, ecosystems on platforms have been found to reach a climax situation in five to six years (source: IMSA Amsterdam (2011c)). As the projections are that there will be many more wind turbines in the future, these differences deserve more research, for example about the value of the resulting ecosystems and the possibility for them to act as stepping stones for the rapid distribution of exotic species. IMSA Amsterdam (2011c) gives more details on the ecosystems at and around hard substrates.
3.5. Seabed habitat map
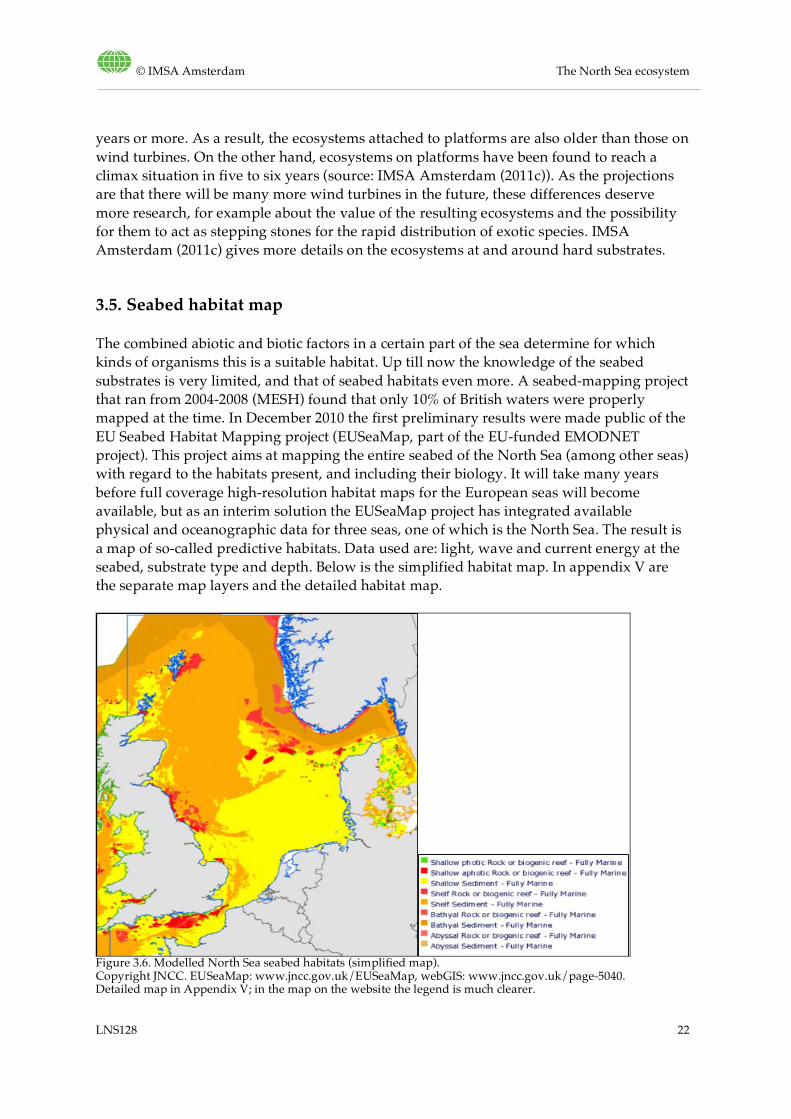
The combined abiotic and biotic factors in a certain part of the sea determine for which kinds of organisms this is a suitable habitat. Up till now the knowledge of the seabed substrates is very limited, and that of seabed habitats even more. A seabed-mapping project that ran from 2004-2008 (MESH) found that only 10% of British waters were properly mapped at the time. In December 2010 the first preliminary results were made public of the EU Seabed Habitat Mapping project (EUSeaMap, part of the EU-funded EMODNET project). This project aims at mapping the entire seabed of the North Sea (among other seas) with regard to the habitats present, and including their biology. It will take many years before full coverage high-resolution habitat maps for the European seas will become available, but as an interim solution the EUSeaMap project has integrated available physical and oceanographic data for three seas, one of which is the North Sea. The result is a map of so-called predictive habitats. Data used are: light, wave and current energy at the seabed, substrate type and depth. Below is the simplified habitat map. In appendix V are the separate map layers and the detailed habitat map.
Figure 3.6. Modelled North Sea seabed habitats (simplified map). Copyright JNCC. EUSeaMap: www.jncc.gov.uk/EUSeaMap, webGIS: www.jncc.gov.uk/page-5040. Detailed map in Appendix V; in the map on the website the legend is much clearer.
© IMSA Amsterdam The North Sea ecosystem
LNS128 23
Because this map has only been produced recently, the following chapter about biotic factors (Chapter 4) has not yet used the information it contains. An analysis of the possible applications of these data will be made in a next phase.
© IMSA Amsterdam The North Sea ecosystem
LNS128 24
4. Biotic factors
In this chapter an introduction is given in the main ecological and taxonomic groups present in the North Sea (plankton, benthos, fish, birds, marine mammals and plants). The status, threats and trends are described for each of these groups; where possible, differences between the northern and southern North Sea are included. More information can be found in the OSPAR QSR 2000 (OSPAR, 2000) and in McGlade (2002). Valuable information is also provided in WWF (2009), including distribution maps of many species and detailed descriptions of ecological sub-regions. First we provide a short introduction into the concept of ecosystem quality, as this plays an important role in the LiNSI project. The concept of biodiversity is also explained because it often surfaces in discussions about a future better state of the North Sea. Both topics are discussed in more detail in Appendix II.
4.1. An introduction to ecosystem quality, assessments and the ecosystem approach
Ecosystem quality and the ecosystem approach
The biological quality of ecosystems is defined by a combination of biodiversity (including species composition) and ecosystem functions. Ecosystem quality can be described in terms of e.g. energy and nutrient fluxes, food availability and use, growth and reproduction of organisms. Instead of the term ecosystem quality, also ecosystem health is used, with approximately the same meaning. Ecosystem quality is influenced by the state of the environment. Species loss or a non-optimal functioning of the ecosystem is usually caused by a combined impact of several pressure factors. Biological processes in ecosystems are interactive and are determined by climate, human use and the biological, chemical and physical properties of soil, water and air. When the environment is negatively impacted, this causes chain reactions in processes, services and functions of ecosystems (RIVM Milieuportaal). The traditional system of assessment and monitoring is very much sector-based (fisheries, chemical contamination, nature conservation). OSPAR, as many other organisations, has adopted the ecosystem approach to manage human activities. This approach cuts across all sectors and results in one policy driver applicable to all sectors (ICES, 2003). The goal is a sustainable use of the ecosystem. The ecosystem approach requires the comprehensive integrated management of human activities based on the best available scientific knowledge about ecosystems and their dynamics, in order to identify and take action on influences which are critical to the health of marine ecosystems (OSPAR, 2010; see appendix II).
© IMSA Amsterdam The North Sea ecosystem
LNS128 25
Methods to assess ecosystem quality
To support the ecosystem approach, OSPAR (in collaboration with ICES) formulated for the North Sea a set of EcoQOs (Ecological Quality Objectives). These define the desired qualities of selected ecosystem components in relation to human pressures. The indicators are chosen in such a way that meeting all EcoQOs should provide the evidence that the ecosystem is in a good state (OSPAR, 2010). Examples of the OSPAR North Sea EcoQOs are: • the proportion of oiled common guillemots should be 10% or less of the total found
dead or dying in all areas of the North Sea • at least 30% of fish (by weight) should exceed 40 cm in length. For the status of the EcoQOs, see Chapter 6 and Appendix XIII. OSPAR acknowledges that it needs to develop the EcoQO system further to provide more comprehensive coverage of ecosystem components and pressures (OSPAR, 2010). Apart from the EcoQO method from OSPAR, there are other ways to assess ecosystem quality. In some cases (for example by the Dutch PBL, the Netherlands Environment Assessment Agency) the ecosystem quality is expressed as the MSA (relative Mean Species Abundance of originally occurring species). As a reference for the originally occurring species, PBL uses the situation in 1950, in which most ecosystems are supposed to have been relatively intact. This use of the presence of characteristic species, as an indicator for ecosystem quality, is in congruity with the way in which nature quality is described internationally, for example in the EU Water Framework Directive and global CBD guidelines. In this method an unspoilt ecosystem gets a score of 100%. This indicator therefore describes the mean biodiversity quality of an ecosystem. Use of the MSA has advantages and disadvantages; it is a much-debated topic. In the North Sea it is difficult to measure ecosystem quality from the presence of species, because there are large natural variations. OSPAR (2010) remarks that future improvement of ecosystem quality assessments requires improved coordination of biological monitoring programmes. There are many such programmes already in place, but these mostly focus on protected sites or features rather than the functional aspects of the ecosystem. These functional aspects that important to monitor if one wants to assess status and impacts at the ecosystem scale.
4.2. Biodiversity of the North Sea
Biodiversity is a difficult topic because it has a complex definition and it is hard to measure. Few people question the value of biodiversity (intrinsic value and value for humans) but there is a lot of debate about how much biodiversity can be lost without jeopardising
© IMSA Amsterdam The North Sea ecosystem
LNS128 26
sustainable development3. Therefore this paragraph starts with a short introduction on biodiversity.
Biodiversity: context of nature value, and biodiversity indices
Biological diversity, or biodiversity, is defined by the Convention on Biological Diversity as: “The variability among living organisms from all sources, including, inter alia, terrestrial, marine, and other aquatic ecosystems, and the ecological complexes of which they are part: this includes diversity within species, between species and of ecosystems". The nature value of an ecosystem may be called high because of several reasons. Biodiversity is one of them. • The area may have a high biodiversity: the genetic, taxonomic and functional diversity of
life on Earth including temporal and spatial variability. The number of species present is the simplest measure of biodiversity but there are better indices, taking also factors such as abundance/evenness into account.
• The area may provide habitat to species with a high abundance: number of individuals per species.
• In the area, one or more rare or endangered species may be present. • Size of individuals (matureness) may also be an indication of a healthy ecosystem and
therefore a higher nature value. • Finally, the extent to which an ecosystem is in a pristine state (unaffected by human
influences) enhances its nature value. Biodiversity can be expressed or calculated in different ways. For example: the Shannon-Wiener index and Simpson’s Index are well known indices, which take into account the number of species as well as their relative abundance. The PBL Netherlands Environmental Assessment Agency uses the indicator “natuurwaarde” (nature value) to express which percentage of biodiversity is left compared to a pristine situation.
Biodiversity issues
Among biologists and nature conservationists, there are at least two discussions in which we should get more insight because they are important for the LiNSI project. • The first one is about the role of biodiversity. Some degree of biodiversity is necessary
for a stable and robust ecosystem. Biologically diverse oceans and seas are important for the proper functioning of marine ecosystems (OSPAR 2010) and for the ecosystem services they yield. However, the exact amount of biodiversity that can be lost without impairing these functions is not known. Ecological theories about biodiversity and its influence on stability should not be translated to marine ecosystems, and the argument “the more biodiversity, the more stable and robust the ecosystem” is certainly not valid (Carlo Heip, pers. comm. November 2010).
• The second discussion is about unnatural versus natural biodiversity. An example of such a discussion: an oil platform provides habitat for hard-substrate species. This is of course not fully natural.
3 “Sustainable development is development that meets the needs of the present without compromising the ability of future generations to meet their own needs” (Brundtland Commission of the United Nations on March 20, 1987).
© IMSA Amsterdam The North Sea ecosystem
LNS128 27
Ecosystems are never static. Sometimes, they even change very suddenly (from one year to the next). This is called a regime shift. Regime shifts are attributed to a range of factors, both climatic and anthropogenic. Substantial regime shifts occurred in the North Sea ecosystem in 1977/79 and 1987/89 (Weijerman et al., 2005). Another regime shift in the North Sea was found in 2001/02 (Alvarez-Fernandez & Lindeboom, submitted). The abundance and seasonal patterns of dinoflagellates and the dominant zooplankton group, the neritic copepods, changed in that period. Furthermore, a non-linear relation between the abundance of neritic copepods and dinoflagellates was found. Environmental factors such as temperature, wind speed and the North Atlantic water inflow were identified as main drivers of seasonal changes, and it is suggested that a change in the balance of dissolved nutrients driven by these environmental factors was the actual cause for the change in plankton community structure, which in turn seems to have affected the North Sea fish community. A difficult question in these matters is how to distinguish between human-induced change and natural changes.
Biodiversity hotspots
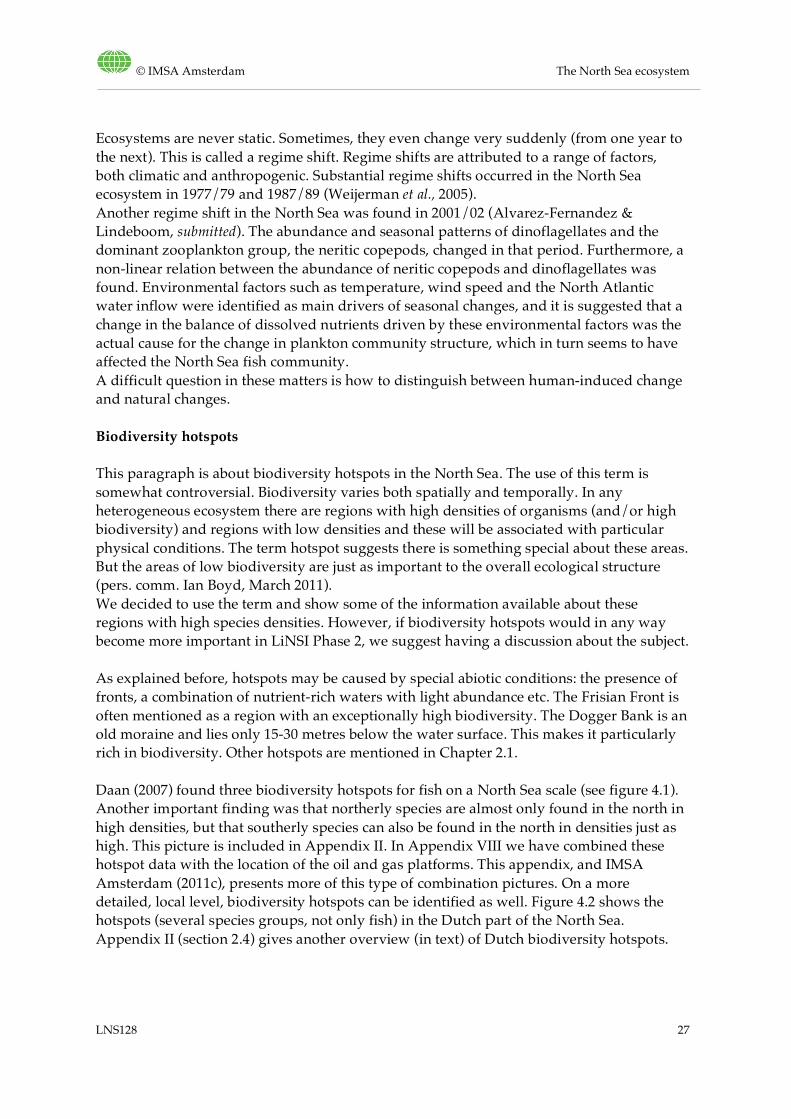
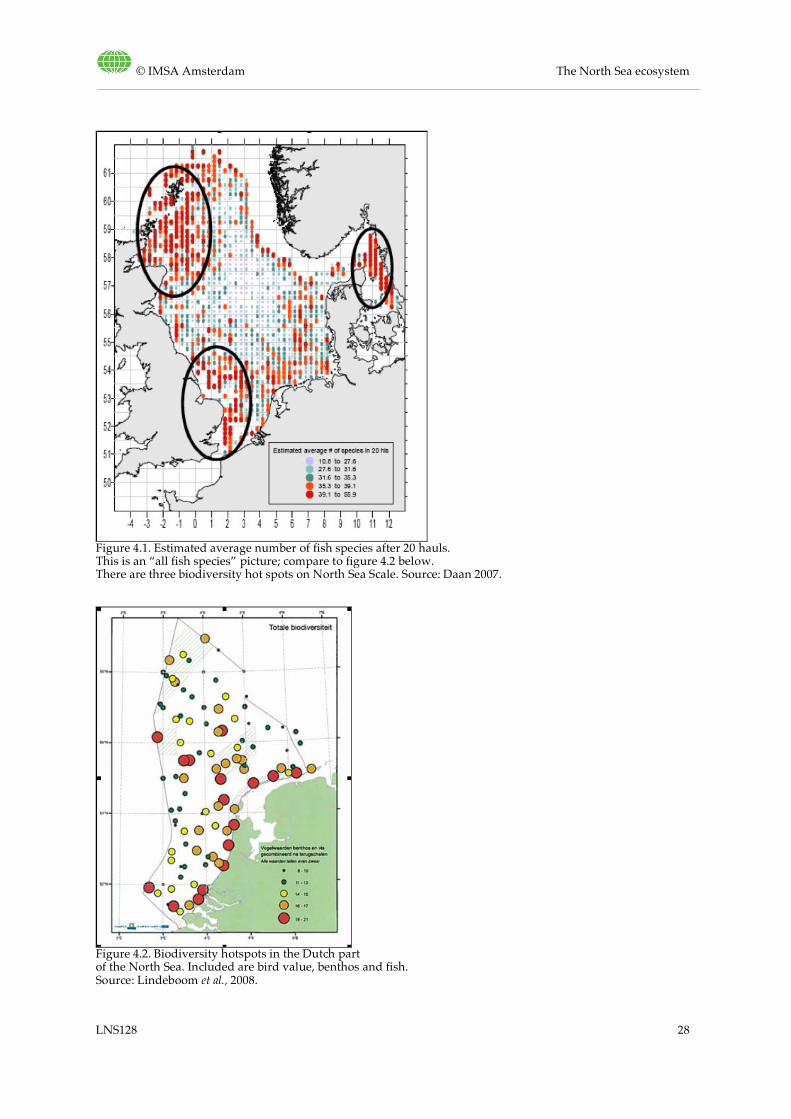
This paragraph is about biodiversity hotspots in the North Sea. The use of this term is somewhat controversial. Biodiversity varies both spatially and temporally. In any heterogeneous ecosystem there are regions with high densities of organisms (and/or high biodiversity) and regions with low densities and these will be associated with particular physical conditions. The term hotspot suggests there is something special about these areas. But the areas of low biodiversity are just as important to the overall ecological structure (pers. comm. Ian Boyd, March 2011). We decided to use the term and show some of the information available about these regions with high species densities. However, if biodiversity hotspots would in any way become more important in LiNSI Phase 2, we suggest having a discussion about the subject. As explained before, hotspots may be caused by special abiotic conditions: the presence of fronts, a combination of nutrient-rich waters with light abundance etc. The Frisian Front is often mentioned as a region with an exceptionally high biodiversity. The Dogger Bank is an old moraine and lies only 15-30 metres below the water surface. This makes it particularly rich in biodiversity. Other hotspots are mentioned in Chapter 2.1. Daan (2007) found three biodiversity hotspots for fish on a North Sea scale (see figure 4.1). Another important finding was that northerly species are almost only found in the north in high densities, but that southerly species can also be found in the north in densities just as high. This picture is included in Appendix II. In Appendix VIII we have combined these hotspot data with the location of the oil and gas platforms. This appendix, and IMSA Amsterdam (2011c), presents more of this type of combination pictures. On a more detailed, local level, biodiversity hotspots can be identified as well. Figure 4.2 shows the hotspots (several species groups, not only fish) in the Dutch part of the North Sea. Appendix II (section 2.4) gives another overview (in text) of Dutch biodiversity hotspots.
© IMSA Amsterdam The North Sea ecosystem
LNS128 28
Figure 4.1. Estimated average number of fish species after 20 hauls. This is an “all fish species” picture; compare to figure 4.2 below. There are three biodiversity hot spots on North Sea Scale. Source: Daan 2007.
Figure 4.2. Biodiversity hotspots in the Dutch part of the North Sea. Included are bird value, benthos and fish. Source: Lindeboom et al., 2008.
© IMSA Amsterdam The North Sea ecosystem
LNS128 29
Threatened biodiversity
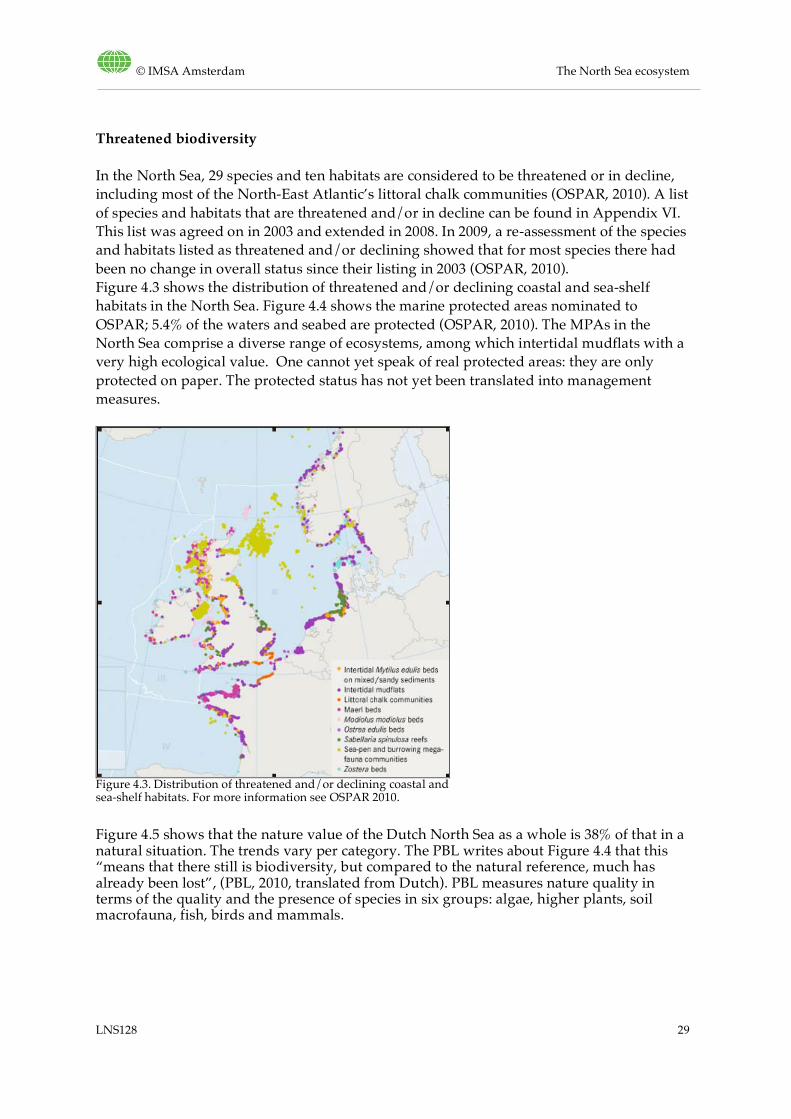
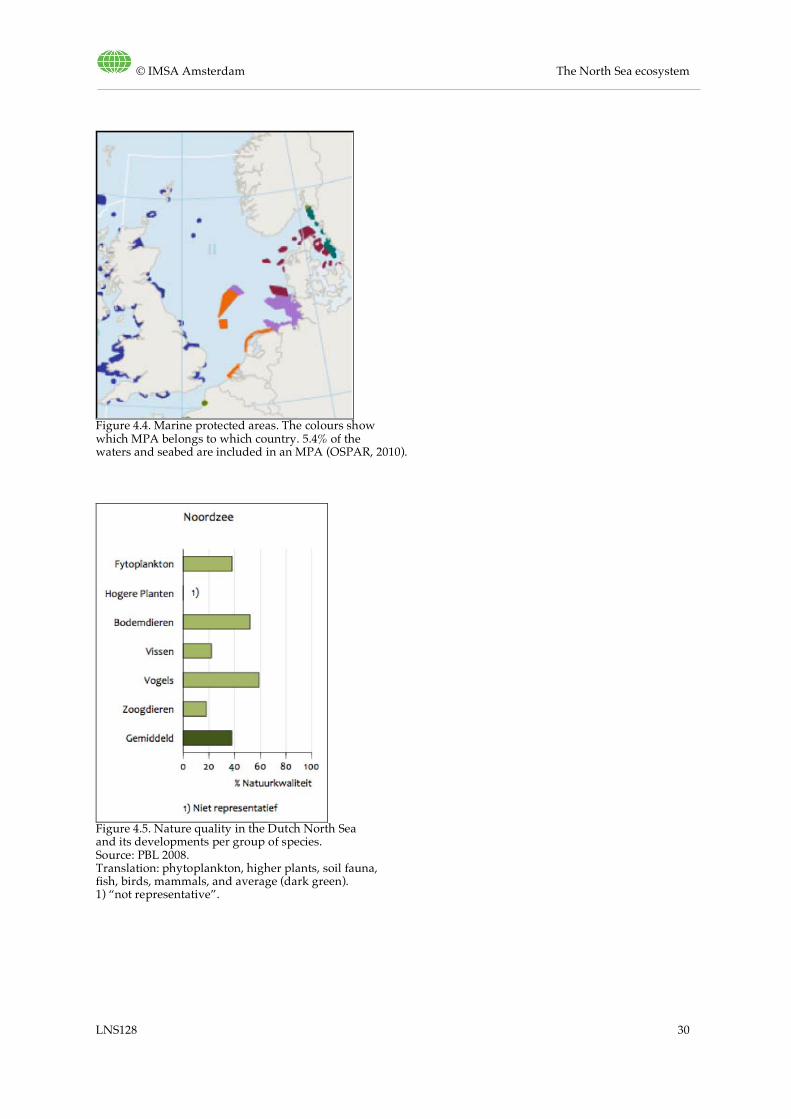
In the North Sea, 29 species and ten habitats are considered to be threatened or in decline, including most of the North-East Atlantic’s littoral chalk communities (OSPAR, 2010). A list of species and habitats that are threatened and/or in decline can be found in Appendix VI. This list was agreed on in 2003 and extended in 2008. In 2009, a re-assessment of the species and habitats listed as threatened and/or declining showed that for most species there had been no change in overall status since their listing in 2003 (OSPAR, 2010). Figure 4.3 shows the distribution of threatened and/or declining coastal and sea-shelf habitats in the North Sea. Figure 4.4 shows the marine protected areas nominated to OSPAR; 5.4% of the waters and seabed are protected (OSPAR, 2010). The MPAs in the North Sea comprise a diverse range of ecosystems, among which intertidal mudflats with a very high ecological value. One cannot yet speak of real protected areas: they are only protected on paper. The protected status has not yet been translated into management measures.
Figure 4.3. Distribution of threatened and/or declining coastal and sea-shelf habitats. For more information see OSPAR 2010.
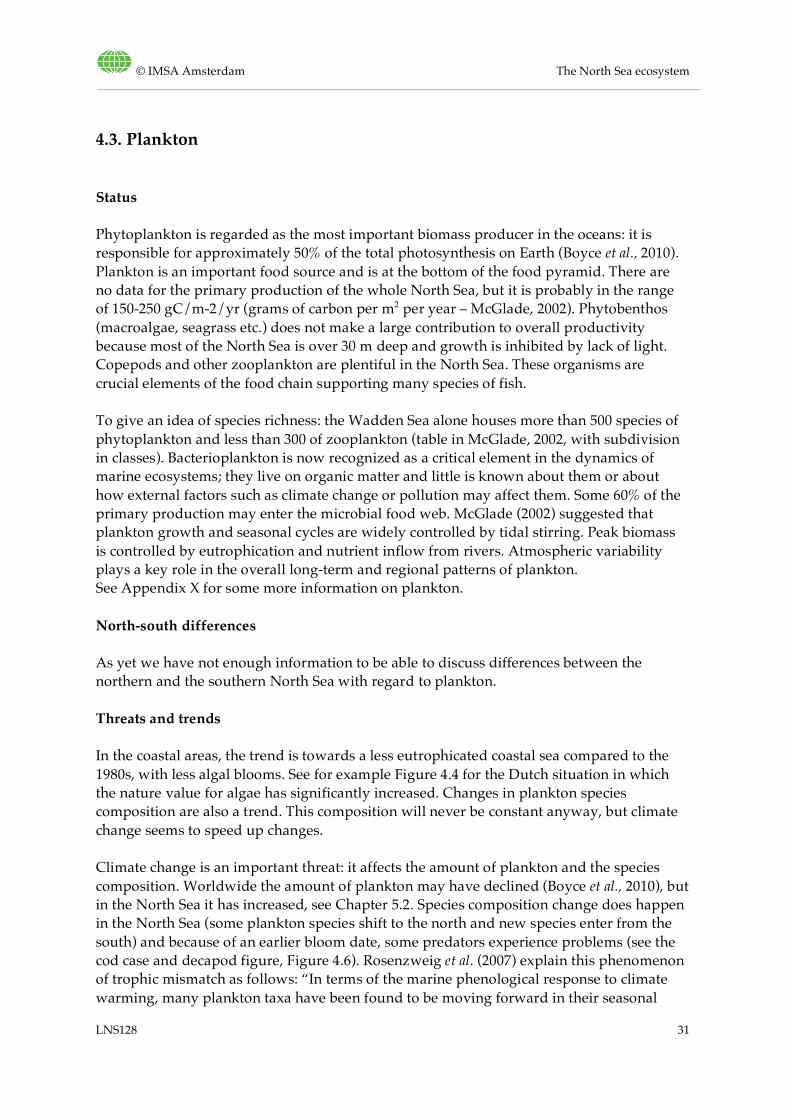
Figure 4.5 shows that the nature value of the Dutch North Sea as a whole is 38% of that in a natural situation. The trends vary per category. The PBL writes about Figure 4.4 that this “means that there still is biodiversity, but compared to the natural reference, much has already been lost”, (PBL, 2010, translated from Dutch). PBL measures nature quality in terms of the quality and the presence of species in six groups: algae, higher plants, soil macrofauna, fish, birds and mammals.
© IMSA Amsterdam The North Sea ecosystem
LNS128 30
Figure 4.4. Marine protected areas. The colours show which MPA belongs to which country. 5.4% of the waters and seabed are included in an MPA (OSPAR, 2010).
Figure 4.5. Nature quality in the Dutch North Sea and its developments per group of species. Source: PBL 2008. Translation: phytoplankton, higher plants, soil fauna, fish, birds, mammals, and average (dark green). 1) “not representative”.
© IMSA Amsterdam The North Sea ecosystem
LNS128 31
4.3. Plankton
Status
Phytoplankton is regarded as the most important biomass producer in the oceans: it is responsible for approximately 50% of the total photosynthesis on Earth (Boyce et al., 2010). Plankton is an important food source and is at the bottom of the food pyramid. There are no data for the primary production of the whole North Sea, but it is probably in the range of 150-250 gC/m-2/yr (grams of carbon per m2 per year – McGlade, 2002). Phytobenthos (macroalgae, seagrass etc.) does not make a large contribution to overall productivity because most of the North Sea is over 30 m deep and growth is inhibited by lack of light. Copepods and other zooplankton are plentiful in the North Sea. These organisms are crucial elements of the food chain supporting many species of fish. To give an idea of species richness: the Wadden Sea alone houses more than 500 species of phytoplankton and less than 300 of zooplankton (table in McGlade, 2002, with subdivision in classes). Bacterioplankton is now recognized as a critical element in the dynamics of marine ecosystems; they live on organic matter and little is known about them or about how external factors such as climate change or pollution may affect them. Some 60% of the primary production may enter the microbial food web. McGlade (2002) suggested that plankton growth and seasonal cycles are widely controlled by tidal stirring. Peak biomass is controlled by eutrophication and nutrient inflow from rivers. Atmospheric variability plays a key role in the overall long-term and regional patterns of plankton. See Appendix X for some more information on plankton.
North-south differences
As yet we have not enough information to be able to discuss differences between the northern and the southern North Sea with regard to plankton.
Threats and trends
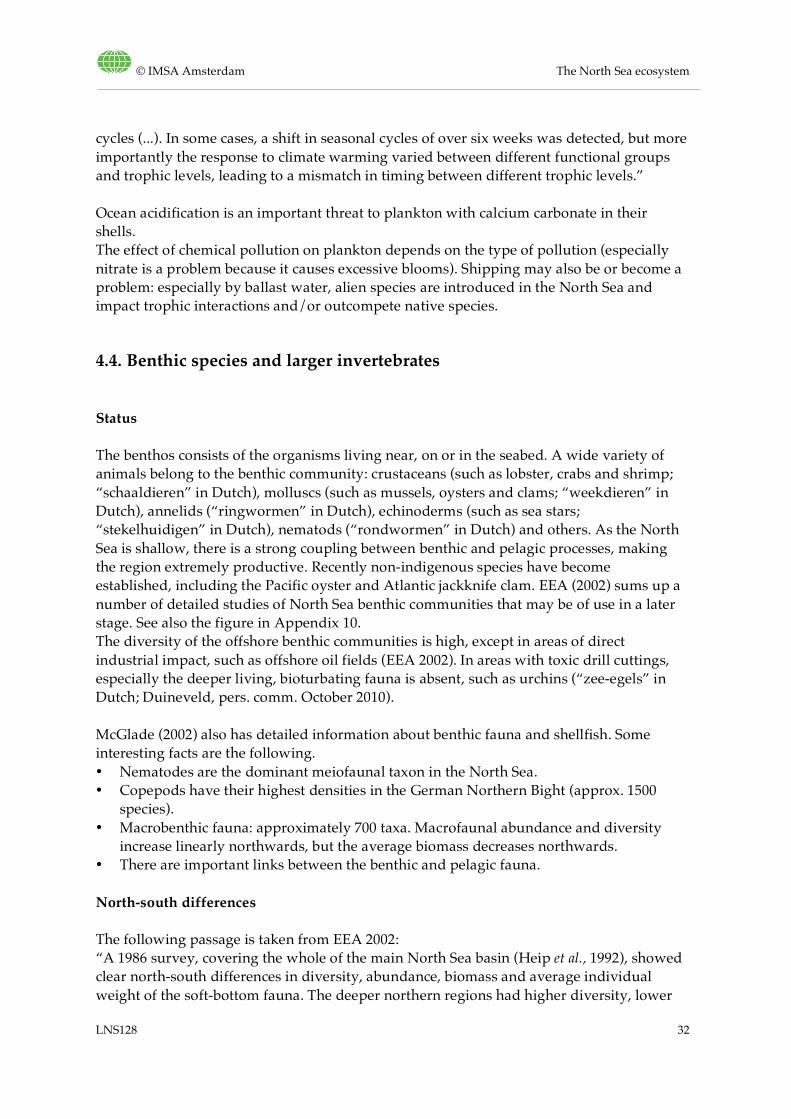
In the coastal areas, the trend is towards a less eutrophicated coastal sea compared to the 1980s, with less algal blooms. See for example Figure 4.4 for the Dutch situation in which the nature value for algae has significantly increased. Changes in plankton species composition are also a trend. This composition will never be constant anyway, but climate change seems to speed up changes. Climate change is an important threat: it affects the amount of plankton and the species composition. Worldwide the amount of plankton may have declined (Boyce et al., 2010), but in the North Sea it has increased, see Chapter 5.2. Species composition change does happen in the North Sea (some plankton species shift to the north and new species enter from the south) and because of an earlier bloom date, some predators experience problems (see the cod case and decapod figure, Figure 4.6). Rosenzweig et al. (2007) explain this phenomenon of trophic mismatch as follows: “In terms of the marine phenological response to climate warming, many plankton taxa have been found to be moving forward in their seasonal
© IMSA Amsterdam The North Sea ecosystem
LNS128 32
cycles (...). In some cases, a shift in seasonal cycles of over six weeks was detected, but more importantly the response to climate warming varied between different functional groups and trophic levels, leading to a mismatch in timing between different trophic levels.” Ocean acidification is an important threat to plankton with calcium carbonate in their shells. The effect of chemical pollution on plankton depends on the type of pollution (especially nitrate is a problem because it causes excessive blooms). Shipping may also be or become a problem: especially by ballast water, alien species are introduced in the North Sea and impact trophic interactions and/or outcompete native species.
4.4. Benthic species and larger invertebrates
Status
The benthos consists of the organisms living near, on or in the seabed. A wide variety of animals belong to the benthic community: crustaceans (such as lobster, crabs and shrimp; “schaaldieren” in Dutch), molluscs (such as mussels, oysters and clams; “weekdieren” in Dutch), annelids (“ringwormen” in Dutch), echinoderms (such as sea stars; “stekelhuidigen” in Dutch), nematods (“rondwormen” in Dutch) and others. As the North Sea is shallow, there is a strong coupling between benthic and pelagic processes, making the region extremely productive. Recently non-indigenous species have become established, including the Pacific oyster and Atlantic jackknife clam. EEA (2002) sums up a number of detailed studies of North Sea benthic communities that may be of use in a later stage. See also the figure in Appendix 10. The diversity of the offshore benthic communities is high, except in areas of direct industrial impact, such as offshore oil fields (EEA 2002). In areas with toxic drill cuttings, especially the deeper living, bioturbating fauna is absent, such as urchins (“zee-egels” in Dutch; Duineveld, pers. comm. October 2010). McGlade (2002) also has detailed information about benthic fauna and shellfish. Some interesting facts are the following. • Nematodes are the dominant meiofaunal taxon in the North Sea. • Copepods have their highest densities in the German Northern Bight (approx. 1500
species). • Macrobenthic fauna: approximately 700 taxa. Macrofaunal abundance and diversity
increase linearly northwards, but the average biomass decreases northwards. • There are important links between the benthic and pelagic fauna.
North-south differences
The following passage is taken from EEA 2002: “A 1986 survey, covering the whole of the main North Sea basin (Heip et al., 1992), showed clear north-south differences in diversity, abundance, biomass and average individual weight of the soft-bottom fauna. The deeper northern regions had higher diversity, lower
© IMSA Amsterdam The North Sea ecosystem
LNS128 33
biomass, and lower individual weights than the shallow southern regions. The main causes are thought to be differences in the size distribution of the sedimentary grains, and the supply to the bottom of organic matter from the pelagic primary production. In particular it appears that the benthic-pelagic coupling is stronger in the more shallow southern areas. There can be considerable short-term temporal changes in the diversity and structure of the benthic community in the central part of the North Sea (Pearson and Mannvik, 1998). This variability may be driven by climate-induced fluctuations in the overlying pelagic communities.” One benthic organism that is only found in the North is Lophelia pertusa. Lophelia reefs (cold water corals) are in the OSPAR list of threatened habitats. They usually grow in depths of more than 150 m but occasionally are found in shallower inshore waters (such as the Kosterfjord in the Skagerrak (ICES 2006)). Lophelia seems to occur mainly on the very fringes of the North Sea (such as South Norway). Norway has the highest known density of Lophelia pertusa reefs in the world, but most are just outside the North Sea. The UvA (University of Amsterdam) World Biodiversity Database mentions that Lophelia habitats are “on rocky or soft bottoms” (sources: WBD, lophelia.org, McCrea et al., 2003). Additionally, Lophelia has been found on gas and oil platforms in the deep parts of the North Sea. It is often found in areas with strong currents and rocky substrates. CITES defines the Lophelia status as “not yet threatened with extinction but may become so in the future” (CITES Annex II). The south has some hard substrates with Alcyonium digitatum (Dead man’s fingers). These are soft corals. Furthermore, Sabellaria (a species of tube worm) builds colonies that are reef-like. Other species of hard substrates are included in IMSA Amsterdam (2011c).
Threats and trends
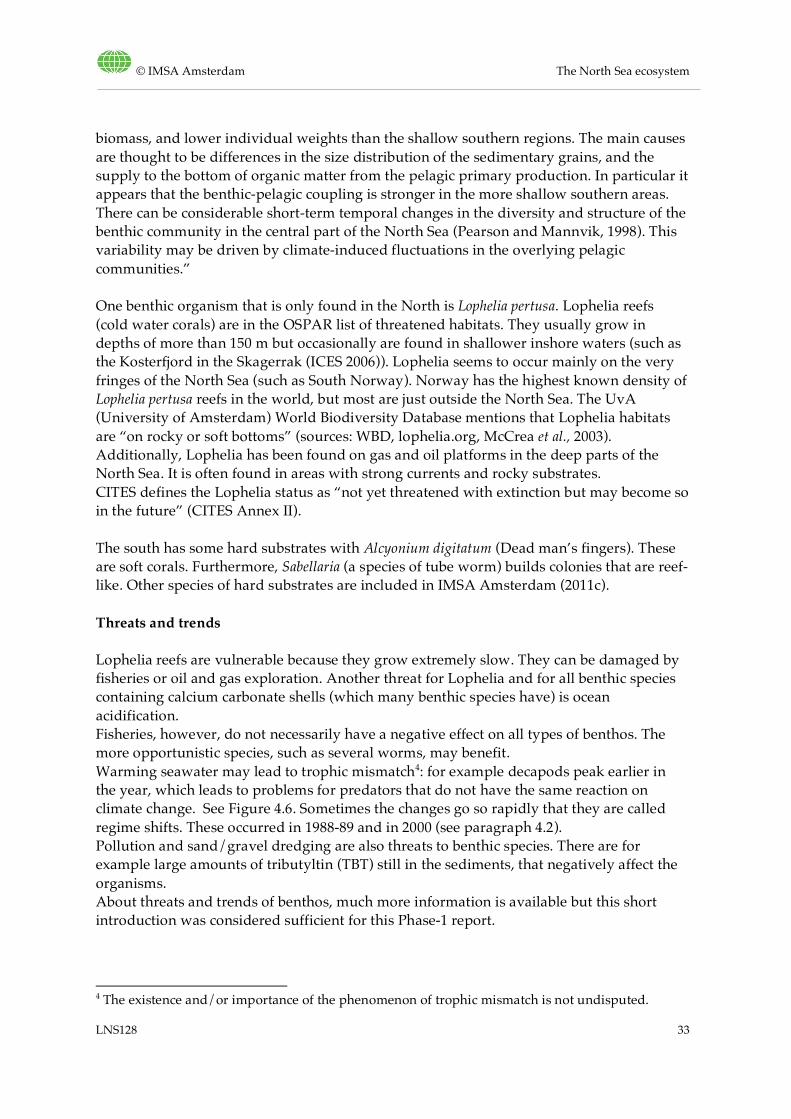
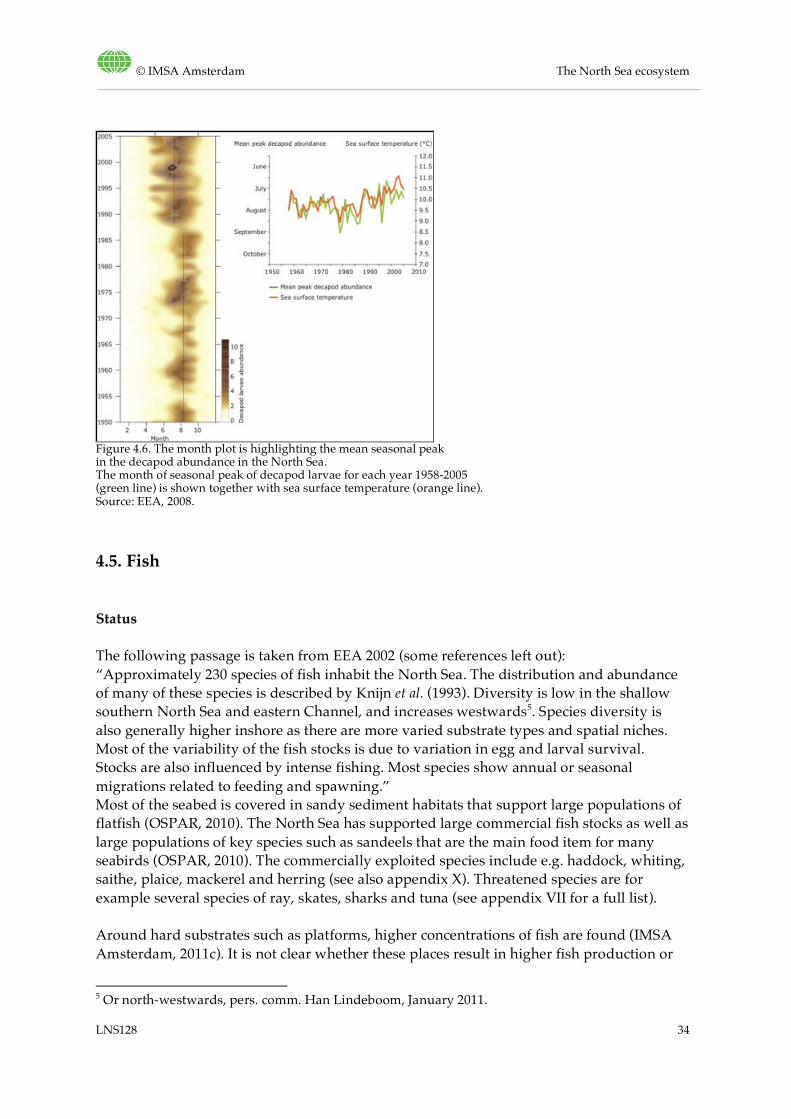
Lophelia reefs are vulnerable because they grow extremely slow. They can be damaged by fisheries or oil and gas exploration. Another threat for Lophelia and for all benthic species containing calcium carbonate shells (which many benthic species have) is ocean acidification. Fisheries, however, do not necessarily have a negative effect on all types of benthos. The more opportunistic species, such as several worms, may benefit. Warming seawater may lead to trophic mismatch4: for example decapods peak earlier in the year, which leads to problems for predators that do not have the same reaction on climate change. See Figure 4.6. Sometimes the changes go so rapidly that they are called regime shifts. These occurred in 1988-89 and in 2000 (see paragraph 4.2). Pollution and sand/gravel dredging are also threats to benthic species. There are for example large amounts of tributyltin (TBT) still in the sediments, that negatively affect the organisms. About threats and trends of benthos, much more information is available but this short introduction was considered sufficient for this Phase-1 report.
4 The existence and/or importance of the phenomenon of trophic mismatch is not undisputed.
© IMSA Amsterdam The North Sea ecosystem
LNS128 34
Figure 4.6. The month plot is highlighting the mean seasonal peak in the decapod abundance in the North Sea. The month of seasonal peak of decapod larvae for each year 1958-2005 (green line) is shown together with sea surface temperature (orange line). Source: EEA, 2008.
4.5. Fish
Status
The following passage is taken from EEA 2002 (some references left out): “Approximately 230 species of fish inhabit the North Sea. The distribution and abundance of many of these species is described by Knijn et al. (1993). Diversity is low in the shallow southern North Sea and eastern Channel, and increases westwards5. Species diversity is also generally higher inshore as there are more varied substrate types and spatial niches. Most of the variability of the fish stocks is due to variation in egg and larval survival. Stocks are also influenced by intense fishing. Most species show annual or seasonal migrations related to feeding and spawning.” Most of the seabed is covered in sandy sediment habitats that support large populations of flatfish (OSPAR, 2010). The North Sea has supported large commercial fish stocks as well as large populations of key species such as sandeels that are the main food item for many seabirds (OSPAR, 2010). The commercially exploited species include e.g. haddock, whiting, saithe, plaice, mackerel and herring (see also appendix X). Threatened species are for example several species of ray, skates, sharks and tuna (see appendix VII for a full list). Around hard substrates such as platforms, higher concentrations of fish are found (IMSA Amsterdam, 2011c). It is not clear whether these places result in higher fish production or
5 Or north-westwards, pers. comm. Han Lindeboom, January 2011.
© IMSA Amsterdam The North Sea ecosystem
LNS128 35
whether fish are merely attracted to these places from elsewhere. This topic is treated in more detail in IMSA Amsterdam (2011c).
North-south differences
McGlade (2002) has listed the dominating fish species in the northern and southern part of the North Sea, respectively (see Appendix X). Knijn et al. (1993) may be a good source for further reading in the next phase. As described above, diversity is low in the south.
Threats and trends
There has been a trend towards smaller fish, because large fish are being fished away (WWF, 2010); the main threat to fish in the North Sea is – obviously – fishing. Shipwrecks, oil and gas platforms and other such human-built structures provide some local protection from fisheries for larger fish (see paragraph 5.1 for more about fishing and fish). Discards are a huge problem. Furthermore, there is the threat of climate change: the severity of the threat depends on the species of fish. Cold-water species shift to the north. Pollution is also a threat, including pollution by small plastic particles. Knowledge about this is, however, limited. Much more will be written about fish status, threats and trends in subsequent reports, but this is considered sufficient for this introductory report (with the addition of the information in Chapter 5.1 on fisheries).
4.6. Birds
Status
About 110 species of birds utilize the North Sea (McGlade (2002) presents more details on locations). Especially the nature reserves along the coasts provide breeding habitat for dozens of bird species. Tens of millions of birds make use of the North Sea for breeding, feedin, or migratory stopovers every year. There are, among others, populations of Black legged Kittiwakes, Atlantic Puffins, Northern fulmars, and species of petrels, gannets, seaducks, loons (divers), cormorants, gulls, auks, and terns (Wikipedia). The extensive estuaries with mudflats and saltmarshes are globally important areas for migrating waterfowl and waders (OSPAR, 2010). In the northwest of the North Sea, islands support major colonies of seabirds (OSPAR, 2010). Sandbanks are also important features for birds (see Chapter 4 and WWF, 2009). EEA 2002 states: “The bird populations of the North Sea area are of global importance. There are 31 species of seabirds breeding along the coasts and major seabird colonies living along the rocky coasts in the northern part of the North Sea. Some 10 million seabirds are present at most times of the year, but migrations and seasonal shifts are pronounced, and none of the species is endemic. Many shorebirds, such as waders and ducks, feed in inter-tidal areas along the coast. The Wadden Sea is of particular importance for both breeding
© IMSA Amsterdam The North Sea ecosystem
LNS128 36
and migratory populations, with 6 to 12 million birds of more than 50 different species present every year (OSPAR, 2000).” Benthic organisms such as worms and shellfish, and fish are the main food for birds, depending on species.
North-south differences
We have not enough information yet to discuss north-south differences. One thing we know (see above) is that the rocky coasts in the north are important for breeding and the southern North Sea is important for feeding (and resting).
Threats and trends
More literature is needed in a next phase. Puffins are on the decline in the North Sea, perhaps because of a lack of food6. There seems to be competition between fishermen and birds for some species of fish, like sandeel (OSPAR, 2010). Climate change will be a threat to all birds. Persistent chemicals also affect birds because of the bioaccumulation. Plastic marine litter entering the food chain also poses a threat: birds confuse plastic with food, eat it and eventually starve to death, because their stomach is full of plastic. They may also find themselves entangled in old fishing gear or suffocate from ingesting plastic particles (UNEP, 2009). Plastic soup (very small plastic particles) may also have a negative effect via the fish but this is still unclear. The problem of plastic marine litter on coastlines is larger in the northern than in the southern North Sea (UNEP, 2009).
4.7. Marine mammals
Status
There are three species of seal and 16 of whale that are more or less regularly observed in the North Sea (OSPAR, 2000). The grey seal (Halichoerus grypus) and the harbour seal (Phoca vitulina) both breed in the area. The grey seal is most abundant in exposed locations in the northwest, while the harbour seal is more widespread, often found on mud and sand flats (EEA, 2002). The harbour seal population in the North Sea has recovered from two severe epidemics of viruses in 1988 and 2002. The most frequently observed cetacean is the harbour porpoise (Phocoena phocoena, see Table 4.1). Other species of toothed cetacean that are sighted regularly include long-finned pilot whales (Globicephala melas), the common dolphin (Delphinus delphis), the whitesided dolphin (Lagenorhynchus acutus), Risso’s dolphin (Grampus griseus) and the killer whale (Orcinus orca). Sightings of other species are relatively rare (OSPAR, 2000) although ICES (2010a) also mentions bottlenose dolphins. WWF (2009) has distribution maps for seals and porpoises. Table 4.1. ICES estimates for number of some species of cetaceans in the North Sea (ICES, 2010a)
Harbour porpoise (North Sea and Skagerrak) 205,751 Common and/or striped dolphin together (North Sea) 5022 Bottlenose dolphin (North Sea) 1026
6 The real cause of the decline is probably not yet known (pers. comm. Ian Boyd).
© IMSA Amsterdam The North Sea ecosystem
LNS128 37
North-south differences
Two map in Appendix X shows the distribution of bottlenose dolphins, harbour porpoise, grey seal and common seal.
Trends
• In general, the recruitment of grey seal pups increased while the population of harbour seals in the north decreased over the years up to 2006. Declines of harbour seals of more than 10% occurred near Shetland, Orkney, east of Scotland, Grater Wah to Scroby Sands, Limfjorden in Denmark and West Norway. In the Limfjorden the cause was an outbreak of the morbillovirus; in all other areas the cause is not known. Harbour seals in the Wadden Sea have been increasing (OSPAR, 2010).
• Two assessments of harbour porpoise densities, in 1994 and 2005, did not show any significant change in the overall population sizes, but there have been marked changes in their distribution. There was a decline in the north and an increase in the south (OSPAR, 2009c). In the past years, many harbour porpoise were washed ashore. Researchers have suggested that some fisheries are an important cause of harbour porpoise deaths (Haelters & Camphuysen, 2009).
• About other cetaceans not enough research has been done yet (in the scope of the LiNSI project) to give information.
Threats (cetaceans)
Threats are: entanglement in fisheries nets and bycatch (especially by static nets and trawling); habitat and feeding ground degradation; hunting; climate change; ship collissions; pollution; and marine noise such as underwater noise from shipping, oil and gas exploration and (increasingly) from the installation of wind mills. The operation of wind mills makes some noise but is expected not to harm seals or disturb their communication; however, an effect on their behaviour might occur close to the wind mills (Tougaard et al., 2009). Pollution is a threat because marine mammals are at the top of the food pyramid: there is bioaccumulation of persistent chemicals in their bodies. Plastic particles from human waste are also a threat. With regard to fisheries the assessment of total bycatch of cetaceans in this area is uncertain. An ICES study found it impossible, with the data available, to assess bycatch of cetaceans with any great precision.7 This study estimates for the North Sea and Skagerrak together that bycatch of harbour porpoise may be between 715 and 7364 animals per year. The figure of 7364 is based on only one sample, but does give rise to concern because the total harbour porpoise population in North Sea and Skagerrak is only 205,751 animals. A figure of 1.7% is considered to be the rate of total removals from a population that would still allow the harbour porpoise population to achieve 80% of its carrying capacity over a long time horizon (a proxy for a sustainable population). That would mean a maximum of
7 The possible scale of bycatch was calculated by multiplying observed bycatch rates by the relevant figure for effort in each Management Region.
© IMSA Amsterdam The North Sea ecosystem
LNS128 38
3498 animals per year8. According to ICES, there is no indication that pelagic fisheries in the North Sea currently pose a major risk to cetaceans (ICES, 2010a). A 2009 study estimated that in the southern North Sea, up to half of the stranded porpoises were killed accidentally in fishing gear. The main fishing gears responsible for the porpoise bycatch are gill- and tangle nets, considered otherwise as selective and relatively environmentally friendly (Haelters & Camphuysen, 2009).
Threats (seals)
According to the OSPAR “Utrecht Workshop” (OSPAR, 2009b) the total human impact on seals in the North Sea is moderate with all individual human pressures identified as having a low impact on seals. The OSPAR Quality Status Report 2010 describes in some detail the effect of the fishing industry on seal populations. Fishing causes the death of many species and indirectly affects marine mammals like seals. Seals, like dolphins, are also commonly entangled in fishing gear. Mariculture gives rise to site-specific impacts as a result of the scaring devices that are used to discourage birds and seals from eating the farmed fish. Commercial sealing occurs in Norway and Iceland (Regions I and II, this is the Arctic waters and the North Sea respectively) by local hunters and is well within quota. In Norway quotas are usually set at 5% of the current abundance estimates. Current evidence suggests that the impact of human-generated noise on marine mammals is sufficiently great to warrant concern. However, determining the impact of the noise is nearly impossible given our limited knowledge about ocean noise and marine mammals’ responses to it. Sources of noise include: shipping, dredging and construction, oil and gas drilling and production (NRC, 2003).
4.8. Plants and algae
Status
Higher plants in the North Sea include species of seagrass (Zostera sp.) and wrack, among them bladder wrack, knotted wrack and serrated wrack. Algae, macroalgae, and kelp, such as oarweed and Laminaria hyperboria, and species of maerl are found as well. EEA (2002) gives the following description of North Sea benthic flora: “Most of the seabed in the North Sea hosts soft-bottom communities apart from the land margins of Norway and the United Kingdom where rocky shores dominate. Rocky shores have the most developed macroalgal communities in the region, with vegetation down to approximately 15 m in the southern part and 30 m in the northern part of the sea. Kelp forests are widespread on rocky sublittoral areas in the northern part of the region and many species of flora and fauna find shelter, food and surfaces for attachment on the kelp 8 An extra reason for concern is that ICES mentions that aside from the Denmark sample, “other possible figures are all below 3000 per year”. That means, however, that there will be at least one other sample leading to a bycatch estimation of close to 3000 animals per year, which is close to the sustainability threshold.
© IMSA Amsterdam The North Sea ecosystem
LNS128 39
and the surrounding rocky substrate. Different communities develop, depending on factors such as exposure, turbidity, grazing pressure and substrate type. Different species directories list about 820 macroalgal species for the British Isles and the surrounding seas, 370 for the Norwegian coastline, 325 for the northern part of Kattegat, 274 for Helgoland and 230 for the Netherlands. Benthic microalgae are a primary source of nutrition in shallow waters for larger grazers and fish like the mullet. These algae, suspended by wave action, constitute up to 90% of the primary production in these waters.”
North-south differences
We have not enough information yet to discuss north-south differences.
Threats and trends
Pollution (especially N, P) and climate change.
© IMSA Amsterdam The North Sea ecosystem
LNS128 40
5. External impacts (including future developments)
The main pressures on North Sea biodiversity and ecosystem health are the removal of target and non-target species, loss of and damage to habitats, the introduction of non-native species, obstacles to species migration and poor water quality. All can act in synergy with or be exacerbated by climate change. The loss of biodiversity that is caused by these pressures includes a decline in the distribution and population of species, a decline in the extent and condition of habitats and the interruption of ecological processes, such as spawning and migration (OSPAR, 2010). Ecosystems that are easily damaged and slow to recover, such as cold water corals, are the most sensitive ones. In the past, insufficient attention has been paid to the conservation of marine biodiversity. The reason is that knowledge about effects of external impacts (and more generally speaking, the knowledge about marine biodiversity – especially below 200 metres) is still underdeveloped (OSPAR, 2010). Appendix VII contains lists taken from the Quality Status Report 2010 with all the threatened or declining species (excl. plankton) and habitats in the North Sea. (Human-induced) climate change has already many important effects. Some research even indicates that two-thirds of North Sea fish species have shifted in mean latitude or depth over the last 25 years (CLIMAR, 2008; see paragraph 5.2 on climate change). Because plankton is at the base of the food pyramid, any change in these primary producers has consequences at the top. Global ocean primary productivity has declined by more than 6% since the early 1980s (Gregg et al., 2003). In the North Sea, however, an increase in algae has been found while nutrients decreased (McQuatters-Gollop et al., 2007). This regime shift can, according to the authors, be explained by decreasing turbidy and increasing sea temperature. Climate change seems (in general) a potential trigger for regime shifts. In recent years we see changes in intertidal rocky shore populations and fish communities as well as an increase in harmful algal blooms in some parts of the North Sea. The cumulative environmental impact of all external pressures is not fully understood (OSPAR 2010). In paragraph 5.9 the various external impacts are shown in a diagram, including information on the part of the ecosystem where they have their main effects and including an indication of the trends (increasing or decreasing). This paragraph also contains a preliminary ranking some of the pressures according to their severity.
5.1. Fisheries
5.1.1. Mechanisms of impact
The most important factors related to fisheries that cause pressure on the North Sea ecosystem are 1) the high fishing pressure (removal of target species), 2) high discards (removal or killing of non-target species) and 3) the severe disturbance of the ocean floor
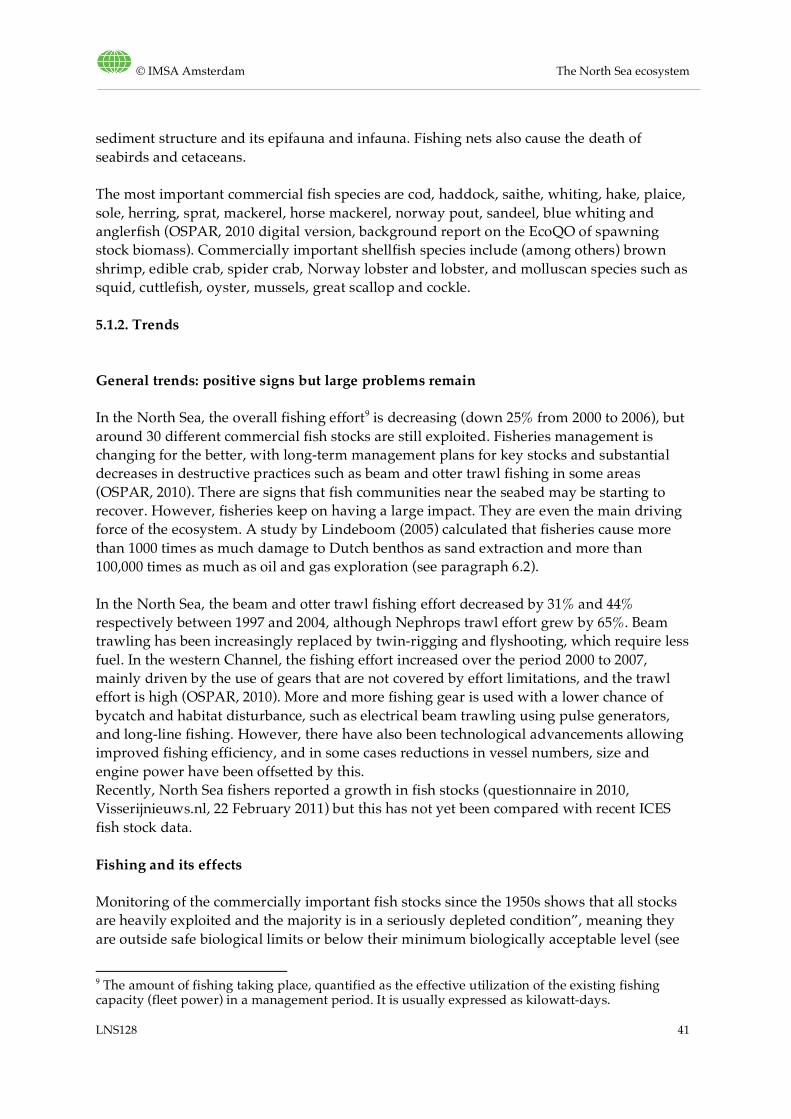
© IMSA Amsterdam The North Sea ecosystem
LNS128 41
sediment structure and its epifauna and infauna. Fishing nets also cause the death of seabirds and cetaceans. The most important commercial fish species are cod, haddock, saithe, whiting, hake, plaice, sole, herring, sprat, mackerel, horse mackerel, norway pout, sandeel, blue whiting and anglerfish (OSPAR, 2010 digital version, background report on the EcoQO of spawning stock biomass). Commercially important shellfish species include (among others) brown shrimp, edible crab, spider crab, Norway lobster and lobster, and molluscan species such as squid, cuttlefish, oyster, mussels, great scallop and cockle.
5.1.2. Trends
General trends: positive signs but large problems remain
In the North Sea, the overall fishing effort9 is decreasing (down 25% from 2000 to 2006), but around 30 different commercial fish stocks are still exploited. Fisheries management is changing for the better, with long-term management plans for key stocks and substantial decreases in destructive practices such as beam and otter trawl fishing in some areas (OSPAR, 2010). There are signs that fish communities near the seabed may be starting to recover. However, fisheries keep on having a large impact. They are even the main driving force of the ecosystem. A study by Lindeboom (2005) calculated that fisheries cause more than 1000 times as much damage to Dutch benthos as sand extraction and more than 100,000 times as much as oil and gas exploration (see paragraph 6.2). In the North Sea, the beam and otter trawl fishing effort decreased by 31% and 44% respectively between 1997 and 2004, although Nephrops trawl effort grew by 65%. Beam trawling has been increasingly replaced by twin-rigging and flyshooting, which require less fuel. In the western Channel, the fishing effort increased over the period 2000 to 2007, mainly driven by the use of gears that are not covered by effort limitations, and the trawl effort is high (OSPAR, 2010). More and more fishing gear is used with a lower chance of bycatch and habitat disturbance, such as electrical beam trawling using pulse generators, and long-line fishing. However, there have also been technological advancements allowing improved fishing efficiency, and in some cases reductions in vessel numbers, size and engine power have been offsetted by this. Recently, North Sea fishers reported a growth in fish stocks (questionnaire in 2010, Visserijnieuws.nl, 22 February 2011) but this has not yet been compared with recent ICES fish stock data.
Fishing and its effects
Monitoring of the commercially important fish stocks since the 1950s shows that all stocks are heavily exploited and the majority is in a seriously depleted condition”, meaning they are outside safe biological limits or below their minimum biologically acceptable level (see
9 The amount of fishing taking place, quantified as the effective utilization of the existing fishing capacity (fleet power) in a management period. It is usually expressed as kilowatt-days.
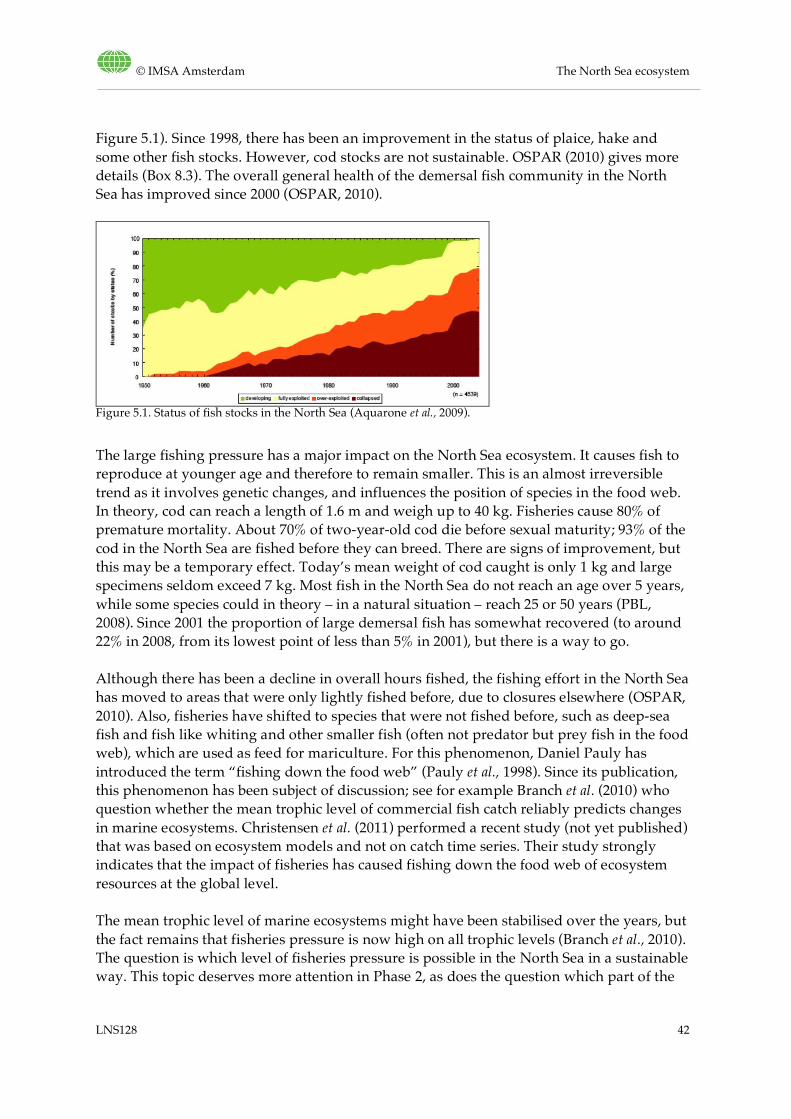
© IMSA Amsterdam The North Sea ecosystem
LNS128 42
Figure 5.1). Since 1998, there has been an improvement in the status of plaice, hake and some other fish stocks. However, cod stocks are not sustainable. OSPAR (2010) gives more details (Box 8.3). The overall general health of the demersal fish community in the North Sea has improved since 2000 (OSPAR, 2010).
Figure 5.1. Status of fish stocks in the North Sea (Aquarone et al., 2009).
The large fishing pressure has a major impact on the North Sea ecosystem. It causes fish to reproduce at younger age and therefore to remain smaller. This is an almost irreversible trend as it involves genetic changes, and influences the position of species in the food web. In theory, cod can reach a length of 1.6 m and weigh up to 40 kg. Fisheries cause 80% of premature mortality. About 70% of two-year-old cod die before sexual maturity; 93% of the cod in the North Sea are fished before they can breed. There are signs of improvement, but this may be a temporary effect. Today’s mean weight of cod caught is only 1 kg and large specimens seldom exceed 7 kg. Most fish in the North Sea do not reach an age over 5 years, while some species could in theory – in a natural situation – reach 25 or 50 years (PBL, 2008). Since 2001 the proportion of large demersal fish has somewhat recovered (to around 22% in 2008, from its lowest point of less than 5% in 2001), but there is a way to go. Although there has been a decline in overall hours fished, the fishing effort in the North Sea has moved to areas that were only lightly fished before, due to closures elsewhere (OSPAR, 2010). Also, fisheries have shifted to species that were not fished before, such as deep-sea fish and fish like whiting and other smaller fish (often not predator but prey fish in the food web), which are used as feed for mariculture. For this phenomenon, Daniel Pauly has introduced the term “fishing down the food web” (Pauly et al., 1998). Since its publication, this phenomenon has been subject of discussion; see for example Branch et al. (2010) who question whether the mean trophic level of commercial fish catch reliably predicts changes in marine ecosystems. Christensen et al. (2011) performed a recent study (not yet published) that was based on ecosystem models and not on catch time series. Their study strongly indicates that the impact of fisheries has caused fishing down the food web of ecosystem resources at the global level. The mean trophic level of marine ecosystems might have been stabilised over the years, but the fact remains that fisheries pressure is now high on all trophic levels (Branch et al., 2010). The question is which level of fisheries pressure is possible in the North Sea in a sustainable way. This topic deserves more attention in Phase 2, as does the question which part of the
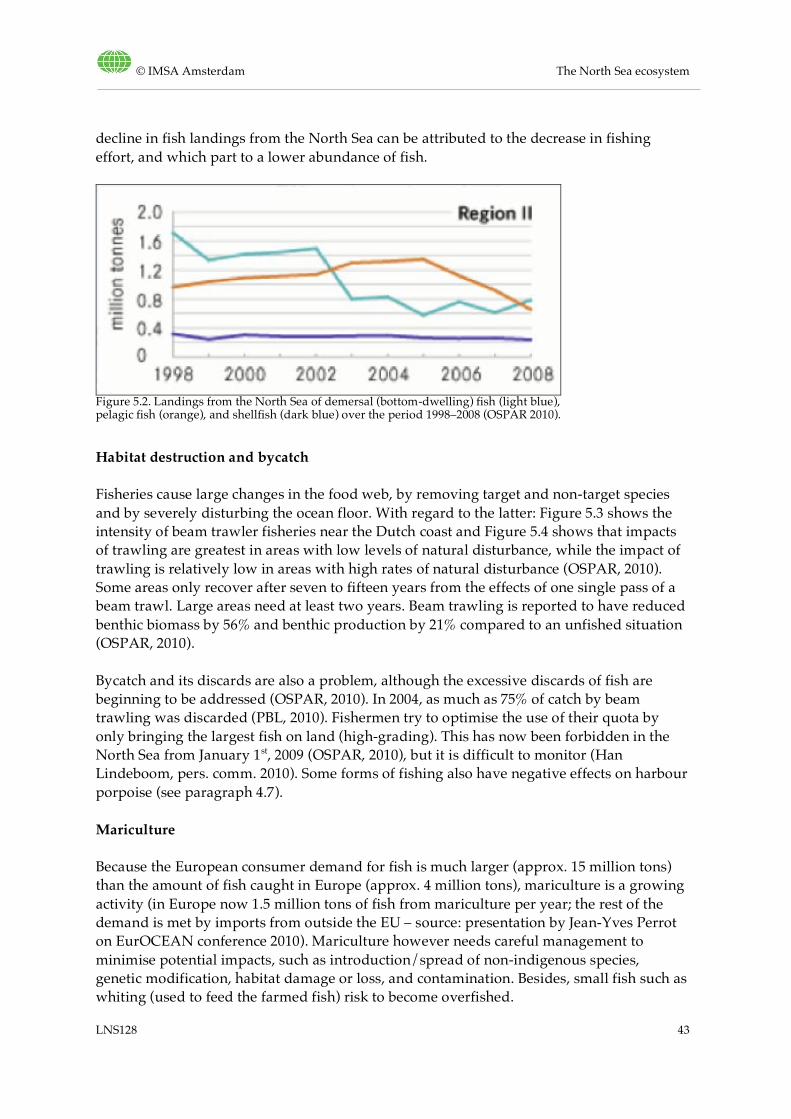
© IMSA Amsterdam The North Sea ecosystem
LNS128 43
decline in fish landings from the North Sea can be attributed to the decrease in fishing effort, and which part to a lower abundance of fish.
Figure 5.2. Landings from the North Sea of demersal (bottom-dwelling) fish (light blue), pelagic fish (orange), and shellfish (dark blue) over the period 1998–2008 (OSPAR 2010).
Habitat destruction and bycatch
Fisheries cause large changes in the food web, by removing target and non-target species and by severely disturbing the ocean floor. With regard to the latter: Figure 5.3 shows the intensity of beam trawler fisheries near the Dutch coast and Figure 5.4 shows that impacts of trawling are greatest in areas with low levels of natural disturbance, while the impact of trawling is relatively low in areas with high rates of natural disturbance (OSPAR, 2010). Some areas only recover after seven to fifteen years from the effects of one single pass of a beam trawl. Large areas need at least two years. Beam trawling is reported to have reduced benthic biomass by 56% and benthic production by 21% compared to an unfished situation (OSPAR, 2010). Bycatch and its discards are also a problem, although the excessive discards of fish are beginning to be addressed (OSPAR, 2010). In 2004, as much as 75% of catch by beam trawling was discarded (PBL, 2010). Fishermen try to optimise the use of their quota by only bringing the largest fish on land (high-grading). This has now been forbidden in the North Sea from January 1st, 2009 (OSPAR, 2010), but it is difficult to monitor (Han Lindeboom, pers. comm. 2010). Some forms of fishing also have negative effects on harbour porpoise (see paragraph 4.7).
Mariculture
Because the European consumer demand for fish is much larger (approx. 15 million tons) than the amount of fish caught in Europe (approx. 4 million tons), mariculture is a growing activity (in Europe now 1.5 million tons of fish from mariculture per year; the rest of the demand is met by imports from outside the EU – source: presentation by Jean-Yves Perrot on EurOCEAN conference 2010). Mariculture however needs careful management to minimise potential impacts, such as introduction/spread of non-indigenous species, genetic modification, habitat damage or loss, and contamination. Besides, small fish such as whiting (used to feed the farmed fish) risk to become overfished.
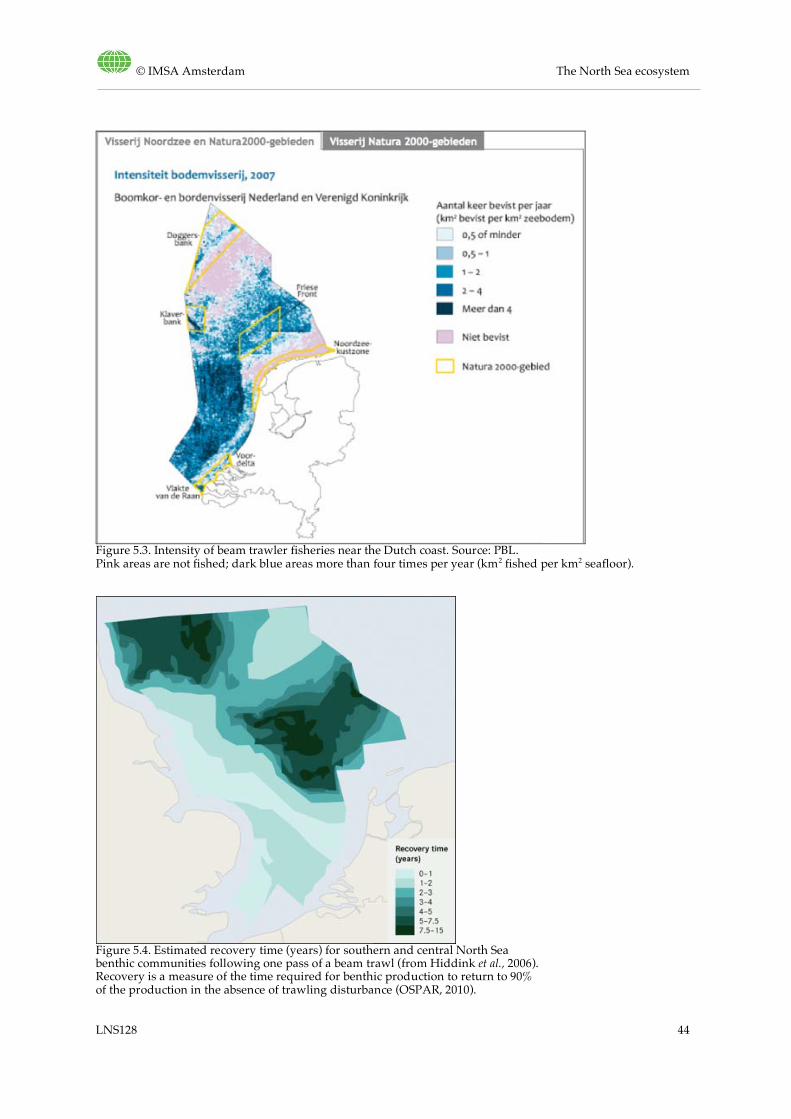
© IMSA Amsterdam The North Sea ecosystem
LNS128 44
Figure 5.3. Intensity of beam trawler fisheries near the Dutch coast. Source: PBL. Pink areas are not fished; dark blue areas more than four times per year (km2 fished per km2 seafloor).
Figure 5.4. Estimated recovery time (years) for southern and central North Sea benthic communities following one pass of a beam trawl (from Hiddink et al., 2006). Recovery is a measure of the time required for benthic production to return to 90% of the production in the absence of trawling disturbance (OSPAR, 2010).
© IMSA Amsterdam The North Sea ecosystem
LNS128 45
5.2. Climate change: increased seawater temperatures and ocean acidification
Climate change is caused by rising CO2 levels in the atmosphere. The oceans play a key role in the carbon cycle of the planet and have absorbed about one third of total anthropogenic CO2 emissions until now. Whereas on land global warming is the most well-known effect, in the oceans the warming of the water is not the only threat. More CO2 in the atmosphere also increases the amount of CO2 in the water. This leads to ocean acidification, which is a very important potential threat to marine life, especially shell-building organisms. Acidification is a consequence of the much more rapid increase of CO2 in the oceans since the industrial revolution. The CO2 does not have enough time to mix down into the deep sea, as happened in the past when CO2 concentrations went up but more slowly (good mixing prevents a high concentration in the upper layers). In the North Atlantic the anthropogenic CO2 signal already extends down to 3000 m10. Because global warming causes water temperatures to rise, the natural uptake of CO2 by oceans will eventually diminish. In the North Atlantic, a reduced flux of CO2 into surface waters has already been observed in 2002-2005 compared with 1994-1995 (Schuster & Watson, 2007). Boyce et al. (2010) suggested that increasing ocean warming is contributing to a restructuring of marine ecosystems with implications for biogeochemical cycling, fishery yields and ocean circulation. It is, however, difficult to really link recent biological trends to climate change, because non-climatic influences (eutrophication, diseases, fisheries etc.) dominate local, short-term biological changes. Furthermore, many North Sea species are long-lived. Therefore, the effects of changed conditions may not be clear immediately. And because many species have complex life histories, the effects on different life stages may vary. Finally, as the IPCC writes in its 4th Assessment Report: “Observational changes in marine and freshwater environments associated with climate change should be considered against the background of natural variation on a variety of spatial and temporal scales. While many of the biological responses have been associated with rising temperatures, distinguishing the effects of climate change embedded in natural modes of variability such as ENSO and the NAO is challenging.” In spite of the difficulties described above, Schubert et al. (2006) remark that especially for some marine regions in northern latitudes such as the North Sea, "our understanding of the ecosystem structures and their response to natural climate variability is good enough to discuss possible impacts of climate change” (CLIMAR, 2007). OSPAR (2010) writes: “Impacts of climate change and ocean acidification are now evident and are potentially the most significant threats to biodiversity.” Seawater warming has both direct and indirect effects. Direct effects are migration of species to colder water and disturbed predator-prey interactions due to time mismatches. The survival and spread of exotic species introduced by shipping or aquaculture (for example the Pacific oyster) can also be seen as a direct effect. There is also at least one
10 3000 meters is usually classified as deep sea. This is, however, not the same thing as good mixing of the upper layers and the deep sea, as in this case the upper layers contain a higher concentration of CO2 than the deep sea.
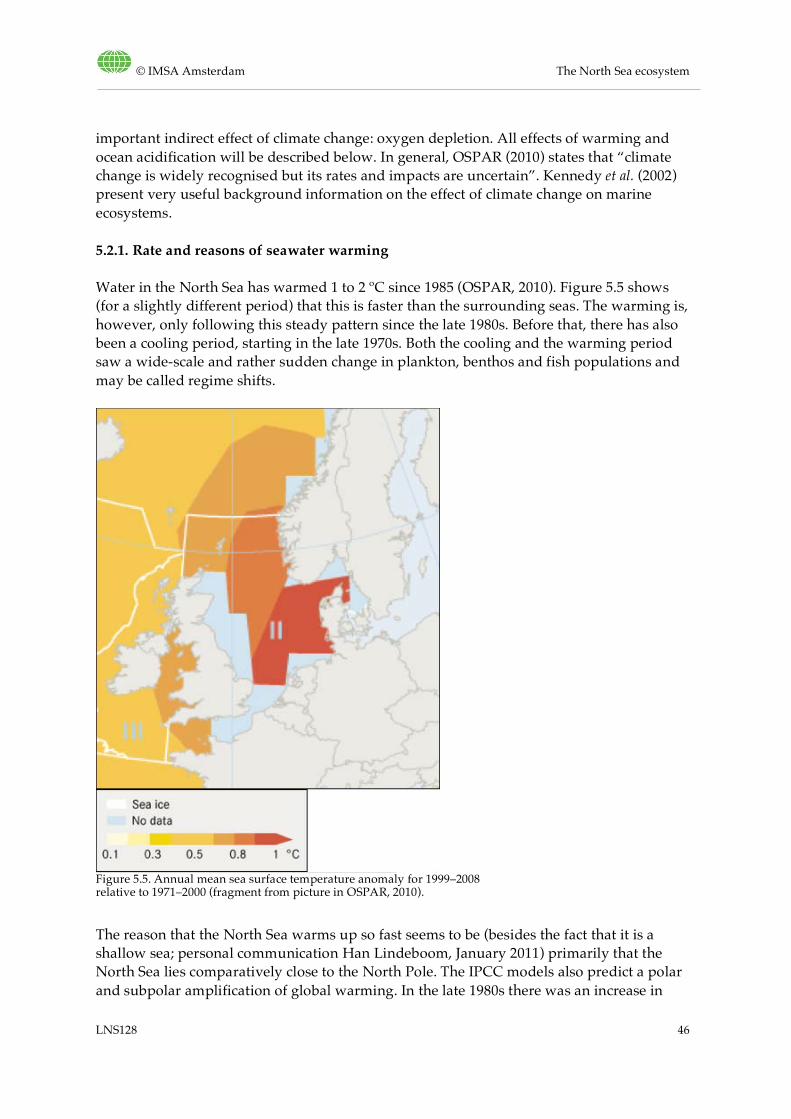
© IMSA Amsterdam The North Sea ecosystem
LNS128 46
important indirect effect of climate change: oxygen depletion. All effects of warming and ocean acidification will be described below. In general, OSPAR (2010) states that “climate change is widely recognised but its rates and impacts are uncertain”. Kennedy et al. (2002) present very useful background information on the effect of climate change on marine ecosystems.
5.2.1. Rate and reasons of seawater warming
Water in the North Sea has warmed 1 to 2 ºC since 1985 (OSPAR, 2010). Figure 5.5 shows (for a slightly different period) that this is faster than the surrounding seas. The warming is, however, only following this steady pattern since the late 1980s. Before that, there has also been a cooling period, starting in the late 1970s. Both the cooling and the warming period saw a wide-scale and rather sudden change in plankton, benthos and fish populations and may be called regime shifts.
Figure 5.5. Annual mean sea surface temperature anomaly for 1999–2008 relative to 1971–2000 (fragment from picture in OSPAR, 2010).
The reason that the North Sea warms up so fast seems to be (besides the fact that it is a shallow sea; personal communication Han Lindeboom, January 2011) primarily that the North Sea lies comparatively close to the North Pole. The IPCC models also predict a polar and subpolar amplification of global warming. In the late 1980s there was an increase in
© IMSA Amsterdam The North Sea ecosystem
LNS128 47
westerly winds, which caused the influx of warm water into the North Sea, causing in its turn, among others things, worsening conditions for cod (CLIMAR, 2007). During this recent change, a pronounced modification occurred in large-scale hydro-meteorological forcing and ecosystem parameters, including an increase in oceanic flow and sea-surface temperature (CLIMAR, 2007). There are more theories about winds and effect on warming or cooling; these may be studied in Phase 2 of LiNSI.
5.2.2. Direct effects of warming seawater
There are many evidences of shifts in biogeographical distribution and abundance at different trophic levels: in phytoplankton, zooplankton, benthos and fish species (OSPAR, 2010 and ICES, 2008). Frederiksen et al. (2006) established a climate link between four trophic levels in the North Sea: changes in phytoplankton and zooplankton have had a direct effect on sandeel populations, which lead to consequences for the breeding success of many seabirds (CLIMAR, 2008). This shows the possible profound effects on an ecosystem level from changes in the lower trophic levels. OSPAR (2010, Chapter 3) gives many more details, and more trends. Ecological responses to warming seawater include a displacement of populations: invasions of warm-water species from the south; changes in geographical distribution and abundance of populations of many fish species; changes in time of reproduction; changed predator-prey relationships; and more. Appendix XI gives more details. Box 5.1. The cod case The so-called cod case is exemplary for direct, already occurring effects: climate change causing large shifts (regime shifts) in the North Sea ecosystem (Kirby/Beaugrand, 2009). Cod larvae feed on plankton (copepods). This plankton moves from the warming North Sea up north, to cooler waters (by about 30 km per year). Cod can’t follow because the water there is too deep. As a result, North Sea cod stocks decline. This causes an explosion of crab and jellyfish populations, which were normally eaten by adult cod. Crabs eat young flatfish (such as plaice and sole). More crabs means less flatfish. So, the decline of cod had a cascading effect on the whole ecosystem. Because temperature acts on different components of the food web, the gross effect is amplified through the food web.
5.2.3. Indirect effect of warming: oxygen depletion
A consequence of seawater surface warming is also an increased ocean stratification. Among other effects, this could lead to an altered nutrient availability and thus to changes in biological productivity. OSPAR (2010) writes that there is some evidence for earlier stratification in recent years and the onset of the associated bloom. Maps exist (e.g. Digital Atlas of the North Sea, Schlüter & Jerosh, 2009) that indicate where oxygen depletion exists for part of the year.
© IMSA Amsterdam The North Sea ecosystem
LNS128 48
5.2.4. Ocean acidification
Trends in acidification
During the past 250 years (since the start of the industrial revolution), the average sea surface pH worldwide has decreased by approximately 0.1 pH units. This seems little, but because the pH scale is logarithmic, it means a 30% increase in hydrogen ions: a considerable acidification (CBD, 2009). It is predicted that by 2050 ocean acidity could increase by 150%. This is 100 times faster than any such change over the last 20 million years, and it is questionable whether biological systems will be able to adapt fast enough. Ecosystem-wide effects are expected within 50 to 100 years, including the undersaturation of calcium carbonate in seawater. Ocean acidification is a key threat (OSPAR, 2010), e.g. to shellfish and corals.
Consequences of acidification for the North Sea ecosystem
Acidification reduces the availability of carbonate minerals – important building blocks for marine plants and animals – in seawater. So, calcifying organisms have more difficulty to build up their shells. Seas on high latitudes (such as the Arctic) experience these problems earlier, because colder water naturally holds more CO2 and are more acidic than warmer waters. Therefore, they will be the first to become undersaturated (CBD, 2009). The North Sea is a bit more to the south, but Thomas et al. (2007) already found a rapid decline of the CO2 buffering capacity in the North Sea. It has been predicted that by 2100, 70% of cold-water corals worldwide will be exposed to corrosive waters. Many of the effects of ocean acidification on marine species and ecosystems will be variable and complex. Evidence from naturally acidified locations confirms that although some species may benefit, biological communities under acidified seawater conditions are less diverse and calcifying species are absent. However, many questions remain regarding the consequences (see below), and the ecological effects must be considered alongside other environmental changes (CBD, 2009). When worsening conditions for calciferous organisms causes loss of key predators or grazing species from ecosystems, this could in theory lead to major environmental phase shifts (e.g. coral to algal-dominated reefs), or favour the proliferation of non-food organisms: a negative relationship between jellyfish abundance and ocean pH has been suggested for the western central North Sea, which will allow jellyfish to take advantage of vacant niches made available by the negative effects of acidification on calcifying plankton (Attrill et al., 2007). This has been questioned, however, by other researchers. Richardson and Gibbons (2008) found no significant correlation between acidification and jellyfish abundance in the same region. Attrill, in response, admits some mistakes in their paper, but argues their conclusions remain valid (Attrill & Edwards, 2008). In some systems jellyfish are competitors and predators of fish and can replace fish as the dominant higher trophic level, negatively affecting commercial fish recruitment. Conclusion: the effects of acidification are as yet merely theoretic and have not yet been indicated in the North Sea, but they deserve more attention because of their potentially serious effects.
© IMSA Amsterdam The North Sea ecosystem
LNS128 49
CBD (2009; Scientific synthesis of the impacts of ocean acidification on marine biodiversity) provides a very complete overview of the mechanisms and consequences of ocean acidification, although not specifically for the North Sea. Acidification may also lead to acidification of body fluids in fish and invertebrates, but this has not yet been observed (OSPAR, 2010).
5.3. Pollution and waste from offshore and land-based sources
Mechanisms of impact from pollution and waste
Offshore as well as land-based activities have a significant effect on the North Sea ecosystem. The North Sea is impacted by various forms of pollution and waste. • The pollution with nutrients, leading to eutrophication, is discussed separately in
paragraph 5.4. • Marine (plastic) litter is ingested by birds and marine mammals; smaller particles also
by fish. It leads to starvation (because it fills up stomachs) or suffocation. Animals also get entangled in plastic and other litter, especially old fishing gear.
• Heavy metals and other hazardous substances, some of which, such as TBT (tributyltin, in anti-fouling paints) are now forbidden but are still in the sediment, and this will be a source for years to come).
• Radiation.
Trends in pollution and waste
The amounts of litter are a concern. OSPAR (2010) states that over 90% of fulmars (“stormvogels” in Dutch) have plastic particles in their stomachs and 45% to 60% have more than the ecological quality objective (EcoQO) set by OSPAR. Beach litter in the southern North Sea is at OSPAR-wide average (around 700 items per 100 m beach), but levels are higher in the northern North Sea (OSPAR, 2010). Heavy metal contamination is decreasing. Inputs of mercury and lead to the sea from several major rivers have dropped. Heavy metal river loads to the sea decreased substantially between 1990 and 2006, see Table 5.1. There is local variation, however. In some locations cadmium and mercury concentrations in fish and shellfish have risen, e.g. on the Dogger Bank and in the southern North Sea (OSPAR, 2010). Concentrations of metals (cadmium, mercury and lead) and persistent organic pollutants are above background in some offshore waters of the North Sea, and unacceptable in some coastal areas. Lead levels, for example, were unacceptable at 40% of locations monitored, while PAHs and PCBs were at unacceptable levels at more than half of the monitoring sites (OSPAR, 2010).
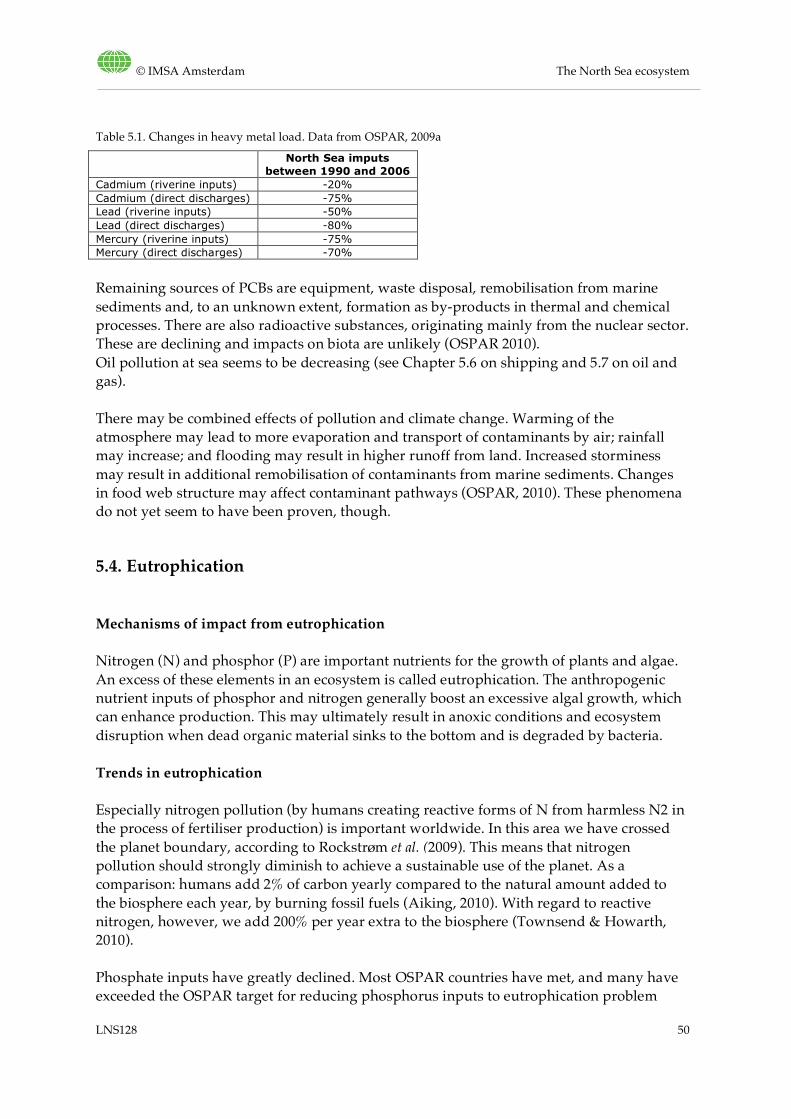
© IMSA Amsterdam The North Sea ecosystem
LNS128 50
Table 5.1. Changes in heavy metal load. Data from OSPAR, 2009a
North Sea imputs between 1990 and 2006
Cadmium (riverine inputs) -20% Cadmium (direct discharges) -75% Lead (riverine inputs) -50% Lead (direct discharges) -80% Mercury (riverine inputs) -75% Mercury (direct discharges) -70%
Remaining sources of PCBs are equipment, waste disposal, remobilisation from marine sediments and, to an unknown extent, formation as by-products in thermal and chemical processes. There are also radioactive substances, originating mainly from the nuclear sector. These are declining and impacts on biota are unlikely (OSPAR 2010). Oil pollution at sea seems to be decreasing (see Chapter 5.6 on shipping and 5.7 on oil and gas). There may be combined effects of pollution and climate change. Warming of the atmosphere may lead to more evaporation and transport of contaminants by air; rainfall may increase; and flooding may result in higher runoff from land. Increased storminess may result in additional remobilisation of contaminants from marine sediments. Changes in food web structure may affect contaminant pathways (OSPAR, 2010). These phenomena do not yet seem to have been proven, though.
5.4. Eutrophication
Mechanisms of impact from eutrophication
Nitrogen (N) and phosphor (P) are important nutrients for the growth of plants and algae. An excess of these elements in an ecosystem is called eutrophication. The anthropogenic nutrient inputs of phosphor and nitrogen generally boost an excessive algal growth, which can enhance production. This may ultimately result in anoxic conditions and ecosystem disruption when dead organic material sinks to the bottom and is degraded by bacteria.
Trends in eutrophication
Especially nitrogen pollution (by humans creating reactive forms of N from harmless N2 in the process of fertiliser production) is important worldwide. In this area we have crossed the planet boundary, according to Rockstrøm et al. (2009). This means that nitrogen pollution should strongly diminish to achieve a sustainable use of the planet. As a comparison: humans add 2% of carbon yearly compared to the natural amount added to the biosphere each year, by burning fossil fuels (Aiking, 2010). With regard to reactive nitrogen, however, we add 200% per year extra to the biosphere (Townsend & Howarth, 2010). Phosphate inputs have greatly declined. Most OSPAR countries have met, and many have exceeded the OSPAR target for reducing phosphorus inputs to eutrophication problem
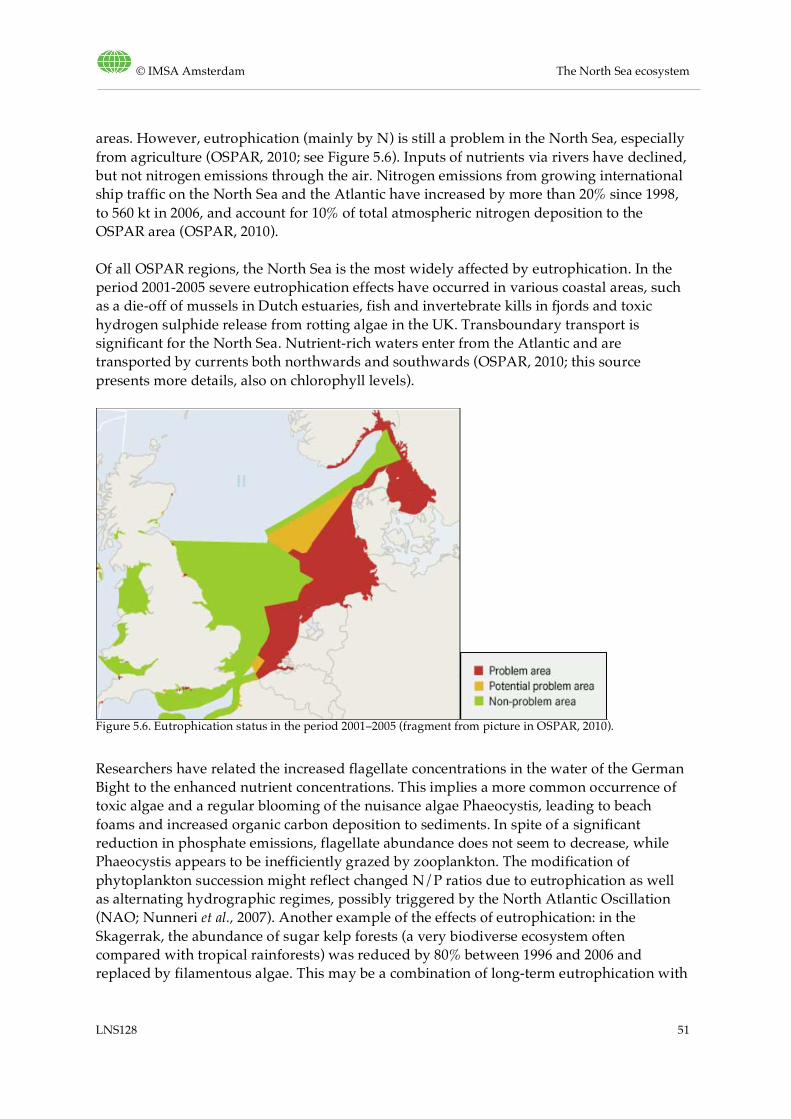
© IMSA Amsterdam The North Sea ecosystem
LNS128 51
areas. However, eutrophication (mainly by N) is still a problem in the North Sea, especially from agriculture (OSPAR, 2010; see Figure 5.6). Inputs of nutrients via rivers have declined, but not nitrogen emissions through the air. Nitrogen emissions from growing international ship traffic on the North Sea and the Atlantic have increased by more than 20% since 1998, to 560 kt in 2006, and account for 10% of total atmospheric nitrogen deposition to the OSPAR area (OSPAR, 2010). Of all OSPAR regions, the North Sea is the most widely affected by eutrophication. In the period 2001-2005 severe eutrophication effects have occurred in various coastal areas, such as a die-off of mussels in Dutch estuaries, fish and invertebrate kills in fjords and toxic hydrogen sulphide release from rotting algae in the UK. Transboundary transport is significant for the North Sea. Nutrient-rich waters enter from the Atlantic and are transported by currents both northwards and southwards (OSPAR, 2010; this source presents more details, also on chlorophyll levels).
Figure 5.6. Eutrophication status in the period 2001–2005 (fragment from picture in OSPAR, 2010).
Researchers have related the increased flagellate concentrations in the water of the German Bight to the enhanced nutrient concentrations. This implies a more common occurrence of toxic algae and a regular blooming of the nuisance algae Phaeocystis, leading to beach foams and increased organic carbon deposition to sediments. In spite of a significant reduction in phosphate emissions, flagellate abundance does not seem to decrease, while Phaeocystis appears to be inefficiently grazed by zooplankton. The modification of phytoplankton succession might reflect changed N/P ratios due to eutrophication as well as alternating hydrographic regimes, possibly triggered by the North Atlantic Oscillation (NAO; Nunneri et al., 2007). Another example of the effects of eutrophication: in the Skagerrak, the abundance of sugar kelp forests (a very biodiverse ecosystem often compared with tropical rainforests) was reduced by 80% between 1996 and 2006 and replaced by filamentous algae. This may be a combination of long-term eutrophication with
© IMSA Amsterdam The North Sea ecosystem
LNS128 52
recent higher sea temperatures. The new algae communities provide much less food and shelter (OSPAR, 2010). Since 1990 the amount of foaming algae in the North Sea goes up and down, without a real trend. These foaming algae are not toxic, but, as all algae blooms, the death of large amounts of algae can lead to an anoxic situation in the sediment and deep water layers.
5.5. Wind energy
5.5.1. Mechanisms of impact from wind energy
Offshore wind power has both positive and negative impacts on the environment. The negative environmental consequences are generally local, whereas the positive environmental consequences are global (e.g. less climate change) and exist only insofar as offshore wind power replaces other forms of fossil-based electricity generation. Furthermore, the negative (local) impacts are more severe during construction (sounds of pile driving) than after construction. The main impacts are (Snyder & Kaiser, 2009): • collisions with and avoiding behaviour of birds • noise and electric and magnetic fields • wind turbines form a hard substrate and create shelter for marine life • the area around wind turbines remains unfished.
Impact on birds
An often-repeated concern about wind farms is the risk that they will cause excessive avian mortality through collisions. The birds most at risk of collision will be seabirds, and in some cases migrating passerines. Most collisions happen in misty weather circumstances. While bird mortality increases due to the risk of colliding with offshore turbines, the rate of mortality is relatively low. On a per MW basis, fatalities range from 0.95 to 11.67 deaths per year. Wind farms may also pose barriers to birds. Birds avoiding a wind farm must spend (a lot of) energy flying around it; especially since offshore wind farms can be quite large (tens of square kilometres). This could be of particular importance if a wind farm is located in between rookeries and feeding grounds. Also, wind farms can remove essential habitat from seabirds. The latter two impacts are easily mitigated through proper spatial planning. Finally, it might be that some species of birds are attracted by the wind mills, because these artificial hard substrates enhance underwater fish densities. This may increase the risk of collision but this hypothesis has not yet been further researched in the context of this background report.
Noise and electric and magnetic fields
Underwater noise is receiving a lot of research attention in the last few years, also in OSPAR. Cetaceans use echolocation to find food and communicate through acoustic signals. As a result many cetaceans, particularly porpoises, have very sensitive hearing, which can be damaged by the loud noises associated with wind farms, particularly the
© IMSA Amsterdam The North Sea ecosystem
LNS128 53
sounds of pile driving. About the exact distance on which effects may occur, there is still discussion. According to Thomsen et al. (2006) pile driving would be audible to porpoises and seals for at least 80 km and might cause behavioural responses up to 20 km away. Hearing loss for harbour porpoises may extend 1.8 km away from the source and once their hearing is impacted, they die of starvation. Bailey et al. (2010) find that “for bottlenose dolphins, auditory injury would only have occurred within 100 m of the pile-driving and behavioural disturbance, defined as modifications in behaviour, could have occurred up to 50 km away”. During operation noise pollution from the wind turbines may be detectable for harbour porpoises on a distance of 20-70 m from turbines and for harbour seals between < 100 m and several kilometres from the turbine (Tougaard et al., 2009). Fish can also be very sensitive to loud sounds and could be displaced during wind farm construction. However, there is a great deal of variability among fish auditory systems and different species of fish will respond differently to noise from underwater construction. Like all electricity-generating facilities, wind turbines produce electric and magnetic fields. Many fish species are sensitive to these fields because they use their perception of electric and magnetic fields for orientation and prey detection. The wind turbines may disturb this but knowledge on this subject is still limited (Gill, 2005).
Creation of substrate and shelter
Discussion also has arisen on the potential positive impacts of offshore wind farms on marine life (esp. fish and fisheries). After construction of an offshore wind farm, turbine foundations could act as fish aggregating devices. The foundations could serve as a substrate for benthic invertebrates, thereby attracting fish. Wind turbines also form zones free of fishing, with a diameter of one kilometre.
5.5.2. Trends in wind energy
Most of the wind farms planned in the OSPAR region are planned in the North Sea part. The number of offshore wind farms in the OSPAR area has grown substantially over the past ten years and if all farms authorised and applied for in 2009 are developed, the number of offshore turbines in the OSPAR area will increase almost tenfold. The potential for cumulative and transboundary effects (particularly on migratory species) will increase as more wind farms are developed.
© IMSA Amsterdam The North Sea ecosystem
LNS128 54
5.6. Shipping
Mechanisms of impact from shipping
The impact of shipping is mainly via ballast water and fouling (exotic species), calamities (oil, other chemicals) and dumping of litter. Figure 5.7 shows the heavy shipping traffic in the North Sea, although this picture does not show differences in the intensity of specific routes very well. For example, shipping intensity is large towards Rotterdam and Hamburg, and much less to other destinations (pers. comm. Han Lindeboom, Jan. 2011). In Appendix XI (Competition for space) an illustration showing this is included. “Some 20% of sea pollution comes from the deliberate dumping of oil and other wastes from ships, from accidental spills and offshore oil drilling. But of all the sources of marine pollution, the discharge of oily engine wastes and bilge from day-to-day shipping operations may be the worst, because it is steady and occurs everywhere. Even low levels of contamination can kill larvae and cause disease. Oil slicks kill birds, marine mammals and fish, particularly near coasts, and coagulated oil destroys coastal habitats” (UNEP Regional Seas Programme). “Ship emissions account for a large part of the secondary inorganic aerosol formation in North Sea coastal areas. Ship emissions contribute to a large extent, particularly in summer, to air pollution in coastal areas. It can be expected that the secondary aerosol formation over the North Sea will have additional adverse effects on the eutrophication of North Sea coastal waters and ecosystems at the eastern border of the North Sea” (Matthias et al., 2010). Air pollution includes CO2, NOx, PM10 and SOx. Other impacts from shipping are pollution through loss of ships and cargo, noise and collisions with marine mammals (OSPAR, 2010).
Trends in shipping
The North Sea has some of the busiest shipping lanes in the world (OSPAR, 2010). Ship traffic in the North Sea has increased over the past 20 years (more and larger ships). Illegal discharges of oil or oily wastes are still occurring. It is not possible to say which oil at sea has been caused by shipping. However, monitoring on oiled guillemots suggests that the oil pollution has been decreasing (OSPAR 2010). Nitrogen emissions from this growing international ship traffic on the North Sea and the Atlantic have increased by more than 20% since 1998, to 560 kt in 2006, and account for 10% of total atmospheric nitrogen deposition to the OSPAR area. Apart from nitrogen, also other forms of air pollution from shipping have increased (OSPAR, 2010). Predictions for shipping are difficult because of the dependency on economic and geopolitical issues (and of future human behaviour such as consumer preferences for local or imported food). A main cause of the increase of the risks of shipping is that ships become larger. The absolute amount of ships grows less fast. However, through-traffic of
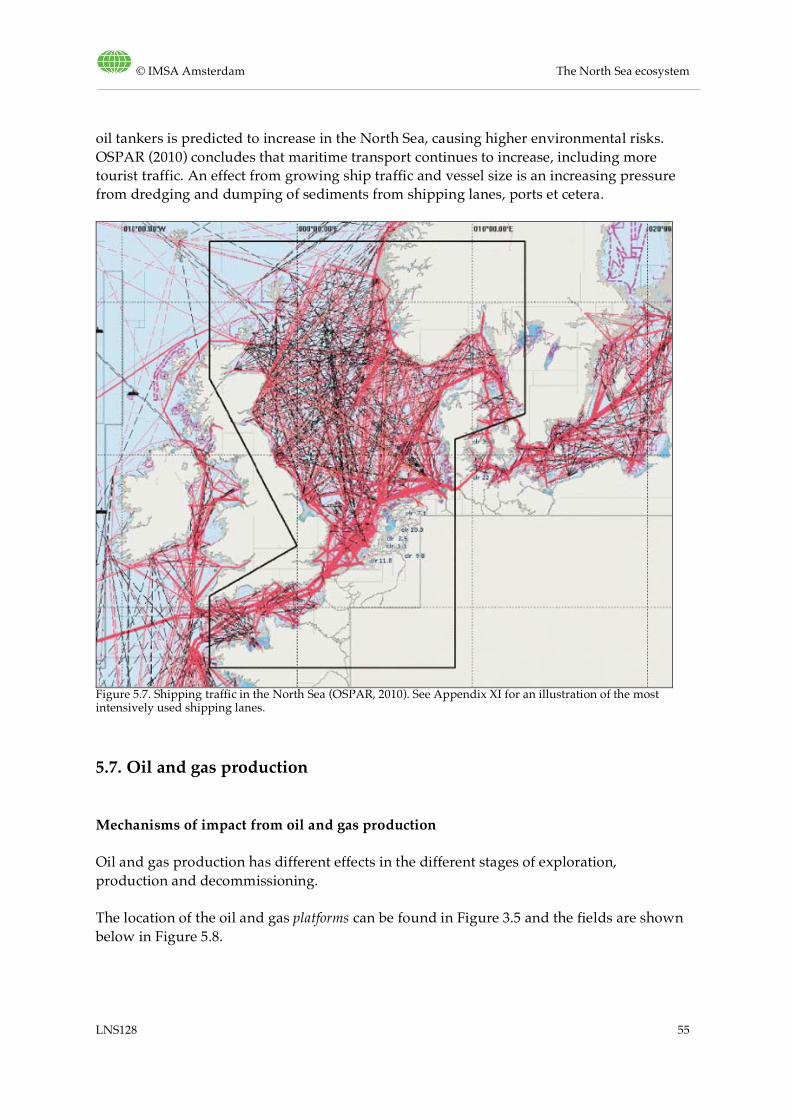
© IMSA Amsterdam The North Sea ecosystem
LNS128 55
oil tankers is predicted to increase in the North Sea, causing higher environmental risks. OSPAR (2010) concludes that maritime transport continues to increase, including more tourist traffic. An effect from growing ship traffic and vessel size is an increasing pressure from dredging and dumping of sediments from shipping lanes, ports et cetera.
Figure 5.7. Shipping traffic in the North Sea (OSPAR, 2010). See Appendix XI for an illustration of the most intensively used shipping lanes.
5.7. Oil and gas production
Mechanisms of impact from oil and gas production
Oil and gas production has different effects in the different stages of exploration, production and decommissioning. The location of the oil and gas platforms can be found in Figure 3.5 and the fields are shown below in Figure 5.8.
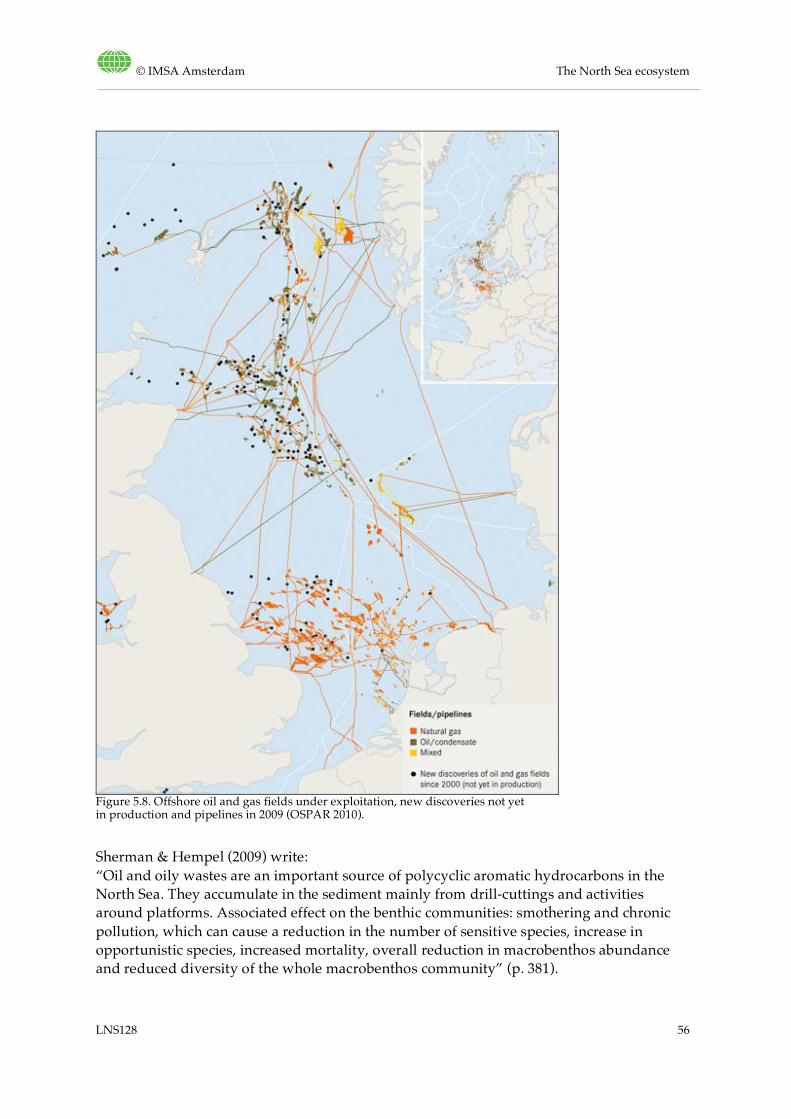
© IMSA Amsterdam The North Sea ecosystem
LNS128 56
Figure 5.8. Offshore oil and gas fields under exploitation, new discoveries not yet in production and pipelines in 2009 (OSPAR 2010).
Sherman & Hempel (2009) write: “Oil and oily wastes are an important source of polycyclic aromatic hydrocarbons in the North Sea. They accumulate in the sediment mainly from drill-cuttings and activities around platforms. Associated effect on the benthic communities: smothering and chronic pollution, which can cause a reduction in the number of sensitive species, increase in opportunistic species, increased mortality, overall reduction in macrobenthos abundance and reduced diversity of the whole macrobenthos community” (p. 381).
© IMSA Amsterdam The North Sea ecosystem
LNS128 57
OSPAR (2010) mentions the following pressures from oil and gas platforms: water (containing hazardous substances) produced and discharged during routine production; rests of drilling fluids; emissions of volatile compounds; physical seabed disturbance during installation of pipelines etc.; and underwater noise (for more information about underwater noise and its effects, see Chapter 5.5.1). The level of underwater noise of oil and gas production as compared to wind turbines is not researched in this phase of this LiNSI background report. There are also transport movements around platforms. In the coming years, many platforms in the North Sea will stop production and have to be decommissioned. Decommissioning itself may have harmful effects (for more information, see IMSA Amsterdam, 2011c). There is also a positive effect of oil and gas platforms: in the area around them (circle of one kilometre diameter) commercial fishing is prohibited. Therefore, these areas may be used as a reference (good environmental status) when assessing the environmental status of other stretches of ocean in the context of European environmental legislation. However, sometimes fishing takes place anyhow, and the presence of a platform (and often the presence of pollution from oil-based muds) may be an extra factor to take into account. In this LiNSI background report, not much research attention has been given to the local ecosystem characteristics at the location of the oil and gas platforms. For example: it could be interesting to know which platforms are located in frontal zones, because of the often high biodiversity in these areas. Appendix VIII contains some trials to project oil and gas platforms in other maps (such as a map showing frontal zones). This subject has also been partly dealt with in IMSA Amsterdam (2011c), which for example shows the location of oil and gas platforms in a seabed substrate map.
Trends in oil and gas production
The following trends can be observed (for the entire OSPAR area). • The amount of oil in produced water has decreased. • Most oil spills are small (no more than a tonne). • Discharges of contaminated cuttings have largely stopped. • Some emissions to air are decreasing (but CO2 and nitrogen oxides are stable). • In regions such as the Ekofisk region in Norway, where discharges have been reduced
and concentrations of oil (and barite) in sediments have decreased, there is a clear recovery of the sediment dwelling animal communities: the area disturbed fell by 85% to less than 20 km2 between 1996 and 2005. Ekofisk is a mature production site. At younger sites, areas impacted by oil and barium are still increasing (OSPAR, 2010).
For the North Sea itself, OSPAR (2010) mentions that the OSPAR strategy objectives for the offshore oil and gas industry to prevent or eliminate pollution have been partly achieved, the environmental status has improved between 1998 and 2006, and the outlook is that pressures will further decrease.
© IMSA Amsterdam The North Sea ecosystem
LNS128 58
5.8. Other impacts and issues
Other impacts include: sand and gravel dredging, hazardous and radioactive substances, other forms of energy production (tidal, osmotic), defence, recreation and tourism, dredging, microbiological pollution and some others. Some of these are included in previous chapters. The various ways in which these activities have an impact are explained well in OSPAR (2010) and will partly be left out below; main trends are included. Finally one other issue is described: the scarcity of research data.
Tourism
The total of visitors has increased steadily. There are continued increases in coastal infrastructure, and there is an increasing demand for resources. OSPAR (2010) predicts more tourist traffic. Tourism is an important source of marine litter (UNEP, 2009).
Sand and gravel extraction and sand suppletion
About 80% of the total volume of sand and gravel extracted in the OSPAR area is extracted from the North Sea, mainly by the Netherlands, the UK, France and Denmark. The main effect of extraction is the removal of substrate and associated organisms. The plumes of suspended material are considered negligible, although locally smothering and decreased visibility may have an effect. Recolonisation of substrate goes quite quickly after short-term extraction activities (2-4 years). However, after intensive or protracted periods of extraction, significant changes in community structure may occur, persisting over many years (OSPAR background report in OSPAR 2010 digital version: Summary assessment of sand and gravel extraction; 2009). The same happens when gravel is removed entirely. Sand and gravel extraction also causes underwater noise. The demand for marine sand and gravel in coastal protection schemes is likely to increase as a result of sea level rise and growth in infrastructure projects (OSPAR, 2010). Sand suppletion causes habitats to be buried under a layer of sand. Especially some types of shellfish need several years for full recovery. This in turn may impact (shellfish-eating) duck numbers. Worm populations recover much faster, so the impact on (worm-eating) fish is not very large (Ecomare encyclopedy).
Military exercises
• Military exercises (for example shooting exercises and landings on beaches) cause noise and visual disturbance of birds and seals.
• Vast amounts of munitions are dumped and lost in the North Sea, but most are very close to the coast. They are a threat to fishermen, but also to marine mammals (which have been reported as being killed within four kilometre of explosions). Not only controlled explosion of explosives found in sea takes place, but sometimes explosives found on land are transported into the sea to bring them to explosion (personal communication Joop Coolen, March 2011).
• Ships cause pollution (see shipping).
© IMSA Amsterdam The North Sea ecosystem
LNS128 59
Scarcity of research data
Because oceans are very dynamic ecosystems, numbers of individuals per species and distribution patterns of species can vary greatly from year to year. Therefore long datasets are necessary when researching the development of species. Monitoring at sea is expensive, though, and for many species there is no monitoring programme (this is for example the case for 60% of all marine target species of the Dutch “Ecologic Main Structure” (EHS; source PBL, 2008). In contrast, commercially important fish species are well researched. The normal variability of populations, among others due to changing ocean circulation and natural climatic variation, is large. Data are often collected or presented for only one country, or data collection is organised per sector.
Other issues
There are more issues that are not further described here but may be discussed in Phase 2, such as building works along coastlines, future carbon capture and storage (CCS), seismic surveys and sonar.
© IMSA Amsterdam The North Sea ecosystem
LNS128 60
6. The ecosystem quality of the North Sea today
It is common knowledge that the North Sea ecosystem is not in an excellent state and that this is largely caused by human pressures. But can the ecosystem quality be called moderate, bad, or even very bad? And is it improving? It is a little too early for such general statements. This is illustrated by the fact that OSPAR (2010) acknowledges that its set of EcoQOs is still incomplete and should be further developed in order to be able to deliver sufficient information to the European Marine Framework Directive (this directive asks for the definition of a good environmental status of the North Sea and an assessment of how this compares to the actual situation). Because there are no general statements to quote, in this chapter we give our own preliminary vision on what we think can be concluded about the quality of the North Sea ecosystem. This is based on the research in Phase 1 and on a number of quotes from the OSPAR Quality Status Report 2010 and other sources. We start with an overview of the external impacts and a discussion about how these impacts could be ranked in order of importance. We end with directions on how to improve the ecosystem quality, according to OSPAR (2010). Our own view on this topic will be further developed in Phase 2.
6.1. Graphic representation of human impacts on different ecosystem components
The graph on the next page is still in a sketching phase. The figure shows the different key ecosystem components of the North Sea. The coloured dots in the legend below indicate on which ecosystem component (with corresponding colour) each human impact has its main influence(s). Indirect effects are not taken into account (e.g. mariculture has an impact on water and fish (escaped farmed fish etc.), and this in turn affects birds and marine mammals, but mariculture does not receive a dot for the birds component as an impact on an inner ring usually has an impact on outer rings as a consequence). Arrows indicate whether the trend in the past ten years has been towards an increase or a decrease (or both, in case there are various different effects of one human impact). Arrows are based on the information in OSPAR (2010); the dots are our own preliminary estimations.
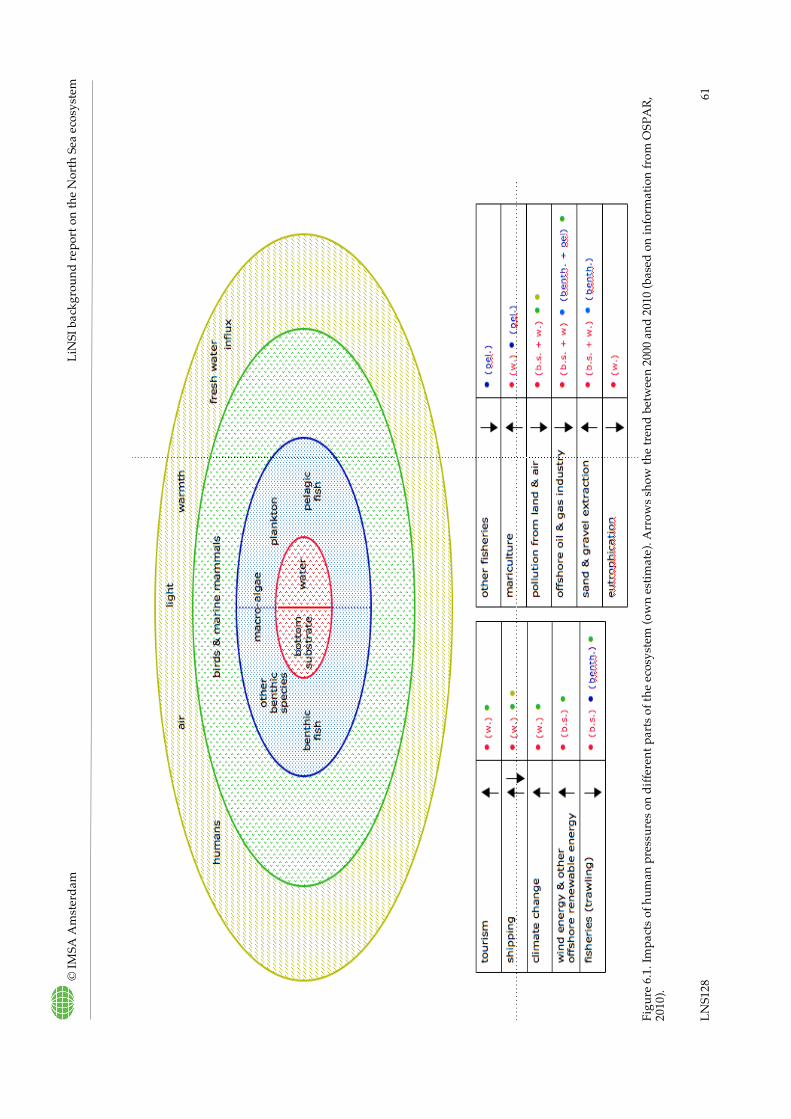
©
IMSA
Am
ster
dam
Li
NSI
bac
kgro
und
repo
rt o
n th
e N
orth
Sea
eco
syst
em
LNS1
28
61
Fi
gure
6.1
. Im
pact
s of
hum
an p
ress
ures
on
diffe
rent
par
ts o
f the
eco
syst
em (o
wn
estim
ate)
. Arr
ows s
how
the
tren
d be
twee
n 20
00 a
nd 2
010
(bas
ed o
n in
form
atio
n fr
om O
SPA
R,
2010
).
© IMSA Amsterdam LiNSI background report on the North Sea ecosystem
LNS128 62
6.2. Which pressures are having the largest impact?
It is understandable that parties or sectors, which perform activities in the North Sea, are interested to know how their impact on the ecosystem compares with the impact of other parties. It is also very important to know this when we want to take action and improve a certain aspect of the ecosystem quality: to really improve the situation, it is necessary to intervene in those activities that have the largest effect. At this moment, the only available study known to us that aims to compare the importance of all human effects on the North Sea ecosystem is the OSPAR QSR 2010, and especially a background report to this QSR called “The Utrecht Workshop”. However, these two sources do not really compare or rank sectors, but they compare types of impact. For example: they do not compare fisheries with oil and gas production and sand extraction, but they compare “removal of species, target and non-target” with “hazardous substances” and “habitat damage”. Fisheries are of course always recognisable because there is no other large sector in the North Sea causing “removal of species”, but “hazardous substances” also includes radioactive waste from nuclear energy production, anti-fouling paint from shipping and so on, and it is not possible to see which part of the impact comes from which sector. Furthermore, “comparing” is not really what they did: they merely assess the impact (low, moderate, high) for each pressure. Another useful study is one by Han Lindeboom (2010). Both are described below.
OSPAR 2010 and the Utrecht Workshop
During the Utrecht Workshop (9-13 February 2009), 70 experts of marine science (from all OSPAR regions) together assessed on the scale of the OSPAR regions the impact of pressures from human activities and from climate change on eight ecosystem components: four species groups and four habitat types. The assessment drew upon data from the QSR, and collective expert knowledge. For each component, a total status assessment was given as well. A table with the results is shown in Figure 6.2 (legend and figure number on the next page). For the North Sea (Region 2) habitat damage and removal of species in shallow sediment habitats were marked as high impact. The total status assessment per ecosystem component was only marked as good for seals and the deeper deep-sea habitats; fish, seabirds, “rock and biogenic reef habitats” and “shelf sediment habitats” scored moderate and “shallow sediment habitats” scored poor. For cetaceans the confidence of data was too low for a status to be assigned.
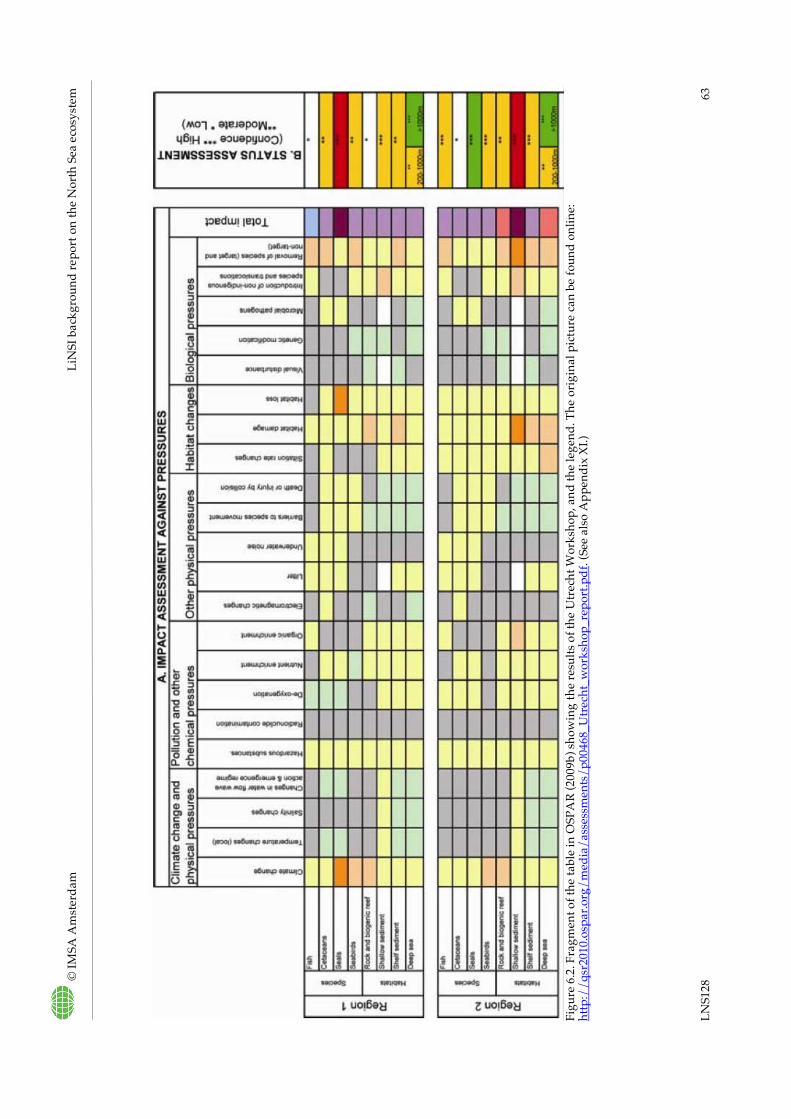
©
IMSA
Am
ster
dam
Li
NSI
bac
kgro
und
repo
rt o
n th
e N
orth
Sea
eco
syst
em
LNS1
28
63
Fi
gure
6.2
. Fra
gmen
t of t
he ta
ble
in O
SPA
R (2
009b
) sho
win
g th
e re
sults
of t
he U
trec
ht W
orks
hop,
and
the
lege
nd. T
he o
rigi
nal p
ictu
re c
an b
e fo
und
onlin
e:
http
://q
sr20
10.o
spar
.org
/med
ia/a
sses
smen
ts/p
0046
8_U
trec
ht_w
orks
hop_
repo
rt.p
df. (
See
also
App
endi
x X
I.)
© IMSA Amsterdam The North Sea ecosystem
LNS128 64
Below are two quotes from OSPAR (2010) where an order of importance is given. “There is an urgent need for effective protection and conservation of the threatened and/or declining species and habitats on OSPAR’s List, which are primarily affected by pressure from fishing, general environmental status and the developing pressures from climate change” (OSPAR, 2010). “The key pressure affecting the species listed is the removal of target and non-target species, mainly as a result of fishing, while other key pressures include habitat loss or damage, and pollution. Large-scale oceanographic changes associated with climate change (...) are likely to become increasingly important in the coming decades. Other pressures include the introduction of non-indigenous species and litter” (OSPAR, 2010). The QSR 2000 identified as issues of high importance in Region 2: “impacts of fisheries; hazardous substances, especially persistent organic pollutants; nutrient inputs from land; and a lack of knowledge on climate change” (OSPAR 2000). An overview of the status of all EcoQOs is in Appendix XIII.
Study by Han Lindeboom
Another study that gives input for a possible ranking of activities/sectors is “Comparison of effects of fishing with effects of natural events and non-fishing anthropogenic impacts on benthic habitats” by Han Lindeboom (2005). This study does compare sectors, although only three sectors are taken into account (fisheries, sand extraction and oil and gas extraction), and only the impact on benthic fauna and this only for the Dutch part of the North Sea. He concludes that presently (2005) the impact of fisheries on the benthic fauna is 1000 times higher than that of sand extraction and 100,000 times higher than that of the oil and gas exploration.
Conclusions
A full ranking of the impact of the different sectors and activities in the North Sea cannot yet be made. However, it is clear that fisheries are having by far the largest negative impact, although there are signs that the impact is starting to decline due to lower fishing intensities. Climate change is also having a large impact, but this factor is not diminishing but increasing. Sand dredging is, at least for benthos and in the Netherlands, less damaging than fisheries but more damaging than oil and gas exploration (and expected to increase). All other sectors or activities have less effects than fisheries. Since OSPAR (2010) does not assess the impact of sectors but of pressures such as “hazardous substances” or “underwater noise”, we cannot use that report to rank the influence of the different sectors.
6.3. Discussion and conclusions about North Sea quality status
As explained in Chapter 6.2, the Utrecht Workshop (part of the OSPAR assessment 2010) formulates a total status assessment per ecosystem component. Of the eight components taken into account, only seals and the deeper deep-sea habitats score good; fish, seabirds, “rock and biogenic reef habitats”, “shelf sediment habitats” and the upper part of the deep-
© IMSA Amsterdam The North Sea ecosystem
LNS128 65
sea score moderate and “shallow sediment habitats” score poor. The Utrecht Workshop nor the final OSPAR QSR report 2010 give a grand total assessment, but the average value from the above component assessments11 is moderate. That the ecosystem is not in a good state can also be concluded from a quotation from the OSPAR QSR 2010 about EcoQOs. These quality indicators are formulated as “objectives” and when all EcoQOs are achieved, the ecosystem is assumed to be in a good state. “The evaluation shows that the objectives set have mostly not yet been achieved and that continued efforts are needed to improve the quality of the North Sea” (OSPAR, 2010). The QSR does not make any general statement about the trend in quality of the North Sea ecosystem either (such as: the quality of the North Sea ecosystem is deteriorating/ improving or the biodiversity is in decline/recovering). However, the QSR does mention a number of observations (see Appendix XIV) that show that at least: • the biodiversity is changing and species and habitats that used to be abundant in the
past are now declining and • the quality of the ecosystem is now worse than it used to be some decennia ago. Ad 1. The fact that species and habitats that used to be abundant in the past are now declining, does not necessarily mean that the biodiversity is in decline. Many new species have been colonizing the North Sea from the south, partly as a result of climate change in the past 30 years, and new species have been introduced by ballast water. Most of these add to biodiversity, apart from some that aggressively outcompete other species (Gollash et al., 2009). Additionally, new habitats have been created by humans (such as oil platforms), and some of the human pressures show (recent) trends towards improvement. The Quality Status Report does not pronounce upon the net change in biodiversity. It could be argued that because of the many new species, the net biodiversity, could actually be increasing (personal communication Han Lindeboom, February 2011). The fact remains, however, that it is mostly the more vulnerable habitats and the more vulnerable, long-lived species which make high demands upon their environment that are in decline (e.g. rays, sharks, ocean quahogs, corals, sea grass beds). Because of this, OSPAR righteously pays much attention to the conservation of these species and habitats.
Ad 2. With regard to human pressures: some pressures are decreasing (such as less phosphate pollution, less damaging fishing methods, less oil pollution from oil platforms), but there are also pressures that are increasing (underwater noise, sand and gravel extraction, climate change etc.) At this moment it is hardly possible to give an indication as to whether the quality of the ecosystem is in a net decline or not, and “ecosystem quality” does not yet contain information about ecosystem functioning. The functional aspects of the ecosystem are much less well monitored than aspects like the abundance of protected species12. The method used for status assessment at the Utrecht Workshop did not take into account relationships between ecosystem components (for example indirect effects). It is also in the “lessons learnt” from the Utrecht Workshop that the further development of ecosystem-assessment methodologies needs to be supported by aggregation and integration 11 Calculation: one and a halve good, plus four and a half moderate, plus one poor, divided by seven. 12 For example: we have information about the trend in the amount of plastic in birds’ stomachs, but we don’t know what the result is on prey fish populations if these birds have more or less plastic in their stomachs.
© IMSA Amsterdam The North Sea ecosystem
LNS128 66
techniques that take into account the interactions of the components as part of ecosystem functioning (OSPAR, 2009b). In other words: we now know that the ecosystem quality is only moderate and not good, but we don’t know whether this also means that the ecosystem functions less well than it used to do. Therefore we can't judge whether there is a loss of resilience, ecosystem stability or ecosystem services. In Appendix XIV are more quotes from OSPAR (2010), that we have used to formulate our conclusions in this chapter and Chapter 6.5. In addition to OSPAR (2010), also McGlade (2002) has a chapter on the assessment of the North Sea ecosystem. Unfortunately the exact method is not included in the book. From the resulting graph however (see Appendix XII) it can be concluded that biodiversity and especially trophic stability show a decline. Three remarks from her conclusions are interesting for our discussion. She writes that: • “...the measures also suggest that the changes observed in trophic structure are
indicative of a trend towards decreasing resilience” • ”...the trend is not only a response to fishing pressure and resource exploitation, but also
to inter-annual changes in physical oceanography of the North Atlantic” • “Overall, despite several decades of increasing exploitation, the North Sea Large Marine
Ecosystem has provided and continues to provide a high level of goods and services to the human and biological communities that rely on it” (McGlade, 2002).
6.4. Our preliminary conclusions about the ecosystem quality of the North Sea
Based upon the sources mentioned above, we estimate that at least the North Sea ecosystem has been in decline in the past decennia (especially since the start of large-scale trawling and industrial fishing); that the situation is still very serious (many endangered and declining species and habitats; that the total quality assessment score is moderate (if we simply13 average the assessment scores for the separate ecosystem components), but that there are signs of improvement on certain aspects; and that research in the coming years will have to show: • whether the decline in species and habitats also means a degradation of the ecosystem as
a whole or not (including loss of ecosystem functions and/or decreasing resilience), and • whether the decline is now perhaps slowing down.
6.5. Directions for improving the ecosystem quality
OSPAR (2010) gives some directions regarding what should be done to improve the quality of the North Sea ecosystem. Of course much more can be said about this, but we consider this quotation sufficient for Phase 1 of LiNSI.
13 This average is not an official assessment score, see paragraphs before.
© IMSA Amsterdam The North Sea ecosystem
LNS128 67
• Develop coordinated spatial planning. With pressure from multiple activities increasing and intense competition for space, improved marine spatial management is particularly urgent.
• Promote further action to manage fishing effort. OSPAR must keep cooperating with the fisheries authorities to support sustainable management of fishing, including reductions in discards, improved stock assessments and better reporting and mitigation of bycatch of marine mammals and long-lived shark, skate and ray species.
• Focused targets to reduce pollution. Efforts to reduce pollution from nutrients, hazardous substances and the oil and gas industry should now be focused on problem areas and regional hotspots, with appropriate reduction targets for discharges and losses in particular places (OSPAR, 2010).
© IMSA Amsterdam The North Sea ecosystem
LNS128 68
7. Conclusions
7.1. Conclusions about the characteristics of the North Sea ecosystem
The North Sea has a high productivity and is rich in marine life. The northern and southern North Sea have different characteristics. The southern North Sea has little stratification and has a predominantly sandy substrate. It has a higher productivity and total biomass, but a lower biodiversity than the northern North Sea. The north becomes stratified in summer and has more hard substrates. Because of the diversity in abiotic characteristics, the number of different habitats in the North Sea is also large, as is the biodiversity. There are biodiversity hotspots, both on a local and on a regional scale. There is a lot of knowledge about individual species, especially fish and threatened species. Knowledge of habitats is less good but increasing. Structure and functioning of the ecosystem, however, are much less well understood, including the relation between organisms and oceanography (and for example the influence of seawater warming on the relationships between organisms). This makes an assessment of ecosystem quality more difficult. The North Sea ecosystem is rather unique in that it is a large area of shallow sea (apart from the most northern part) with large parts of sandy substrate. This poses the (in this report still unanswered) question whether additional hard substrates such as oil and gas platforms should be seen as positive, because they add a habitat that is not abundant, or negative, because the large amount of sandy substrate is part of what makes the North Sea unique. The nature of the sediment is, however, not the only factor determining fauna distribution; bottom water temperature, bottom water salinity and tidal stress also play an important role (Reiss & Rees, 2007). The North Sea is also heavily exploited. Together with external factors such as climate change, this is the reason that the quality of the ecosystem is not good. If we want to repair and restrict the damage to the ecosystem and take a new route of more careful use of the sea, we need to have a good insight in the structure and functioning of the ecosystem and the ways in which it is impacted by human activities.
7.2. Conclusions on the ranking of external factors
A full ranking of the impact of the different sectors and activities in the North Sea cannot yet be made. However, the research in this report indicates that the oil and gas sector is certainly not the largest external pressure to the North Sea ecosystem; rather, it is one of a fairly large group of moderate impacts. Next to negative impacts, it has the positive impact of adding a hard substrate habitat that is otherwise quite rare in major parts of the North
© IMSA Amsterdam The North Sea ecosystem
LNS128 69
Sea, especially in the south. Furthermore, the total impact of the oil and gas sector is expected to decrease because of decommissioning. Other decreasing impacts are pollution, eutrophication and fisheries (trawling and other types of fisheries). At the moment, however, it is clear that fisheries are still having by far the largest negative impact: one study even concludes that (in 2005 in the Netherlands) the impact of fisheries on the benthic fauna is 1000 times higher than that of sand extraction and 100,000 times higher than that of oil and gas exploration. Several sources mention that fisheries are the main driving force of the ecosystem. Climate change is also having an important impact and this factor is not diminishing but increasing. Seawater warming is causing biodiversity to change; changing wind forces alter stratification. And ocean acidification, if worsening, is a most threatening effect of the increase in atmospheric CO2 concentration. Sand dredging is, at least for benthos and in the Netherlands, less damaging than fisheries, but more damaging than oil and gas exploration, and expected to increase. All other sectors or activities have less effect than fisheries, but because OSPAR (2010) does not assess the impact of sectors but of pressures such as “hazardous substances” or “underwater noise”, we cannot use that report to rank the influence of the different sectors. The effects of tourism, offshore renewable energy and mariculture are expected to increase, while the different effects of shipping show a mixed picture. In the OSPAR Quality Status Report 2010 the following conclusion is drawn: “The main pressures on North Sea biodiversity and ecosystem health are the removal of target and non-target species, loss of and damage to habitats, the introduction of non-native species, obstacles to species migration and poor water quality. All can act in synergy with or be exacerbated by climate change.”
7.3. Conclusions about the quality of the North Sea ecosystem
The assessment system used by OSPAR (with EcoQOs) is not yet complete. Therefore, OSPAR is not yet able to give an assessment of the ecosystem quality of the North Sea as a whole. The Utrecht Workshop (background report of the OSPAR assessment 2010) only formulated a total quality status assessment per ecosystem component (four species and four habitats). This status was only assessed as good for seals and the deeper deep-sea habitats. Shallow sediment habitats scored poor; all other components scored moderate (fish, seabirds, rock and biogenic reef habitats, shelf sediment habitats and the upper part of deep-sea habitats. Cetaceans were left out because of low confidence level). OSPAR, in response to the EU Marine Framework Directive, is working hard to expand its set of EcoQOs to give a reliable assessment of the quality of the North Sea ecosystem as a whole. This may, however, take some more years of research. Given the many moderate-scoring ecosystem components, we assume the North Sea as a whole is in a moderate state. It should be noted that “ecosystem quality” in the above does not yet contain information about ecosystem functioning. The functional aspects of the ecosystem are much less well monitored than aspects like the abundance of protected species. In other words: we now know that the ecosystem quality is only moderate and not good, but we don’t know whether
© IMSA Amsterdam The North Sea ecosystem
LNS128 70
this also means that the ecosystem functions less well than it used to do. Therefore we can't judge whether there is a loss of resilience, ecosystem stability or ecosystem services. The OSPAR Quality Status Report 2010 (QSR) does not make any general statement about the trend in quality of the North Sea ecosystem either (such as: the quality of the North Sea ecosystem is deteriorating/ improving or the biodiversity is in decline/recovering). However, the QSR does mention a number of observations that show two things: • Species and habitats that used to be abundant are now declining. This does not
necessarily mean, however, that the biodiversity is in decline. Many new species have colonized the North Sea, introduced by ballast water or migrating from the south because of seawater warming. Additionally, humans have created new habitats (such as oil platforms), and some of the human pressures show (recent) trends towards improvement. The Quality Status Report does not pronounce upon the net change in biodiversity. Because of the many new species, it is likely that biodiversity in the North Sea is merely changing, or perhaps even increasing. The fact remains, however, that it is mostly the more vulnerable habitats and the more vulnerable, long-lived species which make high demands upon their environment, that are in decline. Because of this, OSPAR righteously pays much attention to the conservation of these species and habitats. We found one author (McGlade, 2002) who concludes there has been a decline in biodiversity and especially in trophic stability. She suggests the latter could be indicative of a trend towards decreasing resilience.
• Human pressures are large, and the quality of the ecosystem is now worse than it used
to be some decennia ago. Some human pressures are further increasing, but others are decreasing. Therefore, at this moment it is hardly possible to give an indication as to whether the quality of the ecosystem is in a net decline or not. Another thing we don’t know exactly is which part of the changes we see is caused by natural factors.
We estimate that the North Sea ecosystem has been in decline over the past decennia (especially since the start of large-scale trawling and industrial fishing); that the situation is still serious (many endangered and declining species and habitats; a moderate total quality assessment score); but that there are signs of improvement on certain aspects, and that research in the coming years will have to show: • whether the decline in species and habitats also means a degradation of the ecosystem as
a whole or not (including loss of ecosystem functions and/or decreasing resilience and loss of ecosystem services), and
• whether the decline is now perhaps slowing down. Is the present state of the North Sea reason for concern and, as a consequence, action? We think so. The direct negative effects of the human pressures on the ecosystem (such as oiled birds, decline of large predatory fish, animals with plastic in their stomachs, porpoises caught in fishing nets) already are a good reason to aim for a decrease of these human pressures. And given the many changes observed, plus the threat of global warming and ocean acidification, the risk of a deteriorated ecosystem functioning and loss of services is real.
© IMSA Amsterdam The North Sea ecosystem
LNS128 71
After this first phase of research, our impression is that the OSPAR process of assessment, using the ecosystem approach and the set of EcoQOs, is useful and should be supported. In the scope of the LiNSI project, however, we may want to take certain actions before the final assessment, necessary for the EU Marine Strategy Assessment, is finalised. How to handle this should be discussed before starting Phase 2, in order to prevent starting off research while the OSPAR process is to deliver the answers in a later stage.
© IMSA Amsterdam The North Sea ecosystem
LNS128 72
8. References and interviews
Aiking, H., 2010. Future protein supply. In: Trends in food science and technology. In press. Attrill, M.J., J. Wright & M. Edwards, 2007. Climate related increases in jellyfish frequency suggest a more gelatinous future for the North Sea. Limnol. Oceanogr. 52:480–485. Attrill, Martin J. & Martin Edwards, 2008. Reply to Haddock, S. H. D.: Reconsidering evidence for potential climate-related increases in jellyfish Bailey, H., Bridget Senior, Dave Simmons, Jan Rusin, Gordon Picken & Paul M. Thompson, 2010. Assessing underwater noise levels during pile-driving at an offshore windfarm and its potential effects on marine mammals. Marine Pollution Bulletin, Volume 60, Issue 6, June 2010, Pages 888-897 Branch, T., R. Watson, E. Fulton, S. Jennings, C. McGilliard, G. Pablico, D. Ricard & S. Tracey, 2010. The trophic fingerprint of marine fisheries Nature, 468 (7322), 431-435 DOI: 10.1038/nature09528 CBD, 1992. Convention on biological diversity. Christensen, V., C. Piroddi, M. Coll, J. Steenbeek, J. Buszowski & D. Pauly. Fish biomass in the world ocean: a century of decline. Manuscript presented at AAAS 2011, session “2050: Will there be fish?” in Washington DC, 18 February 2011 Edwards, M. & A.J. Richardson, 2004. Impact of climate change on marine pelagic phenology and trophic mismatch. Nature 430: 881884. (left and right) EEA, 2002. Europe’s biodiversity – biogeographical regions and seas. EEA, 2008. Impacts of Europe’s changing climate — 2008 indicator-based assessment ESA (European Space Agency), 2009. ESA map reveals European shipping routes like never before. Press release on ESA website, dated 22 May 2009 Fisheries Direction of the Dutch Government, date not exactly known but certainly after 1932 and before 1953. “Visserijkaart”, (“fisheries map”) Gerrard, S., A. Grant, R. Marsh & C. London, 1999, Drill Cuttings Piles in the North Sea: Management Options During Platform Decommissioning, Centre for Environmental Risk, Research Report No 31, Centre for Environmental Risk School of Environmental Sciences, University of East Anglia, Norwich
Gill, A.B., 2005. Offshore renewable energy: ecological implications of generating electricity in the coastal zone. Journal of Applied Ecology, 42: 605–615. Doi: 10.1111/j.1365-2664.2005.01060.x
Gollasch, S., Deniz Haydar, Dan Minchin, Wim J. Wolff & Karsten Reise, 2009. Introduced Aquatic Species of the North Sea Coasts and Adjacent Brackish Waters. Contribution to G. Rilov, J.A. Crooks (eds.) Biological Invasions in Marine Ecosystems. Ecological Studies 204, Springer-Verlag, Berlin Heidelberg 2009 Gregg, W.W., M.E. Conkright, P. Ginoux, J.E. O’Reilly & N.W. Casey, Ocean primary production and climate: Global decadal changes, Geophys. Res. Lett., 30(15), 1809, doi:10.1029/2003GL016889, 2003 Haelters, J. & C.J. Camphuysen, 2009. The harbour porpoise (Phocoena phocoena L.) in the southern North Sea: Abundance, threats, research- and management proposals. Royal Belgian Institute of Natural Sciences (RBINS), department Management Unit of the North Sea Mathematical Models (MUMM) & Royal Netherlands Institute for Sea Research (NIOZ).
Held, M.E. den, 2009, Is the metapopulation concept applicable for the North Sea?, Thesis project for the Coastal Zone Management program at Van Hall Larenstein University of Applied Sciences, Alterra report 1928. ICES, 2006, Report of working group for regional ecosystem description. ICES, 2008. An assessment of the changes in the distribution and abundance of marine species in the OSPAR maritime area in relation to changes in hydrodynamics and sea temperature. (Input for OSPAR 2010 and on the website of the QSR).
© IMSA Amsterdam The North Sea ecosystem
LNS128 73
ICES. Factors affecting the distribution of North Sea fish. ICES-FishMap. Available at: http://www.ices.dk/marineworld/fishmap/pdfs/factors.pdf. Downloaded 2011. ICES, 2010. Report of the Working Group on Marine Mammal Ecology (WGMME), 12–15 April 2010, Horta, The Azores. ICES CM 2010/ACOM:24. 212 pp. ICES, 2010a. General advice, 1.5.1.5. EC request on cetacean bycatch Regulation 812/2004, Item 3. Special Request Advice October 2010. IMSA Amsterdam, 2011b. Decommissioning of North Sea oil and gas facilities (LNS200) IMSA Amsterdam, 2011c. Ecosystems associated with North Sea oil and gas facilities and the impact of decommissioning options (LNS214). IMSA Amsterdam, 2011d. North Sea legal and policy framework (LNS130) IPCC, 2007. Climate Change 2007: Impacts, Adaptation and Vulnerability. Contribution of Working Group II to the Fourth Assessment Report of the Intergovernmental Panel on Climate Change, M.L. Parry, O.F. Canziani, J.P. Palutikof, P.J. van der Linden and C.E. Hanson, Eds., Cambridge University Press, Cambridge, UK, 976pp. Kennedy, V.S., R.R. Twilley, J.A. Kleypas, J.H. Cowan Jr. & S.R. Hare, 2002. Coastal and Marine Ecosystems: Potential Effects on U.S. Resources and Global Climate Change. Pew Center on Global Climate Change Levin, S.A. (Ed.), 2009. The Princeton Guide to Ecology. S. A. Levin (Ed.). Princeton Press, Princeton. Lindeboom, H.J., E.M. Dijkman, O.G. Bos, E.H. Meesters, J.S.M. Cremer, I. de Raad & A. Bosma, 2008, Ecologische Atlas Noordzee ten behoeve van gebiedsbescherming, Wageningen IMARES ISBN 978-90-74549-12-7 Lindeboom, H.J., 2003. De Noordzee, vroeger, nu en straks: op weg naar duurzaamheid. www.nibi.nl/expertisecentrum/artikelen Lindeboom, H.J., 2005. Comparison of effects of fishing with effects of natural events and non-fishing anthropogenic impacts on benthic habitats. Pages 609-618 in P.W.Barnes and J.P. Thomas, editors. Benthic habitats and the effects of fishing. American Fishing Society Symposium 41. Bethesda. Maryland Matthias, V., Ines Bewersdorffa, Armin Aulingera & Markus Quantea, 2010. The contribution of ship emissions to air pollution in the North Sea regions. Environmental Pollution, Volume 158, Issue 6, June 2010, p 2241-2250 McCrea, M., M.J. Costello, A. Freiwald, T. Lundalv, L. Jonsson & B. Bett, 2003 on http://www.ecoserve.ie/projects/aces/ McGlade, J.M., 2002. The North Sea Large Marine Ecosystem. In: Sherman, K. & H.R. Skjoldal, 2002. Large Marine Ecosystems of the North Atlantic. Changing states and sustainability. McQuatters-Gollop A, D.E. Raitsos, M. Edwards, Y. Pradhan, L.D. Mee, S.J. Lavender & M.J. Attril, 2007. A long-term chlorophyll dataset reveals regime shift in North Sea phytoplankton biomass unconnected to increasing nutrient levels. Limnol. Oceanogr. 2007;52:635–648 MUMM, 2007. Impacts of climate change on the physical and chemical parameters of the North Sea (literature study) (CLIMAR project). Work package 1: Definition and modelling of climate change induced primary impacts at the North Sea scale. December 14, 2007. MUMM, 2008. Impacts of climate change on the ecological parameters of the North Sea (literature study) (CLIMAR project). Work package 1: Definition and modelling of climate change induced primary impacts at the North Sea scale. July 15, 2008. Natuur & Milieu, Wot-rapport 110. 116 blz. 14 fig.; 16 tab.; 59 ref.; 3 bijl. NRC (National Research Counsil of the national academies), 2003. Ocean Noise and Marine Mammals, Committee on Potential Impacts of Ambient Noise in the Ocean on Marine Mammals, National Research Council, National Academic Press, Washington DC Nunneri, C., Wilhelm Windhorsta, R. Kerry Turnera & Hermann Lenharta, 2007. Nutrient emission reduction scenarios in the North Sea: An abatement cost and ecosystem integrity analysis – Ecological Indicators, Volume 7, Issue 4, November 2007, Pages 776-792 Olsen, O.T., 1883. The Piscatorial Atlas of the North Sea, English and St. George’s Channels. Taylor and Francis, London. 50 maps.
© IMSA Amsterdam The North Sea ecosystem
LNS128 74
OSPAR Commission, 2000. Quality Status Report 2000. Region II, Greater North Sea. OSPAR, 2009. Evaluation of the OSPAR system of Ecological Quality Objectives for the North Sea (update 2010). OSPAR, 2009a. Trends in waterborne inputs. Assessment of riverine inputs and direct discharges of nutrients and selected hazardous substances to OSPAR maritime area in 1990 – 2006 OSPAR, 2009b. Report of the Utrecht Workshop - Regional assessment OSPAR, 2009c. Background Document for Harbour porpoise Phocoena phocoena (background document to the OSPAR QSR 2010) OSPAR Commission, 2010. Quality Status Report 2010 OSPAR Commission, 2010a. The Ospar System of Ecological Quality Objectives for the North Sea. Update 2010. Pauly, Daniel, Villy Christensen, Johanne Dalsgaard, Rainer Froese & Francisco Torres Jr., 1998. Fishing down marine food webs. Science 279:860-863. PBL, 2008. Natuurbalans 2008. Planbureau voor de Leefomgeving (PBL), 2010. Natuurkwaliteit en biodiversiteit van de Nederlandse zoute wateren. Reijnders, P.J.H. & K. Lankester, 1990. Status of marine mammals in the North sea. Richardson, A.J. & M.J. Gibbons, 2008. Are jellyfish increasing in response to ocean acidification? Limnology and Oceanography 53: 2040-2045 Reijnen, M.J.S.M., A. van Hinsberg, M.L.P. van Esbroek, B. de Knegt, R. Pouwels, S. van Tol & J. Wiertz, 2010. Natuurwaarde 2.0 land. Graadmeter natuurkwaliteit landecosystemen voor nationale beleidsdoelen. Wageningen, Wettelijke Onderzoekstaken Reiss, H. & H.L. Rees, 2007. Links between infauna, epifauna, and demersal fish distribution. In: Rees H L, Eggleton J D, Rachor E, Vanden Berghe E (eds.) Structure and dynamics of the North Sea benthos. ICES Cooperative Research Report 288: 141-152. Rockstrøm, Johan, Will Steffen, Kevin Noone, Åsa Persson, F. Stuart Chapin, III, Eric F. Lambin, Timothy M. Lenton, Marten Scheffer, Carl Folke, Hans Joachim Schellnhuber, Björn Nykvist, Cynthia A. De Wit, Terry Hughes, Sander van der Leeuw, Henning Rodhe, Sverker Sörlin, Peter K. Snyder, Robert Costanza, Uno Svedin, Malin Falkenmark, Louise Karlberg, Robert W. Corell, Victoria J. Fabry, James Hansen, Brian Walker, Diana Liverman, Katherine Richardson, Paul Crutzen & Jonathan A. Foley, 2009. A safe operating space for humanity. Nature 461, 472-475(24 September 2009 doi:10.1038/461472. Rosenzweig, C., G. Casassa, D.J. Karoly, A. Imeson, C. Liu, A. Menzel, S. Rawlins, T.L. Root, B. Seguin & P. Tryjanowski, 2007: Assessment of observed changes and responses in natural and managed systems. Climate Change 2007: Impacts, Adaptation and Vulnerability. Contribution of Working Group II to the Fourth Assessment Report of the Intergovernmental Panel on Climate Change, M.L. Parry, O.F. Canziani, J.P. Palutikof, P.J. van der Linden and C.E. Hanson, Eds., Cambridge University Press, Cambridge, UK, 79-131. Schlüter, M. A. & K. Jerosch, 2009. Digital atlas of the North Sea (DANS). Geo-information regarding geology, geochemistry, oceanography and biology. Available at http://www.awi.de/en/research/research_divisions/geosciences/marine_geochemistry/marine_gis/digital_atlas_of_the_north_sea [accessed on 27 February 2011]. Schuster, U. & A. J. Watson, 2007. A variable and decreasing sink for atmospheric CO2 in the North Atlantic. J. Geophys. Res., 112, C11006, doi:10.1029/2006JC003941 Secretariat of the Convention on Biological Diversity, 2009. Scientific synthesis of the impacts of ocean acidification on marine biodiversity. Montreal, technical series No. 46, 61 pages. Sherman, K. & G. Hempel, 2009. The UNEP Large Marine Ecosystem Report: A perspective on changing conditions in LMEs of the world’s Regional Seas. UNEP Regional Seas Report and Studies no. 182. United Nations Environment Programme, Nairobi, Kenya. Snyder, Brian, & Mark J. Kaiser, 2009. Ecological and economic cost-benefit analysis of offshore wind energy , Renewable Energy, Volume 34, Issue 6, June 2009, Pages 1567-1578
© IMSA Amsterdam The North Sea ecosystem
LNS128 75
Thomsen, F., K. Lüdemann, R. Kafemann & W. Piper, 2006. Effects of offshore wind farm noise on marine mammals and fish. Biola, Hamburg, Germany on behalf of Cowrie Ltd. 62 pp. Tougaard, J., O.D. Henriksen & L.A. Miller, 2009. Underwater noise from three types of offshore wind turbines: estimation of impact zones for porpoises and seals. Journal of the Acoustical Society of America, 2009, June; 125(6):3766-73. Thomas, H., A.E. F. Prowe, S. van Heuven, Y. Bozec, H.J.W. de Baar, L.S. Schiettecatte, K. Suykens, M. Kone, A.V. Borges, I.D. Lima & S.C. Doney, 2007. Rapid decline of the CO2 buffering capacity in the North Sea and implications for the North Atlantic Ocean, Global Biogeochem. Cy., 21, GB4001, doi:10.1029/2006GB002825. Townsend, A.R. & R.W. Howarth, 2010. Fixing the Nitrogen Problem. Scientific American, Feb 2010, pp 64-71 UNEP, 2009. Marine litter, a global challenge. Nairobi: UNEP. 232 pp. Visserijnieuws.nl, 22 February 2011. Vissers zien weer meer vis. Weijerman, M., H. Lindeboom & A.F. Zuur, 2005. Regime shifts in marine ecosystems of the North Sea and Wadden Sea. Mar. Ecol. Prog. Ser. 298: 21–39 World Biodiversity Database (UvA) at http://nlbif.eti.uva.nl/bis/projects.php WWF, 2005. Vulnerability Assessment of the North East Atlantic Shelf Marine Ecoregion to Climate Change WWF, 2009. Towards good environmental status. A network of marine protected areas for the North Sea. Zintzen, V., E. Vanden Berghe, S. Degraer, A. Norro & J. Mallefet, 2006. North Sea wrecks: hotspots for biodiversity = Wrakken in de Noordzee: hotspots van biodiversiteit, in: Pieters, M. et al. (Ed.) (2006). Colloquium: To sea or not to sea - 2nd international colloquium on maritime and fluvial archaeology in the southern North Sea area, Brugge (Belgium), 21-23 September 2006: book of abstracts = Colloquium: Ter zee of niet ter z. VLIZ Special Publication, 32: pp. 39, 40.
Websites
www.jncc.gov.uk www.lophelia.org http://onegeology-europe.brgm.fr/geoportal/viewer.jsp
Interviews
Han Lindeboom IMARES Carlo Heip NIOZ, NIOO Joop Coolen Stichting Noordzee Ian Boyd SMRU, St. Andrews, Scotland Gordon Picken Shell UK, BMT Cordah
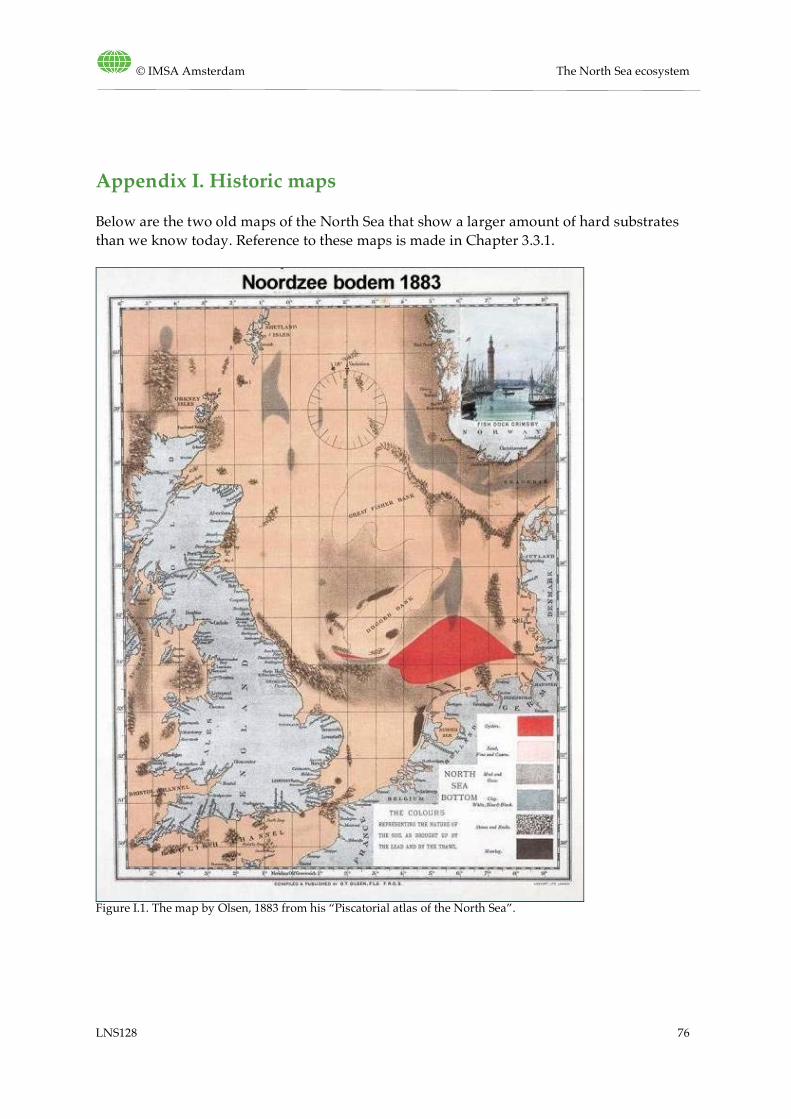
© IMSA Amsterdam The North Sea ecosystem
LNS128 76
Appendix I. Historic maps
Below are the two old maps of the North Sea that show a larger amount of hard substrates than we know today. Reference to these maps is made in Chapter 3.3.1.
Figure I.1. The map by Olsen, 1883 from his “Piscatorial atlas of the North Sea”.
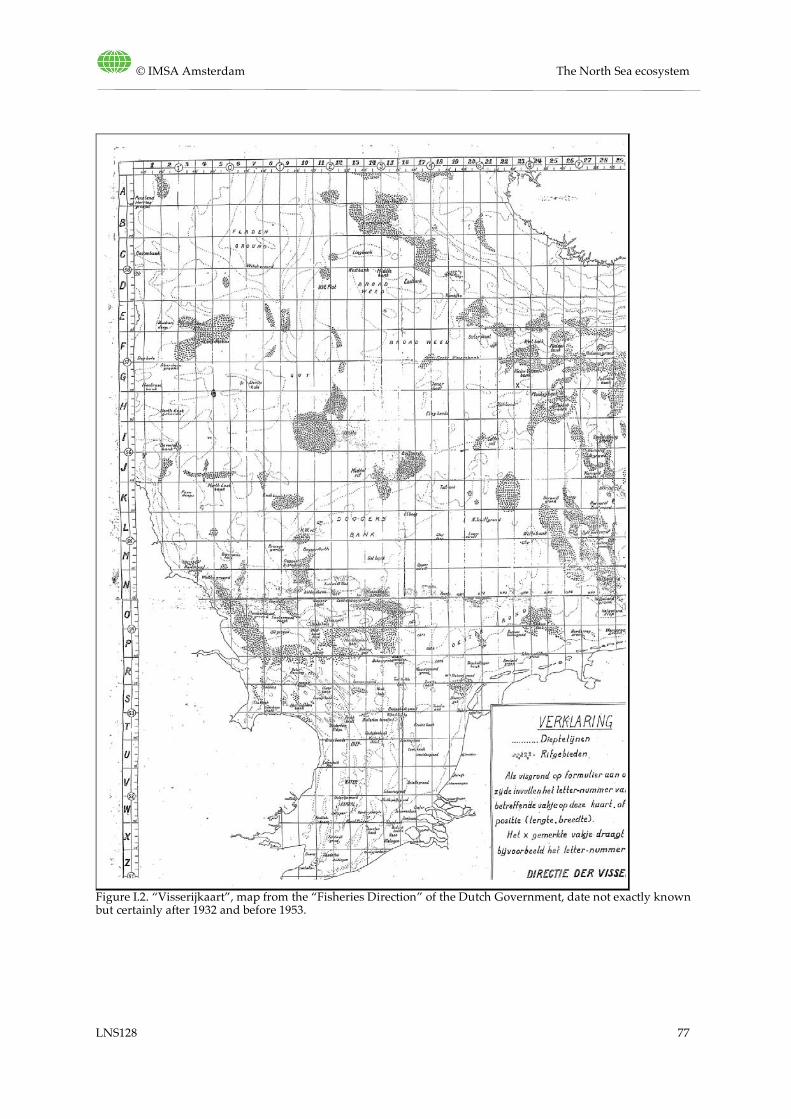
© IMSA Amsterdam The North Sea ecosystem
LNS128 77
Figure I.2. “Visserijkaart”, map from the “Fisheries Direction” of the Dutch Government, date not exactly known but certainly after 1932 and before 1953.
© IMSA Amsterdam The North Sea ecosystem
LNS128 78
Appendix II. Background on (the assessment of) “ecosystem quality” and “biodiversity”
II.1. Ecosystem quality, ecosystem approach and assessment methods
II-1.1. Ecosystem quality
The biological quality of ecosystems is defined by a combination of biodiversity (including species composition) and ecosystem functions. Ecosystem quality can be described in terms of e.g. energy and nutrient fluxes, food availability and use, growth, and reproduction of organisms. Instead of the term ecosystem quality, also ecosystem health is used, with approximately the same meaning. Ecosystem quality is influenced by the state of the environment. Species loss or a non-optimal functioning of the ecosystem is usually caused by a combined impact of several pressure factors. Biological processes in ecosystems are interactive and are determined by climate, human use and the biological, chemical and physical properties of soil, water and air. When the environment is negatively impacted, this causes chain reactions in processes, services and functions of ecosystems (RIVM Milieuportaal).
II-1.2. Ecosystem approach
The traditional system of assessment and monitoring is very much sector-based (fisheries, chemical contamination, nature conservation etc.) OSPAR, as many other organisations, has adopted the ecosystem approach to manage human activities. The ecosystem approach cuts across all sectors and results in one policy driver applicable to all sectors (ICES, 2003). The goal is a sustainable use of the ecosystem. In the words of OSPAR: “The ecosystem approach requires the comprehensive integrated management of human activities based on the best available scientific knowledge about ecosystems and their dynamics, in order to identify and take action on influences which are critical to the health of marine ecosystems. This presents a challenge to existing methods for the assessment of the marine environment by requiring consideration of the wider implications of human activities on the quality, structure and functioning of marine ecosystems” (OSPAR, 2010). They add: “Yet, understanding of the functioning of marine ecosystems and their interactions with human activities, and the availability of data supporting an ecosystem assessment are – and are likely to remain – limited. Assessment methodologies that support the ecosystem approach must accommodate these limitations and evolve with developments in knowledge.”
II-1.3. OSPAR assessment method: Ecological Quality Objectives (EcoQOs)
As a first step in developing a methodology to assess ecosystem health, OSPAR assesses the overall status of biodiversity. First, the status of species and habitats is assessed, then
© IMSA Amsterdam The North Sea ecosystem
LNS128 79
pressures from human activities, and finally the status is linked to the impact from pressures (taking into account any cumulative effects arising from multiple pressures and the interactions among species and habitats in the ecosystem). This is especially important for those parts of the ecosystem that play a key role in ecosystem functioning (OSPAR, 2010). To support the ecosystem approach, OSPAR has developed the system of Ecological Quality Objectives (EcoQOs), which provide a link between human activities and impacts on biodiversity and collectively provide a means of expressing a clean, healthy and biologically diverse sea (OSPAR, 2010). OSPAR (in collaboration with ICES) has formulated for the North Sea a set of EcoQOs. These define the desired qualities of selected ecosystem components in relation to human pressures. The indicators should be chosen in such a way that meeting all EcoQOs should provide the evidence that the ecosystem is in a good state (OSPAR, 2010). At present, the main added value of the EcoQO system lies in providing examples of objectives and indicators that can be used to define good environmental status (GES) under the Marine Strategy Framework Directive (OSPAR, 2010a). Examples of EcoQOs are: • the proportion of oiled common guillemots should be 10% or less of the total found dead
or dying in all areas of the North Sea • at least 30% of fish (by weight) should exceed 40 cm in length. For the status of the EcoQOs, see Chapter 6 and Appendix XIII. OSPAR acknowledges it needs to develop the EcoQO system further to provide more comprehensive coverage of ecosystem components and pressures. A more complete system would strengthen overall assessments of the North Sea status. Additional EcoQOs are already under development (OSPAR, 2010).
II-1.4. Other methods to assess ecosystem quality
Apart from the EcoQO method from OSPAR, there are other ways to assess ecosystem quality. Some examples of the types of indicators are often used. • Number of species (biodiversity) and their abundance. • Activity of specific species and functional groups of organisms. • Redundancy of functional properties of groups of organisms. • Energy fluxes and their velocities. • Progression of vital processes. • Sensitivity to stress and recovery potential. In some cases (for example by the Dutch PBL, the Netherlands Environmental Assessment Agency) the ecosystem quality is expressed as the MSA (relative mean species abundance of originally occurring species). As a reference for the original species, PBL uses the situation in 1950, in which most ecosystems are supposed to have been relatively intact. So they don’t use the situation before human influence as a reference (which would be 3000 BC). For every grid of a certain size it is assessed in how far environmental pressure deviates from the reference “unspoilt nature” (or an intact system). This use of the presence of characteristic species, as an indicator for ecosystem quality, is in congruity with the way in which nature quality is described internationally, for example in the EU Water Framework Directive and global CBD guidelines. The sets of characteristic species used should be as representative as possible for the quality of the ecosystem type as a whole. In this method an unspoilt
© IMSA Amsterdam The North Sea ecosystem
LNS128 80
ecosystem gets a score of 100%. As an indication: Dutch forests in 2007 were given 40%. This indicator therefore describes the mean biodiversity quality of an ecosystem. (There are also indicators that describe changes in diversity on a species level, of which the Red List Index is the most important one). The main idea behind striving towards an intact ecosystem is that this gives some sort of a guarantee that by protecting the ecosystem, the separate species in the ecosystem will be protected too. Use of the MSA has advantages and disadvantages; it is a much-debated topic. In the North Sea it is difficult to measure ecosystem quality from the presence of species, because there are large natural variations.
II-1.5. Future improvement
OSPAR speaks of a need for improved coordination of biological monitoring programmes. There are many such programmes in place, but these mostly focus on protected sites or features rather than the functional aspects of the ecosystem. It is the functional aspects that are important to monitor if one wants to assess status and impacts at the ecosystem scale (OSPAR, 2010; this remark by OSPAR is about the whole OSPAR region, but we think it certainly applies to the North Sea too).
II.2. Biodiversity
Biodiversity is a difficult topic because it has a complex definition and it is difficult to measure. Furthermore, nobody questions the value of biodiversity (intrinsic value and value for humans) but there is a lot of debate about how much biodiversity can be lost without jeopardising sustainability. In the context of the North Sea ecosystem, biodiversity is often used to illustrate the quality of the ecosystem, and that is why this paragraph gives an introduction into the subject.
II-2.1. Biodiversity in the context of nature value
The nature value of an ecosystem may be called high because of several reasons. Biodiversity is one of them. • The area may have a high biodiversity: the genetic, taxonomic and functional diversity of
life on Earth including temporal and spatial variability. The number of species present is the simplest measure of biodiversity, but there are better indices, taking also factors such as abundance/evenness into account (see below). Evenness is important: when a few species are abundant and others are only present in small numbers, the ecosystem may be called less biodiverse (according to some indices) than another ecosystem that has less species but where all species have more or less the same abundance.
• The area may provide habitat to species with a high abundance: number of individuals per species.
• In the area, one or more rare or endangered species may be present. Lindeboom et al. (2008) mention a “zeldzaamheidsindex” which they use to give a measure for the relative amount of rare/endangered species. Sometimes the uniqueness of species is taken into account (species only found in a certain area).
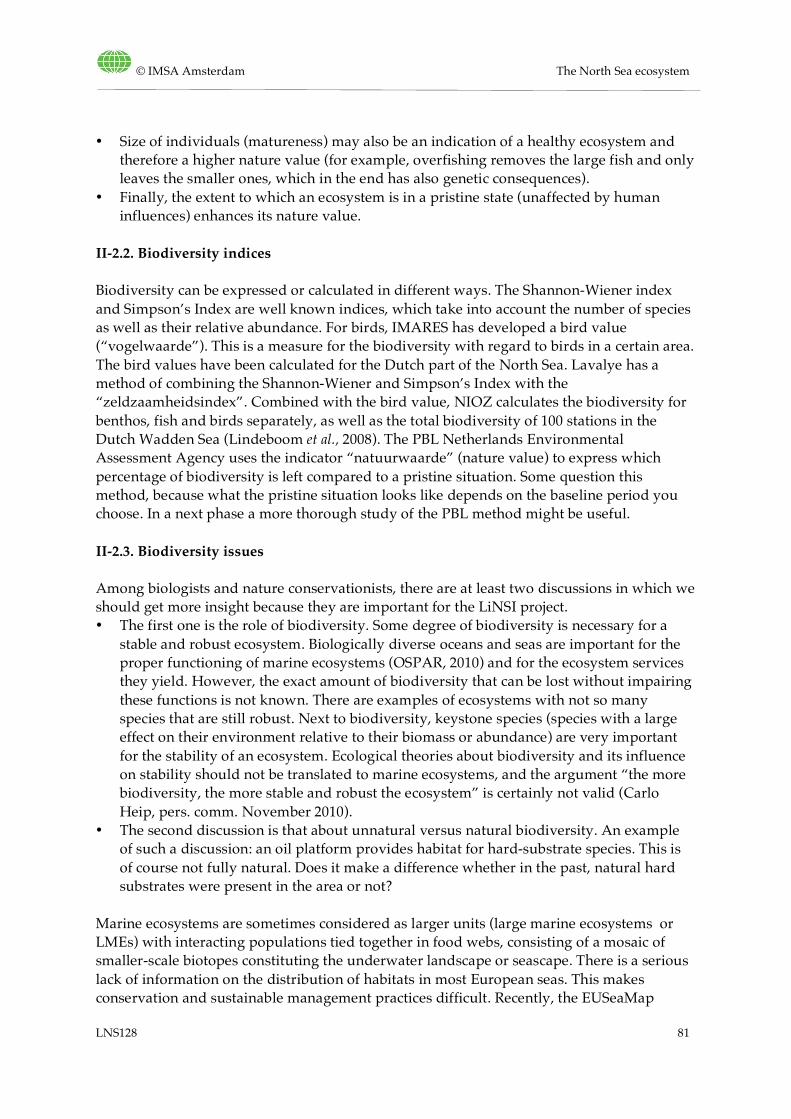
© IMSA Amsterdam The North Sea ecosystem
LNS128 81
• Size of individuals (matureness) may also be an indication of a healthy ecosystem and therefore a higher nature value (for example, overfishing removes the large fish and only leaves the smaller ones, which in the end has also genetic consequences).
• Finally, the extent to which an ecosystem is in a pristine state (unaffected by human influences) enhances its nature value.
II-2.2. Biodiversity indices
Biodiversity can be expressed or calculated in different ways. The Shannon-Wiener index and Simpson’s Index are well known indices, which take into account the number of species as well as their relative abundance. For birds, IMARES has developed a bird value (“vogelwaarde”). This is a measure for the biodiversity with regard to birds in a certain area. The bird values have been calculated for the Dutch part of the North Sea. Lavalye has a method of combining the Shannon-Wiener and Simpson’s Index with the “zeldzaamheidsindex”. Combined with the bird value, NIOZ calculates the biodiversity for benthos, fish and birds separately, as well as the total biodiversity of 100 stations in the Dutch Wadden Sea (Lindeboom et al., 2008). The PBL Netherlands Environmental Assessment Agency uses the indicator “natuurwaarde” (nature value) to express which percentage of biodiversity is left compared to a pristine situation. Some question this method, because what the pristine situation looks like depends on the baseline period you choose. In a next phase a more thorough study of the PBL method might be useful.
II-2.3. Biodiversity issues
Among biologists and nature conservationists, there are at least two discussions in which we should get more insight because they are important for the LiNSI project. • The first one is the role of biodiversity. Some degree of biodiversity is necessary for a
stable and robust ecosystem. Biologically diverse oceans and seas are important for the proper functioning of marine ecosystems (OSPAR, 2010) and for the ecosystem services they yield. However, the exact amount of biodiversity that can be lost without impairing these functions is not known. There are examples of ecosystems with not so many species that are still robust. Next to biodiversity, keystone species (species with a large effect on their environment relative to their biomass or abundance) are very important for the stability of an ecosystem. Ecological theories about biodiversity and its influence on stability should not be translated to marine ecosystems, and the argument “the more biodiversity, the more stable and robust the ecosystem” is certainly not valid (Carlo Heip, pers. comm. November 2010).
• The second discussion is that about unnatural versus natural biodiversity. An example of such a discussion: an oil platform provides habitat for hard-substrate species. This is of course not fully natural. Does it make a difference whether in the past, natural hard substrates were present in the area or not?
Marine ecosystems are sometimes considered as larger units (large marine ecosystems or LMEs) with interacting populations tied together in food webs, consisting of a mosaic of smaller-scale biotopes constituting the underwater landscape or seascape. There is a serious lack of information on the distribution of habitats in most European seas. This makes conservation and sustainable management practices difficult. Recently, the EUSeaMap
© IMSA Amsterdam The North Sea ecosystem
LNS128 82
research programme made a start to fill in some of these knowledge gaps for the North Sea. Some maps have been included in this report. Finally, ecosystems are never static; they change all the time and sometimes suddenly (from one year to the next). This is called a regime shift. Such shifts are attributed to a range of factors, both climatic and anthropogenic. Substantial regime shifts occurred in the North Sea ecosystem in 1979 and 1988 and perhaps (less clear evidence) also in 1998 (Weijerman et al., 2005). A difficult question is how to distinguish between human-induced change and natural changes. Below is a picture that is referred to in Chapter 4.1.
Figure II.1. Fish biodiversity in the North Sea. Same method as in Figure 4.1 but now for northerly (left panel) and southerly (right panel) fish species. Source: Daan 2007.
II-2.4. Ecological hotspots in the Dutch North Sea In the Dutch part of the North Sea (10% of the total North Sea area), regions with a special ecological value are: Dogger Bank Rich benthic community; spawning site plaice, whiting, cod Cleaver Bank The only area of the Dutch North Sea with a gravel substrate. Soft
corals and spawning site for fish Central Oystergrounds Sludge-rich sediment and calm waters lead to a rich benthic
community
© IMSA Amsterdam The North Sea ecosystem
LNS128 83
Frisian Front Because it is a front, this area is rich in nutrients which attracts fish, birds and sea mammals
Borkumse Stones Important area for seals Coastal zone Relatively warm and shallow. Important nursery for fish and
benthic species, and therefore important foraging area for birds Brown Bank Area with seepage water. Spawning site for flatfish; important
area for sea birds and harbour porpoise Voordelta, Gasfonteinen (no further information) Zeeuwse Banks (no further information) (source: PBL, 2008).
© IMSA Amsterdam The North Sea ecosystem
LNS128 84
Appendix III. Possible research questions Phase 2
• Discuss, before the start of Phase 2, how to handle the situation that we might want to take certain actions in the scope of the LiNSI project, while the final OSPAR quality assessment of the North Sea, necessary for the EU Marine Strategy Assessment, is not yet finalised. We should prevent starting off research while the OSPAR process is to deliver the answers in a later stage.
• Further define the extent of damage to the ecosystem. Are there consequences for ecosystem functioning? And what are the consequences of causing further damage or of not restoring the system?
• Further investigate the relationship between the ecosystems around platforms and the North Sea ecosystem at large.
• Can we reach a reasonable level of consensus about the impact of the various human activities and about solutions from an ecosystem perspective?
• Are certain ecosystem services under threat from changes brought about by human activities and climate change?
• Can we make an analysis of ecosystem quality and external pressures for different regions of the North Sea?
• Even while OSPAR’s EcoQO system is still under development, can we further research the quality of the ecosystem and how this has changed over the past decades?
• Can we make an analysis for optimal spatial planning from an ecosystem approach, with the knowledge that is available at this moment?
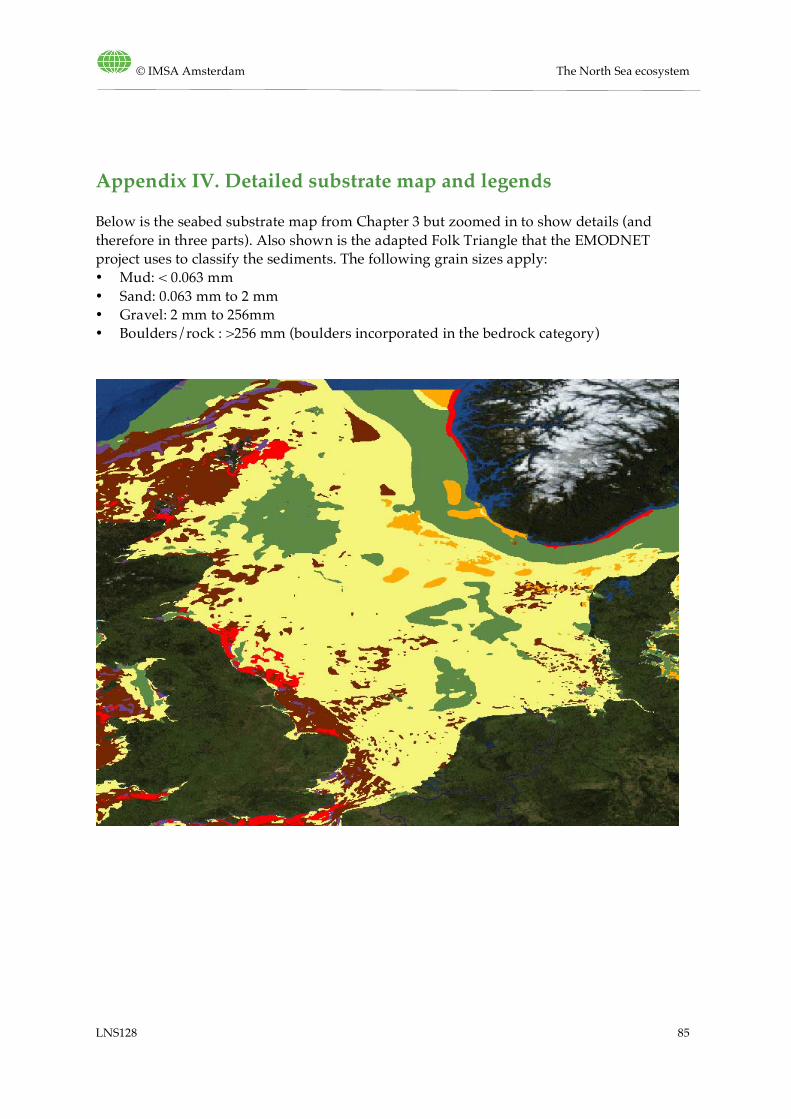
© IMSA Amsterdam The North Sea ecosystem
LNS128 85
Appendix IV. Detailed substrate map and legends
Below is the seabed substrate map from Chapter 3 but zoomed in to show details (and therefore in three parts). Also shown is the adapted Folk Triangle that the EMODNET project uses to classify the sediments. The following grain sizes apply: • Mud: < 0.063 mm • Sand: 0.063 mm to 2 mm • Gravel: 2 mm to 256mm • Boulders/rock : >256 mm (boulders incorporated in the bedrock category)
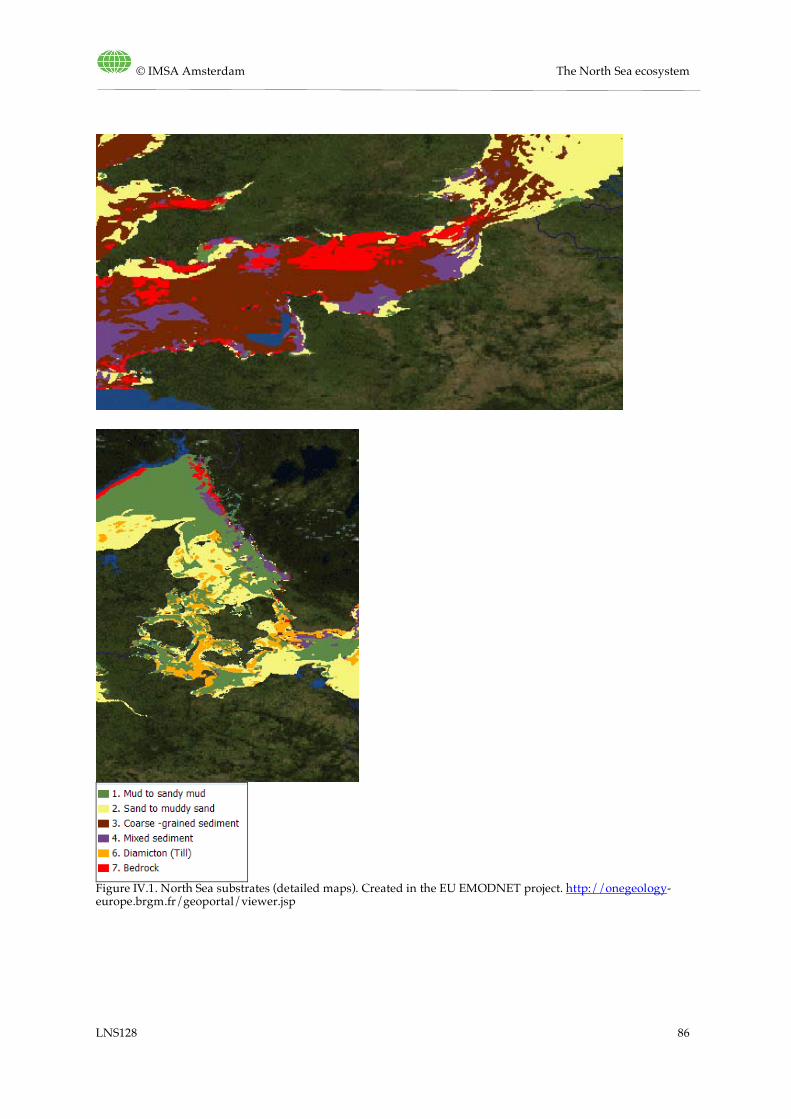
© IMSA Amsterdam The North Sea ecosystem
LNS128 86
Figure IV.1. North Sea substrates (detailed maps). Created in the EU EMODNET project. http://onegeology-europe.brgm.fr/geoportal/viewer.jsp
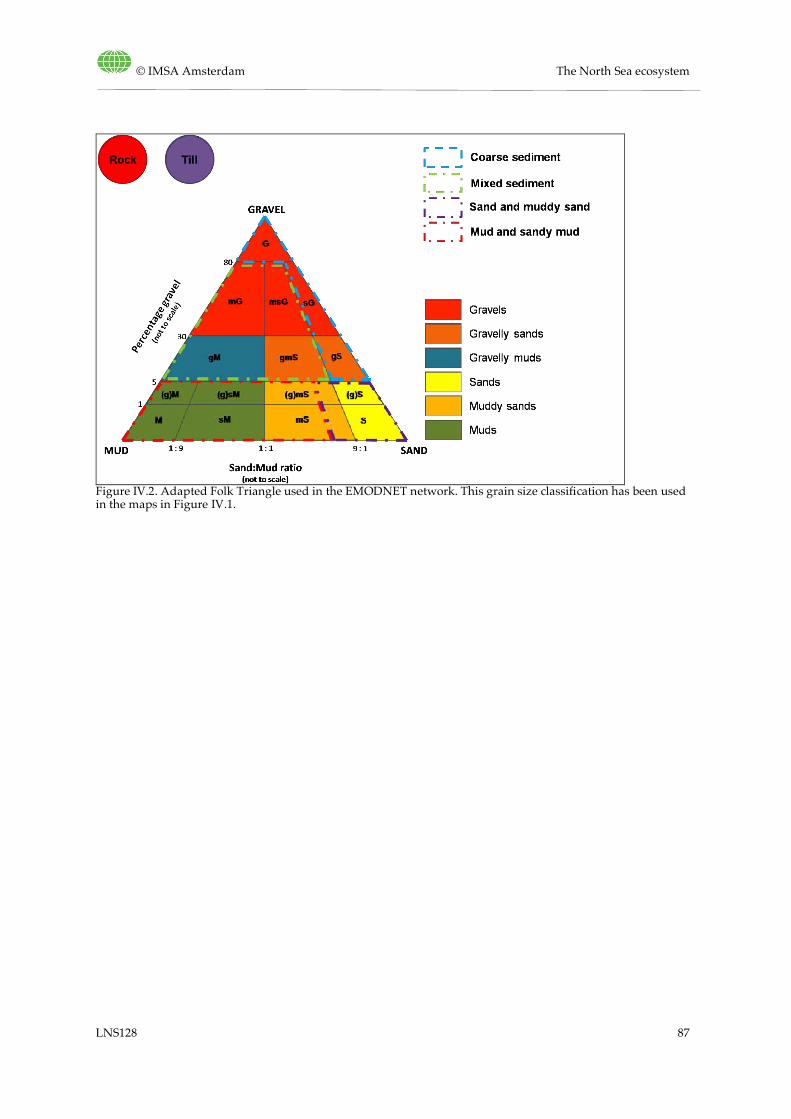
© IMSA Amsterdam The North Sea ecosystem
LNS128 87
Figure IV.2. Adapted Folk Triangle used in the EMODNET network. This grain size classification has been used in the maps in Figure IV.1.
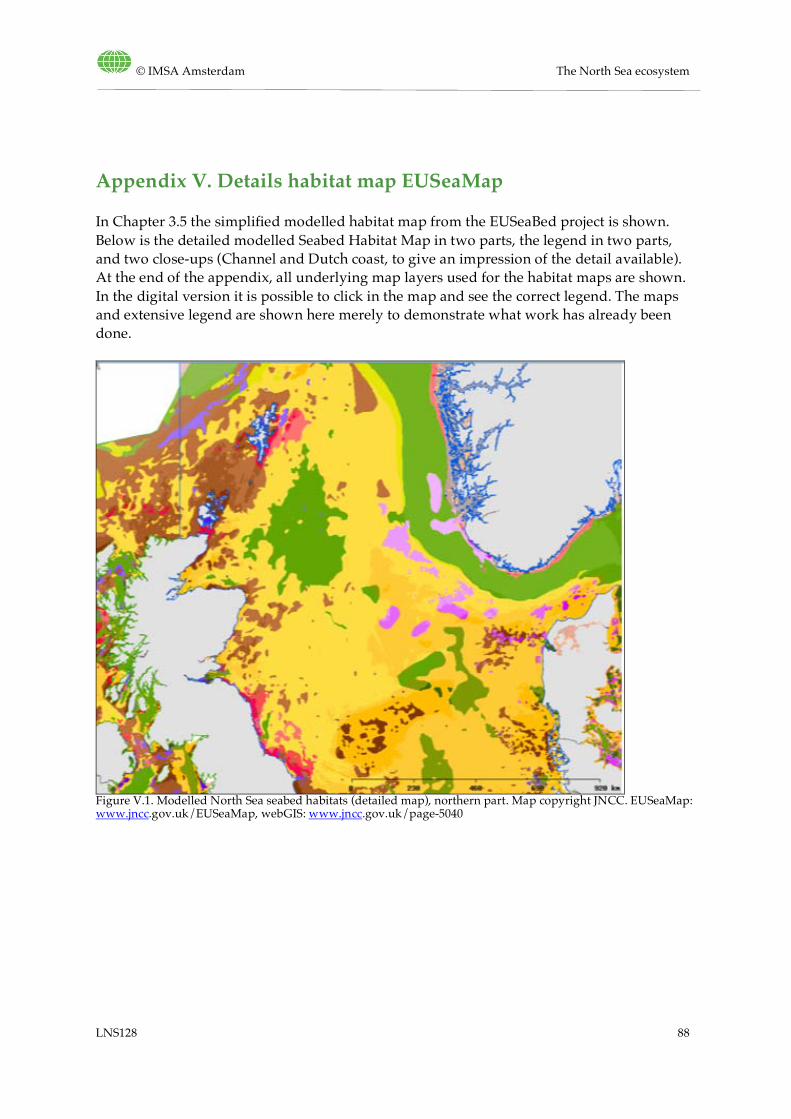
© IMSA Amsterdam The North Sea ecosystem
LNS128 88
Appendix V. Details habitat map EUSeaMap
In Chapter 3.5 the simplified modelled habitat map from the EUSeaBed project is shown. Below is the detailed modelled Seabed Habitat Map in two parts, the legend in two parts, and two close-ups (Channel and Dutch coast, to give an impression of the detail available). At the end of the appendix, all underlying map layers used for the habitat maps are shown. In the digital version it is possible to click in the map and see the correct legend. The maps and extensive legend are shown here merely to demonstrate what work has already been done.
Figure V.1. Modelled North Sea seabed habitats (detailed map), northern part. Map copyright JNCC. EUSeaMap: www.jncc.gov.uk/EUSeaMap, webGIS: www.jncc.gov.uk/page-5040
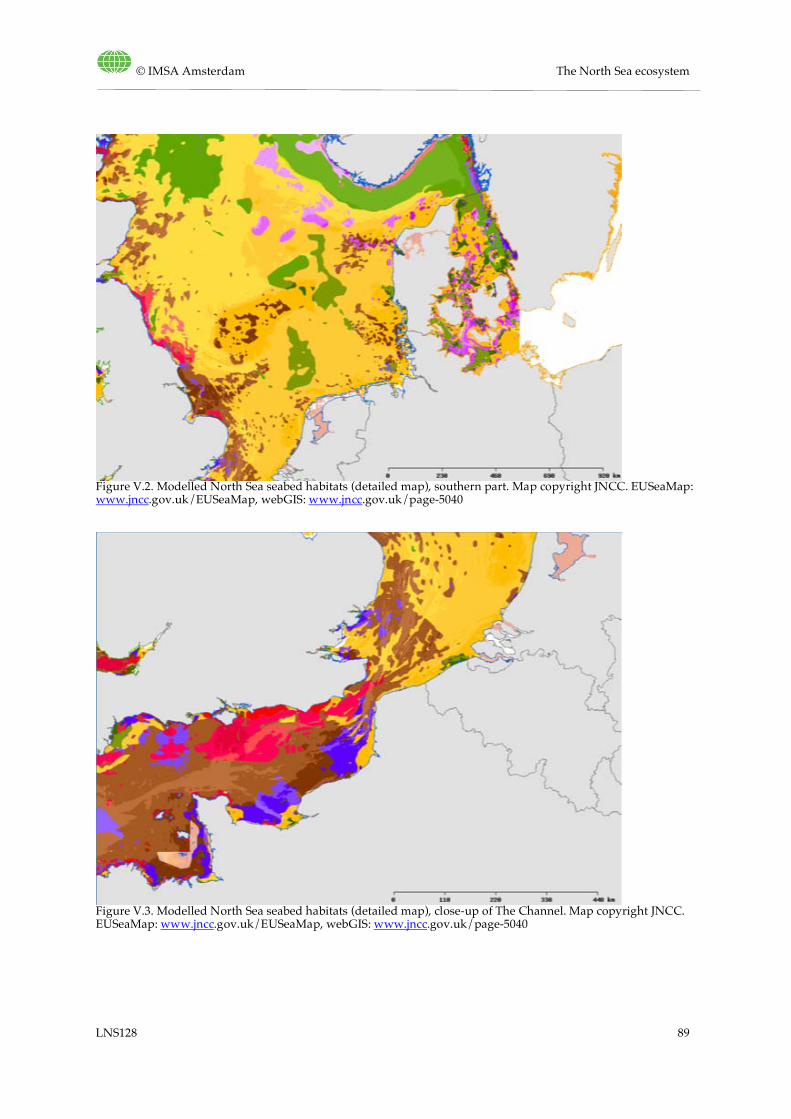
© IMSA Amsterdam The North Sea ecosystem
LNS128 89
Figure V.2. Modelled North Sea seabed habitats (detailed map), southern part. Map copyright JNCC. EUSeaMap: www.jncc.gov.uk/EUSeaMap, webGIS: www.jncc.gov.uk/page-5040
Figure V.3. Modelled North Sea seabed habitats (detailed map), close-up of The Channel. Map copyright JNCC. EUSeaMap: www.jncc.gov.uk/EUSeaMap, webGIS: www.jncc.gov.uk/page-5040
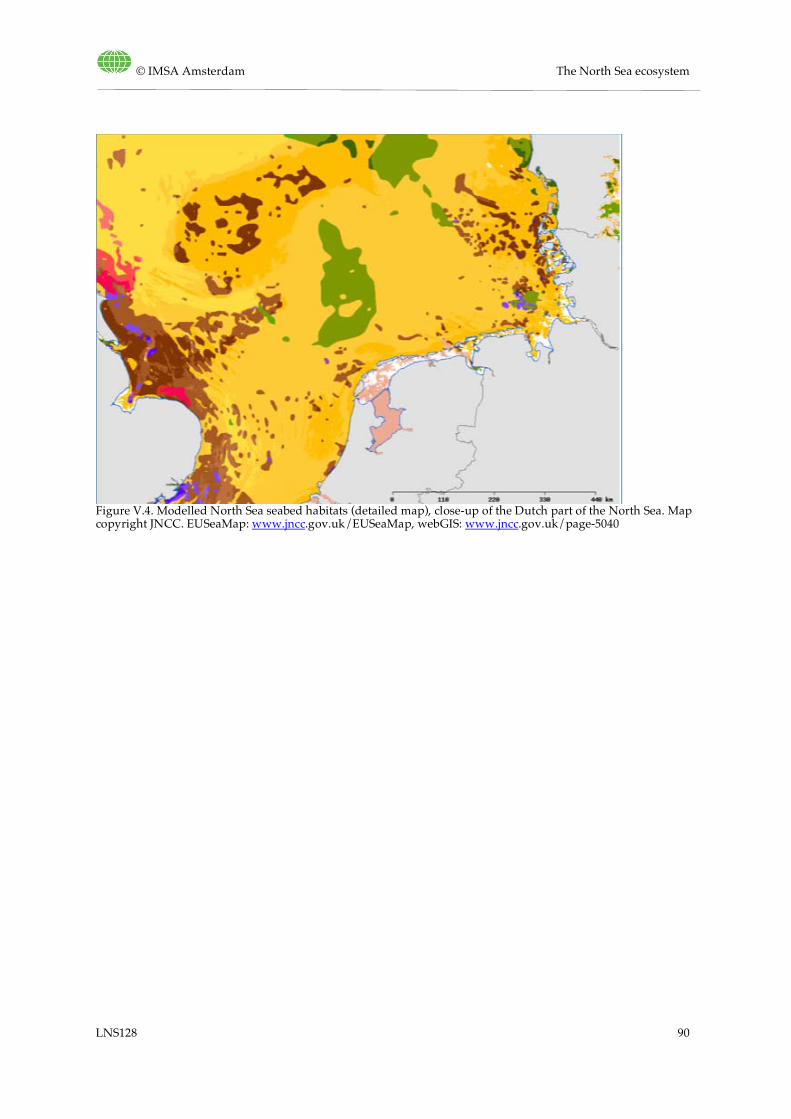
© IMSA Amsterdam The North Sea ecosystem
LNS128 90
Figure V.4. Modelled North Sea seabed habitats (detailed map), close-up of the Dutch part of the North Sea. Map copyright JNCC. EUSeaMap: www.jncc.gov.uk/EUSeaMap, webGIS: www.jncc.gov.uk/page-5040
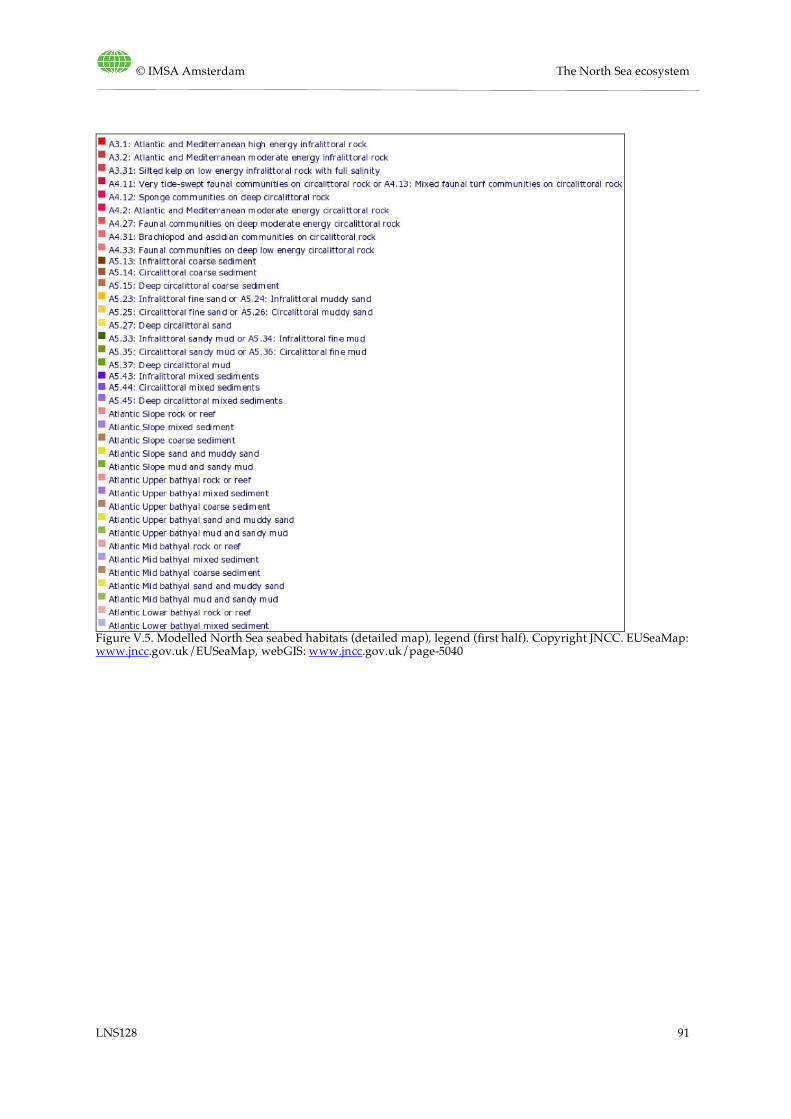
© IMSA Amsterdam The North Sea ecosystem
LNS128 91
Figure V.5. Modelled North Sea seabed habitats (detailed map), legend (first half). Copyright JNCC. EUSeaMap: www.jncc.gov.uk/EUSeaMap, webGIS: www.jncc.gov.uk/page-5040
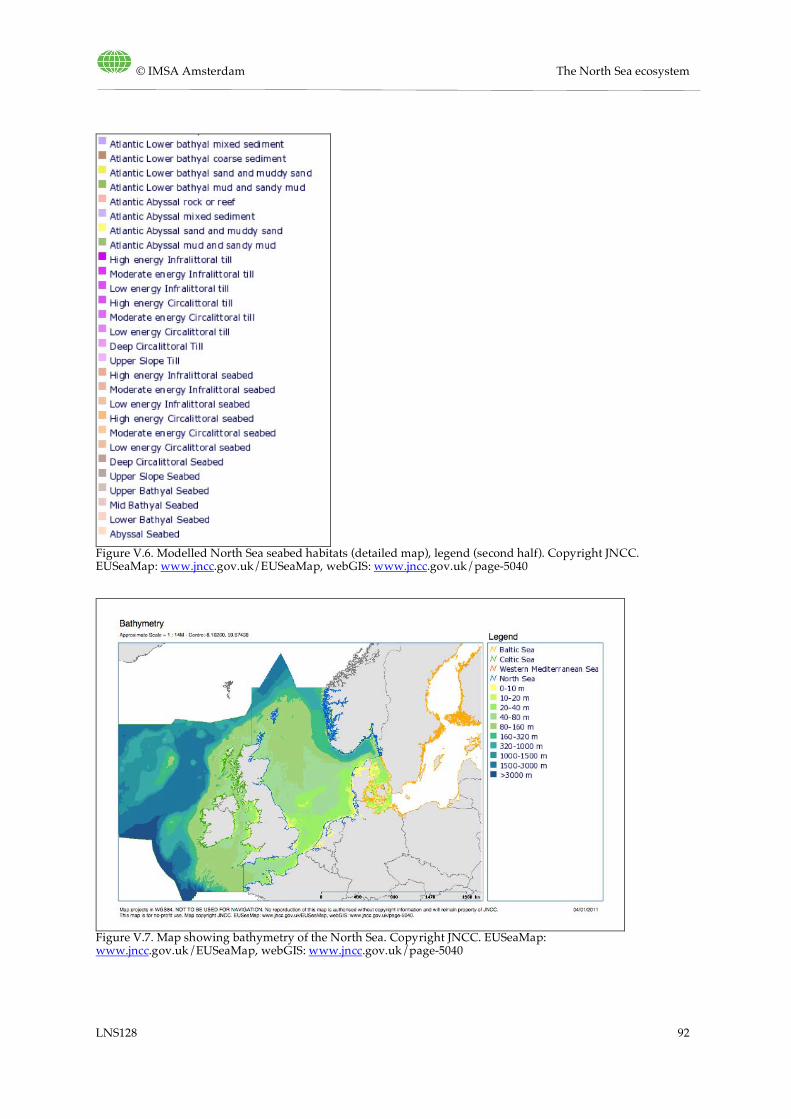
© IMSA Amsterdam The North Sea ecosystem
LNS128 92
Figure V.6. Modelled North Sea seabed habitats (detailed map), legend (second half). Copyright JNCC. EUSeaMap: www.jncc.gov.uk/EUSeaMap, webGIS: www.jncc.gov.uk/page-5040
Figure V.7. Map showing bathymetry of the North Sea. Copyright JNCC. EUSeaMap: www.jncc.gov.uk/EUSeaMap, webGIS: www.jncc.gov.uk/page-5040
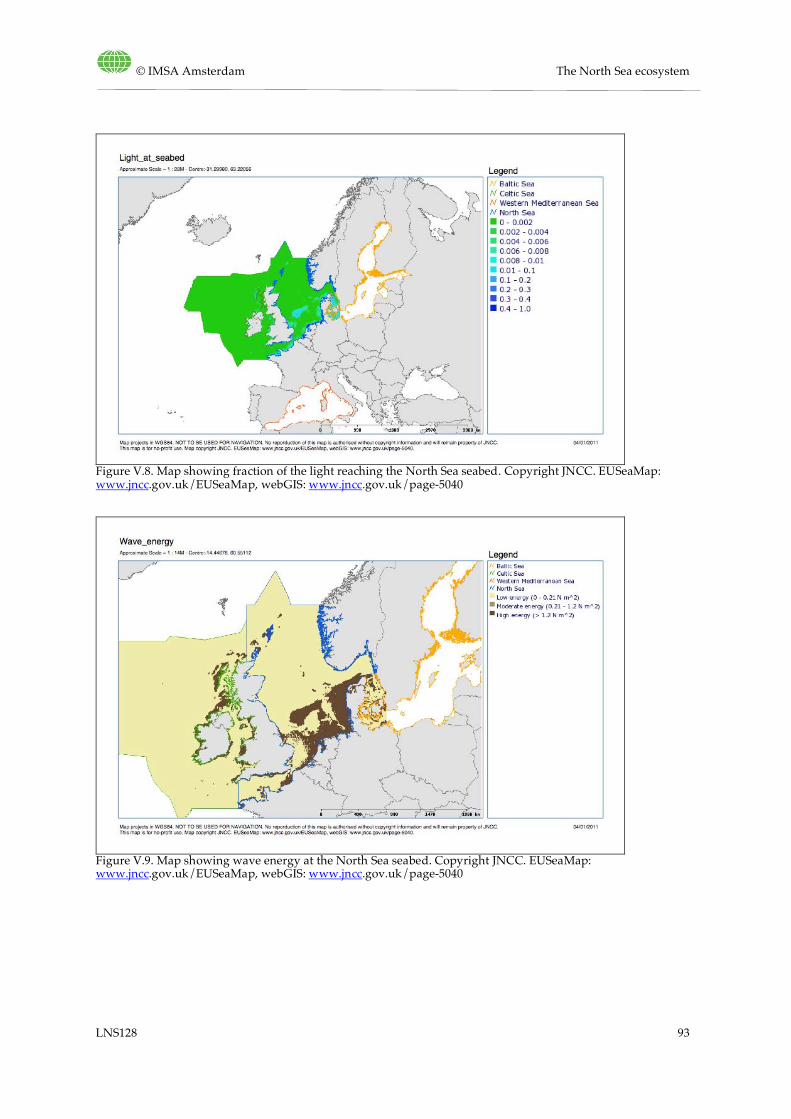
© IMSA Amsterdam The North Sea ecosystem
LNS128 93
Figure V.8. Map showing fraction of the light reaching the North Sea seabed. Copyright JNCC. EUSeaMap: www.jncc.gov.uk/EUSeaMap, webGIS: www.jncc.gov.uk/page-5040
Figure V.9. Map showing wave energy at the North Sea seabed. Copyright JNCC. EUSeaMap: www.jncc.gov.uk/EUSeaMap, webGIS: www.jncc.gov.uk/page-5040
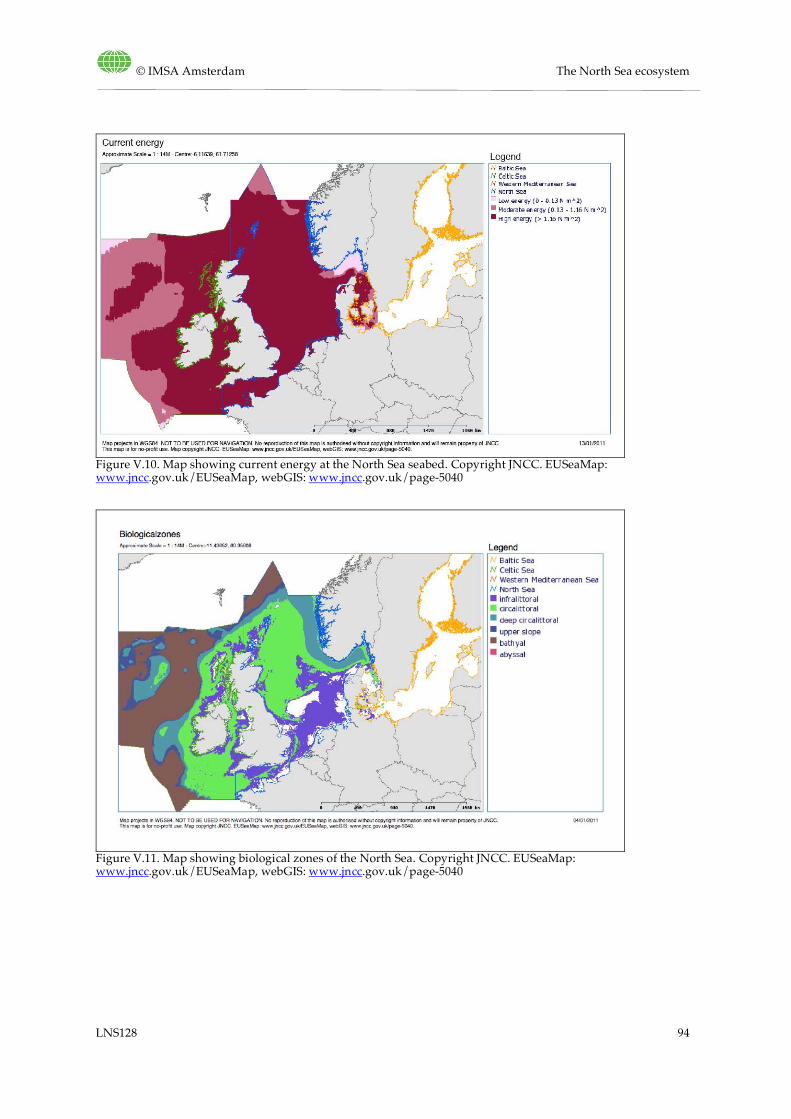
© IMSA Amsterdam The North Sea ecosystem
LNS128 94
Figure V.10. Map showing current energy at the North Sea seabed. Copyright JNCC. EUSeaMap: www.jncc.gov.uk/EUSeaMap, webGIS: www.jncc.gov.uk/page-5040
Figure V.11. Map showing biological zones of the North Sea. Copyright JNCC. EUSeaMap: www.jncc.gov.uk/EUSeaMap, webGIS: www.jncc.gov.uk/page-5040
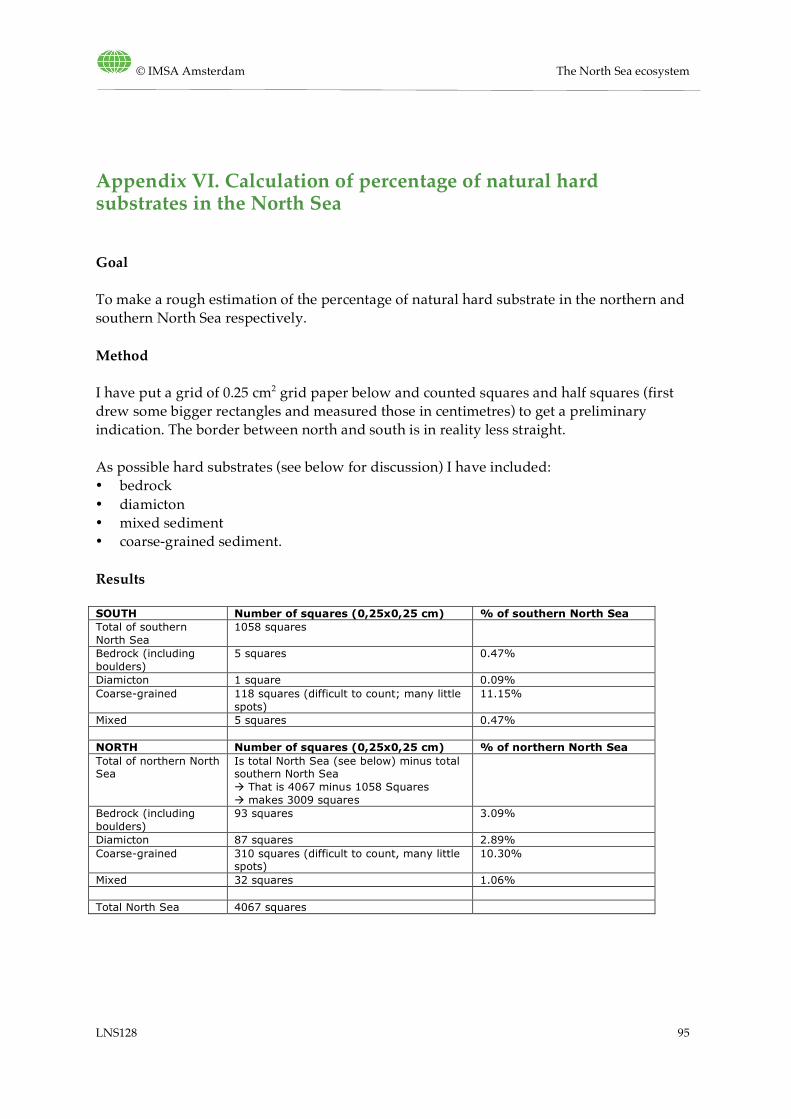
© IMSA Amsterdam The North Sea ecosystem
LNS128 95
Appendix VI. Calculation of percentage of natural hard substrates in the North Sea
Goal
To make a rough estimation of the percentage of natural hard substrate in the northern and southern North Sea respectively.
Method
I have put a grid of 0.25 cm2 grid paper below and counted squares and half squares (first drew some bigger rectangles and measured those in centimetres) to get a preliminary indication. The border between north and south is in reality less straight. As possible hard substrates (see below for discussion) I have included: • bedrock • diamicton • mixed sediment • coarse-grained sediment.
Results
SOUTH Number of squares (0,25x0,25 cm) % of southern North Sea Total of southern North Sea
1058 squares
Bedrock (including boulders)
5 squares 0.47%
Diamicton 1 square 0.09% Coarse-grained 118 squares (difficult to count; many little
spots) 11.15%
Mixed 5 squares 0.47% NORTH Number of squares (0,25x0,25 cm) % of northern North Sea Total of northern North Sea
Is total North Sea (see below) minus total southern North Sea That is 4067 minus 1058 Squares makes 3009 squares
Bedrock (including boulders)
93 squares 3.09%
Diamicton 87 squares 2.89% Coarse-grained 310 squares (difficult to count, many little
spots) 10.30%
Mixed 32 squares 1.06% Total North Sea 4067 squares
© IMSA Amsterdam The North Sea ecosystem
LNS128 96
Conclusion
For the LiNSI project we made a rough estimation of percentages of hard substrates in the northern and southern North Sea. If we only count bedrock (including boulders) as hard substrate, then in the southern North Sea 0.5% of the seabed surface area is hard substrate and the northern North Sea 3.1%. If we count diamicton, mixed and coarse-grained substrate also as hard, the totals are 12.2% hard substrate for the southern and 17.3% for the northern North Sea. In reality, however, only part of the sediment in these latter three categories will exist of pebbles and cobbles that are large enough to be called hard substrate. Calculations are based on a seabed substrates map of the North Sea created in the EMODNET project (august 2010; OneGeology-Europe Portal; http://onegeology-europe.brgm.fr/geoportal/viewer.jsp). The area counted is shown in the map below. To the west, east and north, the map edges have been used as border. To the south, the Straight of Dover is the border. The dashed line shows the division between the southern and northern North Sea as used for these calculations.
Next step
Of course the hard substrate can also be calculated in square kilometres, but then first an estimation should be made of the total number of square kilometres of the area shown. We have used squares of 0.25 x 0.25 cm.
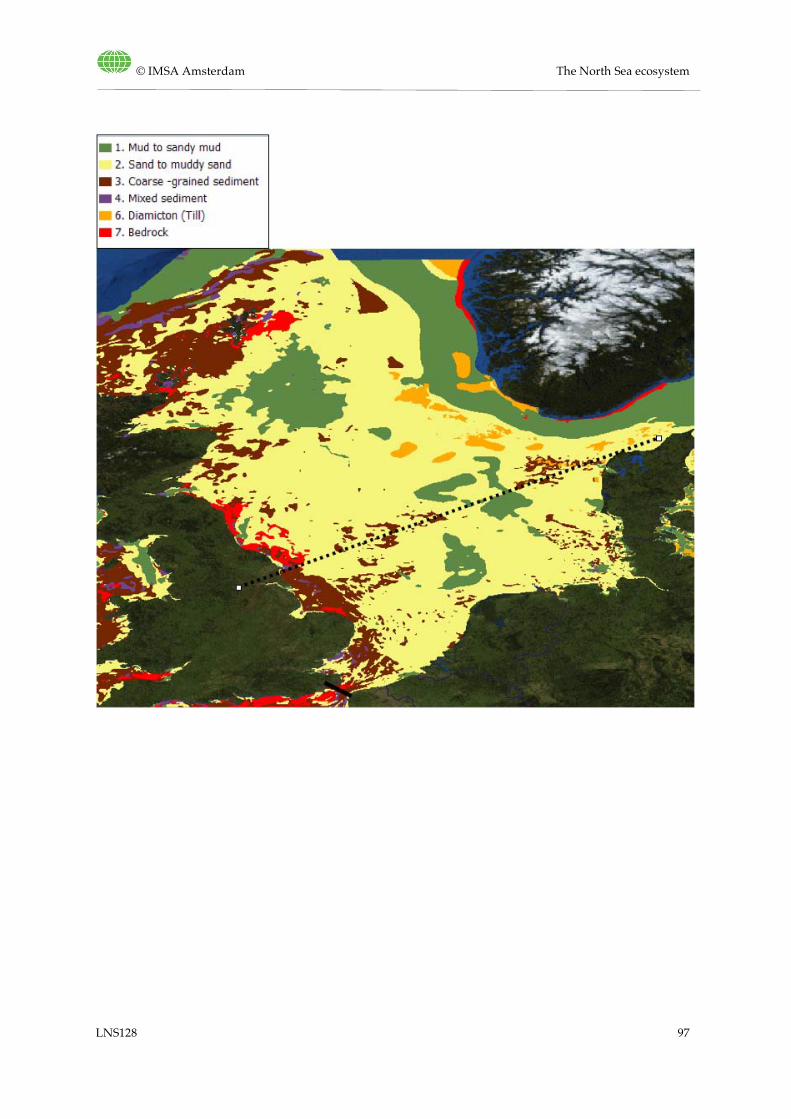
© IMSA Amsterdam The North Sea ecosystem
LNS128 97
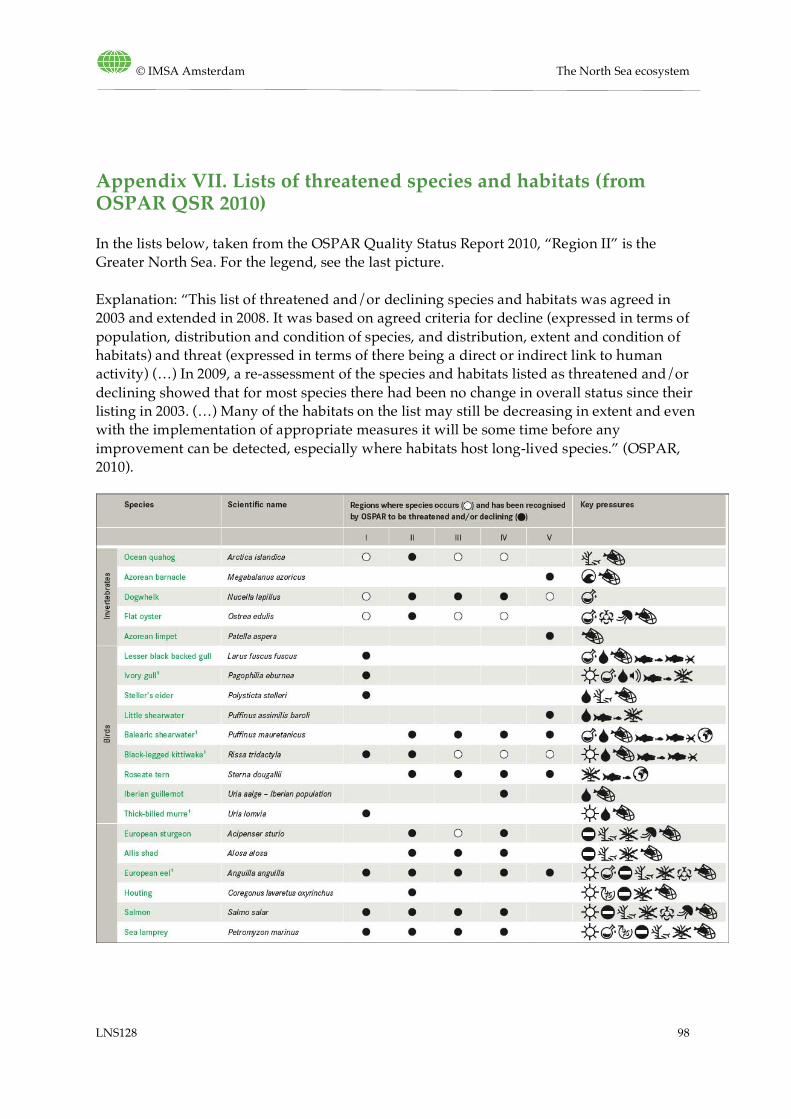
© IMSA Amsterdam The North Sea ecosystem
LNS128 98
Appendix VII. Lists of threatened species and habitats (from OSPAR QSR 2010)
In the lists below, taken from the OSPAR Quality Status Report 2010, “Region II” is the Greater North Sea. For the legend, see the last picture. Explanation: “This list of threatened and/or declining species and habitats was agreed in 2003 and extended in 2008. It was based on agreed criteria for decline (expressed in terms of population, distribution and condition of species, and distribution, extent and condition of habitats) and threat (expressed in terms of there being a direct or indirect link to human activity) (…) In 2009, a re-assessment of the species and habitats listed as threatened and/or declining showed that for most species there had been no change in overall status since their listing in 2003. (…) Many of the habitats on the list may still be decreasing in extent and even with the implementation of appropriate measures it will be some time before any improvement can be detected, especially where habitats host long-lived species.” (OSPAR, 2010).
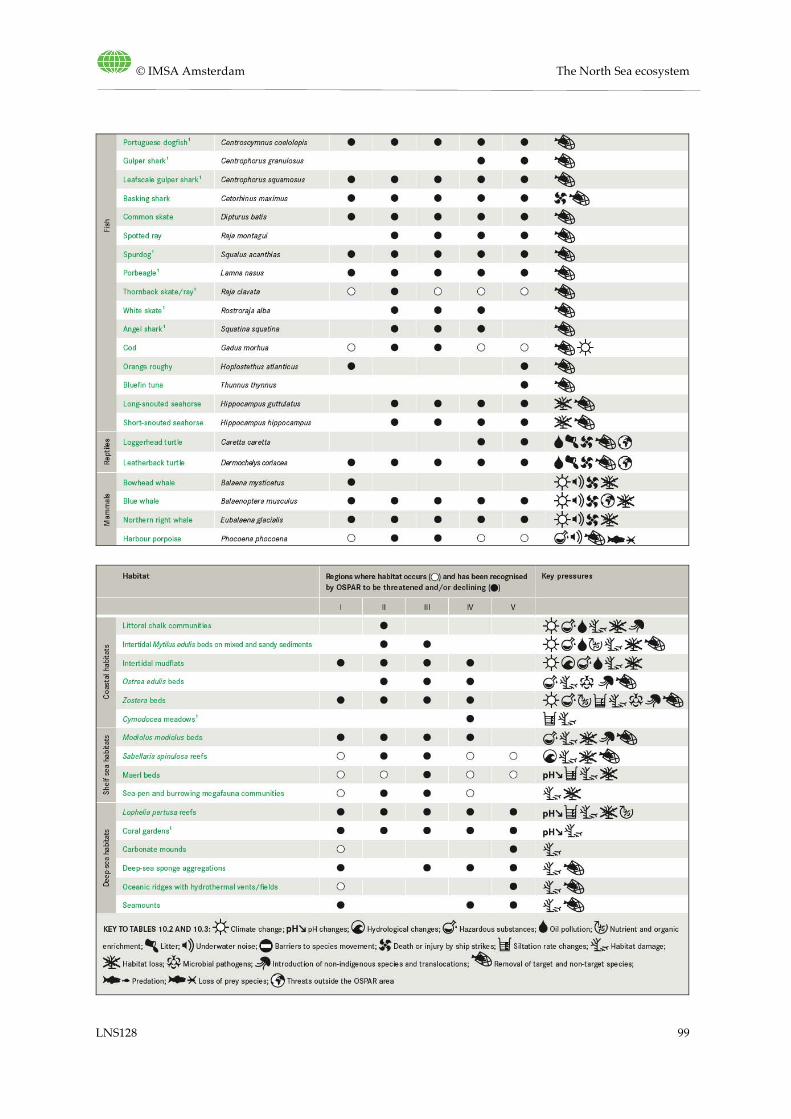
© IMSA Amsterdam The North Sea ecosystem
LNS128 99
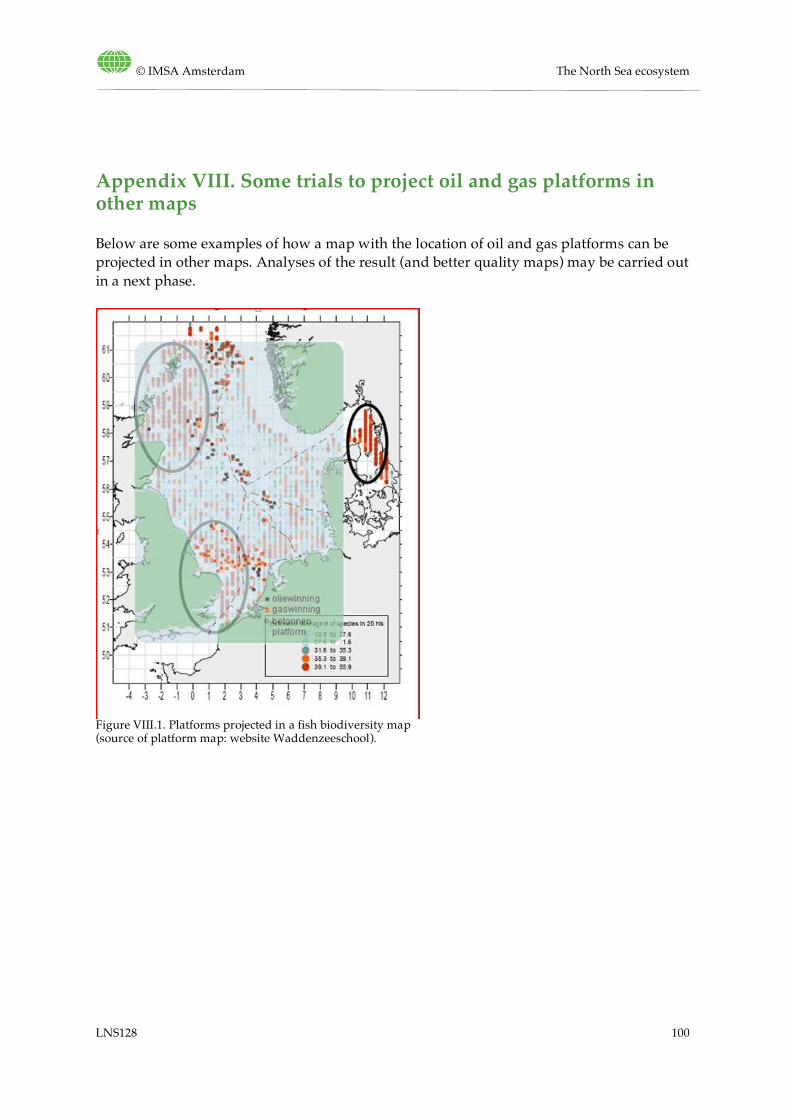
© IMSA Amsterdam The North Sea ecosystem
LNS128 100
Appendix VIII. Some trials to project oil and gas platforms in other maps
Below are some examples of how a map with the location of oil and gas platforms can be projected in other maps. Analyses of the result (and better quality maps) may be carried out in a next phase.
Figure VIII.1. Platforms projected in a fish biodiversity map (source of platform map: website Waddenzeeschool).
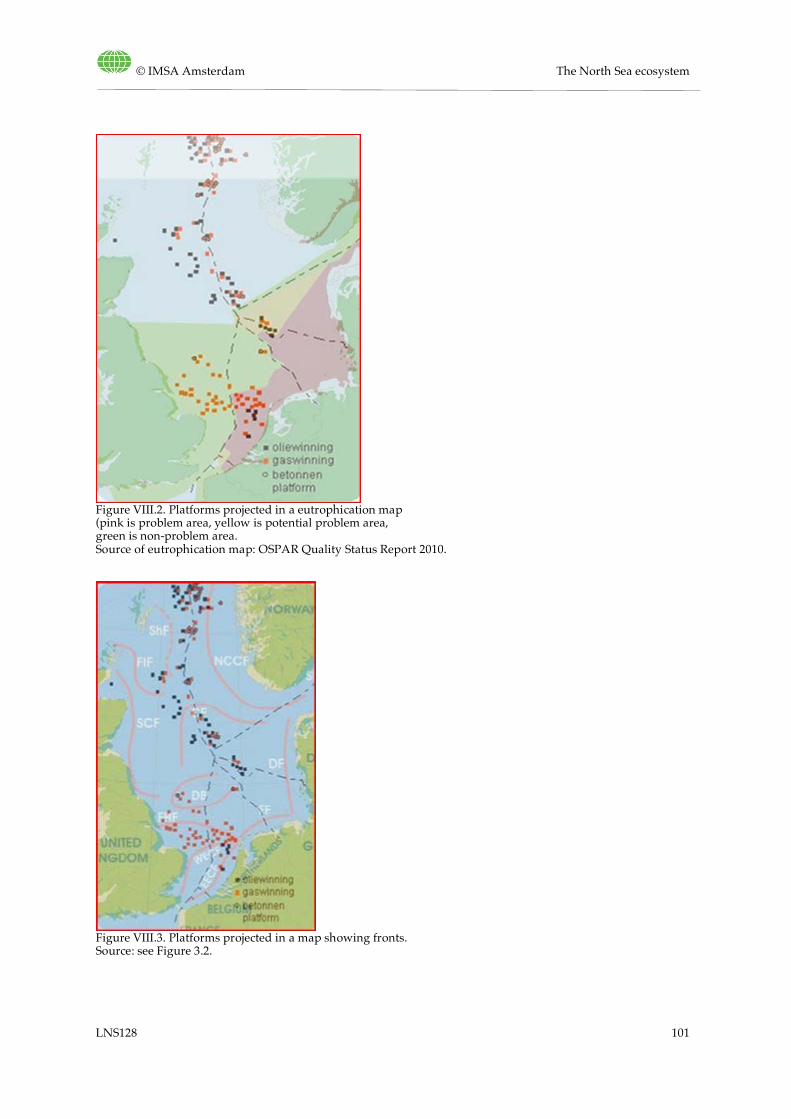
© IMSA Amsterdam The North Sea ecosystem
LNS128 101
Figure VIII.2. Platforms projected in a eutrophication map (pink is problem area, yellow is potential problem area, green is non-problem area. Source of eutrophication map: OSPAR Quality Status Report 2010.
Figure VIII.3. Platforms projected in a map showing fronts. Source: see Figure 3.2.
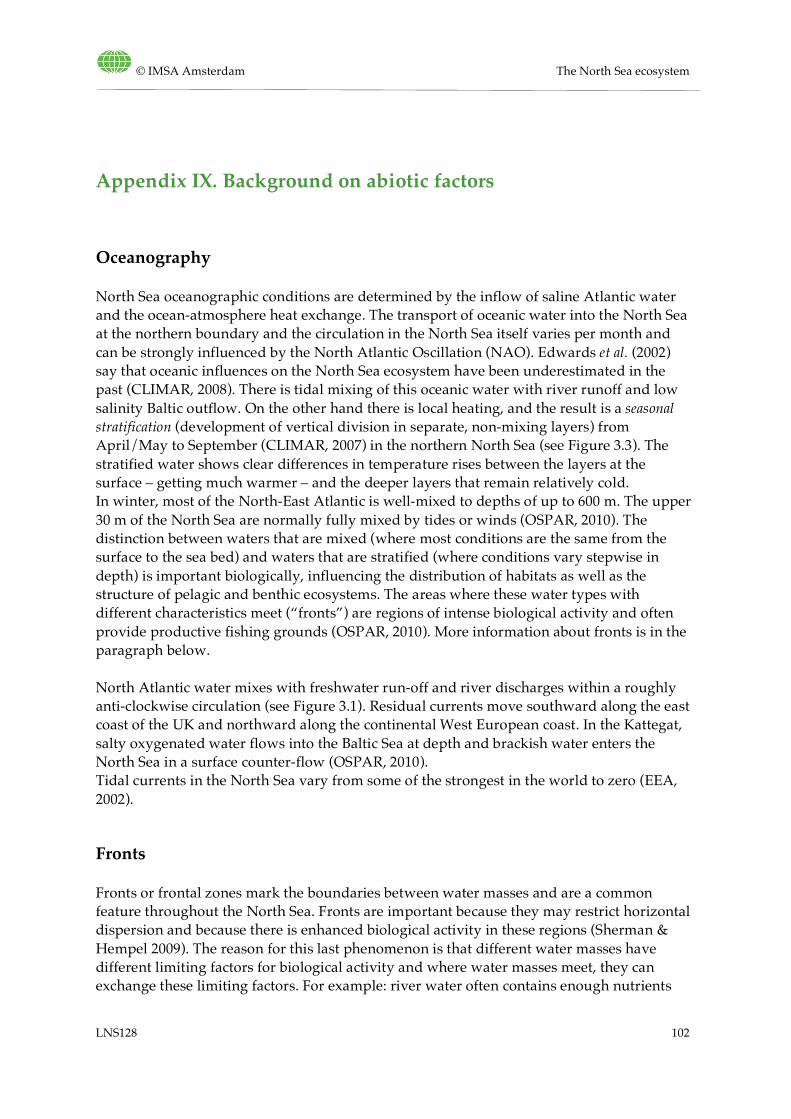
© IMSA Amsterdam The North Sea ecosystem
LNS128 102
Appendix IX. Background on abiotic factors
Oceanography
North Sea oceanographic conditions are determined by the inflow of saline Atlantic water and the ocean-atmosphere heat exchange. The transport of oceanic water into the North Sea at the northern boundary and the circulation in the North Sea itself varies per month and can be strongly influenced by the North Atlantic Oscillation (NAO). Edwards et al. (2002) say that oceanic influences on the North Sea ecosystem have been underestimated in the past (CLIMAR, 2008). There is tidal mixing of this oceanic water with river runoff and low salinity Baltic outflow. On the other hand there is local heating, and the result is a seasonal stratification (development of vertical division in separate, non-mixing layers) from April/May to September (CLIMAR, 2007) in the northern North Sea (see Figure 3.3). The stratified water shows clear differences in temperature rises between the layers at the surface – getting much warmer – and the deeper layers that remain relatively cold. In winter, most of the North-East Atlantic is well-mixed to depths of up to 600 m. The upper 30 m of the North Sea are normally fully mixed by tides or winds (OSPAR, 2010). The distinction between waters that are mixed (where most conditions are the same from the surface to the sea bed) and waters that are stratified (where conditions vary stepwise in depth) is important biologically, influencing the distribution of habitats as well as the structure of pelagic and benthic ecosystems. The areas where these water types with different characteristics meet (“fronts”) are regions of intense biological activity and often provide productive fishing grounds (OSPAR, 2010). More information about fronts is in the paragraph below. North Atlantic water mixes with freshwater run-off and river discharges within a roughly anti-clockwise circulation (see Figure 3.1). Residual currents move southward along the east coast of the UK and northward along the continental West European coast. In the Kattegat, salty oxygenated water flows into the Baltic Sea at depth and brackish water enters the North Sea in a surface counter-flow (OSPAR, 2010). Tidal currents in the North Sea vary from some of the strongest in the world to zero (EEA, 2002).
Fronts
Fronts or frontal zones mark the boundaries between water masses and are a common feature throughout the North Sea. Fronts are important because they may restrict horizontal dispersion and because there is enhanced biological activity in these regions (Sherman & Hempel 2009). The reason for this last phenomenon is that different water masses have different limiting factors for biological activity and where water masses meet, they can exchange these limiting factors. For example: river water often contains enough nutrients
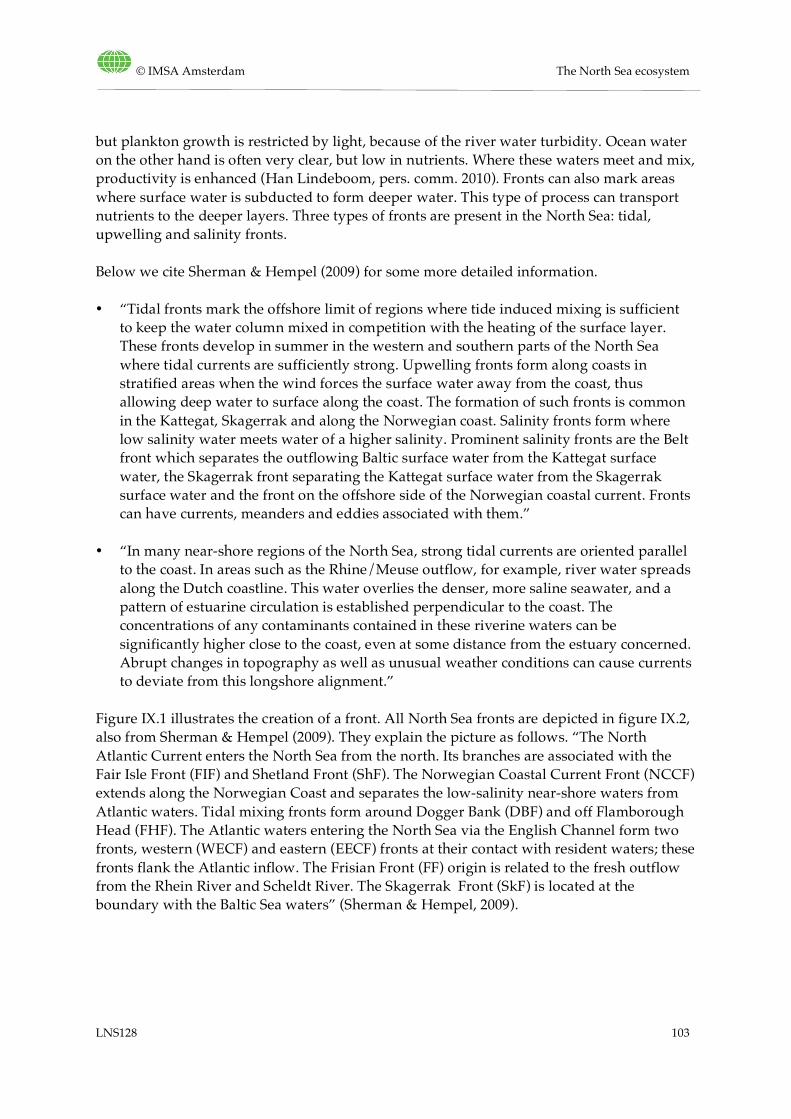
© IMSA Amsterdam The North Sea ecosystem
LNS128 103
but plankton growth is restricted by light, because of the river water turbidity. Ocean water on the other hand is often very clear, but low in nutrients. Where these waters meet and mix, productivity is enhanced (Han Lindeboom, pers. comm. 2010). Fronts can also mark areas where surface water is subducted to form deeper water. This type of process can transport nutrients to the deeper layers. Three types of fronts are present in the North Sea: tidal, upwelling and salinity fronts. Below we cite Sherman & Hempel (2009) for some more detailed information. • “Tidal fronts mark the offshore limit of regions where tide induced mixing is sufficient
to keep the water column mixed in competition with the heating of the surface layer. These fronts develop in summer in the western and southern parts of the North Sea where tidal currents are sufficiently strong. Upwelling fronts form along coasts in stratified areas when the wind forces the surface water away from the coast, thus allowing deep water to surface along the coast. The formation of such fronts is common in the Kattegat, Skagerrak and along the Norwegian coast. Salinity fronts form where low salinity water meets water of a higher salinity. Prominent salinity fronts are the Belt front which separates the outflowing Baltic surface water from the Kattegat surface water, the Skagerrak front separating the Kattegat surface water from the Skagerrak surface water and the front on the offshore side of the Norwegian coastal current. Fronts can have currents, meanders and eddies associated with them.”
• “In many near-shore regions of the North Sea, strong tidal currents are oriented parallel to the coast. In areas such as the Rhine/Meuse outflow, for example, river water spreads along the Dutch coastline. This water overlies the denser, more saline seawater, and a pattern of estuarine circulation is established perpendicular to the coast. The concentrations of any contaminants contained in these riverine waters can be significantly higher close to the coast, even at some distance from the estuary concerned. Abrupt changes in topography as well as unusual weather conditions can cause currents to deviate from this longshore alignment.”
Figure IX.1 illustrates the creation of a front. All North Sea fronts are depicted in figure IX.2, also from Sherman & Hempel (2009). They explain the picture as follows. “The North Atlantic Current enters the North Sea from the north. Its branches are associated with the Fair Isle Front (FIF) and Shetland Front (ShF). The Norwegian Coastal Current Front (NCCF) extends along the Norwegian Coast and separates the low-salinity near-shore waters from Atlantic waters. Tidal mixing fronts form around Dogger Bank (DBF) and off Flamborough Head (FHF). The Atlantic waters entering the North Sea via the English Channel form two fronts, western (WECF) and eastern (EECF) fronts at their contact with resident waters; these fronts flank the Atlantic inflow. The Frisian Front (FF) origin is related to the fresh outflow from the Rhein River and Scheldt River. The Skagerrak Front (SkF) is located at the boundary with the Baltic Sea waters” (Sherman & Hempel, 2009).
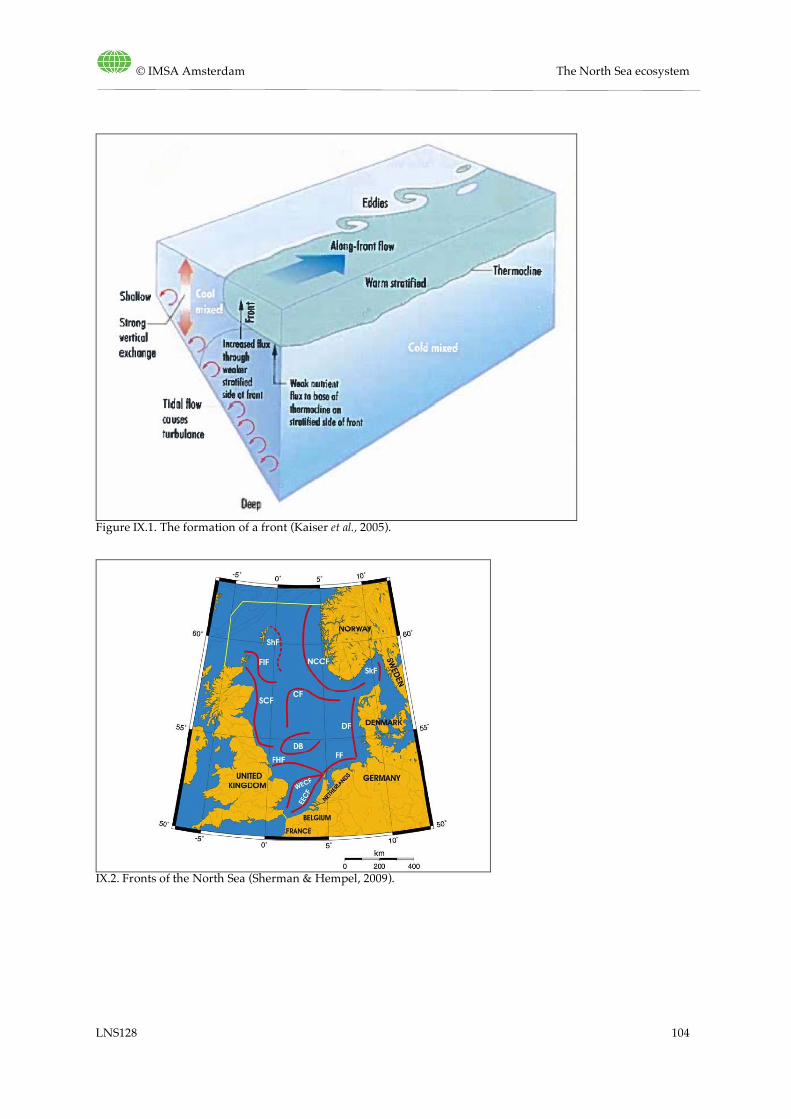
© IMSA Amsterdam The North Sea ecosystem
LNS128 104
Figure IX.1. The formation of a front (Kaiser et al., 2005).
IX.2. Fronts of the North Sea (Sherman & Hempel, 2009).
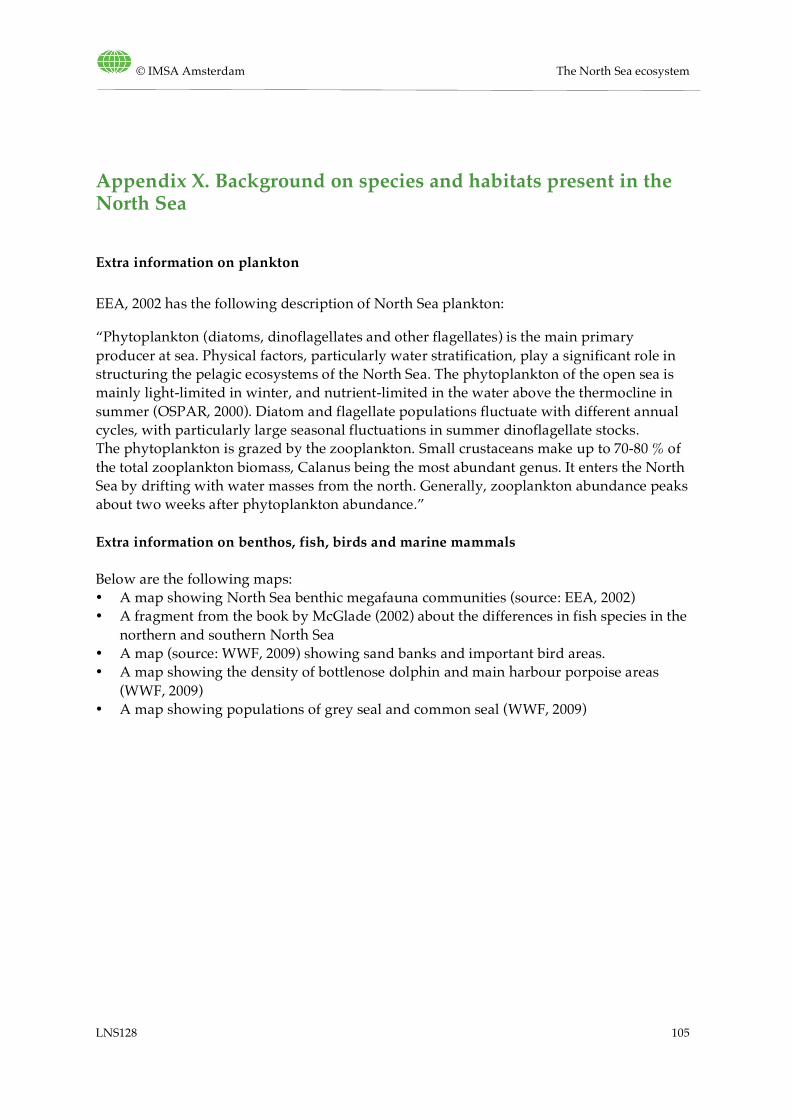
© IMSA Amsterdam The North Sea ecosystem
LNS128 105
Appendix X. Background on species and habitats present in the North Sea
Extra information on plankton
EEA, 2002 has the following description of North Sea plankton:
“Phytoplankton (diatoms, dinoflagellates and other flagellates) is the main primary producer at sea. Physical factors, particularly water stratification, play a significant role in structuring the pelagic ecosystems of the North Sea. The phytoplankton of the open sea is mainly light-limited in winter, and nutrient-limited in the water above the thermocline in summer (OSPAR, 2000). Diatom and flagellate populations fluctuate with different annual cycles, with particularly large seasonal fluctuations in summer dinoflagellate stocks. The phytoplankton is grazed by the zooplankton. Small crustaceans make up to 70-80 % of the total zooplankton biomass, Calanus being the most abundant genus. It enters the North Sea by drifting with water masses from the north. Generally, zooplankton abundance peaks about two weeks after phytoplankton abundance.”
Extra information on benthos, fish, birds and marine mammals
Below are the following maps: • A map showing North Sea benthic megafauna communities (source: EEA, 2002) • A fragment from the book by McGlade (2002) about the differences in fish species in the
northern and southern North Sea • A map (source: WWF, 2009) showing sand banks and important bird areas. • A map showing the density of bottlenose dolphin and main harbour porpoise areas
(WWF, 2009) • A map showing populations of grey seal and common seal (WWF, 2009)
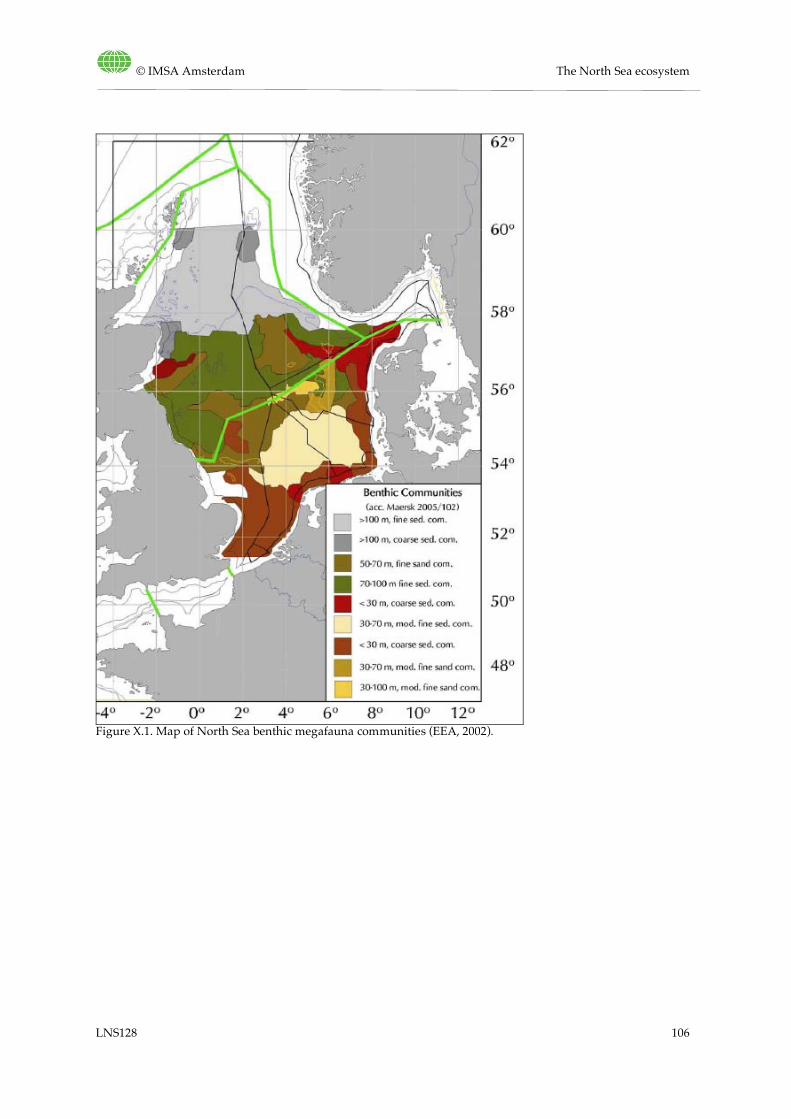
© IMSA Amsterdam The North Sea ecosystem
LNS128 106
Figure X.1. Map of North Sea benthic megafauna communities (EEA, 2002).
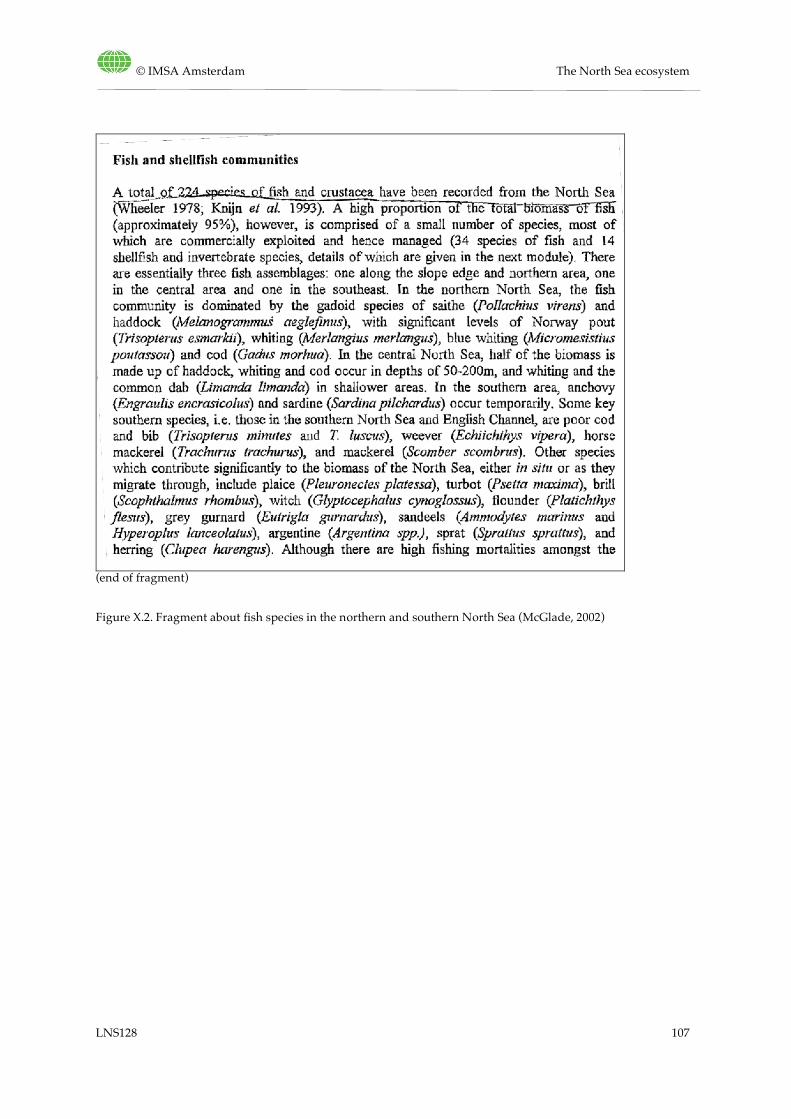
© IMSA Amsterdam The North Sea ecosystem
LNS128 107
(end of fragment) Figure X.2. Fragment about fish species in the northern and southern North Sea (McGlade, 2002)
© IMSA Amsterdam The North Sea ecosystem
LNS128 108
Figure X.3. Map showing sand banks and important bird areas (WWF, 2009)
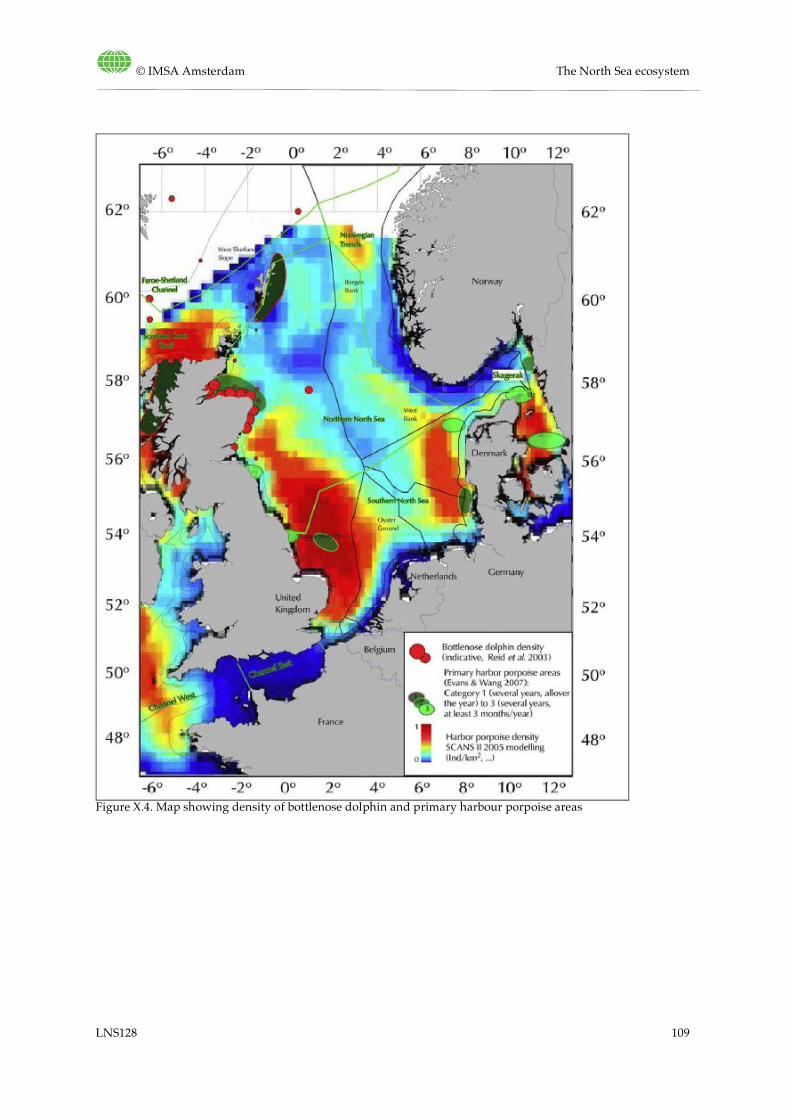
© IMSA Amsterdam The North Sea ecosystem
LNS128 109
Figure X.4. Map showing density of bottlenose dolphin and primary harbour porpoise areas
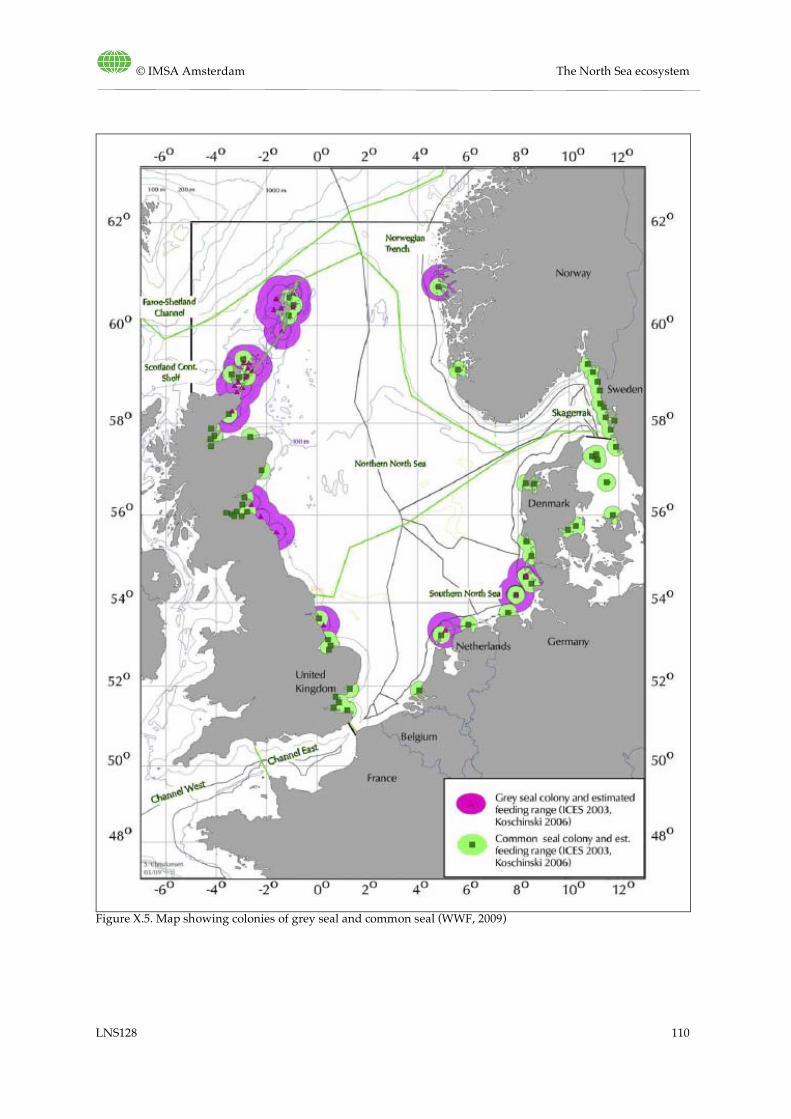
© IMSA Amsterdam The North Sea ecosystem
LNS128 110
Figure X.5. Map showing colonies of grey seal and common seal (WWF, 2009)
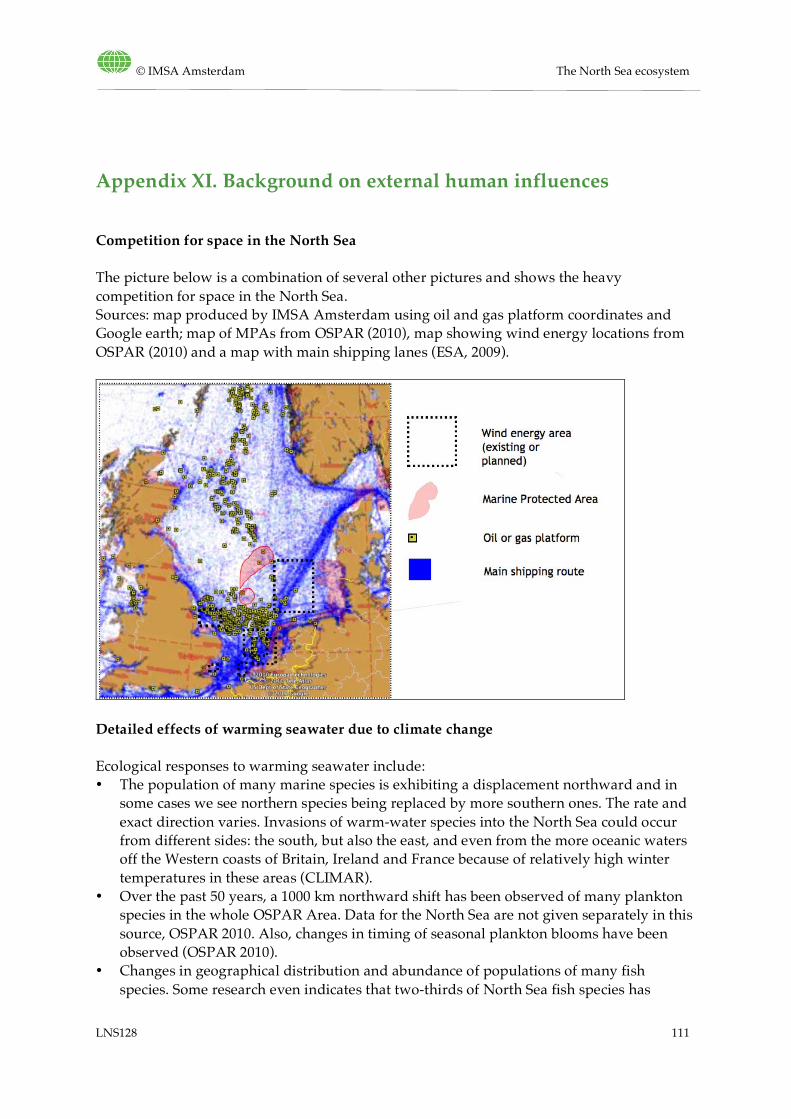
© IMSA Amsterdam The North Sea ecosystem
LNS128 111
Appendix XI. Background on external human influences
Competition for space in the North Sea
The picture below is a combination of several other pictures and shows the heavy competition for space in the North Sea. Sources: map produced by IMSA Amsterdam using oil and gas platform coordinates and Google earth; map of MPAs from OSPAR (2010), map showing wind energy locations from OSPAR (2010) and a map with main shipping lanes (ESA, 2009).
Detailed effects of warming seawater due to climate change
Ecological responses to warming seawater include: • The population of many marine species is exhibiting a displacement northward and in
some cases we see northern species being replaced by more southern ones. The rate and exact direction varies. Invasions of warm-water species into the North Sea could occur from different sides: the south, but also the east, and even from the more oceanic waters off the Western coasts of Britain, Ireland and France because of relatively high winter temperatures in these areas (CLIMAR).
• Over the past 50 years, a 1000 km northward shift has been observed of many plankton species in the whole OSPAR Area. Data for the North Sea are not given separately in this source, OSPAR 2010. Also, changes in timing of seasonal plankton blooms have been observed (OSPAR 2010).
• Changes in geographical distribution and abundance of populations of many fish species. Some research even indicates that two-thirds of North Sea fish species has
© IMSA Amsterdam The North Sea ecosystem
LNS128 112
shifted in mean latitude or depth over the last 25 years. Atlantic cod density decreased by a factor 100 along the Dutch coast. Haddock decreased in the south and slightly increased in the north. Red mullet has increased by 48% in the North Sea. Anchovy (an almost subtropical species) greatly increased in density in the North Sea in recent years (CLIMAR, 2008). Sea birds are also affected (Atlantic puffin, black legged kittiwake, northern fulmar), but these relations are less clear.
• Different species react differently on warming of the seawater. This leads to mismatches in timing between organisms that are dependent on each other (trophic mismatch).
• Primary production is influenced by many climatic factors: temperature, light and nutrients (CLIMAR 2008). There is some evidence for earlier stratification in recent years and earlier onset of the associated algal bloom (OSPAR 2010).
• Changes in time of reproduction • Timing of the spring migration of birds • Population dynamics, abundance, competition and predator-prey relationships An effect of the changing climate in general is that rainfall patterns may influence the amount of nutrient deposition. OSPAR 2010: “Drier summers may already be contributing to a decrease in nutrient inputs. Higher inputs in wet years have caused harmful algae blooms”. This quote however is about the OSPAR region at large, minus Region V (wider Atlantic).
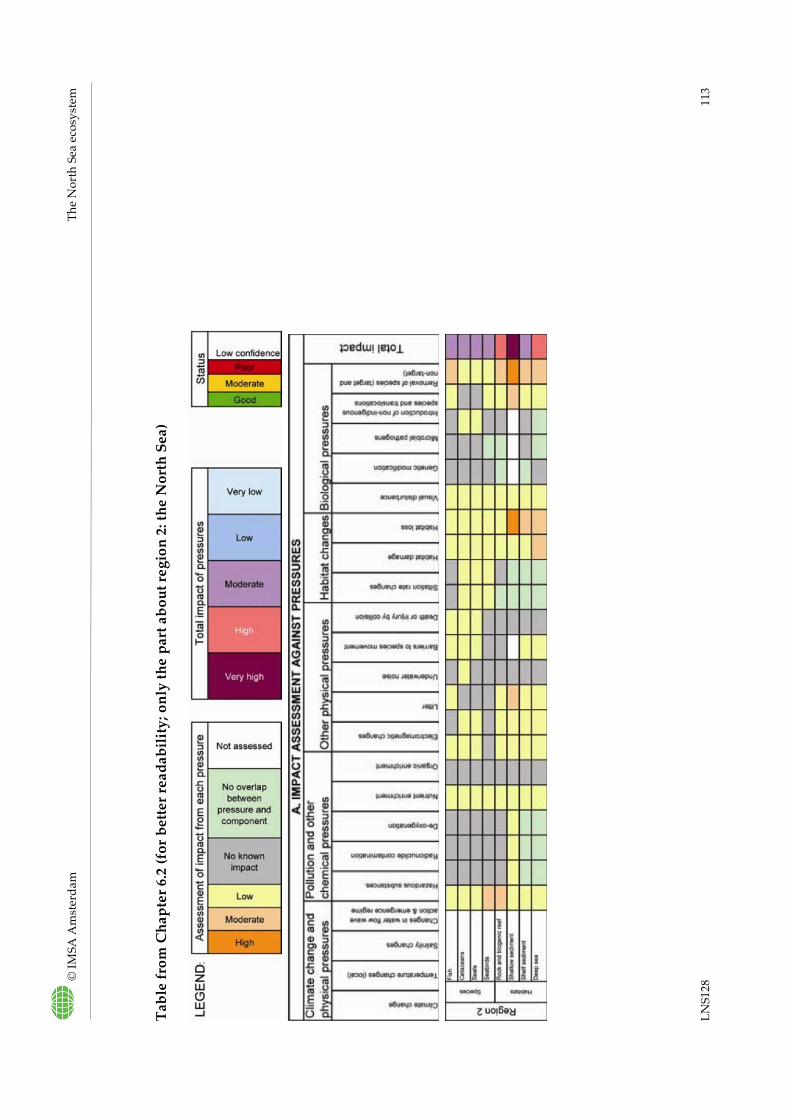
©
IMSA
Am
ster
dam
Th
e N
orth
Sea
eco
syst
em
LNS1
28
113
Tabl
e fr
om C
hapt
er 6
.2 (f
or b
ette
r rea
dabi
lity;
onl
y th
e pa
rt a
bout
regi
on 2
: the
Nor
th S
ea)
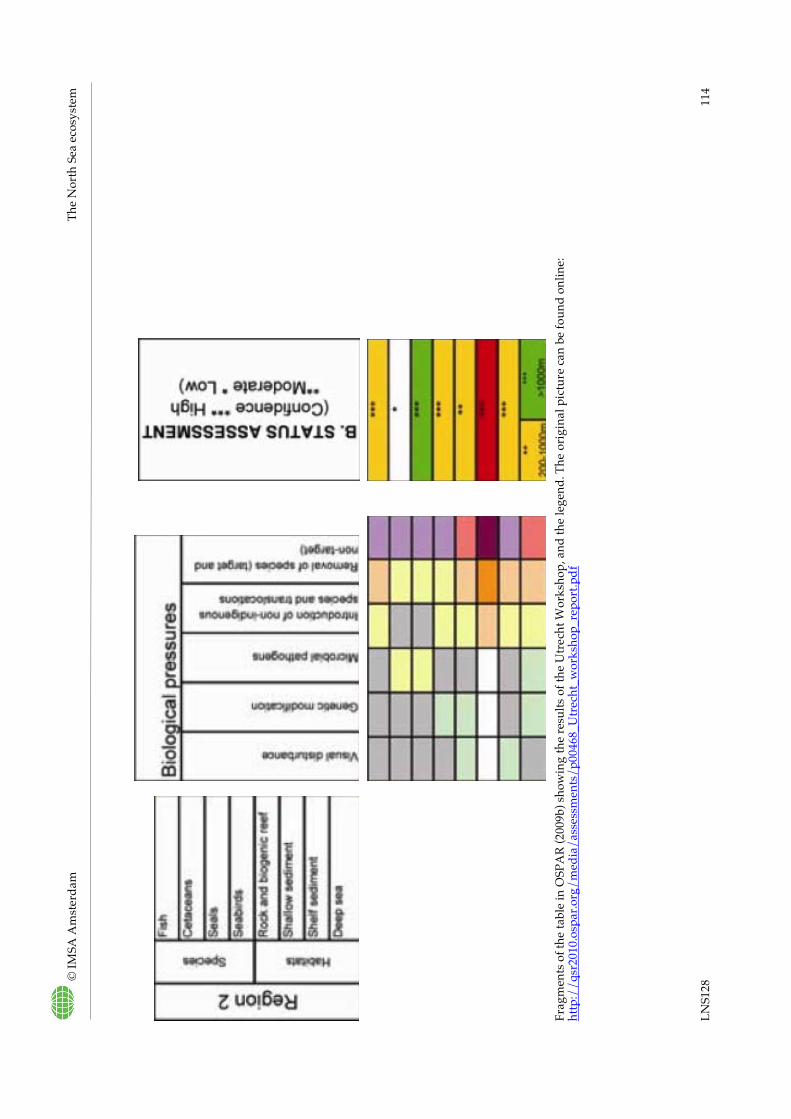
©
IMSA
Am
ster
dam
Th
e N
orth
Sea
eco
syst
em
LNS1
28
114
Frag
men
ts o
f the
tabl
e in
OSP
AR
(200
9b) s
how
ing
the
resu
lts o
f the
Utr
echt
Wor
ksho
p, a
nd th
e le
gend
. The
ori
gina
l pic
ture
can
be fo
und
onlin
e:
http
://q
sr20
10.o
spar
.org
/med
ia/a
sses
smen
ts/p
0046
8_U
trec
ht_w
orks
hop_
repo
rt.p
df
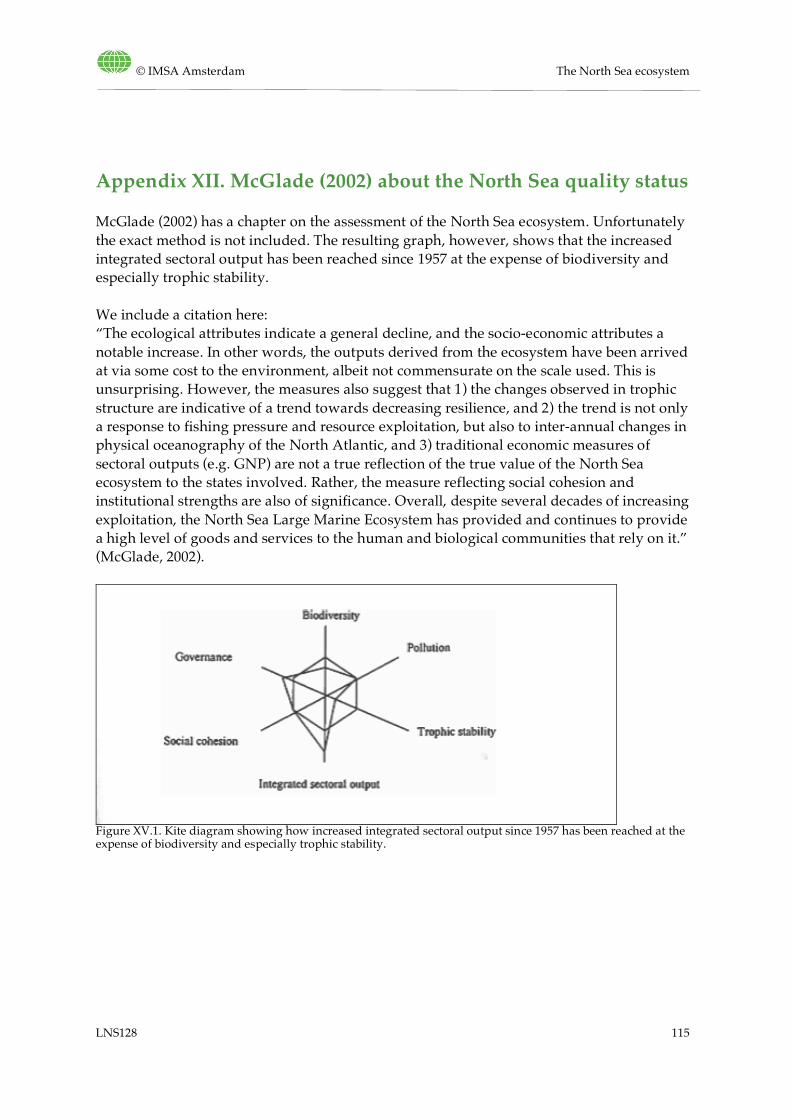
© IMSA Amsterdam The North Sea ecosystem
LNS128 115
Appendix XII. McGlade (2002) about the North Sea quality status
McGlade (2002) has a chapter on the assessment of the North Sea ecosystem. Unfortunately the exact method is not included. The resulting graph, however, shows that the increased integrated sectoral output has been reached since 1957 at the expense of biodiversity and especially trophic stability. We include a citation here: “The ecological attributes indicate a general decline, and the socio-economic attributes a notable increase. In other words, the outputs derived from the ecosystem have been arrived at via some cost to the environment, albeit not commensurate on the scale used. This is unsurprising. However, the measures also suggest that 1) the changes observed in trophic structure are indicative of a trend towards decreasing resilience, and 2) the trend is not only a response to fishing pressure and resource exploitation, but also to inter-annual changes in physical oceanography of the North Atlantic, and 3) traditional economic measures of sectoral outputs (e.g. GNP) are not a true reflection of the true value of the North Sea ecosystem to the states involved. Rather, the measure reflecting social cohesion and institutional strengths are also of significance. Overall, despite several decades of increasing exploitation, the North Sea Large Marine Ecosystem has provided and continues to provide a high level of goods and services to the human and biological communities that rely on it.” (McGlade, 2002).
Figure XV.1. Kite diagram showing how increased integrated sectoral output since 1957 has been reached at the expense of biodiversity and especially trophic stability.
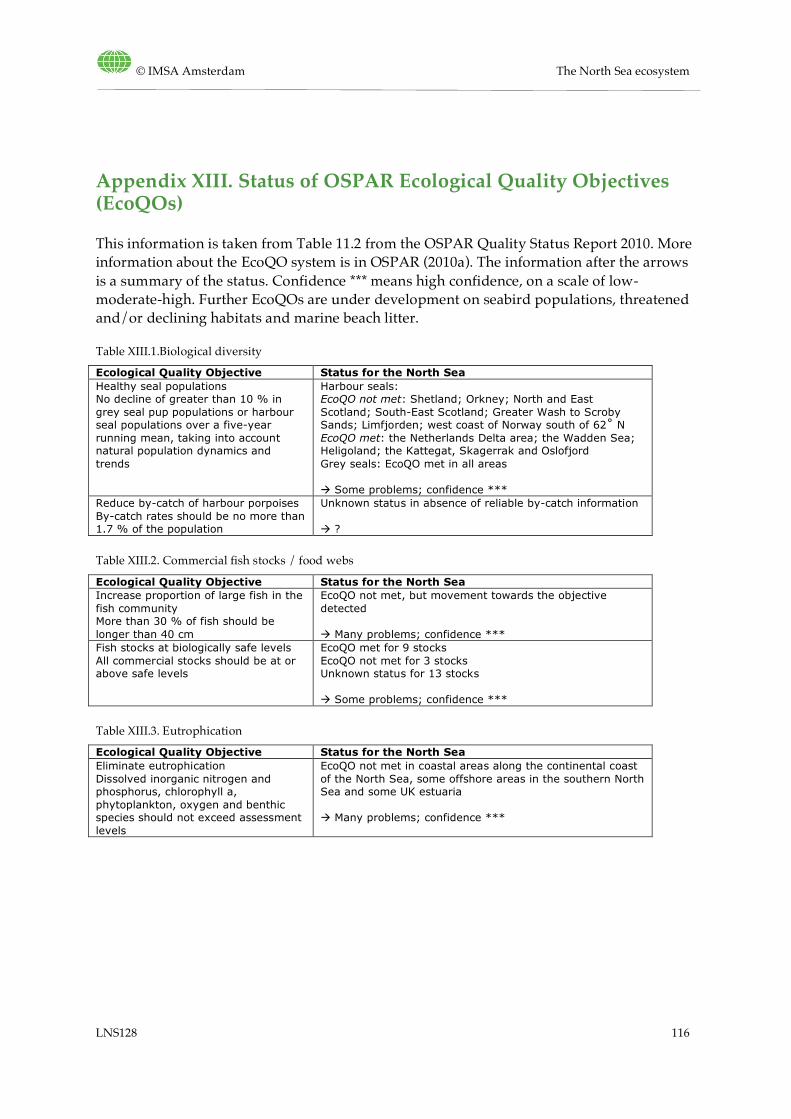
© IMSA Amsterdam The North Sea ecosystem
LNS128 116
Appendix XIII. Status of OSPAR Ecological Quality Objectives (EcoQOs)
This information is taken from Table 11.2 from the OSPAR Quality Status Report 2010. More information about the EcoQO system is in OSPAR (2010a). The information after the arrows is a summary of the status. Confidence *** means high confidence, on a scale of low-moderate-high. Further EcoQOs are under development on seabird populations, threatened and/or declining habitats and marine beach litter. Table XIII.1.Biological diversity
Ecological Quality Objective Status for the North Sea Healthy seal populations No decline of greater than 10 % in grey seal pup populations or harbour seal populations over a five-year running mean, taking into account natural population dynamics and trends
Harbour seals: EcoQO not met: Shetland; Orkney; North and East Scotland; South-East Scotland; Greater Wash to Scroby Sands; Limfjorden; west coast of Norway south of 62˚ N EcoQO met: the Netherlands Delta area; the Wadden Sea; Heligoland; the Kattegat, Skagerrak and Oslofjord Grey seals: EcoQO met in all areas Some problems; confidence ***
Reduce by-catch of harbour porpoises By-catch rates should be no more than 1.7 % of the population
Unknown status in absence of reliable by-catch information ?
Table XIII.2. Commercial fish stocks / food webs
Ecological Quality Objective Status for the North Sea Increase proportion of large fish in the fish community More than 30 % of fish should be longer than 40 cm
EcoQO not met, but movement towards the objective detected Many problems; confidence ***
Fish stocks at biologically safe levels All commercial stocks should be at or above safe levels
EcoQO met for 9 stocks EcoQO not met for 3 stocks Unknown status for 13 stocks Some problems; confidence ***
Table XIII.3. Eutrophication
Ecological Quality Objective Status for the North Sea Eliminate eutrophication Dissolved inorganic nitrogen and phosphorus, chlorophyll a, phytoplankton, oxygen and benthic species should not exceed assessment levels
EcoQO not met in coastal areas along the continental coast of the North Sea, some offshore areas in the southern North Sea and some UK estuaria Many problems; confidence ***
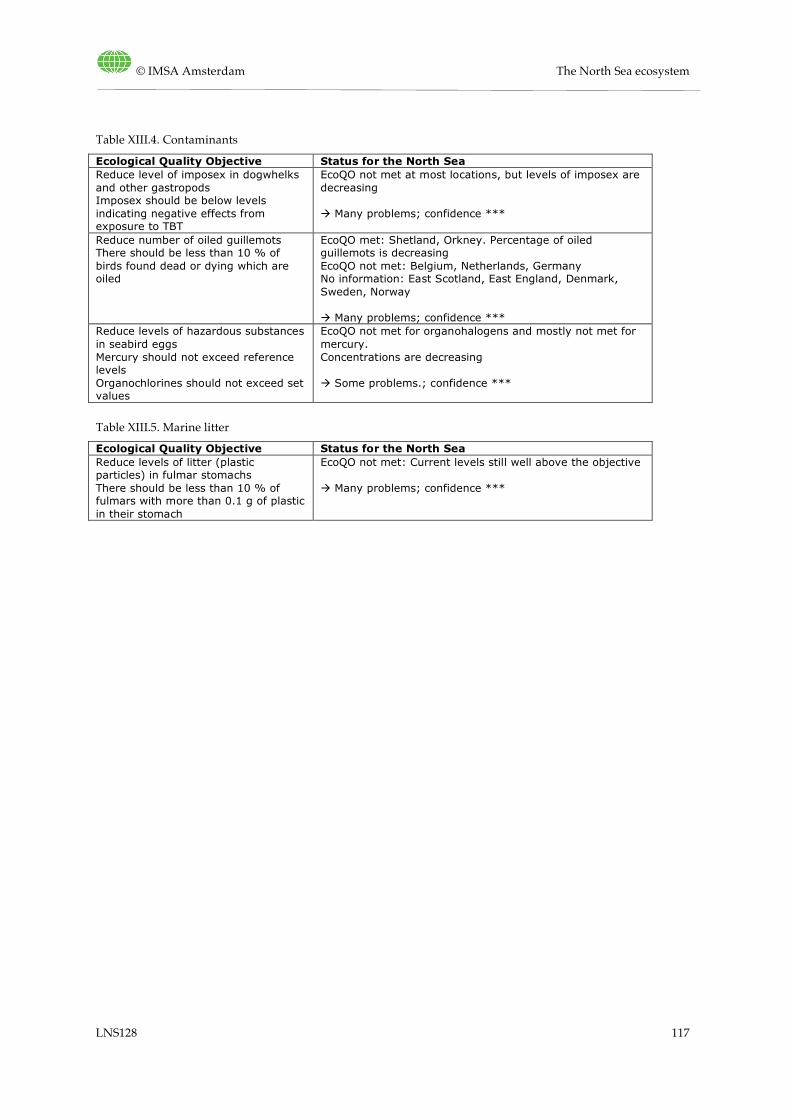
© IMSA Amsterdam The North Sea ecosystem
LNS128 117
Table XIII.4. Contaminants
Ecological Quality Objective Status for the North Sea Reduce level of imposex in dogwhelks and other gastropods Imposex should be below levels indicating negative effects from exposure to TBT
EcoQO not met at most locations, but levels of imposex are decreasing Many problems; confidence ***
Reduce number of oiled guillemots There should be less than 10 % of birds found dead or dying which are oiled
EcoQO met: Shetland, Orkney. Percentage of oiled guillemots is decreasing EcoQO not met: Belgium, Netherlands, Germany No information: East Scotland, East England, Denmark, Sweden, Norway Many problems; confidence ***
Reduce levels of hazardous substances in seabird eggs Mercury should not exceed reference levels Organochlorines should not exceed set values
EcoQO not met for organohalogens and mostly not met for mercury. Concentrations are decreasing Some problems.; confidence ***
Table XIII.5. Marine litter
Ecological Quality Objective Status for the North Sea Reduce levels of litter (plastic particles) in fulmar stomachs There should be less than 10 % of fulmars with more than 0.1 g of plastic in their stomach
EcoQO not met: Current levels still well above the objective Many problems; confidence ***
© IMSA Amsterdam The North Sea ecosystem
LNS128 118
Appendix XIV. Quotes from OSPAR QSR 2010 on which conclusions of Chapter 6 are based
Here are the fragments that are the base of the conclusions in paragraph 6.3 and 6.5. Some are originally about the OSPAR area as a whole. • “Region II contains a great number of habitats considered to be threatened or in decline,
including most of the North-East Atlantic’s littoral chalk communities.” • “On the basis of current evidence, the UN target of reducing the loss of biodiversity by
2010 is far from being achieved in the North-East Atlantic” (OSPAR, 2010). • (About the evaluation of EcoQOs in the North Sea): “The evaluation shows that the
objectives set have mostly not yet been achieved and that continued efforts are needed to improve the quality of the North Sea. There are, however, signs that the impacts of tributyltin (TBT) and oil on marine life and the contamination of seabird eggs with chemicals have been decreasing. Some important commercial fish stocks for which reference levels have been set continue to be beyond safe limits, but the size composition of demersal fish communities has been improving, although the desired objective has not yet been reached. Litter in the marine environment is still a concern as indicated by the amount of plastic found in fulmar stomachs. By-catch of harbour porpoises is still high and the data are insufficient to assess whether the EcoQO is met.” See Appendix XIII for the table with all EcoQOs and their status.
• “Many diadromous fish species (those that migrate between freshwater and marine habitats at different stages of their life cycle) have been strongly declining” (remark is about the total OSPAR area).
• “Populations of many elasmobranch species have declined as a result of fishing pressure and in the past several species were targeted by fisheries until their numbers collapsed” (remark is about the total OSPAR area).
• “Some pressures are even increasing in parts of the OSPAR area and all can act in synergy or be exacerbated by climate change. These pressures result in loss of biodiversity, including declines in the abundance and variety of species and habitats. Interruption of ecological processes, such as spawning, migration, and biological communication, may also occur” (OSPAR, 2010).
• “Many of the species and habitats on the OSPAR List are affected by poor environmental quality. Work towards improved environmental quality under all OSPAR Strategies has had a positive influence on biodiversity. For example, threatened and/or declining species and habitats as well as wider ecosystems benefit from improvements in water quality” (OSPAR, 2010).
• “This list” (of threatened/declining species and habitats, see Appendix VI) “was agreed in 2003 and extended in 2008. In 2009, a re-assessment of the species and habitats listed as threatened and/or declining showed that for most species there had been no change in overall status since their listing in 2003 (OSPAR, 2010). (…) Many of the habitats on the list may still be decreasing in extent and even with the implementation of appropriate measures it will be some time before any improvement can be detected, especially where habitats host long-lived species” (OSPAR, 2010).
Related Documents