The North Dakota Petroleum Council Study on Bakken Crude Properties Bakken Crude Characterization Task Force Prepared for the By Suite 2920, LB 38 2100 Ross Avenue Dallas, Texas 75201 www.turnermason.com August 4, 2014 John R. Auers, P.E. Ryan M. Couture Dennis L. Sutton

Welcome message from author
This document is posted to help you gain knowledge. Please leave a comment to let me know what you think about it! Share it to your friends and learn new things together.
Transcript

The North Dakota Petroleum Council Study on Bakken Crude Properties
Bakken Crude Characterization Task Force
Prepared for the
By
Suite 2920, LB 38 2100 Ross Avenue
Dallas, Texas 75201 www.turnermason.com
August 4, 2014
John R. Auers, P.E. Ryan M. Couture Dennis L. Sutton

Table of Contents Executive Summary ....................................................................................................................................... 1
Quality Characterization ........................................................................................................................... 2
Operating Conditions/Impact on Bakken Quality ..................................................................................... 7
Conclusions and Recommended Action Steps .......................................................................................... 9
Introduction ................................................................................................................................................ 11
Test Results/Analyses ................................................................................................................................. 14
API Gravity .............................................................................................................................................. 15
D86 IBP .................................................................................................................................................... 16
Vapor Pressure ........................................................................................................................................ 16
Flash Point ............................................................................................................................................... 17
Light Ends ................................................................................................................................................ 17
Simulated Distillation .............................................................................................................................. 19
Sample Consistency ................................................................................................................................ 20
Sample Methodology Comparison: Floating Piston Cylinder (FPC) versus Standard Glass Bottle ......... 21
Interlaboratory (Round-Robin) Testing ................................................................................................... 22
D86 Variation .......................................................................................................................................... 23
Rail Testing .............................................................................................................................................. 25
Member Contributed Data ..................................................................................................................... 26
AFPM Report Comparison .......................................................................................................................... 27
The Pipeline and Hazardous Materials Safety Administration (PHMSA) Report Comparison ................... 30
Operating Conditions .................................................................................................................................. 32
Overview of Sampling, Analytical Methods and Quality Control/Quality Assurance ................................. 38
Sampling .................................................................................................................................................. 38
Analytical Methods and Quality Control/Quality Assurance .................................................................. 39
Figures
Figure 1: Rail Sample Locations, With Average Sample Results ................................................................. 13
Figure 2: Well Sample Locations, With Average Sample Results ................................................................ 14
Figure 3: API Distribution; Total, Rail, Well ................................................................................................. 15
Figure 4: API Gravity vs. Measured Vapor Pressure (VPCR4) ...................................................................... 15
Figure 5: D86 IBP Distribution; Total, Rail, Well ......................................................................................... 16
Figure 6: Vapor Pressure Distribution; Total, Rail, Well ............................................................................. 17
Figure 7: C2-C4 Distribution: Total, Rail, Well ............................................................................................. 18
Figure 8: Light Ends (C2-C4s) Concentration vs. Vapor Pressure ................................................................ 18
Figure 9: Bakken Crude Distillation Curve................................................................................................... 19
Figure 10: Simple Distillation Apparatus ..................................................................................................... 24
Figure 11: Seasonality Data Collected by Member Company ..................................................................... 27
Figure 12: Horizontal Three Phase (Gas/Liquid/Water) Separator Diagram .............................................. 33
Figure 13: Vertical Treater Diagram ............................................................................................................ 34
Figure 14: Vapor Pressure versus Operating Temperature ........................................................................ 36
Figure 15: Ethane Liquid Vol. % versus Operating Temperature ................................................................ 37
Figure 16: Propane Liquid Vol. % versus Operating Temperature .............................................................. 37
Figure 17: Vapor Pressure versus Well Production Rate ............................................................................ 38
Tables
Table 1: Comparison of Crude Properties ..................................................................................................... 2
Table 2: Bakken Quality Comparison, NDPC to AFPM and PHMSA .............................................................. 3
Table 3: AFPM Bakken Report, Crude Quality Comparison Table ................................................................ 4
Table 4: NDPC Bakken Crude Sampling Data Summary ................................................................................ 7
Table 5: BKN Field Operations Recommended Best Practices...................................................................... 9
Table 6: Distillation Data; Well, Rail, Total .................................................................................................. 20
Table 7: Quality Comparison – Well vs. Rail Test Results ........................................................................... 21
Table 8: Round-Robin API and Vapor Pressure ........................................................................................... 22
Table 9: Round-Robin D86 IBP .................................................................................................................... 23
Table 10: D86 IBP Variability Testing .......................................................................................................... 25
Table 11: Rail Car Source and Destination Testing ..................................................................................... 25
Table 12: Member Company Laboratory Comparison (Round-Robin) ....................................................... 26
Table 13: Comparison of NDPC to AFPM Study Data ................................................................................. 29
Table 14: Comparison of NDPC to PHMSA Study Data ............................................................................... 31
Table 15: Average Delta (Top-Bottom) of Tank, Rail and Overall Samples................................................. 35
Appendices
Appendix 1: Additional Figures
Appendix 2: Summary Data
Appendix 3: Sample Conditions - Rail
Appendix 4: Sample Conditions - Well
Appendix 5: Operational Conditions – Well Only
Appendix 6: Lab Data – Rail
Appendix 7: Lab Data – Well
Appendix 8: Light Ends Data – Rail
Appendix 9: Light Ends Data – Well
Appendix 10: Simulated Distillation Data – Rail
Appendix 11: Simulated Distillation Data – Well
Appendix 12: Seasonality Data (Member Contributed)
Appendix 13: Interlaboratory (Round-Robin) Data
Appendix 14: Glossary of Terms

1
The North Dakota Petroleum Council Study on Bakken Crude Properties
Bakken Crude Characterization Task Force
Project Coordinator: Turner, Mason & Company
Executive Summary This report documents the detailed sampling and testing program recently conducted on Bakken crude oil. This program is the most thorough and comprehensive study of crude quality from a tight oil production basin to date.
In the past year, considerable attention has been focused on transportation and quality issues related to Bakken crude oil. As a result of several high profile railcar incidents in the U.S. and Canada, various investigations have been launched by governmental and industry groups to better understand the safety aspects of moving Bakken crude by rail. Questions as to whether Bakken is materially different from other crude oils and if the current railroad materials classification is appropriate have been raised. Investigations are ongoing as to the cause of the railcar accidents and potential hazards to the public associated with crude oil rail movements in general. In response to these concerns, the North Dakota Petroleum Council (NDPC) commissioned a comprehensive sampling and testing program to answer questions regarding the chemical and physical composition of Bakken, issues regarding proper classification and establish a Bakken quality baseline. This program collected samples from seven rail terminals and 15 well sites. The crude producers that provided the well samples account for over 50% of total North Dakota (ND) production, and the rail facilities sampled represent a similar proportion of total ND crude-by-rail capacity. The sampling locations cover the entire producing region and include both “old” and “new” wells, giving a good representation of any property variations that result either from geography, production rate, or during processing and transit. At this time, we are not aware of any field-level crude oil quality assessments as extensive or as controlled as this study in the Bakken or elsewhere.
The NDPC commissioned this program to establish Bakken crude properties (Quality Characterization) and to understand if these properties pose transportation and handling risks unique to Bakken compared to other light crude oils. The results from the study will be used to help establish and maintain a Bakken quality baseline to ensure continued crude quality and consistency. The study was also used to evaluate the impact of field-operating conditions (ambient temperature, tank settling times/production rates, and field equipment operating temperatures and pressures) on Bakken qualities. These study results, together with follow-up efforts, will be used to establish “management best practices” for operating production field equipment to minimize the light ends content and vapor pressure of Bakken crude sent to rail-loading facilities and to meet the proposed quality specifications.
NDPC engaged Turner, Mason & Company (TM&C), an internationally recognized engineering consultancy with over 40 years of experience in the petroleum industry (including a significant background in crude oil quality and processing), to serve as project coordinator. The TM&C team

2
included engineers with extensive refining and crude characterization/evaluation experience and a chemist with over 40 years of laboratory experience in crude oil analyses who serves as Executive Director of the Crude Oil Quality Association and on the Board of the Canadian Crude Quality Technical Association. Analyses of all primary samples were conducted by SGS, a global leader in testing and inspection with over 135 years in the business. Both the local North Dakota and U.S. Gulf Coast SGS labs participated in the sampling and testing process.
The key findings were as follows:
Quality Characterization • Bakken crude is a light sweet crude oil with an API gravity generally between 40° and 43° and a
sulfur content <0.2 wt.%. As such, it is similar to many other light sweet crude oils produced and transported in the United States.
o As a point of reference, the Energy Information Administration (EIA) categorizes crude oil that has an API gravity between 35° and 50° and less than 0.3 wt% sulfur as light sweet. Bakken falls in the middle of those ranges for both properties.
• Although testing for sulfur, Total Acid Number (TAN) and other corrosivity-specific testing were outside the scope of this project. Results from other test programs, as summarized below in Table 1, indicate that Bakken has very low sulfur and TAN properties.
• Table 1 compares key Bakken qualities to other important domestic and international crude oils: o Note the quality data in Table 1 for crudes other than Bakken came from sources
without the extensive controls and systematic sampling procedures used in the NDPC study.
Table 1: Comparison of Crude Properties
Domestic Light Sweet Crudes API Gravity Sulfur (wt. %) TAN (mg KOH) Bakken (1) (2) 40 to 43* 0.1 < 0.1 WTI (4) (5) 37-42 0.42 0.28 LLS (2) (4) 36-40 0.39 0.4 Eagle Ford (2) 47.7 0.1 0.03 Eagle Ford Light (2) 58.8 0.04 0.02
International Crudes API Gravity Sulfur (wt. %) TAN (mg KOH) Light Sweet
Brent (2) (6) 37-39 0.4 < 0.05 Medium
Arabian Light (2) 33 1.98 < 0.1 Arabian Heavy (2) 27.7 2.99 < 0.1 Heavy
Western Canadian Select (Heavy Sour) (3) 21.3 3.46 0.93 Dalia (High TAN) (2) (7) 23.1 0.51 1.6

3
Sources: 1 - NDPC Study Data 5 - Crude Oil Quality Association
2 – Capline 6 - BP Crude Assay 3 - crudemonitor.ca 7 - ExxonMobil Crude Assay 4 - AFPM Bakken Report, 5/14/2014 * Majority of NDPC samples in this range
• The qualities of Bakken were very consistent within our sample population and throughout the
supply chain – from wellhead to rail terminal to refining destination. Test results showed no evidence of “spiking” with Natural Gas Liquids (NGLs) before rail shipment.
• The test results from this study are also consistent with reported results from others, including
the American Fuel & Petrochemical Manufacturers (AFPM) Bakken Report, the Pipeline and Hazardous Safety Materials Administration (PHMSA) Operation Safe Delivery Report, NDPC member-gathered data and other recent studies and presentations on the quality of Bakken crude oil.
Table 2: Bakken Quality Comparison, NDPC to AFPM and PHMSA
NDPC Rail Avg (1) AFPM Report PHMSA Report (5)
API Gravity 41.7 42 Not Reported Vapor Pressure (psi) 11.5 7.83 (2) 12.3 IBP (°F) 100.3 69.6 (3) 87.0 Light Ends (C2-C4s) (Liq. Vol. %) 4.95 3.5-11.9 (4) 4.65 (6)
Comments:
(1) Rail chosen because AFPM samples from Bakken at point of delivery, Rail data from NDPC closest to direct comparison.
(2) AFPM reported RVP, NDPC reported VPCR4 (D6377) at 37.8°C. AFPM also reported VPCR4 done at 50°C, results 13.9-16.7 psi.
(3) 87.3 Median, Multiple tests in AFPM data, some of which can report lower than D86, which skewed average lower.
(4) AFPM report, three respondents average 3.5%, fourth had 12 samples, range 5.9-11.9%.
(5) PHMSA data from Table E, data ranging from 3/17 to 5/2, to maximize overlap with NDPC study data timeframe.
(6) PHMSA does not report isobutane, and C2-C4 results do not appear to include isobutane. By comparison, NDPC C2-C4 without isobutane was 4.37 Liq. Vol. %.
• While the test results from PHMSA’s report agreed closely with the NDPC results, PHMSA did make some assertions in their Executive Summary which do not appear to be supported by their study or our findings.
4
o The PHMSA report makes the statement that, “We conclude that while this product does not demonstrate the characteristics for a flammable gas, corrosive liquid or toxic material, it is more volatile than most other types of crude.” No comparative data was provided to support this statement; and, as we note elsewhere in this report, the limited data available on other crudes (that we were able to obtain) would not support that conclusion.
o PHMSA also claims that a higher degree of volatility “correlates to increased ignitability and flammability.” Again, no support is provided for this statement in the report. While we are aware that some groups, including API, are studying this very complex subject, we are not aware of any results or conclusions from those studies to date.
• During the time frame of our sampling program, Bakken had an average vapor pressure of
between 11.5 and 11.8 psi, which is more than 60% below the vapor pressure threshold limit for liquids under the Hazardous Materials Regulations (43.5 psi).
o It should be noted that the vapor pressure testing was done using the EPA approved method for crude oils (ASTM D6377), which results in readings about 1 psi higher than if the Reid Vapor Pressure (RVP) test method (ASTM D323) was used.
o Test data from an NDPC member’s rail terminal taken over a seven-month period from August 2013 through March 2014 showed RVP’s in the range of 8 to 11 psi; consistent with the NDPC test results when adjusted for seasonality and test method.
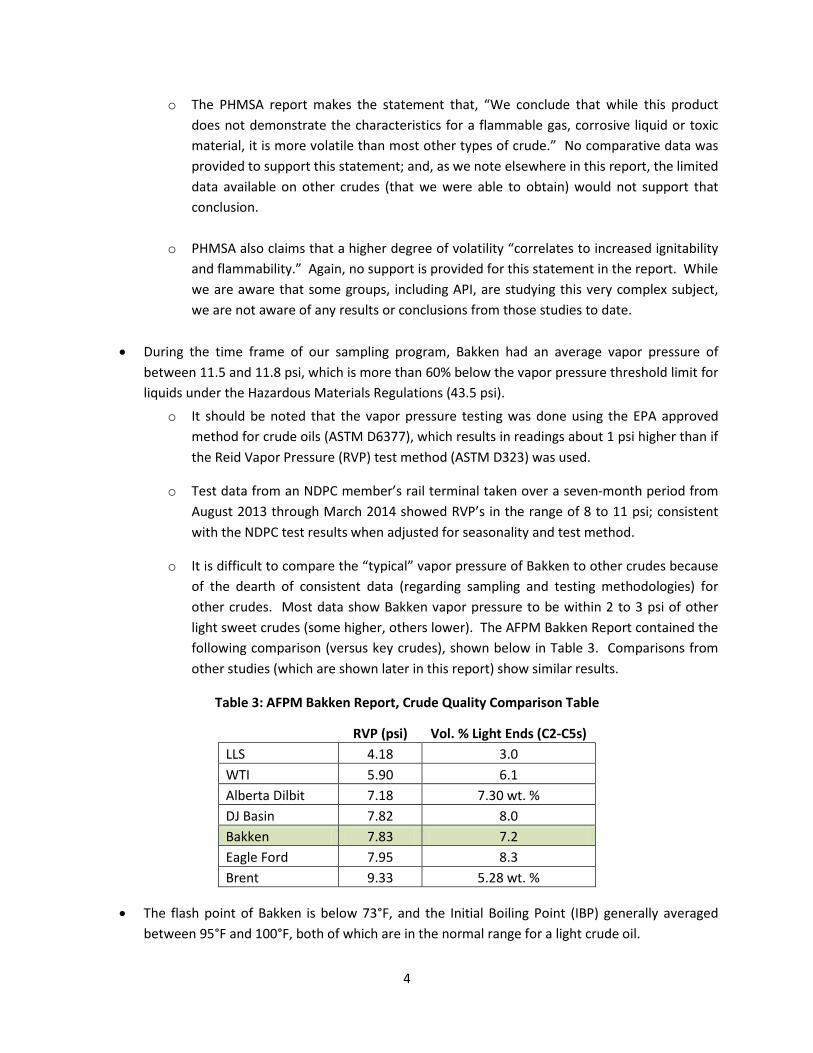
o It is difficult to compare the “typical” vapor pressure of Bakken to other crudes because of the dearth of consistent data (regarding sampling and testing methodologies) for other crudes. Most data show Bakken vapor pressure to be within 2 to 3 psi of other light sweet crudes (some higher, others lower). The AFPM Bakken Report contained the following comparison (versus key crudes), shown below in Table 3. Comparisons from other studies (which are shown later in this report) show similar results.
Table 3: AFPM Bakken Report, Crude Quality Comparison Table
RVP (psi) Vol. % Light Ends (C2-C5s)
LLS 4.18 3.0 WTI 5.90 6.1 Alberta Dilbit 7.18 7.30 wt. % DJ Basin 7.82 8.0 Bakken 7.83 7.2 Eagle Ford 7.95 8.3 Brent 9.33 5.28 wt. %
• The flash point of Bakken is below 73°F, and the Initial Boiling Point (IBP) generally averaged between 95°F and 100°F, both of which are in the normal range for a light crude oil.

5
o The data supports the current Department of Transportation (DOT) Pipeline and PHMSA classification for Bakken crude as a Class 3 Flammable Liquid (similar to other crude oils, as well as gasoline, ethanol and other materials containing light components).
o As a result, Bakken crude oil meets all specifications for transport using existing DOT-111 tank cars.
o This conclusion is consistent with the recent AFPM Bakken Report, which stated “Bakken crude oil does not pose risks significantly different than other crude oils or other flammable liquids authorized for rail transport. Bakken and other crude oils have been classified as flammable liquids. As noted, Bakken crude poses a lower risk than other flammable liquids authorized for transport by rail in the same specification tank cars.”
• Flammable liquids fall into packing groups (PG) depending on their IBP as defined by the ASTM D86 method. The testing performed in this study highlighted the difficulty with using this test method for packing group determination. The results showed significant (10°F+) variability between labs on the same sample.
o This is because D86 was not developed for wide boiling range materials like crude oil, with no specifically defined lab-operating parameters specified. Therefore, different labs used different operating conditions during testing, resulting in a wide variability of values for the IBP.
• Because of the difficulty with achieving consistent IBP results, groups including API are working on recommendations to update the current regulations.
o Based upon the findings of this study, the NDPC encourages all members to classify their BKN crude as a Class 3 PG I flammable liquid until a more definitive testing protocol is established.
• It is critical to note that the determination of PG I versus PG II has no impact on the type of rail car used or on first responder response to an incident and had no impact on any of the incidents in which Bakken was involved.
• The accuracy and precision of our test program were ratified by a series of round-robin tests between both SGS laboratories (Williston, ND and St. Rose, LA) and a second internationally recognized testing company.
o The results of the round-robin testing, using identical samples (from four locations) of Bakken (tested at each of the three laboratories) showed excellent agreement on API gravity and vapor pressure.
o Significant variance did occur in the measured IBP from the D86 testing, as noted earlier.
6
o A member company conducted a similar round-robin test comparison with samples of Bakken taken from four rail cars. Duplicate samples were sent to SGS and a second laboratory and the results of this testing also showed excellent agreement on API and vapor pressure and significant differences on D86 IBP.
• A series of side-by-side tests were performed using both the standard sealed glass jars (Boston Rounds, used for testing during the study) and Floating Piston Cylinders (FPCs) which have been suggested by some industry groups for testing vapor pressure.
o Preliminary results proved inconclusive. Results of samples taken from the atmospheric tanks using the glass bottles came back with higher vapor pressure readings than when tested using either glass bottles or FPCs on the pressurized tank discharge.
o Due to the requirement to sample from a pressurized tap with FPCs, there are difficulties with sampling and finding appropriate sample locations, which restricts where samples can be collected.
o These initial results, though limited, indicate that sampling with the glass bottles was at least as representative as testing with FPCs for vapor pressure, and allowed for a greater variety of sample locations with greater consistency.
Table 4 below summarizes the results from the sampling and testing program.
• API gravity of Bakken was generally in the low 40’s which falls in the range of what is considered a light crude oil.
• Vapor pressure (via ASTM D6377 at 37.8°C/100°F) was in a fairly tight range, averaging between 11.5 and 11.8 psi, with over 90% of well and 100% of rail samples measuring below 13 psi. As noted earlier, D6377 shows readings about 1 psi higher than the RVP test method (ASTM D323).
• D86 IBP showed a range of approximately 15°F on samples. All samples measured as either a PG I or II, with most of the test results close to the 95°F determination threshold. Because of the limitations of the test and variability of test conditions, the exact result varied depending on which laboratory conducted the testing.
• The light ends (C2-C4s) content of Bakken, which averaged just below 5.5 liquid volume %, is generally within 1 or 2% of other light crudes. Comprehensive data comparable to that obtained in this study for the other major Light Tight Oil (LTO) basins is not available. However, the data, which is available, indicates that Bakken light ends content is more consistent; and in many cases, lower than for most of the light crudes and condensates produced in the major LTO basins (including Eagle Ford, Utica, Niobrara and Permian basins).
• It is important to note that the DOT-111 cars used to transport this crude are rated for 100 psig, and the type of car used is the same for both PG I and PG II material transport.

7
Table 4: NDPC Bakken Crude Sampling Data Summary
Sample Date Range 3/25 to 4/24/2014 Total (152 Samples) Avg Min Max API Gravity 41.0 36.7 46.3 Vapor Pressure (psi) 11.7 8.9 14.4 D86 IBP (°F) 99.5 (PG II) 91.9 (PG I) 106.8 (PG II) Light Ends (C2-C4s) 5.45 3.33 9.30 Rail (49 Samples) Avg Min Max API Gravity 41.7 39.2 44.0 Vapor Pressure (psi) 11.5 9.6 12.9 D86 IBP (°F) 100.3 (PG II) 96.7 (PG II) 104.1 (PG II) Light Ends (C2-C4s) 4.95 3.91 6.44 Well (103 Samples) Avg Min Max API Gravity 40.6 36.7 46.3 Vapor Pressure (psi) 11.8 8.9 14.4 D86 IBP (°F) 99.1 (PG II) 91.9 (PG I) 106.8 (PG II) Light Ends (C2-C4s) 5.69 3.33 9.30
The results indicate that the well-to-well quality of Bakken is very consistent. Testing across the geographic area showed very limited geographical variation in key properties such as API, vapor pressure and light ends content. Data provided by one of the NDPC member companies (which involved testing over an eight-month period) showed that while there was some seasonality in vapor pressure, it was not significant (3 psi lower in summer months vs. winter months) and it agreed very closely with the AFPM seasonality data. The data was also consistent with the NDPC test results during the period when the sampling overlapped.
Bakken quality, throughout the supply chain in our sample pool, was also consistent. There was no evidence of “spiking” of Bakken crude with NGLs between the well and rail terminals, with rail terminals showing less variation and tighter averages than well-readings. This was expected, given that regional rail facilities receive oil from many wells. Additionally, limited sampling at both the rail terminal and destination refinery showed no significant weathering or off-gassing of light ends in transit.
Operating Conditions/Impact on Bakken Quality In addition to characterizing the quality of Bakken crude, our study looked at the impact that well site operating conditions have on the quality. These conditions include ambient temperature, production volume flow rates/field tank settling time, vapor capture status and field equipment operating parameters such as separator and treater temperatures and pressures. All of these measurements were recorded during the sampling program and have been correlated to determine how they impact test results. Based on this analysis, we offer the following observations and conclusions:
• The samples were gathered during the spring season (late March to late April) and ambient temperatures varied from a low of 10°F to a high of 65°F (average of about 34°F).

8
o Vapor pressure will vary by season with lower vapor pressures (lower levels of dissolved light ends) in the hotter summer months and higher vapor pressures (higher levels of dissolved light ends) in the colder winter months. This was confirmed by the member-contributed data referred to earlier in this section (and included later in this report).
o The results during this sampling program were in the intermediate range due to the mid range ambient temperatures experienced during sampling.
o Although the temperature range was limited, vapor pressure levels did correlate with temperatures (consistent with the more extensive member contributed data and the AFPM data), and with higher measured vapor pressure for crude sampled with lower ambient temperatures.
• While the companies operating in the Bakken, which participated in our sampling program, use a variety of well site production equipment and operating conditions (production rates, equipment operating pressures and temperatures) varied across the study, key crude qualities from our study were distributed across a fairly narrow range.
o The data consistency indicates that field equipment is limited in its ability to significantly impact vapor pressure and light ends content.
o This is consistent with the expected capabilities of the equipment.
o The field equipment is designed to separate gas, remove water and break emulsions to prepare crude for transport, and not remove significant levels of dissolved light ends from the crude.
• Despite the limitations of the field equipment, the data did show that the content of some of the lighter components, specifically ethane and propane, was reduced in a measureable way by running the equipment at higher temperatures.
o The difference between running cold (50°F) and running at close to the maximum practical temperature (150°F) resulted in an average reduction of 0.13 liquid vol. % ethane and 0.25 liquid vol. % propane, and about 0.40 liquid vol. % of total light ends reduction.
o Total ethane levels were almost universally below 0.20 liquid vol. % (and often closer to 0.10 liquid vol. %) when treaters were run at temperatures above 140°F, compared to levels averaging around 0.30 liquid vol. % (and as high as 0.40%) when temperatures were less than 100°F.
o It is important to note that true “plant tests” were not conducted where the field equipment temperatures and pressures were varied systematically at individual well sites, but rather results correlated across all samples at all locations.

9
• Production rates were also obtained at the time of sampling in an effort to determine whether higher flowing wells retained more light ends and had a higher vapor pressure than lower flowing wells where there was more opportunity to “weather” off the light components.
o The data from the study showed very limited correlation between production rates and vapor pressure.
o There was also little difference observed in vapor pressure between samples which were obtained from wells which were directly connected to a gathering system (no settling time) versus those which were obtained from stock tanks (where there was an opportunity for settling).
o As with the analysis of treater conditions impact on crude quality, the fact that this analysis was not done under systematic “plant test” conditions does not confirm that there is not some impact on vapor pressure, but rather that the impact is likely limited.
Conclusions and Recommended Action Steps
• Bakken is a light sweet crude oil with very consistent properties throughout the entire production basin, and the properties measured meet all the requirements of 49 CFR 171-180 for safe transport by rail or truck.
• Based on the results of this study, the NDPC has developed a set of Field Operations Recommended Best Practices. These cover the operation of the field treating equipment, Bakken crude oil quality, testing procedures and shipping classification, and are detailed in Table 5 below:
Table 5: BKN Field Operations Recommended Best Practices
Field Treating Equipment (In an effort to minimize light ends in crude oil presented for market)
• Design and operate all equipment within manufacturers recommended operating limits. • Operate Gas/Liquid Separator (if utilized) at the lowest pressure to accommodate gas sales and
fluid delivery to the Emulsion Separator/Heater Treater. • Operate Emulsion Separator/Heater Treater pressure to the lowest operating pressure to safely
accommodate gas sales and fluid delivery to the production tank battery. • Maintain all fired treating equipment (Emulsion Heater Treater, etc.) temperature between 90°
and 120° F+ year round. • Provide maximum tank settling time possible prior to shipment. • Reduce stock tank pressure to lowest pressure possible to maintain vapor collection equipment
(engineered flare, vapor recovery, etc.) operational integrity.

10
Typical BKN * Specifications (ranges reflect expected seasonality) Range Typical
• API Gravity (hydrometer at 60°F) 35° to 45° 42° • Vapor Pressure (ASTM D6377 @ 100°F) 8 to 15 psi 11.5 psi • Initial Boiling Point (ASTM D86) 90°F to 105°F 95°F • Sulfur <0.3% 0.15% • H2S <10 ppm <1 ppm • Light Ends (C2 – C4s) 3% to 9% 5%
*BKN refers to light sweet crude aggregated at rail and pipeline terminals within the Williston Basin. This crude is predominantly sourced from the Bakken common source of supply, but also includes legacy production from various other producing formations located within the proximity of the Bakken field. BKN does not include nonstabilized condensate recovered from wet gas gathering pipelines or from product derived outside the U.S. Williston Basin. Individual well values may be higher or lower than the aggregated values observed at the rail terminals.
Testing Procedures
• Well Site Operators/Purchasers – Prior to each custody transfer or LACT EOM o API gravity corrected to 60° F using hydrometer o Basic Sediment & Water (BS&W) by field centrifugal grind-out o Spot test vapor pressure pending available field testing equipment
• Rail/Pipeline Terminal Operators o Test each unit train loading or tank shipment batch
API gravity corrected to 60° F using hydrometer BS&W by field centrifugal grind-out
o Test at least midmonth and EOM ASTM D6377 @100° F vapor pressure using certified laboratory
• DOT PHMSA Hazmat Shipping Category o Flammable Liquid Category 3 o Packing Group I**
** PG I is recommended even though the majority of samples tested for the study would fall within specifications for PG II. The margin of error for the test methodology can result in different labs testing the same sample with values meeting both PGs. PG I has the more stringent standards and is therefore recommended to avoid further confusion.
• Other recommended procedures o DO NOT deliver fluid recovered from gas pipe lines (a.k.a. “pigging operations”) to crude
oil sales system unless processed by stabilization unit capable of lowering vapor pressure below 10 psi at 100° F.
o DO NOT blend non-Williston Basin crude oils into the BKN common stream. o DO NOT blend plant liquids (plant condensates, pentanes, butanes or propane) into the
BKN common stream.

11
Introduction
Bakken crude has been produced for over 60 years, recently passing the one-billion-barrel produced milestone. Bakken is moved by rail, pipeline and truck, and has been for decades. In the last few years, crude-by-rail has increased rapidly as production has topped one million barrels per day, and as such, the opportunities for incidents to occur have increased. Bakken is finding its way to refining markets across the country, including along new routes to the East and West Coasts, increasing rail traffic on those tracks. Recently, several high profile incidents in which Bakken crude was being transported brought public attention on the potential hazards of crude-by-rail. Bakken has had an increased focus recently, in large part due to the disaster in Lac Megantic, Quebec, in July 2013, where 47 persons lost their lives. While human error played a significant role in the cause of the accident, the DOT-111 rail cars involved have been heavily scrutinized. The reality is that no rail car is designed to always withstand the full force of a high-speed derailment; and once containment is breached during such an event, there are countless ignition sources.
Government focus on these accidents has brought up the potential for changing regulations around the transport of Bakken (or other light crudes). The oil and gas industry has been building newer style rail cars since 2011, moving toward replacing the older DOT-111 cars with revised cars that have thicker side shells and other safety improvements. Additionally, regulations imposed since the accident in Quebec have required both increased testing of crudes and notification of routes before shipment. Industry focus is on ensuring that all activities are conducted with a focus on safety, but the industry expresses concerns about additional testing requirements, regulations, or transitions to new transportation or handling methods without a scientific basis that those changes will have a significant safety impact. The industry supports regulations that are implemented through scientific investigation and factual basis, not implemented emotionally. The PHMSA Bakken Blitz study was started for that purpose. While the federal government has been criticized for not moving immediately, they recognized the importance of researching the material, railcars and railcar movements to propose rules that increase overall safety. It is with the focus on maintaining a scientific basis for decisions that this study was commissioned.
The scope of this NDPC study was to perform a comprehensive, controlled sampling of Bakken from a wide range of geographic locations at both individual wells and rail terminals. The controlled sampling ensured the same, consistent sampling techniques were used. Samples were sent to a single laboratory for testing, and thus the same methods and equipment were used. This ensured the data would be more consistent than data aggregated from many member companies, each using different labs and sometimes different test methods.
In addition to the direct sampling of the seven rail terminals and 15 well sites, additional data was collected. In order to evaluate the impact that shipping may have on crude; samples were taken at the rail terminal in Fryburg, ND, as well as upon receipt in St. James, LA. The same rail cars were sampled in both locations, and samples were sent to the same testing provider for analyses. Another set of testing on an individual well was performed to determine laboratory test variability. Samples were taken at the same time, but sent to two different labs: SGS (the primary lab used for this study) and a second internationally recognized lab. This resulted in some variance, primarily around D86 IBP measurements,

12
which are critical for proper PG determination. A third test was performed to compare D86 measurements between two SGS labs. One lab also did testing by varying some of the test parameters around D86 instrument setup. The results highlighted the opportunity for significant variability of results and the limitations of using the D86 test method on crude oil samples, which have wider boiling ranges than the method was intended.
Testing was conducted starting March 25 and continued through April 24, 2014. Through the course of testing, sample data was collected, including the following:
• Sample Date, Time, Company, Location (Geographic and Facility/Well ID); • Ambient temperature at time of sampling; • Size of tank where sample was pulled from; • Location in tank (top, bottom, or composite) where sample was taken; • For samples taken at well, operating conditions including treater/separator operating pressure
and temperature, as well as production rates were recorded; • API Gravity; • D86 IBP; • Vapor Pressure via D6377, as measured at 37.8°C/100°F with a 4:1 V/L ratio; • Flash Point via D3278; • Light Ends via IP344; and • Simulated Distillation via D7169.
Details on the sample conditions at time of sampling were recorded to evaluate what parameters may have an impact on the sample results. All samples were taken in sealed one-quart glass bottles, consistent with testing for stock oil tanks. The process was similar to the procedure used for finished gasoline testing with RVPs up to 15 psi.
On the first visit to each location, samples were taken at both the top and bottom of the tank. This was done to determine if there was a variance or stratification taking place in tanks, either at the well or at the rail terminals. On subsequent visits, samples at each location were composite samples of the tanks.
In order to capture any variances seen across the Bakken formation, sites were chosen to ensure a wide variety of locations. The points have been plotted on the maps below with corresponding average sample data for each location. The map of rail locations sampled, along with corresponding data is shown in Figure 1.

13
Figure 1: Rail Sample Locations, With Average Sample Results
The map of well locations sampled, along with corresponding data is shown in Figure 2.

14
Figure 2: Well Sample Locations, With Average Sample Results
Test Results/Analyses
Sampling was conducted beginning March 25, 2014. Each site was sampled from their stock or storage tank. For each location, a top and bottom tank sample was taken once, with the remainder of samples taken as a composite. Samples were spaced every few days to gain the most representative snapshot during the test period. All testing was completed on April 24, 2014. A complete listing of sample dates/times by location (along with all data) can be seen in the appendix. A breakdown of the samples is as follows:
• API Gravity: 152 Samples; • D86 Initial Boiling Point (IBP): 152 Samples; • Vapor Pressure (D6377): 152 Samples; • Flash Point (D3278): 152 Samples; • Light Ends (IP344): 152 Samples; and • Simulated Distillation (D7169): 111 Samples.

15
API Gravity
API Gravity was measured on all samples taken. API is a common property used to compare the relative density of a given petroleum liquid. While reported in degrees API gravity, it inversely correlates to the measured density of the liquid tested. For light crudes, the API gravity is generally around 40-45 API. Of all Bakken samples tested, the API gravity ranged from 36.7 to 46.3 API, averaging 41.0 API. The average for rail samples was slightly higher at 41.7 API, but with a tighter range of 39.2 to 44.0 API. These are all within the range expected for light crudes. By comparison, the common benchmark conventional light crudes, West Texas Intermediate (WTI) and Light Louisiana Sweet (LLS), measure 36-42 API. Bakken is not substantially lighter than other conventional light crudes. Higher API crudes may, but do not necessarily correlate with higher vapor pressure crudes. Figure 3 shows the distribution of API gravity data, and Figure 4 shows a plot of API gravity vs. measured vapor pressure.
Figure 3: API Distribution; Total, Rail, Well
Figure 4: API Gravity vs. Measured Vapor Pressure (VPCR4)
0.00
0.05
0.10
0.15
0.20
0.25
0.30
0.35
36 37 38 39 40 41 42 43 44 45 46 47 API
Total
Well
Rail
40% 20% Avg. 20% 40%
8
9
10
11
12
13
14
15
35 37 39 41 43 45 47
Vapo
r Pre
ssur
e (p
si)
API Gravity
16
D86 IBP
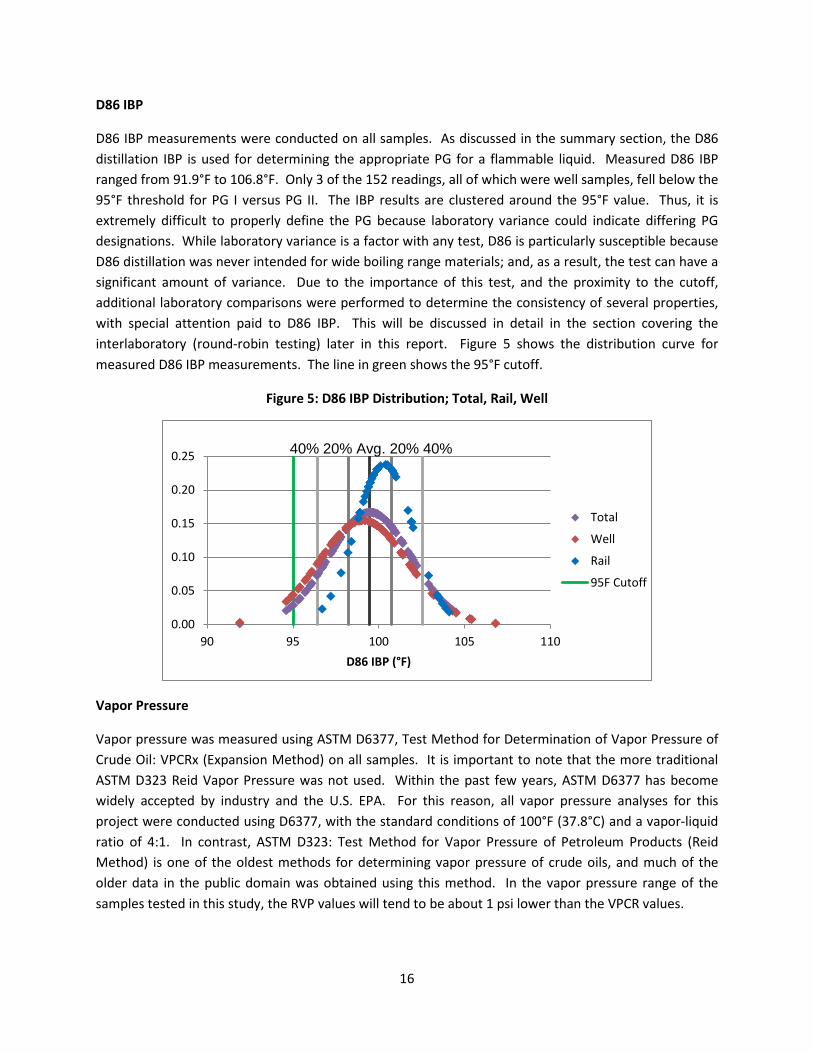
D86 IBP measurements were conducted on all samples. As discussed in the summary section, the D86 distillation IBP is used for determining the appropriate PG for a flammable liquid. Measured D86 IBP ranged from 91.9°F to 106.8°F. Only 3 of the 152 readings, all of which were well samples, fell below the 95°F threshold for PG I versus PG II. The IBP results are clustered around the 95°F value. Thus, it is extremely difficult to properly define the PG because laboratory variance could indicate differing PG designations. While laboratory variance is a factor with any test, D86 is particularly susceptible because D86 distillation was never intended for wide boiling range materials; and, as a result, the test can have a significant amount of variance. Due to the importance of this test, and the proximity to the cutoff, additional laboratory comparisons were performed to determine the consistency of several properties, with special attention paid to D86 IBP. This will be discussed in detail in the section covering the interlaboratory (round-robin testing) later in this report. Figure 5 shows the distribution curve for measured D86 IBP measurements. The line in green shows the 95°F cutoff.
Figure 5: D86 IBP Distribution; Total, Rail, Well
Vapor Pressure
Vapor pressure was measured using ASTM D6377, Test Method for Determination of Vapor Pressure of Crude Oil: VPCRx (Expansion Method) on all samples. It is important to note that the more traditional ASTM D323 Reid Vapor Pressure was not used. Within the past few years, ASTM D6377 has become widely accepted by industry and the U.S. EPA. For this reason, all vapor pressure analyses for this project were conducted using D6377, with the standard conditions of 100°F (37.8°C) and a vapor-liquid ratio of 4:1. In contrast, ASTM D323: Test Method for Vapor Pressure of Petroleum Products (Reid Method) is one of the oldest methods for determining vapor pressure of crude oils, and much of the older data in the public domain was obtained using this method. In the vapor pressure range of the samples tested in this study, the RVP values will tend to be about 1 psi lower than the VPCR values.
0.00
0.05
0.10
0.15
0.20
0.25
90 95 100 105 110 D86 IBP (°F)
Total
Well
Rail
95F Cutoff
40% 20% Avg. 20% 40%

17
Vapor pressure samples in this study averaged 11.69 psi, well below the limit for the shipping classification. Rail averaged slightly lower at 11.52 psi, with a range of 9.57 to 12.85 psi. This is a more accurate representation of the quality being transported. This is in line with the vapor pressure of gasoline, which is transported under the same classification. Well vapor pressure averaged slightly higher at 11.77 psi, with a slightly broader range of 8.93 to 14.37 psi. The aggregation of crude and mixing that takes place at terminals, in addition to the potential slight losses of light ends during handling and storage, accounts for the difference in ranges and absolute vapor pressure seen between well and rail. Figure 6 shows the distribution of vapor pressures measured.
Figure 6: Vapor Pressure Distribution; Total, Rail, Well
Flash Point
Flash point tested via D3278 was performed on all samples. All flash point readings were <73°F (<23°C), which is the threshold value to distinguish between PG I or II and PG III. This threshold means all Bakken samples tested would fall in the PG I or PG II categories, and the ultimate PG I vs. II determination would be based on the D86 IBP, as discussed above. Because all samples were <73°F, no data analysis was performed.
Light Ends
Light ends-testing via IP344 was performed on all samples. While the test measured concentrations of C1 (methane) to C6 (hexanes) individually by compound, the following light ends numbers account for the sum of C2-C4s only. Methane was excluded because it was at or below detection limits (0.01 liquid vol. %) for all samples, and C5+ has less impact on vapor pressure. The well samples had both a wider range (3.33-9.30 liquid vol. %) and average (5.69 liquid vol. %) concentration than rail (3.91-6.44 and 4.95 liquid vol. %, respectively). This is expected, as some small amount of light ends may be lost to storage tank vapor recovery systems while in atmospheric storage tanks at the well or rail terminals. Also, the mixing of various crudes into single tanks would help normalize any high or low concentration
0.0
0.1
0.2
0.3
0.4
0.5
8 9 10 11 12 13 14 15 Vapor Pressure D6377 VPCR4 (psi)
Total
Well
Rail
40% 20% Avg. 20% 40%

18
crudes. This corresponds with the vapor pressure readings in the previous section. Figure 7 shows the distribution of C2-C4s as measured.
Figure 7: C2-C4 Distribution: Total, Rail, Well
Light ends concentration was plotted versus measured vapor pressure on Figure 8, below. There is some correlation between the two, although significant scatter appears as the light ends concentration increases. With a rough correlation between measured vapor pressure and C2-C4s concentration, looking at seasonality data presented later, one could conclude that ambient temperature would have an effect on vapor pressure. Due to the short duration of testing, it was difficult to draw a clear correlation between the effects of ambient temperature on light ends content directly, although based on the seasonality data, colder temperatures would have the potential to leave greater amounts of light ends in the crude. The maps shown in the introduction section highlight the variance in properties from a geographic standpoint. While there is some variance in geographic measurements of light ends content, there does not appear to be any specific north to south or east to west correlations visible.
Figure 8: Light Ends (C2-C4s) Concentration vs. Vapor Pressure
0.0
0.1
0.2
0.3
0.4
0.5
0.6
0.7
2 4 6 8 10 C2-C4 Liquid Vol. %
Total
Well
Rail
40% 20%Avg. 20% 40%
8
9
10
11
12
13
14
15
2 3 4 5 6 7 8 9 10
Vapo
r Pre
ssur
e (p
si)
C2-C4 Light Ends Liquid Vol. %

19
Simulated Distillation
Simulated distillation (SimDist) via D7169 was conducted on 111 of the 152 samples. SimDist testing was performed on the first five samples for those samples that started on or around March 25, and three to four of the samples for the remaining few sites that had a more compressed sampling schedule. As testing progressed, the results appeared very consistent, and the importance of the SimDist results on overall analysis was determined to be limited. The test was subsequently excluded from later samples. Simulated distillation data showed consistent crude quality with the expected variance, ranging from an IBP of <97°F (minimum detection limit) to a final boiling point over 1200°F. Comparing Bakken to a pure liquid such as ethanol in a fire, the crude would vaporize more slowly in a fire should cars be heated versus ethanol, which has a single boiling point (173°F) where the entire cargo would vaporize. This temperature is roughly the SimDist 10% point for Bakken crude. Figure 9 and Table 6, below, show the distillation curve and average distillation data for well, rail and cumulative measurements.
Figure 9: Bakken Crude Distillation Curve
0
200
400
600
800
1000
1200
1400
Sim
Dist
T (°
F)
Max
Avg
Min

20
Table 6: Distillation Data; Well, Rail, Total
SimDist Well Rail Total IBP < 97 < 97 < 97 5%* 106 113 108 10%* 153 165 157 20% 231 238 234 30% 310 316 312 40% 394 396 395 50% 481 482 481 60% 572 572 572 70% 671 670 671 80% 785 787 786 90% 935 939 936 95% 1053 1060 1056 FBP* 1305 1317 1309
All values shown are in °F.
*Adjusted averages to account for one or more values in group above/below detection limits (97 °F and 1382 °F). Adjusted by averaging detection limit for values, raw data in appendix.
Sample Consistency
Comparing the well versus rail properties for the API/D86 IBP/vapor pressure, as well as light ends and SimDist, the qualities are very close and consistently correlate, as expected, with some slightly lower light ends numbers for rail properties for reasons discussed above. The light ends showed on average lower numbers and distillation curves were very similar. This shows that there is no evidence of spiking of Bakken crudes with light materials as some news reports had conjectured. The rail terminals sampled accounted for approximately 50% of total rail capacity out of the Bakken. These terminals receive crudes from many regional wells, not just member companies that contributed data: and, given the span of testing, it is highly likely results would have reflected such activity.

21
Table 7: Quality Comparison – Well vs. Rail Test Results
Well Rail API Gravity 40.6 41.7 D86 IBP (°F) 99.1 100 VPCR D6377 (psi) 11.8 11.5 Light Ends (Liquid Vol. %) Ethane 0.24 0.23 Propane 1.63 1.39 Isobutane 0.65 0.58 n-Butane 3.16 2.75 Isopentane 1.52 1.42 n-Pentane 2.90 2.72 C2-C4s 5.69 4.95 C2-C5s* 10.12 9.10 *Excludes Cyclopentane
Sample Methodology Comparison: Floating Piston Cylinder (FPC) versus Standard Glass Bottle
The sampling methodology employed in the NDPC Study was the industry standard technique of capturing material from tanks at either the well site or rail location in a glass bottle and sealing them with a screw-on cap. These quart-sized (32oz) glass bottles, referred to as “Boston Rounds” are the standard for sampling crude, gasoline and other hydrocarbons with similar vapor pressures to Bakken crude. Recently, a new technique has begun to gain acceptance as an alternate method, which involves the use of a FPC. The sample is captured under pressure in a cylinder with a hydraulic piston which minimizes any vapor space. The purpose of this is to minimize potential gas losses that could flash off from a liquid sample as it is captured at atmospheric pressure in a bottle, or is lost to the vapor space left when capturing a sample in a bottle.
In order to determine if there was any variance between the standard bottle sampling technique and the FPC, a set of four comparison tests at rail locations were performed. Rail locations were chosen because the floating piston cylinders require a pressurized sample location in order to overcome the pressure of the hydraulic piston in the cylinder. In each case, the samples were taken at the tap (spigot) located downstream of the loading pumps from the storage tanks to the rail car loading racks. Samples were taken while the line was in service and had flow (and adequate pressure) to fill the FPC’s. By comparison, the samples taken during the NDPC testing were from the tank itself at atmospheric pressure upstream of the loading pumps where the FPC samples were taken.
The initial results from this testing proved inclusive. While some samples showed excellent agreement both with historic NDPC sampling and between the glass bottle and FPC samples at the pressurized sample point, others showed variation, with samples taken off the line having lower vapor pressure values than the samples collected from the tank. This implies that samples taken at the pressurized sample point downstream of the tank somehow lost light ends by comparison. This brings into question
22
sampling techniques, sample point location and effects of sampling while under pressure in some locations such as after a pump. Further evaluation, regarding the comparison of FPC results to standard sampling with Boston Round glass jars, is being considered and will be provided as an addendum to this report if conducted.
Interlaboratory (Round-Robin) Testing
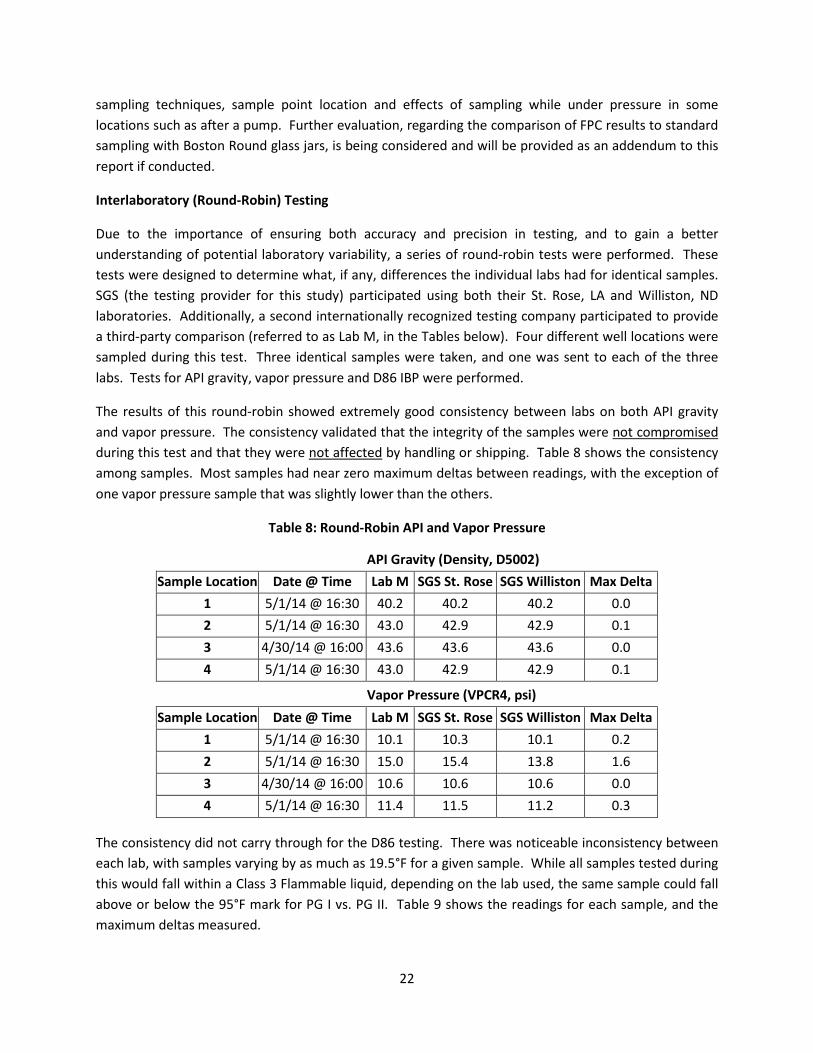
Due to the importance of ensuring both accuracy and precision in testing, and to gain a better understanding of potential laboratory variability, a series of round-robin tests were performed. These tests were designed to determine what, if any, differences the individual labs had for identical samples. SGS (the testing provider for this study) participated using both their St. Rose, LA and Williston, ND laboratories. Additionally, a second internationally recognized testing company participated to provide a third-party comparison (referred to as Lab M, in the Tables below). Four different well locations were sampled during this test. Three identical samples were taken, and one was sent to each of the three labs. Tests for API gravity, vapor pressure and D86 IBP were performed.
The results of this round-robin showed extremely good consistency between labs on both API gravity and vapor pressure. The consistency validated that the integrity of the samples were not compromised during this test and that they were not affected by handling or shipping. Table 8 shows the consistency among samples. Most samples had near zero maximum deltas between readings, with the exception of one vapor pressure sample that was slightly lower than the others.
Table 8: Round-Robin API and Vapor Pressure
API Gravity (Density, D5002)
Sample Location Date @ Time Lab M SGS St. Rose SGS Williston Max Delta 1 5/1/14 @ 16:30 40.2 40.2 40.2 0.0 2 5/1/14 @ 16:30 43.0 42.9 42.9 0.1 3 4/30/14 @ 16:00 43.6 43.6 43.6 0.0 4 5/1/14 @ 16:30 43.0 42.9 42.9 0.1
Vapor Pressure (VPCR4, psi)
Sample Location Date @ Time Lab M SGS St. Rose SGS Williston Max Delta 1 5/1/14 @ 16:30 10.1 10.3 10.1 0.2 2 5/1/14 @ 16:30 15.0 15.4 13.8 1.6 3 4/30/14 @ 16:00 10.6 10.6 10.6 0.0 4 5/1/14 @ 16:30 11.4 11.5 11.2 0.3
The consistency did not carry through for the D86 testing. There was noticeable inconsistency between each lab, with samples varying by as much as 19.5°F for a given sample. While all samples tested during this would fall within a Class 3 Flammable liquid, depending on the lab used, the same sample could fall above or below the 95°F mark for PG I vs. PG II. Table 9 shows the readings for each sample, and the maximum deltas measured.

23
Table 9: Round-Robin D86 IBP
D86 IBP (°F)
Sample Location Date @ Time Lab M SGS St. Rose SGS Williston Max Delta 1 5/1/14 @ 16:30 89.9 95.4 101.8 11.9 2 5/1/14 @ 16:30 83.1 89.1 102.6 19.5 3 4/30/14 @ 16:00 87.8 90.7 105.5 17.7 4 5/1/14 @ 16:30 89.2 94.5 102.2 13.0
D86 Variation
The D86 testing showed that, in fact, there were problems with variability between labs. This is a result of the test not being designed for evaluating such a wide boiling range material, and thus different labs choose different heating, condenser temperature and receiver temperature parameters. In addition, the D86 distillation conditions do not allow for the accurate retention of butane and lighter material. Thus, samples containing significant quantities of butane and lighter material will not have this material detected and will still yield an IBP in the 80-100°F range. The C1-C4 compounds do not readily condense at the condenser temperatures the D86 test is conducted at, and thus are not accurately measured.
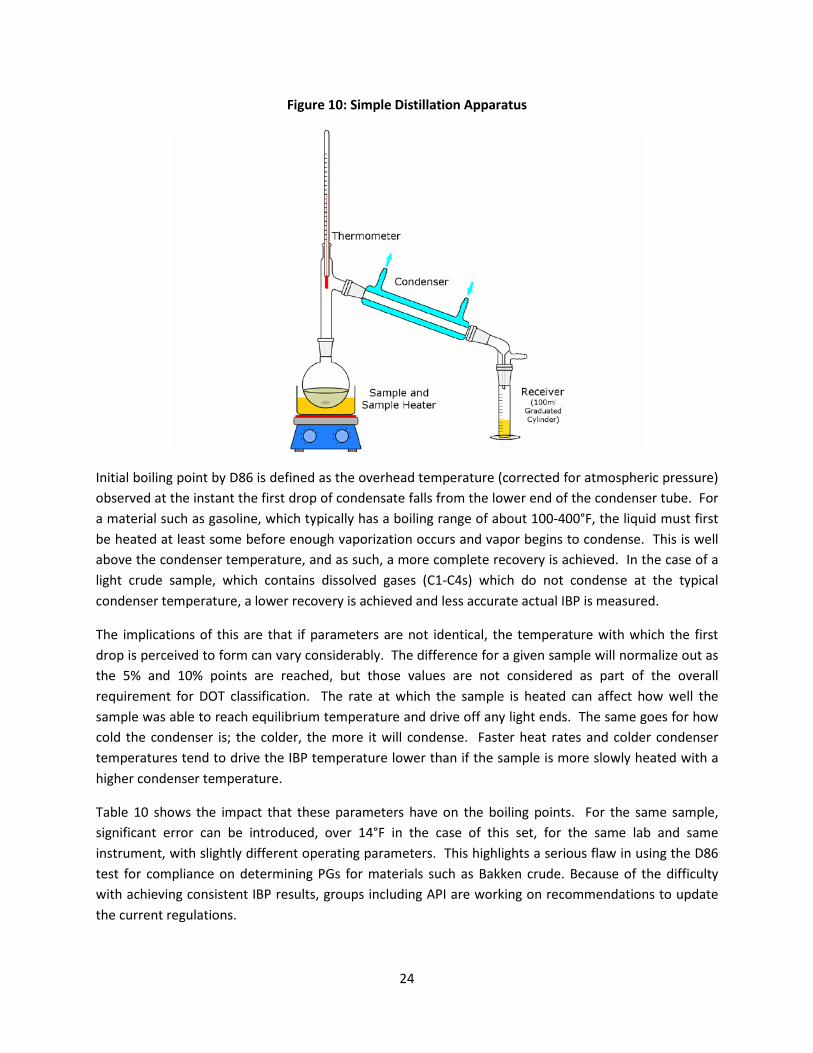
Before we discuss this further, a brief description of how a D86 distillation is performed is warranted. The setup consists of a flask of 100ml of liquid to be tested, a heater to boil the liquid, associated instrumentation to measure the temperature and volume, an overhead condenser which condenses the vapor boiled off and a receiver which collects the condensed material. While it is allowable to perform this test manually, almost all current analyses are conducted utilizing automatic instrumentation, which uses microprocessor controlled instrumentation to produce more precise results with minimal human intervention. All analyses conducted on this project utilized this type of automated instrumentation. Current D86 instruments are automatic; and typically, the type of liquid being tested will dictate parameters such as the condenser temperature and heat rate. The liquid is heated at the given rate dictated by the operator, and as it boils, it is condensed overhead, and drops into the receiver, which is maintained at a fixed temperature. The amount of liquid in the receiver is measured, and the distillation curve is generated. The liquid at the end is measured to determine the total recovery, as light components dissolved in the original sample can be lost if they are not able to be condensed at the condenser’s operating temperature. Figure 10 shows a sample simple distillation, similar in principle to that used during D86 testing. The sample is heated, condenses, and is collected in the receiver. The volume at a given temperature is recorded to generate the distillation curve.
24
Figure 10: Simple Distillation Apparatus
Initial boiling point by D86 is defined as the overhead temperature (corrected for atmospheric pressure) observed at the instant the first drop of condensate falls from the lower end of the condenser tube. For a material such as gasoline, which typically has a boiling range of about 100-400°F, the liquid must first be heated at least some before enough vaporization occurs and vapor begins to condense. This is well above the condenser temperature, and as such, a more complete recovery is achieved. In the case of a light crude sample, which contains dissolved gases (C1-C4s) which do not condense at the typical condenser temperature, a lower recovery is achieved and less accurate actual IBP is measured.
The implications of this are that if parameters are not identical, the temperature with which the first drop is perceived to form can vary considerably. The difference for a given sample will normalize out as the 5% and 10% points are reached, but those values are not considered as part of the overall requirement for DOT classification. The rate at which the sample is heated can affect how well the sample was able to reach equilibrium temperature and drive off any light ends. The same goes for how cold the condenser is; the colder, the more it will condense. Faster heat rates and colder condenser temperatures tend to drive the IBP temperature lower than if the sample is more slowly heated with a higher condenser temperature.
Table 10 shows the impact that these parameters have on the boiling points. For the same sample, significant error can be introduced, over 14°F in the case of this set, for the same lab and same instrument, with slightly different operating parameters. This highlights a serious flaw in using the D86 test for compliance on determining PGs for materials such as Bakken crude. Because of the difficulty with achieving consistent IBP results, groups including API are working on recommendations to update the current regulations.

25
Table 10: D86 IBP Variability Testing
Lab SGS St. Rose SGS Williston SGS Williston Condenser Temp 60°F 60°F 31°F Receiver Temp 73°F 81°F 81°F Sample D86 IBP Time to IBP D86 IBP Time to IBP D86 IBP Time to IBP 1 95.4 4 min 53 sec 101.8 7 min 56 sec 91.1 7 min 45 sec 2 89.1 3 min 22 sec 102.6 6 min 27 sec 88.7 6 min 07 sec 3 90.7 3 min 37 sec 105.5 7 min 26 sec 91.4 7 min 11 sec 4 94.5 3 min 42 sec 102.2 6 min 50 sec 94.4 8 min 00 sec
Rail Testing
A separate set of testing was conducted in order to evaluate whether there was merit in the claims that Bakken sees substantial weathering during transport. Five individual rail cars were sampled at their origin in Fryburg, ND, and destination of St. James, LA. Samples were tested by local labs in ND and LA of the same company for vapor pressure via D6377 at 100°F, flash point via D86, H2S in vapor phase at 77°F via ITM 3468 and light ends analysis by modified D6730. The results were then compared to average NDPC test results from the same rail terminal. The testing showed that throughout transportation, vapor pressure and C2-C4 concentration were consistent, indicating there were no light ends losses. Additionally, no detectable H2S was present in the samples. Comparing the samples tested at the two labs, the greatest variance in results was with the D86 IBP, for reasons discussed previously. Table 11 shows the table of average test data from both Fryburg and St. James and compares it to the other data collected at the Fryburg rail terminal. The appendix contains the full set of sample data for the cars.
Table 11: Rail Car Source and Destination Testing
Test Units
Avg. ND Rail Terminal
5 Car Samples
Avg. St. James Rail Terminal 5 Car Samples
Avg. NDPC Data for ND Rail Terminal
VPCR 4 (37.8⁰ C) psi 10.47 10.61 10.45 IBP ⁰F 94.7 90.4 101.7 Flash Point ⁰F <50 <50 <73 H2S in Vapor Phase ppm v/v <1 <1
C2-C4s Vol % 4.00 4.08 4.23 C2-C5s* Vol % 8.01 7.89 8.13 *Excludes Cyclopentane
Member Contributed Data
In addition to the data collected, member companies voluntarily submitted data to supplement data gathered in this study. The data contributed consisted of a smaller, less controlled round-robin sample test between one SGS laboratory and a second independent laboratory, and a NDPC member rail
26
company terminal who contributed vapor pressure operating data collected over a seven-month period from late August 2013 to late March 2014.
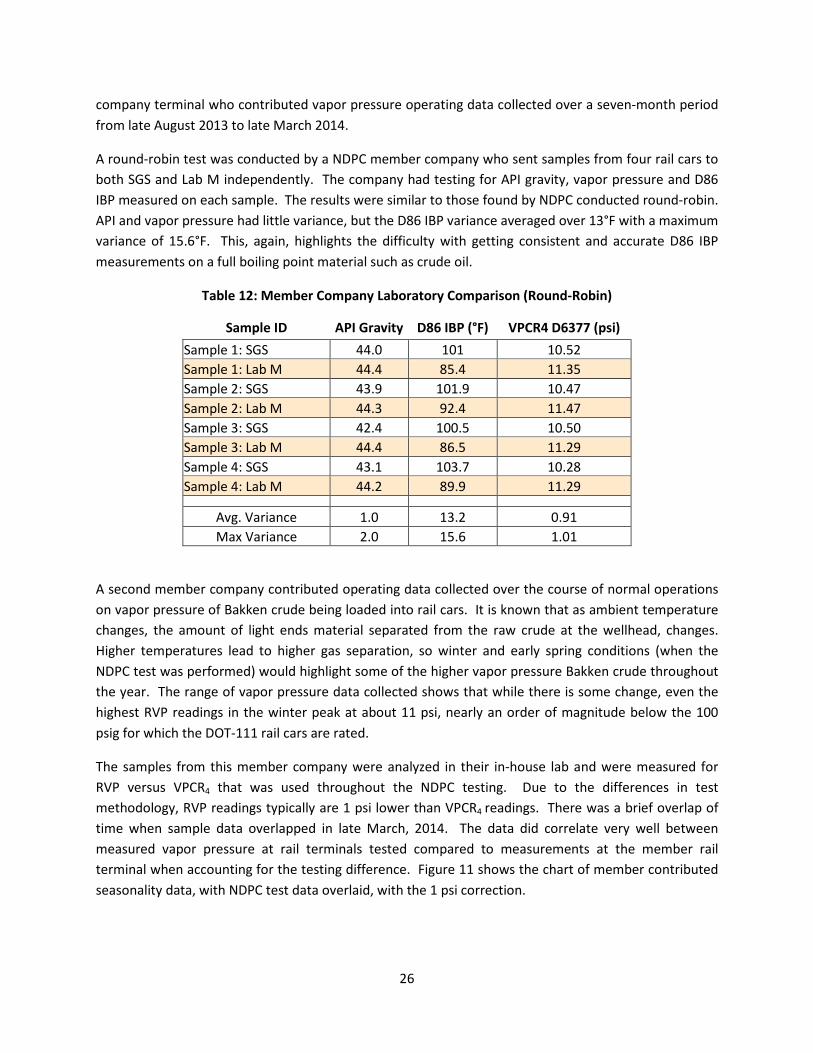
A round-robin test was conducted by a NDPC member company who sent samples from four rail cars to both SGS and Lab M independently. The company had testing for API gravity, vapor pressure and D86 IBP measured on each sample. The results were similar to those found by NDPC conducted round-robin. API and vapor pressure had little variance, but the D86 IBP variance averaged over 13°F with a maximum variance of 15.6°F. This, again, highlights the difficulty with getting consistent and accurate D86 IBP measurements on a full boiling point material such as crude oil.
Table 12: Member Company Laboratory Comparison (Round-Robin)
Sample ID API Gravity D86 IBP (°F) VPCR4 D6377 (psi) Sample 1: SGS 44.0 101 10.52 Sample 1: Lab M 44.4 85.4 11.35 Sample 2: SGS 43.9 101.9 10.47 Sample 2: Lab M 44.3 92.4 11.47 Sample 3: SGS 42.4 100.5 10.50 Sample 3: Lab M 44.4 86.5 11.29 Sample 4: SGS 43.1 103.7 10.28 Sample 4: Lab M 44.2 89.9 11.29
Avg. Variance 1.0 13.2 0.91 Max Variance 2.0 15.6 1.01
A second member company contributed operating data collected over the course of normal operations on vapor pressure of Bakken crude being loaded into rail cars. It is known that as ambient temperature changes, the amount of light ends material separated from the raw crude at the wellhead, changes. Higher temperatures lead to higher gas separation, so winter and early spring conditions (when the NDPC test was performed) would highlight some of the higher vapor pressure Bakken crude throughout the year. The range of vapor pressure data collected shows that while there is some change, even the highest RVP readings in the winter peak at about 11 psi, nearly an order of magnitude below the 100 psig for which the DOT-111 rail cars are rated.
The samples from this member company were analyzed in their in-house lab and were measured for RVP versus VPCR4 that was used throughout the NDPC testing. Due to the differences in test methodology, RVP readings typically are 1 psi lower than VPCR4 readings. There was a brief overlap of time when sample data overlapped in late March, 2014. The data did correlate very well between measured vapor pressure at rail terminals tested compared to measurements at the member rail terminal when accounting for the testing difference. Figure 11 shows the chart of member contributed seasonality data, with NDPC test data overlaid, with the 1 psi correction.

27
Figure 11: Seasonality Data Collected by Member Company
The seasonality results are in line with the report from Transport Canada on the derailment in Quebec which showed RVP results ranging from 9.0-9.6 psi. The derailment took place in July 2013, and the RVP results recorded by Transport Canada are consistent with the summer results measured by the seasonality data above.
AFPM Report Comparison
AFPM released a report on Bakken crude titled, “A Survey of Bakken Crude Oil Characteristics Assembled for the U.S. Department of Transportation” dated May 14, 2014. The report assembled a variety of Bakken data and compared its results to the parameters as laid out by DOT PHMSA and other international regulations for shipping. While raw data was not given for analysis, a statistical breakdown and walkthrough of each captured parameter gave a good overview of Bakken crude properties from a broad data set.
• The APFM report concluded that Bakken was not materially different and posed no special hazards versus other light crude oils.
o These findings coincide with the findings from this NDPC report.
• The AFPM report came to the same conclusions regarding the safety of Bakken in DOT-111 rail cars.
o Vapor pressure was well below the allowable pressure for DOT-111 rail cars.
o Bakken was well within all specifications for a Class 3 flammable liquid.
• Despite the same conclusions, a direct comparison between AFPM and NDPC cannot be performed on all data points collected.
6
7
8
9
10
11
12
8/1/13 9/30/13 11/29/13 1/28/14 3/29/14
Vapo
r Pre
ssur
e (p
si)
Production Train A
Production Train B
NDPC Rail

28
o The AFPM report collected voluntary data submissions from its members, instead of a controlled study. Its members consist largely of fuel producers who sample and test the Bakken
as it arrives at their facility, versus at the well or rail terminal.
o Sampling procedures and test methods were not uniform across all data.
The AFPM report listed all test methods used for various properties.
Samples were run at different labs, resulting in increased variability.
o The report did not indicate if tests of differing methods were correlated in any way prior to comparison, nor what the minimum detection limits were or how samples were handled.
• This variety of testing led to certain peculiarities, such as the initial boiling point or flash point data having what appeared to be varying test ranges.
Of particular focus was the IBP testing. For the NDPC report, all data in the main data set was tested by a single testing provider, SGS. Samples were consistently collected and handled throughout the testing process, with all testing using the same ASTM D86 testing protocol. In contrast, the AFPM report used five different test methods for distillation alone, as discussed in their appendix. This resulted in IBP data ranging down to 32°F (0°C). In particular, gas chromatographic methods are referenced as being used. These methods, e.g. D2887, are known to yield much lower IBPs than the D86 method. Thus, this data must be both used and compared with caution. Based on our earlier discussion of how D86 testing is conducted, the D86 test method does not lend itself to measuring boiling points that low. The condenser does not operate at a temperature low enough (it would have to operate below 32°F to condense materials boiling at that temperature). Additionally, the initial sample is not cooled to that level before testing and the collector is held at roughly room temperature, meaning any collected sample would evaporate. Thus, any IBP results below about 60°F must, therefore, have been conducted with another test method, assumed to be a gas chromatographic simulated distillation method. Since there was no indication that the data was correlated to D86, and the regulations are based around D86 testing, it raises questions about what the equivalent boiling points were for those samples, based on DOT requirements. Similarly, other data that used multiple test methods did not show an indication of a correlation between the two methods and makes the data good for information only, but not from which to draw firm conclusions or correlations. Table 13 shown below gives a brief comparison of the results of the two tests.

29
Table 13: Comparison of NDPC to AFPM Study Data
NDPC Average
Well Rail Range
AFPM Study
Comments
API Gravity 40.6 41.7 36.7-46.3
API Gravity 42
Reported in crude comparison table.
D86 IBP (°F) 99.1 100.
3 91.9-106.8
IBP (Various Tests) 69.6
87.3 median IBP, multiple tests in AFPM data, some of which can report lower than D86, which skewed average lower.
Vap. P D6377 (37.8C) (psi) 11.8 11.5
8.9-14.4
RVP (psi) (Various Tests) 7.83
RVP reported by AFPM. Also reported D6377 done at 50C (higher than NDPC), with range 13.9-16.7 psi.
Seasonality RVP (psi) - 9.98
7.9-11.6
Seasonality RVP (psi) 8-12.5
AFPM 807 data points to 215 for NDPC, greater variety of locations.
NDPC Light Ends (Liquid Vol. %) Well Rail Range
AFPM Light Ends (Liquid Vol. %)
Comments
Ethane 0.24 0.23 0.08-0.67
Ethane 0.5
Reported as ranges only.
Propane 1.63 1.39 0.84-3.13
Propane <1-2%
Isobutane 0.65 0.58
0.35-0.95
Isobutane
3-4%
n-Butane 3.16 2.75 2.00-4.55
n-Butane
Isopentane 1.52 1.42
1.10-1.93
n-Pentane 2.90 2.72
2.07-3.70
n-Pentane -
C2-C4s 5.69 4.95 3.52-9.30
C2-C4s
3.5-11.9%
AFPM report, three respondents average 3.5%, fourth had 12 samples, range 5.9-11.9%
C2-C5s* 10.12 9.10 6.77-14.71 C2-C5 7.2 *Excludes Cyclopentane
The AFPM report did include additional data, which was not tested as part of the NDPC study. Many samples were tested for hydrogen sulfide (H2S) in the vapor phase, and they were able to capture some samples that contained detectable H2S. It is known that select pockets in legacy ND wells contain higher H2S concentrations, but that crude is typically segregated from low H2S Bakken crude for safety reasons. The AFPM study was also able to gather data on corrosivity using National Association of Corrosion Engineers (NACE) TM 172 testing, which confirmed the low corrosivity of Bakken crude. The AFPM paper also summarized data gathered on the pressure of rail cars measured as they reached their final destination. Over 380 cars were sampled, with a majority arriving to the refinery in the 7-10 psig range. The highest reported pressure recorded was 11.3 psig, well below the rated operating pressure of the DOT-111 rail cars or their minimum relief valve setting of 35 psig.

30
Despite the inability to draw a direct comparison between the AFPM and NDPC data, the results of both studies lead to the same conclusion. Bakken crude is a consistent product that clearly fits the classification of a Class 3 Flammable Liquid. The only point of debate would be the PG designation that is used, PG I versus PG II. That falls back to D86 testing of full boiling range materials, and the need for a reevaluation as to whether that is the most appropriate test method for the classification of materials such as Bakken for shipment.
The Pipeline and Hazardous Materials Safety Administration (PHMSA) Report Comparison
PHMSA released a report on July 23, 2014, which included the results of their findings as part of Operation Safe Delivery. PHMSA found that, “Operation Classification has determined that the current classification applied to Bakken crude is accurate under the current classification system.” The PHMSA report outlined the efforts of their testing program, which began in August 2013, and spanned through May 2014. Sampling was unannounced and intended to capture a representative sample of Bakken crude. The initial phase, from August-November 2013, was focused on verifying that appropriate hazard classes that were being used; and as such, testing was limited to flash point and boiling point. The second phase from February-May 2014 was to gain a complete understanding of Bakken properties and more closely align with the NDPC study. This data from Phase 2 was the data used to compare to the NDPC report.
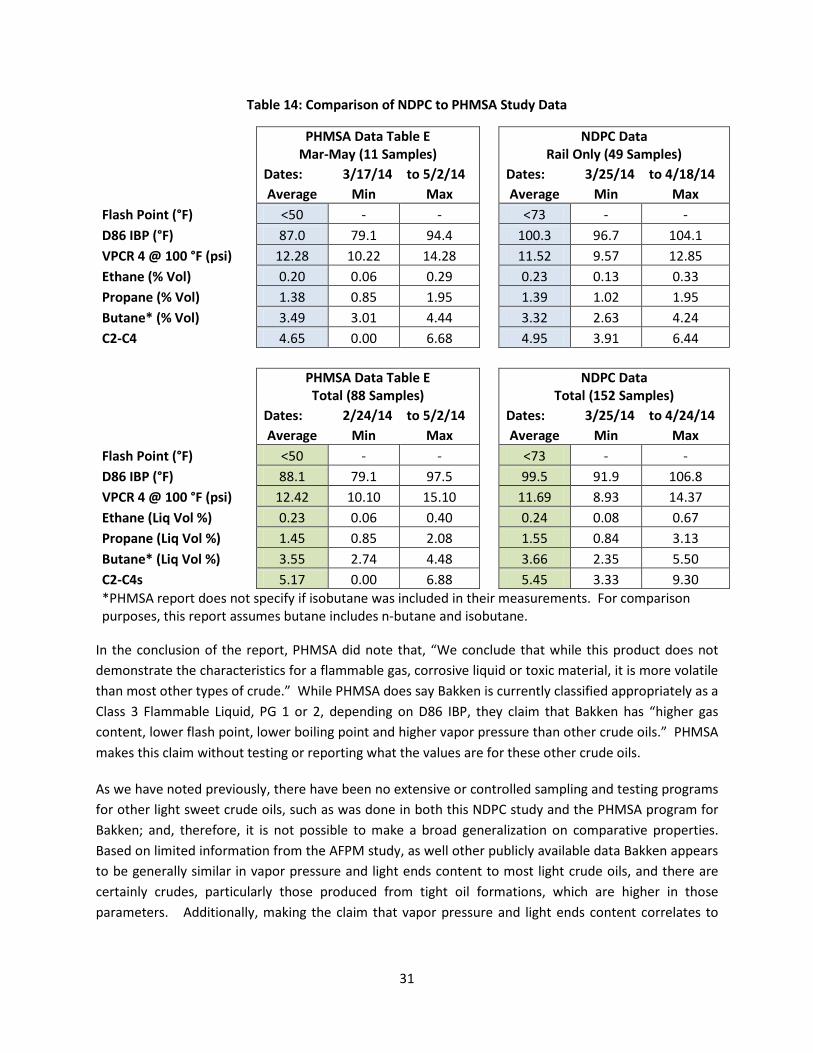
The results outlined showed good agreement with the data collected as part of the NDPC study, especially when comparing data collected for the same general time period. Since the NDPC testing was done during the period from late March to late April 2014, the data points that fell in this general time frame were separated out and compared (11 total samples), as was the entire data set (88 total samples). Since the last round of PHMSA sampling was conducted at rail-loading facilities, for consistency, comparisons were made specifically with the NDPC rail data. As seen in Table 14 below, the results agreed very well, despite not being identical samples nor identical locations. The variation is minimal, and ranges agree well, with a trend toward slightly lower D86 IBP readings from PHMSA; although as discussed earlier, those results are subject to variation based on exact testing parameters and procedures.
31
Table 14: Comparison of NDPC to PHMSA Study Data
PHMSA Data Table E Mar-May (11 Samples)
NDPC Data Rail Only (49 Samples)
Dates: 3/17/14 to 5/2/14
Dates: 3/25/14 to 4/18/14
Average Min Max
Average Min Max
Flash Point (°F) <50 - -
<73 - - D86 IBP (°F) 87.0 79.1 94.4
100.3 96.7 104.1
VPCR 4 @ 100 °F (psi) 12.28 10.22 14.28
11.52 9.57 12.85 Ethane (% Vol) 0.20 0.06 0.29
0.23 0.13 0.33
Propane (% Vol) 1.38 0.85 1.95
1.39 1.02 1.95 Butane* (% Vol) 3.49 3.01 4.44
3.32 2.63 4.24
C2-C4 4.65 0.00 6.68
4.95 3.91 6.44
PHMSA Data Table E Total (88 Samples)
NDPC Data Total (152 Samples)
Dates: 2/24/14 to 5/2/14
Dates: 3/25/14 to 4/24/14
Average Min Max
Average Min Max
Flash Point (°F) <50 - -
<73 - - D86 IBP (°F) 88.1 79.1 97.5
99.5 91.9 106.8
VPCR 4 @ 100 °F (psi) 12.42 10.10 15.10
11.69 8.93 14.37 Ethane (Liq Vol %) 0.23 0.06 0.40
0.24 0.08 0.67
Propane (Liq Vol %) 1.45 0.85 2.08
1.55 0.84 3.13 Butane* (Liq Vol %) 3.55 2.74 4.48
3.66 2.35 5.50
C2-C4s 5.17 0.00 6.88
5.45 3.33 9.30 *PHMSA report does not specify if isobutane was included in their measurements. For comparison purposes, this report assumes butane includes n-butane and isobutane.
In the conclusion of the report, PHMSA did note that, “We conclude that while this product does not demonstrate the characteristics for a flammable gas, corrosive liquid or toxic material, it is more volatile than most other types of crude.” While PHMSA does say Bakken is currently classified appropriately as a Class 3 Flammable Liquid, PG 1 or 2, depending on D86 IBP, they claim that Bakken has “higher gas content, lower flash point, lower boiling point and higher vapor pressure than other crude oils.” PHMSA makes this claim without testing or reporting what the values are for these other crude oils.
As we have noted previously, there have been no extensive or controlled sampling and testing programs for other light sweet crude oils, such as was done in both this NDPC study and the PHMSA program for Bakken; and, therefore, it is not possible to make a broad generalization on comparative properties. Based on limited information from the AFPM study, as well other publicly available data Bakken appears to be generally similar in vapor pressure and light ends content to most light crude oils, and there are certainly crudes, particularly those produced from tight oil formations, which are higher in those parameters. Additionally, making the claim that vapor pressure and light ends content correlates to

32
increased ignitability and flammability is a broad statement that without extensive and complicated testing cannot be factually stated or supported.
Operating Conditions
As part of the sampling program, operating conditions at the time of sample collection were taken for each well location sampled. This was done in order to determine if there were additional factors which may affect crude qualities. The conditions recorded included ambient temperature, separator and treater temperature and pressure, well production rate, equipment size and configuration, and for wells not attached to a gathering system, the time the stock tank was isolated from the well.
In order to better understand the impact the operational conditions play, a brief overview of wellhead crude processing is warranted. Raw crude, as it comes out of the ground, is a mix of gas, liquid hydrocarbons and water. The amount of each varies depending on geology and ambient temperature. The raw crude stream requires separation to remove the gas phase and separate entrained water before it is transferred to the stock tank. This is achieved by passing the crude through a separator and/or treater unit before it is stored and transported. Often, a standard three-phase (gas/oil/water) separator drum is used to separate the bulk water and gas from the hydrocarbon stream, as seen in Figure 12. The raw crude stream enters the separator drum and settles. Gas passes over and through a mist extractor, essentially a fine metal mesh, to collect and knock out entrained liquid before passing out of the drum to either be flared or captured. The liquid settles and separates as it flows through the vessel. In a three-phase separator, the liquid level is controlled so that the oil layer passes over a baffle and out of the vessel to tankage or for additional treatment. The water, which collects behind the baffle, is drained off and treated. Some wells may instead use a simple gas/liquid separator followed by a second liquid/liquid separator. In this configuration the liquid passes out without separating water and hydrocarbons, which then passes directly to a second separator or treater designed to separate the liquid hydrocarbons and water.
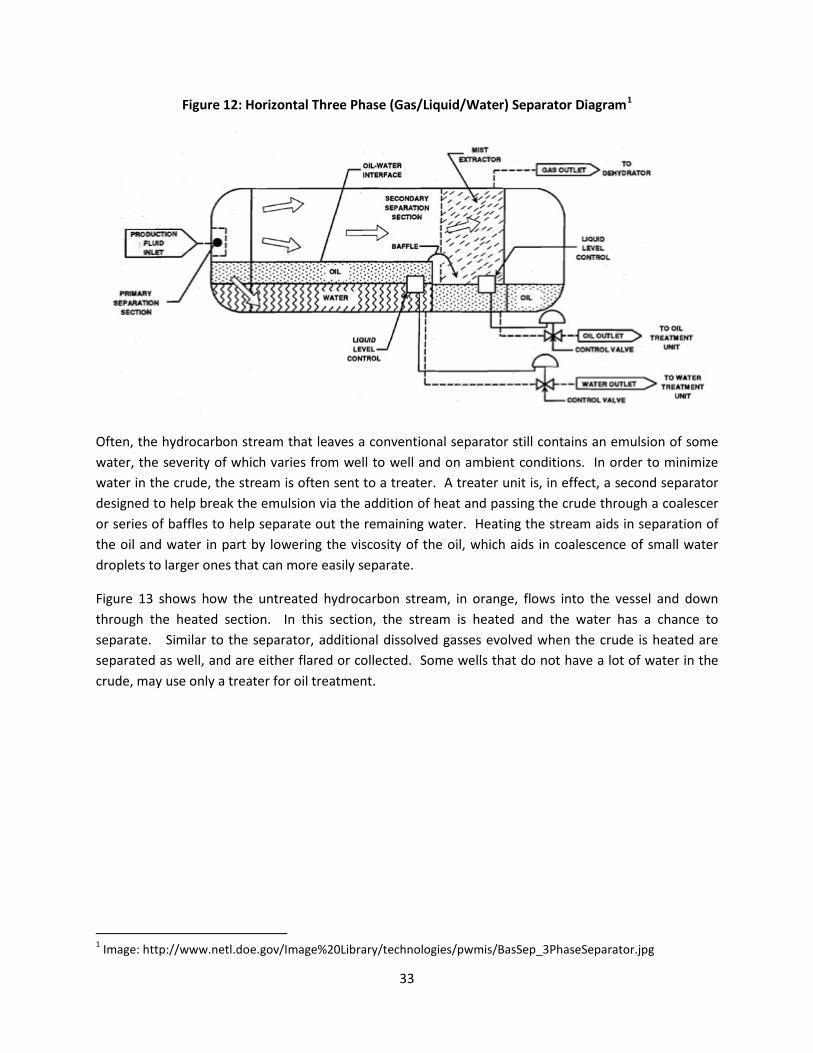
33
Figure 12: Horizontal Three Phase (Gas/Liquid/Water) Separator Diagram1
Often, the hydrocarbon stream that leaves a conventional separator still contains an emulsion of some water, the severity of which varies from well to well and on ambient conditions. In order to minimize water in the crude, the stream is often sent to a treater. A treater unit is, in effect, a second separator designed to help break the emulsion via the addition of heat and passing the crude through a coalescer or series of baffles to help separate out the remaining water. Heating the stream aids in separation of the oil and water in part by lowering the viscosity of the oil, which aids in coalescence of small water droplets to larger ones that can more easily separate.
Figure 13 shows how the untreated hydrocarbon stream, in orange, flows into the vessel and down through the heated section. In this section, the stream is heated and the water has a chance to separate. Similar to the separator, additional dissolved gasses evolved when the crude is heated are separated as well, and are either flared or collected. Some wells that do not have a lot of water in the crude, may use only a treater for oil treatment.
1 Image: http://www.netl.doe.gov/Image%20Library/technologies/pwmis/BasSep_3PhaseSeparator.jpg

34
Figure 13: Vertical Treater Diagram2
The separator and treater operate at relatively constant conditions as set by the well operator. Typically, they operate under pressure (a range of 8-80 psig was recorded in this study) as the flow follows through the separator and treater to tankage. Adequate pressure is required to overcome any head pressure and allow movement of oil into the stock tank. When a treater is used, the stream is heated only enough to maximize separation of the emulsion (range up to 160°F was observed in this study), while minimizing the temperature to which the stream needs to be heated. There are several reasons to limiting temperature, including energy cost of heating, increased hydrocarbon losses to flare and potential for increased tank emissions.
Due to the difficulty and hazards associated with sampling a raw well stream, crude was sampled from the stock tank after it passed through the separator and/or treater. This is consistent with measuring the quality of the crude that would be transported via rail. Additional notes were taken on whether the wells were connected to gathering systems; small pipeline networks designed to take the oil to central facilities to be loaded to rail or major pipeline systems. Other wells fill stock tanks and require trucks to
2 Image: http://www.des-co.com/portfolioentry/heater-treaters/

35
haul crude away. Wells not on gathering systems were sampled from their full stock tanks after they were safely filled and isolated from the well.
As discussed previously, on the first visit to each location, samples were taken at both the top and bottom of the tank. This was done to determine if there was a variance or stratification taking place in tanks, either at the well or at the rail terminals. No stratification was observed, with relative uniformity of properties from the top to bottom. On subsequent visits, samples at each location were composite samples of the tanks. The average delta (top-bottom) for rail, well and overall samples is summarized in Table 15, with complete data available in the appendix.
Table 15: Average Delta (Top-Bottom) of Tank, Rail and Overall Samples
Avg. Delta (Top-Bottom)
Rail Well Overall
API Gravity 0.0 0.2 0.1 D86 IBP (°F) 0.5 -0.9 -0.5 Vapor P (psi) 0.12 0.01 0.05
Light Ends (Liquid Vol. %) Ethane 0.00 0.02 0.01
Propane 0.00 0.05 0.03 Isobutane 0.00 0.01 0.01 n- Butane 0.00 0.05 0.03 Isopentane 0.00 0.01 0.01 n- Pentane 0.01 0.03 0.02 Cyclopentane 0.00 0.00 0.00 C2-C4s -0.01 0.12 0.08 C2-C5s* 0.00 0.15 0.10 *Excludes Cyclopentane
Vapor pressure showed no clear correlation with operating conditions. Production rate did not show any appreciable impact on the vapor pressure (this is covered later in this report). The same was seen with both operating pressure and temperature. The measured vapor pressure was scattered throughout the range of temperatures and pressures, with no clear correlation. Figure 14, below, shows a plot of vapor pressure versus operational temperature. A plot of vapor pressure versus operating pressure can be seen in Figure 1-1 in the Appendix.

36
Figure 14: Vapor Pressure versus Operating Temperature
The results of the testing did show a slight correlation between operating temperature and light ends (ethane/propane) content, which would be expected. Otherwise, there was no clear correlation between either operating pressure or production rate and the subsequent vapor pressure or ethane/propane content in the crude. While both the separator and treater separate out gas phase from the mixed stream, they are not designed as “stabilizers” to treat the crude. Their purpose is to remove entrained gases and water. Stabilizers, often used in condensate (crude API 50°+) service separate out the lightest components from a given hydrocarbon stream. Those components are then transported separately as liquefied petroleum gas (LPG) and NGLs in pressurized rail cars alongside Bakken crude. This would ultimately be shifting responsibility from one type of rail car to another, concentrating and magnifying potential risks. As with any crude oil, some dissolved light ends will exist in Bakken, and will only be completely removed when the crude is fully fractionated in a refinery setting. This is true of any light crude oil, regardless of the separator and treater setup is used.
Figure 15 and Figure 16 show the effect of operating temperature on the ethane and propane concentrations. There is a slight trend toward lower concentrations at higher temperatures. This is plausible, as some of the lightest components will be driven off as the crude is heated. This would be most apparent in winter months when this test was conducted and ambient temperatures are low. In the summer months, ambient temperatures may reach 100°F or more, making use of the treater less impactful. Figures 1-2 through 1-5 in the Appendix show the charts of the ethane and propane versus operating pressure and production rate, for reference.
8
9
10
11
12
13
14
15
0 20 40 60 80 100 120 140 160 180
Vapo
r Pre
ssur
e (p
si)
Operating Temperature (°F)
W1 W2 W3 W4 W5 W6 W7 W8 W9 W10 W11 W12 W13 W14 W15

37
Figure 15: Ethane Liquid Vol. % versus Operating Temperature
Figure 16: Propane Liquid Vol. % versus Operating Temperature
Based on these findings, a general correlation between the operating temperature of the treater and the ethane or propane concentration was developed. Excluding the few points that were anomalous from W7, the following correlations were developed (charts can be seen in the Appendix, Figures 1-6 and 1-7):
1. Ethane (Liquid Vol %) = -0.0013 * Temp (°F) + 0.3568; and 2. Propane (Liquid Vol %) = -0.0025 * Temp (°F) + 1.8414.
These equations hold that the difference in concentration between 50°F and 150°F operation is 0.13 and 0.25 liquid vol. % for ethane and propane, respectively. This represents approximately 0.4 liquid vol. %
0.00
0.10
0.20
0.30
0.40
0.50
0.60
0.70
0.80
0 20 40 60 80 100 120 140 160 180
Etha
ne (L
iqui
d Vo
l. %
)
Operating Temperature (°F)
W1 W2 W3 W4 W5 W6 W7 W8 W9 W10 W11 W12 W13 W14 W15
0.00
0.50
1.00
1.50
2.00
2.50
3.00
3.50
0 20 40 60 80 100 120 140 160 180
Prop
ane
(Liq
uid
Vol.
%)
Operating Temperature (°F)
W1 W2 W3 W4 W5 W6 W7 W8 W9 W10 W11 W12 W13 W14 W15

38
of the total crude stream. It would stand that operating the treaters toward the higher end of their operating range would ensure maximum reduction of the light ends fractions of the crude oil with current equipment. Because of this, the NDPC recommends that operators run their treaters at the highest feasible operational temperature that allows for safe and consistent operation, to help minimize these components in the crude. This recognizes the limits of both treater design and the limits set forth for the safe storage of crude in stock tanks, which have upper bounds on crude storage temperature.
The impact of stock tanks for crude storage versus being connected to a gathering system on vapor pressure was also considered. Stock tanks hold produced crude and sit for a short time before being pumped out. In the case of this study, the duration between a filled stock tank and sample collection was as much as a day and a half. Because of this, there is a small opportunity for light ends to weather off. The comparison showed there was no appreciable trend between samples collected from wells on a gathering system versus those that used a stock tank and were isolated from the well before collection.
Figure 17 shows the data for this comparison, plotted for those wells with which we had distinct information on their configuration. This is expected, as tanks are designed to minimize evaporative emissions; so significant changes in vapor pressure would indicate the possibility of high tank emissions.
Figure 17: Vapor Pressure versus Well Production Rate
Overview of Sampling, Analytical Methods and Quality Control/Quality Assurance
Sampling
All samples were obtained at both the well and rail facilities by trained SGS personnel, based out of Williston, ND, following accepted industry practices for collection of crude oil samples. Sampling procedures in API Chapter 8.1 “Manual Sampling of Petroleum and Petroleum Products” formed the basis for their sampling methodology. SGS has also written in-house sampling procedures that supplement the API document, as part of their standard operating procedures.
8
9
10
11
12
13
14
15
0 200 400 600 800 1000
Vapo
r Pre
ssur
e (p
si)
Prod. Rate (bbl/day)
W1 W2 W3 - Gathering Sys W4 W5 W6 - Tank W7 - Gathering Sys W8 - Gathering Sys W9 - Tank W10 - Gathering Sys W11 - Tank W12 - Gathering Sys W13 W14 W15 - Tank
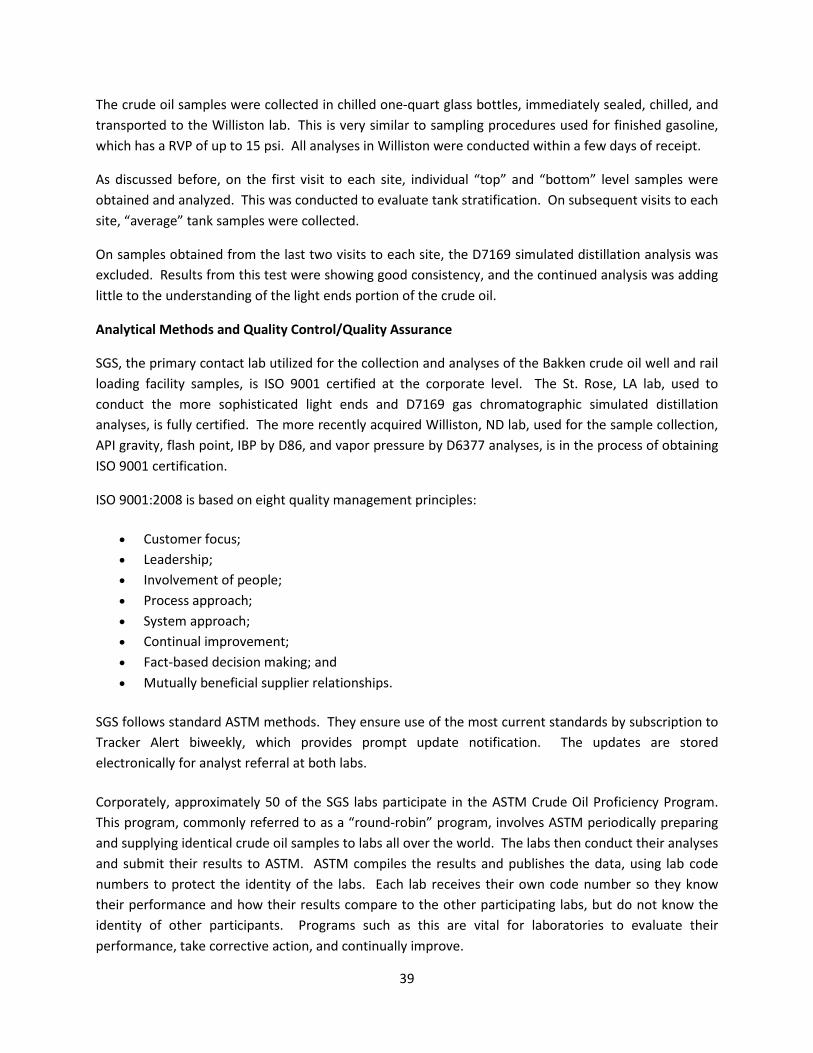
39
The crude oil samples were collected in chilled one-quart glass bottles, immediately sealed, chilled, and transported to the Williston lab. This is very similar to sampling procedures used for finished gasoline, which has a RVP of up to 15 psi. All analyses in Williston were conducted within a few days of receipt.
As discussed before, on the first visit to each site, individual “top” and “bottom” level samples were obtained and analyzed. This was conducted to evaluate tank stratification. On subsequent visits to each site, “average” tank samples were collected.
On samples obtained from the last two visits to each site, the D7169 simulated distillation analysis was excluded. Results from this test were showing good consistency, and the continued analysis was adding little to the understanding of the light ends portion of the crude oil.
Analytical Methods and Quality Control/Quality Assurance
SGS, the primary contact lab utilized for the collection and analyses of the Bakken crude oil well and rail loading facility samples, is ISO 9001 certified at the corporate level. The St. Rose, LA lab, used to conduct the more sophisticated light ends and D7169 gas chromatographic simulated distillation analyses, is fully certified. The more recently acquired Williston, ND lab, used for the sample collection, API gravity, flash point, IBP by D86, and vapor pressure by D6377 analyses, is in the process of obtaining ISO 9001 certification.
ISO 9001:2008 is based on eight quality management principles:
• Customer focus; • Leadership; • Involvement of people; • Process approach; • System approach; • Continual improvement; • Fact-based decision making; and • Mutually beneficial supplier relationships.
SGS follows standard ASTM methods. They ensure use of the most current standards by subscription to Tracker Alert biweekly, which provides prompt update notification. The updates are stored electronically for analyst referral at both labs.
Corporately, approximately 50 of the SGS labs participate in the ASTM Crude Oil Proficiency Program. This program, commonly referred to as a “round-robin” program, involves ASTM periodically preparing and supplying identical crude oil samples to labs all over the world. The labs then conduct their analyses and submit their results to ASTM. ASTM compiles the results and publishes the data, using lab code numbers to protect the identity of the labs. Each lab receives their own code number so they know their performance and how their results compare to the other participating labs, but do not know the identity of other participants. Programs such as this are vital for laboratories to evaluate their performance, take corrective action, and continually improve.

40
Specific QA/QC procedures for each of the analytical methods are described below.
• API Gravity by ASTM D5002 “Standard Test Method for Density and Relative Density of Crude Oils by Digital Density Meter” - This method is specifically for the measurement of crude oils. The instrumentation is calibrated with freshly distilled water as described in Section 10 of the method.
• Flash Point by ASTM D3278 (Williston lab) or ASTM D56 (St. Rose lab) - Flash point measures the tendency of the material to form a flammable mixture with air under controlled laboratory conditions. Section §173.120 of Hazardous Material Regulations allows for the use of either ASTM D56 or D3828. Both D56 and D3278 are very similar. ASTM D56 is the “Standard Method for Flash Point by Tag Closed Cup Tester,” while ASTM D3278 is “Standard Test Methods for Flash Point of Liquids by Small Scale Closed-Cup Apparatus.” Para-Xylene is used as a calibration/check standard for this method, and records were provided by SGS showing acceptable results for this material.
In the case of flash point, it was not necessary to determine the exact flash point, but only to determine whether the value was above or below the critical value of 73°F, which distinguishes between PG II and PG III.
• IBP by ASTM D86 “Standard Test Method for Distillation of Petroleum Products at Atmospheric Pressure” - This method, originally approved by ASTM in 1921 is still utilized for certification of petroleum products such as gasoline and diesel fuel. Temperature bias is determined using reagent grade toluene as a standard, as described in Section 9 of the method. To verify the temperature measurement, pure n-hexadecane is used. SGS provided examples of the instrument printouts for the analyses of both of these reference materials.
It should be noted that full boiling range crude oils are not within the scope of this method as described in Section 1. Thus, various labs have employed different conditions for the condenser and receiver temperatures. These parameters were shown to have a significant impact on the recorded IBP of whole crudes. However, these differences have only a minimal effect on the analysis of the standard materials. Thus, acceptable results on the standard materials do NOT ensure correct IBPs on whole crude.
• Vapor Pressure of Crude Oil (VPCRx) by ASTM D6377 “Standard Test Method for Determination of Vapor Pressure of Crude Oil: VPCRx (Expansion Method)” - This newer method (originally published in 1999) has become the method of choice for vapor pressure measurements of whole crude oils, and EPA recommended its use in a recent publication for determining storage tank compliance. Section 11 of the method describes Quality Control Checks and indicates that Pentane, 2,2-Dimethylbutane, or 2,3-Dimethylbutane may be used as acceptable reference fluids. SGS uses 2,2-Dimethylbutane, and provided results showing all values within the acceptable limits of 10.58 psi – 10.92 psi for this standard material.

41
• Light Ends in Crude Oil by IP344-88 (2010) “Determination of light hydrocarbons in stabilized crude oils- Gas Chromatography method” - This is an Institute of Petroleum (IP) method. IP is the British equivalent of ASTM. This is an internal standard gas chromatography (GC) method. No reference standard is used, but participation in the ASTM Crude Oil Proficiency program is used to evaluate the accuracy of the results from this analysis.
• Boiling Range Distribution by ASTM D7169 “Standard Test Method for Boiling Point Distribution of Samples with Residues Such as Crude Oils and Atmospheric and Vacuum Residues by High Temperature Gas Chromatography” - This newer method (originally published in 2005) is an external standard approach to obtain distillation type data for full-range crude oils. A reference gas oil is used for determination of detector response and evaluation of boiling points. This standard is run regularly. Blank runs are made to determine the baseline correction.
Documentation was also provided showing calibration information for balances and thermometers used in various laboratory methods.

Appendix 1: Additional Figures
Appendix 1 - Page 1 of 4
Figure 1-1: Vapor Pressure versus Operating Pressure
Figure 1-2: Ethane Liquid Vol. % versus Operating Pressure
8
9
10
11
12
13
14
15
0 10 20 30 40 50 60 70 80 90
Vapo
r Pre
ssur
e (p
si)
Operating Pressure (psig)
0.00
0.10
0.20
0.30
0.40
0.50
0.60
0.70
0.80
0 10 20 30 40 50 60 70 80 90
Etha
ne (L
iqui
d Vo
l. %
)
Operating Pressure (psig)

Appendix 1: Additional Figures
Appendix 1 - Page 2 of 4
Figure 1-3: Ethane Liquid Vol. % versus Production Rate
Figure 1-4: Propane Liquid Vol. % versus Operating Pressure
0.00
0.10
0.20
0.30
0.40
0.50
0.60
0.70
0.80
0 100 200 300 400 500 600 700 800
Etha
ne (L
iqui
d Vo
l. %
)
Production Rate (b/d)
0.0
0.5
1.0
1.5
2.0
2.5
3.0
3.5
0 10 20 30 40 50 60 70 80 90
Prop
ane
(Liq
uid
Vol.
%)
Operating Pressure (psig)
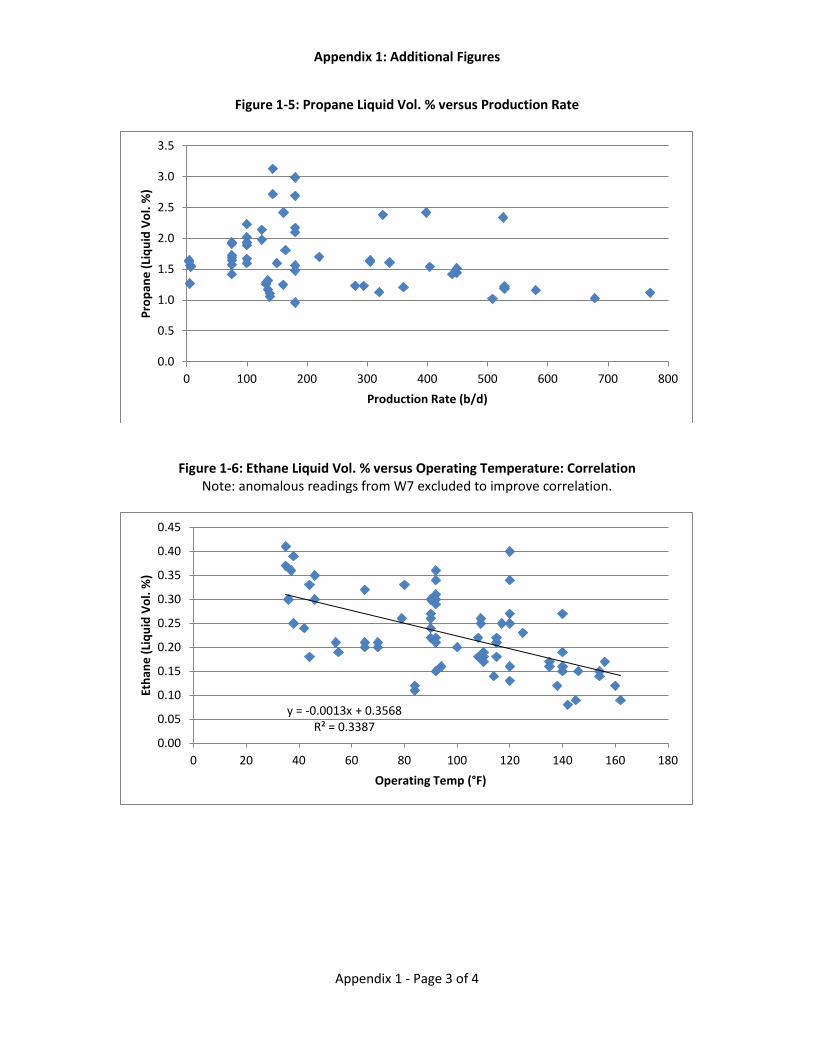
Appendix 1: Additional Figures
Appendix 1 - Page 3 of 4
Figure 1-5: Propane Liquid Vol. % versus Production Rate
Figure 1-6: Ethane Liquid Vol. % versus Operating Temperature: Correlation Note: anomalous readings from W7 excluded to improve correlation.
0.0
0.5
1.0
1.5
2.0
2.5
3.0
3.5
0 100 200 300 400 500 600 700 800
Prop
ane
(Liq
uid
Vol.
%)
Production Rate (b/d)
y = -0.0013x + 0.3568 R² = 0.3387
0.00
0.05
0.10
0.15
0.20
0.25
0.30
0.35
0.40
0.45
0 20 40 60 80 100 120 140 160 180
Etha
ne (L
iqui
d Vo
l. %
)
Operating Temp (°F)
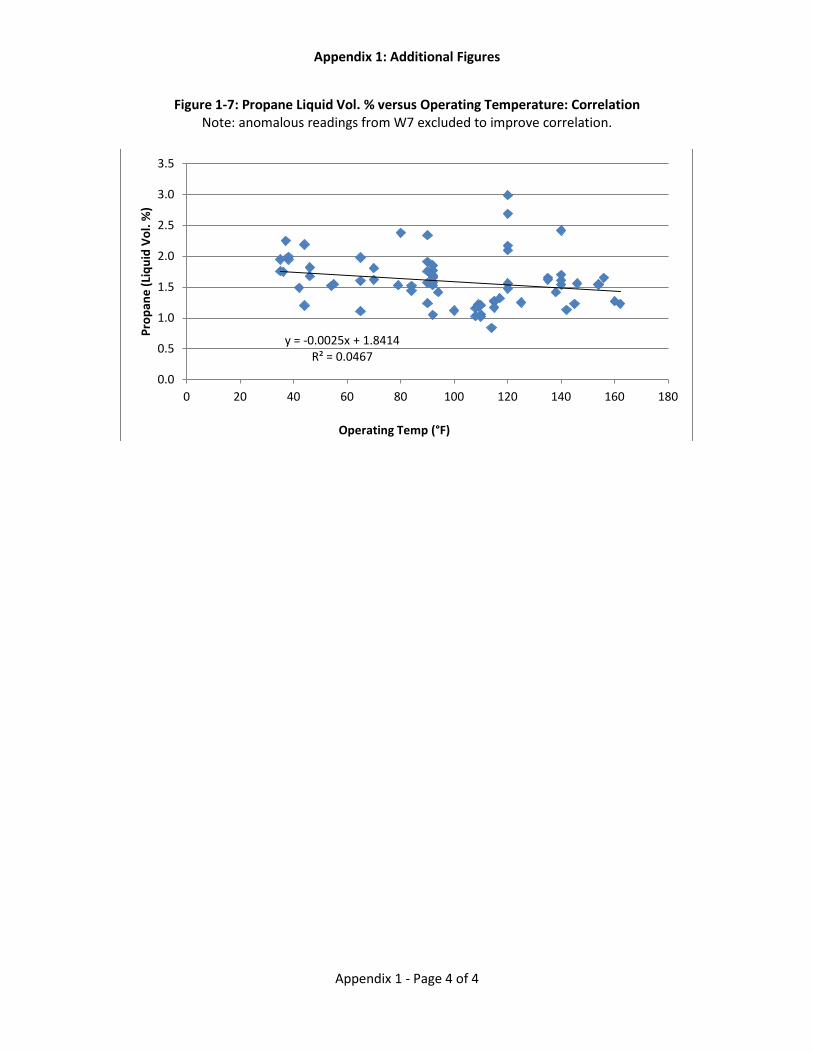
Appendix 1: Additional Figures
Appendix 1 - Page 4 of 4
Figure 1-7: Propane Liquid Vol. % versus Operating Temperature: Correlation Note: anomalous readings from W7 excluded to improve correlation.
y = -0.0025x + 1.8414 R² = 0.0467
0.0
0.5
1.0
1.5
2.0
2.5
3.0
3.5
0 20 40 60 80 100 120 140 160 180
Prop
ane
(Liq
uid
Vol.
%)
Operating Temp (°F)

Appendix 2 ‐ Summary Data
Count Min Avg Max StDev Count Min Avg Max StDev Count Min Avg Max StDevAmbient Temp (°F) 108 10.0 33.8 65.0 13.7 37 10.0 28.7 47.0 9.8 71 11.0 36.5 65.0 14.7API Gravity 152 36.7 41.0 46.3 2.2 49 39.2 41.7 44.0 1.3 103 36.7 40.6 46.3 2.4D86 IBP (°F) 152 91.9 99.5 106.8 2.4 49 96.7 100.3 104.1 1.7 103 91.9 99.1 106.8 2.6Vapor P via D6377 (100°F, 4:1 V/L) (psi) 152 8.93 11.69 14.37 0.97 49 9.57 11.52 12.85 0.80 103 8.93 11.77 14.37 1.04
Light Ends via IP344 Count Min Avg Max StDev Count Min Avg Max StDev Count Min Avg Max StDevMethane 152 0.00 0.00 0.01 0.00 27 0.00 0.00 0.01 0.00 79 0.00 0.00 0.01 0.00Ethane 152 0.08 0.24 0.67 0.08 49 0.13 0.23 0.33 0.04 103 0.08 0.24 0.67 0.09Propane 152 0.84 1.55 3.13 0.41 49 1.02 1.39 1.95 0.24 103 0.84 1.63 3.13 0.45Isobutane 152 0.35 0.63 0.95 0.13 49 0.46 0.58 0.73 0.07 103 0.35 0.65 0.95 0.15n‐ Butane 152 2.00 3.03 4.55 0.56 49 2.17 2.75 3.51 0.33 103 2.00 3.16 4.55 0.60Neopentane 150 0.00 0.01 0.01 0.00 49 0.00 0.01 0.01 0.00 101 0.00 0.01 0.01 0.00Isopentane 152 1.10 1.49 1.93 0.20 49 1.17 1.42 1.69 0.11 103 1.10 1.52 1.93 0.23n‐ Pentane 152 2.07 2.84 3.70 0.38 49 2.12 2.72 3.33 0.23 103 2.07 2.90 3.70 0.43Cyclopentane 152 0.17 0.22 0.30 0.03 49 0.17 0.21 0.25 0.02 103 0.17 0.23 0.30 0.03Hexanes 152 4.98 6.33 7.64 0.56 49 5.46 6.33 6.96 0.32 103 4.98 6.34 7.64 0.64
Simulated Distillation via D7169 Count Min Avg Max StDev Count Min Avg Max StDev Count Min Avg Max StDev
IBP 111 <97 <97 <97 111 <97 <97 <97 111 <97 <97 <975%* 111 97 108 151 17 21 98 113 151 17 28 97 106 150 1810%* 111 103 157 188 17 35 143 165 186 10 71 103 153 188 1920% 111 180 234 278 20 35 216 238 264 11 76 180 231 278 2330% 111 244 312 375 25 35 289 316 346 12 76 244 310 375 2940% 111 327 395 476 29 35 364 396 436 15 76 327 394 476 3450% 111 412 481 578 33 35 443 482 527 17 76 412 481 578 3860% 111 508 572 684 35 35 527 572 623 19 76 508 572 684 4170% 111 611 671 796 39 35 620 670 730 23 76 611 671 796 4580% 111 718 786 920 42 35 733 787 850 25 76 718 785 920 4890% 111 860 936 1069 43 35 888 939 1012 30 76 860 935 1069 4895% 111 966 1056 1192 52 35 1000 1060 1180 44 76 966 1053 1192 55FBP* 111 1186 1309 1362 44 21 1217 1317 1342 40 51 1186 1305 1362 45
Recovery (weight %) 111 95.7 99.3 100.0 1.1 35 95.9 99.3 100.0 1.1 76 95.7 99.4 100.0 1.1
Raw data can be seen in the other sheets for reference.
WellRailTotal
* Items with astricks were adjusted averages, to account for one or more values that were above or below detection limits (97°F and 1382°F, respectively).Those items were adjusted by averaging the detection limit for those values, and thus the averages may be slightly above or below the actual value.
Appendix 2 ‐ Page 1 of 1
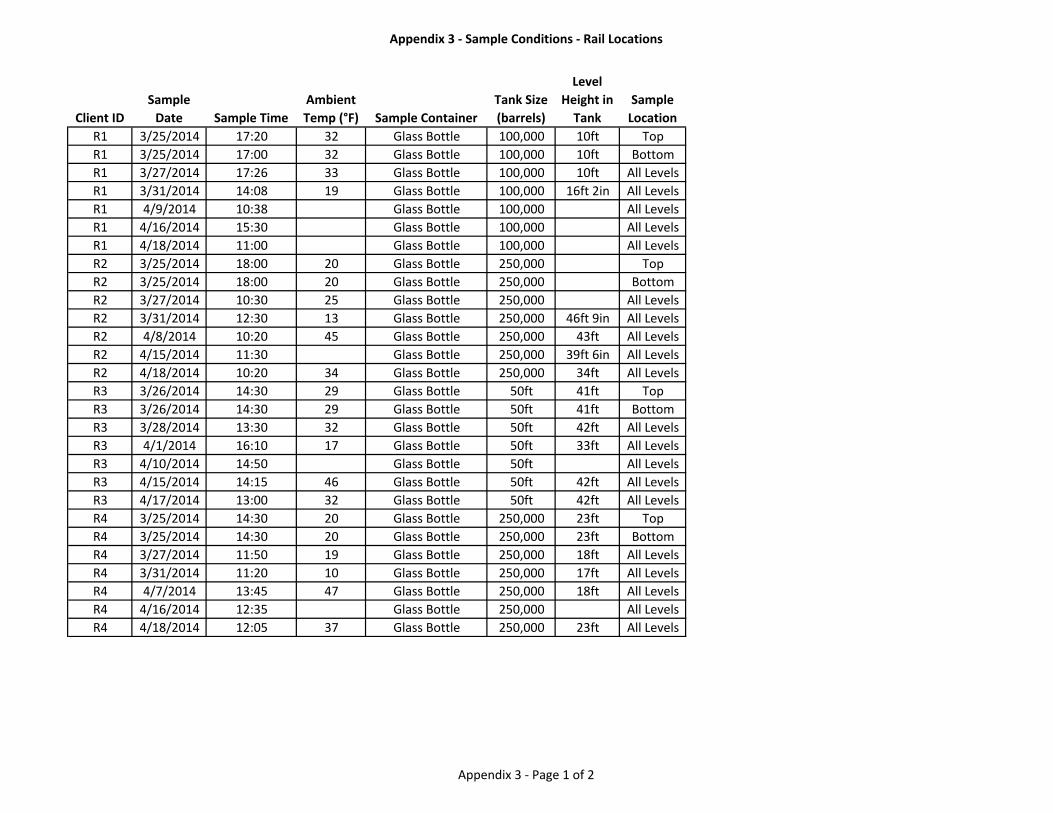
Appendix 3 ‐ Sample Conditions ‐ Rail Locations
Client IDSample Date Sample Time
Ambient Temp (°F) Sample Container
Tank Size (barrels)
Level Height in Tank
Sample Location
R1 3/25/2014 17:20 32 Glass Bottle 100,000 10ft TopR1 3/25/2014 17:00 32 Glass Bottle 100,000 10ft BottomR1 3/27/2014 17:26 33 Glass Bottle 100,000 10ft All LevelsR1 3/31/2014 14:08 19 Glass Bottle 100,000 16ft 2in All LevelsR1 4/9/2014 10:38 Glass Bottle 100,000 All LevelsR1 4/16/2014 15:30 Glass Bottle 100,000 All LevelsR1 4/18/2014 11:00 Glass Bottle 100,000 All LevelsR2 3/25/2014 18:00 20 Glass Bottle 250,000 TopR2 3/25/2014 18:00 20 Glass Bottle 250,000 BottomR2 3/27/2014 10:30 25 Glass Bottle 250,000 All LevelsR2 3/31/2014 12:30 13 Glass Bottle 250,000 46ft 9in All LevelsR2 4/8/2014 10:20 45 Glass Bottle 250,000 43ft All LevelsR2 4/15/2014 11:30 Glass Bottle 250,000 39ft 6in All LevelsR2 4/18/2014 10:20 34 Glass Bottle 250,000 34ft All LevelsR3 3/26/2014 14:30 29 Glass Bottle 50ft 41ft TopR3 3/26/2014 14:30 29 Glass Bottle 50ft 41ft BottomR3 3/28/2014 13:30 32 Glass Bottle 50ft 42ft All LevelsR3 4/1/2014 16:10 17 Glass Bottle 50ft 33ft All LevelsR3 4/10/2014 14:50 Glass Bottle 50ft All LevelsR3 4/15/2014 14:15 46 Glass Bottle 50ft 42ft All LevelsR3 4/17/2014 13:00 32 Glass Bottle 50ft 42ft All LevelsR4 3/25/2014 14:30 20 Glass Bottle 250,000 23ft TopR4 3/25/2014 14:30 20 Glass Bottle 250,000 23ft BottomR4 3/27/2014 11:50 19 Glass Bottle 250,000 18ft All LevelsR4 3/31/2014 11:20 10 Glass Bottle 250,000 17ft All LevelsR4 4/7/2014 13:45 47 Glass Bottle 250,000 18ft All LevelsR4 4/16/2014 12:35 Glass Bottle 250,000 All LevelsR4 4/18/2014 12:05 37 Glass Bottle 250,000 23ft All Levels
Appendix 3 ‐ Page 1 of 2

Appendix 3 ‐ Sample Conditions ‐ Rail Locations
Client IDSample Date Sample Time
Ambient Temp (°F) Sample Container
Tank Size (barrels)
Level Height in Tank
Sample Location
R5 3/26/2014 12:00 36 Glass Bottle 45ft 39ft TopR5 3/26/2014 12:00 36 Glass Bottle 45ft 39ft BottomR5 3/28/2014 12:00 32 Glass Bottle 45ft 32ft All LevelsR5 4/1/2014 14:30 15 Glass Bottle 45ft 39ft All LevelsR5 4/10/2014 13:15 Glass Bottle 45ft All LevelsR5 4/15/2014 12:50 44 Glass Bottle 45ft 40ft All LevelsR5 4/17/2014 11:40 32 Glass Bottle 45ft 28ft All LevelsR6 3/26/2014 15:30 29 Glass Bottle 250,000 TopR6 3/26/2014 15:30 29 Glass Bottle 250,000 BottomR6 3/27/2014 15:30 33 Glass Bottle 250,000 All LevelsR6 3/31/2014 14:00 13 Glass Bottle 250,000 27ft 4in All LevelsR6 4/7/2014 15:00 Glass Bottle 250,000 All LevelsR6 4/15/2014 14:00 Glass Bottle 250,000 34ft 6in All LevelsR6 4/17/2014 12:00 Glass Bottle 250,000 38ft 6in All LevelsR7 3/26/2014 19:30 28 Glass Bottle 250,000 40ft TopR7 3/26/2014 19:30 28 Glass Bottle 250,000 40ft BottomR7 3/28/2014 13:00 46 Glass Bottle 250,000 42ft All LevelsR7 3/31/2014 17:00 22 Glass Bottle 250,000 35ft 6in All LevelsR7 4/11/2014 10:50 Glass Bottle 250,000 All LevelsR7 4/14/2014 12:30 27 Glass Bottle 250,000 40ft All LevelsR7 4/18/2014 10:00 Glass Bottle 250,000 33ft All Levels
Appendix 3 ‐ Page 2 of 2

Appendix 4 ‐ Sample Conditions ‐ Well
Client ID Sample Date Sample Time Ambient Temp (°F) Sample Container Tank Size (barrels) Level Height in TankSample Location
W1 3/25/2014 19:45 18 Glass Bottle 400 15ft TopW1 3/25/2014 19:45 18 Glass Bottle 400 15ft BottomW1 3/27/2014 18:15 26 Glass Bottle 400 15ft All LevelsW1 3/30/2014 16:00 39 Glass Bottle 400 15ft All LevelsW1 4/1/2014 11:00 Glass Bottle 400 All LevelsW1 4/7/2014 12:20 31 Glass Bottle 400 18ft All LevelsW1 4/16/2014 11:30 Glass Bottle 400 14ft All LevelsW2 3/26/2014 12:45 30 Glass Bottle 400 14ft TopW2 3/26/2014 12:45 30 Glass Bottle 400 14ft BottomW2 3/29/2014 15:00 52 Glass Bottle 400 10ft All LevelsW2 3/31/2014 10:00 12 Glass Bottle 400 15ft All LevelsW2 4/7/2014 13:05 51 Glass Bottle 400 16ft All LevelsW2 4/16/2014 12:00 Glass Bottle 400 All LevelsW2 4/19/2014 9:00 Glass Bottle 400 All LevelsW3 3/25/2014 12:30 15 Glass Bottle 400 10ft TopW3 3/25/2014 12:30 15 Glass Bottle 400 10ft BottomW3 3/27/2014 10:00 24 Glass Bottle 400 10ft All LevelsW3 3/31/2014 10:00 11 Glass Bottle 400 10ft All LevelsW3 4/7/2014 12:50 42 Glass Bottle 400 12ft All LevelsW3 4/16/2014 10:30 Glass Bottle 400 12ft All LevelsW3 4/18/2014 11:20 37 Glass Bottle 400 10ft All LevelsW4 3/26/2014 12:00 30 Glass Bottle 400 6ft TopW4 3/26/2014 12:00 30 Glass Bottle 400 6ft BottomW4 3/28/2014 13:15 23 Glass Bottle 400 5ft 9in All LevelsW4 4/3/2014 17:25 37 Glass Bottle 400 9ft All LevelsW4 4/7/2014 18:14 49 Glass Bottle 400 10ft 6in All LevelsW4 4/15/2014 16:00 Glass Bottle 400 7ft 7in All LevelsW4 4/17/2014 14:30 Glass Bottle 400 7ft 2in All Levels
Appendix 4 ‐ Page 1 of 4
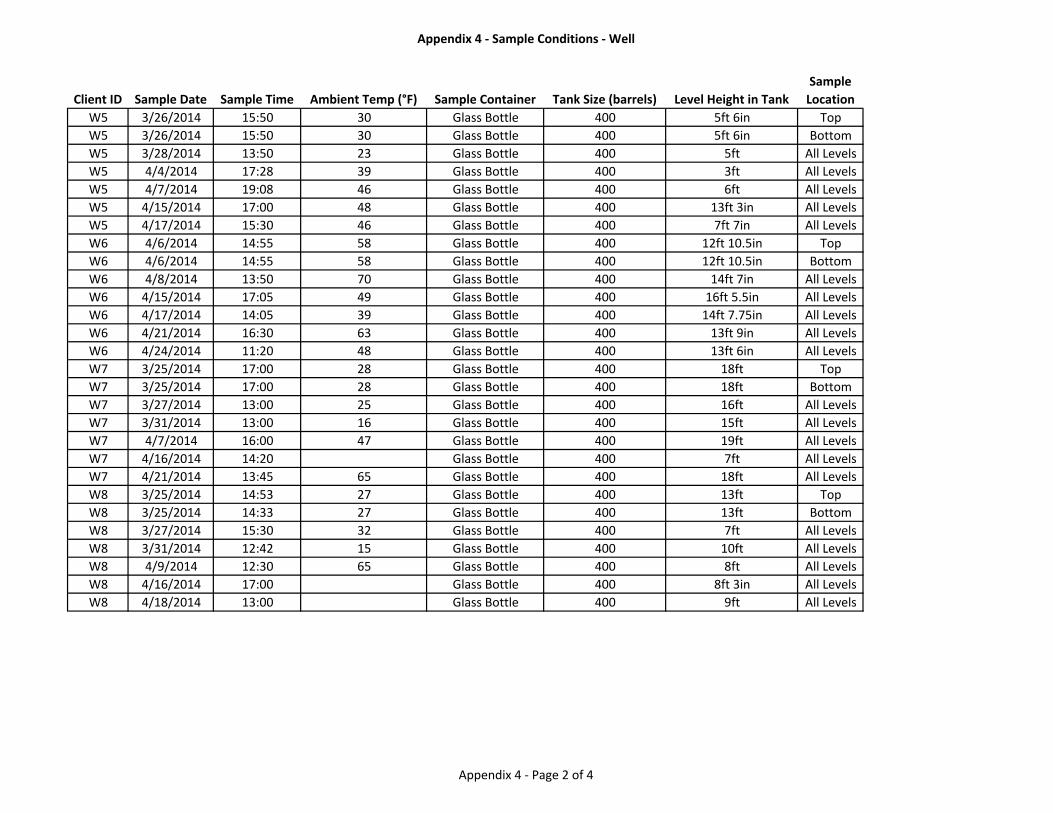
Appendix 4 ‐ Sample Conditions ‐ Well
Client ID Sample Date Sample Time Ambient Temp (°F) Sample Container Tank Size (barrels) Level Height in TankSample Location
W5 3/26/2014 15:50 30 Glass Bottle 400 5ft 6in TopW5 3/26/2014 15:50 30 Glass Bottle 400 5ft 6in BottomW5 3/28/2014 13:50 23 Glass Bottle 400 5ft All LevelsW5 4/4/2014 17:28 39 Glass Bottle 400 3ft All LevelsW5 4/7/2014 19:08 46 Glass Bottle 400 6ft All LevelsW5 4/15/2014 17:00 48 Glass Bottle 400 13ft 3in All LevelsW5 4/17/2014 15:30 46 Glass Bottle 400 7ft 7in All LevelsW6 4/6/2014 14:55 58 Glass Bottle 400 12ft 10.5in TopW6 4/6/2014 14:55 58 Glass Bottle 400 12ft 10.5in BottomW6 4/8/2014 13:50 70 Glass Bottle 400 14ft 7in All LevelsW6 4/15/2014 17:05 49 Glass Bottle 400 16ft 5.5in All LevelsW6 4/17/2014 14:05 39 Glass Bottle 400 14ft 7.75in All LevelsW6 4/21/2014 16:30 63 Glass Bottle 400 13ft 9in All LevelsW6 4/24/2014 11:20 48 Glass Bottle 400 13ft 6in All LevelsW7 3/25/2014 17:00 28 Glass Bottle 400 18ft TopW7 3/25/2014 17:00 28 Glass Bottle 400 18ft BottomW7 3/27/2014 13:00 25 Glass Bottle 400 16ft All LevelsW7 3/31/2014 13:00 16 Glass Bottle 400 15ft All LevelsW7 4/7/2014 16:00 47 Glass Bottle 400 19ft All LevelsW7 4/16/2014 14:20 Glass Bottle 400 7ft All LevelsW7 4/21/2014 13:45 65 Glass Bottle 400 18ft All LevelsW8 3/25/2014 14:53 27 Glass Bottle 400 13ft TopW8 3/25/2014 14:33 27 Glass Bottle 400 13ft BottomW8 3/27/2014 15:30 32 Glass Bottle 400 7ft All LevelsW8 3/31/2014 12:42 15 Glass Bottle 400 10ft All LevelsW8 4/9/2014 12:30 65 Glass Bottle 400 8ft All LevelsW8 4/16/2014 17:00 Glass Bottle 400 8ft 3in All LevelsW8 4/18/2014 13:00 Glass Bottle 400 9ft All Levels
Appendix 4 ‐ Page 2 of 4
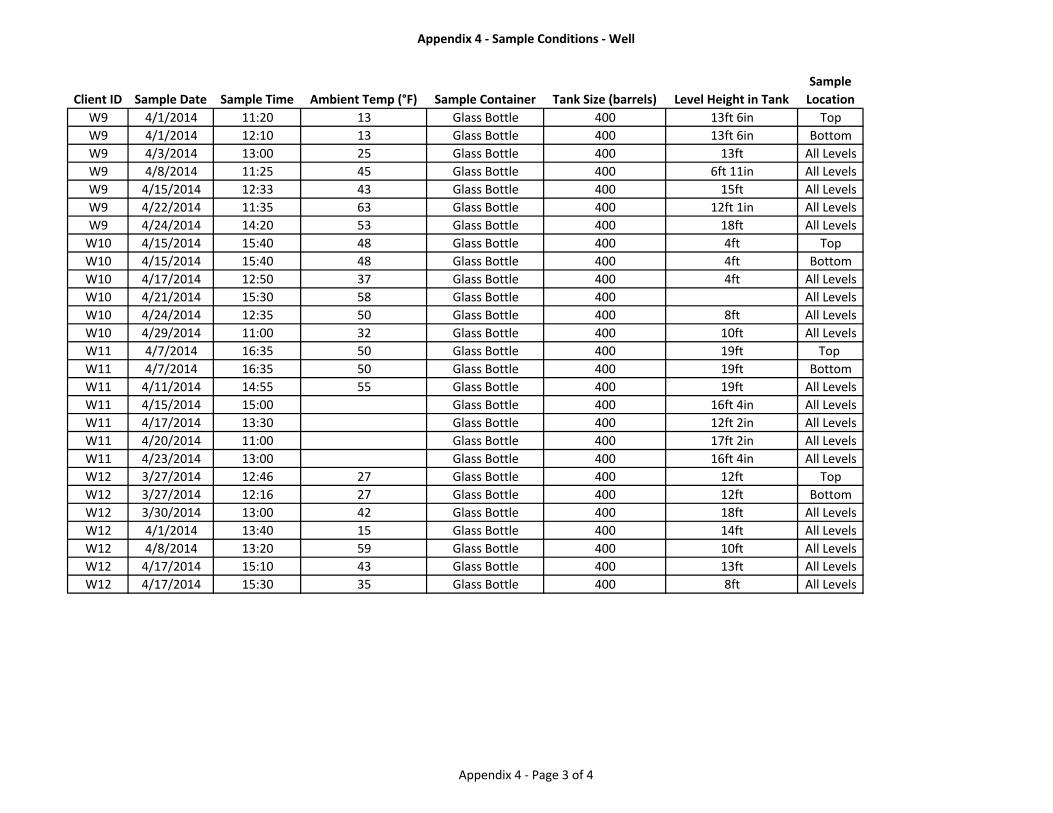
Appendix 4 ‐ Sample Conditions ‐ Well
Client ID Sample Date Sample Time Ambient Temp (°F) Sample Container Tank Size (barrels) Level Height in TankSample Location
W9 4/1/2014 11:20 13 Glass Bottle 400 13ft 6in TopW9 4/1/2014 12:10 13 Glass Bottle 400 13ft 6in BottomW9 4/3/2014 13:00 25 Glass Bottle 400 13ft All LevelsW9 4/8/2014 11:25 45 Glass Bottle 400 6ft 11in All LevelsW9 4/15/2014 12:33 43 Glass Bottle 400 15ft All LevelsW9 4/22/2014 11:35 63 Glass Bottle 400 12ft 1in All LevelsW9 4/24/2014 14:20 53 Glass Bottle 400 18ft All LevelsW10 4/15/2014 15:40 48 Glass Bottle 400 4ft TopW10 4/15/2014 15:40 48 Glass Bottle 400 4ft BottomW10 4/17/2014 12:50 37 Glass Bottle 400 4ft All LevelsW10 4/21/2014 15:30 58 Glass Bottle 400 All LevelsW10 4/24/2014 12:35 50 Glass Bottle 400 8ft All LevelsW10 4/29/2014 11:00 32 Glass Bottle 400 10ft All LevelsW11 4/7/2014 16:35 50 Glass Bottle 400 19ft Top W11 4/7/2014 16:35 50 Glass Bottle 400 19ft BottomW11 4/11/2014 14:55 55 Glass Bottle 400 19ft All LevelsW11 4/15/2014 15:00 Glass Bottle 400 16ft 4in All LevelsW11 4/17/2014 13:30 Glass Bottle 400 12ft 2in All LevelsW11 4/20/2014 11:00 Glass Bottle 400 17ft 2in All LevelsW11 4/23/2014 13:00 Glass Bottle 400 16ft 4in All LevelsW12 3/27/2014 12:46 27 Glass Bottle 400 12ft TopW12 3/27/2014 12:16 27 Glass Bottle 400 12ft BottomW12 3/30/2014 13:00 42 Glass Bottle 400 18ft All LevelsW12 4/1/2014 13:40 15 Glass Bottle 400 14ft All LevelsW12 4/8/2014 13:20 59 Glass Bottle 400 10ft All LevelsW12 4/17/2014 15:10 43 Glass Bottle 400 13ft All LevelsW12 4/17/2014 15:30 35 Glass Bottle 400 8ft All Levels
Appendix 4 ‐ Page 3 of 4
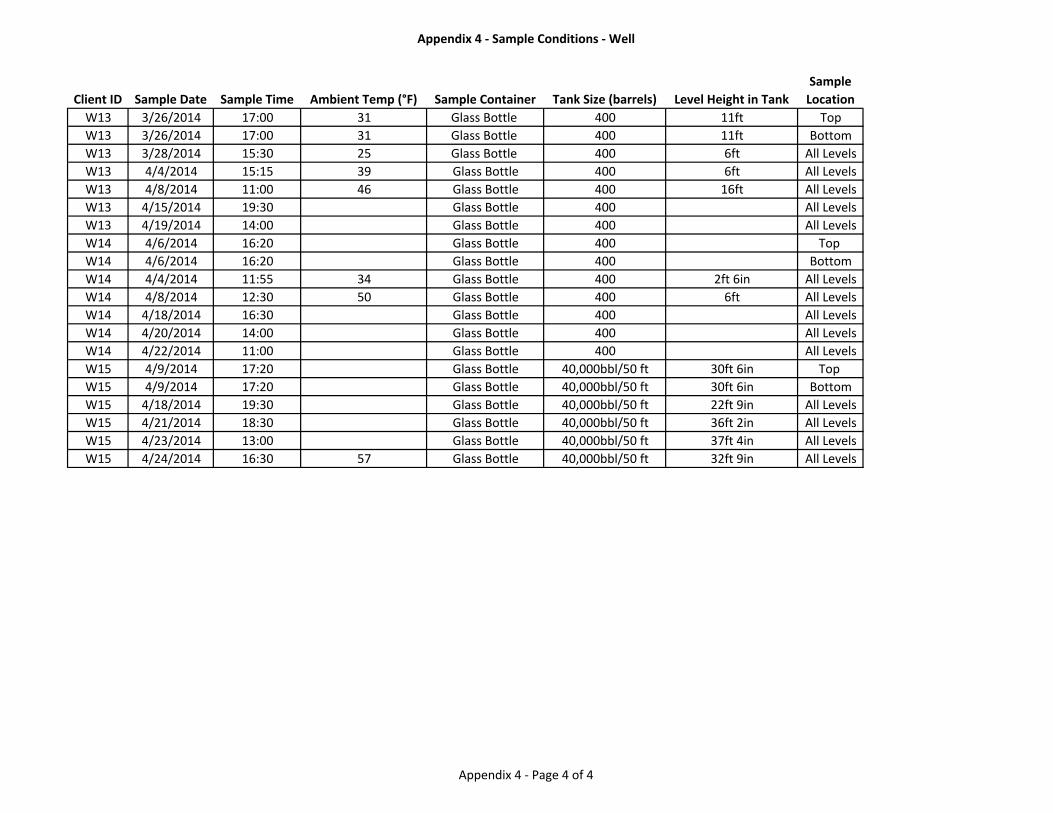
Appendix 4 ‐ Sample Conditions ‐ Well
Client ID Sample Date Sample Time Ambient Temp (°F) Sample Container Tank Size (barrels) Level Height in TankSample Location
W13 3/26/2014 17:00 31 Glass Bottle 400 11ft TopW13 3/26/2014 17:00 31 Glass Bottle 400 11ft BottomW13 3/28/2014 15:30 25 Glass Bottle 400 6ft All LevelsW13 4/4/2014 15:15 39 Glass Bottle 400 6ft All LevelsW13 4/8/2014 11:00 46 Glass Bottle 400 16ft All LevelsW13 4/15/2014 19:30 Glass Bottle 400 All LevelsW13 4/19/2014 14:00 Glass Bottle 400 All LevelsW14 4/6/2014 16:20 Glass Bottle 400 Top W14 4/6/2014 16:20 Glass Bottle 400 BottomW14 4/4/2014 11:55 34 Glass Bottle 400 2ft 6in All LevelsW14 4/8/2014 12:30 50 Glass Bottle 400 6ft All LevelsW14 4/18/2014 16:30 Glass Bottle 400 All LevelsW14 4/20/2014 14:00 Glass Bottle 400 All LevelsW14 4/22/2014 11:00 Glass Bottle 400 All LevelsW15 4/9/2014 17:20 Glass Bottle 40,000bbl/50 ft 30ft 6in Top W15 4/9/2014 17:20 Glass Bottle 40,000bbl/50 ft 30ft 6in BottomW15 4/18/2014 19:30 Glass Bottle 40,000bbl/50 ft 22ft 9in All LevelsW15 4/21/2014 18:30 Glass Bottle 40,000bbl/50 ft 36ft 2in All LevelsW15 4/23/2014 13:00 Glass Bottle 40,000bbl/50 ft 37ft 4in All LevelsW15 4/24/2014 16:30 57 Glass Bottle 40,000bbl/50 ft 32ft 9in All Levels
Appendix 4 ‐ Page 4 of 4

Appendix 5 ‐ Operational Conditions ‐ Well Only
Client ID Sample Date Sample TimeTank Vapor Capture ‐ Flare Stack or VRU
Production Rates from Producer(b/d)
Last Movement from Tank (Date and Time) Separator Size
Separator Operating Pressure (psig)
Separator Operating Temp
(°F)Treater/Emulsion Heater Size
Treater/Emulsion Heater Operating Pressure (psig)
Treater/Emulsion Heater Operating
Temp (°F)
Treater/Emulsion Heater Oil Line
Dia (inches)
Treater/Emulsion Heater Oil Dump Valve Size/Style Additional Field Info
W1 3/25/14 19:45 46 92 TreaterW1 3/25/14 19:45 46 92 TreaterW1 3/27/14 18:15 48 92 TreaterW1 3/30/14 16:00 31 92 TreaterW1 4/1/14 11:00W1 4/7/14 12:20 31 92W1 4/16/14 11:30W2 3/26/14 12:45 20 46 TreaterW2 3/26/14 12:45 20 46 TreaterW2 3/29/14 15:00 19 90 TreaterW2 3/31/14 10:00 55 92 TreaterW2 4/7/14 13:05 44 54 TreaterW2 4/16/14 12:00W2 4/19/14 9:00W3 3/25/14 12:30 110 N/A 6' x 20' 30 35 3" 3" KimrayW3 3/25/14 12:30 110 N/A 6' x 20' 30 35 3" 3" KimrayW3 3/27/14 10:00 90 N/A 6' x 20' 42 38 3" 3" KimrayW3 3/31/14 10:00 100 N/A 6' x 20' 38 36 3" 3" KimrayW3 4/7/14 12:50 110 N/A 6' x 20' 36 44 3" 3" KimrayW3 4/16/14 10:30 90 N/A 6' x 20' 44 36 3" 3" KimrayW3 4/18/14 11:20 90 N/A 6' x 20' 8 42 3" 3" KimrayW4 3/26/14 12:00 Flare Stack 305 N/A N/A N/A 6' x 22' 48 135 3" 3" Gas Operated On Gathering SystemW4 3/26/14 12:00 Flare Stack 305 N/A N/A N/A 6' x 22' 48 135 3" 3" Gas Operated On Gathering SystemW4 3/28/14 13:15 Flare Stack 337 N/A N/A N/A 6' x 22' 50 140 3" 3" Gas Operated On Gathering SystemW4 4/3/14 17:25 Flare Stack 280 N/A N/A N/A 6' x 22' 54 145 3" 3" Gas Operated On Gathering SystemW4 4/7/14 18:14 Flare Stack 320 N/A N/A N/A 6' x 22' 12 142 3" 3" Gas Operated On Gathering SystemW4 4/15/14 16:00 Flare Stack 220 N/A N/A N/A 6' x 22' 52 140 3" 3" Gas Operated On Gathering SystemW4 4/17/14 14:30 Flare Stack 326 N/A N/A N/A 6' x 22' 40 80 3" 3" Gas Operated On Gathering SystemW5 3/26/14 15:50 Both (Stack/VRU) 449 N/A N/A N/A 6' x 22' 40 84 3" 3" Gas Operated On Gathering SystemW5 3/26/14 15:50 Both (Stack/VRU) 449 N/A N/A N/A 6' x 22' 40 84 3" 3" Gas Operated On Gathering SystemW5 3/28/14 13:50 Both (Stack/VRU) 404 N/A N/A N/A 6' x 22' 40 140 3" 3" Gas Operated On Gathering SystemW5 4/4/14 17:28 Both (Stack/VRU) 294 N/A N/A N/A 6' x 22' 51 162 3" 3" Gas Operated On Gathering SystemW5 4/7/14 19:08 Both (Stack/VRU) 441 N/A N/A N/A 6' x 22' 53 138 3" 3" Gas Operated On Gathering SystemW5 4/15/14 17:00 Both (Stack/VRU) 526 N/A N/A N/A 6' x 22' 45 90 3" 3" Gas Operated On Gathering SystemW5 4/17/14 15:30 Both (Stack/VRU) 398 N/A N/A N/A 6' x 22' 50 140 3" 3" Gas Operated On Gathering SystemW6 4/6/14 14:55 100 4/5/14 11:00 30" x 10' 80 6' x 20' 30 3" 3" SteelW6 4/6/14 14:55 100 4/5/14 11:00 30" x 10' 80 6' x 20' 30 3" 3" SteelW6 4/8/14 13:50 100 4/7/14 11:00 30" x 10' 80 6' x 20' 30 3" 3" SteelW6 4/15/14 17:05 100 4/14/14 11:00 30" x 10' 80 6' x 20' 30 3" 3" SteelW6 4/17/14 14:05 100 4/16/14 11:00 30" x 10' 80 6' x 20' 30 3" 3" SteelW6 4/21/14 16:30 100 4/20/14 11:00 30" x 10' 80 6' x 20' 30 3" 3" SteelW6 4/24/14 11:20 100 4/23/14 11:00 30" x 10' 80 6' x 20' 30 3" 3" SteelW7 3/25/14 17:00 Flare Stack 143 N/A 30" x 10' 6' x 20' 26 120 3" 3" float operatedW7 3/25/14 17:00 Flare Stack 143 N/A 30" x 10' 6' x 20' 26 120 3" 3" float operatedW7 3/27/14 13:00 Flare Stack 161 N/A 30" x 10' 6' x 20' 26 123 3" 3" float operatedW7 3/31/14 13:00 Flare Stack 125 N/A 30" x 10' 6' x 20' 28 38 3" 3" float operatedW7 4/7/14 16:00 Flare Stack 150 N/A 30" x 10' 6' x 20' 28 65 3" 3" float operatedW7 4/16/14 14:20 Flare Stack 125 N/A 30" x 10' 6' x 20' 28 65 3" 3" float operatedW7 4/21/14 13:45 Flare Stack 164 N/A 30" x 10' 6' x 20' 28 70 3" 3" float operated
Appendix 5 ‐ Page 1 of 2
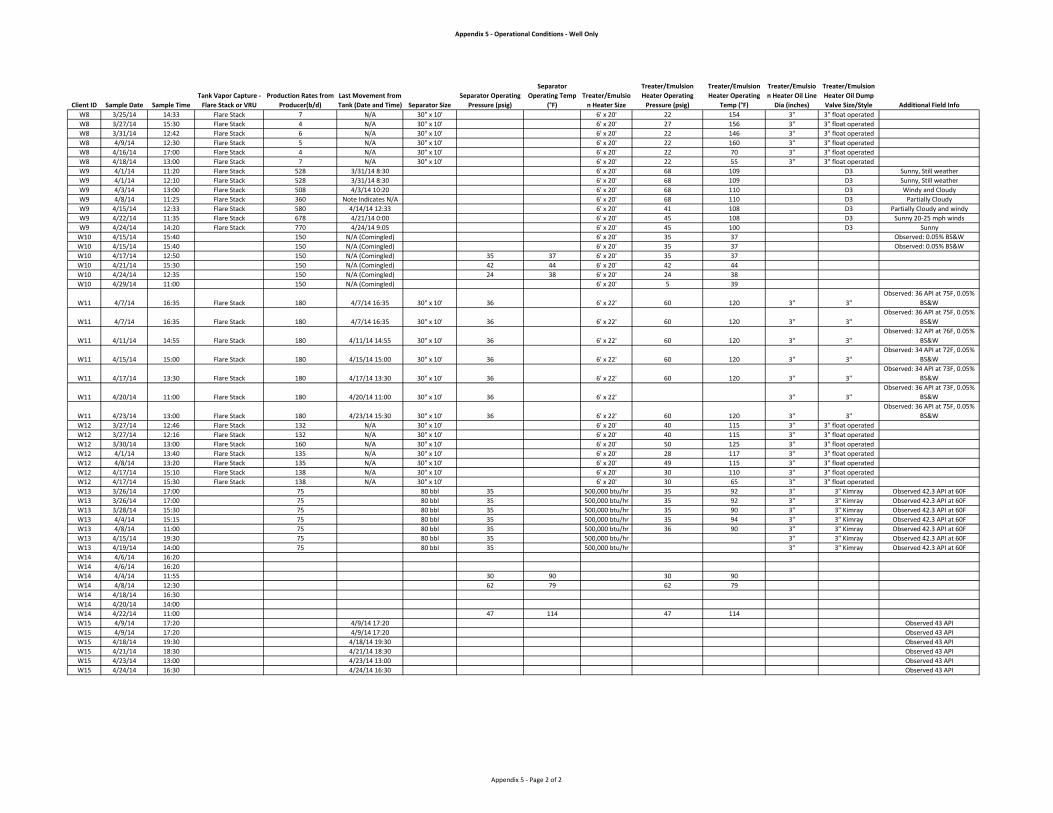
Appendix 5 ‐ Operational Conditions ‐ Well Only
Client ID Sample Date Sample TimeTank Vapor Capture ‐ Flare Stack or VRU
Production Rates from Producer(b/d)
Last Movement from Tank (Date and Time) Separator Size
Separator Operating Pressure (psig)
Separator Operating Temp
(°F)Treater/Emulsion Heater Size
Treater/Emulsion Heater Operating Pressure (psig)
Treater/Emulsion Heater Operating
Temp (°F)
Treater/Emulsion Heater Oil Line
Dia (inches)
Treater/Emulsion Heater Oil Dump Valve Size/Style Additional Field Info
W8 3/25/14 14:33 Flare Stack 7 N/A 30" x 10' 6' x 20' 22 154 3" 3" float operatedW8 3/27/14 15:30 Flare Stack 4 N/A 30" x 10' 6' x 20' 27 156 3" 3" float operatedW8 3/31/14 12:42 Flare Stack 6 N/A 30" x 10' 6' x 20' 22 146 3" 3" float operatedW8 4/9/14 12:30 Flare Stack 5 N/A 30" x 10' 6' x 20' 22 160 3" 3" float operatedW8 4/16/14 17:00 Flare Stack 4 N/A 30" x 10' 6' x 20' 22 70 3" 3" float operatedW8 4/18/14 13:00 Flare Stack 7 N/A 30" x 10' 6' x 20' 22 55 3" 3" float operatedW9 4/1/14 11:20 Flare Stack 528 3/31/14 8:30 6' x 20' 68 109 D3 Sunny, Still weatherW9 4/1/14 12:10 Flare Stack 528 3/31/14 8:30 6' x 20' 68 109 D3 Sunny, Still weatherW9 4/3/14 13:00 Flare Stack 508 4/3/14 10:20 6' x 20' 68 110 D3 Windy and CloudyW9 4/8/14 11:25 Flare Stack 360 Note Indicates N/A 6' x 20' 68 110 D3 Partially CloudyW9 4/15/14 12:33 Flare Stack 580 4/14/14 12:33 6' x 20' 41 108 D3 Partially Cloudy and windyW9 4/22/14 11:35 Flare Stack 678 4/21/14 0:00 6' x 20' 45 108 D3 Sunny 20‐25 mph windsW9 4/24/14 14:20 Flare Stack 770 4/24/14 9:05 6' x 20' 45 100 D3 SunnyW10 4/15/14 15:40 150 N/A (Comingled) 6' x 20' 35 37 Observed: 0.05% BS&WW10 4/15/14 15:40 150 N/A (Comingled) 6' x 20' 35 37 Observed: 0.05% BS&WW10 4/17/14 12:50 150 N/A (Comingled) 35 37 6' x 20' 35 37W10 4/21/14 15:30 150 N/A (Comingled) 42 44 6' x 20' 42 44W10 4/24/14 12:35 150 N/A (Comingled) 24 38 6' x 20' 24 38W10 4/29/14 11:00 150 N/A (Comingled) 6' x 20' 5 39
W11 4/7/14 16:35 Flare Stack 180 4/7/14 16:35 30" x 10' 36 6' x 22' 60 120 3" 3"Observed: 36 API at 75F, 0.05%
BS&W
W11 4/7/14 16:35 Flare Stack 180 4/7/14 16:35 30" x 10' 36 6' x 22' 60 120 3" 3"Observed: 36 API at 75F, 0.05%
BS&W
W11 4/11/14 14:55 Flare Stack 180 4/11/14 14:55 30" x 10' 36 6' x 22' 60 120 3" 3"Observed: 32 API at 76F, 0.05%
BS&W
W11 4/15/14 15:00 Flare Stack 180 4/15/14 15:00 30" x 10' 36 6' x 22' 60 120 3" 3"Observed: 34 API at 72F, 0.05%
BS&W
W11 4/17/14 13:30 Flare Stack 180 4/17/14 13:30 30" x 10' 36 6' x 22' 60 120 3" 3"Observed: 34 API at 73F, 0.05%
BS&W
W11 4/20/14 11:00 Flare Stack 180 4/20/14 11:00 30" x 10' 36 6' x 22' 3" 3"Observed: 36 API at 73F, 0.05%
BS&W
W11 4/23/14 13:00 Flare Stack 180 4/23/14 15:30 30" x 10' 36 6' x 22' 60 120 3" 3"Observed: 36 API at 75F, 0.05%
BS&WW12 3/27/14 12:46 Flare Stack 132 N/A 30" x 10' 6' x 20' 40 115 3" 3" float operatedW12 3/27/14 12:16 Flare Stack 132 N/A 30" x 10' 6' x 20' 40 115 3" 3" float operatedW12 3/30/14 13:00 Flare Stack 160 N/A 30" x 10' 6' x 20' 50 125 3" 3" float operatedW12 4/1/14 13:40 Flare Stack 135 N/A 30" x 10' 6' x 20' 28 117 3" 3" float operatedW12 4/8/14 13:20 Flare Stack 135 N/A 30" x 10' 6' x 20' 49 115 3" 3" float operatedW12 4/17/14 15:10 Flare Stack 138 N/A 30" x 10' 6' x 20' 30 110 3" 3" float operatedW12 4/17/14 15:30 Flare Stack 138 N/A 30" x 10' 6' x 20' 30 65 3" 3" float operatedW13 3/26/14 17:00 75 80 bbl 35 500,000 btu/hr 35 92 3" 3" Kimray Observed 42.3 API at 60FW13 3/26/14 17:00 75 80 bbl 35 500,000 btu/hr 35 92 3" 3" Kimray Observed 42.3 API at 60FW13 3/28/14 15:30 75 80 bbl 35 500,000 btu/hr 35 90 3" 3" Kimray Observed 42.3 API at 60FW13 4/4/14 15:15 75 80 bbl 35 500,000 btu/hr 35 94 3" 3" Kimray Observed 42.3 API at 60FW13 4/8/14 11:00 75 80 bbl 35 500,000 btu/hr 36 90 3" 3" Kimray Observed 42.3 API at 60FW13 4/15/14 19:30 75 80 bbl 35 500,000 btu/hr 3" 3" Kimray Observed 42.3 API at 60FW13 4/19/14 14:00 75 80 bbl 35 500,000 btu/hr 3" 3" Kimray Observed 42.3 API at 60FW14 4/6/14 16:20W14 4/6/14 16:20W14 4/4/14 11:55 30 90 30 90W14 4/8/14 12:30 62 79 62 79W14 4/18/14 16:30W14 4/20/14 14:00W14 4/22/14 11:00 47 114 47 114W15 4/9/14 17:20 4/9/14 17:20 Observed 43 APIW15 4/9/14 17:20 4/9/14 17:20 Observed 43 APIW15 4/18/14 19:30 4/18/14 19:30 Observed 43 APIW15 4/21/14 18:30 4/21/14 18:30 Observed 43 APIW15 4/23/14 13:00 4/23/14 13:00 Observed 43 APIW15 4/24/14 16:30 4/24/14 16:30 Observed 43 API
Appendix 5 ‐ Page 2 of 2

Appendix 6 ‐ Lab Data ‐ Rail
Client ID Sample Date Sample Time API Gravity D86 IBP (°F)Vapor P via D6377 (100°F, 4:1 V/L) (psi)
Vapor P via D6377 (100°F, 4:1 V/L) (kPa)
Flash Point D3278 (°F)
R1 3/25/2014 17:20 39.6 100.5 9.73 67.1 <73R1 3/25/2014 17:00 39.5 102.9 9.96 68.7 <73R1 3/27/2014 17:26 39.7 103.9 9.67 66.7 <73R1 3/31/2014 14:08 42.8 100.5 11.31 78.0 <73R1 4/9/2014 10:38 41.6 100.8 11.76 81.1 <73R1 4/16/2014 15:30 42.1 98.4 11.85 81.7 <73R1 4/18/2014 11:00 41.4 99.9 12.33 85.0 <73R2 3/25/2014 18:00 43.4 99.9 11.73 80.9 <73R2 3/25/2014 18:00 42.8 100.7 11.68 80.5 <73R2 3/27/2014 10:30 43.8 99.5 12.39 85.4 <73R2 3/31/2014 12:30 43.2 99.4 11.52 79.4 <73R2 4/8/2014 10:20 40.3 100.5 11.55 79.6 <73R2 4/15/2014 11:30 42.0 97.8 11.94 82.3 <73R2 4/18/2014 10:20 39.2 99.6 11.89 82.0 <73R3 3/26/2014 14:30 42.4 103.5 11.53 79.5 <73R3 3/26/2014 14:30 42.6 101.9 11.70 80.7 <73R3 3/28/2014 13:30 42.6 100.9 11.53 79.5 <73R3 4/1/2014 16:10 41.7 102.0 10.95 75.5 <73R3 4/10/2014 14:50 40.9 97.2 11.53 79.5 <73R3 4/15/2014 14:15 41.3 98.2 11.46 79.0 <73R3 4/17/2014 13:00 40.6 98.8 11.02 76.0 <73R4 3/25/2014 14:30 41.3 99.9 11.95 82.4 <73R4 3/25/2014 14:30 41.4 99.2 11.25 77.6 <73R4 3/27/2014 11:50 43.1 99.9 11.95 82.4 <73R4 3/31/2014 11:20 41.5 99.5 12.44 85.8 <73R4 4/7/2014 13:45 41.5 99.5 12.85 88.6 <73R4 4/16/2014 12:35 40.3 99.1 12.08 83.3 <73R4 4/18/2014 12:05 39.8 100.5 11.99 82.7 <73
Appendix 6 ‐ Page 1 of 2

Appendix 6 ‐ Lab Data ‐ Rail
Client ID Sample Date Sample Time API Gravity D86 IBP (°F)Vapor P via D6377 (100°F, 4:1 V/L) (psi)
Vapor P via D6377 (100°F, 4:1 V/L) (kPa)
Flash Point D3278 (°F)
R5 3/26/2014 12:00 44.0 101.0 10.52 72.5 <73R5 3/26/2014 12:00 43.9 101.9 10.47 72.2 <73R5 3/28/2014 12:00 42.4 100.5 10.50 72.4 <73R5 4/1/2014 14:30 43.1 103.7 10.28 70.9 <73R5 4/10/2014 13:15 42.6 100.4 10.95 75.5 <73R5 4/15/2014 12:50 41.8 100.8 10.85 74.8 <73R5 4/17/2014 11:40 42.0 103.4 9.57 66.0 <73R6 3/26/2014 15:30 42.6 99.7 12.84 88.5 <73R6 3/26/2014 15:30 42.5 98.9 12.47 86.0 <73R6 3/27/2014 15:30 43.0 98.9 12.71 87.6 <73R6 3/31/2014 14:00 41.2 99.4 11.82 81.5 <73R6 4/7/2014 15:00 39.9 96.7 12.43 85.7 <73R6 4/15/2014 14:00 40.2 100.8 12.52 86.3 <73R6 4/17/2014 12:00 39.7 100.1 11.88 81.9 <73R7 3/26/2014 19:30 42.3 104.1 11.66 80.4 <73R7 3/26/2014 19:30 42.8 99.7 11.57 79.8 <73R7 3/28/2014 13:00 42.6 99.5 11.89 82.0 <73R7 3/31/2014 17:00 42.2 101.9 11.86 81.8 <73R7 4/11/2014 10:50 40.9 99.3 11.37 78.4 <73R7 4/14/2014 12:30 41.5 98.9 11.37 78.4 <73R7 4/18/2014 10:00 40.4 101.7 11.39 78.5 <73
Appendix 6 ‐ Page 2 of 2

Appendix 7 ‐ Lab Data ‐ Well
Client ID Sample Date Sample Time API Gravity D86 IBP (°F)Vapor P via D6377 (100°F, 4:1 V/L) (psi)
Vapor P via D6377 (100°F, 4:1 V/L) (kPa)
Flash Point D3278 (°F)
W1 3/25/2014 19:45 40.6 98.2 11.99 82.7 <73W1 3/25/2014 19:45 39.2 102.1 11.55 79.6 <73W1 3/27/2014 18:15 40.3 99.7 11.55 79.6 <73W1 3/30/2014 16:00 39.1 99.2 11.81 81.4 <73W1 4/1/2014 11:00 37.1 98.8 12.18 84 <73W1 4/7/2014 12:20 37.1 99.9 11.40 78.6 <73W1 4/16/2014 11:30 37.7 98.6 11.57 79.8 <73W2 3/26/2014 12:45 41.4 100.6 12.26 84.5 <73W2 3/26/2014 12:45 40.2 100.3 12.08 83.3 <73W2 3/29/2014 15:00 41.5 100.7 11.94 82.3 <73W2 3/31/2014 10:00 39.9 101.9 11.50 79.3 <73W2 4/7/2014 13:05 40.0 98.9 11.37 78.4 <73W2 4/16/2014 12:00 38.0 98.1 11.27 77.7 <73W2 4/19/2014 9:00 38.9 99.8 11.91 82.1 <73W3 3/25/2014 12:30 43.8 96.8 10.65 73.4 <73W3 3/25/2014 12:30 44.4 99.7 10.86 74.9 <73W3 3/27/2014 10:00 44.4 98.6 11.07 76.3 <73W3 3/31/2014 10:00 43.4 98.1 12.02 82.9 <73W3 4/7/2014 12:50 42.1 99.4 12.01 82.8 <73W3 4/16/2014 10:30 40.2 98.4 10.92 75.3 <73W3 4/18/2014 11:20 42.1 98.9 11.37 78.4 <73W4 3/26/2014 12:00 40.0 98.5 12.56 86.6 <73W4 3/26/2014 12:00 41.7 97.7 12.71 87.6 <73W4 3/28/2014 13:15 42.5 98.6 12.84 88.5 <73W4 4/3/2014 17:25 40.4 98.2 11.15 76.9 <73W4 4/7/2014 18:14 39.3 97.3 13.92 96 <73W4 4/15/2014 16:00 38.9 97.4 11.98 82.6 <73W4 4/17/2014 14:30 38.8 99.5 13.24 91.3 <73
Appendix 7 ‐ Page 1 of 4

Appendix 7 ‐ Lab Data ‐ Well
Client ID Sample Date Sample Time API Gravity D86 IBP (°F)Vapor P via D6377 (100°F, 4:1 V/L) (psi)
Vapor P via D6377 (100°F, 4:1 V/L) (kPa)
Flash Point D3278 (°F)
W5 3/26/2014 15:50 42.9 97.3 12.27 84.6 <73W5 3/26/2014 15:50 42.3 99.6 12.44 85.8 <73W5 3/28/2014 13:50 44.3 98.2 13.24 91.3 <73W5 4/4/2014 17:28 41.1 100.9 12.23 84.3 <73W5 4/7/2014 19:08 39.9 94.6 13.26 91.4 <73W5 4/15/2014 17:00 39.9 95.4 12.20 84.1 <73W5 4/17/2014 15:30 42.6 97.5 13.08 90.2 <73W6 4/6/2014 14:55 42.6 97.2 13.04 89.9 <73W6 4/6/2014 14:55 42.6 96.5 13.04 89.9 <73W6 4/8/2014 13:50 42.1 97.7 11.04 76.1 <73W6 4/15/2014 17:05 42.5 96.7 12.33 85 <73W6 4/17/2014 14:05 42.8 97.4 12.59 86.8 <73W6 4/21/2014 16:30 42.3 98.9 11.33 78.1 <73W6 4/24/2014 11:20 45.8 96.4 13.56 93.5 <73W7 3/25/2014 17:00 43.5 97.6 10.25 70.7 <73W7 3/25/2014 17:00 43.8 98.3 10.59 73 <73W7 3/27/2014 13:00 42.6 99.9 10.91 75.2 <73W7 3/31/2014 13:00 43.9 96.9 10.02 69.1 <73W7 4/7/2014 16:00 39.2 96.7 11.33 78.1 <73W7 4/16/2014 14:20 41.7 94.8 12.92 89.1 <73W7 4/21/2014 13:45 39.5 99 11.69 80.6 <73W8 3/25/2014 14:53 44.4 95 12.52 86.3 <73W8 3/25/2014 14:33 44.6 99.2 12.37 85.3 <73W8 3/27/2014 15:30 44.8 99 12.92 89.1 <73W8 3/31/2014 12:42 43.4 97.5 12.15 83.8 <73W8 4/9/2014 12:30 39.0 101.3 11.07 76.3 <73W8 4/16/2014 17:00 40.9 96.1 11.92 82.2 <73W8 4/18/2014 13:00 42.5 96.8 14.37 99.1 <73
Appendix 7 ‐ Page 2 of 4
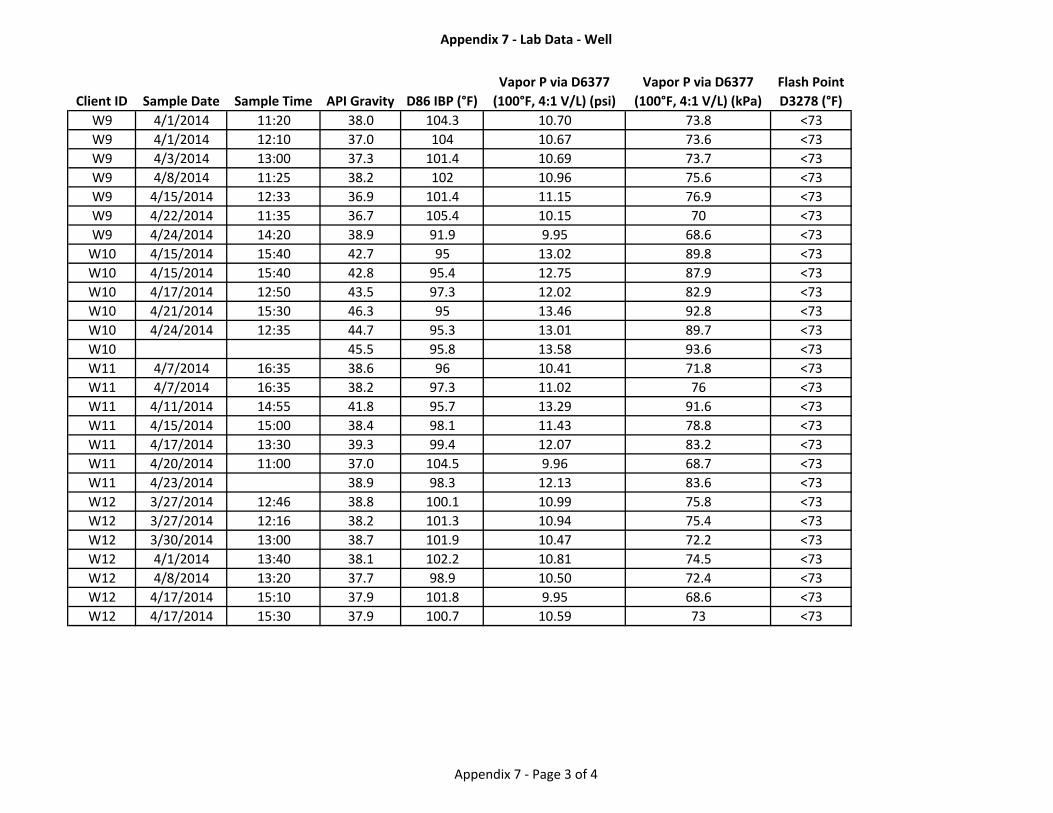
Appendix 7 ‐ Lab Data ‐ Well
Client ID Sample Date Sample Time API Gravity D86 IBP (°F)Vapor P via D6377 (100°F, 4:1 V/L) (psi)
Vapor P via D6377 (100°F, 4:1 V/L) (kPa)
Flash Point D3278 (°F)
W9 4/1/2014 11:20 38.0 104.3 10.70 73.8 <73W9 4/1/2014 12:10 37.0 104 10.67 73.6 <73W9 4/3/2014 13:00 37.3 101.4 10.69 73.7 <73W9 4/8/2014 11:25 38.2 102 10.96 75.6 <73W9 4/15/2014 12:33 36.9 101.4 11.15 76.9 <73W9 4/22/2014 11:35 36.7 105.4 10.15 70 <73W9 4/24/2014 14:20 38.9 91.9 9.95 68.6 <73W10 4/15/2014 15:40 42.7 95 13.02 89.8 <73W10 4/15/2014 15:40 42.8 95.4 12.75 87.9 <73W10 4/17/2014 12:50 43.5 97.3 12.02 82.9 <73W10 4/21/2014 15:30 46.3 95 13.46 92.8 <73W10 4/24/2014 12:35 44.7 95.3 13.01 89.7 <73W10 45.5 95.8 13.58 93.6 <73W11 4/7/2014 16:35 38.6 96 10.41 71.8 <73W11 4/7/2014 16:35 38.2 97.3 11.02 76 <73W11 4/11/2014 14:55 41.8 95.7 13.29 91.6 <73W11 4/15/2014 15:00 38.4 98.1 11.43 78.8 <73W11 4/17/2014 13:30 39.3 99.4 12.07 83.2 <73W11 4/20/2014 11:00 37.0 104.5 9.96 68.7 <73W11 4/23/2014 38.9 98.3 12.13 83.6 <73W12 3/27/2014 12:46 38.8 100.1 10.99 75.8 <73W12 3/27/2014 12:16 38.2 101.3 10.94 75.4 <73W12 3/30/2014 13:00 38.7 101.9 10.47 72.2 <73W12 4/1/2014 13:40 38.1 102.2 10.81 74.5 <73W12 4/8/2014 13:20 37.7 98.9 10.50 72.4 <73W12 4/17/2014 15:10 37.9 101.8 9.95 68.6 <73W12 4/17/2014 15:30 37.9 100.7 10.59 73 <73
Appendix 7 ‐ Page 3 of 4

Appendix 7 ‐ Lab Data ‐ Well
Client ID Sample Date Sample Time API Gravity D86 IBP (°F)Vapor P via D6377 (100°F, 4:1 V/L) (psi)
Vapor P via D6377 (100°F, 4:1 V/L) (kPa)
Flash Point D3278 (°F)
W13 3/26/2014 17:00 42.5 100.4 12.71 87.6 <73W13 3/26/2014 17:00 41.4 99.9 12.60 86.9 <73W13 3/28/2014 15:30 40.6 100.7 12.27 84.6 <73W13 4/4/2014 15:15 42.7 99.4 12.75 87.9 <73W13 4/8/2014 11:00 38.5 98.9 11.57 79.8 <73W13 4/15/2014 19:30 39.3 98.3 12.56 86.6 <73W13 4/19/2014 14:00 39.7 99 12.81 88.3 <73W14 4/6/2014 16:20 37.4 99.8 11.47 79.1 <73W14 4/6/2014 16:20 38.1 98.3 11.31 78 <73W14 4/4/2014 11:55 38.5 103.1 11.76 81.1 <73W14 4/8/2014 12:30 37.4 100.7 11.46 79 <73W14 4/18/2014 16:30 38.9 100.2 10.96 75.6 <73W14 4/20/2014 14:00 37.1 105.3 9.35 64.5 <73W14 4/22/2014 11:00 37.5 106.8 8.93 61.6 <73W15 4/9/2014 17:20 40.1 100 11.75 81 <73W15 4/9/2014 17:20 39.9 101.3 11.44 78.9 <73W15 4/18/2014 19:30 40.9 101.8 12.84 88.5 <73W15 4/21/2014 18:30 40.4 103.2 12.59 86.8 <73W15 4/23/2014 13:00 41.9 99.9 11.04 76.1 <73W15 4/24/2014 16:30 42.9 102.2 11.21 77.3 <73
Appendix 7 ‐ Page 4 of 4

Appendix 8 ‐ Light Ends Data ‐ Rail
Client ID Sample Date Sample Time Methane Ethane Propane Isobutane n‐ Butane Neopentane Isopentane n‐ Pentane Cyclopentane HexanesR1 3/25/2014 17:20 <0.01 0.18 1.16 0.49 2.27 0.01 1.22 2.21 0.21 5.64R1 3/25/2014 17:00 <0.01 0.17 1.14 0.49 2.27 0.01 1.22 2.21 0.21 5.66R1 3/27/2014 17:26 0.00 0.18 1.10 0.46 2.17 0.00 1.17 2.12 0.20 5.46R1 3/31/2014 14:08 <0.01 0.25 1.46 0.62 2.73 0.01 1.46 2.67 0.21 6.48R1 4/9/2014 10:38 0.00 0.25 1.46 0.62 2.74 0.01 1.44 2.67 0.20 6.38R1 4/16/2014 15:30 0.01 0.23 1.35 0.60 2.78 0.01 1.59 2.84 0.21 6.68R1 4/18/2014 11:00 0.00 0.20 1.23 0.55 2.56 0.01 1.41 2.65 0.20 6.50R2 3/25/2014 18:00 <0.01 0.28 1.56 0.62 2.91 0.01 1.46 2.87 0.21 6.49R2 3/25/2014 18:00 <0.01 0.27 1.55 0.62 2.90 0.01 1.47 2.86 0.21 6.49R2 3/27/2014 10:30 <0.01 0.26 1.60 0.66 3.04 0.01 1.57 2.98 0.21 6.88R2 3/31/2014 12:30 0.01 0.26 1.45 0.59 2.75 0.01 1.44 2.74 0.21 6.56R2 4/8/2014 10:20 0.00 0.25 1.46 0.58 2.74 0.01 1.38 2.66 0.21 6.10R2 4/15/2014 11:30 0.00 0.18 1.16 0.52 2.58 0.01 1.41 2.79 0.21 6.60R2 4/18/2014 10:20 0.00 0.21 1.37 0.56 2.81 0.01 1.43 2.80 0.23 6.49R3 3/26/2014 14:30 <0.01 0.27 1.46 0.58 2.69 0.01 1.37 2.62 0.19 6.45R3 3/26/2014 14:30 <0.01 0.25 1.39 0.57 2.63 0.01 1.35 2.58 0.20 6.08R3 3/28/2014 13:30 0.01 0.28 1.44 0.58 2.68 0.01 1.36 2.62 0.19 6.13R3 4/1/2014 16:10 0.00 0.20 1.18 0.50 2.39 0.01 1.27 2.46 0.18 5.61R3 4/10/2014 14:50 0.00 0.21 1.20 0.52 2.46 0.01 1.33 2.55 0.19 6.19R3 4/15/2014 14:15 0.00 0.25 1.31 0.54 2.55 0.01 1.35 2.59 0.19 6.22R3 4/17/2014 13:00 0.01 0.24 1.35 0.58 2.77 0.01 1.49 2.88 0.22 6.96R4 3/25/2014 14:30 <0.01 0.33 1.95 0.73 3.43 0.01 1.60 3.13 0.22 6.60R4 3/25/2014 14:30 <0.01 0.32 1.92 0.73 3.42 0.01 1.60 3.13 0.22 6.62R4 3/27/2014 11:50 <0.01 0.28 1.62 0.64 3.04 0.01 1.48 2.93 0.22 6.46R4 3/31/2014 11:20 <0.01 0.27 1.81 0.73 3.51 0.01 1.69 3.33 0.24 6.52R4 4/7/2014 13:45 0.00 0.13 1.09 0.51 2.60 0.01 1.37 2.74 0.20 5.97R4 4/16/2014 12:35 0.00 0.22 1.44 0.60 2.89 0.01 1.49 2.97 0.21 6.69R4 4/18/2014 12:05 0.00 0.20 1.35 0.58 2.84 0.01 1.47 2.93 0.21 6.62R5 3/26/2014 12:00 <0.01 0.19 1.10 0.50 2.39 0.01 1.33 2.60 0.18 6.36R5 3/26/2014 12:00 <0.01 0.22 1.20 0.53 2.46 0.01 1.34 2.60 0.18 6.29R5 3/28/2014 12:00 <0.01 0.21 1.17 0.52 2.44 0.01 1.33 2.60 0.19 6.33R5 4/1/2014 14:30 0.01 0.18 1.04 0.47 2.25 0.01 1.25 2.42 0.17 5.69R5 4/10/2014 13:15 0.01 0.23 1.25 0.54 2.50 0.01 1.34 2.59 0.18 6.21R5 4/15/2014 12:50 0.01 0.20 1.13 0.51 2.43 0.01 1.35 2.62 0.19 6.48R5 4/17/2014 11:40 0.00 0.17 1.02 0.48 2.30 0.01 1.30 2.54 0.19 6.33
Light Ends IP344 ‐ All results in liquid volume %
Appendix 8 ‐ Page 1 of 2
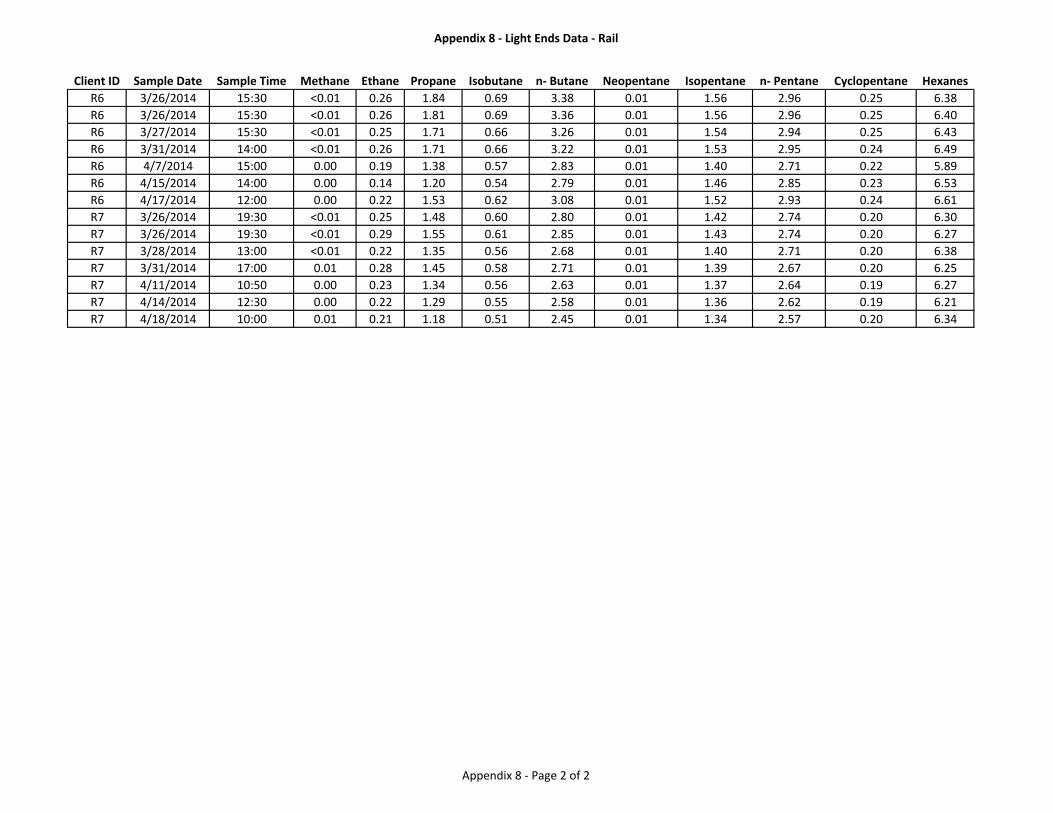
Appendix 8 ‐ Light Ends Data ‐ Rail
Client ID Sample Date Sample Time Methane Ethane Propane Isobutane n‐ Butane Neopentane Isopentane n‐ Pentane Cyclopentane HexanesR6 3/26/2014 15:30 <0.01 0.26 1.84 0.69 3.38 0.01 1.56 2.96 0.25 6.38R6 3/26/2014 15:30 <0.01 0.26 1.81 0.69 3.36 0.01 1.56 2.96 0.25 6.40R6 3/27/2014 15:30 <0.01 0.25 1.71 0.66 3.26 0.01 1.54 2.94 0.25 6.43R6 3/31/2014 14:00 <0.01 0.26 1.71 0.66 3.22 0.01 1.53 2.95 0.24 6.49R6 4/7/2014 15:00 0.00 0.19 1.38 0.57 2.83 0.01 1.40 2.71 0.22 5.89R6 4/15/2014 14:00 0.00 0.14 1.20 0.54 2.79 0.01 1.46 2.85 0.23 6.53R6 4/17/2014 12:00 0.00 0.22 1.53 0.62 3.08 0.01 1.52 2.93 0.24 6.61R7 3/26/2014 19:30 <0.01 0.25 1.48 0.60 2.80 0.01 1.42 2.74 0.20 6.30R7 3/26/2014 19:30 <0.01 0.29 1.55 0.61 2.85 0.01 1.43 2.74 0.20 6.27R7 3/28/2014 13:00 <0.01 0.22 1.35 0.56 2.68 0.01 1.40 2.71 0.20 6.38R7 3/31/2014 17:00 0.01 0.28 1.45 0.58 2.71 0.01 1.39 2.67 0.20 6.25R7 4/11/2014 10:50 0.00 0.23 1.34 0.56 2.63 0.01 1.37 2.64 0.19 6.27R7 4/14/2014 12:30 0.00 0.22 1.29 0.55 2.58 0.01 1.36 2.62 0.19 6.21R7 4/18/2014 10:00 0.01 0.21 1.18 0.51 2.45 0.01 1.34 2.57 0.20 6.34
Appendix 8 ‐ Page 2 of 2

Appendix 9 ‐ Light Ends Data ‐ Well
Client ID Sample Date Sample Time Methane Ethane Propane Isobutane n‐ Butane Neopentane Isopentane n‐ Pentane Cyclopentane HexanesW1 3/25/2014 19:45 0.01 0.31 1.77 0.65 3.12 0.01 1.46 2.73 0.25 6.02W1 3/25/2014 19:45 0.01 0.36 1.85 0.67 3.19 0.01 1.48 2.76 0.25 6.02W1 3/27/2014 18:15 0.01 0.30 1.58 0.60 2.94 0.01 1.42 2.68 0.25 6.04W1 3/30/2014 16:00 0.01 0.29 1.67 0.63 3.06 0.01 1.45 2.73 0.25 6.13W1 4/1/2014 11:00 0.01 0.31 1.59 0.59 2.88 0.01 1.39 2.64 0.24 5.94W1 4/7/2014 12:20 0.00 0.15 1.05 0.46 2.39 0.01 1.28 2.46 0.23 5.75W1 4/16/2014 11:30 0.01 0.25 1.50 0.60 2.96 0.01 1.47 2.78 0.26 6.37W2 3/26/2014 12:45 <0.01 0.30 1.68 0.61 3.00 0.01 1.42 2.71 0.24 6.10W2 3/26/2014 12:45 0.01 0.35 1.82 0.65 3.15 0.01 1.47 2.81 0.25 6.29W2 3/29/2014 15:00 0.01 0.30 1.76 0.63 3.05 0.01 1.42 2.73 0.24 6.14W2 3/31/2014 10:00 0.01 0.34 1.53 0.53 2.62 0.01 1.28 2.48 0.23 5.92W2 4/7/2014 13:05 0.00 0.21 1.52 0.56 2.75 0.01 1.31 2.52 0.23 5.43W2 4/16/2014 12:00 0.00 0.29 1.79 0.66 3.22 0.01 1.49 2.84 0.25 6.36W2 4/19/2014 9:00 0.00 0.26 1.78 0.66 3.18 0.01 1.46 2.77 0.24 6.12W3 3/25/2014 12:30 0.01 0.41 1.95 0.75 3.60 0.01 1.76 3.55 0.24 7.01W3 3/25/2014 12:30 0.01 0.37 1.76 0.68 3.26 0.01 1.59 3.21 0.21 6.79W3 3/27/2014 10:00 0.01 0.39 1.99 0.78 3.71 0.01 1.81 3.65 0.24 7.17W3 3/31/2014 10:00 <0.01 0.30 1.75 0.70 3.36 0.01 1.63 3.28 0.22 7.00W3 4/7/2014 12:50 0.00 0.18 1.20 0.54 2.68 0.01 1.38 2.82 0.19 5.95W3 4/16/2014 10:30 0.00 0.21 1.40 0.61 3.05 0.01 1.57 3.19 0.22 6.93W3 4/18/2014 11:20 0.00 0.24 1.49 0.64 3.13 0.01 1.58 3.21 0.22 6.91W4 3/26/2014 12:00 <0.01 0.17 1.65 0.66 3.33 0.01 1.54 2.87 0.26 6.22W4 3/26/2014 12:00 <0.01 0.16 1.62 0.65 3.32 0.01 1.53 2.85 0.26 6.19W4 3/28/2014 13:15 <0.01 0.16 1.61 0.66 3.36 0.01 1.57 2.43 0.26 6.34W4 4/3/2014 17:25 0.00 0.09 1.23 0.58 3.14 0.01 1.53 2.90 0.26 6.36W4 4/7/2014 18:14 0.00 0.08 1.13 0.55 2.94 0.00 1.49 2.79 0.25 6.13W4 4/15/2014 16:00 0.00 0.19 1.70 0.67 3.38 0.00 1.58 2.95 0.27 6.49W4 4/17/2014 14:30 0.01 0.33 2.38 0.81 3.89 0.01 1.66 3.02 0.30 6.31W5 3/26/2014 15:50 <0.01 0.11 1.44 0.65 3.49 0.01 1.66 3.14 0.28 6.77W5 3/26/2014 15:50 <0.01 0.12 1.52 0.67 3.56 0.01 1.68 3.17 0.28 6.81W5 3/28/2014 13:50 <0.01 0.15 1.54 0.66 3.50 0.01 1.66 3.15 0.28 6.84W5 4/4/2014 17:28 0.00 0.09 1.23 0.57 3.13 0.01 1.53 2.89 0.26 6.10W5 4/7/2014 19:08 0.00 0.12 1.42 0.63 3.36 0.01 1.61 3.06 0.27 6.60W5 4/15/2014 17:00 0.00 0.27 2.34 0.86 4.06 0.01 1.86 3.46 0.30 7.23W5 4/17/2014 15:30 0.00 0.27 2.42 0.88 4.41 0.01 1.88 3.51 0.29 7.19
Light Ends IP344 ‐ All results in liquid volume %
Appendix 9 ‐ Page 1 of 3
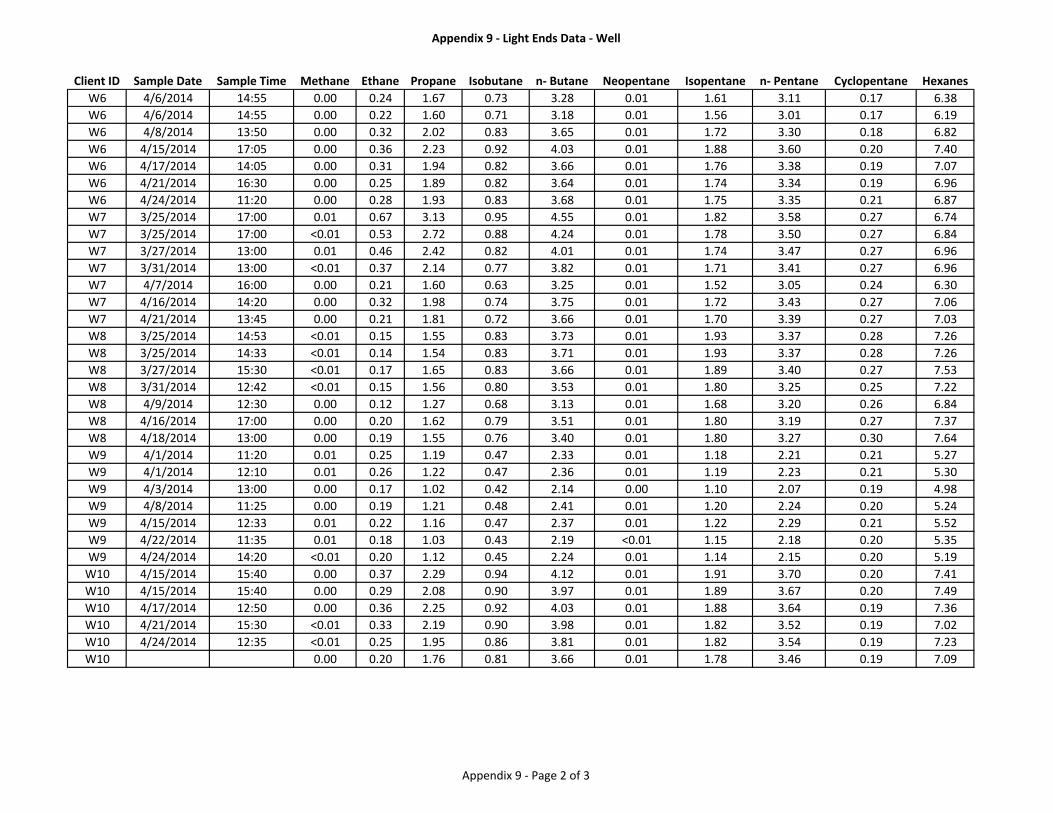
Appendix 9 ‐ Light Ends Data ‐ Well
Client ID Sample Date Sample Time Methane Ethane Propane Isobutane n‐ Butane Neopentane Isopentane n‐ Pentane Cyclopentane HexanesW6 4/6/2014 14:55 0.00 0.24 1.67 0.73 3.28 0.01 1.61 3.11 0.17 6.38W6 4/6/2014 14:55 0.00 0.22 1.60 0.71 3.18 0.01 1.56 3.01 0.17 6.19W6 4/8/2014 13:50 0.00 0.32 2.02 0.83 3.65 0.01 1.72 3.30 0.18 6.82W6 4/15/2014 17:05 0.00 0.36 2.23 0.92 4.03 0.01 1.88 3.60 0.20 7.40W6 4/17/2014 14:05 0.00 0.31 1.94 0.82 3.66 0.01 1.76 3.38 0.19 7.07W6 4/21/2014 16:30 0.00 0.25 1.89 0.82 3.64 0.01 1.74 3.34 0.19 6.96W6 4/24/2014 11:20 0.00 0.28 1.93 0.83 3.68 0.01 1.75 3.35 0.21 6.87W7 3/25/2014 17:00 0.01 0.67 3.13 0.95 4.55 0.01 1.82 3.58 0.27 6.74W7 3/25/2014 17:00 <0.01 0.53 2.72 0.88 4.24 0.01 1.78 3.50 0.27 6.84W7 3/27/2014 13:00 0.01 0.46 2.42 0.82 4.01 0.01 1.74 3.47 0.27 6.96W7 3/31/2014 13:00 <0.01 0.37 2.14 0.77 3.82 0.01 1.71 3.41 0.27 6.96W7 4/7/2014 16:00 0.00 0.21 1.60 0.63 3.25 0.01 1.52 3.05 0.24 6.30W7 4/16/2014 14:20 0.00 0.32 1.98 0.74 3.75 0.01 1.72 3.43 0.27 7.06W7 4/21/2014 13:45 0.00 0.21 1.81 0.72 3.66 0.01 1.70 3.39 0.27 7.03W8 3/25/2014 14:53 <0.01 0.15 1.55 0.83 3.73 0.01 1.93 3.37 0.28 7.26W8 3/25/2014 14:33 <0.01 0.14 1.54 0.83 3.71 0.01 1.93 3.37 0.28 7.26W8 3/27/2014 15:30 <0.01 0.17 1.65 0.83 3.66 0.01 1.89 3.40 0.27 7.53W8 3/31/2014 12:42 <0.01 0.15 1.56 0.80 3.53 0.01 1.80 3.25 0.25 7.22W8 4/9/2014 12:30 0.00 0.12 1.27 0.68 3.13 0.01 1.68 3.20 0.26 6.84W8 4/16/2014 17:00 0.00 0.20 1.62 0.79 3.51 0.01 1.80 3.19 0.27 7.37W8 4/18/2014 13:00 0.00 0.19 1.55 0.76 3.40 0.01 1.80 3.27 0.30 7.64W9 4/1/2014 11:20 0.01 0.25 1.19 0.47 2.33 0.01 1.18 2.21 0.21 5.27W9 4/1/2014 12:10 0.01 0.26 1.22 0.47 2.36 0.01 1.19 2.23 0.21 5.30W9 4/3/2014 13:00 0.00 0.17 1.02 0.42 2.14 0.00 1.10 2.07 0.19 4.98W9 4/8/2014 11:25 0.00 0.19 1.21 0.48 2.41 0.01 1.20 2.24 0.20 5.24W9 4/15/2014 12:33 0.01 0.22 1.16 0.47 2.37 0.01 1.22 2.29 0.21 5.52W9 4/22/2014 11:35 0.01 0.18 1.03 0.43 2.19 <0.01 1.15 2.18 0.20 5.35W9 4/24/2014 14:20 <0.01 0.20 1.12 0.45 2.24 0.01 1.14 2.15 0.20 5.19W10 4/15/2014 15:40 0.00 0.37 2.29 0.94 4.12 0.01 1.91 3.70 0.20 7.41W10 4/15/2014 15:40 0.00 0.29 2.08 0.90 3.97 0.01 1.89 3.67 0.20 7.49W10 4/17/2014 12:50 0.00 0.36 2.25 0.92 4.03 0.01 1.88 3.64 0.19 7.36W10 4/21/2014 15:30 <0.01 0.33 2.19 0.90 3.98 0.01 1.82 3.52 0.19 7.02W10 4/24/2014 12:35 <0.01 0.25 1.95 0.86 3.81 0.01 1.82 3.54 0.19 7.23W10 0.00 0.20 1.76 0.81 3.66 0.01 1.78 3.46 0.19 7.09
Appendix 9 ‐ Page 2 of 3
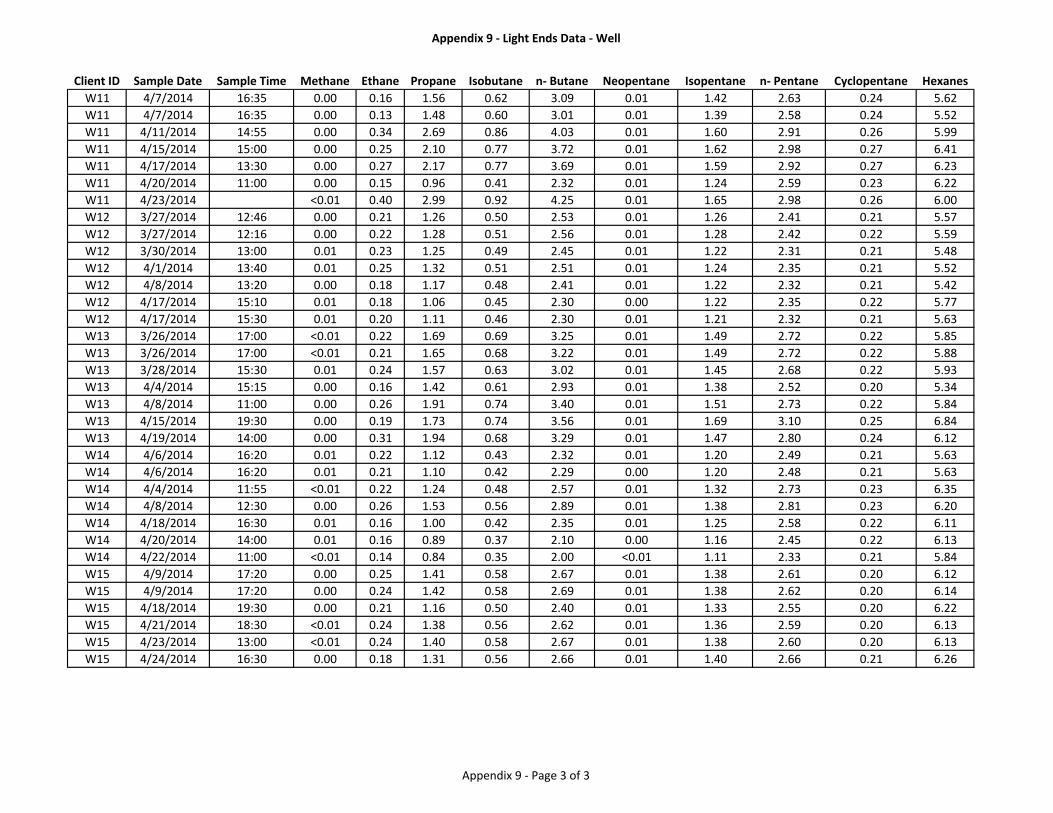
Appendix 9 ‐ Light Ends Data ‐ Well
Client ID Sample Date Sample Time Methane Ethane Propane Isobutane n‐ Butane Neopentane Isopentane n‐ Pentane Cyclopentane HexanesW11 4/7/2014 16:35 0.00 0.16 1.56 0.62 3.09 0.01 1.42 2.63 0.24 5.62W11 4/7/2014 16:35 0.00 0.13 1.48 0.60 3.01 0.01 1.39 2.58 0.24 5.52W11 4/11/2014 14:55 0.00 0.34 2.69 0.86 4.03 0.01 1.60 2.91 0.26 5.99W11 4/15/2014 15:00 0.00 0.25 2.10 0.77 3.72 0.01 1.62 2.98 0.27 6.41W11 4/17/2014 13:30 0.00 0.27 2.17 0.77 3.69 0.01 1.59 2.92 0.27 6.23W11 4/20/2014 11:00 0.00 0.15 0.96 0.41 2.32 0.01 1.24 2.59 0.23 6.22W11 4/23/2014 <0.01 0.40 2.99 0.92 4.25 0.01 1.65 2.98 0.26 6.00W12 3/27/2014 12:46 0.00 0.21 1.26 0.50 2.53 0.01 1.26 2.41 0.21 5.57W12 3/27/2014 12:16 0.00 0.22 1.28 0.51 2.56 0.01 1.28 2.42 0.22 5.59W12 3/30/2014 13:00 0.01 0.23 1.25 0.49 2.45 0.01 1.22 2.31 0.21 5.48W12 4/1/2014 13:40 0.01 0.25 1.32 0.51 2.51 0.01 1.24 2.35 0.21 5.52W12 4/8/2014 13:20 0.00 0.18 1.17 0.48 2.41 0.01 1.22 2.32 0.21 5.42W12 4/17/2014 15:10 0.01 0.18 1.06 0.45 2.30 0.00 1.22 2.35 0.22 5.77W12 4/17/2014 15:30 0.01 0.20 1.11 0.46 2.30 0.01 1.21 2.32 0.21 5.63W13 3/26/2014 17:00 <0.01 0.22 1.69 0.69 3.25 0.01 1.49 2.72 0.22 5.85W13 3/26/2014 17:00 <0.01 0.21 1.65 0.68 3.22 0.01 1.49 2.72 0.22 5.88W13 3/28/2014 15:30 0.01 0.24 1.57 0.63 3.02 0.01 1.45 2.68 0.22 5.93W13 4/4/2014 15:15 0.00 0.16 1.42 0.61 2.93 0.01 1.38 2.52 0.20 5.34W13 4/8/2014 11:00 0.00 0.26 1.91 0.74 3.40 0.01 1.51 2.73 0.22 5.84W13 4/15/2014 19:30 0.00 0.19 1.73 0.74 3.56 0.01 1.69 3.10 0.25 6.84W13 4/19/2014 14:00 0.00 0.31 1.94 0.68 3.29 0.01 1.47 2.80 0.24 6.12W14 4/6/2014 16:20 0.01 0.22 1.12 0.43 2.32 0.01 1.20 2.49 0.21 5.63W14 4/6/2014 16:20 0.01 0.21 1.10 0.42 2.29 0.00 1.20 2.48 0.21 5.63W14 4/4/2014 11:55 <0.01 0.22 1.24 0.48 2.57 0.01 1.32 2.73 0.23 6.35W14 4/8/2014 12:30 0.00 0.26 1.53 0.56 2.89 0.01 1.38 2.81 0.23 6.20W14 4/18/2014 16:30 0.01 0.16 1.00 0.42 2.35 0.01 1.25 2.58 0.22 6.11W14 4/20/2014 14:00 0.01 0.16 0.89 0.37 2.10 0.00 1.16 2.45 0.22 6.13W14 4/22/2014 11:00 <0.01 0.14 0.84 0.35 2.00 <0.01 1.11 2.33 0.21 5.84W15 4/9/2014 17:20 0.00 0.25 1.41 0.58 2.67 0.01 1.38 2.61 0.20 6.12W15 4/9/2014 17:20 0.00 0.24 1.42 0.58 2.69 0.01 1.38 2.62 0.20 6.14W15 4/18/2014 19:30 0.00 0.21 1.16 0.50 2.40 0.01 1.33 2.55 0.20 6.22W15 4/21/2014 18:30 <0.01 0.24 1.38 0.56 2.62 0.01 1.36 2.59 0.20 6.13W15 4/23/2014 13:00 <0.01 0.24 1.40 0.58 2.67 0.01 1.38 2.60 0.20 6.13W15 4/24/2014 16:30 0.00 0.18 1.31 0.56 2.66 0.01 1.40 2.66 0.21 6.26
Appendix 9 ‐ Page 3 of 3

Appendix 10 ‐ Simulated Distillation Data ‐ Rail
Client ID Sample Date Sample Time SimDis IBP 5% 10% 20% 30% 40% 50% 60% 70% 80% 90% 95% FBPRecovery (weight %)
Additional Comments ‐ Field or Lab
R1 3/25/2014 17:20 <97 151 186 264 343 430 517 609 710 823 967 1071 1278 100.0 Oil Temp 35°FR1 3/25/2014 17:00 <97 151 183 263 346 436 527 623 730 850 1012 1150 >1382 97.6R1 3/27/2014 17:26 <97 104 176 252 332 423 513 608 713 828 973 1076 1307 100.0R1 3/31/2014 14:08 <97 127 177 239 315 391 473 559 650 760 903 1009 1217 100.0R1 4/9/2014 10:38 <97 <97 153 222 300 376 459 549 647 761 909 1019 1246 100.0R1 4/16/2014 15:30R1 4/18/2014 11:00R2 3/25/2014 18:00 <97 135 168 235 313 388 470 557 651 763 909 1017 1226 100.0R2 3/25/2014 18:00 <97 138 178 246 320 388 477 564 659 772 921 1033 1317 99.7R2 3/27/2014 10:30 <97 98 158 223 289 364 443 527 620 733 888 1013 >1382 99.1R2 3/31/2014 12:30 <97 107 164 232 302 376 454 540 630 742 889 1000 1219 100.0R2 4/8/2014 10:20 <97 <97 143 216 295 379 468 561 664 783 936 1048 1257 100.0R2 4/15/2014 11:30R2 4/18/2014 10:20R3 3/26/2014 14:30 <97 112 175 245 325 405 488 576 675 788 933 1039 1244 100.0 Oil Temp 37°FR3 3/26/2014 14:30 <97 146 177 251 326 408 492 581 679 791 935 1040 1256 100.0 Oil Temp 37°FR3 3/28/2014 13:30 <97 <97 157 235 317 403 490 583 686 805 957 1073 1309 100.0 Oil Temp 49°FR3 4/1/2014 16:10 <97 <97 162 235 320 405 496 591 696 820 994 1180 >1382 95.9R3 4/10/2014 14:50 <97 <97 158 238 317 398 486 577 678 795 946 1062 >1382 99.1R3 4/15/2014 14:15R3 4/17/2014 13:00R4 3/25/2014 14:30 <97 111 156 234 314 393 480 573 674 796 962 1107 >1382 99.8R4 3/25/2014 14:30 <97 133 167 237 318 399 484 574 673 792 950 1077 >1382 98.9R4 3/27/2014 11:50 <97 <97 163 238 320 403 489 581 682 800 954 1072 1318 100.0R4 3/31/2014 11:20 <97 103 168 239 318 399 486 575 674 791 945 1065 >1382 99.1R4 4/7/2014 13:45 <97 <97 157 233 305 385 474 563 663 779 925 1029 1220 100.0R4 4/16/2014 12:35R4 4/18/2014 12:05R5 3/26/2014 12:00 <97 117 168 236 314 390 475 563 660 775 927 1049 >1382 98.7R5 3/26/2014 12:00 <97 <97 159 234 315 394 481 575 675 796 959 1089 1341 100.0R5 3/28/2014 12:00 <97 <97 160 233 311 389 475 564 662 777 924 1037 1276 100.0R5 4/1/2014 14:30 <97 <97 151 227 306 385 474 569 671 792 957 1116 >1382 96.6R5 4/10/2014 13:15 <97 <97 158 236 306 385 466 555 651 764 910 1019 1272 99.8R5 4/15/2014 12:50R5 4/17/2014 11:40
Simulated Distillation by ASTM D7169‐ All results reported in °F
Appendix 10 ‐ Page 1 of 2
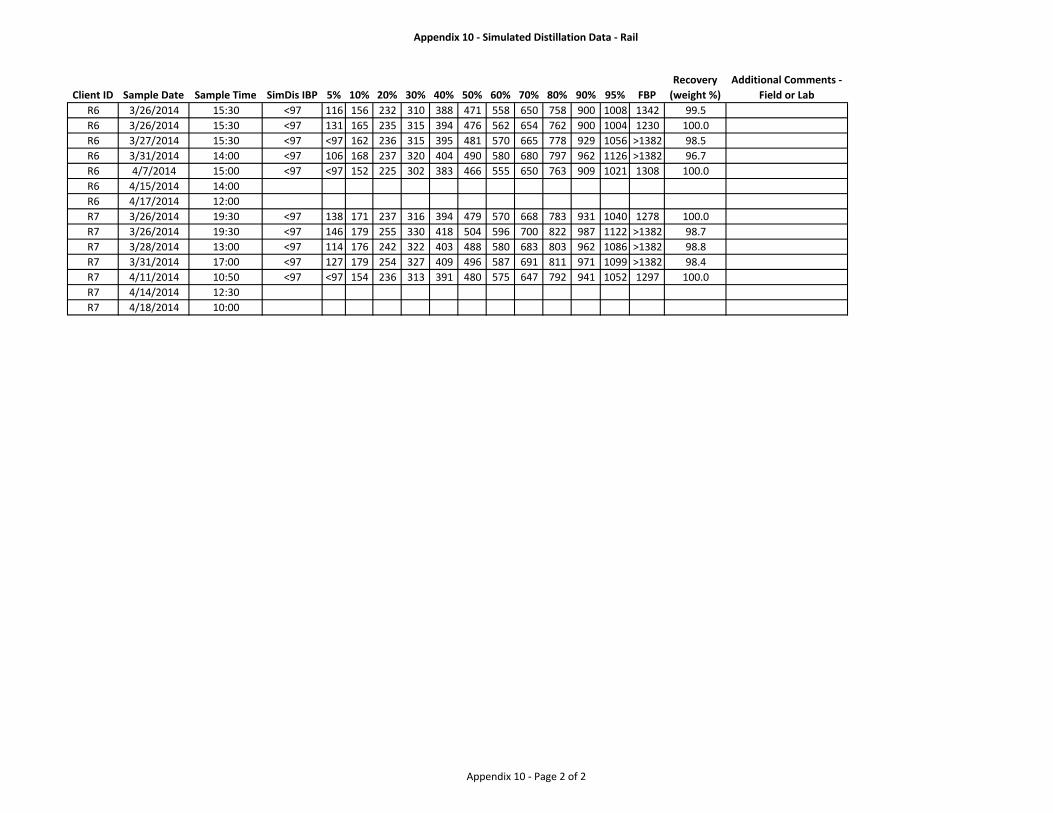
Appendix 10 ‐ Simulated Distillation Data ‐ Rail
Client ID Sample Date Sample Time SimDis IBP 5% 10% 20% 30% 40% 50% 60% 70% 80% 90% 95% FBPRecovery (weight %)
Additional Comments ‐ Field or Lab
R6 3/26/2014 15:30 <97 116 156 232 310 388 471 558 650 758 900 1008 1342 99.5R6 3/26/2014 15:30 <97 131 165 235 315 394 476 562 654 762 900 1004 1230 100.0R6 3/27/2014 15:30 <97 <97 162 236 315 395 481 570 665 778 929 1056 >1382 98.5R6 3/31/2014 14:00 <97 106 168 237 320 404 490 580 680 797 962 1126 >1382 96.7R6 4/7/2014 15:00 <97 <97 152 225 302 383 466 555 650 763 909 1021 1308 100.0R6 4/15/2014 14:00R6 4/17/2014 12:00R7 3/26/2014 19:30 <97 138 171 237 316 394 479 570 668 783 931 1040 1278 100.0R7 3/26/2014 19:30 <97 146 179 255 330 418 504 596 700 822 987 1122 >1382 98.7R7 3/28/2014 13:00 <97 114 176 242 322 403 488 580 683 803 962 1086 >1382 98.8R7 3/31/2014 17:00 <97 127 179 254 327 409 496 587 691 811 971 1099 >1382 98.4R7 4/11/2014 10:50 <97 <97 154 236 313 391 480 575 647 792 941 1052 1297 100.0R7 4/14/2014 12:30R7 4/18/2014 10:00
Appendix 10 ‐ Page 2 of 2

Appendix 11 ‐ Simulated Distillation Data ‐ Well
Client ID Sample Date Sample Time SimDis IBP 5% 10% 20% 30% 40% 50% 60% 70% 80% 90% 95% FBPRecovery (weight %)
Additional Comments ‐ Field or Lab
W1 3/25/2014 19:45 <97 135 178 259 342 428 517 610 713 827 974 1086 1329 100.0W1 3/25/2014 19:45 <97 150 188 272 355 442 531 623 725 839 987 1102 1337 100.0W1 3/27/2014 18:15 <97 119 179 257 334 422 510 601 703 815 958 1071 >1382 98.8W1 3/30/2014 16:00 <97 142 180 262 344 432 524 621 726 846 1011 1176 >1382 96.7W1 4/1/2014 11:00 <97 <97 148 224 310 396 488 584 688 803 947 1050 1248 100.0W1 4/7/2014 12:20W1 4/16/2014 11:30W2 3/26/2014 12:45 <97 143 179 261 342 424 508 596 693 803 952 1072 1328 100.0W2 3/26/2014 12:45 <97 140 184 263 342 422 505 590 685 793 937 1050 1303 100.0W2 3/29/2014 15:00 <97 108 165 237 318 400 482 569 661 768 903 1004 1248 99.7W2 3/31/2014 10:00 <97 136 178 255 329 412 492 577 670 774 910 1013 1244 100.0W2 4/7/2014 13:05 <97 <97 154 235 316 398 481 570 664 772 911 1018 1316 100.0W2 4/16/2014 12:00W2 4/19/2014 9:00W3 3/25/2014 12:30 <97 <97 157 232 304 383 462 548 639 748 895 1016 >1382 98.6W3 3/25/2014 12:30 <97 <97 161 234 310 384 464 547 638 744 886 995 1283 99.8W3 3/27/2014 10:00 <97 <97 159 230 300 374 456 545 638 750 903 1037 >1382 98.1W3 3/31/2014 10:00 <97 97 159 230 298 371 453 537 629 737 879 990 >1382 99.4W3 4/7/2014 12:50 <97 <97 154 224 297 372 453 537 628 737 880 992 1329 100.0W3 4/16/2014 10:30W3 4/18/2014 11:20W4 3/26/2014 12:00 <97 100 158 236 318 406 491 579 675 788 940 1076 >1382 97.7W4 3/26/2014 12:00 <97 110 165 239 319 405 488 575 667 774 914 1023 >1382 99.4W4 3/28/2014 13:15 <97 119 169 243 322 409 493 581 678 792 947 1082 >1382 98.2W4 4/3/2014 17:25 <97 <97 104 207 286 373 460 552 648 760 904 1014 1273 100.0W4 4/7/2014 18:14 <97 <97 152 233 315 402 490 582 683 801 966 1121 >1382 98.3W4 4/15/2014 16:00W4 4/17/2014 14:30W5 3/26/2014 15:50 <97 101 160 234 312 390 475 562 656 767 914 1028 1289 100.0W5 3/26/2014 15:50 <97 <97 146 216 292 374 458 548 642 753 898 1008 1257 100.0W5 3/28/2014 13:50 <97 <97 156 225 300 377 458 547 640 751 896 1010 1272 100.0W5 4/4/2014 17:28 <97 <97 132 205 280 366 454 548 645 757 903 1020 >1382 98.7W5 4/7/2014 19:08 <97 <97 135 209 285 364 448 538 633 747 894 1009 1322 100.0W5 4/15/2014 17:00W5 4/17/2014 15:30W6 4/6/2014 14:55 <97 <97 129 204 277 349 436 528 629 751 914 1037 >1382 98.9W6 4/6/2014 14:55 <97 <97 103 189 264 336 420 513 613 734 891 1004 1218 99.9W6 4/8/2014 13:50 <97 <97 156 236 304 377 461 554 658 789 977 1157 >1382 96.6W6 4/15/2014 17:05 <97 <97 <97 188 257 331 419 510 611 734 895 1010 1217 100.0W6 4/17/2014 14:05 <97 <97 145 206 278 348 433 521 622 741 899 1011 1214 100.0W6 4/21/2014 16:30W6 4/24/2014 11:20
Simulated Distillation by ASTM D7169‐ All results reported in °F
Appendix 11 ‐ Page 1 of 3
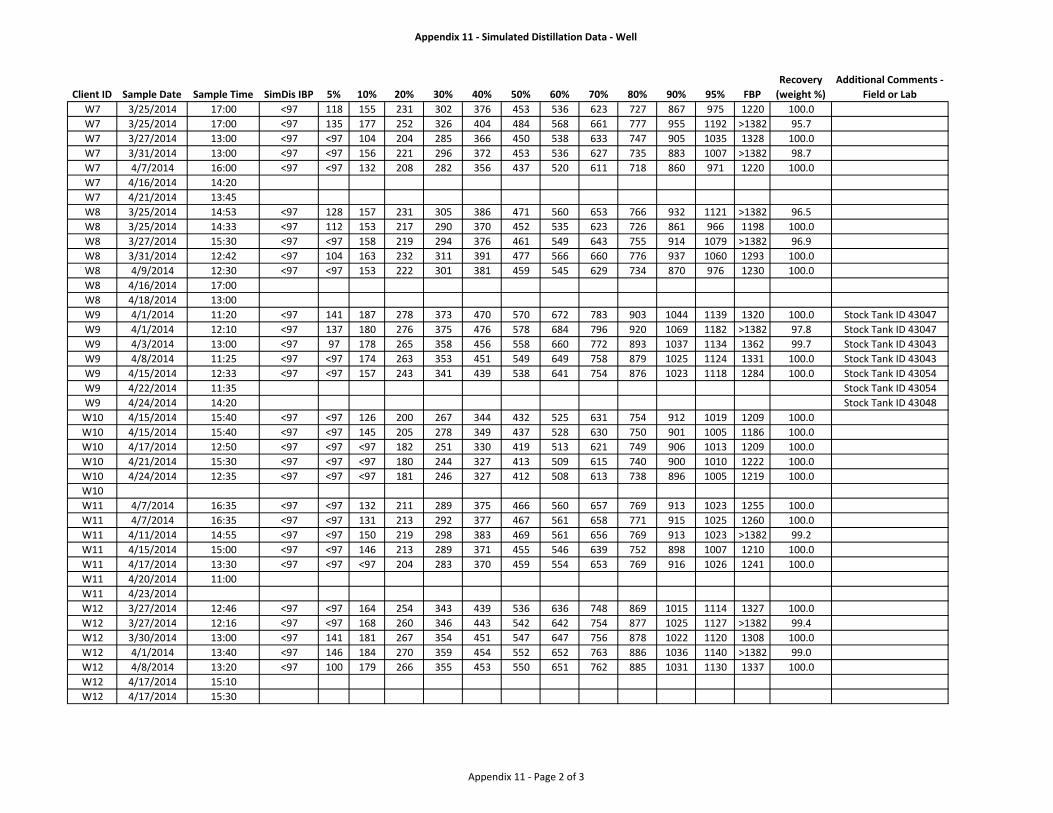
Appendix 11 ‐ Simulated Distillation Data ‐ Well
Client ID Sample Date Sample Time SimDis IBP 5% 10% 20% 30% 40% 50% 60% 70% 80% 90% 95% FBPRecovery (weight %)
Additional Comments ‐ Field or Lab
W7 3/25/2014 17:00 <97 118 155 231 302 376 453 536 623 727 867 975 1220 100.0W7 3/25/2014 17:00 <97 135 177 252 326 404 484 568 661 777 955 1192 >1382 95.7W7 3/27/2014 13:00 <97 <97 104 204 285 366 450 538 633 747 905 1035 1328 100.0W7 3/31/2014 13:00 <97 <97 156 221 296 372 453 536 627 735 883 1007 >1382 98.7W7 4/7/2014 16:00 <97 <97 132 208 282 356 437 520 611 718 860 971 1220 100.0W7 4/16/2014 14:20W7 4/21/2014 13:45W8 3/25/2014 14:53 <97 128 157 231 305 386 471 560 653 766 932 1121 >1382 96.5W8 3/25/2014 14:33 <97 112 153 217 290 370 452 535 623 726 861 966 1198 100.0W8 3/27/2014 15:30 <97 <97 158 219 294 376 461 549 643 755 914 1079 >1382 96.9W8 3/31/2014 12:42 <97 104 163 232 311 391 477 566 660 776 937 1060 1293 100.0W8 4/9/2014 12:30 <97 <97 153 222 301 381 459 545 629 734 870 976 1230 100.0W8 4/16/2014 17:00W8 4/18/2014 13:00W9 4/1/2014 11:20 <97 141 187 278 373 470 570 672 783 903 1044 1139 1320 100.0 Stock Tank ID 43047W9 4/1/2014 12:10 <97 137 180 276 375 476 578 684 796 920 1069 1182 >1382 97.8 Stock Tank ID 43047W9 4/3/2014 13:00 <97 97 178 265 358 456 558 660 772 893 1037 1134 1362 99.7 Stock Tank ID 43043W9 4/8/2014 11:25 <97 <97 174 263 353 451 549 649 758 879 1025 1124 1331 100.0 Stock Tank ID 43043W9 4/15/2014 12:33 <97 <97 157 243 341 439 538 641 754 876 1023 1118 1284 100.0 Stock Tank ID 43054W9 4/22/2014 11:35 Stock Tank ID 43054W9 4/24/2014 14:20 Stock Tank ID 43048W10 4/15/2014 15:40 <97 <97 126 200 267 344 432 525 631 754 912 1019 1209 100.0W10 4/15/2014 15:40 <97 <97 145 205 278 349 437 528 630 750 901 1005 1186 100.0W10 4/17/2014 12:50 <97 <97 <97 182 251 330 419 513 621 749 906 1013 1209 100.0W10 4/21/2014 15:30 <97 <97 <97 180 244 327 413 509 615 740 900 1010 1222 100.0W10 4/24/2014 12:35 <97 <97 <97 181 246 327 412 508 613 738 896 1005 1219 100.0W10W11 4/7/2014 16:35 <97 <97 132 211 289 375 466 560 657 769 913 1023 1255 100.0W11 4/7/2014 16:35 <97 <97 131 213 292 377 467 561 658 771 915 1025 1260 100.0W11 4/11/2014 14:55 <97 <97 150 219 298 383 469 561 656 769 913 1023 >1382 99.2W11 4/15/2014 15:00 <97 <97 146 213 289 371 455 546 639 752 898 1007 1210 100.0W11 4/17/2014 13:30 <97 <97 <97 204 283 370 459 554 653 769 916 1026 1241 100.0W11 4/20/2014 11:00W11 4/23/2014W12 3/27/2014 12:46 <97 <97 164 254 343 439 536 636 748 869 1015 1114 1327 100.0W12 3/27/2014 12:16 <97 <97 168 260 346 443 542 642 754 877 1025 1127 >1382 99.4W12 3/30/2014 13:00 <97 141 181 267 354 451 547 647 756 878 1022 1120 1308 100.0W12 4/1/2014 13:40 <97 146 184 270 359 454 552 652 763 886 1036 1140 >1382 99.0W12 4/8/2014 13:20 <97 100 179 266 355 453 550 651 762 885 1031 1130 1337 100.0W12 4/17/2014 15:10W12 4/17/2014 15:30
Appendix 11 ‐ Page 2 of 3

Appendix 11 ‐ Simulated Distillation Data ‐ Well
Client ID Sample Date Sample Time SimDis IBP 5% 10% 20% 30% 40% 50% 60% 70% 80% 90% 95% FBPRecovery (weight %)
Additional Comments ‐ Field or Lab
W13 3/26/2014 17:00 <97 110 165 240 327 418 503 589 684 792 938 1063 >1382 98.5W13 3/26/2014 17:00 <97 <97 155 231 313 403 490 578 674 783 924 1042 >1382 98.9W13 3/28/2014 15:30 <97 120 175 247 332 425 514 602 702 814 978 1165 >1382 96.5W13 4/4/2014 15:15 <97 <97 136 219 303 394 488 582 683 797 959 1141 >1382 96.2W13 4/8/2014 11:00 <97 <97 154 233 313 400 488 576 670 777 913 1018 1270 100.0W13 4/15/2014 19:30W13 4/19/2014 14:00W14 4/6/2014 16:20 <97 <97 149 229 315 397 484 574 670 780 926 1044 >1382 99.5W14 4/6/2014 16:20 <97 <97 168 248 325 409 495 584 679 789 936 1053 1298 100.0W14 4/4/2014 11:55 <97 <97 137 217 300 384 473 563 661 774 923 1039 1262 100.0W14 4/8/2014 12:30 <97 <97 155 236 315 392 477 565 660 768 910 1018 1257 100.0W14 4/18/2014 16:30 <97 98 174 244 328 411 496 585 681 790 931 1035 1225 100.0W14 4/20/2014 14:00 <97 110 181 250 331 416 500 587 683 792 931 1035 1225 100.0W14 4/22/2014 11:00 <97 <97 153 238 320 403 489 579 677 789 932 1040 1262 100.0W15 4/9/2014 17:20 <97 <97 158 237 313 390 477 570 671 789 942 1053 1282 100.0W15 4/9/2014 17:20 <97 <97 154 235 309 388 476 570 672 790 945 1058 1307 100.0W15 4/18/2014 19:30 <97 <97 153 232 307 389 478 572 674 794 947 1054 1251 100.0W15 4/21/2014 18:30 <97 <97 147 221 301 383 472 566 670 791 946 1055 1263 100.0W15 4/23/2014 13:00W15 4/24/2014 16:30
Appendix 11 ‐ Page 3 of 3
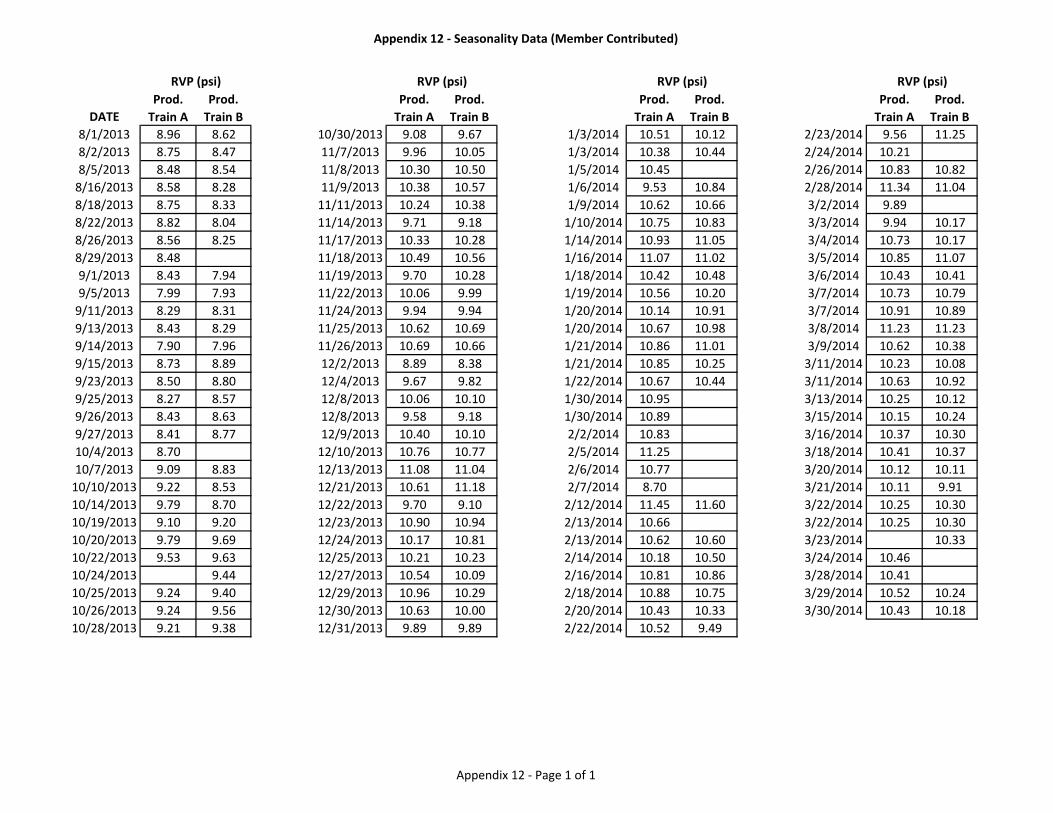
Appendix 12 ‐ Seasonality Data (Member Contributed)
DATEProd. Train A
Prod. Train B
Prod. Train A
Prod. Train B
Prod. Train A
Prod. Train B
Prod. Train A
Prod. Train B
8/1/2013 8.96 8.62 10/30/2013 9.08 9.67 1/3/2014 10.51 10.12 2/23/2014 9.56 11.258/2/2013 8.75 8.47 11/7/2013 9.96 10.05 1/3/2014 10.38 10.44 2/24/2014 10.218/5/2013 8.48 8.54 11/8/2013 10.30 10.50 1/5/2014 10.45 2/26/2014 10.83 10.828/16/2013 8.58 8.28 11/9/2013 10.38 10.57 1/6/2014 9.53 10.84 2/28/2014 11.34 11.048/18/2013 8.75 8.33 11/11/2013 10.24 10.38 1/9/2014 10.62 10.66 3/2/2014 9.898/22/2013 8.82 8.04 11/14/2013 9.71 9.18 1/10/2014 10.75 10.83 3/3/2014 9.94 10.178/26/2013 8.56 8.25 11/17/2013 10.33 10.28 1/14/2014 10.93 11.05 3/4/2014 10.73 10.178/29/2013 8.48 11/18/2013 10.49 10.56 1/16/2014 11.07 11.02 3/5/2014 10.85 11.079/1/2013 8.43 7.94 11/19/2013 9.70 10.28 1/18/2014 10.42 10.48 3/6/2014 10.43 10.419/5/2013 7.99 7.93 11/22/2013 10.06 9.99 1/19/2014 10.56 10.20 3/7/2014 10.73 10.799/11/2013 8.29 8.31 11/24/2013 9.94 9.94 1/20/2014 10.14 10.91 3/7/2014 10.91 10.899/13/2013 8.43 8.29 11/25/2013 10.62 10.69 1/20/2014 10.67 10.98 3/8/2014 11.23 11.239/14/2013 7.90 7.96 11/26/2013 10.69 10.66 1/21/2014 10.86 11.01 3/9/2014 10.62 10.389/15/2013 8.73 8.89 12/2/2013 8.89 8.38 1/21/2014 10.85 10.25 3/11/2014 10.23 10.089/23/2013 8.50 8.80 12/4/2013 9.67 9.82 1/22/2014 10.67 10.44 3/11/2014 10.63 10.929/25/2013 8.27 8.57 12/8/2013 10.06 10.10 1/30/2014 10.95 3/13/2014 10.25 10.129/26/2013 8.43 8.63 12/8/2013 9.58 9.18 1/30/2014 10.89 3/15/2014 10.15 10.249/27/2013 8.41 8.77 12/9/2013 10.40 10.10 2/2/2014 10.83 3/16/2014 10.37 10.3010/4/2013 8.70 12/10/2013 10.76 10.77 2/5/2014 11.25 3/18/2014 10.41 10.3710/7/2013 9.09 8.83 12/13/2013 11.08 11.04 2/6/2014 10.77 3/20/2014 10.12 10.1110/10/2013 9.22 8.53 12/21/2013 10.61 11.18 2/7/2014 8.70 3/21/2014 10.11 9.9110/14/2013 9.79 8.70 12/22/2013 9.70 9.10 2/12/2014 11.45 11.60 3/22/2014 10.25 10.3010/19/2013 9.10 9.20 12/23/2013 10.90 10.94 2/13/2014 10.66 3/22/2014 10.25 10.3010/20/2013 9.79 9.69 12/24/2013 10.17 10.81 2/13/2014 10.62 10.60 3/23/2014 10.3310/22/2013 9.53 9.63 12/25/2013 10.21 10.23 2/14/2014 10.18 10.50 3/24/2014 10.4610/24/2013 9.44 12/27/2013 10.54 10.09 2/16/2014 10.81 10.86 3/28/2014 10.4110/25/2013 9.24 9.40 12/29/2013 10.96 10.29 2/18/2014 10.88 10.75 3/29/2014 10.52 10.2410/26/2013 9.24 9.56 12/30/2013 10.63 10.00 2/20/2014 10.43 10.33 3/30/2014 10.43 10.1810/28/2013 9.21 9.38 12/31/2013 9.89 9.89 2/22/2014 10.52 9.49
RVP (psi) RVP (psi) RVP (psi) RVP (psi)
Appendix 12 ‐ Page 1 of 1
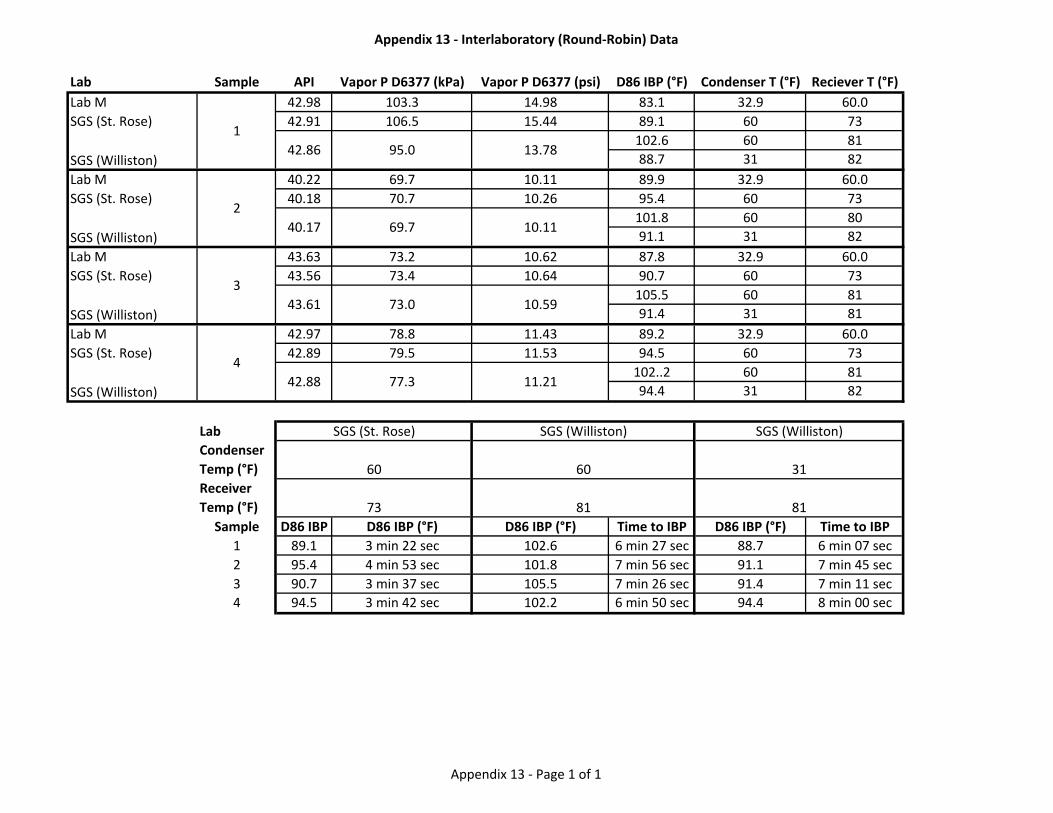
Appendix 13 ‐ Interlaboratory (Round‐Robin) Data
Lab Sample API Vapor P D6377 (kPa) Vapor P D6377 (psi) D86 IBP (°F) Condenser T (°F) Reciever T (°F)Lab M 42.98 103.3 14.98 83.1 32.9 60.0SGS (St. Rose) 42.91 106.5 15.44 89.1 60 73
102.6 60 8188.7 31 82
Lab M 40.22 69.7 10.11 89.9 32.9 60.0SGS (St. Rose) 40.18 70.7 10.26 95.4 60 73
101.8 60 8091.1 31 82
Lab M 43.63 73.2 10.62 87.8 32.9 60.0SGS (St. Rose) 43.56 73.4 10.64 90.7 60 73
105.5 60 8191.4 31 81
Lab M 42.97 78.8 11.43 89.2 32.9 60.0SGS (St. Rose) 42.89 79.5 11.53 94.5 60 73
102..2 60 8194.4 31 82
LabCondenser Temp (°F)Receiver Temp (°F)
Sample D86 IBP D86 IBP (°F) D86 IBP (°F) Time to IBP D86 IBP (°F) Time to IBP1 89.1 3 min 22 sec 102.6 6 min 27 sec 88.7 6 min 07 sec2 95.4 4 min 53 sec 101.8 7 min 56 sec 91.1 7 min 45 sec3 90.7 3 min 37 sec 105.5 7 min 26 sec 91.4 7 min 11 sec4 94.5 3 min 42 sec 102.2 6 min 50 sec 94.4 8 min 00 sec
31
SGS (Williston)SGS (Williston)
SGS (Williston)
SGS (Williston)
SGS (Williston)
SGS (Williston) 43.61
4
3
2
1
42.88
81
10.59
40.17
42.86 95.0 13.78
10.1169.7
73.0
11.2177.3
SGS (St. Rose)
60
73
60
81
Appendix 13 ‐ Page 1 of 1
Appendix 14 – Glossary of Terms
Page 1 of 2
AFPM – American Fuel & Petrochemical Manufacturers API – American Petroleum Institute ASTM – American Society for Testing and Materials BKN – Bakken BS&W – Basic Sediment & Water DOT – Department of Transportation EPA – Environmental Protection Agency FPCs – Floating Piston Cylinders H2S – Hydrogen Sulfide IBP – Initial Boiling Point LLS – Light Louisiana Sweet LPG - Liquefied Petroleum Gas LTO – Light Tight Oil NACE – National Association of Corrosion Engineers ND – North Dakota NDPC – North Dakota Petroleum Council NGL – Natural Gas Liquids PG – Packing Group PHMSA – Pipeline and Hazardous Safety Materials Administration psi – Pounds per Square Inch psig – Pounds per Square Inch Gauge QA/QC – Quality Assurance/ Quality Control RVP – Reid Vapor Pressure SGS – Laboratory Testing Provider
Appendix 14 – Glossary of Terms
Page 2 of 2
SimDist – Simulated Distillation TAN – Total Acid Number TM&C – Turner, Mason & Company VPCR – ASTM D6377 Vapor Pressure WTI – West Texas Intermediate
Related Documents