WP/15/254 The Nordic Labor Market and Migration by Giang Ho and Kazuko Shirono

Welcome message from author
This document is posted to help you gain knowledge. Please leave a comment to let me know what you think about it! Share it to your friends and learn new things together.
Transcript

WP/15/254
The Nordic Labor Market and Migration
by Giang Ho and Kazuko Shirono
© 2015 International Monetary Fund WP/15/254
IMF Working Paper
European Department
The Nordic Labor Market and Migration
Prepared by Giang Ho and Kazuko Shirono1
Authorized for distribution by Craig Beaumont
December 2015
Abstract
The large influx of migrants to Nordic countries in recent years is challenging the adoptability of Nordic labor market institutions while also adding to potential growth. This paper examines the trends, economic drivers, and labor market implications of migration to Nordic countries with a particular focus on economic migration as distinct from the recent large flows of asylum seekers. Our analysis finds that migration inflows to the Nordics are influenced by both cyclical and structural factors. Although migration helpfully dampens overheating pressures during periods of strong demand, and over the longer term will cushion the decline in labor supply from population aging, in the near-term unemployment can rise, especially among the young and lower-skilled. The analysis highlights the need to adapt Nordic labor market institutions in a manner that better facilitates the integration of migrants into employment. In particular, greater wage flexibility at the firm level and continued strong active labor market measures will help improve labor market outcomes among immigrants.
JEL Classification Numbers: J08, J11, J15, J21, E02, E24
Keywords: Nordic countries; migration; labor market; unemployment; Nordic model; Denmark; Finland; Norway; Sweden
Author’s E-Mail Address: [email protected]; [email protected]
1 We would like to thank Craig Beaumont, Helge Berger, Enrica Detragiache, Tom Dorsey, Davide Furceri, David Hofman, Christoph Klingen, Jerome Vandenbussche, and colleagues in the Nordic Unit for helpful comments.
IMF Working Papers describe research in progress by the author(s) and are published to elicit comments and to encourage debate. The views expressed in IMF Working Papers are those of the author(s) and do not necessarily represent the views of the IMF, its Executive Board, or IMF management.
2
Contents
I. INTRODUCTION ________________________________________________________4
II. PATTERNS AND DRIVERS OF MIGRATION TO THE NORDICS ____________5 A. Patterns of Migration ______________________________________________________5 B. Drivers of Migration _______________________________________________________9
III. LABOR MARKET IMPACT OF MIGRATION ____________________________13 A. Migration and the Labor Market ____________________________________________13 B. A Quantitative Perspective _________________________________________________18
IV. CONCLUDING REMARKS _____________________________________________24
REFERENCES ___________________________________________________________28 BOXES 1. Migration and Inflation Dynamics: Evidence from Sweden _______________________15 2. The Labor Market Impact of Migration in Denmark: A Spatial Correlations Approach __21 FIGURES 1. Stock and Flows of Migrants to Nordic Countries ________________________________6 2. Characteristics of Immigration to the Nordics ___________________________________7 3. Patterns of Bilateral Intra-Nordic Migration _____________________________________8 4. Intra-Nordic Net Migration—Actual and Predicted _____________________________11 5. EU Migration—Actual and Predicted ________________________________________12 6. The Demographic Benefits of Migration ______________________________________13 7. Labor Market Outcomes of Immigrants _______________________________________17 8. Wage Structure in the Nordic Countries _______________________________________18 TABLES 1. Summary Statistics—Intra-Nordic Migration ___________________________________31 2. Drivers of Intra-Nordic Migration ___________________________________________31 3. Summary Statistics—Non-Nordic EU Migration ________________________________32 4. Drivers of Non-Nordic EU Migration _________________________________________32 5. Impact of Migration on Unemployment—OLS Static Results ______________________33 6. Impact of Migration on Unemployment—GMM Dynamic Results __________________33 7. Impact of Policy and Institutions on Immigrant Unemployment ____________________34 ANNEXES I. The Nordic Labor Market Model and its Performance ____________________________35 II. Collective Bargaining in the Nordic countries __________________________________39 III. Recent Labor Market Reforms in the Nordic Countries __________________________41 IV. Integrating Immigrants into the Nordic Labor Market ___________________________43

3
ANNEX FIGURES A1. Labor Market Institutions_________________________________________________36 A2. Labor Market Performance _______________________________________________38
4
I. INTRODUCTION
Increasing migration to the Nordic region is challenging the adaptability of Nordic labor market institutions.2 Although the stock of immigrants in most countries in the region is still relatively modest compared with some other advanced OECD countries, net migration inflows as a share of the population have increased significantly since the mid-2000s. This mostly reflects the enlargements of the European Union (EU), which triggered a surge in labor migration from the new member states (NMS). While intra-Nordic labor mobility has been a long-standing feature of the Nordic labor market model, the surge in migration inflows from outside the region is a more recent phenomenon and has presented new opportunities and challenges for the Nordic states. On one hand, the inflows help the Nordic economies maintain labor force growth in the face of an aging population and dampen overheating pressures during periods of strong demand. On the other, young and lower-skilled immigrants are more prone to unemployment relative to Nordic natives. What factors account for the increasing migration inflows to the Nordic region, and what are the labor market consequences of migration? What role do labor market institutions play, and what is the scope for the Nordic institutions to adapt to the emerging labor market challenges? This paper addresses these questions by examining the recent trends, economic drivers, and labor market and policy implications of migration to the Nordics. Some Nordic countries, most notably Sweden, have also experienced a rise in asylum seekers over the past decade, especially in 2015. While this type of migration also has important labor market implications, the data analyzed in this paper on total migration flows appear to be primarily driven by economic migration although the data available sometimes do not allow a clear distinction between the different types of migration.3 The analysis of this paper may thus not apply directly to the current developments related to Europe’s refugee crisis. 4 Econometric analysis of this paper suggests that both cyclical and structural factors play an important role in explaining migration flows to the Nordic region. Other things being equal, immigrants have incentives to move to countries with better economic and labor market conditions relative to their home country. The influence of these cyclical factors is particularly strong in the case of intra-Nordic migration, whereas structural factors such as real wage differences and network effects matter more for shaping migration flows from outside the region. Migration to the Nordic region brings significant benefits. For example, about 80 percent of the Nordic labor force growth during recent years has come from increases in the foreign-born population as opposed to growth in the native workforce. Over the longer horizons, Eurostat estimates that the Nordic working age population would shrink by more
2 In this paper, Nordic countries refer to the group of four countries: Denmark, Finland, Norway, and Sweden. 3 Swedish labor market issues including asylum seekers are discussed in El-Ganainy (forthcoming).
4 A forthcoming IMF paper will examine the issues related to refugees/asylum seekers in Europe.

5
than 10 percent by 2050 without continued migration at the current pace. This expansion in labor supply alone helps boost potential output in the long run. A “back-of-the-envelope” calculation shows that real GDP in the average Nordic country would be about 2½ percent higher by 2020 compared to a scenario of no further migration inflows. In the short run, evidence from Swedish data shows that migration contributes to relaxing the economy’s unemployment-inflation tradeoff, possibly by dampening wage growth and/or increasing the elasticity of labor supply. Notwithstanding these benefits, migration can come with short-term costs in terms of its impact on the labor market of the host economy.5 Based on data from a sample of advanced OECD countries, our analysis finds that an increase in migration is associated with a subsequent rise in unemployment in the host country, at least initially. In addition, migration tends to have larger impacts on the unemployment outcomes of the young and the low skilled. These results are broadly robust to the potential endogeneity of migration flows. Finally, our analysis indicates that labor market policy and institutions play an important role in integrating immigrants into the labor market. For example, active labor market policies (ALMP) and greater scope for wage differentiation can help alleviate differences in unemployment between foreign- and native-born workers. As a crude policy experiment, reducing the degree of wage compression in Nordic countries to the OECD average is estimated to reduce foreign-born unemployment by over 10 percentage points for the average Nordic country, which is enough to close the observed foreign-native unemployment gap. While these results should be viewed with the usual caveats regarding the challenges in empirically isolating the effect of any particular policy or reform, they suggest that allowing more scope for wages to adjust—especially at the lower end of the wage distribution—and continued support through ALMP, among other policies, can help the Nordic economies to more successfully integrate immigrants into productive employment. The rest of the paper is organized as follows. The next section outlines the stylized facts about migration to Nordic countries and empirically examines the drivers of bilateral migration flows for both intra-Nordic and non-Nordic EU migration. Section III investigates the short- and long-term impact of migration on the host country labor market and studies the role of policy and institutions such as the wage structure and ALMP in shaping the unemployment outcomes of immigrants. Section IV concludes by discussing the implications for Nordic labor market policies and institutions.
II. PATTERNS AND DRIVERS OF MIGRATION TO THE NORDICS
A. Patterns of Migration
The Nordic countries have seen a rise in immigration over the past decade. Although the stock of immigrants in most of the Nordics is still relatively modest compared to some other
5 While the paper focuses on studying the impact of migration on the receiving countries, a full analysis of the costs and benefits of migration would need to take into account the effects on sending countries. For many of these sending countries, emigration poses significant economic costs.
6
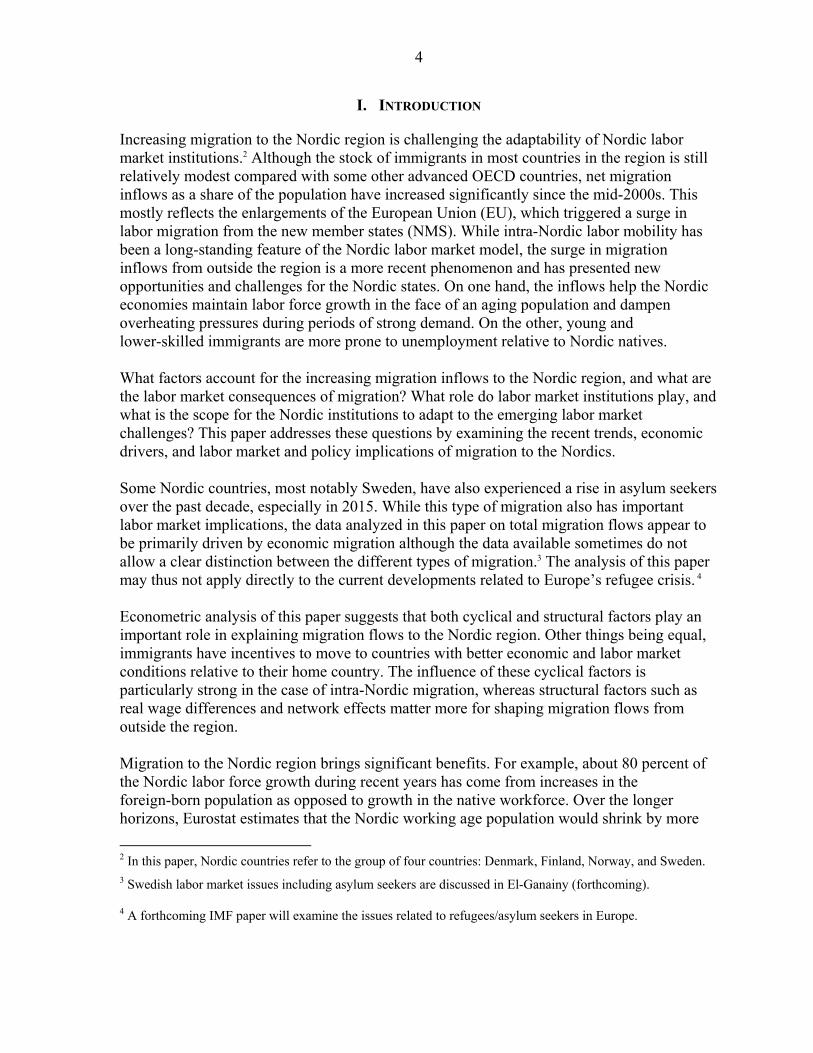
advanced OECD countries, net migration inflows as a share of population have picked up significantly since the mid-2000s (Figure 1). Norway has experienced the largest wave of immigration in the Nordic region—supported by robust oil prices and economic growth— followed by Sweden and Denmark. Finland still has a relatively small immigrant population, but inflows have been steadily rising since the early 2000s, albeit from a low level. Migration flows reversed briefly during the global financial crisis, but have since picked up again.
Figure 1. Stock and Flows of Migrants to Nordic Countries
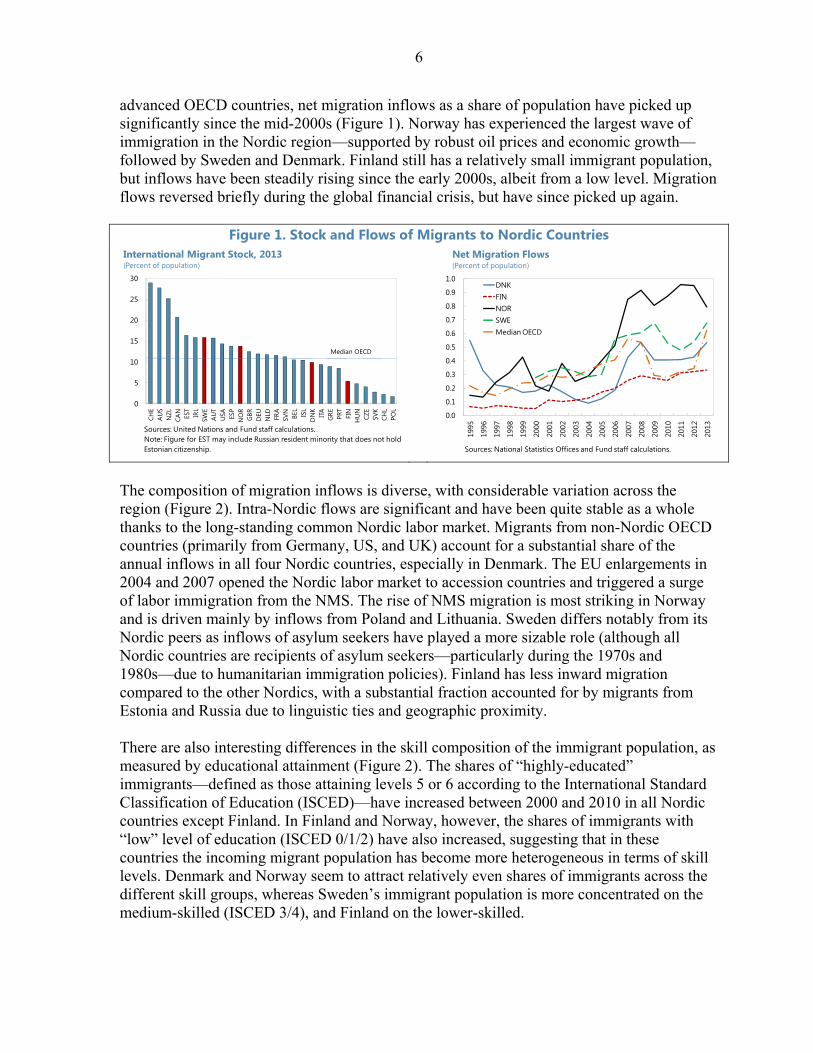
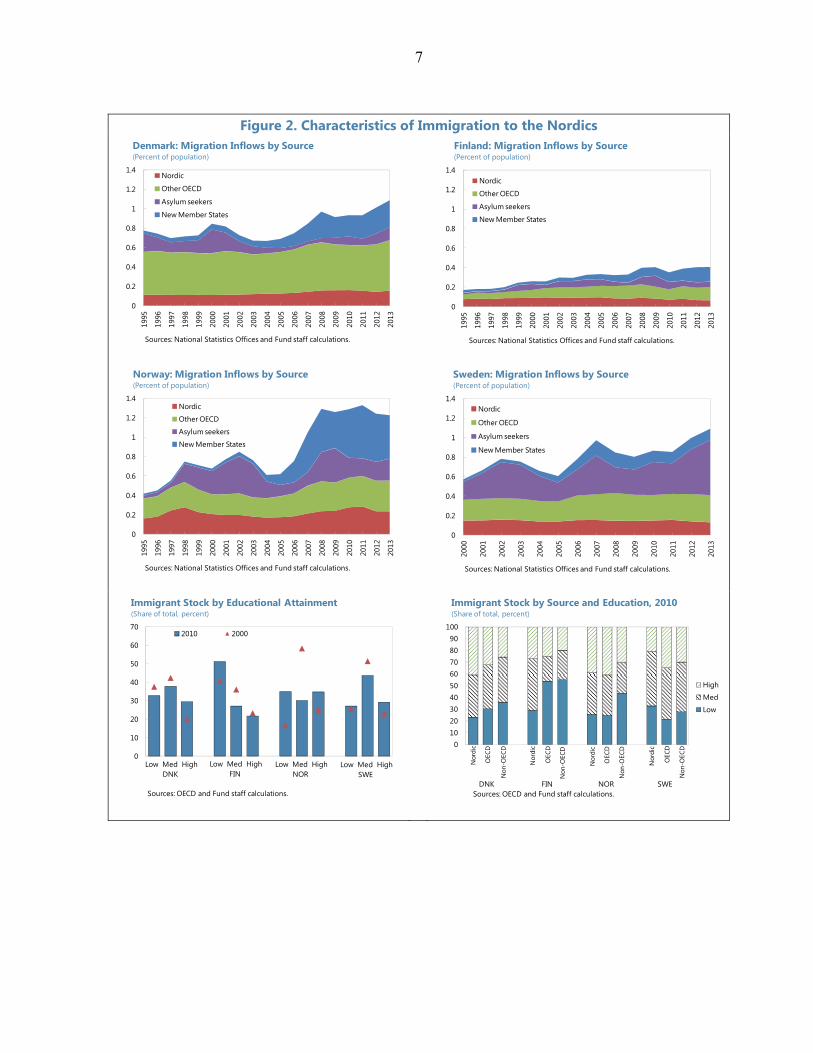
The composition of migration inflows is diverse, with considerable variation across the region (Figure 2). Intra-Nordic flows are significant and have been quite stable as a whole thanks to the long-standing common Nordic labor market. Migrants from non-Nordic OECD countries (primarily from Germany, US, and UK) account for a substantial share of the annual inflows in all four Nordic countries, especially in Denmark. The EU enlargements in 2004 and 2007 opened the Nordic labor market to accession countries and triggered a surge of labor immigration from the NMS. The rise of NMS migration is most striking in Norway and is driven mainly by inflows from Poland and Lithuania. Sweden differs notably from its Nordic peers as inflows of asylum seekers have played a more sizable role (although all Nordic countries are recipients of asylum seekers—particularly during the 1970s and 1980s—due to humanitarian immigration policies). Finland has less inward migration compared to the other Nordics, with a substantial fraction accounted for by migrants from Estonia and Russia due to linguistic ties and geographic proximity. There are also interesting differences in the skill composition of the immigrant population, as measured by educational attainment (Figure 2). The shares of “highly-educated” immigrants—defined as those attaining levels 5 or 6 according to the International Standard Classification of Education (ISCED)—have increased between 2000 and 2010 in all Nordic countries except Finland. In Finland and Norway, however, the shares of immigrants with “low” level of education (ISCED 0/1/2) have also increased, suggesting that in these countries the incoming migrant population has become more heterogeneous in terms of skill levels. Denmark and Norway seem to attract relatively even shares of immigrants across the different skill groups, whereas Sweden’s immigrant population is more concentrated on the medium-skilled (ISCED 3/4), and Finland on the lower-skilled.
0
5
10
15
20
25
30
CHE
AU
SN
ZLCA
NES
TIR
LSW
EA
UT
USA ES
PN
OR
GBR
DEU
NLD FRA
SVN
BEL
ISL
DN
KIT
AG
RE PRT
FIN
HU
NCZ
ESV
KCH
LPO
L
International Migrant Stock, 2013(Percent of population)
Sources: United Nations and Fund staff calculations.Note: Figure for EST may include Russian resident minority that does not hold Estonian citizenship.
Median OECD
0.0
0.1
0.2
0.3
0.4
0.5
0.6
0.7
0.8
0.9
1.0
1995
1996
1997
1998
1999
2000
2001
2002
2003
2004
2005
2006
2007
2008
2009
2010
2011
2012
2013
DNKFINNORSWEMedian OECD
Sources: National Statistics Offices and Fund staff calculations.
Net Migration Flows(Percent of population)
7
Figure 2. Characteristics of Immigration to the Nordics
0
0.2
0.4
0.6
0.8
1
1.2
1.4
1995
1996
1997
1998
1999
2000
2001
2002
2003
2004
2005
2006
2007
2008
2009
2010
2011
2012
2013
Nordic
Other OECD
Asylum seekers
New Member States
Sources: National Statistics Offices and Fund staff calculations.
Denmark: Migration Inflows by Source (Percent of population)
0
0.2
0.4
0.6
0.8
1
1.2
1.4
1995
1996
1997
1998
1999
2000
2001
2002
2003
2004
2005
2006
2007
2008
2009
2010
2011
2012
2013
Nordic
Other OECD
Asylum seekers
New Member States
Sources: National Statistics Offices and Fund staff calculations.
Finland: Migration Inflows by Source(Percent of population)
0
0.2
0.4
0.6
0.8
1
1.2
1.4
1995
1996
1997
1998
1999
2000
2001
2002
2003
2004
2005
2006
2007
2008
2009
2010
2011
2012
2013
Nordic
Other OECD
Asylum seekers
New Member States
Sources: National Statistics Offices and Fund staff calculations.
Norway: Migration Inflows by Source(Percent of population)
0
0.2
0.4
0.6
0.8
1
1.2
1.4
2000
2001
2002
2003
2004
2005
2006
2007
2008
2009
2010
2011
2012
2013
Nordic
Other OECD
Asylum seekers
New Member States
Sources: National Statistics Offices and Fund staff calculations.
Sweden: Migration Inflows by Source(Percent of population)
0
10
20
30
40
50
60
702010 2000
Immigrant Stock by Educational Attainment(Share of total, percent)
Sources: OECD and Fund staff calculations.
Low Med HighDNK
Low Med HighFIN
Low Med HighNOR
Low Med HighSWE
0102030405060708090
100
High
Med
Low
Immigrant Stock by Source and Education, 2010(Share of total, percent)
Sources: OECD and Fund staff calculations.
Nor
dic
OEC
D
Non
-OEC
D
Nor
dic
Nor
dic
Nor
dic
OEC
D
OEC
D
OEC
D
Non
-OEC
D
Non
-OEC
D
Non
-OEC
D
DNK FIN NOR SWE
8
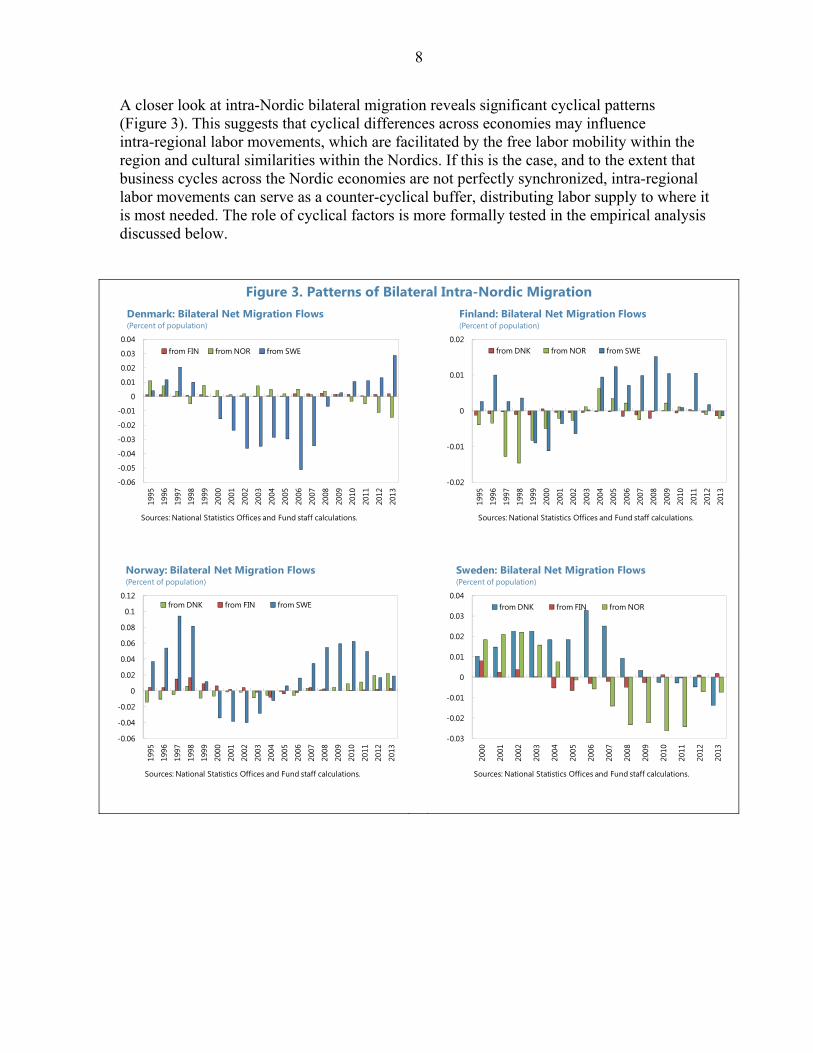
A closer look at intra-Nordic bilateral migration reveals significant cyclical patterns (Figure 3). This suggests that cyclical differences across economies may influence intra-regional labor movements, which are facilitated by the free labor mobility within the region and cultural similarities within the Nordics. If this is the case, and to the extent that business cycles across the Nordic economies are not perfectly synchronized, intra-regional labor movements can serve as a counter-cyclical buffer, distributing labor supply to where it is most needed. The role of cyclical factors is more formally tested in the empirical analysis discussed below.
Figure 3. Patterns of Bilateral Intra-Nordic Migration
-0.06
-0.05
-0.04
-0.03
-0.02
-0.01
0
0.01
0.02
0.03
0.04
1995
1996
1997
1998
1999
2000
2001
2002
2003
2004
2005
2006
2007
2008
2009
2010
2011
2012
2013
from FIN from NOR from SWE
Sources: National Statistics Offices and Fund staff calculations.
Denmark: Bilateral Net Migration Flows(Percent of population)
-0.02
-0.01
0
0.01
0.02
1995
1996
1997
1998
1999
2000
2001
2002
2003
2004
2005
2006
2007
2008
2009
2010
2011
2012
2013
from DNK from NOR from SWE
Sources: National Statistics Offices and Fund staff calculations.
Finland: Bilateral Net Migration Flows(Percent of population)
-0.06
-0.04
-0.02
0
0.02
0.04
0.06
0.08
0.1
0.12
1995
1996
1997
1998
1999
2000
2001
2002
2003
2004
2005
2006
2007
2008
2009
2010
2011
2012
2013
from DNK from FIN from SWE
Sources: National Statistics Offices and Fund staff calculations.
Norway: Bilateral Net Migration Flows(Percent of population)
-0.03
-0.02
-0.01
0
0.01
0.02
0.03
0.04
2000
2001
2002
2003
2004
2005
2006
2007
2008
2009
2010
2011
2012
2013
from DNK from FIN from NOR
Sources: National Statistics Offices and Fund staff calculations.
Sweden: Bilateral Net Migration Flows(Percent of population)
9
B. Drivers of Migration
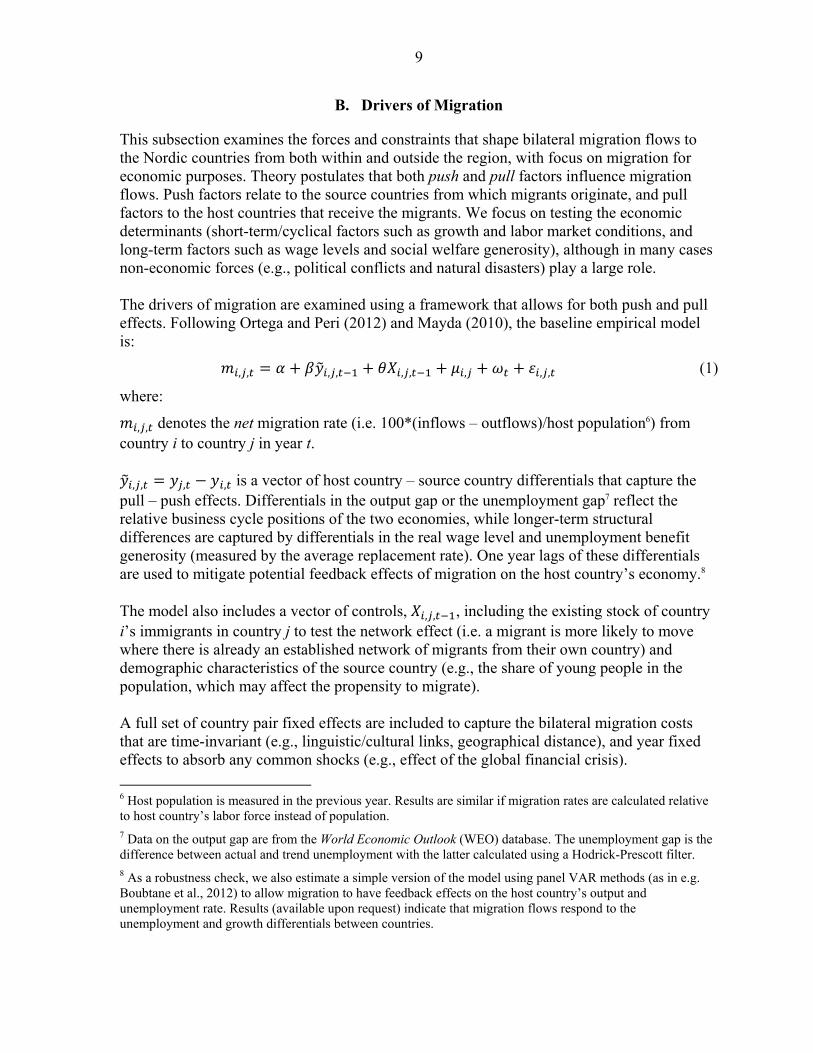
This subsection examines the forces and constraints that shape bilateral migration flows to the Nordic countries from both within and outside the region, with focus on migration for economic purposes. Theory postulates that both push and pull factors influence migration flows. Push factors relate to the source countries from which migrants originate, and pull factors to the host countries that receive the migrants. We focus on testing the economic determinants (short-term/cyclical factors such as growth and labor market conditions, and long-term factors such as wage levels and social welfare generosity), although in many cases non-economic forces (e.g., political conflicts and natural disasters) play a large role. The drivers of migration are examined using a framework that allows for both push and pull effects. Following Ortega and Peri (2012) and Mayda (2010), the baseline empirical model is:
, , , , , , , , , (1)
where:
, , denotes the net migration rate (i.e. 100*(inflows – outflows)/host population6) from country i to country j in year t. , , , , is a vector of host country – source country differentials that capture the
pull – push effects. Differentials in the output gap or the unemployment gap7 reflect the relative business cycle positions of the two economies, while longer-term structural differences are captured by differentials in the real wage level and unemployment benefit generosity (measured by the average replacement rate). One year lags of these differentials are used to mitigate potential feedback effects of migration on the host country’s economy.8 The model also includes a vector of controls, , , , including the existing stock of country i’s immigrants in country j to test the network effect (i.e. a migrant is more likely to move where there is already an established network of migrants from their own country) and demographic characteristics of the source country (e.g., the share of young people in the population, which may affect the propensity to migrate). A full set of country pair fixed effects are included to capture the bilateral migration costs that are time-invariant (e.g., linguistic/cultural links, geographical distance), and year fixed effects to absorb any common shocks (e.g., effect of the global financial crisis).
6 Host population is measured in the previous year. Results are similar if migration rates are calculated relative to host country’s labor force instead of population. 7 Data on the output gap are from the World Economic Outlook (WEO) database. The unemployment gap is the difference between actual and trend unemployment with the latter calculated using a Hodrick-Prescott filter. 8 As a robustness check, we also estimate a simple version of the model using panel VAR methods (as in e.g. Boubtane et al., 2012) to allow migration to have feedback effects on the host country’s output and unemployment rate. Results (available upon request) indicate that migration flows respond to the unemployment and growth differentials between countries.
10
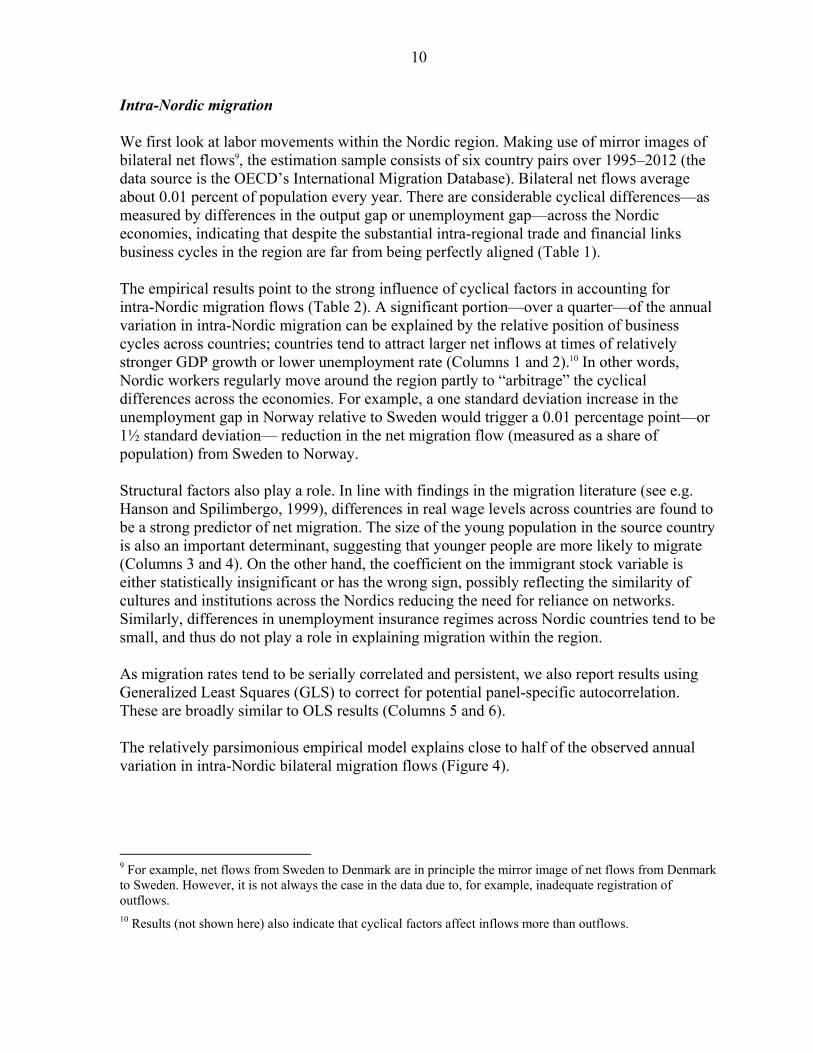
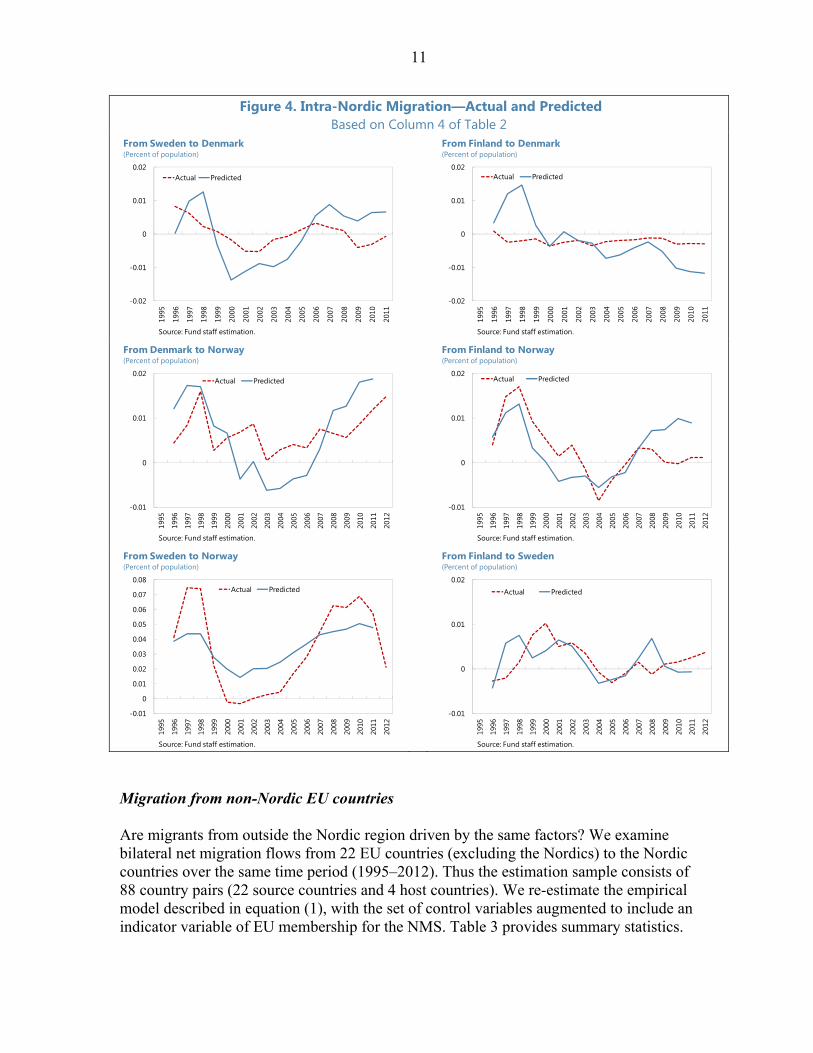
Intra-Nordic migration We first look at labor movements within the Nordic region. Making use of mirror images of bilateral net flows9, the estimation sample consists of six country pairs over 1995–2012 (the data source is the OECD’s International Migration Database). Bilateral net flows average about 0.01 percent of population every year. There are considerable cyclical differences—as measured by differences in the output gap or unemployment gap—across the Nordic economies, indicating that despite the substantial intra-regional trade and financial links business cycles in the region are far from being perfectly aligned (Table 1). The empirical results point to the strong influence of cyclical factors in accounting for intra-Nordic migration flows (Table 2). A significant portion—over a quarter—of the annual variation in intra-Nordic migration can be explained by the relative position of business cycles across countries; countries tend to attract larger net inflows at times of relatively stronger GDP growth or lower unemployment rate (Columns 1 and 2).10 In other words, Nordic workers regularly move around the region partly to “arbitrage” the cyclical differences across the economies. For example, a one standard deviation increase in the unemployment gap in Norway relative to Sweden would trigger a 0.01 percentage point—or 1½ standard deviation— reduction in the net migration flow (measured as a share of population) from Sweden to Norway. Structural factors also play a role. In line with findings in the migration literature (see e.g. Hanson and Spilimbergo, 1999), differences in real wage levels across countries are found to be a strong predictor of net migration. The size of the young population in the source country is also an important determinant, suggesting that younger people are more likely to migrate (Columns 3 and 4). On the other hand, the coefficient on the immigrant stock variable is either statistically insignificant or has the wrong sign, possibly reflecting the similarity of cultures and institutions across the Nordics reducing the need for reliance on networks. Similarly, differences in unemployment insurance regimes across Nordic countries tend to be small, and thus do not play a role in explaining migration within the region. As migration rates tend to be serially correlated and persistent, we also report results using Generalized Least Squares (GLS) to correct for potential panel-specific autocorrelation. These are broadly similar to OLS results (Columns 5 and 6). The relatively parsimonious empirical model explains close to half of the observed annual variation in intra-Nordic bilateral migration flows (Figure 4).
9 For example, net flows from Sweden to Denmark are in principle the mirror image of net flows from Denmark to Sweden. However, it is not always the case in the data due to, for example, inadequate registration of outflows. 10 Results (not shown here) also indicate that cyclical factors affect inflows more than outflows.
11
Figure 4. Intra-Nordic Migration—Actual and Predicted Based on Column 4 of Table 2
Migration from non-Nordic EU countries Are migrants from outside the Nordic region driven by the same factors? We examine bilateral net migration flows from 22 EU countries (excluding the Nordics) to the Nordic countries over the same time period (1995–2012). Thus the estimation sample consists of 88 country pairs (22 source countries and 4 host countries). We re-estimate the empirical model described in equation (1), with the set of control variables augmented to include an indicator variable of EU membership for the NMS. Table 3 provides summary statistics.
-0.02
-0.01
0
0.01
0.0219
95
1996
1997
1998
1999
2000
2001
2002
2003
2004
2005
2006
2007
2008
2009
2010
2011
Actual Predicted
From Sweden to Denmark(Percent of population)
Source: Fund staff estimation.
-0.02
-0.01
0
0.01
0.02
1995
1996
1997
1998
1999
2000
2001
2002
2003
2004
2005
2006
2007
2008
2009
2010
2011
Actual Predicted
From Finland to Denmark(Percent of population)
Source: Fund staff estimation.
-0.01
0
0.01
0.02
1995
1996
1997
1998
1999
2000
2001
2002
2003
2004
2005
2006
2007
2008
2009
2010
2011
2012
Actual Predicted
From Denmark to Norway(Percent of population)
Source: Fund staff estimation.
-0.01
0
0.01
0.02
1995
1996
1997
1998
1999
2000
2001
2002
2003
2004
2005
2006
2007
2008
2009
2010
2011
2012
Actual Predicted
From Finland to Norway(Percent of population)
Source: Fund staff estimation.
-0.01
0
0.01
0.02
0.03
0.04
0.05
0.06
0.07
0.08
1995
1996
1997
1998
1999
2000
2001
2002
2003
2004
2005
2006
2007
2008
2009
2010
2011
2012
Actual Predicted
From Sweden to Norway(Percent of population)
Source: Fund staff estimation.
-0.01
0
0.01
0.02
1995
1996
1997
1998
1999
2000
2001
2002
2003
2004
2005
2006
2007
2008
2009
2010
2011
2012
Actual Predicted
From Finland to Sweden(Percent of population)
Source: Fund staff estimation.
12
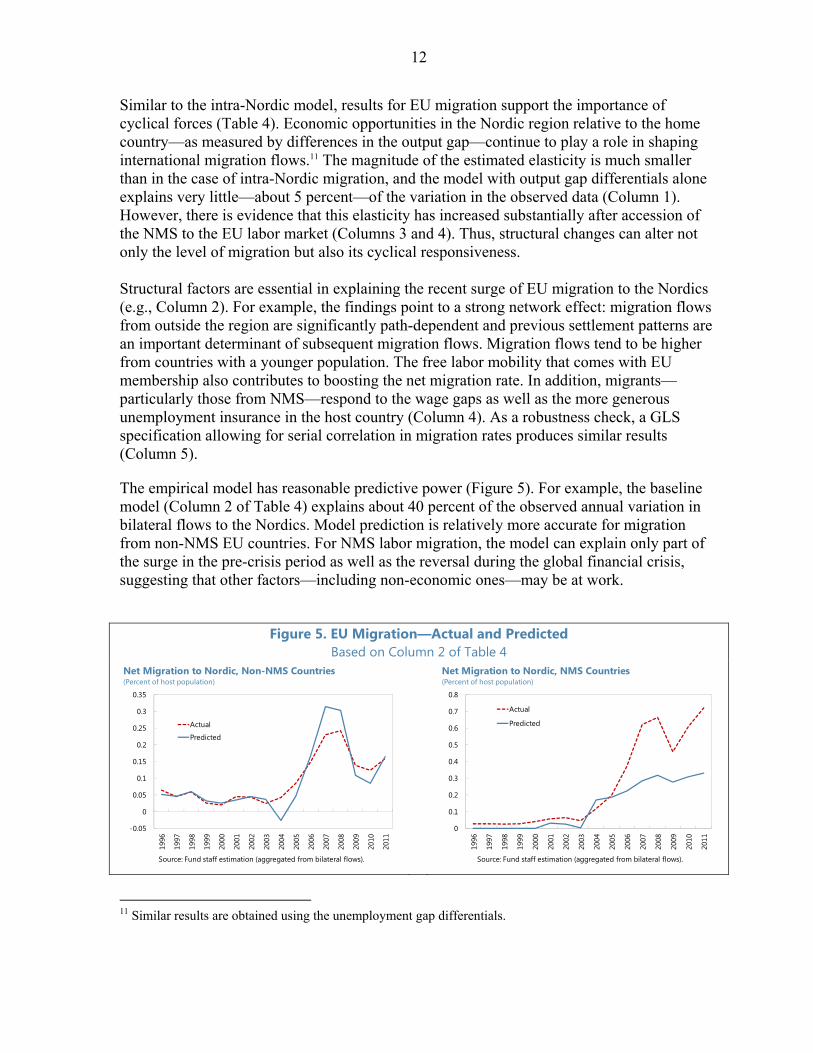
Similar to the intra-Nordic model, results for EU migration support the importance of cyclical forces (Table 4). Economic opportunities in the Nordic region relative to the home country—as measured by differences in the output gap—continue to play a role in shaping international migration flows.11 The magnitude of the estimated elasticity is much smaller than in the case of intra-Nordic migration, and the model with output gap differentials alone explains very little—about 5 percent—of the variation in the observed data (Column 1). However, there is evidence that this elasticity has increased substantially after accession of the NMS to the EU labor market (Columns 3 and 4). Thus, structural changes can alter not only the level of migration but also its cyclical responsiveness. Structural factors are essential in explaining the recent surge of EU migration to the Nordics (e.g., Column 2). For example, the findings point to a strong network effect: migration flows from outside the region are significantly path-dependent and previous settlement patterns are an important determinant of subsequent migration flows. Migration flows tend to be higher from countries with a younger population. The free labor mobility that comes with EU membership also contributes to boosting the net migration rate. In addition, migrants—particularly those from NMS—respond to the wage gaps as well as the more generous unemployment insurance in the host country (Column 4). As a robustness check, a GLS specification allowing for serial correlation in migration rates produces similar results (Column 5).
The empirical model has reasonable predictive power (Figure 5). For example, the baseline model (Column 2 of Table 4) explains about 40 percent of the observed annual variation in bilateral flows to the Nordics. Model prediction is relatively more accurate for migration from non-NMS EU countries. For NMS labor migration, the model can explain only part of the surge in the pre-crisis period as well as the reversal during the global financial crisis, suggesting that other factors—including non-economic ones—may be at work.
Figure 5. EU Migration—Actual and Predicted
Based on Column 2 of Table 4
11 Similar results are obtained using the unemployment gap differentials.
-0.05
0
0.05
0.1
0.15
0.2
0.25
0.3
0.35
1996
1997
1998
1999
2000
2001
2002
2003
2004
2005
2006
2007
2008
2009
2010
2011
Actual
Predicted
Net Migration to Nordic, Non-NMS Countries(Percent of host population)
Source: Fund staff estimation (aggregated from bilateral flows).
0
0.1
0.2
0.3
0.4
0.5
0.6
0.7
0.8
1996
1997
1998
1999
2000
2001
2002
2003
2004
2005
2006
2007
2008
2009
2010
2011
Actual
Predicted
Net Migration to Nordic, NMS Countries(Percent of host population)
Source: Fund staff estimation (aggregated from bilateral flows).

13
III. LABOR MARKET IMPACT OF MIGRATION
This section first discusses the long- and short-run impact of migration on the host economy. It then provides an empirical examination of the short-run impact on the labor market using OECD data, and studies the role of labor market policy and institutions.
A. Migration and the Labor Market
Migration contributes to maintaining labor force growth in the face of adverse medium and long run demographic trends (Figure 6). Between the late 1990s and 2014, the share of foreign-born workers12 in the total active population in the Nordics has more than doubled to 6.6 percent. Although this share is still low compared to some other advanced economies (e.g., Spain, Italy, UK), most of the recent additions to the Nordic labor force (about 80 percent on average for the 2010–14 period) were foreign-born. With fast aging populations (particularly in Finland13), continued migration in the medium and long term would help maintain growth of the working age population, thereby alleviating long-term pressures on public finances. For example, according to Eurostat projections, without continued migration the total working age population in the Nordic region would shrink by a cumulative 5 percent by 2030 and by over 10 percent by 2050.
Figure 6. The Demographic Benefits of Migration
12 Even if an immigrant changes their nationality after settling into the new country, they would still be captured in the foreign born statistics. 13 The total dependency ratio in Finland is projected to increase by more than 20 percentage points—among the largest increases in the OECD—between now and 2035 (OECD, 2012). Finland also has a relatively low labor force participation rate among older workers (aged 55-64) compared to other Nordics.
-100
-50
0
50
100
150
200
250
300
1998 2000 2002 2004 2006 2008 2010 2012 2014
Contribution from nativesContribution from foreign bornTotal increase in labor force
Change in Nordic Labor Force, by Source (Thousand)
Sources: Eurostat and Fund staff calculations.
-15
-10
-5
0
5
10
15
20
2020 2030 2040 2050
Baseline Reduced migration 1/ No migration
Sources: Eurostat and Fund staff calculations.1/ Net international migration reduced by 20%.
Projected Change in Nordic Working Age Population(Percent, cumulative change relative to 2015)

14
The expanded labor supply resulting from migration implies potentially significant output gains in the long run. As an illustration, a simple “back-of-the envelope” calculation using a production function approach14 shows that real GDP for the average Nordic country would be about 2.5 percent higher by 2020 and 7 percent higher by 2030 compared to a scenario without continued migration. The output contribution from migration is estimated to be largest for Norway (over 10 percent by 2030), consistent with the relatively high net migration rate in recent years. These rough estimates are based only on the long-run impact of migration on the size of the country’s working age population, and thus assume that other long-run effects of migration (e.g., on total factor productivity, capital accumulation, employment and labor force participation rates) are negligible. In the short run, the cyclical responsiveness of migration helps make labor supply in the host country more flexible. To the extent that migrant workers tend to come when there are ample job opportunities, are more willing to take on temporary jobs at lower wages, and have the option to return home when jobs become scarce, the adjustment in labor supply mitigates overheating pressures in times of strong aggregate demand and lessens the unemployment impact of a downturn in the host country. A theoretical literature has explored this aspect of migration, positing that migration contributes to dampening the response of inflation to domestic economic activity through increased elasticity of labor supply (see e.g. Razin and Binyamini, 2007; Engler, 2007) or labor market channels such as dampened wage growth (Bentolila and others, 2007). Empirical evidence supporting this hypothesis has been found in the case of Spain (Bentolila and others, 2007) as well as Sweden (see Box 1).
14 The effect of migration on long-run output is given by:
, where α denotes the
labor share in the production function , is the projected level of employment in the baseline scenario (i.e. with continued migration at the current pace), and is the projected level of employment in the “no migration” scenario (i.e. the net migration rate is held at zero between the present and the projected year in the future). Data for labor shares come from the OECD (the calculation uses the 1995-2012 average shares for each country). It is assumed that additional migration does not affect the labor force
participation or employment rate, so that
, where P denotes the working age
population. Long-run projections of working age population are taken from the Eurostat database.
By 2020 By 2030Denmark 1.4 4.5Finland 1.8 5.4Norway 4.4 10.2Sweden 2.2 7.5Average Nordic 2.5 6.9
Estimated Output Gains from Continued Migration(Percent, relative to no migration scenario)
Source: Authors' calculations.

15
Box 1. Migration and Inflation Dynamics: Evidence from Sweden
A relatively unexplored effect of migration is on the short-run unemployment-inflation tradeoff of the host economy. Theoretically, migration may dampen the response of inflation to economic activity, thus inducing a “flatter” short-run Phillips curve (PC). The effect could work through increased elasticity of labor supply and thus dampened wage growth (Razin and Binyamini, 2007; Engler, 2007; Bentolila and others, 2007), or other labor market channels such as lower labor market mismatch (e.g., if immigrant labor helps fill local skill gaps) reducing the natural rate of unemployment. We test this hypothesis using Swedish data. Similar to several other industrial countries, there is evidence that Swedish’s short-run PC has flattened, particularly since the adoption of the inflation targeting framework in 1993 leading to well-anchored inflation expectations. Focusing on the inflation targeting period, we examine whether the inflation-unemployment tradeoff—or the slope of the PC—is sensitive to changes in migration to Sweden during the period. We estimate a PC model of inflation dynamics augmented to include migration, using quarterly data over 1998Q1-2014Q4:
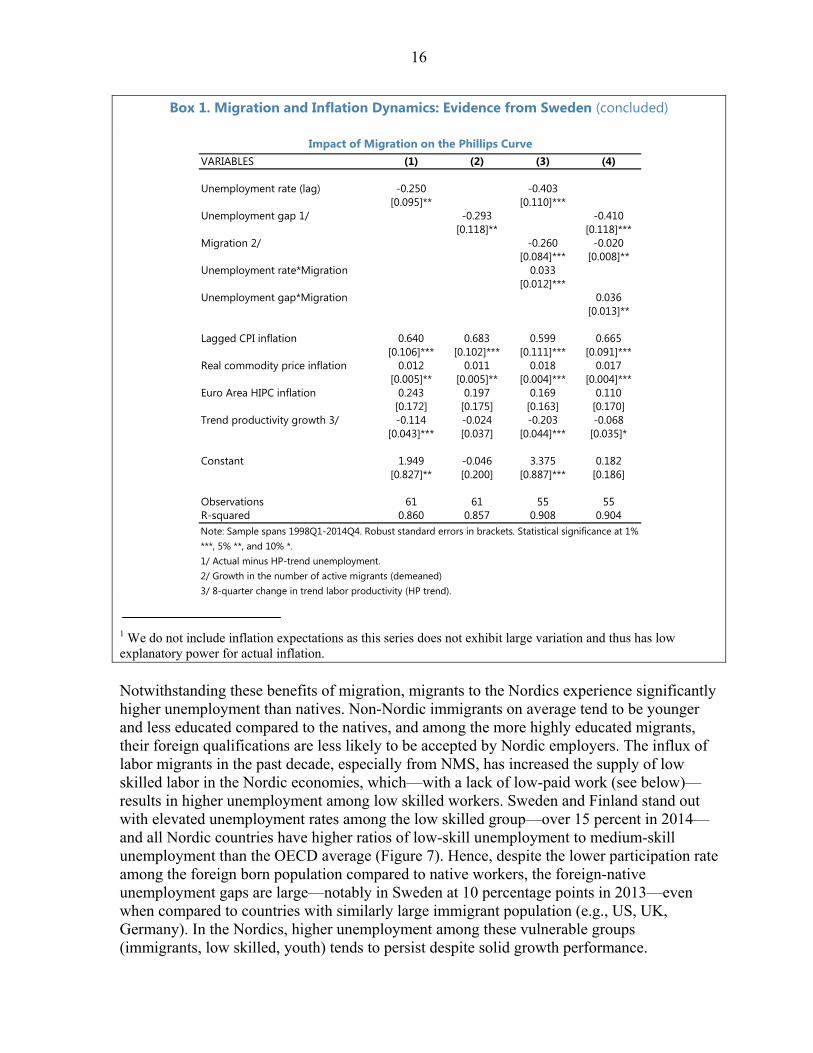
is the quarterly headline CPI inflation (y-o-y), is the one quarter lag of the unemployment rate (also measured in gap in an alternative specification), is measured by the growth rate of the active immigrant population, and denotes a vector of control variables including real commodity price growth, Euro area inflation, and trend productivity growth.1 The parameter captures the effect of migration on the slope of the PC, i.e. the slope would be and thus varies with changes in migration. The estimates suggest that migration has a dampening effect on headline inflation in Sweden (e.g., based on coefficient estimates in Column 3, a one percent increase in the migrant labor force is associated with a reduction in the quarterly inflation rate by 0.26 percentage points). In addition, migration also causes inflation dynamics in Sweden to become less responsive to cyclical output developments, i.e. a flatter PC. As an illustration, using the coefficient estimates in Column 3, the slope of the PC is flatter with migration compared to the case where the immigrant labor force remains unchanged.
1976
1977
1978
1979
1980
1981
19821983
19841985
19861987
19881989
1990
1991
1992
1993
19941995
199619971998
19992000
20012002 2003
20042005
20062007
2008
2009
2010
2011
2012
20132014
-2
0
2
4
6
8
10
12
14
16
0 2 4 6 8 10 12
CPI i
nfla
tion
rate
(%)
Unemployment rate (%)Sources: Statistics Sweden, Haver Analytics, and Fund staff calculations.
Sweden: Phillips Curve
-2
-1
0
1
2
3
4
5
2 4 6 8 10 12
Infla
tion
(%)
Unemployment rate (%)
No migration
With migration 1/
Sweden: Sensitivity of Phillips Curve Slope to Migration(Based on estimates from Model 3)
Source: Fund staff estimates.1/ Assume a 5% quarterly growth rate in the active immigrant population.
16
Box 1. Migration and Inflation Dynamics: Evidence from Sweden (concluded)
1 We do not include inflation expectations as this series does not exhibit large variation and thus has low explanatory power for actual inflation.
Notwithstanding these benefits of migration, migrants to the Nordics experience significantly higher unemployment than natives. Non-Nordic immigrants on average tend to be younger and less educated compared to the natives, and among the more highly educated migrants, their foreign qualifications are less likely to be accepted by Nordic employers. The influx of labor migrants in the past decade, especially from NMS, has increased the supply of low skilled labor in the Nordic economies, which—with a lack of low-paid work (see below)—results in higher unemployment among low skilled workers. Sweden and Finland stand out with elevated unemployment rates among the low skilled group—over 15 percent in 2014—and all Nordic countries have higher ratios of low-skill unemployment to medium-skill unemployment than the OECD average (Figure 7). Hence, despite the lower participation rate among the foreign born population compared to native workers, the foreign-native unemployment gaps are large—notably in Sweden at 10 percentage points in 2013—even when compared to countries with similarly large immigrant population (e.g., US, UK, Germany). In the Nordics, higher unemployment among these vulnerable groups (immigrants, low skilled, youth) tends to persist despite solid growth performance.
VARIABLES (1) (2) (3) (4)
Unemployment rate (lag) -0.250 -0.403[0.095]** [0.110]***
Unemployment gap 1/ -0.293 -0.410[0.118]** [0.118]***
Migration 2/ -0.260 -0.020[0.084]*** [0.008]**
Unemployment rate*Migration 0.033[0.012]***
Unemployment gap*Migration 0.036[0.013]**
Lagged CPI inflation 0.640 0.683 0.599 0.665[0.106]*** [0.102]*** [0.111]*** [0.091]***
Real commodity price inflation 0.012 0.011 0.018 0.017[0.005]** [0.005]** [0.004]*** [0.004]***
Euro Area HIPC inflation 0.243 0.197 0.169 0.110[0.172] [0.175] [0.163] [0.170]
Trend productivity growth 3/ -0.114 -0.024 -0.203 -0.068[0.043]*** [0.037] [0.044]*** [0.035]*
Constant 1.949 -0.046 3.375 0.182[0.827]** [0.200] [0.887]*** [0.186]
Observations 61 61 55 55R-squared 0.860 0.857 0.908 0.904Note: Sample spans 1998Q1-2014Q4. Robust standard errors in brackets. Statistical significance at 1% ***, 5% **, and 10% *.1/ Actual minus HP-trend unemployment.2/ Growth in the number of active migrants (demeaned)3/ 8-quarter change in trend labor productivity (HP trend).
Impact of Migration on the Phillips Curve

17
Figure 7. Labor Market Outcomes of Immigrants
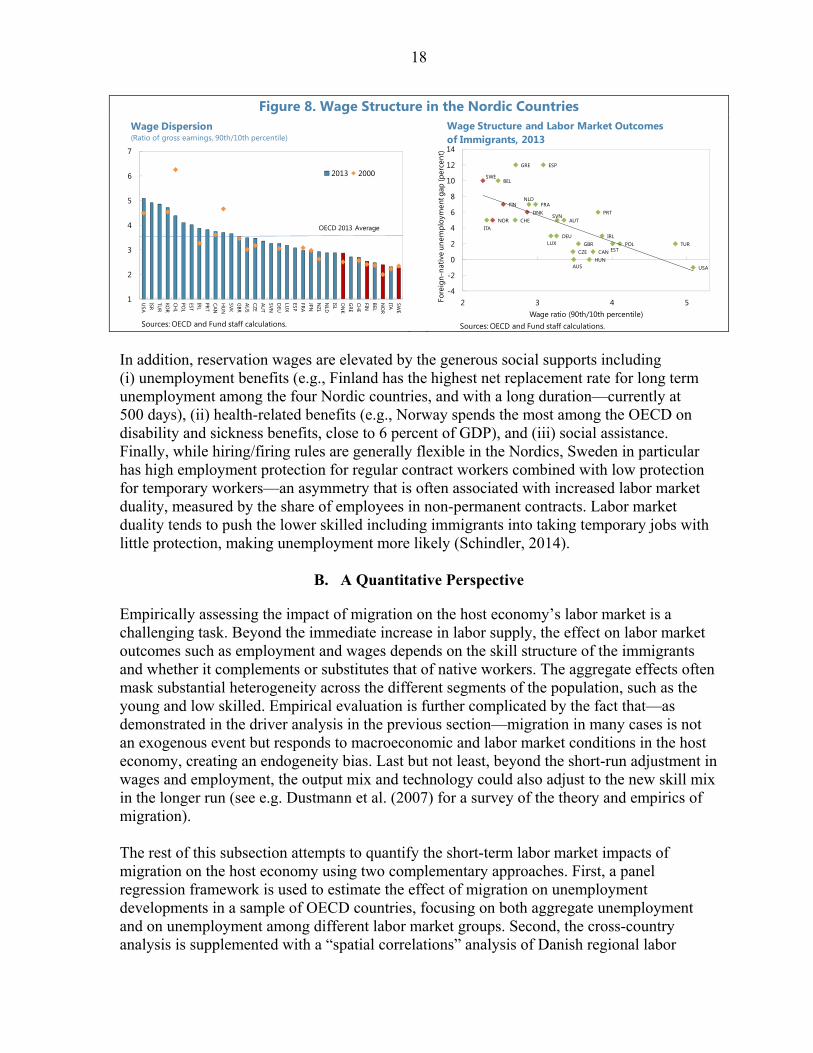
These less favorable labor market outcomes for migrants reflect some aspects of the Nordic labor and welfare institutions (see Annex I for an overview of Nordic labor market institutions). Strong unions and the collective bargaining system (Annex II) help promote wage stability and competitiveness by aligning wage developments with average productivity growth, supporting the overall strong economic performance of Nordic countries. However, wage stability tends to come at the cost of limited cross-sectional wage flexibility, as the collective bargains include high wage floors that imply a compressed wage structure (Figure 8).15 High wage floors may increase the cost structure of sectors using a larger share of lower skill labor, reducing output and employment in these sectors. The reduced scope for adjusting wages to local conditions at the firm level likely also contributes to unemployment among the low skilled immigrants by leaving a gap between wages and productivity.
15 A theoretical literature (e.g., Cahuc and Zilberberg, 2004; Alvarez and Shimer, 2011) finds that collective bargaining reduces the spread of wages compared to the case where workers are paid based on marginal productivity. Empirical work has found evidence to support this theory (e.g., Kahn (1998, 2000) found lower wage inequality in OECD economies with larger collective bargaining coverage).
0.0
0.5
1.0
1.5
2.0
2.5
3.0
0
5
10
15
20
25
30
35
40
SWE
NO
RCH
EBE
LA
UT
NLD
DN
KFI
NFR
ALU
XD
EU ESP
GRC
OEC
D a
vg ITA
PRT
GBR IR
ECA
NA
US
USA
Foreign bornNative bornForeign/Native ratio (rhs)
Unemployment Rate of Foreign- and Native-Born, 2013(Percent; in descending order of foreign/native ratio)
Sources: OECD and Fund staff calculations.
0
10
20
30
40
50
60
70
80
90
100 Foreign born Native born
Employment Rate by Educational Attainment, 2012(percent)
Sources: OECD and Fund staff calculations.
Low Med HighDNK
Low Med HighFIN
Low Med HighNOR
Low Med HighSWE
0102030405060708090
100
Inactive
Unemployed
Employed
Immigrant Stock by Source and LF Status, 2010(share of total, percent)
Sources: OECD and Fund staff calculations.
Nor
dic
OEC
D
Non
-OEC
D
Nor
dic
Nor
dic
Nor
dic
OEC
D
OEC
D
OEC
D
Non
-OEC
D
Non
-OEC
D
Non
-OEC
D
DNK FIN NOR SWE
0
5
10
15
20
25
DNK FIN NOR SWE OECD excl. Nordic
Low
Medium
High
Unemployment Rate by Skill Level, 2014 (Percent of total work force)
Sources: Eurostat and Fund staff calculations.
18
Figure 8. Wage Structure in the Nordic Countries
In addition, reservation wages are elevated by the generous social supports including (i) unemployment benefits (e.g., Finland has the highest net replacement rate for long term unemployment among the four Nordic countries, and with a long duration—currently at 500 days), (ii) health-related benefits (e.g., Norway spends the most among the OECD on disability and sickness benefits, close to 6 percent of GDP), and (iii) social assistance. Finally, while hiring/firing rules are generally flexible in the Nordics, Sweden in particular has high employment protection for regular contract workers combined with low protection for temporary workers—an asymmetry that is often associated with increased labor market duality, measured by the share of employees in non-permanent contracts. Labor market duality tends to push the lower skilled including immigrants into taking temporary jobs with little protection, making unemployment more likely (Schindler, 2014).
B. A Quantitative Perspective
Empirically assessing the impact of migration on the host economy’s labor market is a challenging task. Beyond the immediate increase in labor supply, the effect on labor market outcomes such as employment and wages depends on the skill structure of the immigrants and whether it complements or substitutes that of native workers. The aggregate effects often mask substantial heterogeneity across the different segments of the population, such as the young and low skilled. Empirical evaluation is further complicated by the fact that—as demonstrated in the driver analysis in the previous section—migration in many cases is not an exogenous event but responds to macroeconomic and labor market conditions in the host economy, creating an endogeneity bias. Last but not least, beyond the short-run adjustment in wages and employment, the output mix and technology could also adjust to the new skill mix in the longer run (see e.g. Dustmann et al. (2007) for a survey of the theory and empirics of migration). The rest of this subsection attempts to quantify the short-term labor market impacts of migration on the host economy using two complementary approaches. First, a panel regression framework is used to estimate the effect of migration on unemployment developments in a sample of OECD countries, focusing on both aggregate unemployment and on unemployment among different labor market groups. Second, the cross-country analysis is supplemented with a “spatial correlations” analysis of Danish regional labor
1
2
3
4
5
6
7
USA
ISRTU
RKO
RCH
LPO
LESTIRLPRTCANH
UN
SVKG
BRAU
SCZEAU
TSVND
EULU
XESPFRAJPNN
ZLN
LDISLD
NK
GRE
CHE
FINBELN
OR
ITASW
E
2013 2000
Wage Dispersion (Ratio of gross earnings, 90th/10th percentile)
Sources: OECD and Fund staff calculations.
OECD 2013 Average
AUS
AUT
BEL
CANCZE
DNK
EST
FIN FRA
DEU
GRE
HUN
IRLITA
LUX
NLD
NOR
POL
PRTSVN
ESP
SWE
CHE
TURGBR
USA
-4
-2
0
2
4
6
8
10
12
14
2 3 4 5Fore
ign-
nativ
e un
empl
oym
ent g
ap (p
erce
nt)
Wage ratio (90th/10th percentile)Sources: OECD and Fund staff calculations.
Wage Structure and Labor Market Outcomes of Immigrants, 2013

19
markets in an attempt to achieve better identification of the labor market effects. Finally, the roles of labor market policies and institutions in affecting immigrants’ unemployment outcomes are investigated. Panel regression approach
We estimate a baseline model of the form:
, (2)
Equation (2) relates , the unemployment rate among group k in host country i and year t, to the one year lag of the share of migrants in the labor force, , , and a vector of control variables (e.g., the output gap to capture the economy’s cyclical position). To explore the possibility that migration has heterogeneous effects on different labor market groups, we consider unemployment outcomes for different segments of the population (e.g., foreign vs. native born workers, workers of various educational levels, and youth) in addition to aggregate unemployment. A full set of country and year fixed effects are included to remove the effects of time-invariant unobserved heterogeneity and common shocks. The baseline model is estimated using Ordinary Least Squares (OLS). To check robustness, we also present results from a dynamic version of model (2) (i.e. including the lagged unemployment rate as an explanatory variable). These are estimated using system Generalized Method of Moments (GMM) a la Arellano and Bond (1991) to correct for endogeneity of migration (i.e. resulting from the fact that individuals base their migration decision on labor market conditions in the host country, among other factors) as well as potential dynamic bias due to correlation between country fixed effects and the lagged dependent variable. For both static and dynamic versions, the estimation sample covers 22 advanced OECD countries over 1995–2012. The expanded sample of host countries beyond the Nordics aims to utilize the richer cross-sectional variation in migration and labor market experiences. OLS results are reported in Table 5, and GMM results in Table 6. OLS results indicate that, on average, an increase in migration is associated with a subsequent rise in unemployment in the host country (Table 5). In particular, a one percentage point increase in the migrant share of the labor force—which must mean that net migration inflows in that particular year exceed the growth in the native workforce16—is estimated to increase the overall unemployment rate by 0.25 percentage points (Column 1). Higher unemployment affects both the foreign and native born population. An increase in migration is estimated to raise the unemployment rate among the foreign born population (Column 2), perhaps not surprisingly as studies for various countries have found that newly arrived immigrants tend to experience less favorable labor market outcomes compared to the “settled” immigrant population, possibly due to language problems or missing qualifications. Higher migration is also associated with a higher unemployment rate among native workers (Column 3), although the estimated increase in native unemployment is smaller than that of foreign born workers. Although these findings give a sense of the average effects, we would 16 A higher share can also result from more existing immigrants deciding to join the labor force.

20
expect the precise labor market impact on native workers in each country to be highly dependent on the specific skill distribution of both the immigrants and the native born workforce (see e.g. Dustmann and others (2005) for a discussion). The estimates also suggest that migration tends to have the largest immediate impacts on the young and the low skilled segments of the labor market (Columns 4–7). For example, a one percentage point increase in the share of migrants in the labor force is estimated to raise the youth unemployment rate by 0.53 percentage points compared to 0.25 percentage points for overall unemployment, and the difference is statistically significant at any conventional level. This likely reflects a tendency for migrants to be younger than the average worker. In addition, workers with lower levels of education generally experience a larger increase in unemployment in response to a migration shock, reflecting the fact that immigrants to advanced OECD countries tend to be less educated compared to the native population. The differences in the estimates among educational levels are also statistically significant.
GMM estimation of the dynamic model instrumenting for the migration variable gives a broadly similar picture, albeit with the magnitude of the unemployment impact found to be smaller (Table 6). For example, the estimated increase in overall unemployment associated with a one percentage point increase in the migrant share is lower at 0.15 percentage points compared to 0.25 percentage points in the static OLS specification. However, the initial response is compounded by the persistence of the unemployment shock, as measured by the auto-regressive coefficient (0.63). Thus, although the model allows for only one lag of the migration variable, the impact on unemployment would last for a few years through the persistence term.17
17 See e.g. Jean and Jimenez (2007) for an alternative specification that explicitly allows for dynamic impact of migration. They find that an increase in the share of immigrants in the labor force increases temporarily natives’ unemployment, over a period of approximately five to ten years.
-0.2
0
0.2
0.4
0.6
0.8
1
Short-Run Unemployment Impact for Different Groups(Percentage points)
Source: Fund staff estimates.Note: Red square denotes the estimated mean response, black line denotes 90% confidence interval.
Total Foreign- Native- Low skilled Medium High skilled Youthborn born skilled
21
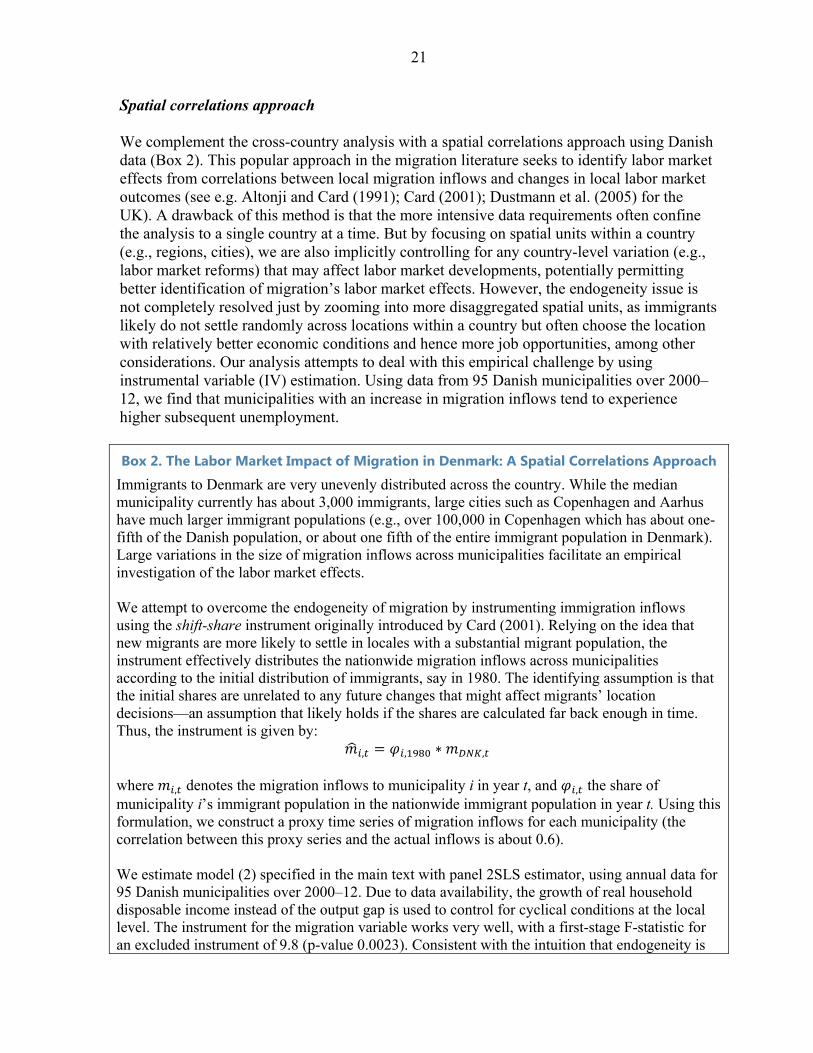
Spatial correlations approach We complement the cross-country analysis with a spatial correlations approach using Danish data (Box 2). This popular approach in the migration literature seeks to identify labor market effects from correlations between local migration inflows and changes in local labor market outcomes (see e.g. Altonji and Card (1991); Card (2001); Dustmann et al. (2005) for the UK). A drawback of this method is that the more intensive data requirements often confine the analysis to a single country at a time. But by focusing on spatial units within a country (e.g., regions, cities), we are also implicitly controlling for any country-level variation (e.g., labor market reforms) that may affect labor market developments, potentially permitting better identification of migration’s labor market effects. However, the endogeneity issue is not completely resolved just by zooming into more disaggregated spatial units, as immigrants likely do not settle randomly across locations within a country but often choose the location with relatively better economic conditions and hence more job opportunities, among other considerations. Our analysis attempts to deal with this empirical challenge by using instrumental variable (IV) estimation. Using data from 95 Danish municipalities over 2000–12, we find that municipalities with an increase in migration inflows tend to experience higher subsequent unemployment.
Box 2. The Labor Market Impact of Migration in Denmark: A Spatial Correlations Approach
Immigrants to Denmark are very unevenly distributed across the country. While the median municipality currently has about 3,000 immigrants, large cities such as Copenhagen and Aarhus have much larger immigrant populations (e.g., over 100,000 in Copenhagen which has about one-fifth of the Danish population, or about one fifth of the entire immigrant population in Denmark). Large variations in the size of migration inflows across municipalities facilitate an empirical investigation of the labor market effects. We attempt to overcome the endogeneity of migration by instrumenting immigration inflows using the shift-share instrument originally introduced by Card (2001). Relying on the idea that new migrants are more likely to settle in locales with a substantial migrant population, the instrument effectively distributes the nationwide migration inflows across municipalities according to the initial distribution of immigrants, say in 1980. The identifying assumption is that the initial shares are unrelated to any future changes that might affect migrants’ location decisions—an assumption that likely holds if the shares are calculated far back enough in time. Thus, the instrument is given by:
, , ∗ , where , denotes the migration inflows to municipality i in year t, and , the share of municipality i’s immigrant population in the nationwide immigrant population in year t. Using this formulation, we construct a proxy time series of migration inflows for each municipality (the correlation between this proxy series and the actual inflows is about 0.6). We estimate model (2) specified in the main text with panel 2SLS estimator, using annual data for 95 Danish municipalities over 2000–12. Due to data availability, the growth of real household disposable income instead of the output gap is used to control for cyclical conditions at the local level. The instrument for the migration variable works very well, with a first-stage F-statistic for an excluded instrument of 9.8 (p-value 0.0023). Consistent with the intuition that endogeneity is
22
Box 2. The Labor Market Impact of Migration in Denmark: A Spatial Correlations Approach (concluded)
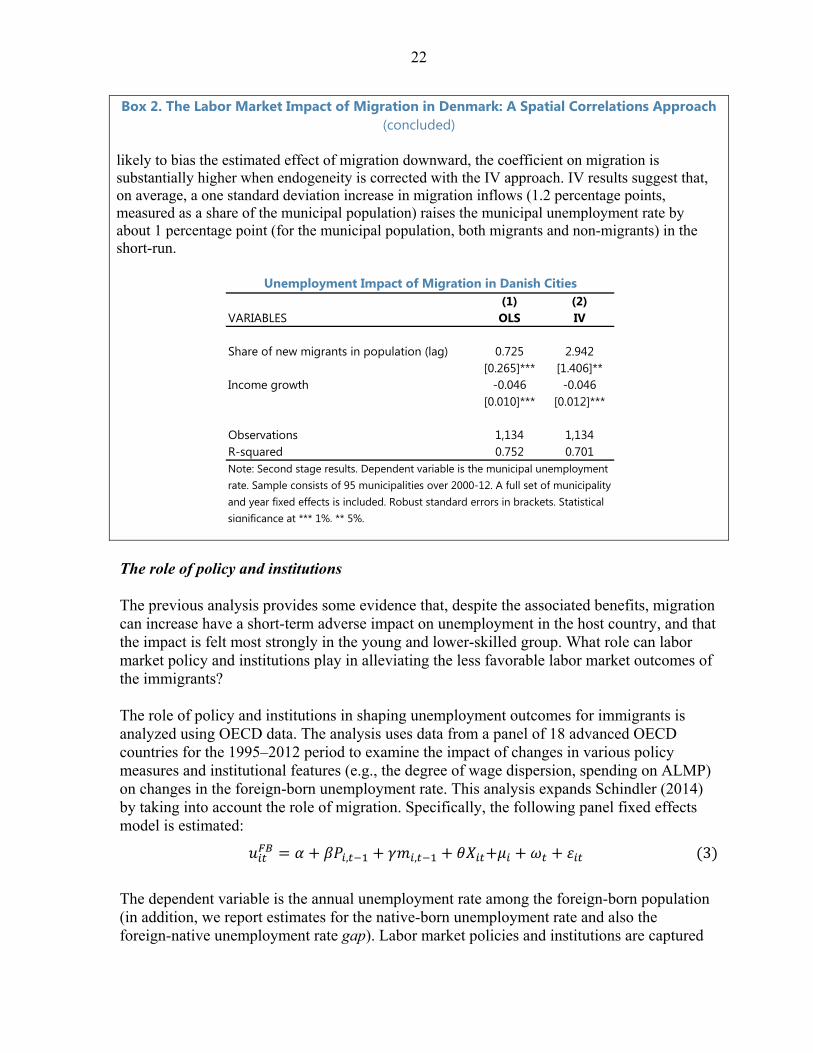
likely to bias the estimated effect of migration downward, the coefficient on migration is substantially higher when endogeneity is corrected with the IV approach. IV results suggest that, on average, a one standard deviation increase in migration inflows (1.2 percentage points, measured as a share of the municipal population) raises the municipal unemployment rate by about 1 percentage point (for the municipal population, both migrants and non-migrants) in the short-run.
The role of policy and institutions The previous analysis provides some evidence that, despite the associated benefits, migration can increase have a short-term adverse impact on unemployment in the host country, and that the impact is felt most strongly in the young and lower-skilled group. What role can labor market policy and institutions play in alleviating the less favorable labor market outcomes of the immigrants? The role of policy and institutions in shaping unemployment outcomes for immigrants is analyzed using OECD data. The analysis uses data from a panel of 18 advanced OECD countries for the 1995–2012 period to examine the impact of changes in various policy measures and institutional features (e.g., the degree of wage dispersion, spending on ALMP) on changes in the foreign-born unemployment rate. This analysis expands Schindler (2014) by taking into account the role of migration. Specifically, the following panel fixed effects model is estimated:
, , 3
The dependent variable is the annual unemployment rate among the foreign-born population (in addition, we report estimates for the native-born unemployment rate and also the foreign-native unemployment rate gap). Labor market policies and institutions are captured
(1) (2)VARIABLES OLS IV
Share of new migrants in population (lag) 0.725 2.942[0.265]*** [1.406]**
Income growth -0.046 -0.046[0.010]*** [0.012]***
Observations 1,134 1,134R-squared 0.752 0.701Note: Second stage results. Dependent variable is the municipal unemployment rate. Sample consists of 95 municipalities over 2000-12. A full set of municipality and year fixed effects is included. Robust standard errors in brackets. Statistical significance at *** 1%, ** 5%.
Unemployment Impact of Migration in Danish Cities

23
in the vector , . The model includes the share of migrants in the labor force, , , to allow shocks to migration to influence the short-term unemployment dynamics, and a vector of control variables (e.g., the output gap to capture the economy’s cyclical position). A full set of country and year fixed effects are included to remove the effects of time-invariant unobserved heterogeneity and common shocks. This simple specification is intended to illustrate the longer-term equilibrium relationships between foreign-born unemployment and various policy variables, rather than providing an accounting for unemployment dynamics. It is found that the wage structure, active labor market policy, and the design of employment protection legislation (EPL) play an important role (Table 7). A less compressed wage distribution and higher spending per unemployed on activation measures are associated with lower foreign-born unemployment rates, although the magnitude of these effects is somewhat reduced when other policies are accounted for (Column 7). The size of the impact is economically significant; for example, a one standard deviation increase in the 90th/10th percentile wage ratio is estimated to reduce the foreign-born unemployment rate by 5.5 percentage points. In addition, greater asymmetry in the strictness of employment protection between regular and temporary contracts—a feature often associated with labor market duality—is associated with higher unemployment rates for the foreign born. Interestingly, the analysis does not find a statistically significant impact from other policies on immigrant unemployment, such as unemployment benefits, disability pensions, or the labor tax wedge, even though these policies are found to influence the labor market outcomes of native workers. For example, a higher unemployment benefit replacement rate is associated with higher native-born unemployment (Column 8), as more generous unemployment insurance systems provide incentives for individuals to be more selective about job offers and search for longer.18 It is worth noting that while higher wage dispersion and ALMP spending also help reduce native-born unemployment, the estimated effects on foreign-born unemployment are much higher (and the differences are statistically significant at conventional levels), such that the foreign-native gap is narrowed as a result (Column 9). Based on these estimates, adjustments in some elements of the Nordic labor market model could significantly improve labor market outcomes for migrants. As discussed, the strong collective bargaining system that characterizes the Nordic model has created a high degree of compression in the wage distribution, especially in Sweden and Norway, compared to elsewhere in the OECD. As a crude illustration, increasing Nordic wage dispersion, as measured by the 90th/10th percentile wage ratio, to the average OECD level is estimated to reduce the equilibrium foreign-born unemployment rate by over 10 percentage points for the average Nordic country, and by 12 percentage points in Sweden—or more than enough to close the observed foreign-native unemployment gap. Without implying that the average OECD level represents an “optimal” benchmark, the example illustrates that even more modest increases in wage differentiation are estimated to enable fairly large gains in terms of a reduction in foreign-born unemployment rates. 18 The finding that this tension is not apparent for foreign workers may reflect the fact that in many cases the immigrants are not eligible for unemployment assistance, especially immediately upon arrival.
24
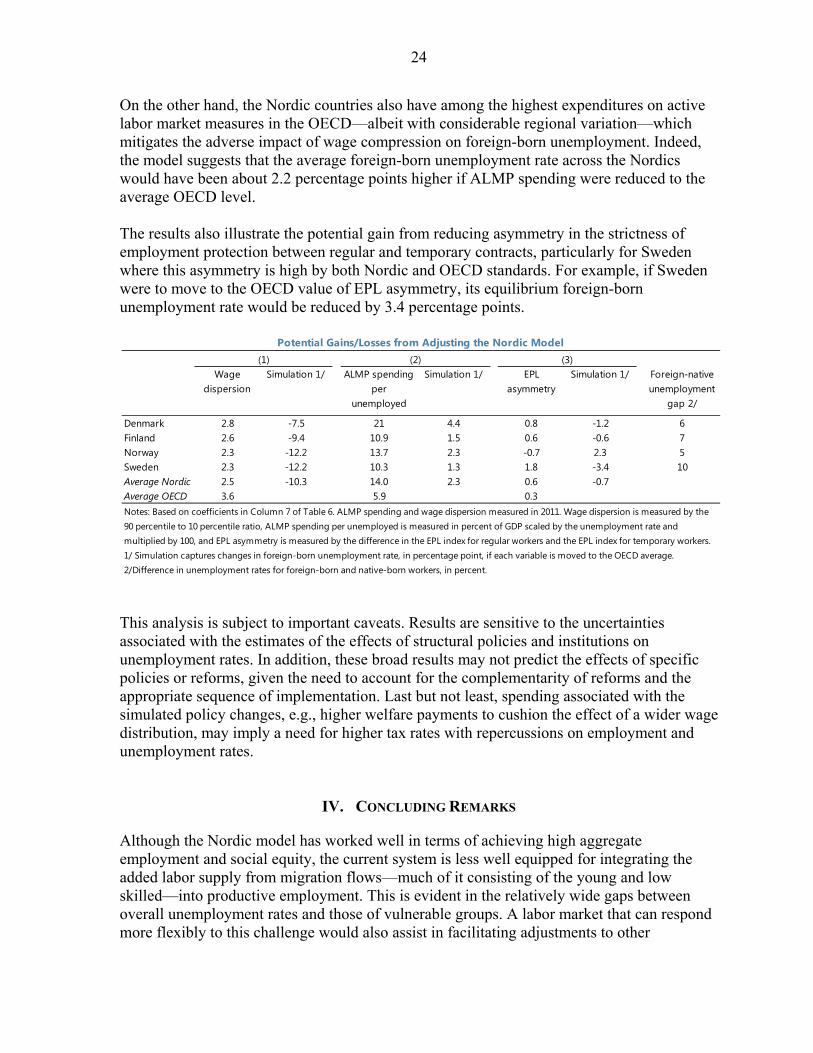
On the other hand, the Nordic countries also have among the highest expenditures on active labor market measures in the OECD—albeit with considerable regional variation—which mitigates the adverse impact of wage compression on foreign-born unemployment. Indeed, the model suggests that the average foreign-born unemployment rate across the Nordics would have been about 2.2 percentage points higher if ALMP spending were reduced to the average OECD level. The results also illustrate the potential gain from reducing asymmetry in the strictness of employment protection between regular and temporary contracts, particularly for Sweden where this asymmetry is high by both Nordic and OECD standards. For example, if Sweden were to move to the OECD value of EPL asymmetry, its equilibrium foreign-born unemployment rate would be reduced by 3.4 percentage points.
This analysis is subject to important caveats. Results are sensitive to the uncertainties associated with the estimates of the effects of structural policies and institutions on unemployment rates. In addition, these broad results may not predict the effects of specific policies or reforms, given the need to account for the complementarity of reforms and the appropriate sequence of implementation. Last but not least, spending associated with the simulated policy changes, e.g., higher welfare payments to cushion the effect of a wider wage distribution, may imply a need for higher tax rates with repercussions on employment and unemployment rates.
IV. CONCLUDING REMARKS
Although the Nordic model has worked well in terms of achieving high aggregate employment and social equity, the current system is less well equipped for integrating the added labor supply from migration flows—much of it consisting of the young and low skilled—into productive employment. This is evident in the relatively wide gaps between overall unemployment rates and those of vulnerable groups. A labor market that can respond more flexibly to this challenge would also assist in facilitating adjustments to other
Wage dispersion
Simulation 1/ ALMP spending per
unemployed
Simulation 1/ EPL asymmetry
Simulation 1/ Foreign-native unemployment
gap 2/
Denmark 2.8 -7.5 21 4.4 0.8 -1.2 6Finland 2.6 -9.4 10.9 1.5 0.6 -0.6 7Norway 2.3 -12.2 13.7 2.3 -0.7 2.3 5Sweden 2.3 -12.2 10.3 1.3 1.8 -3.4 10Average Nordic 2.5 -10.3 14.0 2.3 0.6 -0.7Average OECD 3.6 5.9 0.3Notes: Based on coefficients in Column 7 of Table 6. ALMP spending and wage dispersion measured in 2011. Wage dispersion is measured by the 90 percentile to 10 percentile ratio, ALMP spending per unemployed is measured in percent of GDP scaled by the unemployment rate and multiplied by 100, and EPL asymmetry is measured by the difference in the EPL index for regular workers and the EPL index for temporary workers. 1/ Simulation captures changes in foreign-born unemployment rate, in percentage point, if each variable is moved to the OECD average. 2/Difference in unemployment rates for foreign-born and native-born workers, in percent.
(1) (2) (3)
Potential Gains/Losses from Adjusting the Nordic Model
25
challenges, including the broader structural changes that are taking place in some Nordic economies (e.g., Finland after a combination of structural shocks including Nokia, and Norway’s transition to a new, less oil-dependent growth model).
The foregoing analysis suggests that addressing the challenges associated with higher immigration would benefit from adaptations to the Nordic labor market model while preserving its substantial strengths. The analysis points to reform needs along a number of dimensions:
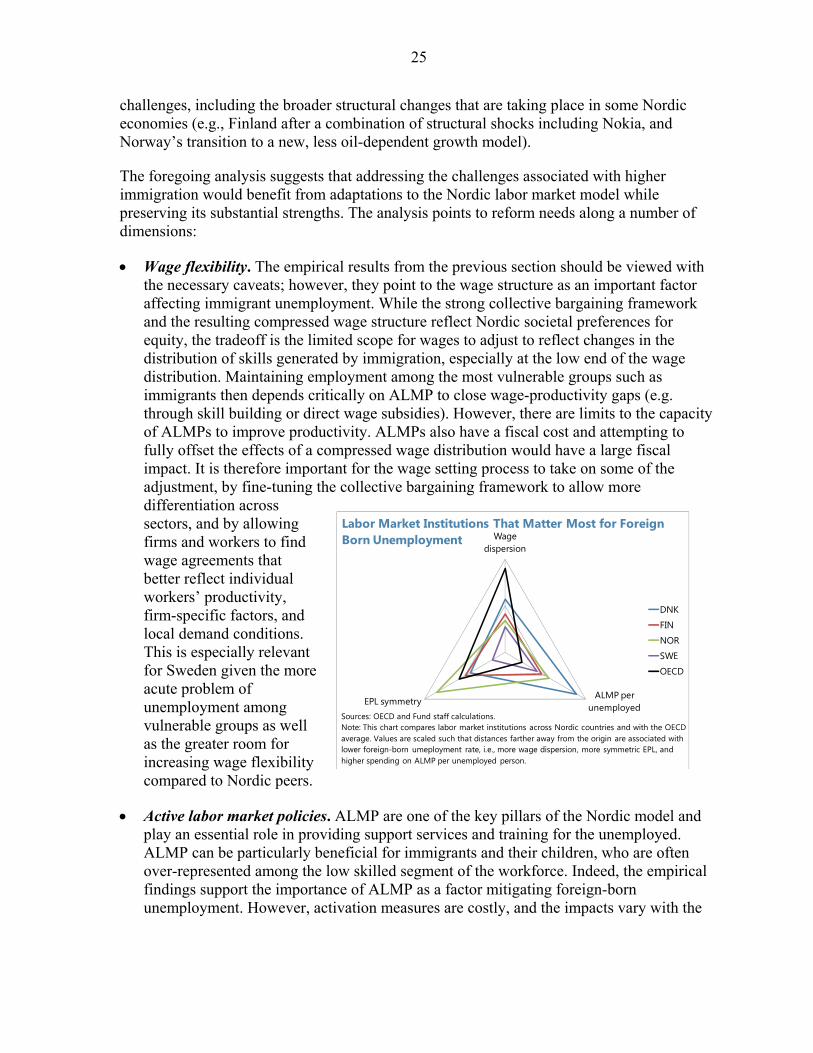
Wage flexibility. The empirical results from the previous section should be viewed with the necessary caveats; however, they point to the wage structure as an important factor affecting immigrant unemployment. While the strong collective bargaining framework and the resulting compressed wage structure reflect Nordic societal preferences for equity, the tradeoff is the limited scope for wages to adjust to reflect changes in the distribution of skills generated by immigration, especially at the low end of the wage distribution. Maintaining employment among the most vulnerable groups such as immigrants then depends critically on ALMP to close wage-productivity gaps (e.g. through skill building or direct wage subsidies). However, there are limits to the capacity of ALMPs to improve productivity. ALMPs also have a fiscal cost and attempting to fully offset the effects of a compressed wage distribution would have a large fiscal impact. It is therefore important for the wage setting process to take on some of the adjustment, by fine-tuning the collective bargaining framework to allow more differentiation across sectors, and by allowing firms and workers to find wage agreements that better reflect individual workers’ productivity, firm-specific factors, and local demand conditions. This is especially relevant for Sweden given the more acute problem of unemployment among vulnerable groups as well as the greater room for increasing wage flexibility compared to Nordic peers.
Active labor market policies. ALMP are one of the key pillars of the Nordic model and play an essential role in providing support services and training for the unemployed. ALMP can be particularly beneficial for immigrants and their children, who are often over-represented among the low skilled segment of the workforce. Indeed, the empirical findings support the importance of ALMP as a factor mitigating foreign-born unemployment. However, activation measures are costly, and the impacts vary with the
Wage dispersion
ALMP per unemployed
EPL symmetry
DNK
FIN
NOR
SWE
OECD
Labor Market Institutions That Matter Most for Foreign Born Unemployment
Sources: OECD and Fund staff calculations.Note: This chart compares labor market institutions across Nordic countries and with the OECDaverage. Values are scaled such that distances farther away from the origin are associated withlower foreign-born umeployment rate, i.e., more wage dispersion, more symmetric EPL, andhigher spending on ALMP per unemployed person.
26
type of programs, the participant groups, the time horizon, as well as the macroeconomic and labor market context in which programs take place.19 Thus, better prioritization and targeting of measures is key to maximize the impact of ALMP. For example, in the case of Sweden, greater emphasis of ALMPs on training, particularly on programs that meet employers’ needs (e.g., work-place training), and job matching services would be helpful (El-Ganainy, 2015). For Norway, further efforts should be made to tailor active programs to the needs of the various groups, such as the vocationally disabled, the economic immigrants, and older/younger workers (Duell et al., 2009; OECD, 2013 and 2014).
Employment protection. The analysis also finds evidence that asymmetry in EPL between permanent and temporary workers exacerbates the unemployment problem of the foreign born. As discussed, Sweden has one of the most asymmetric EPL in Europe—while restrictions on fixed term contracts and temporary work agencies have been eased significantly since the late 1980s, the strict regulations for regular employment have remained unchanged for decades. The resulting dualistic labor market security provides stability for those with a regular contract, but it tends to increase the incidence of temporary work. While temporary employment could serve as a stepping stone into the labor market, as shown in Hartman and others (2010) for Sweden, adverse effects on exit rates from unemployment prolong the average unemployment spell (OECD, 2004). High exit costs may also increase risk aversion in hiring, resulting in high implicit education and skill requirements that may have greater adverse impacts on foreign born workers. Reducing this asymmetry by scaling down job security rules for regular contracts would help alleviate the extent of labor market duality and its adverse consequences for immigrants’ labor market outcomes.
Social support design. More generally, it is important to design labor market measures with a view to striking a balance between protecting vulnerable groups against labor market risks and ensuring appropriate incentives to work. This could be achieved via, for example, greater use of intensified activation (e.g., job seekers are required to attend an ALMP program as a condition for continuing benefit eligibility).
Steps in the right direction are underway but further efforts will be needed for the Nordic countries to enjoy the full potential benefits that immigration brings. The Nordic countries have recently implemented a number of reforms to adapt to the changing labor market conditions and needs in recent years (Annexes III and IV). While the focus differs across the region, they share the common themes of restricting the eligibility or the generosity of unemployment and health-related benefits to improve work incentives, encouraging participation by younger and older workers, and providing greater support services for the 19 See e.g. Card et al. (2015) who conducted a meta-analysis of over 200 impact evaluations of recent ALMP programs around the world (over a quarter of which are in Nordic countries). They found that ALMPs generally have relatively small effects in the short run but larger positive effects in the medium and longer run (more than 1 year post program); job search assistance and sanction programs (i.e. sanctions for failing to search, including threat of assignment to a program) have relatively large short-term impacts, while training and private sector employment programs have larger effects in the medium and longer run; ALMPs have larger effects on women and the long-term unemployed, and smaller effects for older workers and youth; and finally ALMPs have larger effects in periods of slow growth and higher unemployment.

27
unemployed and disadvantaged groups by increasing resources for ALMPs or making them more effectively targeted. These steps will support labor supply and employment, yet deeper reforms are likely needed to facilitate the integration of migrants into these economies.
28
References
Alvarez, F. and R. Shimer, 2011, ”Search and Rest Unemployment,” Econometrica, Vol. 79, pp. 75–122.
Altonji, J. and D. Card, 1991, “The Effects of Immigration on the Labor Market Outcomes of Less Skilled Natives,” in J. M. Abowd and R. B. Freeman (Eds.), Immigration, Trade, and the Labor Market, Chapter 7, pp 201-34, Chicago: University of Chicago Press.
Andersen, S. K., J. E. Dolvik, and C. L. Ibsen, 2014, “The Nordic Labor Market Models in Open Markets—Challenges and Perspectives,” Fafo-report 2014:13.
Anderson, R. and others, 2010, “Immigration, Housing and Segregation in the Nordic Welfare States,” University of Helsinki.
Arellano, M., and S. Bond, 1991, “Some Tests of Specification for Panel Data: Monte Carlo Evidence and an Application to Employment Equations,” Review of Economic Studies, Vol. 58, pp 277–297.
Bentolila, S., J. Dolado, and J. Jimeno, 2007, “Does Immigration Affect the Phillips Curve? Some Evidence for Spain,” IZA Discussion Paper No. 3249.
Bevelander, P. and N. Irastorza, 2014, “Catching Up: The Labor Market Integration of New Immigrants in Sweden,” Migration Policy Institute and ILO.
Boubtane, E., D. Coulibaly, and C. Rault, 2012, “Immigration, Growth and Unemployment: Panel VAR Evidence from OECD Countries,” IZA working paper No. 6966.
Bratsberg, B., O. Raaum, and K. Roed, 2014, “Labor Migrant Adjustments in the Aftermath of the Financial Crisis,” Center for Research and Analysis of Migration Discussion Paper Series No. 19/14.
Cahuc, P. and A. Zylberberg, 2004, Labor Economics (Cambridge: MIT).
Card, D., 2001, “Immigrant Inflows, Native Outflows, and the Local Labor Market Impacts of Higher Immigration, “Journal of Labor Economics, Vol. 19, No. 1, pp 22-64.
Card, D., J. Kluve, and A. Weber, 2015, “What Works? A Meta Analysis of Recent Active Labor Market Program Evaluations,” NBER Working Paper 21431.
Duell, N., S. Singh, and P. Tergeist, 2009, “Activation Policies in Norway,” OECD Social, Employment and Migration Working Paper No. 78.
Dustmann, C., F. Fabbri, and I. Preston, 2005, “The Impact of Immigration on the British Labor Market,” Economic Journal, Vol. 115, No. 507, pp 324-41.
29
Dustmann, C., T. Frattini, and A. Glitz, 2007, “The Impact of Migration: A Review of Economic Evidence,” Center for Research and Analysis of Migration Final Report, November 2007.
ElGanainy, Asmaa, “The Swedish Labor Market Needs Further Adaptation,” Sweden: Selected Issues Paper, IMF Country Report, forthcoming.
Engler, P., 2007, “Gains from Migration in a New-Keynesian Framework,” mimeo, Free University of Berlin.
Halvorsen, B., O-J Hansen, J. Tagtstrom, and R. Flo, 2013, “Creating an Inclusive Labor Market: Inclusion of Youths, People with Disabilities and Seniors,” Nordic Council of Ministers Report.
Hanson, G. H. and A. Spilimbergo, 1999, "Illegal Immigration, Border Enforcement, and Relative Wages: Evidence from Apprehensions at the U.S.-Mexico Border," American Economic Review, Vol. 89, Issue 5, pp. 1337-1357.
Hartman, L., L. Liljeberg, and O.N. Skans, 2010, “Stepping Stones, Dead Ends, or Both? An Analysis of Swedish Replacement Contracts,” Empirical Economics, Vol. 38, pp. 645-668.
IMF, 2014a, “Denmark: Staff Report for Article IV Consultation,” IMF Country Report 14/331.
IMF, 2014b, “Finland: Staff Report for Article IV Consultation,” IMF Country Report 14/139.
IMF, 2015a, “Sweden: Selected Issues Paper,” forthcoming.
Jean, S. and M. Jimenez, 2007, “The Unemployment Impact of Immigration in OECD Countries,” OECD Economics Department Working Paper No. 563.
Kahn, L., 1998, “Collective Bargaining and the Inter-industry Wage Structure,” Economica, Vol. 65, pp. 507–534.
———, 2000, “Wage Inequality, Collective Bargaining and Relative Employment from 1985 to 1994: Evidence from Fifteen OECD Countries,” Review of Economics and Statistics, Vol. 82, pp. 564–579.
Mayda, A., 2010, “International Migration: A Panel Data Analysis of the Determinants of Bilateral Flows,” Journal of Population Economics, Vol. 23, pp 1249-74.
Nordic Council, 2013, “State of the Nordic Region,” Nordic Council Report.
OECD, 2007a, “The Labor Market Integration of Immigrants in Denmark,” OECD Social, Employment and Migration Working paper No. 50.
30
OECD, 2007b, “The Integration of Immigrants into the Labor Market: The Case of Sweden,” OECD Social, Employment and Migration Working paper No. 48.
OECD, 2009, “Jobs for Immigrants: Labor Market Integration in Norway.”
OECD, 2012, “OECD Economic Surveys: Finland 2012.”
OECD, 2013, “Mental Health and Work: Norway.”
OECD, 2014, “Recruiting Immigrant Workers: Norway 2014.”
Ortega F. and G. Peri, 2012, “The Effect of Income and Immigration Policies on International Migration,” Migration Studies, Vol. 1, No. 1, pp 47-74.
Razin, A. and Binyamini, 2007, “Flattening of the Short-Run Tradeoff between Inflation and Domestic Activity: The Analytics of the Effects of Globalization,” mimeo, Tel Aviv University.
Schindler, Martin, 2014, “The Swedish Labor Market—Responding to Global Challenges,” Sweden: Selected Issues Paper, IMF Country Report 14/262.
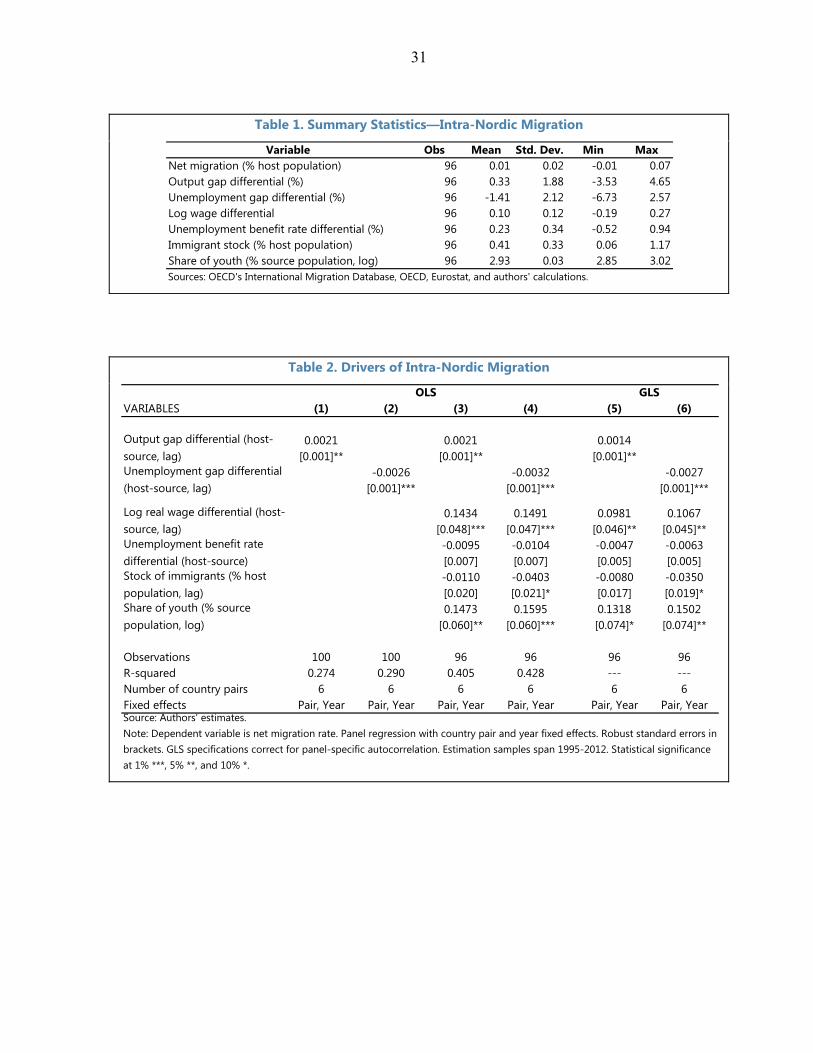
31
Table 1. Summary Statistics—Intra-Nordic Migration
Table 2. Drivers of Intra-Nordic Migration
Variable Obs Mean Std. Dev. Min MaxNet migration (% host population) 96 0.01 0.02 -0.01 0.07Output gap differential (%) 96 0.33 1.88 -3.53 4.65Unemployment gap differential (%) 96 -1.41 2.12 -6.73 2.57Log wage differential 96 0.10 0.12 -0.19 0.27Unemployment benefit rate differential (%) 96 0.23 0.34 -0.52 0.94Immigrant stock (% host population) 96 0.41 0.33 0.06 1.17Share of youth (% source population, log) 96 2.93 0.03 2.85 3.02Sources: OECD's International Migration Database, OECD, Eurostat, and authors' calculations.
VARIABLES (1) (2) (3) (4) (5) (6)
0.0021 0.0021 0.0014[0.001]** [0.001]** [0.001]**
-0.0026 -0.0032 -0.0027[0.001]*** [0.001]*** [0.001]***
0.1434 0.1491 0.0981 0.1067[0.048]*** [0.047]*** [0.046]** [0.045]**-0.0095 -0.0104 -0.0047 -0.0063[0.007] [0.007] [0.005] [0.005]-0.0110 -0.0403 -0.0080 -0.0350[0.020] [0.021]* [0.017] [0.019]*0.1473 0.1595 0.1318 0.1502
[0.060]** [0.060]*** [0.074]* [0.074]**
Observations 100 100 96 96 96 96R-squared 0.274 0.290 0.405 0.428 --- ---Number of country pairs 6 6 6 6 6 6Fixed effects Pair, Year Pair, Year Pair, Year Pair, Year Pair, Year Pair, Year
OLS GLS
Source: Authors' estimates.Note: Dependent variable is net migration rate. Panel regression with country pair and year fixed effects. Robust standard errors in brackets. GLS specifications correct for panel-specific autocorrelation. Estimation samples span 1995-2012. Statistical significance at 1% ***, 5% **, and 10% *.
Output gap differential (host-source, lag)Unemployment gap differential (host-source, lag)
Log real wage differential (host-source, lag)Unemployment benefit rate differential (host-source)Stock of immigrants (% host population, lag)Share of youth (% source population, log)

32
Table 3. Summary Statistics—Non-Nordic EU Migration
Table 4. Drivers of Non-Nordic EU Migration
Variable Obs Mean Std. Dev. Min MaxNet migration (% host population) 1164 0.003 0.02 -0.03 0.28Output gap differential (%) 1164 0.03 2.54 -9.83 7.75Unemployment gap differential (%) 1164 0.62 2.86 -9.67 8.81Log wage differential 1164 0.10 0.35 -0.46 1.03Unemployment benefit rate differential (%) 1164 0.64 0.61 -0.76 2.32Immigrant stock (% host population) 1164 0.06 0.11 0.00 1.34Share of youth (% source population, log) 1164 3.00 0.11 2.73 3.23EU access (dummy) 1164 0.11 0.31 0.00 1.00Sources: OECD's International Migration Database, OECD, Eurostat, and authors' calculations.
GLSVARIABLES (1) (2) (3) (4) (5)
0.0003 0.0004 0.0001 0.0001 0.0003[0.000]*** [0.000]*** [0.000] [0.000] [0.000]**
0.0018 0.0006[0.000]*** [0.000]*
0.0288 0.0204 0.0043 0.0300[0.006]*** [0.006]*** [0.006] [0.007]***
0.0000 0.0003 -0.0007 0.0018[0.001] [0.001] [0.001] [0.001]0.1252 0.1286 0.0734 0.1000
[0.006]*** [0.006]*** [0.017]*** [0.008]***0.0132 0.0073 0.0020 0.0141
[0.006]** [0.006] [0.006] [0.008]*EU access 0.0136 0.0114 0.0154 0.0094
[0.002]*** [0.002]*** [0.002]*** [0.002]***
0.1400[0.016]***
0.0145[0.004]***
0.0481[0.018]***
Observations 1,164 1,164 1,164 1,164 1,164R-squared 0.049 0.399 0.415 0.468 ---Number of country pairs 88 88 88 88 88Fixed effects Pair, Year Pair, Year Pair, Year Pair, Year Pair, Year
Output gap differential*EU access
NMS*Unemployment benefit differential
NMS*Stock of immigrants
NMS*Real wage differential
Source: Authors' estimates.Note: Dependent variable is net migration rate. Panel regression with country pair and year fixed effects. Sample includes 22 EU source countries and 4 Nordic host countries over 1995-2012. Robust standard errors in brackets. GLS specifications correct for panel-specific autocorrelation. Statistical significance at 1% ***, 5% **, and 10% *.
OLS
Output gap differential (host-source, lag)
Log real wage differential (host-source, lag)Unemployment benefit rate differential (host-Stock of immigrants (% host population, lag)Share of youth (% source population)
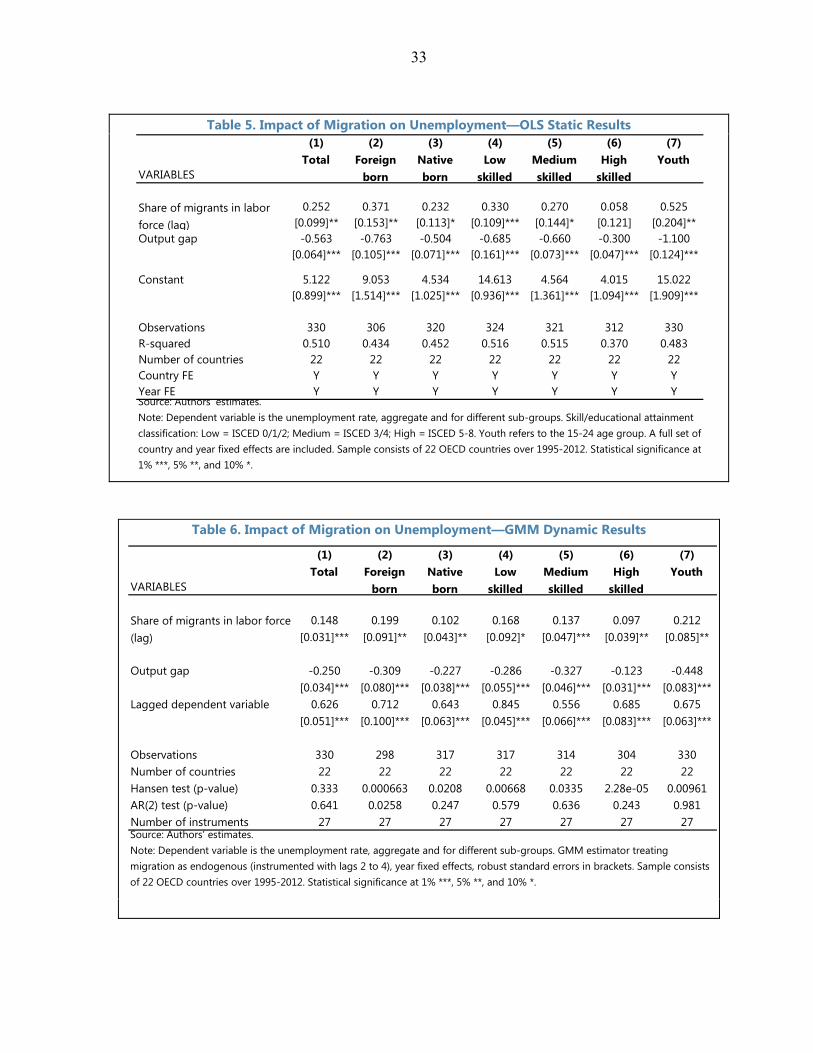
33
Table 5. Impact of Migration on Unemployment—OLS Static Results
Table 6. Impact of Migration on Unemployment—GMM Dynamic Results
(1) (2) (3) (4) (5) (6) (7)
VARIABLESTotal Foreign
bornNative born
Low skilled
Medium skilled
High skilled
Youth
0.252 0.371 0.232 0.330 0.270 0.058 0.525[0.099]** [0.153]** [0.113]* [0.109]*** [0.144]* [0.121] [0.204]**
Output gap -0.563 -0.763 -0.504 -0.685 -0.660 -0.300 -1.100[0.064]*** [0.105]*** [0.071]*** [0.161]*** [0.073]*** [0.047]*** [0.124]***
Constant 5.122 9.053 4.534 14.613 4.564 4.015 15.022[0.899]*** [1.514]*** [1.025]*** [0.936]*** [1.361]*** [1.094]*** [1.909]***
Observations 330 306 320 324 321 312 330R-squared 0.510 0.434 0.452 0.516 0.515 0.370 0.483Number of countries 22 22 22 22 22 22 22Country FE Y Y Y Y Y Y YYear FE Y Y Y Y Y Y Y
Share of migrants in labor force (lag)
Source: Authors' estimates.Note: Dependent variable is the unemployment rate, aggregate and for different sub-groups. Skill/educational attainment classification: Low = ISCED 0/1/2; Medium = ISCED 3/4; High = ISCED 5-8. Youth refers to the 15-24 age group. A full set of country and year fixed effects are included. Sample consists of 22 OECD countries over 1995-2012. Statistical significance at 1% ***, 5% **, and 10% *.
(1) (2) (3) (4) (5) (6) (7)
VARIABLESTotal Foreign
bornNative born
Low skilled
Medium skilled
High skilled
Youth
0.148 0.199 0.102 0.168 0.137 0.097 0.212[0.031]*** [0.091]** [0.043]** [0.092]* [0.047]*** [0.039]** [0.085]**
Output gap -0.250 -0.309 -0.227 -0.286 -0.327 -0.123 -0.448[0.034]*** [0.080]*** [0.038]*** [0.055]*** [0.046]*** [0.031]*** [0.083]***
Lagged dependent variable 0.626 0.712 0.643 0.845 0.556 0.685 0.675[0.051]*** [0.100]*** [0.063]*** [0.045]*** [0.066]*** [0.083]*** [0.063]***
Observations 330 298 317 317 314 304 330Number of countries 22 22 22 22 22 22 22Hansen test (p-value) 0.333 0.000663 0.0208 0.00668 0.0335 2.28e-05 0.00961AR(2) test (p-value) 0.641 0.0258 0.247 0.579 0.636 0.243 0.981Number of instruments 27 27 27 27 27 27 27
Share of migrants in labor force (lag)
Source: Authors' estimates.Note: Dependent variable is the unemployment rate, aggregate and for different sub-groups. GMM estimator treating migration as endogenous (instrumented with lags 2 to 4), year fixed effects, robust standard errors in brackets. Sample consists of 22 OECD countries over 1995-2012. Statistical significance at 1% ***, 5% **, and 10% *.
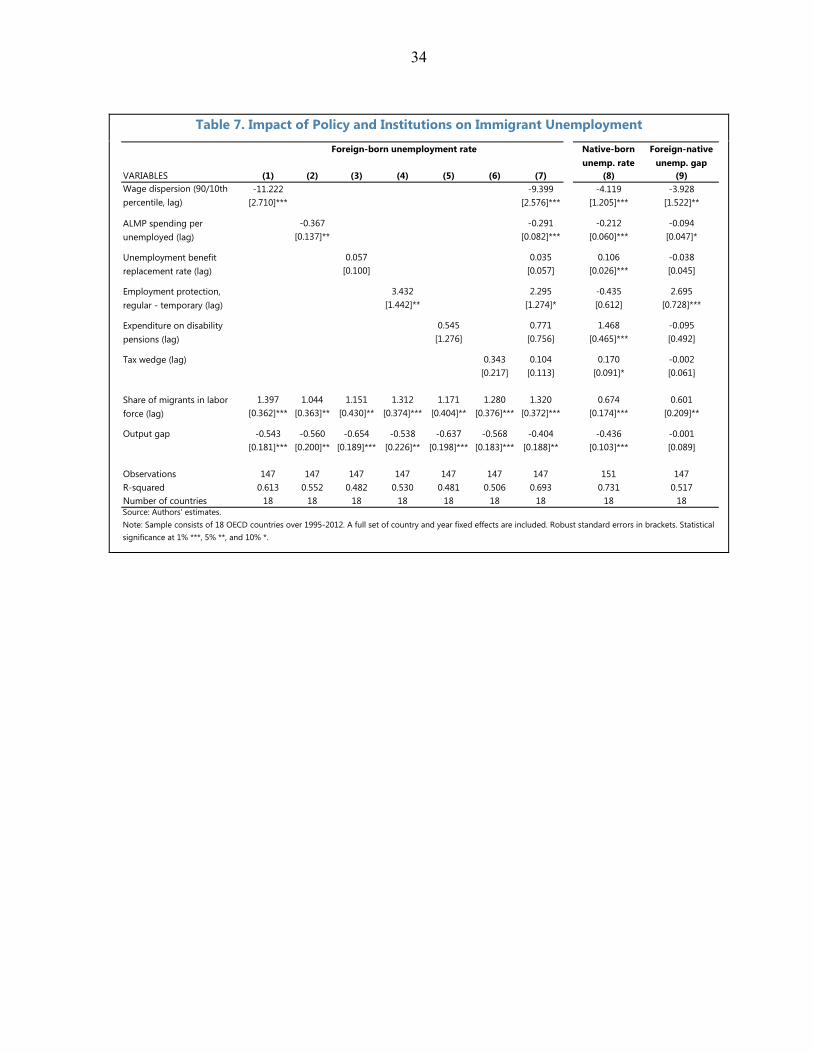
34
Table 7. Impact of Policy and Institutions on Immigrant Unemployment
Native-born unemp. rate
Foreign-native unemp. gap
VARIABLES (1) (2) (3) (4) (5) (6) (7) (8) (9)-11.222 -9.399 -4.119 -3.928
[2.710]*** [2.576]*** [1.205]*** [1.522]**
-0.367 -0.291 -0.212 -0.094[0.137]** [0.082]*** [0.060]*** [0.047]*
0.057 0.035 0.106 -0.038[0.100] [0.057] [0.026]*** [0.045]
3.432 2.295 -0.435 2.695[1.442]** [1.274]* [0.612] [0.728]***
0.545 0.771 1.468 -0.095[1.276] [0.756] [0.465]*** [0.492]
0.343 0.104 0.170 -0.002[0.217] [0.113] [0.091]* [0.061]
1.397 1.044 1.151 1.312 1.171 1.280 1.320 0.674 0.601[0.362]*** [0.363]** [0.430]** [0.374]*** [0.404]** [0.376]*** [0.372]*** [0.174]*** [0.209]**
Output gap -0.543 -0.560 -0.654 -0.538 -0.637 -0.568 -0.404 -0.436 -0.001[0.181]*** [0.200]** [0.189]*** [0.226]** [0.198]*** [0.183]*** [0.188]** [0.103]*** [0.089]
Observations 147 147 147 147 147 147 147 151 147R-squared 0.613 0.552 0.482 0.530 0.481 0.506 0.693 0.731 0.517Number of countries 18 18 18 18 18 18 18 18 18
Tax wedge (lag)
Share of migrants in labor force (lag)
Source: Authors' estimates.Note: Sample consists of 18 OECD countries over 1995-2012. A full set of country and year fixed effects are included. Robust standard errors in brackets. Statistical significance at 1% ***, 5% **, and 10% *.
Foreign-born unemployment rate
Wage dispersion (90/10th percentile, lag)
ALMP spending per unemployed (lag)
Unemployment benefit replacement rate (lag)
Employment protection, regular - temporary (lag)
Expenditure on disability pensions (lag)

35
Annex I. The Nordic Labor Market Model and its Performance The Nordic labor market model
The Nordic labor market model is often characterized as having three distinctive features: (i) flexible hiring and firing rules, (ii) generous social safety nets, and (iii) active labor market policies (ALMP). In principle, these features work together to avoid common causes of structural unemployment and foster adjustment. While jobs are not protected under flexible hiring and firing rules, workers are protected from adverse shocks via unemployment insurance and other social benefits and maintain their participation in the labor force with the help of ALMP. Another key element of the Nordic model is strong unions and a centralized collective wage bargaining system, which delivers and a relatively compressed wage structure (see Annex II for more detail). ALMP play an important role in supporting the combination of high wage floors and low unemployment by enhancing skills and partly by subsidizing low-productivity workers. In practice, the degree to which these elements are applied varies across Nordic countries despite a popular belief that these countries share more or less the same model.
OECD indicators point to both similarities and differences in labor market institutions across Nordic countries (Figure A.1): Employment protection: Data from the OECD indicate that employment protection
for temporary contracts is lower in the Nordic-4 except Norway than the OECD average, with Sweden having the lowest protection among the four countries. Protection for regular contracts is somewhat higher than the OECD average, with Sweden’s protection for regular contracts being among the highest. As a result, Sweden has the largest gap between regular and temporary contract indicators in the OECD. Nonetheless, in practice labor market flexibility may be higher than implied by the OECD indicators as labor turnover is relatively high in the Nordic countries, especially among the lower-skilled group. While this allows for firms to adjust to shocks, it can contribute to higher unemployment among the vulnerable groups, such as youth and immigrants.
Unemployment benefits: While unemployment benefits for short-term unemployment in the Nordics are around the OECD average level or only slightly more generous, the average net replacement rate for long-term unemployment (more than 60 months) is substantially higher in Nordic-4 compared to many other OECD countries. Finland has the highest net replacement rate for long term unemployment among the four (with long duration, currently at 500 days), followed by Sweden. On one hand, unemployment insurance cushions the financial impact of a job loss and helps the unemployed search for their next job. On the other, more generous and longer-lasting unemployment benefits can increase the unemployed workers’ reservation wages, thereby reducing their incentives to accept jobs at wages that might otherwise be acceptable and lengthening unemployment spells further.

36
Figure A.1. Labor Market Institutions OECD indicators show lower than average protection for temporary contracts but higher than average for regular contracts…
…but high labor turnover suggests significant labor market flexibility in practice.
Unemployment benefits, especially for long-term unemployment, are generous, …
…and health-related benefit expenditures are among the highest in the OECD.
Unions play an important role in wage setting in the Nordic countries and union density is high.
High spending on active labor market measures is a distinctive Nordic characteristic.
0
1
2
3
4
5
6
TUR
LUX
FRACH
LESTN
OR
ESPBELG
REKO
RM
EXITAPRTSVNPO
LSVKFINCZED
NK
AU
TH
UN
DEU
CHE
NZL
NLD
AU
SISRJPNSW
EISLIRLG
BRCA
NU
SA
Temporary contracts
Regular contracts
Strictness of Employment Protection(Index, 2013)
Sources: OECD and Fund staff calculations.
OECD average (temporary contracts)
0
5
10
15
20
25
30
35
TUR
MEX
USA
DN
KAU
SFINSW
EBRACANESTISLCH
EN
OR
ESPAU
TN
LDD
EUG
BRFRAH
UN
PRTBELPO
LIRLSVNCZELU
XITASVKG
RC
All employed individualsTertiary educationLow or no formal education
Labor Turnover by Educational Attainment, 2011(Individuals less than 1 year in current job, percent of employment)
Sources: OECD and Fund staff calculations.
0
10
20
30
40
50
60
70
BELA
UT
IREN
ZLA
US
FINFRAD
EUSW
EISLESPPRTD
NK
NO
RG
BRN
LDCH
ECA
NLU
XCH
FSVNU
SASVKPO
LESTJPNISRH
UN
GRC
ITATU
RCZEKO
R
Unemployment Benefits Net Replacement Rates(Percent, over 60 months of unemployment)
Sources: OECD and Fund staff calculations.
OECD average
0
1
2
3
4
5
6
NO
RISLN
LDD
NK
FINSW
EG
BRA
UT
CHE
DEU
ESPIRLLU
XBELCZEH
UN
USA
AU
SSVNESTPO
LPRTFRAISRSVKN
ZLITAG
RCCH
LJPNCA
NTU
RKO
RM
EX
20092000
OECD 2009
Expenditure on Disability and Sickness(Percent of GDP)
Sources: OECD and Fund staff calculations.
0
10
20
30
40
50
60
70
80
90ISLFINSW
ED
NK
BELN
OR
ITALU
XIRLCA
NA
UT
GBR
GRE
PRTN
ZLA
US
JPND
EUN
LDESPSVKCH
ECH
LM
EXCZEPO
LU
SAH
UN
FRAESTTU
R
Trade Union Density(Percent, 2012)
Sources: OECD and Fund staff calculations.
OECD average
0
0.5
1
1.5
2
2.5
DN
KSW
EFINN
LDFRABELA
UT
HU
ND
EUCH
EN
OR
PRTITAKO
RESTN
ZLSVNCZESVKCA
NJPNU
SACH
LM
EX
Active Labor Market Programs(Public expenditure, percent of GDP)
Sources: OECD and Fund staff calculations.
OECD average

37
Health-related benefits: By OECD standards, the Nordic countries spend a large amount on disability and sickness related expenditure, over 3 percent of GDP in most countries and close to 6 percent in Norway. In Norway, for example, about 10 percent of the 20–64 aged population are recipients of disability benefits, with low outflows from disability claims. Sickness absence is also prevalent in all Nordic countries with the exception of Denmark, and its impact in terms of lost working hours is significant. This stands in contrast to the general good health indicators of the Nordic population, and has created a group of workers excluded from the labor market.
Active labor market policies: ALMP play an important role in all Nordic countries. Expenditure on active measures in Denmark, Finland and Sweden are ranked at the highest three among the OECD countries, whereas in Norway it is lower than the OECD average, partly reflecting the relatively low unemployment rate. Labor market measures in all Nordic countries intensified sharply in the aftermath of the global crisis. The balance between universal and more targeted measures varies across the region, with Denmark having a more goal-oriented strategy, Norway more universal, and Sweden and Finland somewhere in between (Halvorsen and others, 2013).
Union density: Union density is distinctively high in Nordic-4 compared with other OECD countries. This reflects a particular Nordic institutional setting: unlike other European labor markets, the Nordic markets are not heavily regulated, and collective agreements serve the functions that legal regulations do in other European countries (Nordic Council, 2013). Union density and collective agreement coverage is somewhat lower in Norway than in other Nordic countries, but Norway also imposes mandatory extensions of collective agreements to certain sectors with heavy concentration of low-wage and immigrant workers (e.g., construction, cleaning).
Labor market performance The Nordic labor markets have been considered successful in delivering favorable labor market outcomes (Figure A.2). Labor force participation, including among females, and employment rates of the Nordic countries are well above the OECD average even though Finland lags behind somewhat. The level of unemployment is relatively low in the Nordics given high participation. Except for Norway, the unemployment rate is just below or close to the OECD average. Norway has the second lowest unemployment rate among the OECD countries, reflecting the buoyant economy supported by the oil boom in recent years. Unemployment rates in Finland, Denmark, and Sweden have been higher than in the past since the global financial crisis. The Nordic countries also enjoy a highly equal wage structure; wage equality as measured by the inverse of the 90th/10th percentile wage ratio is substantially higher than OECD average.
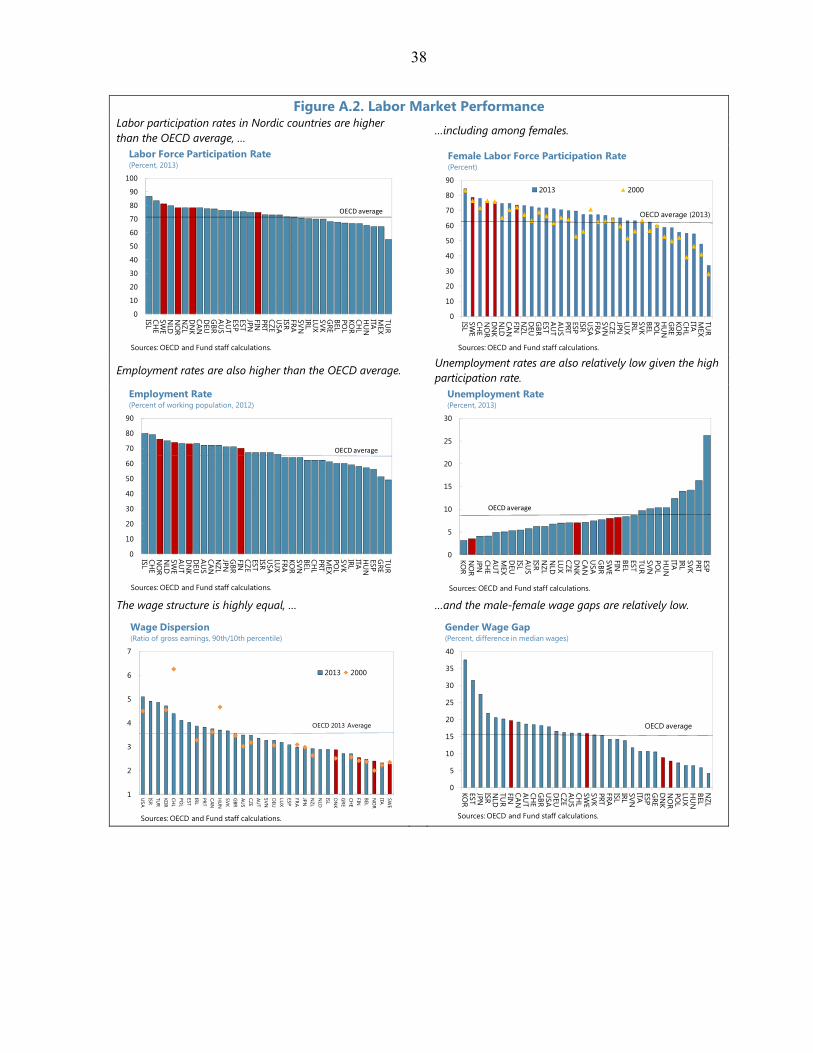
38
Figure A.2. Labor Market Performance Labor participation rates in Nordic countries are higher than the OECD average, …
…including among females.
Employment rates are also higher than the OECD average. Unemployment rates are also relatively low given the high participation rate.
The wage structure is highly equal, … …and the male-female wage gaps are relatively low.
0
10
20
30
40
50
60
70
80
90
100
ISLCH
ESW
EN
LDN
OR
NZL
DN
KCA
ND
EUG
BRA
US
AU
TESPESTJPNFINPRTCZEU
SAISRFRASVNIRLLU
XSVKG
REBELPO
LKO
RCH
LH
UN
ITAM
EXTU
R
Labor Force Participation Rate(Percent, 2013)
Sources: OECD and Fund staff calculations.
OECD average
0
10
20
30
40
50
60
70
80
90
ISLSW
ECH
EN
OR
DN
KN
LDCA
NFINN
ZLD
EUG
BRESTA
UT
AU
SPRTESPISRU
SAFRASVNCZEJPNLU
XIRLSVKBELPO
LH
UN
GRE
KOR
CHL
ITAM
EXTU
R
2013 2000
Female Labor Force Participation Rate(Percent)
Sources: OECD and Fund staff calculations.
OECD average (2013)
0
10
20
30
40
50
60
70
80
90
ISLCH
EN
OR
NLD
SWE
AU
TD
NK
DEU
AU
SCA
NN
ZLJPNG
BRFINCZEESTISRU
SALU
XFRAKO
RSVNBELCH
LPRTM
EXPO
LSVKIRLITAH
UN
ESPG
RETU
R
Employment Rate(Percent of working population, 2012)
Sources: OECD and Fund staff calculations.
OECD average
0
5
10
15
20
25
30
KOR
NO
RJPNCH
EA
UT
MEX
DEU
ISLA
US
ISRN
ZLN
LDLU
XCZED
NK
CAN
USA
GBR
SWE
FINBELESTTU
RSVNPO
LH
UN
ITAIRLSVKPRTESP
Unemployment Rate(Percent, 2013)
Sources: OECD and Fund staff calculations.
OECD average
1
2
3
4
5
6
7
USA
ISRTU
RKO
RCH
LPO
LESTIRLPRTCANH
UN
SVKG
BRAU
SCZEAU
TSVND
EULU
XESPFRAJPNN
ZLN
LDISLD
NK
GRE
CHE
FINBELN
OR
ITASW
E
2013 2000
Wage Dispersion (Ratio of gross earnings, 90th/10th percentile)
Sources: OECD and Fund staff calculations.
OECD 2013 Average
0
5
10
15
20
25
30
35
40
KOR
ESTJPNISRN
LDTU
RFINCA
NA
UT
CHE
GBR
USA
DEU
CZEA
US
CHL
SWE
SVKPRTFRAISLIRLSVNITAESPG
RED
NK
NO
RPO
LLU
XH
UN
BELN
ZL
Gender Wage Gap(Percent, difference in median wages)
Sources: OECD and Fund staff calculations.
OECD average

39
Annex II. Collective Bargaining in the Nordic countries The Nordic labor market model is built upon the key role played by collective bargaining in setting wages and employment conditions. Union density averages about 64 percent across the Nordics in 2012, among the highest in the OECD. Coverage of the collective agreements (i.e. the share of individuals covered by union agreements independent of membership) is 70–80 percent of the private labor force, except for Norway with somewhat lower coverage at around 50 percent (Andersen et al., 2014). Negotiations generally take place at multiple levels. The overall framework and parameters are usually determined at the national level, and collective agreements take place at the sector level. In wage negotiations, manufacturing, which tends to be more exposed to international competition, as well as being more productive with higher wages, typically sets the tone for the wage setting for the rest of the economy. Despite similarities, there are also some nuances across countries: Denmark: Collective bargaining takes place both at the sector level and the more decentralized level, normally every second year in odd years. In the private sector, at the national level, the Danish Employers’ Confederation and the Danish Confederation of Trade Unions negotiate general claims such as general pay increases, reduction of working hours etc. The more specific claims are subsequently negotiated at the sector level. In the public sector, almost every employee is covered by collective agreements. Most of the public sector is regulated by central collective bargaining. Finland: Finland’s collective bargaining system is highly centralized. A national inter-sectoral agreement is negotiated between the government, the central trade union confederations and the employers’ organizations. This covers a wide range of economic and social issues as well as setting a framework for the collective bargaining that takes place at sector level. The main pay and working conditions for most workers are negotiated at the sector level. There is no statutory minimum wage in Finland, but the high level of unionization and collective bargaining coverage mean that terms and conditions of employment are primarily determined by collective agreement. However, there has been some attempt to decentralize wage negations somewhat to increase flexibility. As a result, recent negotiations for the past few years tend to have more locally negotiated items. Norway: Collective bargaining in Norway has a hierarchical structure. The union confederations and the national employers’ associations set the framework for bargaining through the basic agreements. The basic agreements are negotiated every four years. At the next level in the hierarchy are the agreements for specific industries. An important feature of the industry level negotiations is that the manufacturing sector (competitive sector), which is exposed to international competition, sets the norm for the wage growth in the rest of the labor market (sheltered sector). As for industry level agreements, the complete agreements are re-negotiated every two years while pay rates are reviewed in the years in between. Company-level negotiations also take place annually. Sweden: Collective bargaining takes place at the sector level, but it is highly coordinated across industries with the national industry agreement setting the example for the remaining labor market. The national agreements regularly set the floor on wage increases at the

40
firm/local level. Pay agreements typically take place every three years. The Swedish system shares similarities with the German bargaining framework, but it provides for less scope at the firm-level to adjust wages to local conditions, with implications for wage outcomes (Schindler, 2014).

41
Annex III. Recent Labor Market Reforms in the Nordic Countries
The Nordic countries have implemented various reforms to address labor market challenges. This annex summarizes some of the recent reforms. Denmark: The government reformed the early retirement scheme in 2011, increasing the statutory retirement age from 65 to 67 over the period 2019–22, and indexing the retirement age to life expectancy from 2015. Social assistance was reformed in 2013, particularly targeted at preventing young adults being trapped in social assistance and inactivity. Main elements of the reform include increasing job search obligations and sanctions for adults over 30 years old and removing social assistance for low-educated youth under 30 but encouraging them to instead undertake education with a benefit equivalent to the education grant system. Starting from 2013, the maximum unemployment insurance benefit period was also cut from four to two years. Most recently, the eligibility criteria for disability pensions have been tightened and the period for sickness benefits shortened. A reform of ALMP is expected in early 2015, with emphasis on new, individual and job-focused effort for the unemployed, targeted training and education with enhanced focus on the needs of companies, and improved cooperation between job centers and companies (IMF, 2014a). Finland: To address the challenges associated with rapid population aging and the relatively low average effective retirement age (around 61 in 2013), the government is discussing plans to gradually increase the effective retirement age by 1.5 years by 2025, with implementation starting in 2017. To encourage labor participation, active job seekers are allowed to earn up to €300 per month without a reduction in unemployment benefits, while their employment plans will be monitored more closely. The “youth guarantee”—in place in 2013—offers everyone under the age of 25, as well as recent graduates under the age of 30, a place in employment, study, on-the-job training or in a rehabilitation within three months after becoming unemployed. In addition, policies are being developed to encourage job seekers to consider offers across regions, employment services for immigrants, the disabled, and long-term unemployed are being improved, and the child home care subsidy and job alteration leave policies are being amended (IMF, 2014b; OECD, 2012). Norway: The Inclusive Workplace Agreement (IA) was signed in 2001 between the government and the social partners to reduce sickness absence and increase the employment of disabled people. It has been renewed many times, but the effectiveness of the agreement has been limited so far. More recently, starting from January 2015, the disability pension was replaced with disability benefits. All disability pensions are now recalculated as disability benefits which are taxed as income and not as a pension. The new system ensures incentives to work while receiving disability benefits. Norway has also made some progress in pension reforms. The 2011 pension reforms introduced an adjustment of pensions for changes in life expectancy, flexible retirement starting at age 62 based on actuarial principles, and new rules for indexation of pensions. The full impact of reforms is yet to be known, but preliminary data suggest some increases in labor participation in older workers. Sweden: The incoming government in 2006 implemented a wave of labor market reforms, aimed at addressing unemployment and poverty traps and targeted at non-prime age workers

42
(the very young and the very old). Key measures involved reducing the tax burden for low-wage jobs through income tax deductions, a greater focus of ALMPs on training and job matching, and reductions in unemployment and sickness benefits. Others included providing wage subsidies to employers hiring vulnerable groups (New Start Jobs), immigrants (Step-In Jobs), or the previously sick (Well Again Jobs). In recent years, work incentives have been increased through the earned income tax credit, although the 2016 budget bill proposes a gradual tapering of the amount of the credit as income rises.
43
Annex IV. Integrating Immigrants into the Nordic Labor Market20
The Nordic countries have similar programs aiming at integrating immigrants into the labor market. Denmark: Denmark’s integration efforts put special emphasis on employment and early labor market access for immigrants. Initially focused on refugees, the integration program now applies to all qualified immigrants, and consists of intensive language training, vocational education and training, and workplace introduction/traineeship. Participation is obligatory, and is generally framed in terms of a formal signed contract between the receiving municipality and the immigrant. Social benefits are lower initially to increase work incentives. A “spatial dispersal policy”, in place since 1986, aimed at distributing immigrants across municipalities based on the availability of housing, employment, and educational facilities. The 1994 “Action Plan” improved recognition of foreign qualifications. The first Integration Act of 1999 transferred integration responsibilities to the municipalities, and expanded the integration program to 3-year duration, covering all newly arriving non-EEA immigrants above 18. The new Integration Act of 2004 enhanced municipalities’ incentives to integrate new arrivals rapidly into the labor market. Finland: Finland’s Integration Act of 1999 aimed to promote integration, equality and freedom of choice by providing measures that help immigrants acquire the information and skills needed in Finnish society. Municipalities are required to prepare municipal-level integration programs. Immigrants have the obligation to draw up individualized integration plans, consisting of language courses, preparatory and vocational training, and career counseling, etc. The aim is to closely consider the individual characteristics of each immigrant and to design a sequence of measures that is expected to best fit his or her needs. Refusal to participate in the program or failure to follow the plan is sanctioned by a reduction in social benefits. This obligation applies to those entering after May 1st, 1997. A new law on integration of immigrants came into effect in 2011, assigning duties and responsibilities to different levels of administration. Norway: Norway’s integration efforts focus on making best use of the immigrants’ skills through more targeted language/vocational training and improvements in recognition procedures for foreign qualifications. Similar to Denmark and Sweden, a dispersal policy was in place to help with spatial distribution of refugees across municipalities. An introduction program was fully implemented in 2004, in which participation is obligatory for all 18–55 year old immigrants arriving after 2004 and who lack basic qualifications. The program has three main objectives: to provide basic language skills, to give the immigrants insights into the Norwegian society through social studies, and to prepare for the labor market. The program is full time and can last a maximum of 2 years (but may be extended to a maximum of 3 years). Participation is required for immigrants to get introduction benefits. An Action Plan of 2006 provided additional funding for indirectly targeted ALMP instruments and closer follow-up of participants.
20 The information in this Annex draws from OECD (2007a, 2007b, 2009) and Bevelander and Irastorza (2014).
44
Sweden: An introduction program consisting of language training, introduction to life in Sweden, and employment preparation aims to facilitate transition to the labor market. Any recognized asylum seekers—including family members who arrived soon afterwards—aged 20–64 years (or 18–19 years without parents living in Sweden) are eligible, and the program length is 24 months (with possible extensions for paternal/maternal leave). Participation is not compulsory, but once agreed between the refugee and the state, it has to be followed for the participant to continue receiving introduction benefits. After the introduction period, the usual ALMP measures are available to refugees who qualify (e.g., recruitment incentives, self-employment start-up grants, job matching services, and work experience at a work place).
Related Documents


![[Nordic Built Challenge 17.12.2013] Trine Pertou Mach, Nordic Built: Nordic Built](https://static.cupdf.com/doc/110x72/547174dcb4af9f980a8b4ad9/nordic-built-challenge-17122013-trine-pertou-mach-nordic-built-nordic-built.jpg)