Send Orders for Reprints to [email protected] 26 The Open Transportation Journal, 2014, 8, 26-38 1874-4478/14 2014 Bentham Open Open Access The Noise Abatement Plan of an Italian Road Network: A Comparison Between Standard and Innovative Methodologies Francesco D’Alessandro, Francesco Asdrubali * and Samuele Schiavoni Department of Engineering, University of Perugia, Via G. Duranti, 67, 06125 Perugia, Italy Abstract: The Italian legislation prescribes that the managing authorities of transportation infrastructures have to prepare a noise control and abatement plan, using established procedures and indexes defined both at national and regional level. The aim of the paper is to compare the standard procedure given by Umbria Region with three innovative methodologies proposed by the authors to increase the adequacy and the quality of roads noise planning activity. Both standard and innovative approaches require the creation of a ranking of priority to define where noise abatement actions are most necessary. The proposed methodologies introduce at various levels a more detailed phase of noise mapping, by using façade noise map instead of grid noise map, and define new rankings of priority based on improved location of calculation points. More accurate and realistic noise plans allow to optimize the budget allocated for acoustic rehabilitation and to mitigate the most critical situations. The innovative procedures can be easily transferred at European level for the realization of Noise Action Plans requested by the Environmental Noise Directive 2002/49/EC. Keywords: Environmental noise, noise mapping, noise modelling, noise planning, roadway noise. 1. INTRODUCTION The World Health Organization in its report “Burden of disease from environmental noise” states that: “One in three individuals is annoyed during the daytime and one in five has disturbed sleep at night because of traffic noise. Epidemio- logical evidence indicates that those chroni- cally exposed to high levels of environmental noise have an increased risk of cardiovascular diseases such as myocardial infarction. Thus, noise pollution is considered not only an environmental nuisance but also a threat to public health [1].” Several studies [2, 3] have also assessed the social costs of environmental noise for the European Union, including health care costs, house depreciation, limitation to land use, loss of working hours due to stress or insomnia, learning impairment: road traffic noise alone costs 38 billion euros per year (0.4% of the EU gross national product), a terrific amount if we consider that it is about one third of the social costs related to road accidents. So noise cannot be considered only an environmental problem, but it has serious consequences on health and economics. The main causes of noise pollution are the growing request for motorized transport and an increased urbanization, sometimes not adequately planned to take into account the sonic environment. *Address correspondence to this author at the Department of Engineering, University of Perugia, Via G. Duranti, 67, 06125 Perugia, Italy; Tel: +39.0755853716; Fax: +39.0755853697; E-mail: [email protected] Environmental noise planning requires to investigate the sound environment generated by the emissions from specific noise sources (such as roads, railways, airports, harbours and factories) by means of noise mapping activities, in order to identify areas that can be considered quiet and areas that on the contrary are affected by noise pollution. For the latter areas noise abatement measures must be defined and a ranking of priority between the measures must be established to rehabilitate first the most critical ones. Noise assessment methods are well established and a common European harmonised framework named CNOSSOS-EU (Common NOise aSSessment MethOdS) was finally defined in 2012 [4]. On the contrary the definition of common procedures to define the priority of the noise rehabilitation measures is far from being harmonized. Several studies and European projects have dealt with this topic: • in Belgium and in Luxembourg the ECU (Exposure Comparison Unit), now upgraded to the new ECUden [5], is used to set priorities concerning highway and railway noise; • in France the national road agency has defined a methodology based on the definition of “Hot spots”, i.e. buildings exposed to noise levels exceeding a certain threshold; • in Scotland the Government adopted the Building Prioritisation Score (BPS) [6] that assigns an absolute value to each building taking account of the exposure–response relationships based on Miedema’s studies [7];

Welcome message from author
This document is posted to help you gain knowledge. Please leave a comment to let me know what you think about it! Share it to your friends and learn new things together.
Transcript
Send Orders for Reprints to [email protected]
26 The Open Transportation Journal, 2014, 8, 26-38
1874-4478/14 2014 Bentham Open
Open Access
The Noise Abatement Plan of an Italian Road Network: A Comparison Between Standard and Innovative Methodologies
Francesco D’Alessandro, Francesco Asdrubali* and Samuele Schiavoni
Department of Engineering, University of Perugia, Via G. Duranti, 67, 06125 Perugia, Italy
Abstract: The Italian legislation prescribes that the managing authorities of transportation infrastructures have to prepare a noise control and abatement plan, using established procedures and indexes defined both at national and regional level. The aim of the paper is to compare the standard procedure given by Umbria Region with three innovative methodologies proposed by the authors to increase the adequacy and the quality of roads noise planning activity. Both standard and innovative approaches require the creation of a ranking of priority to define where noise abatement actions are most necessary. The proposed methodologies introduce at various levels a more detailed phase of noise mapping, by using façade noise map instead of grid noise map, and define new rankings of priority based on improved location of calculation points. More accurate and realistic noise plans allow to optimize the budget allocated for acoustic rehabilitation and to mitigate the most critical situations. The innovative procedures can be easily transferred at European level for the realization of Noise Action Plans requested by the Environmental Noise Directive 2002/49/EC.
Keywords: Environmental noise, noise mapping, noise modelling, noise planning, roadway noise.
1. INTRODUCTION
The World Health Organization in its report “Burden of disease from environmental noise” states that:
“One in three individuals is annoyed during the daytime and one in five has disturbed sleep at night because of traffic noise. Epidemio-logical evidence indicates that those chroni-cally exposed to high levels of environmental noise have an increased risk of cardiovascular diseases such as myocardial infarction. Thus, noise pollution is considered not only an environmental nuisance but also a threat to public health [1].”
Several studies [2, 3] have also assessed the social costs of environmental noise for the European Union, including health care costs, house depreciation, limitation to land use, loss of working hours due to stress or insomnia, learning impairment: road traffic noise alone costs 38 billion euros per year (0.4% of the EU gross national product), a terrific amount if we consider that it is about one third of the social costs related to road accidents. So noise cannot be considered only an environmental problem, but it has serious consequences on health and economics.
The main causes of noise pollution are the growing request for motorized transport and an increased urbanization, sometimes not adequately planned to take into account the sonic environment.
*Address correspondence to this author at the Department of Engineering, University of Perugia, Via G. Duranti, 67, 06125 Perugia, Italy; Tel: +39.0755853716; Fax: +39.0755853697; E-mail: [email protected]
Environmental noise planning requires to investigate the sound environment generated by the emissions from specific noise sources (such as roads, railways, airports, harbours and factories) by means of noise mapping activities, in order to identify areas that can be considered quiet and areas that on the contrary are affected by noise pollution. For the latter areas noise abatement measures must be defined and a ranking of priority between the measures must be established to rehabilitate first the most critical ones.
Noise assessment methods are well established and a common European harmonised framework named CNOSSOS-EU (Common NOise aSSessment MethOdS) was finally defined in 2012 [4]. On the contrary the definition of common procedures to define the priority of the noise rehabilitation measures is far from being harmonized.
Several studies and European projects have dealt with this topic:
• in Belgium and in Luxembourg the ECU (Exposure Comparison Unit), now upgraded to the new ECUden [5], is used to set priorities concerning highway and railway noise;
• in France the national road agency has defined a methodology based on the definition of “Hot spots”, i.e. buildings exposed to noise levels exceeding a certain threshold;
• in Scotland the Government adopted the Building Prioritisation Score (BPS) [6] that assigns an absolute value to each building taking account of the exposure–response relationships based on Miedema’s studies [7];
The Noise Abatement Plan of an Italian Road Network The Open Transportation Journal, 2014, Volume 8 27
• Licitra et al. [8] upgraded the Scottish method in order to consider the annoyance from multiple sources (MABPS); the method was further improved by Rodrigues et al. [9] and applied to the city of Porto;
• Asdrubali et al. defined a priority index named CBI (Cost Benefit Indicator) that combines the cost and the efficiency of noise abatement measures [10];
• Among the European funded projects which studied or are currently studying this topic the following can be cited: SMILE [11], QCITY [12], HUSH [13] and NADIA [14].
The present paper reports the methodology and some results of the Noise Control and Abatement Plan of the road network owned by the Umbria Region and managed by the Province of Terni, in central Italy. The plan was realized in 2013 using a standard methodology agreed with the Umbria Region based on the Italian decree of the Ministry of the Environment n. 285 of 29/11/2000 [15]. A critical analysis of the plan allowed to identify some weak points of the used methodology and to develop innovative and more sophisticated approaches, in order to obtain a more realistic picture of the sound environment of the areas under study and, consequently, a better definition of noise abatement measures. Three new methodologies were proposed and applied to a road selected as case study and the results were compared with those obtained with the standard methodology.
2. LEGISLATIVE FRAMEWORKS
2.1. European Level
The European Union and the single Member States have adopted measures to contrast noise pollution in terms of prevention, control and mitigation [16]. Furthermore in the last decades researchers are focusing on the positive aspects of wanted sounds as an alternative to the standard approach of environmental acoustics that aims to reduce unwanted sound (noise): in this case subjective perception becomes crucial for evaluating the quality of a soundscape, in urban [17], rural areas [18] or recreational areas [19].
An important legislative action of the European Commission on noise pollution is the Directive 2002/49/EC, commonly known as END (Environmental Noise Directive [20]). The goal of the END is to avoid, prevent or reduce the harmful or annoying effects due to environmental noise exposure. A definition of environmental noise is also given: “…unwanted or harmful outdoor sound created by human activities, including noise emitted by means of transport, road traffic, rail traffic, air traffic, and from sites of industrial activity…”. The directive establishes the indicators to be used, Lden and Lnight, and the methodology for noise mapping activities. The Lden indicator is given by Eq. 1. The noise levels are calculated on each building façade without considering the sound reflected by the façade itself.
𝐿!"# = 10 log !!" nd ∗ 10
!!"#!" + ne ∗ 10
!!"!#$#%!!!" + nn ∗
10!!"#!!!!"
!" (Eq. 1)
where:
• nd, ne and nn are respectively the number of hours in the day, evening and night period (variable between the EU Member States);
• Lday is the A-weighted long-term average sound level of the day period (in Italy from 06:00 to 20:00);
• Levening is the A-weighted long-term average sound level of the evening period (in Italy from 20:00 to 22:00);
• Lnight is the A-weighted long-term average sound level of the night period (in Italy from 22:00 to 06:00);
According to END the managing authorities of roads with a traffic flow higher than 3,000,000 vehicles per year must provide a Noise Action Plan, including the definition of the areas in which noise abatement measures are necessary, the actions planned in the following five years and the relative financial information.
2.2. Italian Level
The END directive was adopted in Italy by the Legislative Decree 194/2005 [21]. Moreover in Italy the decree of the Ministry of the Environment n. 285 of 29/11/2000 previously defined the criteria for the realization of Noise Control and Abatement Plan of infrastructures [15]. The national plan is similar to the one defined at European level but some differences can be found: the most important one is related to the noise indicators to be used. The national legislation uses Ldiurno (similar to Lday, but evaluated on the time period 06:00-22:00) and Lnotturno (identical to Ln) while the indicators used in the one prescribed by the END are the aforementioned Lden and Lnight. Currently, the noise limits are defined in Italy only through Ldiurno and Lnotturno, in compliance with [22]. Moreover the impact of a noise source on a receiver should be evaluated at 1 m from the façade, considering also its own reflection. Further differences between Italian and European legislation about noise planning are reported in the outcomes of the EU funded HUSH Project [23, 24]. However the coexistence of two similar (but sometimes contrasting) legislations generates confusion in the bodies in charge of producing both the European “Noise Action Plan” and the Italian “Noise Control and Abatement Plan”.
2.3. Local Level: Umbria Region
The Italian framework Law 447 of 26/10/1995 shares the responsibilities and the commitments concerning anti-noise controls, actions and planning between State (the national authority), Region and Municipalities [25]. The Regional Law n. 8 of 08/06/2002 [26] and the Regional Regulation n. 1 of 13/08/2004 [27] issued by Umbria Region define the criteria and the methodologies for the realization of acoustic territorial zoning and establish that both Regional and
28 The Open Transportation Journal, 2014, Volume 8 D’Alessandro et al.
Municipalities Authorities have to control the Noise Control and Abatement Plan of road infrastructures.
3. DESCRIPTION OF THE METHODOLOGY
The methodology for the realization of the Noise Control and Abatement Plan was agreed with the technical staff of Umbria Region, in compliance with the Italian and local legislative framework. This section briefly describes the analysed road network and the various activities that were performed to realize the plan.
3.1. Examined Road Network
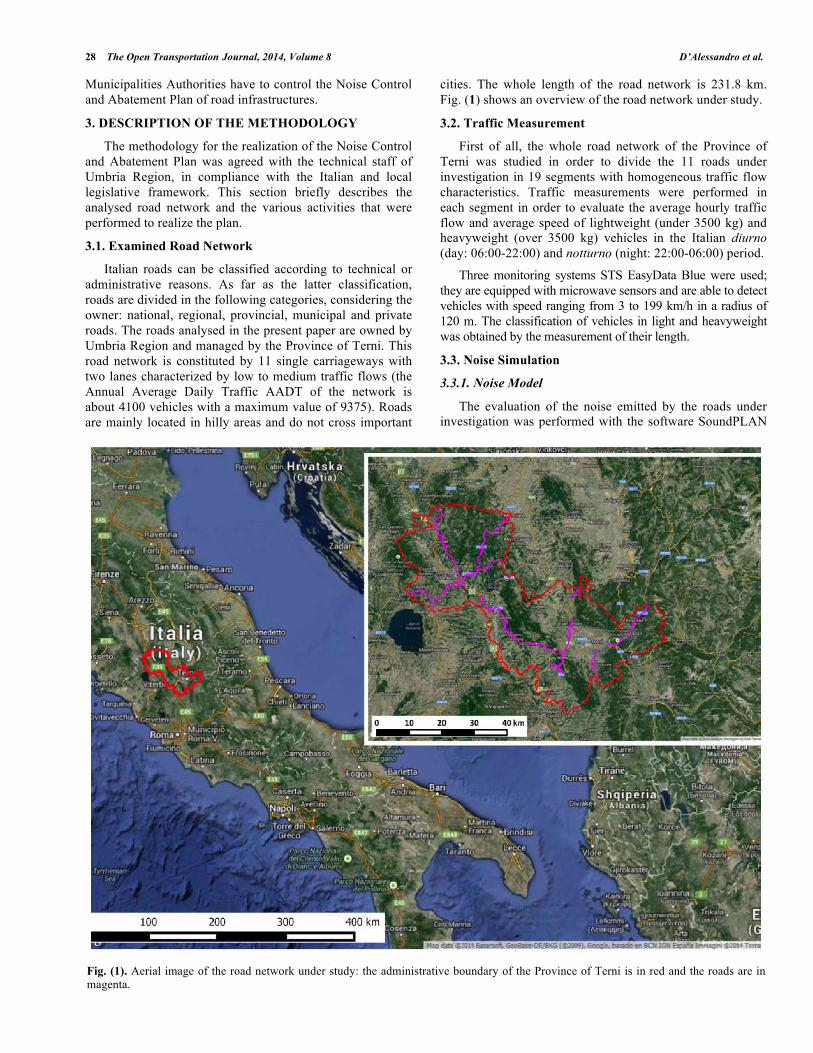
Italian roads can be classified according to technical or administrative reasons. As far as the latter classification, roads are divided in the following categories, considering the owner: national, regional, provincial, municipal and private roads. The roads analysed in the present paper are owned by Umbria Region and managed by the Province of Terni. This road network is constituted by 11 single carriageways with two lanes characterized by low to medium traffic flows (the Annual Average Daily Traffic AADT of the network is about 4100 vehicles with a maximum value of 9375). Roads are mainly located in hilly areas and do not cross important
cities. The whole length of the road network is 231.8 km. Fig. (1) shows an overview of the road network under study.
3.2. Traffic Measurement
First of all, the whole road network of the Province of Terni was studied in order to divide the 11 roads under investigation in 19 segments with homogeneous traffic flow characteristics. Traffic measurements were performed in each segment in order to evaluate the average hourly traffic flow and average speed of lightweight (under 3500 kg) and heavyweight (over 3500 kg) vehicles in the Italian diurno (day: 06:00-22:00) and notturno (night: 22:00-06:00) period.
Three monitoring systems STS EasyData Blue were used; they are equipped with microwave sensors and are able to detect vehicles with speed ranging from 3 to 199 km/h in a radius of 120 m. The classification of vehicles in light and heavyweight was obtained by the measurement of their length.
3.3. Noise Simulation
3.3.1. Noise Model
The evaluation of the noise emitted by the roads under investigation was performed with the software SoundPLAN
Fig. (1). Aerial image of the road network under study: the administrative boundary of the Province of Terni is in red and the roads are in magenta.
The Noise Abatement Plan of an Italian Road Network The Open Transportation Journal, 2014, Volume 8 29
version 7.1 [28] using NMPB Routes 96 as noise propagation model [29]. The NMPB model allows to estimate the noise emission of a road considering: the average hourly traffic flow and the average speed of heavyweight and lightweight vehicles in the reference period, the road surface typology, the characteristics of traffic flow (steady, unsteady, accelerate or decelerate) and the road gradient. Data concerning traffic flows were obtained by the traffic measurements. Traffic flow was always considered as steady and the effect of the road surface type was taken into account using the correction given by the European guideline on strategic noise maps [30].
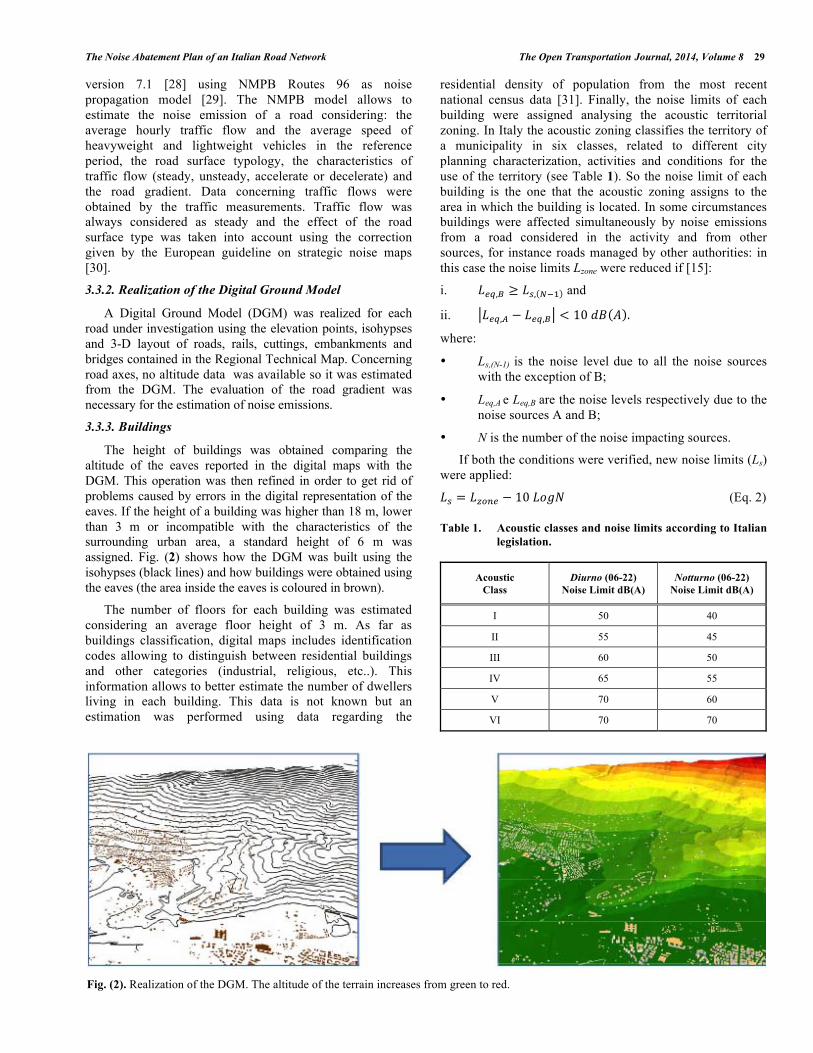
3.3.2. Realization of the Digital Ground Model
A Digital Ground Model (DGM) was realized for each road under investigation using the elevation points, isohypses and 3-D layout of roads, rails, cuttings, embankments and bridges contained in the Regional Technical Map. Concerning road axes, no altitude data was available so it was estimated from the DGM. The evaluation of the road gradient was necessary for the estimation of noise emissions.
3.3.3. Buildings
The height of buildings was obtained comparing the altitude of the eaves reported in the digital maps with the DGM. This operation was then refined in order to get rid of problems caused by errors in the digital representation of the eaves. If the height of a building was higher than 18 m, lower than 3 m or incompatible with the characteristics of the surrounding urban area, a standard height of 6 m was assigned. Fig. (2) shows how the DGM was built using the isohypses (black lines) and how buildings were obtained using the eaves (the area inside the eaves is coloured in brown).
The number of floors for each building was estimated considering an average floor height of 3 m. As far as buildings classification, digital maps includes identification codes allowing to distinguish between residential buildings and other categories (industrial, religious, etc..). This information allows to better estimate the number of dwellers living in each building. This data is not known but an estimation was performed using data regarding the
residential density of population from the most recent national census data [31]. Finally, the noise limits of each building were assigned analysing the acoustic territorial zoning. In Italy the acoustic zoning classifies the territory of a municipality in six classes, related to different city planning characterization, activities and conditions for the use of the territory (see Table 1). So the noise limit of each building is the one that the acoustic zoning assigns to the area in which the building is located. In some circumstances buildings were affected simultaneously by noise emissions from a road considered in the activity and from other sources, for instance roads managed by other authorities: in this case the noise limits Lzone were reduced if [15]:
i. 𝐿!",! ≥ 𝐿!, !!! and
ii. 𝐿!",! − 𝐿!",! < 10 𝑑𝐵 𝐴 .
where:
• Ls,(N-1) is the noise level due to all the noise sources with the exception of B;
• Leq,A e Leq,B are the noise levels respectively due to the noise sources A and B;
• N is the number of the noise impacting sources.
If both the conditions were verified, new noise limits (Ls) were applied:
𝐿! = 𝐿!"#$ − 10 𝐿𝑜𝑔𝑁 (Eq. 2)
Table 1. Acoustic classes and noise limits according to Italian legislation.
Acoustic Class
Diurno (06-22) Noise Limit dB(A)
Notturno (06-22) Noise Limit dB(A)
I 50 40
II 55 45
III 60 50
IV 65 55
V 70 60
VI 70 70
Fig. (2). Realization of the DGM. The altitude of the terrain increases from green to red.
30 The Open Transportation Journal, 2014, Volume 8 D’Alessandro et al.
3.3.4. Noise Model Calibration
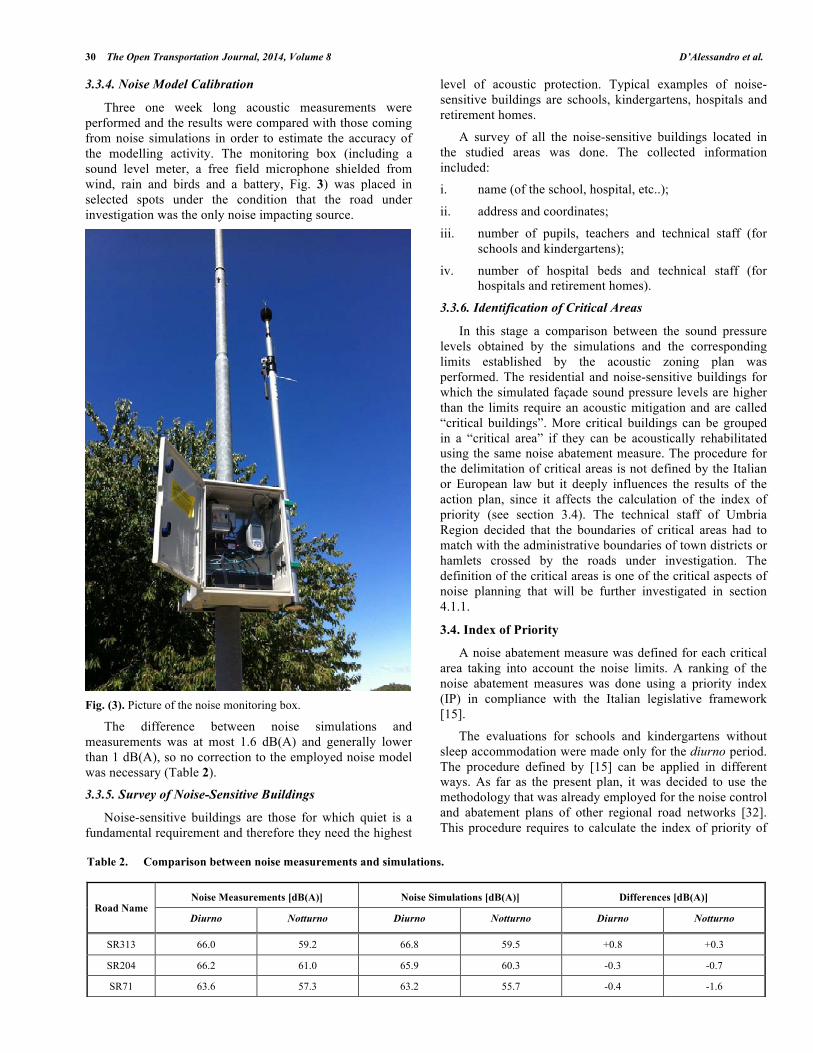
Three one week long acoustic measurements were performed and the results were compared with those coming from noise simulations in order to estimate the accuracy of the modelling activity. The monitoring box (including a sound level meter, a free field microphone shielded from wind, rain and birds and a battery, Fig. 3) was placed in selected spots under the condition that the road under investigation was the only noise impacting source.
Fig. (3). Picture of the noise monitoring box.
The difference between noise simulations and measurements was at most 1.6 dB(A) and generally lower than 1 dB(A), so no correction to the employed noise model was necessary (Table 2).
3.3.5. Survey of Noise-Sensitive Buildings
Noise-sensitive buildings are those for which quiet is a fundamental requirement and therefore they need the highest
level of acoustic protection. Typical examples of noise-sensitive buildings are schools, kindergartens, hospitals and retirement homes.
A survey of all the noise-sensitive buildings located in the studied areas was done. The collected information included:
i. name (of the school, hospital, etc..);
ii. address and coordinates;
iii. number of pupils, teachers and technical staff (for schools and kindergartens);
iv. number of hospital beds and technical staff (for hospitals and retirement homes).
3.3.6. Identification of Critical Areas
In this stage a comparison between the sound pressure levels obtained by the simulations and the corresponding limits established by the acoustic zoning plan was performed. The residential and noise-sensitive buildings for which the simulated façade sound pressure levels are higher than the limits require an acoustic mitigation and are called “critical buildings”. More critical buildings can be grouped in a “critical area” if they can be acoustically rehabilitated using the same noise abatement measure. The procedure for the delimitation of critical areas is not defined by the Italian or European law but it deeply influences the results of the action plan, since it affects the calculation of the index of priority (see section 3.4). The technical staff of Umbria Region decided that the boundaries of critical areas had to match with the administrative boundaries of town districts or hamlets crossed by the roads under investigation. The definition of the critical areas is one of the critical aspects of noise planning that will be further investigated in section 4.1.1.
3.4. Index of Priority
A noise abatement measure was defined for each critical area taking into account the noise limits. A ranking of the noise abatement measures was done using a priority index (IP) in compliance with the Italian legislative framework [15].
The evaluations for schools and kindergartens without sleep accommodation were made only for the diurno period. The procedure defined by [15] can be applied in different ways. As far as the present plan, it was decided to use the methodology that was already employed for the noise control and abatement plans of other regional road networks [32]. This procedure requires to calculate the index of priority of
Table 2. Comparison between noise measurements and simulations.
Road Name Noise Measurements [dB(A)] Noise Simulations [dB(A)] Differences [dB(A)]
Diurno Notturno Diurno Notturno Diurno Notturno
SR313 66.0 59.2 66.8 59.5 +0.8 +0.3
SR204 66.2 61.0 65.9 60.3 -0.3 -0.7
SR71 63.6 57.3 63.2 55.7 -0.4 -1.6
The Noise Abatement Plan of an Italian Road Network The Open Transportation Journal, 2014, Volume 8 31
noise-sensitive buildings and of other critical areas in two different ways. In both cases the noise levels are assigned to buildings considering the results of graphical noise maps (GNM, see section 4.1.2 for further details).
3.4.1. Noise-Sensitive Buildings
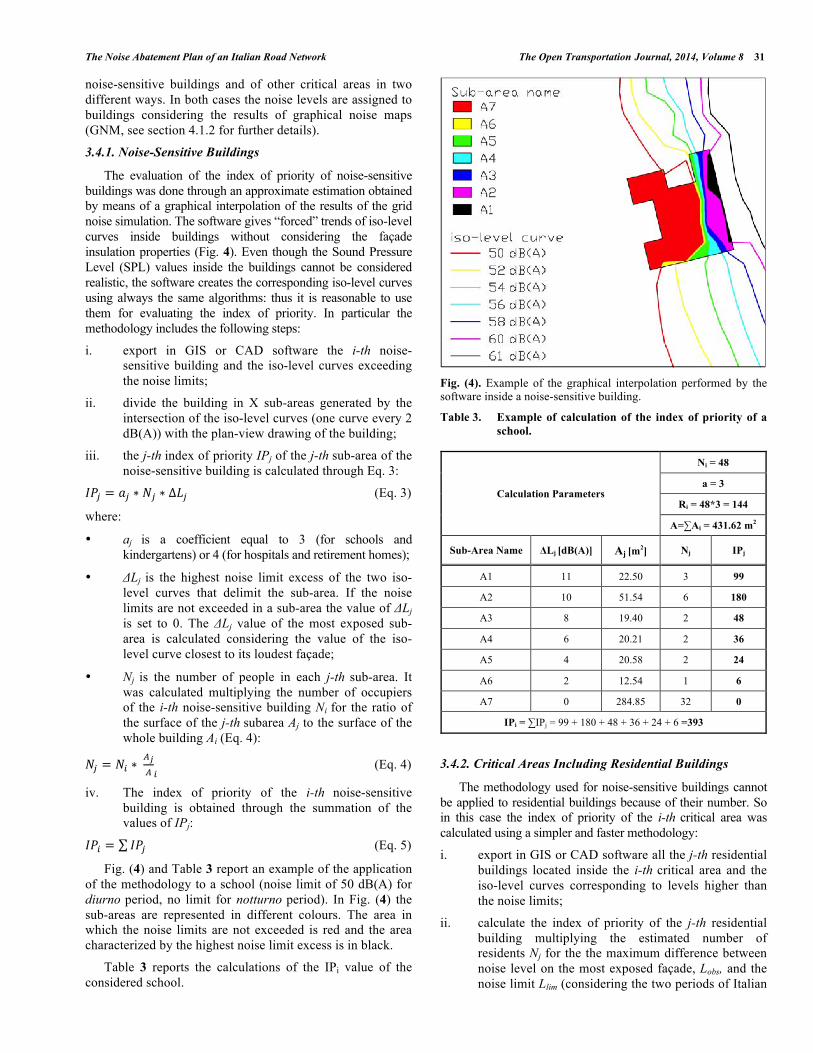
The evaluation of the index of priority of noise-sensitive buildings was done through an approximate estimation obtained by means of a graphical interpolation of the results of the grid noise simulation. The software gives “forced” trends of iso-level curves inside buildings without considering the façade insulation properties (Fig. 4). Even though the Sound Pressure Level (SPL) values inside the buildings cannot be considered realistic, the software creates the corresponding iso-level curves using always the same algorithms: thus it is reasonable to use them for evaluating the index of priority. In particular the methodology includes the following steps:
i. export in GIS or CAD software the i-th noise-sensitive building and the iso-level curves exceeding the noise limits;
ii. divide the building in X sub-areas generated by the intersection of the iso-level curves (one curve every 2 dB(A)) with the plan-view drawing of the building;
iii. the j-th index of priority IPj of the j-th sub-area of the noise-sensitive building is calculated through Eq. 3:
𝐼𝑃! = 𝑎! ∗ 𝑁! ∗ ∆𝐿! (Eq. 3)
where:
• aj is a coefficient equal to 3 (for schools and kindergartens) or 4 (for hospitals and retirement homes);
• ΔLj is the highest noise limit excess of the two iso-level curves that delimit the sub-area. If the noise limits are not exceeded in a sub-area the value of ΔLj is set to 0. The ΔLj value of the most exposed sub-area is calculated considering the value of the iso-level curve closest to its loudest façade;
• Nj is the number of people in each j-th sub-area. It was calculated multiplying the number of occupiers of the i-th noise-sensitive building Ni for the ratio of the surface of the j-th subarea Aj to the surface of the whole building Ai (Eq. 4):
𝑁! = 𝑁! ∗ !!! !
(Eq. 4)
iv. The index of priority of the i-th noise-sensitive building is obtained through the summation of the values of IPj:
𝐼𝑃! = 𝐼𝑃! (Eq. 5)
Fig. (4) and Table 3 report an example of the application of the methodology to a school (noise limit of 50 dB(A) for diurno period, no limit for notturno period). In Fig. (4) the sub-areas are represented in different colours. The area in which the noise limits are not exceeded is red and the area characterized by the highest noise limit excess is in black.
Table 3 reports the calculations of the IPi value of the considered school.
Fig. (4). Example of the graphical interpolation performed by the software inside a noise-sensitive building.
Table 3. Example of calculation of the index of priority of a school.
Calculation Parameters
Ni = 48
a = 3
Ri = 48*3 = 144
A=∑Ai = 431.62 m2
Sub-Area Name ΔLj [dB(A)] Aj [m2] Nj IPj
A1 11 22.50 3 99
A2 10 51.54 6 180
A3 8 19.40 2 48
A4 6 20.21 2 36
A5 4 20.58 2 24
A6 2 12.54 1 6
A7 0 284.85 32 0
IPi = ∑IPj = 99 + 180 + 48 + 36 + 24 + 6 =393
3.4.2. Critical Areas Including Residential Buildings
The methodology used for noise-sensitive buildings cannot be applied to residential buildings because of their number. So in this case the index of priority of the i-th critical area was calculated using a simpler and faster methodology:
i. export in GIS or CAD software all the j-th residential buildings located inside the i-th critical area and the iso-level curves corresponding to levels higher than the noise limits;
ii. calculate the index of priority of the j-th residential building multiplying the estimated number of residents Nj for the the maximum difference between noise level on the most exposed façade, Lobs, and the noise limit Llim (considering the two periods of Italian
32 The Open Transportation Journal, 2014, Volume 8 D’Alessandro et al.
normative, diurno and notturno) rounded to the nearest unit:
𝐼𝑃! =𝑁! ∗max [ 𝐿!"#,!"#$%&,! − 𝐿!"#,!"#$%&,! , 𝐿!"#,!"##$%!",! −𝐿!"#,!"##$%!",! ] (Eq. 6)
iii. the index of priority of the i-th critical area is obtained through the summation of the IPj values of all the residential buildings inside the area (Eq. 5).
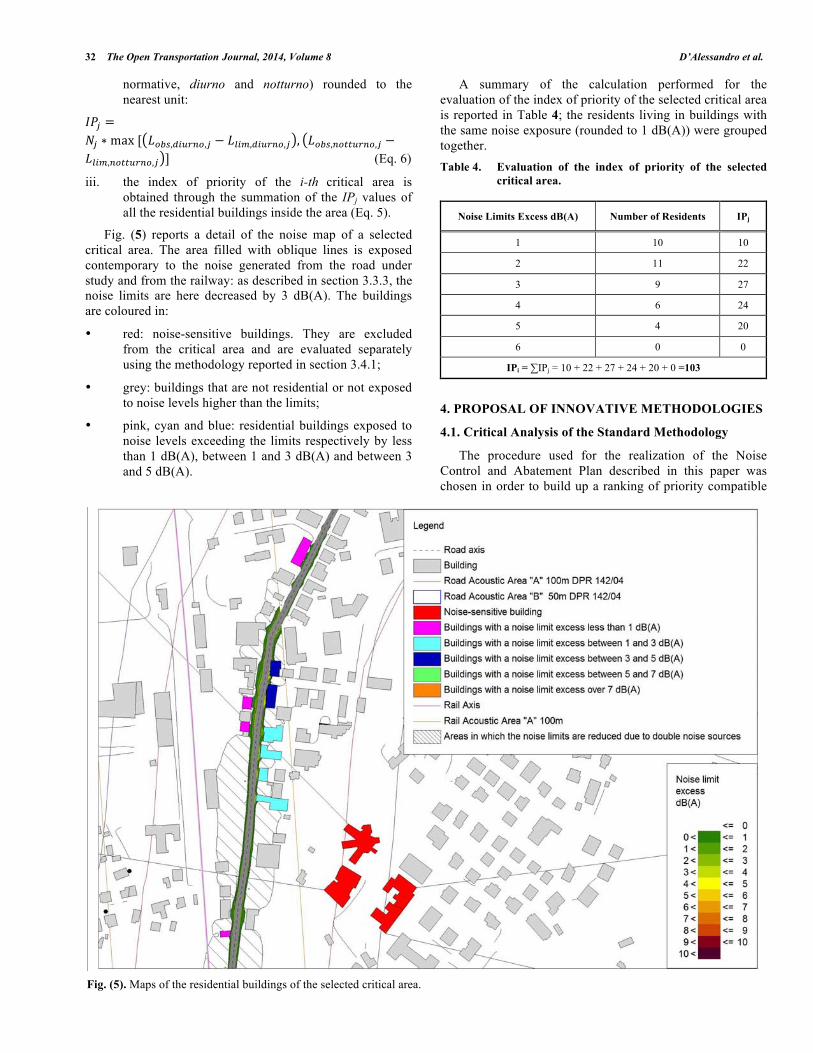
Fig. (5) reports a detail of the noise map of a selected critical area. The area filled with oblique lines is exposed contemporary to the noise generated from the road under study and from the railway: as described in section 3.3.3, the noise limits are here decreased by 3 dB(A). The buildings are coloured in:
• red: noise-sensitive buildings. They are excluded from the critical area and are evaluated separately using the methodology reported in section 3.4.1;
• grey: buildings that are not residential or not exposed to noise levels higher than the limits;
• pink, cyan and blue: residential buildings exposed to noise levels exceeding the limits respectively by less than 1 dB(A), between 1 and 3 dB(A) and between 3 and 5 dB(A).
A summary of the calculation performed for the evaluation of the index of priority of the selected critical area is reported in Table 4; the residents living in buildings with the same noise exposure (rounded to 1 dB(A)) were grouped together. Table 4. Evaluation of the index of priority of the selected
critical area.
Noise Limits Excess dB(A) Number of Residents IPj
1 10 10
2 11 22
3 9 27
4 6 24
5 4 20
6 0 0
IPi = ∑IPj = 10 + 22 + 27 + 24 + 20 + 0 =103
4. PROPOSAL OF INNOVATIVE METHODOLOGIES
4.1. Critical Analysis of the Standard Methodology
The procedure used for the realization of the Noise Control and Abatement Plan described in this paper was chosen in order to build up a ranking of priority compatible
Fig. (5). Maps of the residential buildings of the selected critical area.
The Noise Abatement Plan of an Italian Road Network The Open Transportation Journal, 2014, Volume 8 33
with the outcomes of the plans of the other road networks owned by Umbria Region. Nevertheless the procedure has some critical aspects:
• the delimitation of critical areas does not consider the actual noise problems;
• the accuracy of the results of noise simulations can be improved;
• the evaluation of the index of priority of noise-sensitive buildings is time consuming.
These aspects are further analysed in the following paragraphs.
4.1.1. Improvement on the Delimitation of Critical Areas
As explained in section 3.3.6, the boundaries of critical areas were chosen to be the boundaries of town districts and hamlets close to the roads under study, without considering the results of the noise simulations. This approach makes the selection of the best noise abatement measure difficult or not precise. For example, if two critical areas are adjoining, it is more correct to consider a single one; on the other hand a critical area could be divided in two or more sub-areas if the critical buildings are scattered inside the area.
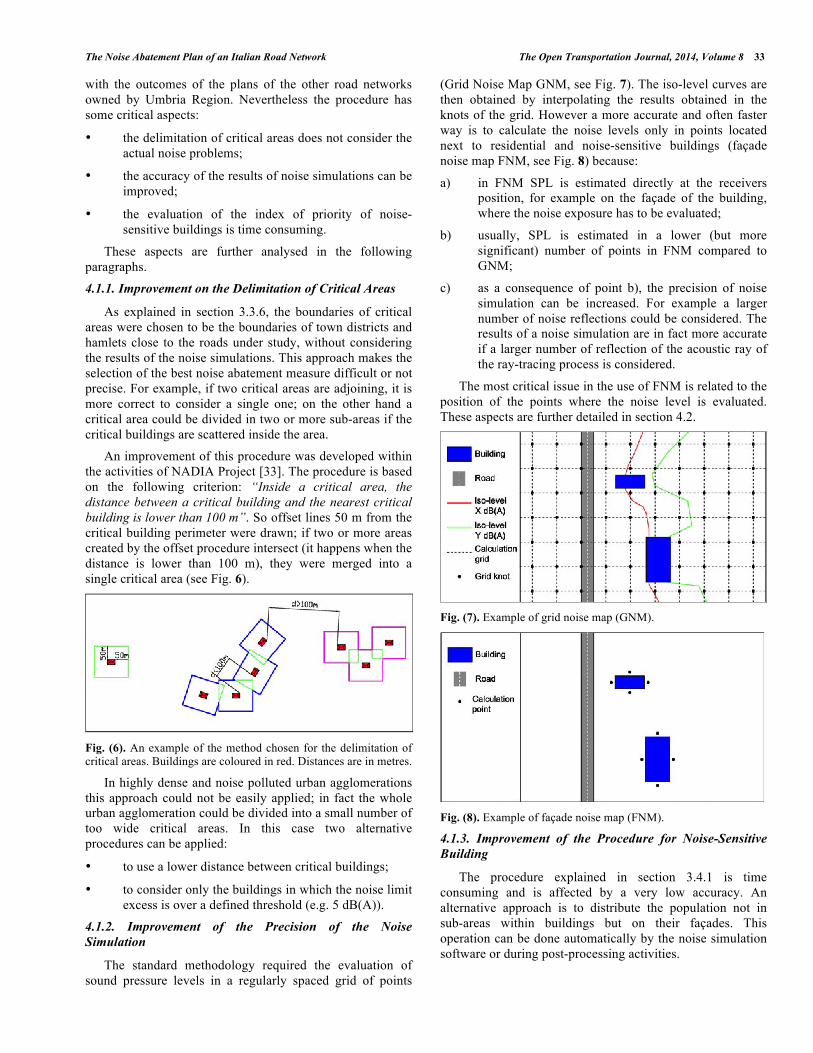
An improvement of this procedure was developed within the activities of NADIA Project [33]. The procedure is based on the following criterion: “Inside a critical area, the distance between a critical building and the nearest critical building is lower than 100 m”. So offset lines 50 m from the critical building perimeter were drawn; if two or more areas created by the offset procedure intersect (it happens when the distance is lower than 100 m), they were merged into a single critical area (see Fig. 6).
Fig. (6). An example of the method chosen for the delimitation of critical areas. Buildings are coloured in red. Distances are in metres.
In highly dense and noise polluted urban agglomerations this approach could not be easily applied; in fact the whole urban agglomeration could be divided into a small number of too wide critical areas. In this case two alternative procedures can be applied:
• to use a lower distance between critical buildings;
• to consider only the buildings in which the noise limit excess is over a defined threshold (e.g. 5 dB(A)).
4.1.2. Improvement of the Precision of the Noise Simulation
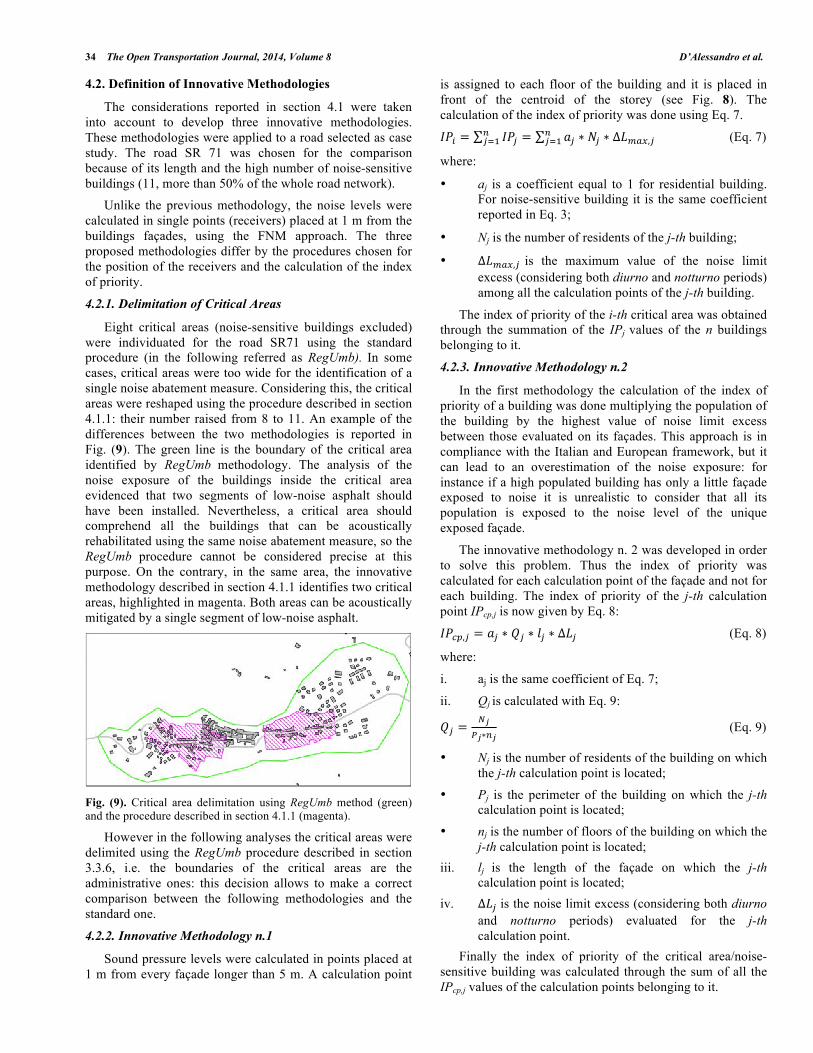
The standard methodology required the evaluation of sound pressure levels in a regularly spaced grid of points
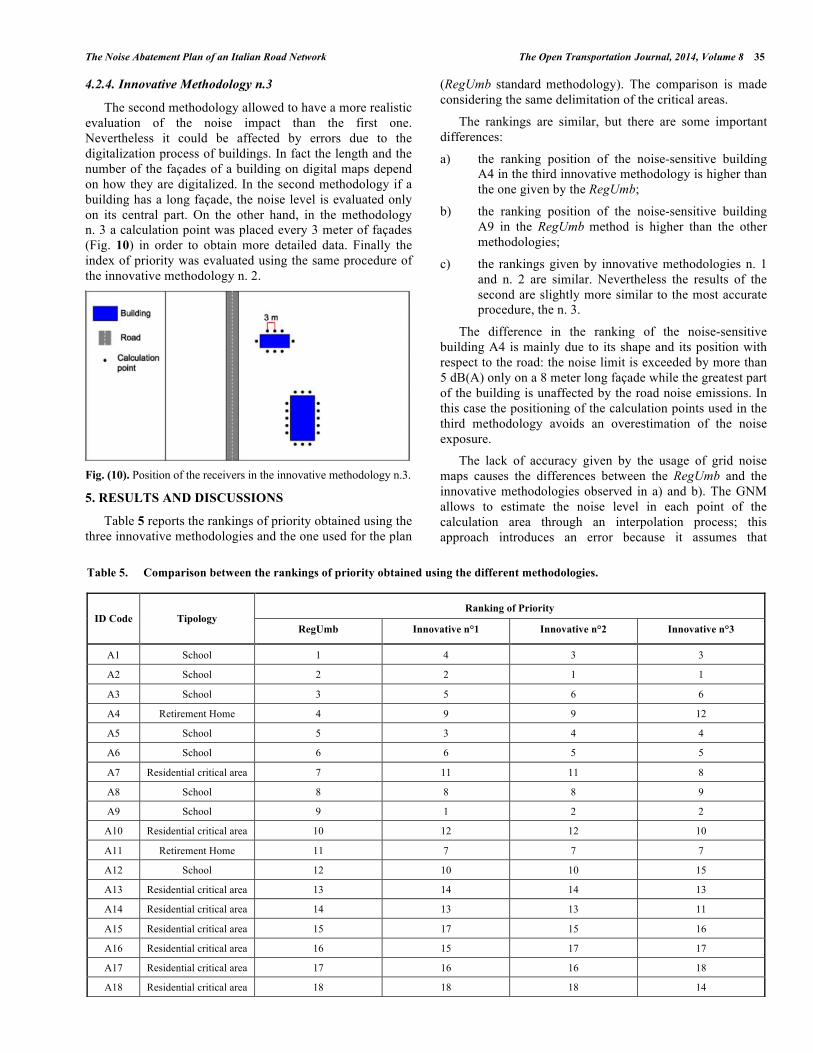
(Grid Noise Map GNM, see Fig. 7). The iso-level curves are then obtained by interpolating the results obtained in the knots of the grid. However a more accurate and often faster way is to calculate the noise levels only in points located next to residential and noise-sensitive buildings (façade noise map FNM, see Fig. 8) because:
a) in FNM SPL is estimated directly at the receivers position, for example on the façade of the building, where the noise exposure has to be evaluated;
b) usually, SPL is estimated in a lower (but more significant) number of points in FNM compared to GNM;
c) as a consequence of point b), the precision of noise simulation can be increased. For example a larger number of noise reflections could be considered. The results of a noise simulation are in fact more accurate if a larger number of reflection of the acoustic ray of the ray-tracing process is considered.
The most critical issue in the use of FNM is related to the position of the points where the noise level is evaluated. These aspects are further detailed in section 4.2.
Fig. (7). Example of grid noise map (GNM).
Fig. (8). Example of façade noise map (FNM).
4.1.3. Improvement of the Procedure for Noise-Sensitive Building
The procedure explained in section 3.4.1 is time consuming and is affected by a very low accuracy. An alternative approach is to distribute the population not in sub-areas within buildings but on their façades. This operation can be done automatically by the noise simulation software or during post-processing activities.
34 The Open Transportation Journal, 2014, Volume 8 D’Alessandro et al.
4.2. Definition of Innovative Methodologies
The considerations reported in section 4.1 were taken into account to develop three innovative methodologies. These methodologies were applied to a road selected as case study. The road SR 71 was chosen for the comparison because of its length and the high number of noise-sensitive buildings (11, more than 50% of the whole road network).
Unlike the previous methodology, the noise levels were calculated in single points (receivers) placed at 1 m from the buildings façades, using the FNM approach. The three proposed methodologies differ by the procedures chosen for the position of the receivers and the calculation of the index of priority.
4.2.1. Delimitation of Critical Areas
Eight critical areas (noise-sensitive buildings excluded) were individuated for the road SR71 using the standard procedure (in the following referred as RegUmb). In some cases, critical areas were too wide for the identification of a single noise abatement measure. Considering this, the critical areas were reshaped using the procedure described in section 4.1.1: their number raised from 8 to 11. An example of the differences between the two methodologies is reported in Fig. (9). The green line is the boundary of the critical area identified by RegUmb methodology. The analysis of the noise exposure of the buildings inside the critical area evidenced that two segments of low-noise asphalt should have been installed. Nevertheless, a critical area should comprehend all the buildings that can be acoustically rehabilitated using the same noise abatement measure, so the RegUmb procedure cannot be considered precise at this purpose. On the contrary, in the same area, the innovative methodology described in section 4.1.1 identifies two critical areas, highlighted in magenta. Both areas can be acoustically mitigated by a single segment of low-noise asphalt.
Fig. (9). Critical area delimitation using RegUmb method (green) and the procedure described in section 4.1.1 (magenta).
However in the following analyses the critical areas were delimited using the RegUmb procedure described in section 3.3.6, i.e. the boundaries of the critical areas are the administrative ones: this decision allows to make a correct comparison between the following methodologies and the standard one.
4.2.2. Innovative Methodology n.1
Sound pressure levels were calculated in points placed at 1 m from every façade longer than 5 m. A calculation point
is assigned to each floor of the building and it is placed in front of the centroid of the storey (see Fig. 8). The calculation of the index of priority was done using Eq. 7.
𝐼𝑃! = 𝐼𝑃!!!!! = 𝑎! ∗ 𝑁! ∗ ∆𝐿!"#,!!
!!! (Eq. 7)
where:
• aj is a coefficient equal to 1 for residential building. For noise-sensitive building it is the same coefficient reported in Eq. 3;
• Nj is the number of residents of the j-th building;
• ∆𝐿!"#,! is the maximum value of the noise limit excess (considering both diurno and notturno periods) among all the calculation points of the j-th building.
The index of priority of the i-th critical area was obtained through the summation of the IPj values of the n buildings belonging to it.
4.2.3. Innovative Methodology n.2
In the first methodology the calculation of the index of priority of a building was done multiplying the population of the building by the highest value of noise limit excess between those evaluated on its façades. This approach is in compliance with the Italian and European framework, but it can lead to an overestimation of the noise exposure: for instance if a high populated building has only a little façade exposed to noise it is unrealistic to consider that all its population is exposed to the noise level of the unique exposed façade.
The innovative methodology n. 2 was developed in order to solve this problem. Thus the index of priority was calculated for each calculation point of the façade and not for each building. The index of priority of the j-th calculation point IPcp,j is now given by Eq. 8:
𝐼𝑃!",! = 𝑎! ∗ 𝑄! ∗ 𝑙! ∗ ∆𝐿! (Eq. 8)
where:
i. aj is the same coefficient of Eq. 7;
ii. Qj is calculated with Eq. 9:
𝑄! =!!
!!∗!! (Eq. 9)
• Nj is the number of residents of the building on which the j-th calculation point is located;
• Pj is the perimeter of the building on which the j-th calculation point is located;
• nj is the number of floors of the building on which the j-th calculation point is located;
iii. lj is the length of the façade on which the j-th calculation point is located;
iv. ∆𝐿! is the noise limit excess (considering both diurno and notturno periods) evaluated for the j-th calculation point.
Finally the index of priority of the critical area/noise-sensitive building was calculated through the sum of all the IPcp,j values of the calculation points belonging to it.
The Noise Abatement Plan of an Italian Road Network The Open Transportation Journal, 2014, Volume 8 35
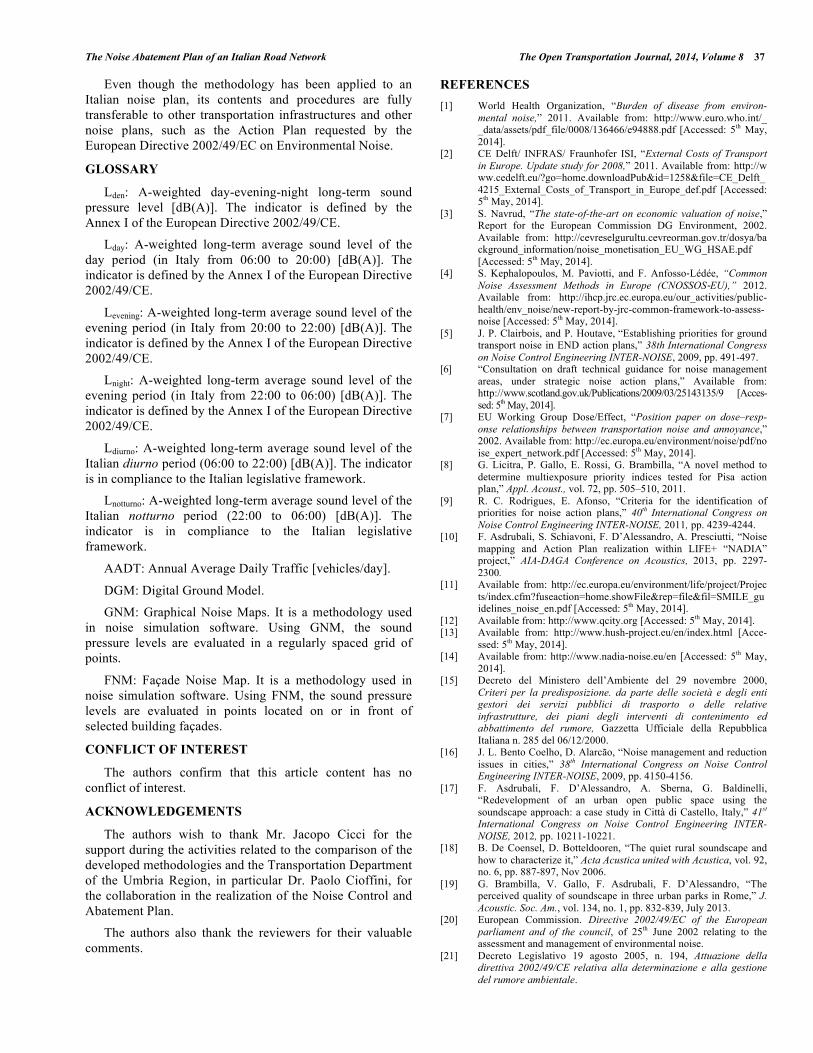
4.2.4. Innovative Methodology n.3
The second methodology allowed to have a more realistic evaluation of the noise impact than the first one. Nevertheless it could be affected by errors due to the digitalization process of buildings. In fact the length and the number of the façades of a building on digital maps depend on how they are digitalized. In the second methodology if a building has a long façade, the noise level is evaluated only on its central part. On the other hand, in the methodology n. 3 a calculation point was placed every 3 meter of façades (Fig. 10) in order to obtain more detailed data. Finally the index of priority was evaluated using the same procedure of the innovative methodology n. 2.
Fig. (10). Position of the receivers in the innovative methodology n.3.
5. RESULTS AND DISCUSSIONS
Table 5 reports the rankings of priority obtained using the three innovative methodologies and the one used for the plan
(RegUmb standard methodology). The comparison is made considering the same delimitation of the critical areas.
The rankings are similar, but there are some important differences:
a) the ranking position of the noise-sensitive building A4 in the third innovative methodology is higher than the one given by the RegUmb;
b) the ranking position of the noise-sensitive building A9 in the RegUmb method is higher than the other methodologies;
c) the rankings given by innovative methodologies n. 1 and n. 2 are similar. Nevertheless the results of the second are slightly more similar to the most accurate procedure, the n. 3.
The difference in the ranking of the noise-sensitive building A4 is mainly due to its shape and its position with respect to the road: the noise limit is exceeded by more than 5 dB(A) only on a 8 meter long façade while the greatest part of the building is unaffected by the road noise emissions. In this case the positioning of the calculation points used in the third methodology avoids an overestimation of the noise exposure.
The lack of accuracy given by the usage of grid noise maps causes the differences between the RegUmb and the innovative methodologies observed in a) and b). The GNM allows to estimate the noise level in each point of the calculation area through an interpolation process; this approach introduces an error because it assumes that
Table 5. Comparison between the rankings of priority obtained using the different methodologies.
ID Code Tipology Ranking of Priority
RegUmb Innovative n°1 Innovative n°2 Innovative n°3
A1 School 1 4 3 3
A2 School 2 2 1 1
A3 School 3 5 6 6
A4 Retirement Home 4 9 9 12
A5 School 5 3 4 4
A6 School 6 6 5 5
A7 Residential critical area 7 11 11 8
A8 School 8 8 8 9
A9 School 9 1 2 2
A10 Residential critical area 10 12 12 10
A11 Retirement Home 11 7 7 7
A12 School 12 10 10 15
A13 Residential critical area 13 14 14 13
A14 Residential critical area 14 13 13 11
A15 Residential critical area 15 17 15 16
A16 Residential critical area 16 15 17 17
A17 Residential critical area 17 16 16 18
A18 Residential critical area 18 18 18 14

36 The Open Transportation Journal, 2014, Volume 8 D’Alessandro et al.
physical effects are not taken into account between two knots of a grid. This error could be limited reducing the width of the grid, but it provokes a dramatic increase of the calculation time, even using a low reflection order. Moreover the GNM estimates the noise levels at a fixed height from the terrain (4 meters in the RegUmb method) since placing calculation grids at different heights causes unreasonable calculation and post-processing times: for high building (for instance higher than 6 meters) a single value of SPL evaluated at 4 meters could be not enough to represent its noise exposure.
Instead, the façade noise map FNM uses a lower number of points that are also better placed, so allowing to calculate the noise level at different heights from the ground: for instance for a three floors building the noise levels can be estimated at 1.5, 4.5 and 7.5 m (considering an average floor height of 3 meter) from the ground. The differences of the noise level values estimated in these three calculation points increase if there is an object (another building, noise barriers etc.) between the building and the noise source (in this case a road). The FNM approach allows to consider the screening effect whereas this could not be done properly using the GNM. Fig. (11) reports an example of this aspect. In particular the red dot is the calculation point used in GNM and the corresponding noise levels are obtained from the interpolation of the noise levels in the closest grid knots; the black dots are the calculation points used in FNM.
In the example reported in Fig. (11a), the noise level in the red dot is affected by the screening effect of the cyan object; nevertheless the building is considered exposed only to this noise level. This is not realistic because the object does not screen the highest floors of the building. If the line between the red dot and the source passes through the screening object, the adequacy of the index of priority evaluated by RegUmb method decreases as the height of the building increases. In Fig. (11b) the noise level in the red dot is not affected by the screening object and the whole building is considered exposed to this noise level. This is not realistic because the first floor of the building is affected by lower noise impact thanks to the effect of the screening object. If the line between the red point and the source does not pass through the screening object, the adequacy of the index of priority evaluated by RegUmb method decreases as the height of the building decreases. On the contrary the FNM approach allows to evaluate the noise levels on different floors (the black dots in Fig. 11) improving the adequacy of the noise impact evaluation.
CONCLUSIONS
The procedure used for the realization of a noise plan deeply influences its outcomes, in particular the selection and the prioritization of the noise abatement measures to be realized. It is worth noting that in Italy the budget available to the managing authority of a road network for noise rehabilitation must be allocated to the noise abatement actions following the priority order defined by the plan. Moreover the available budget is almost always insufficient to solve all the noise problems and only few noise abatement measures are actually realized. So the methodology used for
the noise plan should be as accurate and realistic as possible in order to optimize the budget and rehabilitate the situations that are truly most critical in terms of noise pollution.
(a)
(b)
Fig. (11). Example of the effect of a screening object on the noise level at a building façade using graphical noise map (red dot) and façade noise map (black dots). Road, screen and building disposition that underestimate (a) or overestimate (b) the evaluation of the index of priority.
The methodology, established by the technical staff of the Umbria Region (RegUmb methodology) and used for the realization of the Noise Control and Abatement Plan of the road network owned by Umbria Region and managed by the Province of Terni made in compliance with the Italian laws, appeared to be poorly accurate and time consuming.
Three innovative methodologies were proposed and tested and the results compared with those obtained by means of the RegUmb one. These methodologies differ by the procedures chosen for noise mapping, for the position of the calculation points and for the calculation of the index of priority.
The comparative analysis showed that the results obtained with the RegUmb procedure are not fully reliable while the innovative methodologies, in particular the methodology n. 3, allow a more detailed and realistic estimation of the noise impact generated by the road under study, resulting in a better definition of the rehabilitation activities.
The Noise Abatement Plan of an Italian Road Network The Open Transportation Journal, 2014, Volume 8 37
Even though the methodology has been applied to an Italian noise plan, its contents and procedures are fully transferable to other transportation infrastructures and other noise plans, such as the Action Plan requested by the European Directive 2002/49/EC on Environmental Noise.
GLOSSARY
Lden: A-weighted day-evening-night long-term sound pressure level [dB(A)]. The indicator is defined by the Annex I of the European Directive 2002/49/CE.
Lday: A-weighted long-term average sound level of the day period (in Italy from 06:00 to 20:00) [dB(A)]. The indicator is defined by the Annex I of the European Directive 2002/49/CE.
Levening: A-weighted long-term average sound level of the evening period (in Italy from 20:00 to 22:00) [dB(A)]. The indicator is defined by the Annex I of the European Directive 2002/49/CE.
Lnight: A-weighted long-term average sound level of the evening period (in Italy from 22:00 to 06:00) [dB(A)]. The indicator is defined by the Annex I of the European Directive 2002/49/CE.
Ldiurno: A-weighted long-term average sound level of the Italian diurno period (06:00 to 22:00) [dB(A)]. The indicator is in compliance to the Italian legislative framework.
Lnotturno: A-weighted long-term average sound level of the Italian notturno period (22:00 to 06:00) [dB(A)]. The indicator is in compliance to the Italian legislative framework.
AADT: Annual Average Daily Traffic [vehicles/day].
DGM: Digital Ground Model.
GNM: Graphical Noise Maps. It is a methodology used in noise simulation software. Using GNM, the sound pressure levels are evaluated in a regularly spaced grid of points.
FNM: Façade Noise Map. It is a methodology used in noise simulation software. Using FNM, the sound pressure levels are evaluated in points located on or in front of selected building façades.
CONFLICT OF INTEREST
The authors confirm that this article content has no conflict of interest.
ACKNOWLEDGEMENTS
The authors wish to thank Mr. Jacopo Cicci for the support during the activities related to the comparison of the developed methodologies and the Transportation Department of the Umbria Region, in particular Dr. Paolo Cioffini, for the collaboration in the realization of the Noise Control and Abatement Plan.
The authors also thank the reviewers for their valuable comments.
REFERENCES [1] World Health Organization, “Burden of disease from environ-
mental noise,” 2011. Available from: http://www.euro.who.int/_ _data/assets/pdf_file/0008/136466/e94888.pdf [Accessed: 5th May, 2014].
[2] CE Delft/ INFRAS/ Fraunhofer ISI, “External Costs of Transport in Europe. Update study for 2008,” 2011. Available from: http://w ww.cedelft.eu/?go=home.downloadPub&id=1258&file=CE_Delft_4215_External_Costs_of_Transport_in_Europe_def.pdf [Accessed: 5th May, 2014].
[3] S. Navrud, “The state-of-the-art on economic valuation of noise,” Report for the European Commission DG Environment, 2002. Available from: http://cevreselgurultu.cevreorman.gov.tr/dosya/ba ckground_information/noise_monetisation_EU_WG_HSAE.pdf [Accessed: 5th May, 2014].
[4] S. Kephalopoulos, M. Paviotti, and F. Anfosso-‐Lédée, “Common Noise Assessment Methods in Europe (CNOSSOS-‐EU),” 2012. Available from: http://ihcp.jrc.ec.europa.eu/our_activities/public-health/env_noise/new-report-by-jrc-common-framework-to-assess-noise [Accessed: 5th May, 2014].
[5] J. P. Clairbois, and P. Houtave, “Establishing priorities for ground transport noise in END action plans,” 38th International Congress on Noise Control Engineering INTER-NOISE, 2009, pp. 491-497.
[6] “Consultation on draft technical guidance for noise management areas, under strategic noise action plans,” Available from: http://www.scotland.gov.uk/Publications/2009/03/25143135/9 [Acces-sed: 5th May, 2014].
[7] EU Working Group Dose/Effect, “Position paper on dose–resp-onse relationships between transportation noise and annoyance,” 2002. Available from: http://ec.europa.eu/environment/noise/pdf/no ise_expert_network.pdf [Accessed: 5th May, 2014].
[8] G. Licitra, P. Gallo, E. Rossi, G. Brambilla, “A novel method to determine multiexposure priority indices tested for Pisa action plan,” Appl. Acoust., vol. 72, pp. 505–510, 2011.
[9] R. C. Rodrigues, E. Afonso, “Criteria for the identification of priorities for noise action plans,” 40th International Congress on Noise Control Engineering INTER-NOISE, 2011, pp. 4239-4244.
[10] F. Asdrubali, S. Schiavoni, F. D’Alessandro, A. Presciutti, “Noise mapping and Action Plan realization within LIFE+ “NADIA” project,” AIA-DAGA Conference on Acoustics, 2013, pp. 2297-2300.
[11] Available from: http://ec.europa.eu/environment/life/project/Projec ts/index.cfm?fuseaction=home.showFile&rep=file&fil=SMILE_guidelines_noise_en.pdf [Accessed: 5th May, 2014].
[12] Available from: http://www.qcity.org [Accessed: 5th May, 2014]. [13] Available from: http://www.hush-project.eu/en/index.html [Acce-
ssed: 5th May, 2014]. [14] Available from: http://www.nadia-noise.eu/en [Accessed: 5th May,
2014]. [15] Decreto del Ministero dell’Ambiente del 29 novembre 2000,
Criteri per la predisposizione. da parte delle società e degli enti gestori dei servizi pubblici di trasporto o delle relative infrastrutture, dei piani degli interventi di contenimento ed abbattimento del rumore, Gazzetta Ufficiale della Repubblica Italiana n. 285 del 06/12/2000.
[16] J. L. Bento Coelho, D. Alarcão, “Noise management and reduction issues in cities,” 38th International Congress on Noise Control Engineering INTER-NOISE, 2009, pp. 4150-4156.
[17] F. Asdrubali, F. D’Alessandro, A. Sberna, G. Baldinelli, “Redevelopment of an urban open public space using the soundscape approach: a case study in Città di Castello, Italy,” 41st International Congress on Noise Control Engineering INTER-NOISE, 2012, pp. 10211-10221.
[18] B. De Coensel, D. Botteldooren, “The quiet rural soundscape and how to characterize it,” Acta Acustica united with Acustica, vol. 92, no. 6, pp. 887-897, Nov 2006.
[19] G. Brambilla, V. Gallo, F. Asdrubali, F. D’Alessandro, “The perceived quality of soundscape in three urban parks in Rome,” J. Acoustic. Soc. Am., vol. 134, no. 1, pp. 832-839, July 2013.
[20] European Commission. Directive 2002/49/EC of the European parliament and of the council, of 25th June 2002 relating to the assessment and management of environmental noise.
[21] Decreto Legislativo 19 agosto 2005, n. 194, Attuazione della direttiva 2002/49/CE relativa alla determinazione e alla gestione del rumore ambientale.
38 The Open Transportation Journal, 2014, Volume 8 D’Alessandro et al.
[22] D.P.C.M 1 marzo 1991, Limiti massimi di esposizione al rumore negli ambienti abitativi e nell’ambiente esterno.
[23] S. Luzzi, R. Bellomini, F. Borchi, “Harmonization of action plans and noise reduction plans: the HUSH project,” 39th International Congress on Noise Control Engineering INTER-NOISE 2010, pp. 2516-2524.
[24] S. Curcuruto, R. Silvaggio, R. Amodio, L. De Rinaldis, E. Mazzocchi, F. Sacchetti, M. Stortini, “HUSH project contribution to environmental noise directive implementation and revision, focusing on noise management and public information tools,” 41st International Congress on Noise Control Engineering INTER-NOISE 2012, pp. 4036-4045.
[25] Legge 26/10/1995, n.447, Legge quadro sull'inquinamento acustico.
[26] Legge Regionale 06/06/2002, n.8, Disposizioni per il contenimento e la riduzione dell’inquinamento acustico.
[27] Regolamento Regionale 13/08/2004, n. 1, Regolamento di attuazione della legge regionale 6 giugno 2002, n. 8 -Disposizioni per il contenimento e la riduzione dell’inquinamento acustico.
[28] SoundPLAN software, version 7.1, Braunstein + Berndt GmbH. Available from: http://www.soundplan.eu/english [Accessed: 5th May, 2014].
[29] AFNOR XPS 31-133. Bruit des infrastructures de transports terrestres. Calcul de l’atténuation du son lors de sa propagation en milieu extérieur, incluant les effets météorologiques, 2001.
[30] European Commission Working Group Assessment of Exposure to Noise (WG-AEN), “Good practice guide for strategic noise mapping and the production of associated data on noise exposure,” 2007. Available from: http://ec.europa.eu/environment/noise/pdf/ gpg2.pdf [Accessed: 5th May, 2014].
[31] ISTAT, 15° Censimento generale della popolazione e delle abitazioni (Italian National Census of population and buildings), 2011.
[32] F. Asdrubali, C. Costantini, “Prediction and evaluation of noise pollution caused by a roads network,” 34th International Congress on Noise Control Engineering INTER-NOISE 2005, pp. 3820-3829.
[33] F. Asdrubali, S. Schiavoni, F. D’Alessandro, C. Schenone, I. Pittaluga, “Innovative aspects in noise mapping and dissemination activities within LIFE+ "NADIA" project,” 19th International Congress on Sound and Vibration ICSV 2012, pp. 420-427.
Received: February 2, 2014 Revised: May 8, 2014 Accepted: May 20, 2014 © D’Alessandro et al.; Licensee Bentham Open.
This is an open access article licensed under the terms of the Creative Commons Attribution Non-Commercial License (http://creativecommons.org/licenses/by-nc/3.0/) which permits unrestricted, non-commercial use, distribution and reproduction in any medium, provided the work is properly cited.
Related Documents