143 Jurnal Perspektif Pembiayaan dan Pembangunan Daerah Vol. 7 No. 2, September - October 2019 ISSN: 2338-4603 (print); 2355-8520 (online) The nexus between tourism development and economic growth in Eastern Indonesia: a panel VECM approach Amaluddin Development Economics Department, Faculty of Economics and Business, Universitas Pattimura, Indonesia Correspondence author email: [email protected] Abstract The empirical nexus between tourism development and economic growth have been widely examined, however, the empirical results generally produce diverse conclusion and often debated. The purpose of this empirical study is, firstly, to investigate and analyze the dynamic relationship between tourism sector development and economic growth both in the short and long run. Secondly, to examine the direction of causality between tourism development and economic growth in Eastern Indonesia over the period 2010-2017. This study employed a panel vector error correction model (PVECM) for the quantitative analysis approach from panel data of 12 provinces in eastern Indonesia. The empirical findings of this study were: 1) In the long run, the relationship between tourism development and economic growth supported the feedback causality hypothesis where changes and expansion in the tourism development affect economic growth and increasing economic growth have an impact on the expansion of the tourism sector (bi-directional causality). 2) The empirical findings corroborated the growth-led tourism hypothesis in the short run which argues that the achievements of economic growth affect the expansion of tourism development. In the short run, this empirical study only found a one-way causality running from economic growth to tourism development. Keywords: Causality, Economic growth, PVECM, Tourism development, JEL Classification: O11, Z32 INTRODUCTION In the last decades, the tourism sector has a strategic role and provided significant growth along with the dynamics of the national development paradigm that is more oriented to the development of the service and industry sector. The development of the tourism sector is very promising so that it is expected to become a leading sector in Indonesia's development. In 2017, the contribution of the tourism sector to the country's foreign exchange revenues reached USD 16.8 billion while its contribution to GDP and employment was around 18.5% and 12.5 million people. Evidence of Indonesia's success in the development of the tourism industry can be evaluated from the growth trend of the tourism sector with an indicator of the number of tourist arrivals increasing from year to year, especially foreign tourists. In 2010, the number of foreign tourist arrivals was 7 million people, then in 2017 increased to as many as 14 million people or experienced an average growth of 10.56% per year with the highest growth in 2017 of

Welcome message from author
This document is posted to help you gain knowledge. Please leave a comment to let me know what you think about it! Share it to your friends and learn new things together.
Transcript
143
Jurnal Perspektif Pembiayaan dan Pembangunan Daerah Vol. 7 No. 2, September - October 2019 ISSN: 2338-4603 (print); 2355-8520 (online)
The nexus between tourism development and economic growth
in Eastern Indonesia: a panel VECM approach
Amaluddin
Development Economics Department, Faculty of Economics and Business,
Universitas Pattimura, Indonesia
Correspondence author email: [email protected]
Abstract
The empirical nexus between tourism development and economic growth have been
widely examined, however, the empirical results generally produce diverse conclusion
and often debated. The purpose of this empirical study is, firstly, to investigate and
analyze the dynamic relationship between tourism sector development and economic
growth both in the short and long run. Secondly, to examine the direction of causality
between tourism development and economic growth in Eastern Indonesia over the
period 2010-2017. This study employed a panel vector error correction model
(PVECM) for the quantitative analysis approach from panel data of 12 provinces in
eastern Indonesia. The empirical findings of this study were: 1) In the long run, the
relationship between tourism development and economic growth supported the
feedback causality hypothesis where changes and expansion in the tourism development
affect economic growth and increasing economic growth have an impact on the
expansion of the tourism sector (bi-directional causality). 2) The empirical findings
corroborated the growth-led tourism hypothesis in the short run which argues that the
achievements of economic growth affect the expansion of tourism development. In the
short run, this empirical study only found a one-way causality running from economic
growth to tourism development.
Keywords: Causality, Economic growth, PVECM, Tourism development,
JEL Classification: O11, Z32
INTRODUCTION
In the last decades, the tourism sector has a strategic role and provided significant
growth along with the dynamics of the national development paradigm that is more
oriented to the development of the service and industry sector. The development of the
tourism sector is very promising so that it is expected to become a leading sector in
Indonesia's development. In 2017, the contribution of the tourism sector to the country's
foreign exchange revenues reached USD 16.8 billion while its contribution to GDP and
employment was around 18.5% and 12.5 million people. Evidence of Indonesia's
success in the development of the tourism industry can be evaluated from the growth
trend of the tourism sector with an indicator of the number of tourist arrivals increasing
from year to year, especially foreign tourists. In 2010, the number of foreign tourist
arrivals was 7 million people, then in 2017 increased to as many as 14 million people or
experienced an average growth of 10.56% per year with the highest growth in 2017 of
144
Jurnal Perspektif Pembiayaan dan Pembangunan Daerah Vol. 7 No. 2, September - October 2019 ISSN: 2338-4603 (print); 2355-8520 (online)
21.88%, whereas in the same year national economic growth only grew by 5.07%.
(BPS, 2019).
Indonesian tourism is targeted to be one of the best destinations in the world.
Steps to become a world-class tourism destination have been carried out, among others,
through the Wonderful Branding Country Indonesia. However, one of the important
issues in the development of Indonesia’s tourism sector is the low competitiveness
caused by the lack of availability of infrastructure and tourism investment both
government and private sector, especially in Eastern Indonesia, indicating that there is
still a development gap between the Western Indonesia and Eastern Indonesia. In 2011,
the provinces in eastern Indonesia were able to contribute to economic growth of
4.44%, then in 2017 an increase of 5.65%, with an average economic growth of 6.48%
per year. In the same period, the number of foreign tourist arrivals in Eastern Indonesia
in 2010 was 251,669 people then increased in 2017 to 1,129,920 people, with an
average growth of 29.61% per year (BPS, 2018).
In the perspective of the empirical nexus between tourism development and
economic growth have been widely examined, however, the empirical results generally
produce diverse conclusions and often debated. Some researchers have found that
tourism development has a positive impact on economic growth or supports the tourism
led-growth hypothesis (TLGH). Other empirical studies have found a one-way
relationship running from economic growth to the tourism sector that supports the
economic driven tourism growth hypothesis or growth-led tourism hypothesis (GLTH).
Several recent studies conducted in developed and developing countries have obtained
empirical findings that support a two-way causality or there is a mutually influential
relationship between tourism development and economic growth (bi-directional
causality) that supports the feedback causality or reciprocal causal hypothesis while
Kasimati (2011) and Katircioglu (2009) concluded that there was no causal relationship
between tourism and economic growth or this argument supports the neutrality
hypothesis. Çağlayan, Şak & Karymshakov (2012) also revealed that there was no
causal relationship between tourism and economic growth in the case of Asia, the
Middle East and North Africa, Central Asia and Sub Saharan Africa.
The first empirical finding reveals that economic growth is determined by tourism
development which supports the tourism-led economic growth hypothesis (TLGH).
Empirical studies that support this hypothesis using time series data (Suhel & Bashir,
2017); (Adnan Hye & Khan, 2013); (Kibara, Odhiambo, & Njuguna, 2012); (Akinboade
& Braimoh, 2010); (Kreishan, 2015); (Tang & Tan, 2015); (Mishra, Rout, &
Mohapatra, 2011), (Jalil, Mahmood & Idrees, 2013); (Risso & Brida, 2008); (Bento,
2016); and (Brida, Lanzilotta, & Pizzolon, 2016). Others applying panel and cross-
section data that supports this argument/hypothesis is carried out by Çağlayan, Şak &
Karymshakov, (2012); Lee & Chang (2008); Atan & Arslanturk (2012) and Sequeira &
Nunes (2008). Meanwhile, De Vita & Kyaw (2017) and Lee & Chang (2008) employed
panel data for supporting the tourism-led growth hypothesis (TLGH).
The growth-led tourism hypothesis argues that economic growth affects tourism
expansion (GLTH). The studies in line with this hypothesis were conducted by Oh
(2005); Payne & Mervar (2010); Odhiambo (2011); Suresh & Senthilnathan (2014),
meanwhile, the reciprocal causality relationship or the feedback hypothesis (FH)
considers the causal linkage between economic growth and tourism expansion as a bi-
directional causality, where the impetus for the two variables gives mutual benefits. An
145
Jurnal Perspektif Pembiayaan dan Pembangunan Daerah Vol. 7 No. 2, September - October 2019 ISSN: 2338-4603 (print); 2355-8520 (online)
empirical study was conducted by Nizar (2015) in Indonesia finding that there was a bi-
directional causality relationship between the development of the tourism sector and
economic growth or supported the reciprocal causal hypothesis. Recognition of a causal
relationship between economic growth and tourism expansion is very important because
it can have beneficial implications for relevant policy decision making (Khalil, Kakar,
& Waliullah, 2007); (Dritsakis, 2004); (Shuaibu & Oladayo, 2016); (Songling, Ishtiaq,
& Thanh, 2019); (Katircioglu, 2009); (Ongan & Demiröz, 2005); (Lee & Chang, 2008);
(Kim, Chen, & Jang, 2006); (Atan & Arslanturk, 2012); (Seghir, Mostéfa, Abbes &
Zakarya, 2015); (Tugcu, 2014); (Apergis & Payne, 2012); (Chou, 2013) and (Seetanah,
2011).
This study aims to, firstly, to investigate and analyze the dynamic relationship
between tourism sector development and economic growth both in the short and long
run. Secondly, to examine the direction of causality between tourism development and
economic growth in Eastern Indonesia over the period 2010-2017. The rest of this paper
proceeds as follows: Section 2 presents a review of relevant literature. Section 3
describes the research method consisting of an explanation of the data and variables
used, specifications of the econometric model, testing data and PVECM analysis.
Section 4 explains the results and discussion. Section 5 is the final section that contains
conclusions and recommendations.
LITERATURE REVIEW
In the perspective of an empirical study of tourism development, many
researchers have previously conducted studies/research on the pattern of causal
relationships between economic growth and tourism development, however, empirical
results tend to be diverse, leading to lengthy debates and consensus differences. The
first empirical finding is economic growth is determined by tourism development which
supports the tourism-led economic growth hypothesis (TLGH). The second empirical
finding is that tourism growth is driven by economic growth or supports the growth-led
tourism hypothesis, which considers economic growth to affect tourism expansion
(GLTH). The third empirical finding, reciprocal causality, or supporting the reciprocal
causal hypothesis, which considers the causal relationship between economic growth
and tourism expansion to be bi-directional causality, where the impetus for the two
variables gives mutual benefits.
Chiu & Yeh (2017) examined the threshold effects of the tourism-led growth
hypothesis based on cross-sectional data of 84 countries. The study investigated the
nexus between tourism development and economic growth and finds a linear positive
impact of international tourism receipts on economic growth, which confirms evidence
of the tourism-led growth hypothesis. The study was conducted by Šimundić, Kuliš &
Šerić (2016) about tourism and economic growth in Latin America and the Caribbean.
Total countries studied there are 33 countries with a period of time from 2000 to 2014.
The study employed a dynamic panel data approach. Variable used are real GDP, GDP
per capita, tourism growth per capita, government expenditure, investment, openness,
human capital and stability political. The results obtained by all variables are significant
and have a positive effect. The Results of this research showed the positive impact of
tourism on economic growth supporting the tourism-led growth hypothesis.
De Vita & Kyaw (2017) investigated the relationship between tourism
specialization and economic growth while accounting for the tourism destination
146
Jurnal Perspektif Pembiayaan dan Pembangunan Daerah Vol. 7 No. 2, September - October 2019 ISSN: 2338-4603 (print); 2355-8520 (online)
countries, defined in terms of financial system development. The study employed a
system generalized methods-of-moments (SYS-GMM) estimation methodology to
investigate this relationship for 129 countries over the period 1995-2011. The results of
the study concluded that the relationship between tourism specialization and economic
growth is found to be positive and significant for middle-countries and high-income
countries as they appear to gain considerably more from tourism specialization than
low-income countries.
Cárdenas-García, Sánchez-Rivero & Pulido-Fernández (2015) examined whether
tourism growth influences economic development in a panel of 144 countries. The study
groups the countries into two groups based on their different socioeconomic structures
such as level of income per capita, infrastructure, training, or instability of the economic
activity. The first group of countries characterize countries that showed a higher value
of the synthetic index of economic development in 1991, where it has been
demonstrated that tourism growth has led to an improvement of the economic
development. Narayan, Sharma & Banningidadmath (2013) used panel data predictive
regression modeling in the Pacific Island countries from 1985-2010 and found a
unidirectional causal flow from tourism to growth.
Çağlayan, Sak & Karymshakov (2012) found a unidirectional causality running
from tourism to economic growth in a panel of 135 countries for East Asia, South Asia
and Oceania; and a unidirectional causality running from economic growth to tourism in
the case of countries in America and Latin America and the Caribbean. Kibara,
Odhiambo, & Njuguna (2012) used time-series data from Kenya and an ARDL-bounds
testing approach to examine the linkages between tourism and economic growth in a
multivariate setting with trade as an intermittent variable. The finding from the study
was a unidirectional causal flow from tourism development to economic growth both in
the long and short run. Sequiera & Nunes (2008) also validated the tourism-led growth
hypothesis in the case of multiple countries from 1980 to 2002 using panel regression.
The study tested real per capita GDP, the ratio of tourist arrivals to population, tourism
receipts as a percentage of exports and as a percentage of GDP and other variables.
Although a unidirectional causal flow from tourism to economic growth is found in all
countries, the study also finds a decreasing effect of tourism on economic growth in
small countries.
Payne & Mervar (2010) used the Toda-Yamamoto causality test for Croatia and
also find a unidirectional causality flow from GDP to tourism receipts. Katircioglu,
(2009) employed the bounds test for cointegration and Granger causality tests to
investigate a long-run equilibrium relationship between tourism, trade and real income
growth as well as the direction of causality for Cyprus. The study found that GDP
Granger-causes tourist arrivals. Odhiambo (2011) employed ARDL bounds testing and
finds that in the long run, it is economic growth that drives the development of the
tourism sector in Tanzania. Suresh & Senthilnathan (2014) examined the causal
relationship between economic growth and tourism earning in Sri Lanka during 1977-
2012 by employing Granger-causality tests using annual time series data. The results
revealed that there was a unidirectional causality flow from economic growth to tourism
earning.
The research was conducted by Nizar (2015) employing the VAR model
concluded that the growth of tourism and economic growth have a reciprocal causal
relationship. The impact of tourism (receipts) growth increase will accelerate economic
147
Jurnal Perspektif Pembiayaan dan Pembangunan Daerah Vol. 7 No. 2, September - October 2019 ISSN: 2338-4603 (print); 2355-8520 (online)
growth while the increase of GDP growth will boost the increase of tourism growth in
the short-run. Chow (2013) examined causal relationships between tourism spending
and economic growth in 10 transition countries for the period 1988–2011. Using panel
causality analysis, the results supported and consistent with the feedback hypothesis for
four of the ten countries namely the Czech Republic, Poland, Estonia, and Hungary.
Seetanah (2011) applied panel data on 19 island economies over the period 1990 to
2007 to explore the potential contribution of tourism on economic growth and
development within the conventional augmented Solow growth model. The study
employed GMM methods and found that tourism significantly contributes to economic
growth. Granger causality analysis further reveals a bidirectional relationship between
tourism and growth. Apergis & Payne (2012) examined the causal relationship between
tourism and economic growth for a panel of nine Caribbean countries over the period
1995–2007. The panel error correction model revealed bi-directional causality between
tourism and economic growth in both the short run and the long run.
METHODS
Data and variable
The type of data used in this study is secondary data in the form of panel data,
which includes 12 provinces in Eastern Indonesia namely 1) West Nusa Tenggara, 2)
East Nusa Tenggara, 3) North Sulawesi, 4) Central Sulawesi, 5 ) South Sulawesi, 6)
Southeast Sulawesi, 7) Gorontalo, 8) West Sulawesi, 9) Maluku, 10) North Maluku, 11)
West Papua, 12) Papua. The research period is from 2010 to 2017. All data was taken
from the Indonesian Central Statistics Agency (BPS) and the Indonesian Ministry of
Tourism. In this study, tourism development has two variables as proxy that have been
widely used in previous studies, namely the number of tourist arrivals (JW) and private
investment in the tourism sector (IP), measured by the number of tourism business
units. Economic growth reflects an increase in production output from year to year,
measured by the Gross Regional Domestic Product (GRDP). Data processing, the
transformation of variables into natural logarithms and estimation of the econometrics
model using Microsoft Excel and EViews 10.
The specification of the econometric model
This study applies the quantitative method approach. Panel Vector Error
Correction Model (PVECM) is employed to 1) investigate the short-run and long-run
causality between tourism development and economic growth. 2) determine the
direction of the causal relationship between tourism development and economic growth
in the short-run and long-run. Panel Vector Error Correction Model (PVECM) is a
restricted PVAR (panel vector auto-regression) designed for use with non-stationary
series that are known to be cointegrated. The PVECM has cointegration relations built
into the specification so that it restricts the long-run behavior of the endogenous
variables to converge their cointegrating relationships while allowing for short-run
adjustment dynamics (Engle and Granger, 1987). The cointegration term is known as
the error correction term because a series of partial short-run adjustments make
corrections to deviations to achieve long-run equilibrium gradually.
If the variables are cointegrated of the same order, then the valid error correction
model exists between the three variables. The determination of cointegration
relationship (cointegrated vector) that shows the presence of a long-term relationship
148
Jurnal Perspektif Pembiayaan dan Pembangunan Daerah Vol. 7 No. 2, September - October 2019 ISSN: 2338-4603 (print); 2355-8520 (online)
between variables, causality (Rachev, Mittnik, Fabozzi, Focardi & Jasic, 2007);
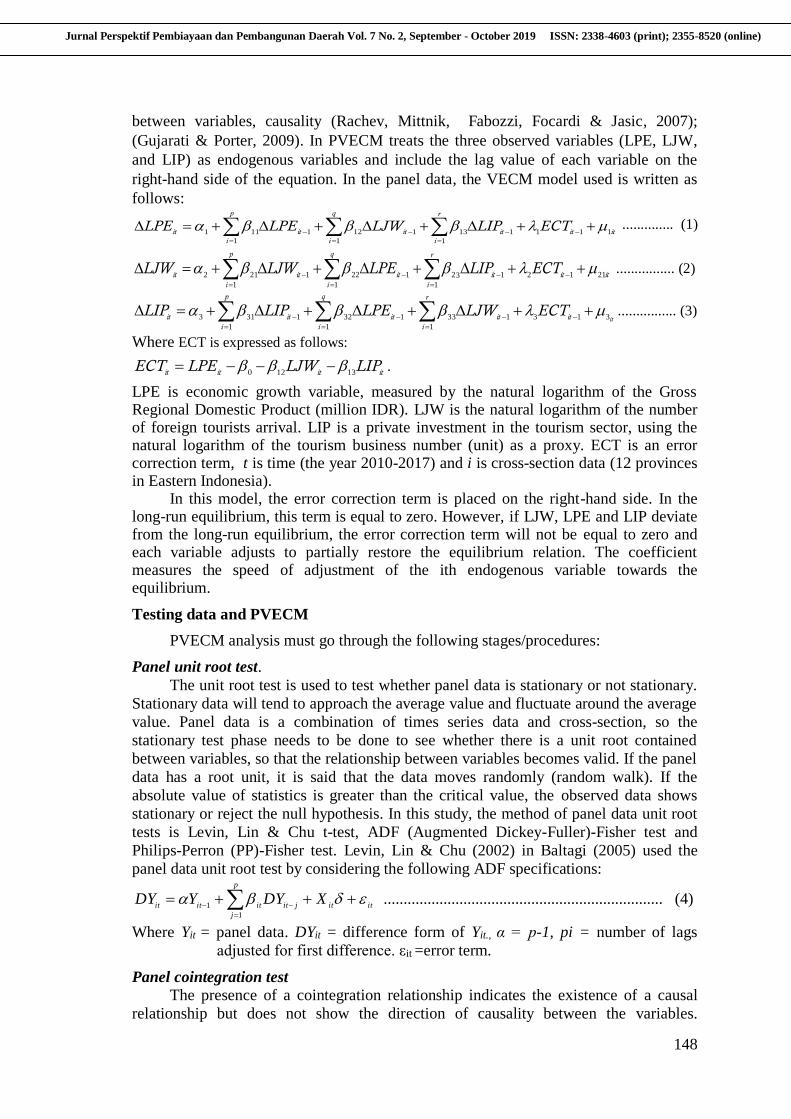
(Gujarati & Porter, 2009). In PVECM treats the three observed variables (LPE, LJW,
and LIP) as endogenous variables and include the lag value of each variable on the
right-hand side of the equation. In the panel data, the VECM model used is written as
follows:
itit
r
i
itit
q
i
it
p
i
itECTLIPLJWLPELPE
111
1
1131
1
121
1
111
.............. (1)
itit
r
i
itit
q
i
it
p
i
itECTLIPLPELJWLJW
2112
1
1321
1
221
1
212
................ (2)
itit
r
i
itit
q
i
it
p
i
itECTLJWLPELIPLIP
313
1
1331
1
321
1
313
................ (3)
Where ECT is expressed as follows:
ititititLIPLJWLPEECT
13120 .
LPE is economic growth variable, measured by the natural logarithm of the Gross Regional Domestic Product (million IDR). LJW is the natural logarithm of the number of foreign tourists arrival. LIP is a private investment in the tourism sector, using the natural logarithm of the tourism business number (unit) as a proxy. ECT is an error correction term, t is time (the year 2010-2017) and i is cross-section data (12 provinces in Eastern Indonesia).
In this model, the error correction term is placed on the right-hand side. In the long-run equilibrium, this term is equal to zero. However, if LJW, LPE and LIP deviate from the long-run equilibrium, the error correction term will not be equal to zero and each variable adjusts to partially restore the equilibrium relation. The coefficient measures the speed of adjustment of the ith endogenous variable towards the equilibrium.
Testing data and PVECM
PVECM analysis must go through the following stages/procedures:
Panel unit root test.
The unit root test is used to test whether panel data is stationary or not stationary.
Stationary data will tend to approach the average value and fluctuate around the average
value. Panel data is a combination of times series data and cross-section, so the
stationary test phase needs to be done to see whether there is a unit root contained
between variables, so that the relationship between variables becomes valid. If the panel
data has a root unit, it is said that the data moves randomly (random walk). If the
absolute value of statistics is greater than the critical value, the observed data shows
stationary or reject the null hypothesis. In this study, the method of panel data unit root
tests is Levin, Lin & Chu t-test, ADF (Augmented Dickey-Fuller)-Fisher test and
Philips-Perron (PP)-Fisher test. Levin, Lin & Chu (2002) in Baltagi (2005) used the
panel data unit root test by considering the following ADF specifications:
ititjit
p
j
itititXDYYDY
1
1 ...................................................................... (4)
Where Yit = panel data. DYit = difference form of Yit., α = p-1, pi = number of lags
adjusted for first difference. εit =error term.
Panel cointegration test
The presence of a cointegration relationship indicates the existence of a causal
relationship but does not show the direction of causality between the variables.

149
Jurnal Perspektif Pembiayaan dan Pembangunan Daerah Vol. 7 No. 2, September - October 2019 ISSN: 2338-4603 (print); 2355-8520 (online)
Cointegration is a long-term relationship between variables, although not individually
stationary, but the linear combination between these variables becomes stationary. The
use of Panel VECM requires that there be at least 2 cointegrated variables. The method
that can be used to test the cointegration is Kao Residual Cointegration Test (Engle-
Granger Based). Kao (1999) in Baltagi (2005) proposed an Augmented Dickey-Fuller
(ADF) panel cointegration test in which cointegrating vectors are assumed to be
homogeneous. Let ˆeit be the estimated residual from the following regression:
ititiitxy .................................................................................................................. (5)
The Kao test is based on a version of the ADF test on the residual (εit) of the
auxiliary regression εit = ρεit−1 + νit, or on the augmented version of the pooled
specification:
itν
jitΔε
p
1jj
λ1it
ρεitε
............................................................................... (6)
The ADF test is applied to the estimated residual: where p is chosen so that the residual
vit are serially uncorrelated. The ADF test statistic is the usual t-statistic in the previous
equation. The null hypothesis of no cointegration, the ADF test statistics can be written
as:
)ˆ10(ˆ2
ˆ(
0ˆ2
ˆ6(
2
02
2
0
v
v
v
ADFv
vNt
ADF
............................................................................................ (7)
Where is the long-run covariance matrix and
tADF is the t-statistic of in the ADF regression. Kao shows that the ADF test converges
to a standard normal distribution N (0,1). The statistical value of Kao panel data
cointegration test (ADF), when compared with the t-statistic value at 5% or the
Probability value. If the statistical value is greater than the critical value or the
probability value is less than 0.05, there is a long-run relationship in the variables.
Wald Test/VEC Granger Causality
The short-run causality is also tested using the Wald test. The Wald test
computes a test statistic based on the unrestricted regression. The Wald statistic
measures how close the unrestricted estimates come to satisfy the restrictions under the
null hypothesis. If the restrictions are in fact true, then the unrestricted estimates should
come close to satisfy the restrictions.
RESULT AND DISCUSSION
Description and testing of data
Based on the research objectives that have been stated previously, namely
1) Researching or investigating the direction of causality between the development of
the tourism sector and economic growth in Eastern Indonesia. 2) Analyzing the dynamic
relationship between the development of the tourism sector and economic growth in
Eastern Indonesia both in the short-run and long-run. To answer two main objectives,
this study employs the Panel Vector Error Correction Model (PVECM).
A description of the panel data containing the mean, median, maximum value,
lowest value (minimum) and the number of observations, available in Table 1. On

150
Jurnal Perspektif Pembiayaan dan Pembangunan Daerah Vol. 7 No. 2, September - October 2019 ISSN: 2338-4603 (print); 2355-8520 (online)
average, the number of foreign tourist visits during the period of 2010-2017 in 12
provinces of Eastern Indonesia was 55,314 people, with a maximum value of 604,823
people. Table 1 also explains that economic growth, measured by Gross Regional
Domestic Product (GRDP) experienced a significant increase of an average of 6.48%
per year or an average GRDP value of Rp. 68,290.03 billion, with a maximum value of
Rp.288,909 billion and a minimum value of Rp.14,984 billion. During 2010-2017, the
achievement of the amount of private investment was an average of 295 business units
per year, with a maximum figure of 112 business units and a minimum number of 62
business units.
Table 1. Description of data
Statistics Data/Variables
JW PE IP
Mean 55314.15 68290.03 294.7292
Median 8649.000 54811.09 224.5000
Maximum 604823.1 288908.6 1211.000
Minimum 10.00000 14983.91 62.00000
Std. Dev. 111582.0 58277.24 211.9719
Jarque-Bera 593.9090 114.4607 89.19167
Probability 0.000000 0.000000 0.000000
Sum 5310159. 6555842. 28294.00
Sum Sq. Dev. 1.18E+12 3.23E+11 4268549.
Observations 96 96 96
Table 1 also explains that data are not normally distributed with the statistical
significance indicator Jarque-Bera statistically significant at alpha of 5%. The number
of cross-section units is 12 provinces in Eastern Indonesia (KTI) and the total time-
series is 8 years (2010-2017) so that a total of 96-panel data observations are obtained.
The econometric model which used to analyze the direction of causality between
the development of the tourism sector and economic growth and to analyze the dynamic
relationship of the development of the tourism sector and economic growth both in the
short-run and long-run in Eastern Indonesia is the Panel Vector Error Correction Model
(PVECM). The first requirement in using PVECM analysis is that the data used should
be stationary and integrated. Therefore, in this section, the first step is testing data
stationarity by employing the methods of Levin, Lin & Chu (LLC), and Augmented
Dickey-Fuller (ADF) -Fisher and Philip-Perron (PP)-Fisher as shown in Table 2.
Table 2. Unit root test/stationarity of panel data
Variables Level First Difference
LLC ADF-Fisher PP-Fisher LLC ADF-Fisher PP-Fisher
LPE 0.20897
(0.5828)
11.2724
(0.9869)
13.8480
(0.9500)
-10.3348
(0.000)***
111.101
(0.000)***
147.732
(0.000)***
LJW -0.99656
(0.1595)
15.3241
(0.9109)
16.4411
(0.8715)
-13.7387
(0.000)***
145.858
(0.000)***
170.143
(0.000)***
LIP 0.40310
(0.6566)
9.49429
(0.9963)
10.2133
(0.9936)
-12.0683
(0.000)***
127.625
(0.000)***
150.377
(0.000)***
Note: LLC=Levin, Lin & Chu. ADF-Fisher= Augmented Dickey-Fuller-Fisher PP-Fisher=Philips-Perron-Fisher
Statistical value in parentheses () is p-value. ***, **, * = Significant at alpha 1 %, 5 %, 10 %.
151
Jurnal Perspektif Pembiayaan dan Pembangunan Daerah Vol. 7 No. 2, September - October 2019 ISSN: 2338-4603 (print); 2355-8520 (online)
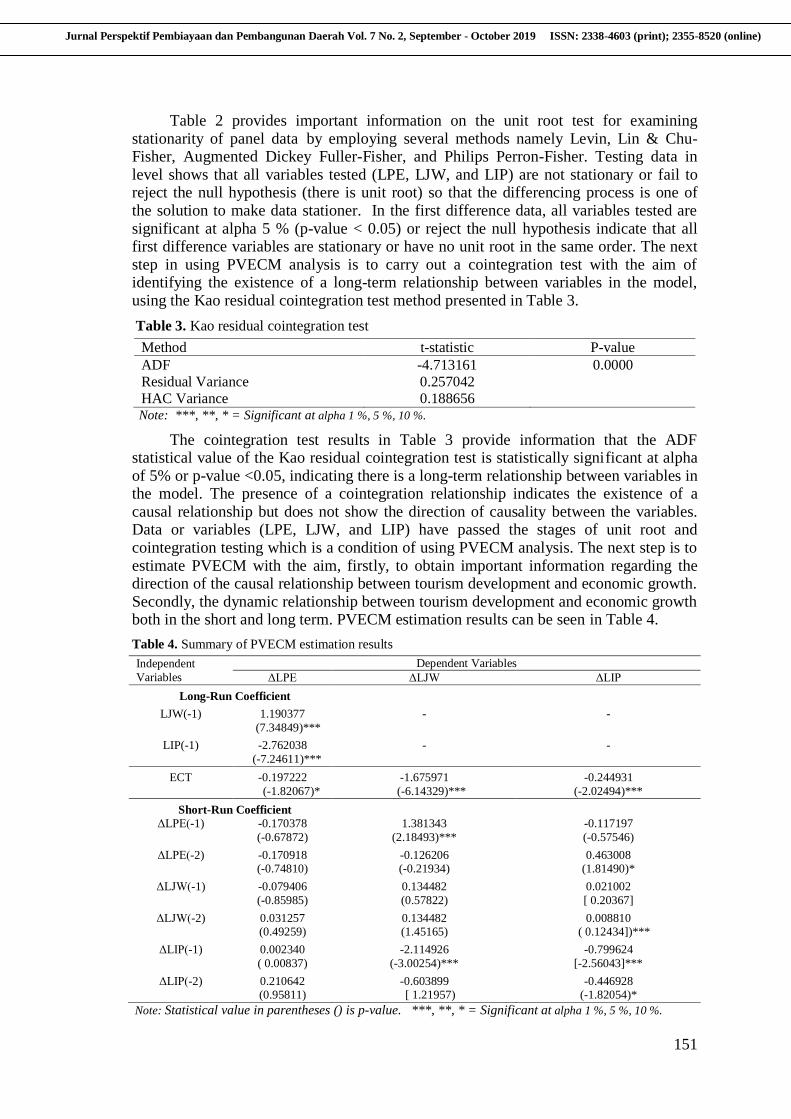
Table 2 provides important information on the unit root test for examining stationarity of panel data by employing several methods namely Levin, Lin & Chu-Fisher, Augmented Dickey Fuller-Fisher, and Philips Perron-Fisher. Testing data in level shows that all variables tested (LPE, LJW, and LIP) are not stationary or fail to reject the null hypothesis (there is unit root) so that the differencing process is one of the solution to make data stationer. In the first difference data, all variables tested are significant at alpha 5 % (p-value < 0.05) or reject the null hypothesis indicate that all first difference variables are stationary or have no unit root in the same order. The next step in using PVECM analysis is to carry out a cointegration test with the aim of identifying the existence of a long-term relationship between variables in the model, using the Kao residual cointegration test method presented in Table 3.
Table 3. Kao residual cointegration test
Method t-statistic P-value
ADF -4.713161 0.0000
Residual Variance 0.257042
HAC Variance 0.188656 Note: ***, **, * = Significant at alpha 1 %, 5 %, 10 %.
The cointegration test results in Table 3 provide information that the ADF statistical value of the Kao residual cointegration test is statistically significant at alpha of 5% or p-value <0.05, indicating there is a long-term relationship between variables in the model. The presence of a cointegration relationship indicates the existence of a causal relationship but does not show the direction of causality between the variables. Data or variables (LPE, LJW, and LIP) have passed the stages of unit root and cointegration testing which is a condition of using PVECM analysis. The next step is to estimate PVECM with the aim, firstly, to obtain important information regarding the direction of the causal relationship between tourism development and economic growth. Secondly, the dynamic relationship between tourism development and economic growth both in the short and long term. PVECM estimation results can be seen in Table 4.
Table 4. Summary of PVECM estimation results
Independent
Variables
Dependent Variables
ΔLPE ΔLJW ΔLIP
Long-Run Coefficient
LJW(-1) 1.190377 - -
(7.34849)***
LIP(-1) -2.762038 - -
(-7.24611)***
ECT -0.197222 -1.675971 -0.244931
(-1.82067)* (-6.14329)*** (-2.02494)***
Short-Run Coefficient
ΔLPE(-1) -0.170378 1.381343 -0.117197
(-0.67872) (2.18493)*** (-0.57546)
ΔLPE(-2) -0.170918 -0.126206 0.463008 (-0.74810) (-0.21934) (1.81490)*
ΔLJW(-1) -0.079406 0.134482 0.021002
(-0.85985) (0.57822) [ 0.20367]
ΔLJW(-2) 0.031257 0.134482 0.008810 (0.49259) (1.45165) ( 0.12434])***
ΔLIP(-1) 0.002340 -2.114926 -0.799624
( 0.00837) (-3.00254)*** [-2.56043]***
ΔLIP(-2) 0.210642 -0.603899 -0.446928 (0.95811) [ 1.21957) (-1.82054)*
Note: Statistical value in parentheses () is p-value. ***, **, * = Significant at alpha 1 %, 5 %, 10 %.
152
Jurnal Perspektif Pembiayaan dan Pembangunan Daerah Vol. 7 No. 2, September - October 2019 ISSN: 2338-4603 (print); 2355-8520 (online)
Based on the PVECM estimation results summarized in Table 4, demonstrating
several important information that there is a long-term causality running from tourism
development variables (LJW, LIP) to the economic growth variable (LPE) and also
giving a strong evidence of the existence of a long-run causality running from economic
growth to the tourism development (LJW & LIP). In the long run, tourism development
affects economic growth and the achievement of economic growth leads to expansion of
the tourism sector (feedback causality). The existence of a two-way relationship (bi-
directional causality) is shown by the ECT coefficient, which is negative and
statistically significant at alpha 5% for all variables. The ECT coefficient shows the
speed of adjustment or the process of correction from the short run to lead to
equilibrium in the long run. The speed of adjustment from tourism development to
economic growth is 19.72 % annually. Table 4 also reports that the two tourism
development variables in the short run do not significantly affect economic growth,
however changes in economic growth is found to have a statistically significant effect
on tourism development at alpha 5%, so that in the short term there is only a one-way
relations running from economic growth to tourism development.
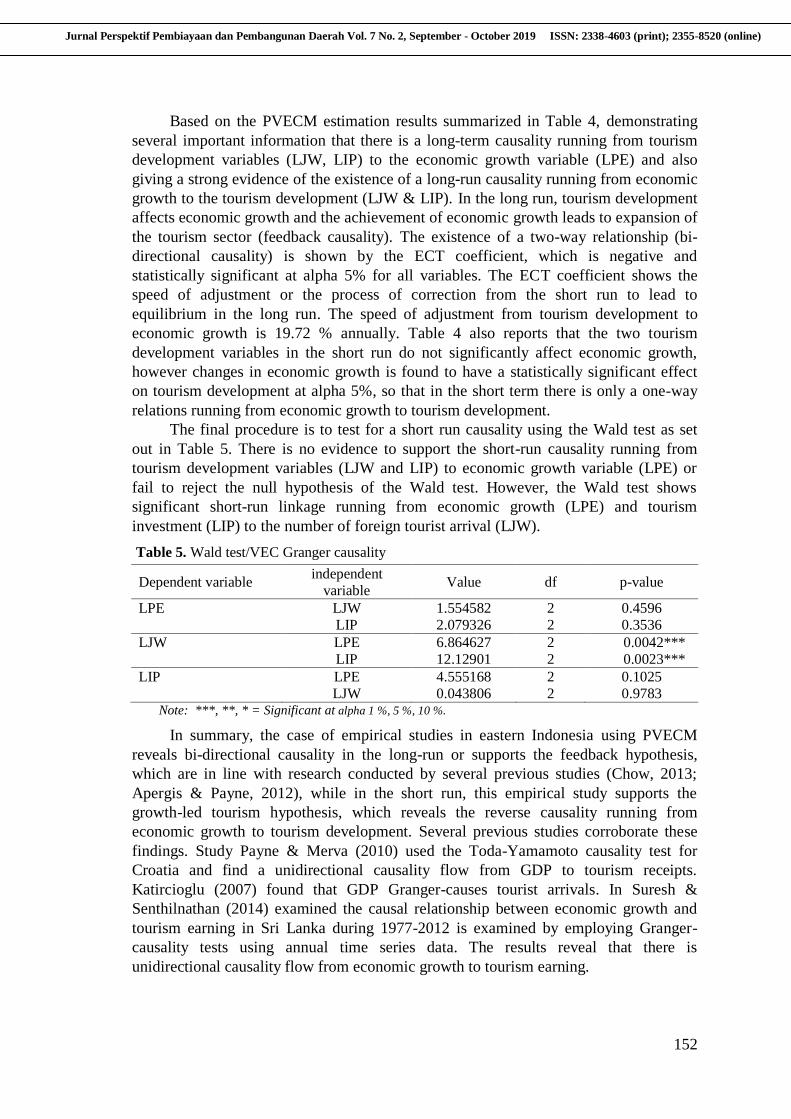
The final procedure is to test for a short run causality using the Wald test as set
out in Table 5. There is no evidence to support the short-run causality running from
tourism development variables (LJW and LIP) to economic growth variable (LPE) or
fail to reject the null hypothesis of the Wald test. However, the Wald test shows
significant short-run linkage running from economic growth (LPE) and tourism
investment (LIP) to the number of foreign tourist arrival (LJW).
Table 5. Wald test/VEC Granger causality
Dependent variable independent
variable Value df p-value
LPE LJW 1.554582 2 0.4596
LIP 2.079326 2 0.3536
LJW LPE 6.864627 2 0.0042***
LIP 12.12901 2 0.0023***
LIP LPE 4.555168 2 0.1025
LJW 0.043806 2 0.9783 Note: ***, **, * = Significant at alpha 1 %, 5 %, 10 %.
In summary, the case of empirical studies in eastern Indonesia using PVECM
reveals bi-directional causality in the long-run or supports the feedback hypothesis,
which are in line with research conducted by several previous studies (Chow, 2013;
Apergis & Payne, 2012), while in the short run, this empirical study supports the
growth-led tourism hypothesis, which reveals the reverse causality running from
economic growth to tourism development. Several previous studies corroborate these
findings. Study Payne & Merva (2010) used the Toda-Yamamoto causality test for
Croatia and find a unidirectional causality flow from GDP to tourism receipts.
Katircioglu (2007) found that GDP Granger-causes tourist arrivals. In Suresh &
Senthilnathan (2014) examined the causal relationship between economic growth and
tourism earning in Sri Lanka during 1977-2012 is examined by employing Granger-
causality tests using annual time series data. The results reveal that there is
unidirectional causality flow from economic growth to tourism earning.
153
Jurnal Perspektif Pembiayaan dan Pembangunan Daerah Vol. 7 No. 2, September - October 2019 ISSN: 2338-4603 (print); 2355-8520 (online)
CONCLUSIONS AND RECOMENDATIONS
Conclusions
This empirical study can conclude several important findings related to the pattern
of dynamic relationships and the direction of the relationship between tourism
development and economic growth both in the long run and short run by using the Panel
VECM, this empirical study found that there was a bi-directional causality between
tourism development and economic growth in the long run which corroborated the
feedback hypothesis. However, in the short run, empirical findings supported the
growth-led tourism hypothesis (GLTH) which argues that the achievements of
economic growth affect the expansion of tourism development. This condition is in line
with the economic development of the provinces in eastern Indonesia which are still
lagging behind compared to economic development in the western regions of Indonesia
which directly or indirectly influences tourism development.
Recommendations
Regional governments in eastern Indonesia should focus on the development and
improvement of public infrastructure, tourism infrastructure and the strengthening of
tourism services that are based on regional leading tourism so that in the long run it will
have an impact on improving the performance of the tourism sector and accelerating
economic growth simultaneously. In further research, it is necessary to add several
variables that further strengthen the results of this study, namely government spending
on the tourism sector and regional revenues from the tourism sector, with a longer
period.
REFERENCES
Adnan Hye, Q. M., & Ali Khan, R. E. (2013). Tourism-Led Growth Hypothesis: A Case
Study of Pakistan. Asia Pacific Journal of Tourism Research, 18(4) 303-313.
https://doi.org/10.1080/10941665.2012.658412
Akinboade, O. A., & Braimoh, L. A. (2010). International tourism and economic
development in South Africa: A granger causality test. International Journal of
Tourism Research, 12(2) 149-163. https://doi.org/10.1002/jtr.743
Apergis, N., & Payne, J. E. (2012). Research note: Tourism and growth in the
Caribbean - Evidence from a panel error correction model. Tourism Economics,
18(2) 449-456. https://doi.org/10.5367/te.2012.0119
Atan, S., & Arslanturk, Y. (2012). Tourism and Economic Growth Nexus: An Input-
Output Analysis in Turkey. Procedia - Social and Behavioral Sciences, 62, 952-
956. https://doi.org/10.1016/j.sbspro.2012.09.162
Baltagi, B.H. (2005). Econometric Analysis of Panel Data. 3rd Edition, John Wiley &
Sons Inc., New York
Bento, J. P. C. (2016). Tourism and economic growth in Portugal: an empirical
investigation of causal links. Tourism & Management Studies, 12(1) 164-171.
https://doi.org/10.18089/tms.2016.12117
Brida, J. G., Lanzilotta, B., & Pizzolon, F. (2016). Dynamic relationship between
tourism and economic growth in MERCOSUR countries: A nonlinear approach
based on asymmetric time series models. Economics Bulletin, 36(2) 879-894.
Çağlayan, E., Şak, N., & Karymshakov (2012). Relationship Between Tourism And
Economic Growth: A Panel Granger Causality Approach. Asian Economic and
154
Jurnal Perspektif Pembiayaan dan Pembangunan Daerah Vol. 7 No. 2, September - October 2019 ISSN: 2338-4603 (print); 2355-8520 (online)
Financial Review, 2(5) 591-602.
Cárdenas-García, P. J., Sánchez-Rivero, M., & Pulido-Fernández, J. I. (2015). Does
Tourism Growth Influence Economic Development? Journal of Travel Research,
54(2) 206-221. https://doi.org/10.1177/0047287513514297
Chiu, Y. Bin, & Yeh, L. T. (2017). The Threshold Effects of the Tourism-Led Growth
Hypothesis: Evidence from a Cross-sectional Model. Journal of Travel Research,
56(5) 625-637. https://doi.org/10.1177/0047287516650938
Chou, M. C. (2013). Does tourism development promote economic growth in transition
countries? A panel data analysis. Economic Modelling, 33, 226–232.
https://doi.org/10.1016/j.econmod.2013.04.024
De Vita, G., & Kyaw, K. S. (2017). Tourism Specialization, Absorptive Capacity, and
Economic Growth. Journal of Travel Research, 56(4) 423-435.
https://doi.org/10.1177/0047287516650042
Dritsakis, N. (2004). Tourism as a long-run economic growth factor: An empirical
investigation for Greece using causality analysis. Tourism Economics, 10(3) 305-
316. https://doi.org/10.5367/0000000041895094
Gujarati, D. N., & Porter, D. C. (2009). Basic Econometrics (5th ed.). McGraw Hill
Inc., New York.
Jalil, A., Mahmood, T., & Idrees, M. (2013). Tourism-growth nexus in Pakistan:
Evidence from ARDL bounds tests. Economic Modelling, 35, 185–191.
https://doi.org/10.1016/j.econmod.2013.06.034
Kasimati, E. (2011). Economic impact of tourism on greece’s economy: Cointegration
and causality anzlysis. International Research Journal of Finance and Economics,
79, 79–85.
Katircioglu, S. (2009). Tourism, trade and growth: The case of Cyprus. Applied
Economics, 41(21) 2741-2750. https://doi.org/10.1080/00036840701335512
Katircioglu, S. T. (2009). Revisiting the tourism-led-growth hypothesis for Turkey
using the bounds test and Johansen approach for cointegration. Tourism
Management, 30(1) 17-20. https://doi.org/10.1016/j.tourman.2008.04.004
Khalil, S., Kakar, M. K., & Waliullah. (2007). Role of tourism in economic growth:
Empirical evidence from Pakistan economy. Pakistan Development Review, 46(4)
985-995.
Kibara, O. N., Odhiambo, N. M., & Njuguna, J. M. (2012). Tourism And Economic
Growth In Kenya: An Empirical Investigation. International Business &
Economics Research Journal (IBER), 11(5) 517-525.
https://doi.org/10.19030/iber.v11i5.6970
Kim, H. J., Chen, M. H., & Jang, S. C. S. (2006). Tourism expansion and economic
development: The case of Taiwan. Tourism Management, 27(5) 925-933.
https://doi.org/10.1016/j.tourman.2005.05.011
Kreishan, F. M. (2015). Empirical Study on Tourism and Economic Growth of Bahrain:
An ARDL Bounds Testing Approach. International Journal of Economics and
Finance, 7(11) 1-10. https://doi.org/10.5539/ijef.v7n11p1
Lee, C. C., & Chang, C. P. (2008). Tourism development and economic growth: A
closer look at panels. Tourism Management, 29(1) 180-192.
https://doi.org/10.1016/j.tourman.2007.02.013
Mishra, P. K., Rout, H. B., & Mohapatra, S. S. (2011). Causality between tourism and
economic growth: Empirical evidence from India. European Journal of Social
155
Jurnal Perspektif Pembiayaan dan Pembangunan Daerah Vol. 7 No. 2, September - October 2019 ISSN: 2338-4603 (print); 2355-8520 (online)
Sciences, 18(4) 518-527.
Narayan, P.K.; Sharma, S. & Banningidadmath, D. (2013) Does tourism predict
macroeconomic performance in Pacific Islands countries? Working Paper SWP
2013/03, Financial Econometric Series, School of Accounting, Business and
Finance, Faculty of Business and Law, Deakin University Australia.
Nizar, M. A. (2015). Tourism Effect on Economic Growth in Indonesia. MPRA Paper,
(65628).
Odhiambo, N. M. (2011). Tourism development and economic growth in Tanzania:
Empirical evidence from the ARDL-bounds testing approach., Economic
Computation and Economic Cybernetics Studies and Research, 15(96) 200-220.
Oh, C. O. (2005). The contribution of tourism development to economic growth in the
Korean economy. Tourism Management, 26(1) 39-44.
https://doi.org/10.1016/j.tourman.2003.09.014
Ongan, S., & Demiröz, D. M. (2005). The contribution of tourism to the long-run
Turkish economic growth. Ekonomicky Casopis, 53(9) 880-894.
Payne, J. E., & Mervar, A. (2010). The tourism-growth nexus in Croatia. Tourism
Economics, 16(4) 1089.
Rachev, S. T., Mittnik, S., Fabozzi, F. J., Focardi, S. M., & Jasic, T. (2007). Financial
Econometrics: From Basics to Advanced Modeling Techniques. New York: John
Wiley & Sons
Risso, W. A., & Brida, J. G. (2008). The Contribution of Tourism to Economic Growth:
An Empirical Analysis for the Case of Chile. European Journal of Tourism
Research, 13(6) 1537-1542. https://doi.org/10.1074/mcp.O114.037879
Seetanah, B. (2011). Assessing the dynamic economic impact of tourism for island
economies. Annals of Tourism Research, 38(1) 291-308.
https://doi.org/10.1016/j.annals.2010.08.009
Seghir, G. M., Mostéfa, B., Abbes, S. M., & Zakarya, G. Y. (2015). Tourism Spending-
Economic Growth Causality in 49 Countries: A Dynamic Panel Data Approach.
Procedia Economics and Finance, 23, 1613–1623. https://doi.org/10.1016/s2212-
5671(15)00402-5
Sequeira, T. N., & Nunes, P. M. (2008). Does tourism influence economic growth? A
dynamic panel data approachy. Applied Economics, 40(18) 2431-2441.
https://doi.org/10.1080/00036840600949520
Shuaibu, M., & Oladayo, P. T. (2016). Determinants of human capital development in
Africa: a panel data analysis. Oeconomia Copernicana, 7(4), 523.
https://doi.org/10.12775/oec.2016.030
Šimundić, B., Kuliš, Z., & Šerić, N. (2016). Tourism And Economic Growth: An
Evidence For Latin American And Caribbean Countries. Tourism & Hospitality
Industry 2016-Congress Proceedings , 457–469.
Songling, Y., Ishtiaq, M., & Thanh, B. T. (2019). Tourism Industry and Economic
Growth Nexus in Beijing, China. Economies, 7(1), 25.
https://doi.org/10.3390/economies7010025
Suhel, S., & Bashir, A. (2018). The role of tourism toward economic growth in the local
economy. Economic Journal of Emerging Markets, 10(1), 32–39.
https://doi.org/10.20885/ejem.vol10.iss1.art4
Suresh, J., & Senthilnathan, S. (2014). Relationship between Tourism and Economic
Growth in Sri Lanka. SSRN Electronic Journal.
156
Jurnal Perspektif Pembiayaan dan Pembangunan Daerah Vol. 7 No. 2, September - October 2019 ISSN: 2338-4603 (print); 2355-8520 (online)
https://doi.org/10.2139/ssrn.2373931
Tang, C. F., & Tan, E. C. (2015). Tourism-Led Growth Hypothesis in Malaysia:
Evidence-Based Upon Regime Shift Cointegration and Time-Varying Granger
Causality Techniques. Asia Pacific Journal of Tourism Research, 20, 1430–1450.
https://doi.org/10.1080/10941665.2014.998247
Tugcu, C. T. (2014). Tourism and economic growth nexus revisited: A panel causality
analysis for the case of the Mediterranean Region. Tourism Management, 42,
207–212. https://doi.org/10.1016/j.tourman.2013.12.007
Related Documents