DEPARTMENT OF LABOUR LABOUR MARKET INFORMATION The New Zealand Knowledge Economy A REVIEW OF INTERNATIONAL METHODOLOGIES FOR MEASURING THE KNOWLEDGE ECONOMY, AND PRELIMINARY FINDINGS FOR NEW ZEALAND

Welcome message from author
This document is posted to help you gain knowledge. Please leave a comment to let me know what you think about it! Share it to your friends and learn new things together.
Transcript

DEPARTMENT OF LABOUR LABOUR MARKET INFORMATION
The New Zealand Knowledge EconomyA review of internAtionAl methodologies for meAsuring the knowledge economy, And preliminAry findings for new ZeAlAnd

Disclaimer: The Department of Labour has made every effort to ensure that the
information contained in this report is reliable, but makes no guarantee of its
accuracy or completeness and does not accept any liability for any errors. The Department may change the contents of this report at any time without notice.
ISBN 978-0-478-33365-7 May 2009
© Crown copyright Year
This material is Crown copyright unless otherwise stated and may be reproduced
free of charge without requiring specific permission. This is subject to it being
reproduced accurately and not being used in a derogatory manner or in a
misleading context. The source and copyright status should be acknowledged.
The permission to reproduce Crown copyright protected material does not extend
to any material in this report that is identified as being the copyright of a third
party.
Department of Labour
PO Box 3705
Wellington
New Zealand
www.dol.govt.nz
Page 3 of 34
CONTENTS PAGE
1. INTRODUCTION....................................................................................4 1.1 Background........................................................................................ 4 1.2 Review of International Methodologies - Local Futures and the Work
Foundation.......................................................................................... 5 1.3 Canterbury focus ................................................................................ 8
2. PRELIMINARY FINDINGS .....................................................................8
3. IMPLICATIONS OF RESULTS...............................................................10
4. FUTURE WORK....................................................................................11
APPENDIX ONE – INTERNATIONAL METHODOLOGY APPLICATION TO
NEW ZEALAND........................................................................................12
APPENDIX TWO – THE CANTERBURY KNOWLEDGE ECONOMY. ...............32
1. INTRODUCTION
The ‘Knowledge Economy’ is a term that has been used widely both in New
Zealand and internationally.
The United Nations notes that Knowledge Economy is not an agreed term “…it
must be said that there is no coherent definition, let alone theoretical concept, of
this term: it is at best a widely used metaphor, rather than a concept.”1
The term "knowledge based economy" was coined by the OECD and defined as an
economy which is "directly based on the production, distribution and use of
knowledge and information"2 (OECD 1996).
While the meaning of ‘knowledge economy’ may differ slightly depending on the
context, it is reasonable to say that the term refers to the influence of differently
skilled individuals on performance of an area, be it social, economic or
developmental performance. It is commonly reported that highly skilled people
add more on average per person to the development and performance of an
economy. While it is recognised that having all workers of an economy being
highly skilled is not practical or even desired, most if not all OECD countries are
attempting to raise average skill levels of their workers.
It is not the purpose of this report to give a complete analysis of Knowledge
Economy literature. A wealth of research and analysis can be found of the topic of
the Knowledge Economy using even the most basic web search.
1.1 Background
Measurement of the Knowledge Economy is important to the Department of
Labour (DoL). In the current environment of historically low unemployment rates
and historically high labour force participation, further development of the labour
force is most likely achieved through skill enhancement of existing members of the labour force. The measurement of skills – at least partially measured by
stocks of knowledge – is important in the understanding the characteristics of the
current labour market. Without an idea of the current level of labour market skills
across industries, occupations and regions, processes which target the
improvement in skills would be inefficient if not misdirected.
The Department of Labour makes frequent reference to the importance of
Productivity improvements. On the Introduction page of the DoL website it says
that the role of DoL is to “support regions and industries and employers to
develop a skilled, innovative and productive workforce”3. The importance of
Productivity improvements is shown within the ‘Buy, Make, Fix’ presentation. This
presentation shows that if New Zealand is to achieve GDP growth at a rate that
moves New Zealand up the order of OECD countries, increasingly this
development will be dependent on productivity improvements. With the pool of
extra workers (generally unemployment) more or less absorbed into employment
1 “What is the Knowledge Economy? Knowledge Intensity and Distributed Knowledge Bases” Keith Smith, United Nations
University, June 2002
2 “The Knowledge Based Economy”, OECD, OCED/GD(96)102. Pg 7. www.oecd.org/dataoecd/51/8/1913021.pdf
3 http://www.dol.govt.nz/about/index.asp
Page 5 of 34
over the last 5 years, the growth in output will need to come from improvements
in output per worker hour (Productivity).
It is generally agreed that increased levels of knowledge, via formal training or on
the job development increases the productivity of those workers. Highly
productive workplaces are a particular focus of the DoL report, ‘Better Work,
Working Better4’.
Also by improving skill levels of New Zealand employees, the jobs of these
employees become decreasingly susceptible to replacement by lower wage
economies. The measurement of knowledge and the change in the stocks of that
knowledge are central to the development of desired levels of worker productivity
and job security.
1.2 Review of International Methodologies - Local Futures
and the Work Foundation
While the theoretical concepts involved in Knowledge economies are important, to
be applied it is also important to have a definition that is able to be measured.
This drive towards application and measurement can be seen internationally.
Amongst other international institutions, The World Bank has developed the
‘Knowledge Assessment Methodology’5, and a variety of other agencies including
the OECD have noted the importance of Research and Development (R&D) spend,
Academic research and the number of Patents issued as indicators of knowledge
intensity. Recently in Australia6, the overemphasis on measurement of R&D
expenditure has been criticised. The Australian Business Foundation report notes
that the contribution of ‘non research and development’ components of the
innovation process “such as engineering experimentation, skill development,
design activities”7 should not be underestimated. By assigning the responsibility
for innovation growth to R&D processes, the costs of innovation are under
estimated, and the returns to R&D spend are overestimated.
Two relatively recent examples of the drive to produce actual measurements of
knowledge intensity come from the United Kingdom based organisations, Local
Futures8, and The Work Foundation9.
Local Futures
“The Local Futures Group is a research and strategy consultancy that provides a
geographical perspective on social and environmental change, set within a 21st
century knowledge economy.” – taken from the Local Futures website.
Local Futures bases their measurement of the Knowledge Economy on
educational qualifications as a proxy for knowledge. Local Futures calculate the
Knowledge Intensity of an Industry or an Occupation based upon the proportion
of the relevant workforce that has University degrees or Higher.
4 Pg 9, Better Work, Working Better, Labour Market & Employment Strategy, Department of Labour New Zealand,
5 http://www.worldbank.org/kam
6 “Innovation and the Knowledge Economy in Australia”, Australian Business Foundation, May 2006 7 Ibid, Pg 18 8 http://www.localfutures.com/
9 http://www.theworkfoundation.com/index.aspx
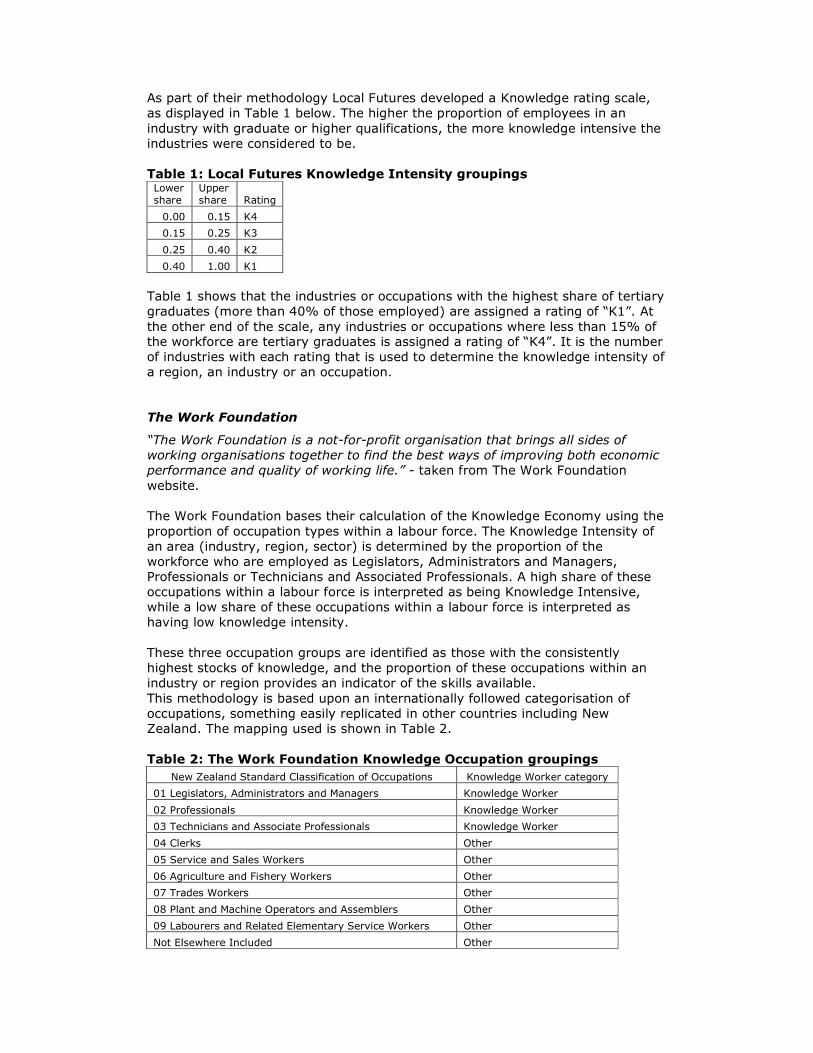
As part of their methodology Local Futures developed a Knowledge rating scale,
as displayed in Table 1 below. The higher the proportion of employees in an
industry with graduate or higher qualifications, the more knowledge intensive the
industries were considered to be.
Table 1: Local Futures Knowledge Intensity groupings Lower share
Upper share Rating
0.00 0.15 K4
0.15 0.25 K3
0.25 0.40 K2
0.40 1.00 K1
Table 1 shows that the industries or occupations with the highest share of tertiary
graduates (more than 40% of those employed) are assigned a rating of “K1”. At
the other end of the scale, any industries or occupations where less than 15% of the workforce are tertiary graduates is assigned a rating of “K4”. It is the number
of industries with each rating that is used to determine the knowledge intensity of
a region, an industry or an occupation.
The Work Foundation
“The Work Foundation is a not-for-profit organisation that brings all sides of
working organisations together to find the best ways of improving both economic
performance and quality of working life.” - taken from The Work Foundation
website.
The Work Foundation bases their calculation of the Knowledge Economy using the
proportion of occupation types within a labour force. The Knowledge Intensity of
an area (industry, region, sector) is determined by the proportion of the
workforce who are employed as Legislators, Administrators and Managers,
Professionals or Technicians and Associated Professionals. A high share of these
occupations within a labour force is interpreted as being Knowledge Intensive,
while a low share of these occupations within a labour force is interpreted as
having low knowledge intensity.
These three occupation groups are identified as those with the consistently
highest stocks of knowledge, and the proportion of these occupations within an
industry or region provides an indicator of the skills available.
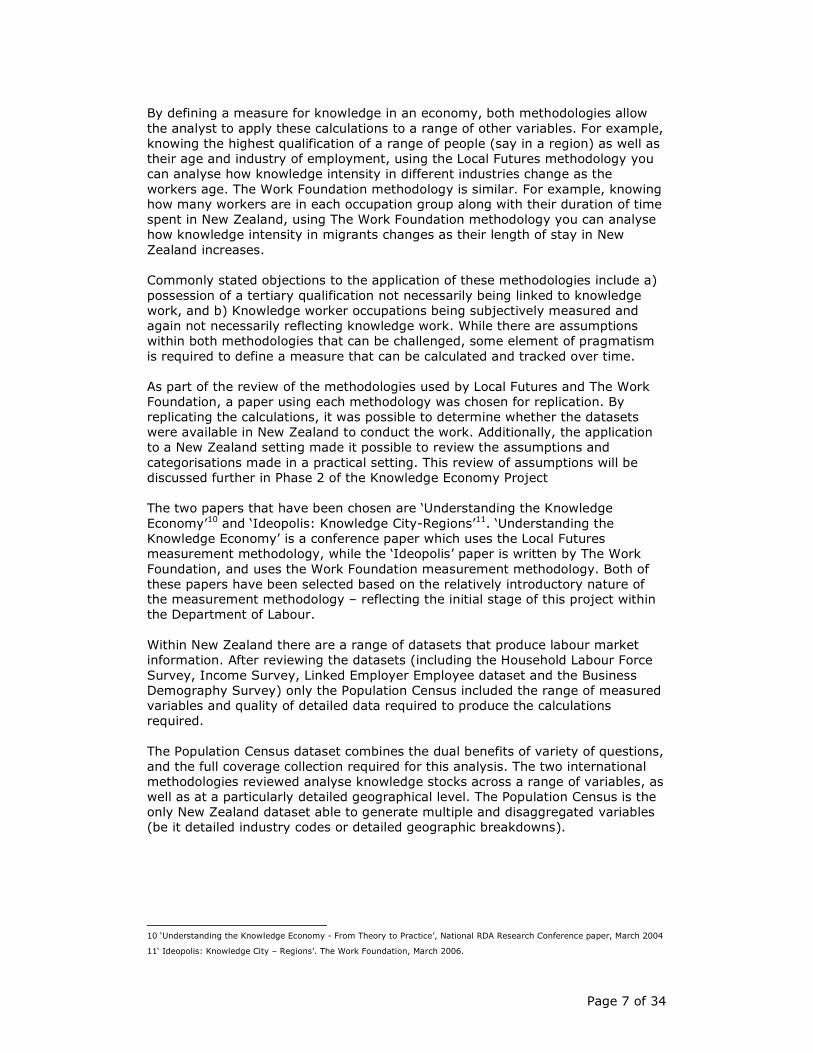
This methodology is based upon an internationally followed categorisation of
occupations, something easily replicated in other countries including New
Zealand. The mapping used is shown in Table 2.
Table 2: The Work Foundation Knowledge Occupation groupings
New Zealand Standard Classification of Occupations Knowledge Worker category
01 Legislators, Administrators and Managers Knowledge Worker
02 Professionals Knowledge Worker
03 Technicians and Associate Professionals Knowledge Worker
04 Clerks Other
05 Service and Sales Workers Other
06 Agriculture and Fishery Workers Other
07 Trades Workers Other
08 Plant and Machine Operators and Assemblers Other
09 Labourers and Related Elementary Service Workers Other
Not Elsewhere Included Other
Page 7 of 34
By defining a measure for knowledge in an economy, both methodologies allow
the analyst to apply these calculations to a range of other variables. For example,
knowing the highest qualification of a range of people (say in a region) as well as
their age and industry of employment, using the Local Futures methodology you
can analyse how knowledge intensity in different industries change as the
workers age. The Work Foundation methodology is similar. For example, knowing how many workers are in each occupation group along with their duration of time
spent in New Zealand, using The Work Foundation methodology you can analyse
how knowledge intensity in migrants changes as their length of stay in New
Zealand increases.
Commonly stated objections to the application of these methodologies include a)
possession of a tertiary qualification not necessarily being linked to knowledge
work, and b) Knowledge worker occupations being subjectively measured and
again not necessarily reflecting knowledge work. While there are assumptions
within both methodologies that can be challenged, some element of pragmatism
is required to define a measure that can be calculated and tracked over time.
As part of the review of the methodologies used by Local Futures and The Work
Foundation, a paper using each methodology was chosen for replication. By
replicating the calculations, it was possible to determine whether the datasets
were available in New Zealand to conduct the work. Additionally, the application
to a New Zealand setting made it possible to review the assumptions and
categorisations made in a practical setting. This review of assumptions will be
discussed further in Phase 2 of the Knowledge Economy Project
The two papers that have been chosen are ‘Understanding the Knowledge
Economy’10 and ‘Ideopolis: Knowledge City-Regions’11. ‘Understanding the
Knowledge Economy’ is a conference paper which uses the Local Futures
measurement methodology, while the ‘Ideopolis’ paper is written by The Work
Foundation, and uses the Work Foundation measurement methodology. Both of
these papers have been selected based on the relatively introductory nature of the measurement methodology – reflecting the initial stage of this project within
the Department of Labour.
Within New Zealand there are a range of datasets that produce labour market
information. After reviewing the datasets (including the Household Labour Force
Survey, Income Survey, Linked Employer Employee dataset and the Business
Demography Survey) only the Population Census included the range of measured
variables and quality of detailed data required to produce the calculations
required.
The Population Census dataset combines the dual benefits of variety of questions,
and the full coverage collection required for this analysis. The two international
methodologies reviewed analyse knowledge stocks across a range of variables, as
well as at a particularly detailed geographical level. The Population Census is the
only New Zealand dataset able to generate multiple and disaggregated variables
(be it detailed industry codes or detailed geographic breakdowns).
10 ‘Understanding the Knowledge Economy - From Theory to Practice’, National RDA Research Conference paper, March 2004
11‘ Ideopolis: Knowledge City – Regions’. The Work Foundation, March 2006.
1.3 Canterbury focus
Discussions commenced on the development of Knowledge Economy calculations
in 2006. At around the same time, the Department was approached by
Canterbury Development Corporation (CDC) who had some involvement with work conducted by The Work Foundation. In late 2006 DoL staff met with
representatives of the CDC who expressed their interest in participating in this
project. Due to this interest, results for Canterbury region and Christchurch City
have been particularly ‘highlighted’ in the detailed analysis of Appendix One.
2. PRELIMINARY FINDINGS
Following the review of the two methodologies, the next step was to apply these
methodologies in a New Zealand context. By applying these methodologies, an
initial view of knowledge stocks within New Zealand could be developed.
Part of the value of measuring knowledge stocks is to identify how levels vary
across different disaggregations, especially on a sub national basis. By showing
how knowledge intensity varied across the United Kingdom, both papers provide
interesting sub national content, able to be used by local level strategic decision makers.
Both methodologies were applied in this report using Regional Council
boundaries. This has been done solely for the benefit of scale. While Regional
Council data does show noticeable differences in knowledge intensity, the real
value of these analyses is at the TA level. In the process of reviewing and
applying the two methodologies, the calculations of the two chosen papers were
replicated at both a regional council and TA basis. Regional Council analysis is
contained within Appendix 1, along with a selection of comment on the larger
TA’s. Equivalent data based on a TA breakdown is available from the author upon
request.
At each extra level of industry disaggregation, a more complete story can be
read. The initial dataset made available to DoL was at the one digit industry and
occupation level. One digit industry data showed very few regional highly
knowledge intensive industries, with the majority of results showing low
knowledge intensity. As data at a 2 digit and 3 digit levels became available,
noticeable differences in regional industry composition became more apparent.
When disaggregated Industry or Occupation data is combined with disaggregated
geographical data (TA results) a much wider range of knowledge intensity is
shown.
While the methodologies of both Local Futures and The Work Foundations focus
on slightly different indicators to determine the level of knowledge intensity, the
results are quite similar.
When data is analysed at a Regional Council level, there are no areas which
qualify as being highly Knowledge Intensive under the most basic evaluations of
either methodology. Within New Zealand, each of the largest regions of New
Zealand have a combination of strongly urban and strongly rural areas. It is this
diversity that has meant that any knowledge intensity that does exist within a
region is dispersed due to the lack of knowledge intensity elsewhere. By breaking
the geographic data down further, to the TA level, consistent areas (fully urban or
fully rural are produced.
Page 9 of 34
The analysis of results contained both here and in Appendix 1, focuses on
identifying the location of high levels of knowledge intensity. Locations of high
levels of knowledge intensity help identify where programmes can be
implemented which depend on high knowledge stocks. Equally important,
although not addressed directly in this report, is the identification of lower levels
of knowledge. This information could be used to a) identify whether this lower
stock is a concern, and if it is to b) develop programmes to increase knowledge intensity.
At a TA level, results for Wellington City and Auckland City clearly stand out from
the remainder of the cities and districts of New Zealand as the most concentrated
stores of knowledge. Across each of the calculations of both the Local Futures and
The Work Foundation methodologies, Wellington and Auckland consistently show
the highest levels of Knowledge Intensity.
Throughout the analysis, Wellington and Auckland rated highest in the majority of
calculations.
1. They are the TAs with the largest proportion of high knowledge industries.
2. They have the largest growth in this proportion between 2001 and 2006.
3. The public sector employment of the two TA’s has the highest proportion of graduates.
4. The private sector employment of the two TA’s has some of the fastest increase between 2001 and 2006.
5. They are the only two TAs with a share of graduates greater than their share of the working age population (a high concentration of graduates).
6. They have the highest share of knowledge workers in both 2001 and 2006
7. They have the highest share of knowledge intensive business units in both 2001 and 2006.
8. They have the highest share of employment in knowledge intensive industries in both 2001 and 2006.
9. Auckland and Wellington regions have the highest shares of employment of knowledge intensive occupations in knowledge intensive industries.
The main difference between the results for Wellington and Auckland cities is the
difference of sector of employment. As shown by Table 6.1 in Appendix 1, 39.7%
of all degree holders in Wellington City worked in Public Sector employment,
while the equivalent figure for Auckland City was only 26.8%. The share of
Auckland City degree holders in public sector employment is particularly low, with
only Queenstown Lakes District being lower.
This result for Auckland City reflects the large volume of high knowledge
employment in the Auckland Private sector. Auckland City employment is
characterised by a combination of a smaller share of government industry and
higher share of private sector employment in industries like Finance and
Insurance, Property and Business Services and other ‘high knowledge’ private
sector employment.
Outside of Auckland and Wellington Public sector employment of tertiary
graduates is more prominent. Sixteen TA’s in 2006 had more than half of their
resident tertiary graduates employed in the Public sector. Of these sixteen TA’s,
the majority were smaller, rural and relatively isolated districts. Kawerau District
had the highest share of public sector employment of graduates – with 85.7% of
graduates employed by government agencies.
3. IMPLICATIONS OF RESULTS
The initial purpose of this investigation was to identify whether Knowledge
Economy calculations as conducted elsewhere were feasible with New Zealand
datasets. Of the two methodologies reviewed, all but one of the calculations
required has been produced from data currently available. These calculations
provide results that indicate the location and scale of the knowledge economy
within New Zealand. The only calculation not currently able to be replicated is the
analysis of knowledge intensity of employees by business size.
While the data is available to measure the New Zealand Knowledge Economy, the
vast majority of the data comes from the Population Census. Given the timing of
the conduction of the Census, this analysis will only be able to be updated every
five years. While development of new knowledge may leap from discovery to
discovery, the methodologies used here measure the dissemination of knowledge
across the wider labour force – something that does not change significantly on
an annual basis. Given the relatively slow rate of change, 5 yearly updates of
these calculations are likely to be satisfactory.
The overriding result from this paper is the focus of knowledge workers and
knowledge industries within Auckland and Wellington cities. As shown in the
Preliminary Findings section, Wellington and Auckland cities generally have the
strongest results across almost all of the calculations conducted.
The consistency of the results produced by this analysis shows that it is currently
only Wellington and Auckland Cities that could currently be considered to be
heading towards a ‘knowledge economy’ status. The importance of this finding is
that if an industry is looking to locate to a site where widespread knowledge intensity is available, it is Wellington and Auckland that provide the most
complete state available in New Zealand. On a partial basis several other TA’s
provide some of the knowledge environment, these TA’s include (in no particular
order) North Shore City, Christchurch City, Palmerston North City, Hamilton City
and Dunedin City.
The focus of graduate employment in public sector jobs outside of Auckland and
Wellington limits the potential for growth in knowledge stocks. For graduate
employment to continue or to expand within these districts, dependence upon
government agencies needs to decline. It cannot be expected that public sector
employment will continue to grow to provide more regional vacancies for
graduates. The focus of growth needs to come from private sector employment.
While the majority of New Zealand employment is in lower skilled industries, skill
levels are increasing over time (this pattern is shown using both of the
methodologies replicated). Consistently across the country and across industries,
skill levels were higher in 2006 than they were in 2001. This pattern of increased
skill levels is noted in each of the Annual In Depth Regional reports as well as the
inter temporal analysis of this report.
Page 11 of 34
It would appear that knowledge intensity in New Zealand is at a lower level than
in the United Kingdom. With the exception of Auckland and Wellington cities, New
Zealand based calculations produce lower results at both a region and TA level
than for equivalent areas in the United Kingdom based reports. This result is
especially significant as UK data is generally from 2001 while New Zealand data is
for 2006 – United Kingdom knowledge intensity is likely to be higher in 2006
data. The validity of a direct comparison of results between New Zealand and other countries will be considered as part of Phase Two of the Knowledge
Economy project.
Results for Canterbury are consistently stronger under The Work Foundation
methodology. This suggests that Canterbury has a slightly stronger focus on
Knowledge Industries compared with highly skilled workers within those
industries. Having said this, Canterbury and Christchurch in particular shows
relatively strong results in both methodologies.
4. FUTURE WORK
While the work done so far has focussed on replicating the initial findings of the
Local Futures and Work Foundation documents, both of these organisations have
now evolved their measurement methods much further.
The next stage of the project (to be defined in the Phase Two Project Plan) will be
for the investigation and potential replication of current Knowledge Economy
methodologies. While there will be a particular focus of Local Futures and The
Work Foundation, other sources of analysis will also be considered.
Phase Two will also include a review of the methodologies with a view to the
customising of measures for a New Zealand environment. The impact of changing
methods will be evaluated and ‘New Zealand’ solutions will be considered.
Given the insights available from the temporal analysis, Phase Two will also
include an extension of the time series. Statistics New Zealand will be contacted
to provide 3 digit 1996 and 1991 Population Census data based on an ANZSIC96
and NZSCO99 basis.
The vast majority of analysis has come from data based on the Usual residence of
the Population Census respondent, rather than on a Workplace basis. Data on a
‘Usual Residence’ basis is much cleaner (there is less non response error)
however data based on Workplace may be more meaningful. Phase Two will
consider the replication of this work on a Workplace basis rather than a Usual
Residence basis.
Wider stakeholder engagement will occur as part of the next stage of the Project.
In particular, the Ministry of Economic Development (MED) and New Zealand
Trade and Enterprise (NZTE) and internally the Employment and Skills team will
be approached to provide input into the design of any methodology developed in
the second phase of the project.
APPENDIX ONE – INTERNATIONAL METHODOLOGY
APPLICATION TO NEW ZEALAND.
This section outlines the replication of both Local Futures and The Work
Foundation methodologies.
The paper that used the Local Futures methodology proved straight forward to
replicate with New Zealand data, with the exception of the Occupational
Employment Forecasts. This forecast however was not a core part of the Knowledge Economy section of the analysis. At the time of writing this document,
there is no accepted source of Occupational Forecasts in New Zealand.
While the Local Futures paper was based on data for a single time period, data
available in New Zealand allowed the analysis to be expanded to compare results
for both 2001 and 2006. Some of the most interesting findings of this report
come from this inter temporal comparison. Given this finding it is likely that more
Census time periods will be added to this analysis in Phase Two of this project.
As well as adding inter temporal analysis, The Local Futures paper was extended
by the replication of the Local Futures tool, the ‘Regional Economic Architecture’
or REA. The REA produces a table which presents both supply and demand
elements of Knowledge within a local area. The structure of the REA, along with
colour coding of results allows readers a quick view of the knowledge intensity of
the area chosen, a useful summary tool. A detailed explanation of the REA is
available later in this report.
The Work Foundation paper was also relatively straight forward to replicate. While
the vast majority of tables were taken from 3 digit industry and occupation
Population Census datasets, one of the variables ‘the proportion of businesses in
knowledge intensive industries’ was calculated from the Business Demography
dataset. Fortunately, the Business Demography dataset was also available at the
TA and 3 digit ANZSIC96 industry breakdown. The availability of the data meant
that each of the tables within The Work Foundation report were able to be
replicated within New Zealand at a TA level. The outputs of this report are
primarily at the Regional Council level, with reference to results for some of the larger TA’s included in commentary. The tabulated results for these larger TA’s is
included at the end of Appendix One. Results for all TA’s are available on request.
Local Futures Approach
The Local Futures paper ‘Understanding the Knowledge Economy’ is a conference
paper submitted in 2004 which takes Local Futures methodology and focuses on
results for the East Midlands, and compares to other regions within Great Britain.
Following the methodology used in the Paper, Industry data based on the 3 digit
ANZSIC96 classification for both 2001 and 2006 were produced. An example of
the methodology used in the production of this table is as follows:
Three digit ANZSIC industry data was gathered for each region. Within this
information, the share of employment of people with Bachelor degrees or higher
within the total industry employment was calculated. Using the assignment of
Table 1 earlier in this report, each industry within each region was assigned a
Knowledge Intensity rating. The proportion of that particular Knowledge Intensity
rating within all of the industries in that region was calculated which gives the
Page 13 of 34
percentage in Table 3. For example, in Northland, in the 2006 Population Census,
63 of the 237 people who reported working in the Computer Services industry12
had a Bachelor Degree of higher. This means that the industry in Northland was
assigned a Knowledge Intensity of K2. In Northland in 2006, 9 of the 159
industries were K2, giving K2 industries 5.6% of regional employment.
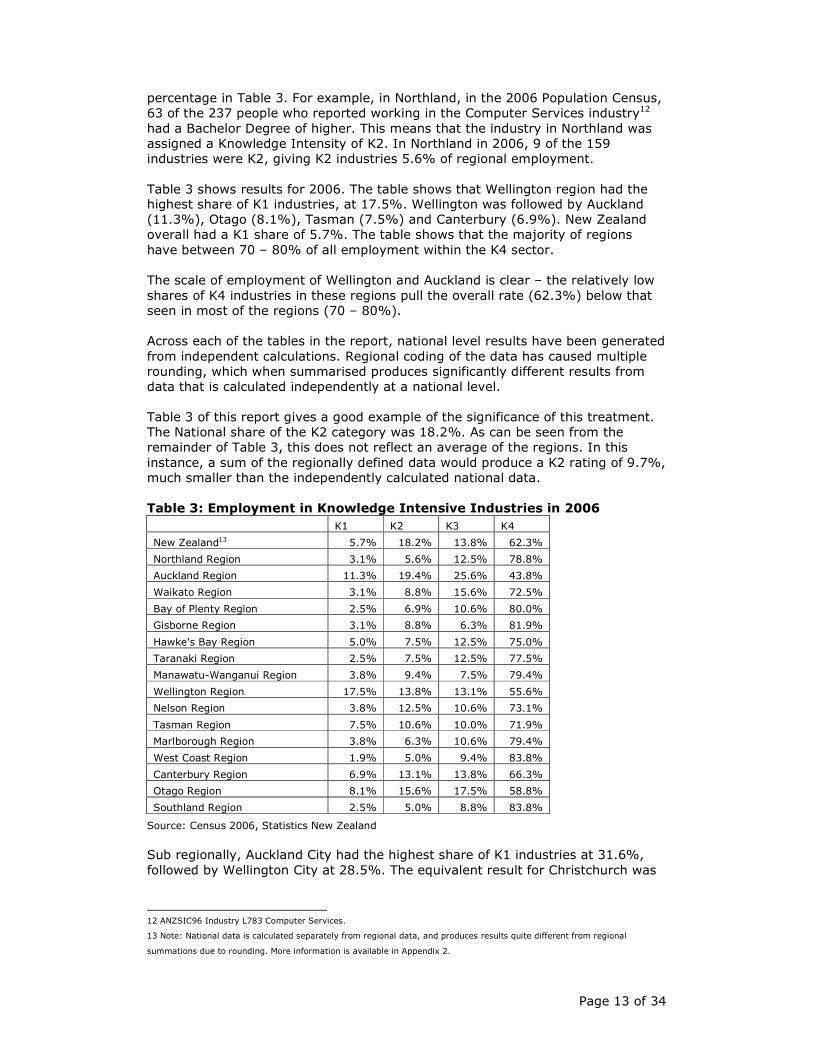
Table 3 shows results for 2006. The table shows that Wellington region had the highest share of K1 industries, at 17.5%. Wellington was followed by Auckland
(11.3%), Otago (8.1%), Tasman (7.5%) and Canterbury (6.9%). New Zealand
overall had a K1 share of 5.7%. The table shows that the majority of regions
have between 70 – 80% of all employment within the K4 sector.
The scale of employment of Wellington and Auckland is clear – the relatively low
shares of K4 industries in these regions pull the overall rate (62.3%) below that
seen in most of the regions (70 – 80%).
Across each of the tables in the report, national level results have been generated
from independent calculations. Regional coding of the data has caused multiple
rounding, which when summarised produces significantly different results from
data that is calculated independently at a national level.
Table 3 of this report gives a good example of the significance of this treatment.
The National share of the K2 category was 18.2%. As can be seen from the
remainder of Table 3, this does not reflect an average of the regions. In this
instance, a sum of the regionally defined data would produce a K2 rating of 9.7%,
much smaller than the independently calculated national data.
Table 3: Employment in Knowledge Intensive Industries in 2006
K1 K2 K3 K4
New Zealand13 5.7% 18.2% 13.8% 62.3%
Northland Region 3.1% 5.6% 12.5% 78.8%
Auckland Region 11.3% 19.4% 25.6% 43.8%
Waikato Region 3.1% 8.8% 15.6% 72.5%
Bay of Plenty Region 2.5% 6.9% 10.6% 80.0%
Gisborne Region 3.1% 8.8% 6.3% 81.9%
Hawke's Bay Region 5.0% 7.5% 12.5% 75.0%
Taranaki Region 2.5% 7.5% 12.5% 77.5%
Manawatu-Wanganui Region 3.8% 9.4% 7.5% 79.4%
Wellington Region 17.5% 13.8% 13.1% 55.6%
Nelson Region 3.8% 12.5% 10.6% 73.1%
Tasman Region 7.5% 10.6% 10.0% 71.9%
Marlborough Region 3.8% 6.3% 10.6% 79.4%
West Coast Region 1.9% 5.0% 9.4% 83.8%
Canterbury Region 6.9% 13.1% 13.8% 66.3%
Otago Region 8.1% 15.6% 17.5% 58.8%
Southland Region 2.5% 5.0% 8.8% 83.8%
Source: Census 2006, Statistics New Zealand
Sub regionally, Auckland City had the highest share of K1 industries at 31.6%,
followed by Wellington City at 28.5%. The equivalent result for Christchurch was
12 ANZSIC96 Industry L783 Computer Services.
13 Note: National data is calculated separately from regional data, and produces results quite different from regional
summations due to rounding. More information is available in Appendix 2.
8.9%. A table showing the full K1 – K4 results for six of the largest TA’s in 2006
is included later in Appendix 1.
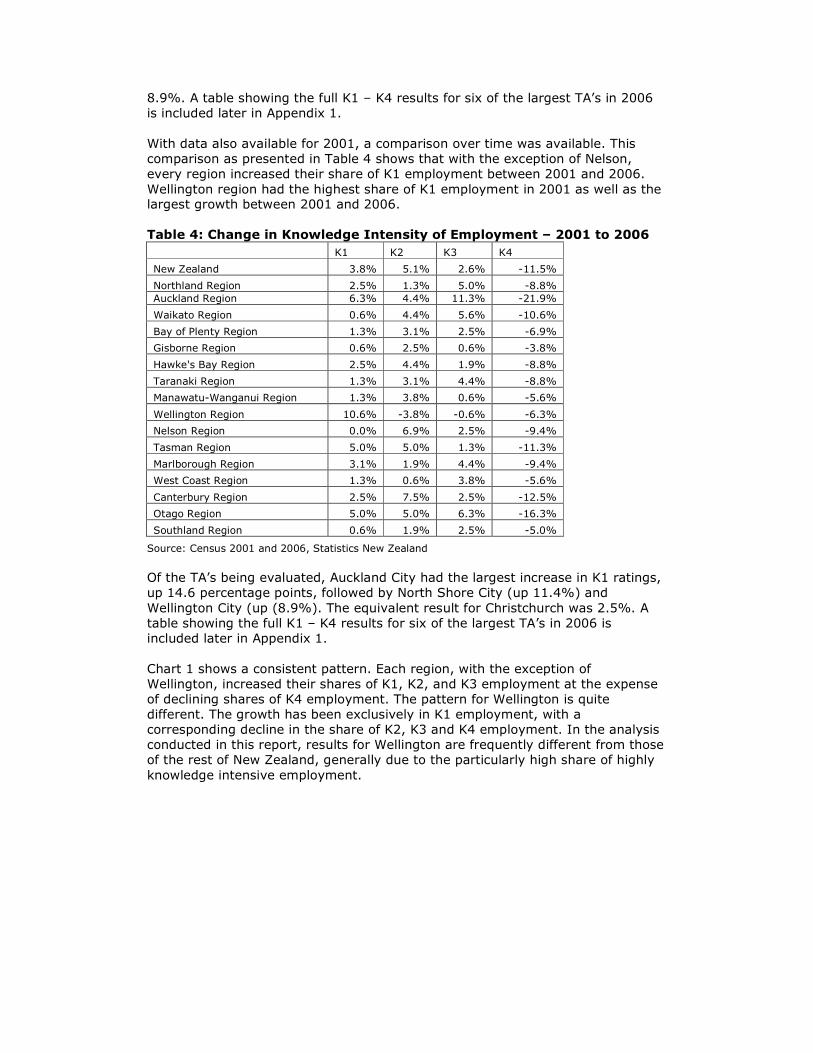
With data also available for 2001, a comparison over time was available. This
comparison as presented in Table 4 shows that with the exception of Nelson,
every region increased their share of K1 employment between 2001 and 2006.
Wellington region had the highest share of K1 employment in 2001 as well as the largest growth between 2001 and 2006.
Table 4: Change in Knowledge Intensity of Employment – 2001 to 2006
K1 K2 K3 K4
New Zealand 3.8% 5.1% 2.6% -11.5%
Northland Region 2.5% 1.3% 5.0% -8.8%
Auckland Region 6.3% 4.4% 11.3% -21.9%
Waikato Region 0.6% 4.4% 5.6% -10.6%
Bay of Plenty Region 1.3% 3.1% 2.5% -6.9%
Gisborne Region 0.6% 2.5% 0.6% -3.8%
Hawke's Bay Region 2.5% 4.4% 1.9% -8.8%
Taranaki Region 1.3% 3.1% 4.4% -8.8%
Manawatu-Wanganui Region 1.3% 3.8% 0.6% -5.6%
Wellington Region 10.6% -3.8% -0.6% -6.3%
Nelson Region 0.0% 6.9% 2.5% -9.4%
Tasman Region 5.0% 5.0% 1.3% -11.3%
Marlborough Region 3.1% 1.9% 4.4% -9.4%
West Coast Region 1.3% 0.6% 3.8% -5.6%
Canterbury Region 2.5% 7.5% 2.5% -12.5%
Otago Region 5.0% 5.0% 6.3% -16.3%
Southland Region 0.6% 1.9% 2.5% -5.0%
Source: Census 2001 and 2006, Statistics New Zealand
Of the TA’s being evaluated, Auckland City had the largest increase in K1 ratings,
up 14.6 percentage points, followed by North Shore City (up 11.4%) and
Wellington City (up (8.9%). The equivalent result for Christchurch was 2.5%. A
table showing the full K1 – K4 results for six of the largest TA’s in 2006 is
included later in Appendix 1.
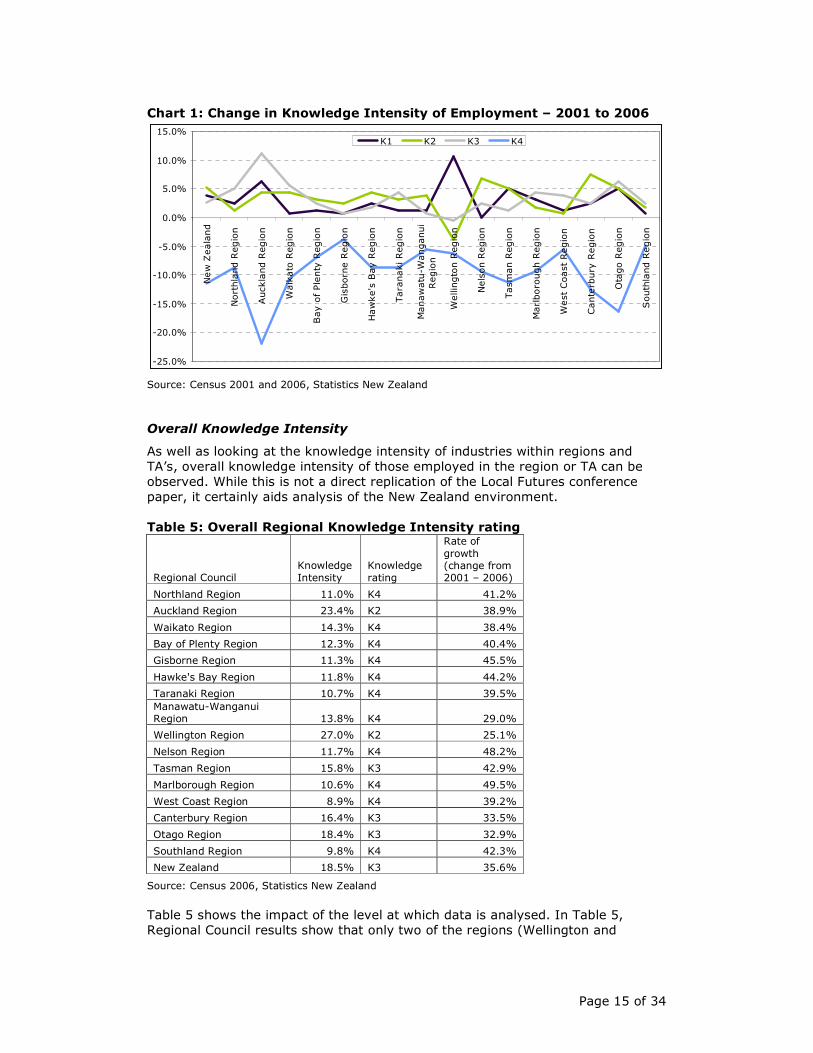
Chart 1 shows a consistent pattern. Each region, with the exception of
Wellington, increased their shares of K1, K2, and K3 employment at the expense
of declining shares of K4 employment. The pattern for Wellington is quite
different. The growth has been exclusively in K1 employment, with a
corresponding decline in the share of K2, K3 and K4 employment. In the analysis
conducted in this report, results for Wellington are frequently different from those
of the rest of New Zealand, generally due to the particularly high share of highly
knowledge intensive employment.
Page 15 of 34
Chart 1: Change in Knowledge Intensity of Employment – 2001 to 2006
-25.0%
-20.0%
-15.0%
-10.0%
-5.0%
0.0%
5.0%
10.0%
15.0%
New Zealand
Northland Region
Auckland Region
Waikato Region
Bay of Plenty Region
Gisborne Region
Hawke's Bay Region
Taranaki Region
Manawatu-Wanganui
Region
Wellington Region
Nelson Region
Tasman Region
Marlborough Region
West Coast Region
Canterbury Region
Otago Region
Southland Region
K1 K2 K3 K4
Source: Census 2001 and 2006, Statistics New Zealand
Overall Knowledge Intensity
As well as looking at the knowledge intensity of industries within regions and
TA’s, overall knowledge intensity of those employed in the region or TA can be
observed. While this is not a direct replication of the Local Futures conference
paper, it certainly aids analysis of the New Zealand environment.
Table 5: Overall Regional Knowledge Intensity rating
Regional Council Knowledge
Intensity
Knowledge
rating
Rate of
growth (change from 2001 – 2006)
Northland Region 11.0% K4 41.2%
Auckland Region 23.4% K2 38.9%
Waikato Region 14.3% K4 38.4%
Bay of Plenty Region 12.3% K4 40.4%
Gisborne Region 11.3% K4 45.5%
Hawke's Bay Region 11.8% K4 44.2%
Taranaki Region 10.7% K4 39.5%
Manawatu-Wanganui Region 13.8% K4 29.0%
Wellington Region 27.0% K2 25.1%
Nelson Region 11.7% K4 48.2%
Tasman Region 15.8% K3 42.9%
Marlborough Region 10.6% K4 49.5%
West Coast Region 8.9% K4 39.2%
Canterbury Region 16.4% K3 33.5%
Otago Region 18.4% K3 32.9%
Southland Region 9.8% K4 42.3%
New Zealand 18.5% K3 35.6%
Source: Census 2006, Statistics New Zealand
Table 5 shows the impact of the level at which data is analysed. In Table 5,
Regional Council results show that only two of the regions (Wellington and
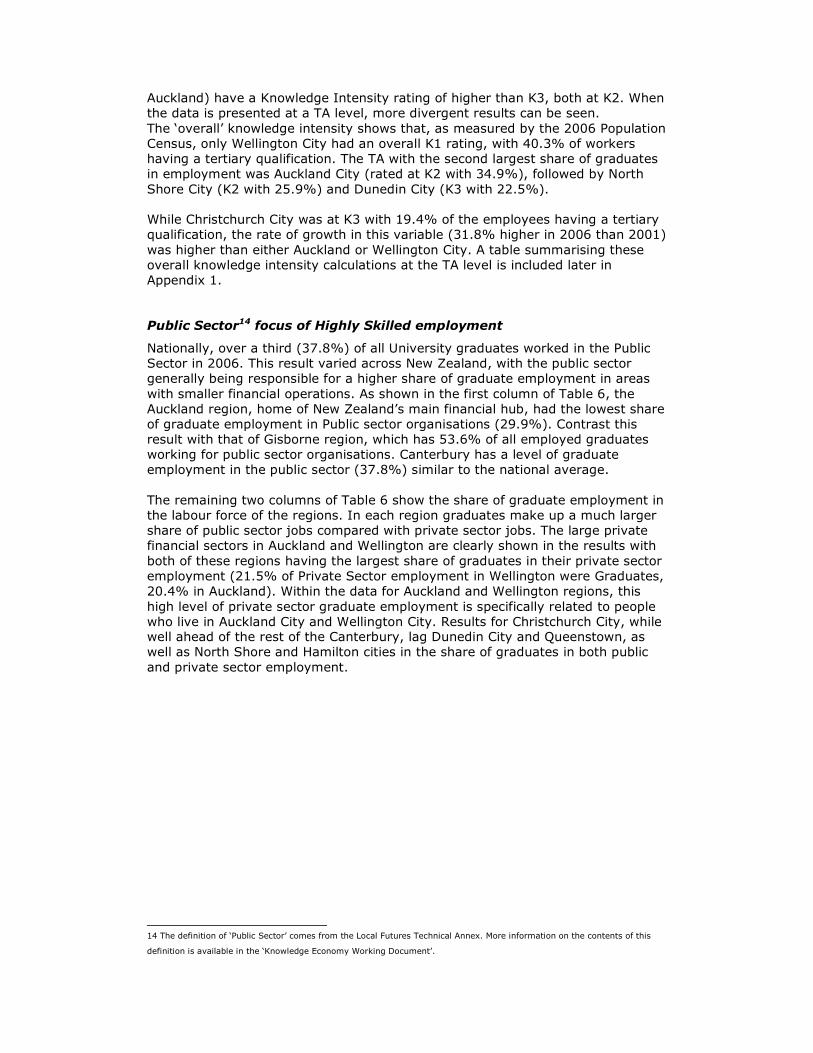
Auckland) have a Knowledge Intensity rating of higher than K3, both at K2. When
the data is presented at a TA level, more divergent results can be seen.
The ‘overall’ knowledge intensity shows that, as measured by the 2006 Population
Census, only Wellington City had an overall K1 rating, with 40.3% of workers
having a tertiary qualification. The TA with the second largest share of graduates
in employment was Auckland City (rated at K2 with 34.9%), followed by North
Shore City (K2 with 25.9%) and Dunedin City (K3 with 22.5%).
While Christchurch City was at K3 with 19.4% of the employees having a tertiary
qualification, the rate of growth in this variable (31.8% higher in 2006 than 2001)
was higher than either Auckland or Wellington City. A table summarising these
overall knowledge intensity calculations at the TA level is included later in
Appendix 1.
Public Sector14 focus of Highly Skilled employment
Nationally, over a third (37.8%) of all University graduates worked in the Public
Sector in 2006. This result varied across New Zealand, with the public sector
generally being responsible for a higher share of graduate employment in areas
with smaller financial operations. As shown in the first column of Table 6, the
Auckland region, home of New Zealand’s main financial hub, had the lowest share
of graduate employment in Public sector organisations (29.9%). Contrast this
result with that of Gisborne region, which has 53.6% of all employed graduates
working for public sector organisations. Canterbury has a level of graduate
employment in the public sector (37.8%) similar to the national average.
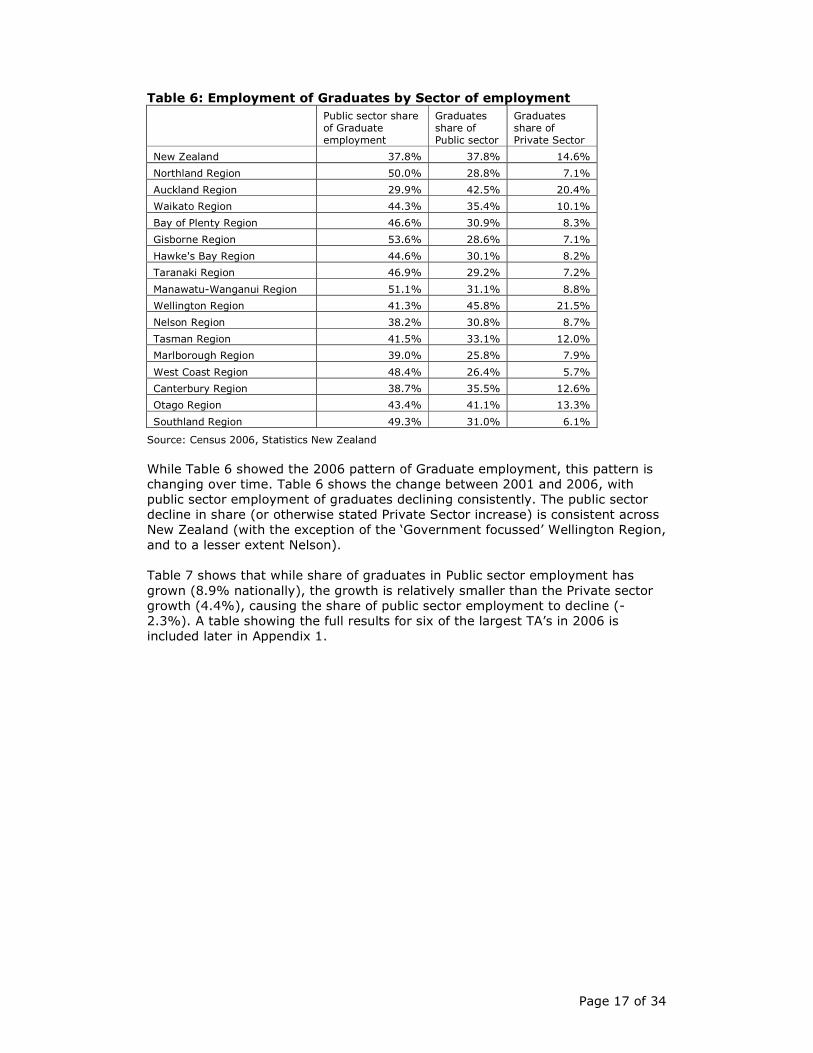
The remaining two columns of Table 6 show the share of graduate employment in
the labour force of the regions. In each region graduates make up a much larger
share of public sector jobs compared with private sector jobs. The large private
financial sectors in Auckland and Wellington are clearly shown in the results with
both of these regions having the largest share of graduates in their private sector
employment (21.5% of Private Sector employment in Wellington were Graduates,
20.4% in Auckland). Within the data for Auckland and Wellington regions, this
high level of private sector graduate employment is specifically related to people
who live in Auckland City and Wellington City. Results for Christchurch City, while well ahead of the rest of the Canterbury, lag Dunedin City and Queenstown, as
well as North Shore and Hamilton cities in the share of graduates in both public
and private sector employment.
14 The definition of ‘Public Sector’ comes from the Local Futures Technical Annex. More information on the contents of this
definition is available in the ‘Knowledge Economy Working Document’.
Page 17 of 34
Table 6: Employment of Graduates by Sector of employment
Public sector share of Graduate employment
Graduates share of Public sector
Graduates share of Private Sector
New Zealand 37.8% 37.8% 14.6%
Northland Region 50.0% 28.8% 7.1%
Auckland Region 29.9% 42.5% 20.4%
Waikato Region 44.3% 35.4% 10.1%
Bay of Plenty Region 46.6% 30.9% 8.3%
Gisborne Region 53.6% 28.6% 7.1%
Hawke's Bay Region 44.6% 30.1% 8.2%
Taranaki Region 46.9% 29.2% 7.2%
Manawatu-Wanganui Region 51.1% 31.1% 8.8%
Wellington Region 41.3% 45.8% 21.5%
Nelson Region 38.2% 30.8% 8.7%
Tasman Region 41.5% 33.1% 12.0%
Marlborough Region 39.0% 25.8% 7.9%
West Coast Region 48.4% 26.4% 5.7%
Canterbury Region 38.7% 35.5% 12.6%
Otago Region 43.4% 41.1% 13.3%
Southland Region 49.3% 31.0% 6.1%
Source: Census 2006, Statistics New Zealand
While Table 6 showed the 2006 pattern of Graduate employment, this pattern is
changing over time. Table 6 shows the change between 2001 and 2006, with
public sector employment of graduates declining consistently. The public sector
decline in share (or otherwise stated Private Sector increase) is consistent across
New Zealand (with the exception of the ‘Government focussed’ Wellington Region,
and to a lesser extent Nelson).
Table 7 shows that while share of graduates in Public sector employment has
grown (8.9% nationally), the growth is relatively smaller than the Private sector
growth (4.4%), causing the share of public sector employment to decline (-
2.3%). A table showing the full results for six of the largest TA’s in 2006 is
included later in Appendix 1.
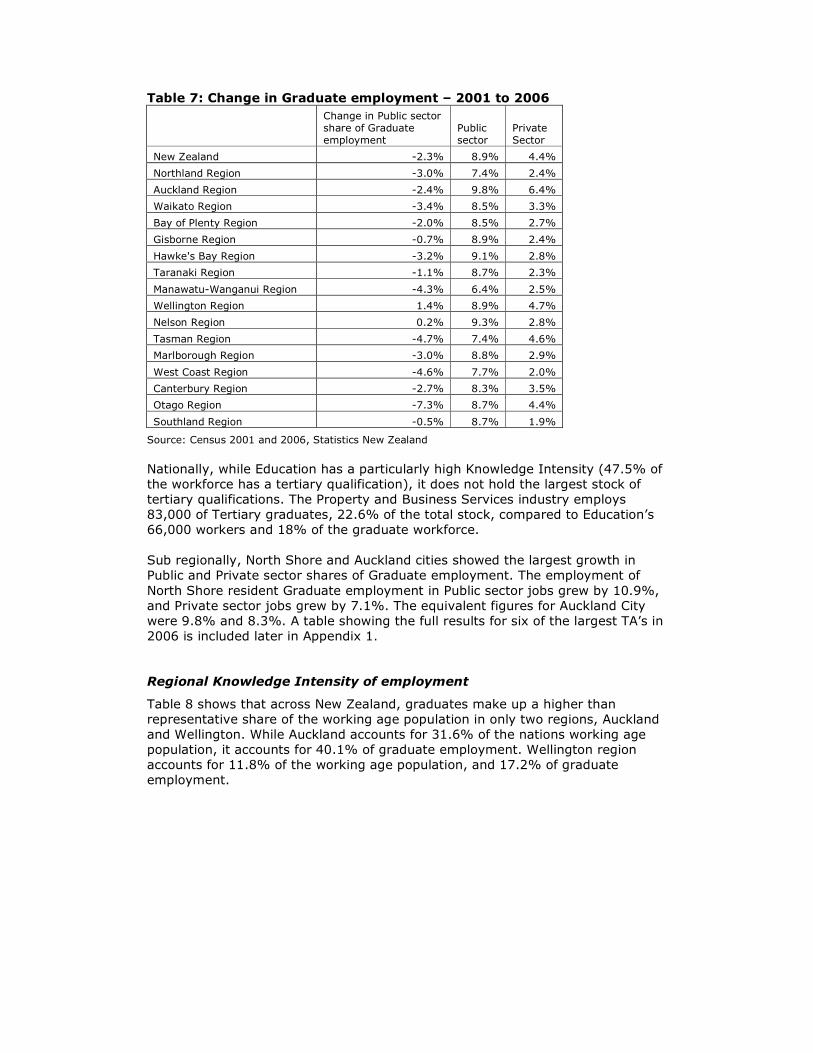
Table 7: Change in Graduate employment – 2001 to 2006
Change in Public sector share of Graduate employment
Public sector
Private Sector
New Zealand -2.3% 8.9% 4.4%
Northland Region -3.0% 7.4% 2.4%
Auckland Region -2.4% 9.8% 6.4%
Waikato Region -3.4% 8.5% 3.3%
Bay of Plenty Region -2.0% 8.5% 2.7%
Gisborne Region -0.7% 8.9% 2.4%
Hawke's Bay Region -3.2% 9.1% 2.8%
Taranaki Region -1.1% 8.7% 2.3%
Manawatu-Wanganui Region -4.3% 6.4% 2.5%
Wellington Region 1.4% 8.9% 4.7%
Nelson Region 0.2% 9.3% 2.8%
Tasman Region -4.7% 7.4% 4.6%
Marlborough Region -3.0% 8.8% 2.9%
West Coast Region -4.6% 7.7% 2.0%
Canterbury Region -2.7% 8.3% 3.5%
Otago Region -7.3% 8.7% 4.4%
Southland Region -0.5% 8.7% 1.9%
Source: Census 2001 and 2006, Statistics New Zealand
Nationally, while Education has a particularly high Knowledge Intensity (47.5% of
the workforce has a tertiary qualification), it does not hold the largest stock of
tertiary qualifications. The Property and Business Services industry employs
83,000 of Tertiary graduates, 22.6% of the total stock, compared to Education’s
66,000 workers and 18% of the graduate workforce.
Sub regionally, North Shore and Auckland cities showed the largest growth in
Public and Private sector shares of Graduate employment. The employment of
North Shore resident Graduate employment in Public sector jobs grew by 10.9%,
and Private sector jobs grew by 7.1%. The equivalent figures for Auckland City
were 9.8% and 8.3%. A table showing the full results for six of the largest TA’s in
2006 is included later in Appendix 1.
Regional Knowledge Intensity of employment
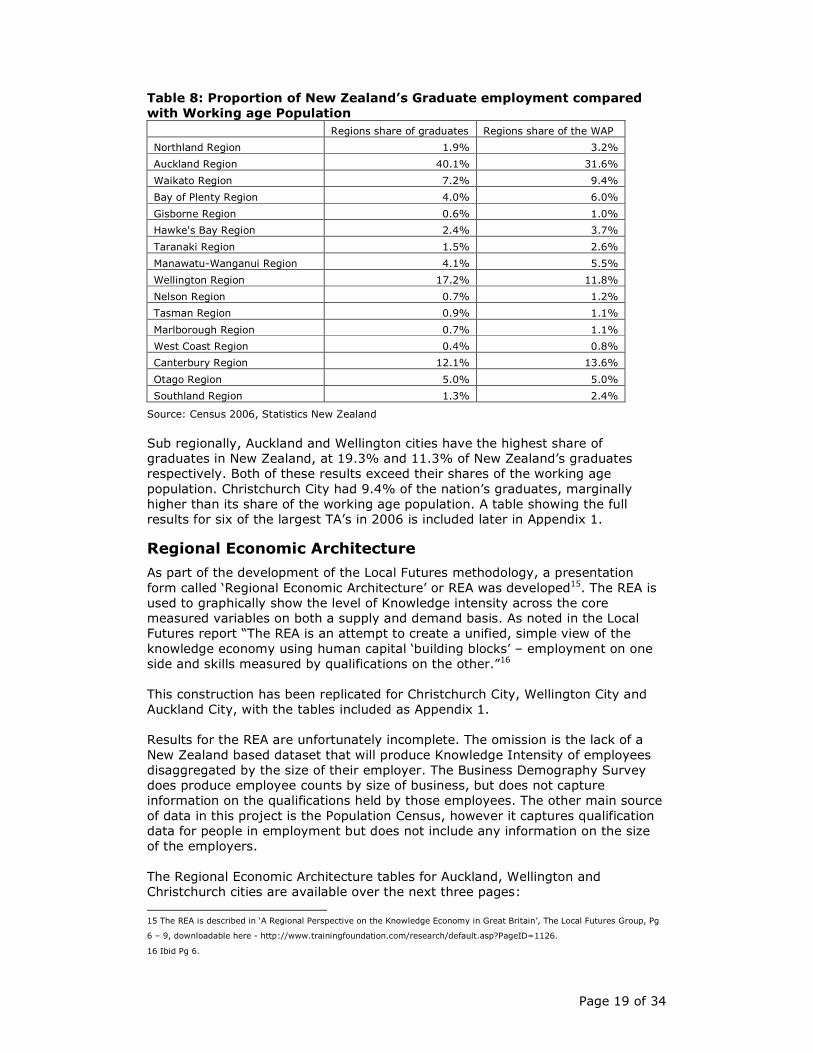
Table 8 shows that across New Zealand, graduates make up a higher than
representative share of the working age population in only two regions, Auckland
and Wellington. While Auckland accounts for 31.6% of the nations working age
population, it accounts for 40.1% of graduate employment. Wellington region
accounts for 11.8% of the working age population, and 17.2% of graduate
employment.
Page 19 of 34
Table 8: Proportion of New Zealand’s Graduate employment compared
with Working age Population
Regions share of graduates Regions share of the WAP
Northland Region 1.9% 3.2%
Auckland Region 40.1% 31.6%
Waikato Region 7.2% 9.4%
Bay of Plenty Region 4.0% 6.0%
Gisborne Region 0.6% 1.0%
Hawke's Bay Region 2.4% 3.7%
Taranaki Region 1.5% 2.6%
Manawatu-Wanganui Region 4.1% 5.5%
Wellington Region 17.2% 11.8%
Nelson Region 0.7% 1.2%
Tasman Region 0.9% 1.1%
Marlborough Region 0.7% 1.1%
West Coast Region 0.4% 0.8%
Canterbury Region 12.1% 13.6%
Otago Region 5.0% 5.0%
Southland Region 1.3% 2.4%
Source: Census 2006, Statistics New Zealand
Sub regionally, Auckland and Wellington cities have the highest share of
graduates in New Zealand, at 19.3% and 11.3% of New Zealand’s graduates
respectively. Both of these results exceed their shares of the working age
population. Christchurch City had 9.4% of the nation’s graduates, marginally
higher than its share of the working age population. A table showing the full
results for six of the largest TA’s in 2006 is included later in Appendix 1.
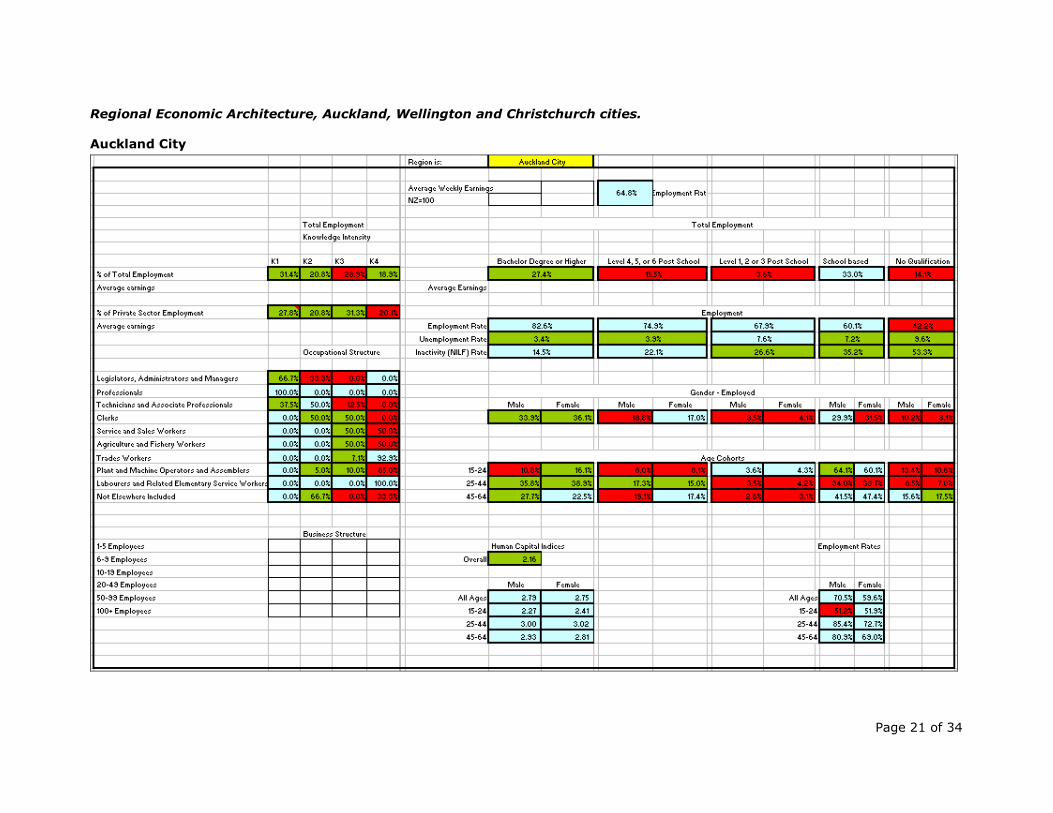
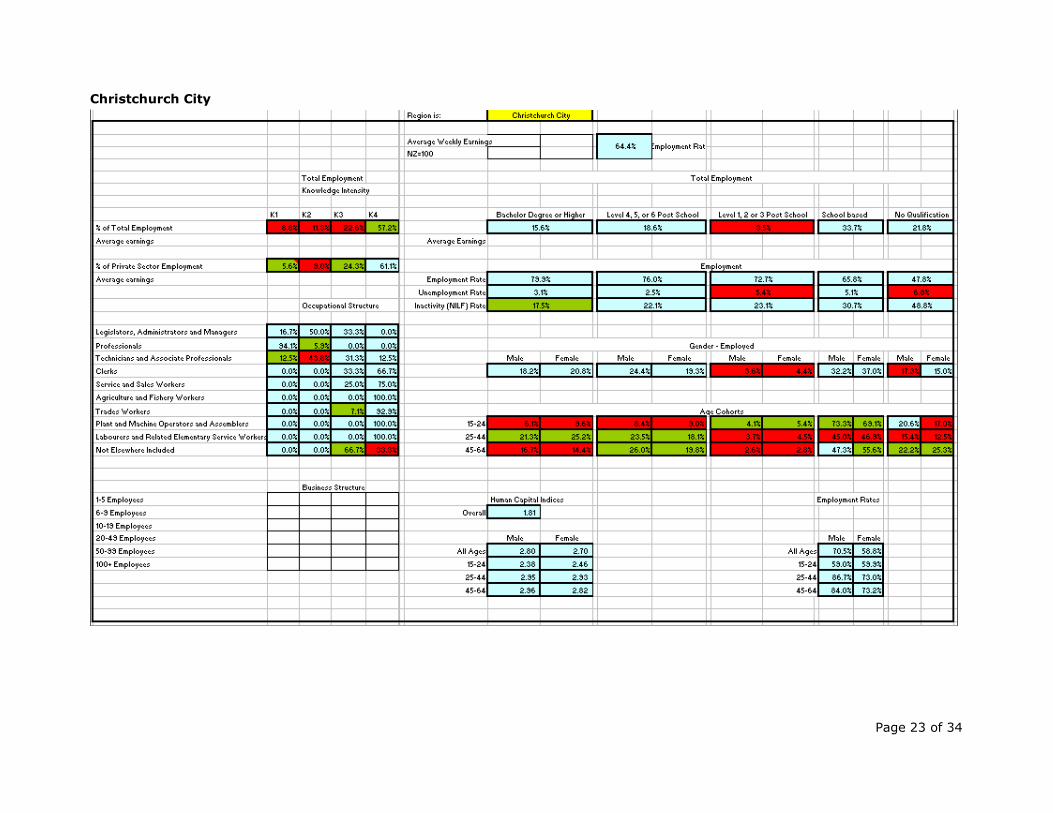
Regional Economic Architecture
As part of the development of the Local Futures methodology, a presentation
form called ‘Regional Economic Architecture’ or REA was developed15. The REA is
used to graphically show the level of Knowledge intensity across the core
measured variables on both a supply and demand basis. As noted in the Local
Futures report “The REA is an attempt to create a unified, simple view of the
knowledge economy using human capital ‘building blocks’ – employment on one
side and skills measured by qualifications on the other.”16
This construction has been replicated for Christchurch City, Wellington City and
Auckland City, with the tables included as Appendix 1.
Results for the REA are unfortunately incomplete. The omission is the lack of a
New Zealand based dataset that will produce Knowledge Intensity of employees
disaggregated by the size of their employer. The Business Demography Survey
does produce employee counts by size of business, but does not capture
information on the qualifications held by those employees. The other main source
of data in this project is the Population Census, however it captures qualification
data for people in employment but does not include any information on the size
of the employers.
The Regional Economic Architecture tables for Auckland, Wellington and
Christchurch cities are available over the next three pages:
15 The REA is described in ‘A Regional Perspective on the Knowledge Economy in Great Britain’, The Local Futures Group, Pg
6 – 9, downloadable here - http://www.trainingfoundation.com/research/default.asp?PageID=1126.
16 Ibid Pg 6.

Results for Auckland City
Results for Wellington City
Results for Christchurch City
Page 21 of 34
Regional Economic Architecture, Auckland, Wellington and Christchurch cities.
Auckland City
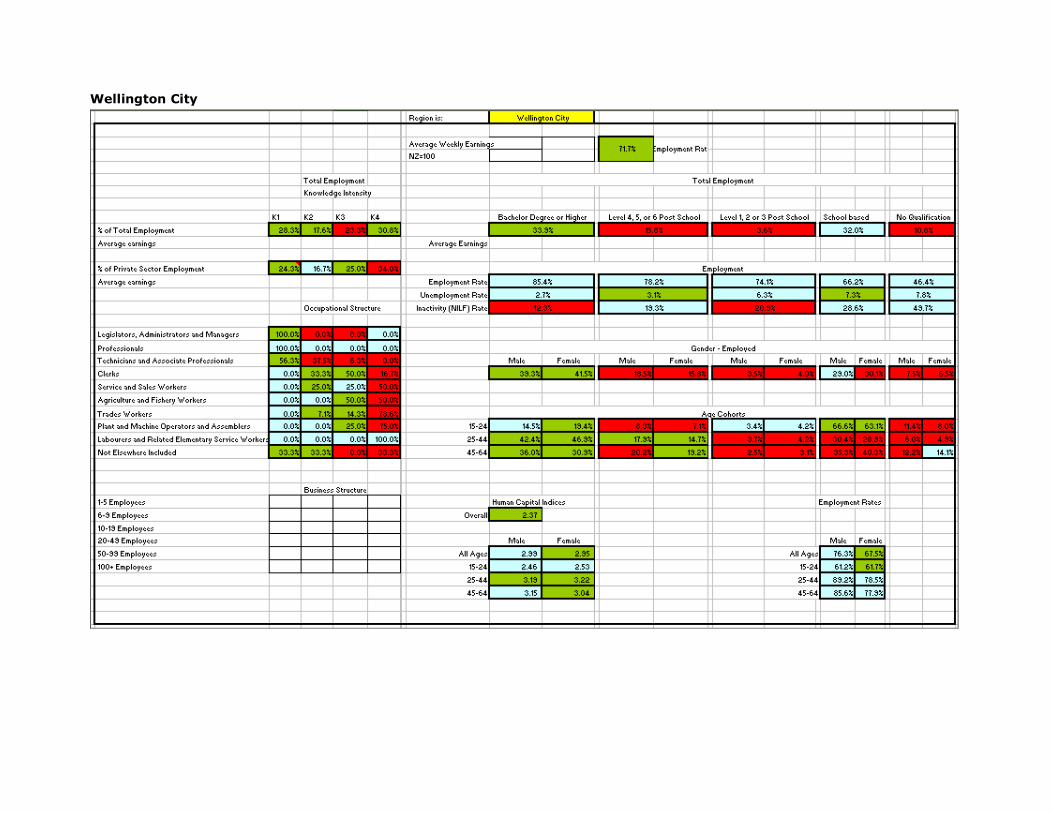
Wellington City
Page 23 of 34
Christchurch City
The Work Foundation Approach
The Work Foundation approach is, like Local Futures, motivated by the attempt to
actually provide a measurement for the concept of the ‘Knowledge Economy’.
While the Local Futures work is based on the measurement of Degree Level
qualifications across a range of other labour market results, The Work Foundation
has based much of their analysis on the measurement of the proportion of
workers in highly skilled occupations across a range of other labour market results.
The Work Foundation paper ‘Defining the Knowledge Economy’17 reviewed a
range of methods for measuring the ‘Knowledge Economy’ including the method
using the Local Futures approach of highly qualified workers. The paper notes
that in earlier work by The Work Foundation including the ‘Ideopolis papers’18,
Knowledge Workers were identified by the proportion of workers who were in the
first three one digit occupation groups (Legislators Administrators and Managers,
Professionals, and Technicians and Associate Professionals). The findings of this
recent paper from The Work Foundation suggests ongoing use of the ‘top three’
occupational groups and the predefined ‘knowledge intensive industries’ as the
basis for their future work.
To replicate calculations of The Work Foundation paper, Population Census data
for 2001 and 2006 was disaggregated by region and TA of residence to produce
estimates that measure Knowledge Intensity. As with the Local Futures work,
results of a particular paper were chosen for replication, in this case ‘Ideopolis:
Knowledge City-Regions’19. This paper presents the concept of Knowledge Cities,
whereby Knowledge Intensive Cities are the basis for economic growth for the
wider city – region. The paper outlines the concept of the Ideopolis and the
secondary Ideopolis, as well as defining a set of measurements to identify
progress towards becoming an Ideopolis. It is this set of measurements that will
be replicated for the regions and TAs of New Zealand. On Page 28 of the
‘Knowledge City-Regions report, The Work Foundation presents “Box D: How do
you measure knowledge intensity in an Ideopolis?”. The four measures are:
1) Proportion of the Labour Force working in Knowledge Intensive occupations across all Businesses
2) Proportion of total businesses that are in knowledge intensive sectors (industries)
3) Proportion of Labour force employed in knowledge intensive sectors 4) Proportion of labour force working in knowledge intensive occupations
in knowledge intensive industries.
The definitions used in New Zealand to replicate these measures are based on as
close as possible to the definitions used in the UK. In fact, for the fourth point
above where knowledge intensive occupations in knowledge intensive industries
were attempted, the data available to DoL was superior in its detail to that
presented by The Work Foundation.
17 ‘Defining the Knowledge Economy – Knowledge Economy Programme Report, Ian Brinkley, The Work Foundation, July
2006.
18 Ibid Pg 17
19 Ideopolis: Knowledge City – Regions. The Work Foundation, March 2006.
25
Replication of results:
In the Ideopolis paper, following the definition of the four measures, the
measures are applied to the largest cities within the United Kingdom20. The
following four tables recreate these calculations based on results for New
Zealand’s regions.
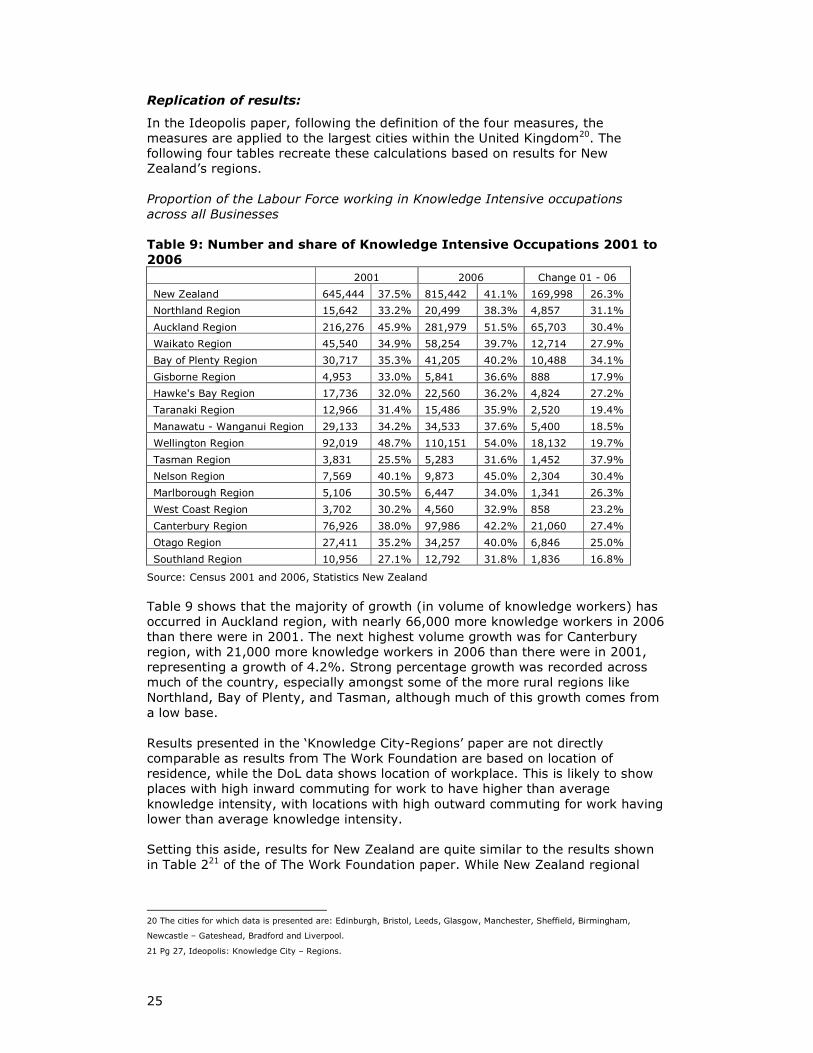
Proportion of the Labour Force working in Knowledge Intensive occupations
across all Businesses
Table 9: Number and share of Knowledge Intensive Occupations 2001 to
2006
2001 2006 Change 01 - 06
New Zealand 645,444 37.5% 815,442 41.1% 169,998 26.3%
Northland Region 15,642 33.2% 20,499 38.3% 4,857 31.1%
Auckland Region 216,276 45.9% 281,979 51.5% 65,703 30.4%
Waikato Region 45,540 34.9% 58,254 39.7% 12,714 27.9%
Bay of Plenty Region 30,717 35.3% 41,205 40.2% 10,488 34.1%
Gisborne Region 4,953 33.0% 5,841 36.6% 888 17.9%
Hawke's Bay Region 17,736 32.0% 22,560 36.2% 4,824 27.2%
Taranaki Region 12,966 31.4% 15,486 35.9% 2,520 19.4%
Manawatu - Wanganui Region 29,133 34.2% 34,533 37.6% 5,400 18.5%
Wellington Region 92,019 48.7% 110,151 54.0% 18,132 19.7%
Tasman Region 3,831 25.5% 5,283 31.6% 1,452 37.9%
Nelson Region 7,569 40.1% 9,873 45.0% 2,304 30.4%
Marlborough Region 5,106 30.5% 6,447 34.0% 1,341 26.3%
West Coast Region 3,702 30.2% 4,560 32.9% 858 23.2%
Canterbury Region 76,926 38.0% 97,986 42.2% 21,060 27.4%
Otago Region 27,411 35.2% 34,257 40.0% 6,846 25.0%
Southland Region 10,956 27.1% 12,792 31.8% 1,836 16.8%
Source: Census 2001 and 2006, Statistics New Zealand
Table 9 shows that the majority of growth (in volume of knowledge workers) has
occurred in Auckland region, with nearly 66,000 more knowledge workers in 2006
than there were in 2001. The next highest volume growth was for Canterbury
region, with 21,000 more knowledge workers in 2006 than there were in 2001,
representing a growth of 4.2%. Strong percentage growth was recorded across
much of the country, especially amongst some of the more rural regions like
Northland, Bay of Plenty, and Tasman, although much of this growth comes from
a low base.
Results presented in the ‘Knowledge City-Regions’ paper are not directly
comparable as results from The Work Foundation are based on location of
residence, while the DoL data shows location of workplace. This is likely to show
places with high inward commuting for work to have higher than average
knowledge intensity, with locations with high outward commuting for work having
lower than average knowledge intensity.
Setting this aside, results for New Zealand are quite similar to the results shown
in Table 221 of the of The Work Foundation paper. While New Zealand regional
20 The cities for which data is presented are: Edinburgh, Bristol, Leeds, Glasgow, Manchester, Sheffield, Birmingham,
Newcastle – Gateshead, Bradford and Liverpool.
21 Pg 27, Ideopolis: Knowledge City – Regions.
26
results are quite variable, any result of over 40% of employment compares well
the UK results which are generally between 35 – 40% share of employment.
Sub regionally, Wellington City had the highest share of Knowledge Workers in
their workforce, at 61.9%. This was followed by Auckland City at 57.5% and
North Shore City at 53.0%. In terms of growth, Auckland City had the largest
increase in number of Knowledge Workers, up 32,000 workers, while North Shore City grew by the largest proportion, up 38.2%. A table showing the full results for
six of the largest TA’s in 2006 is included later in Appendix 1.
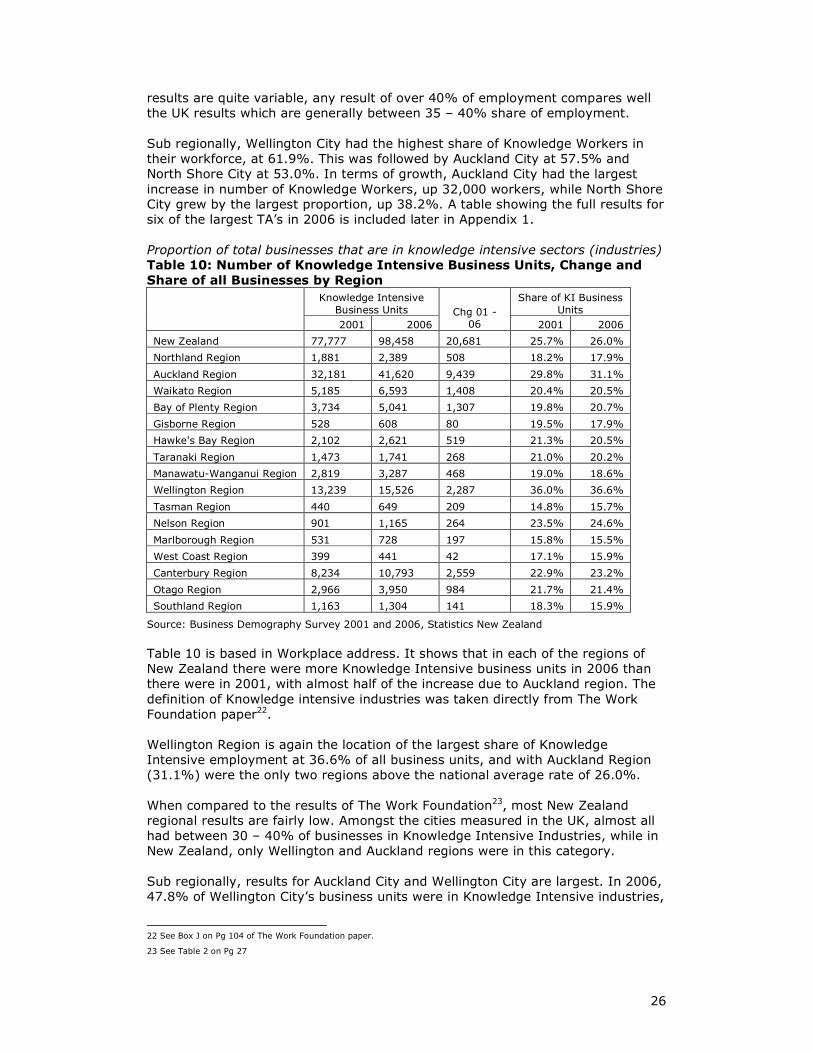
Proportion of total businesses that are in knowledge intensive sectors (industries)
Table 10: Number of Knowledge Intensive Business Units, Change and
Share of all Businesses by Region
Knowledge Intensive
Business Units
Share of KI Business
Units
2001 2006
Chg 01 - 06 2001 2006
New Zealand 77,777 98,458 20,681 25.7% 26.0%
Northland Region 1,881 2,389 508 18.2% 17.9%
Auckland Region 32,181 41,620 9,439 29.8% 31.1%
Waikato Region 5,185 6,593 1,408 20.4% 20.5%
Bay of Plenty Region 3,734 5,041 1,307 19.8% 20.7%
Gisborne Region 528 608 80 19.5% 17.9%
Hawke's Bay Region 2,102 2,621 519 21.3% 20.5%
Taranaki Region 1,473 1,741 268 21.0% 20.2%
Manawatu-Wanganui Region 2,819 3,287 468 19.0% 18.6%
Wellington Region 13,239 15,526 2,287 36.0% 36.6%
Tasman Region 440 649 209 14.8% 15.7%
Nelson Region 901 1,165 264 23.5% 24.6%
Marlborough Region 531 728 197 15.8% 15.5%
West Coast Region 399 441 42 17.1% 15.9%
Canterbury Region 8,234 10,793 2,559 22.9% 23.2%
Otago Region 2,966 3,950 984 21.7% 21.4%
Southland Region 1,163 1,304 141 18.3% 15.9%
Source: Business Demography Survey 2001 and 2006, Statistics New Zealand
Table 10 is based in Workplace address. It shows that in each of the regions of
New Zealand there were more Knowledge Intensive business units in 2006 than
there were in 2001, with almost half of the increase due to Auckland region. The
definition of Knowledge intensive industries was taken directly from The Work
Foundation paper22.
Wellington Region is again the location of the largest share of Knowledge
Intensive employment at 36.6% of all business units, and with Auckland Region
(31.1%) were the only two regions above the national average rate of 26.0%.
When compared to the results of The Work Foundation23, most New Zealand
regional results are fairly low. Amongst the cities measured in the UK, almost all
had between 30 – 40% of businesses in Knowledge Intensive Industries, while in
New Zealand, only Wellington and Auckland regions were in this category.
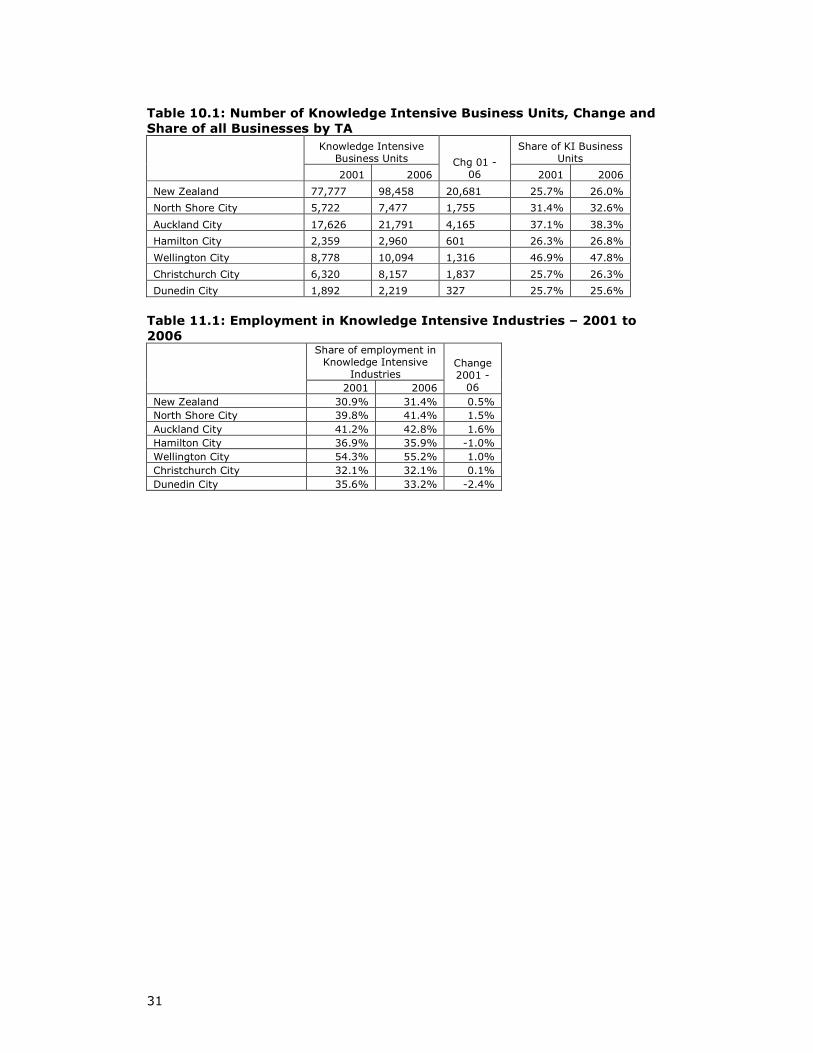
Sub regionally, results for Auckland City and Wellington City are largest. In 2006,
47.8% of Wellington City’s business units were in Knowledge Intensive industries,
22 See Box J on Pg 104 of The Work Foundation paper.
23 See Table 2 on Pg 27
27
while Auckland City had the largest increase in the number of Knowledge
Intensive Business Units, up over 4,100 units between 2001 and 2006.
Christchurch City had the second largest growth in Knowledge Intensive Business
Units, up over 1,800, and had 26.3% of all business units defined as Knowledge
Intensive, marginally above the national average of 26.0%. A table showing the
full results for six of the largest TA’s in 2006 is included later in Appendix 1.
The data used to produce the New Zealand results in Table 10 come from the
Business Demography Survey. This survey excludes industries in the Agriculture
sub division. Given that none of the Knowledge Intensive Industries come from
the Agriculture Industry, the shares produced will be overestimates of the New
Zealand results (the numerator in the share is unaffected, while the denominator
is under counted). This overestimation is not likely to be large in either Auckland
or Wellington given the relatively low levels of these industries in the regions.
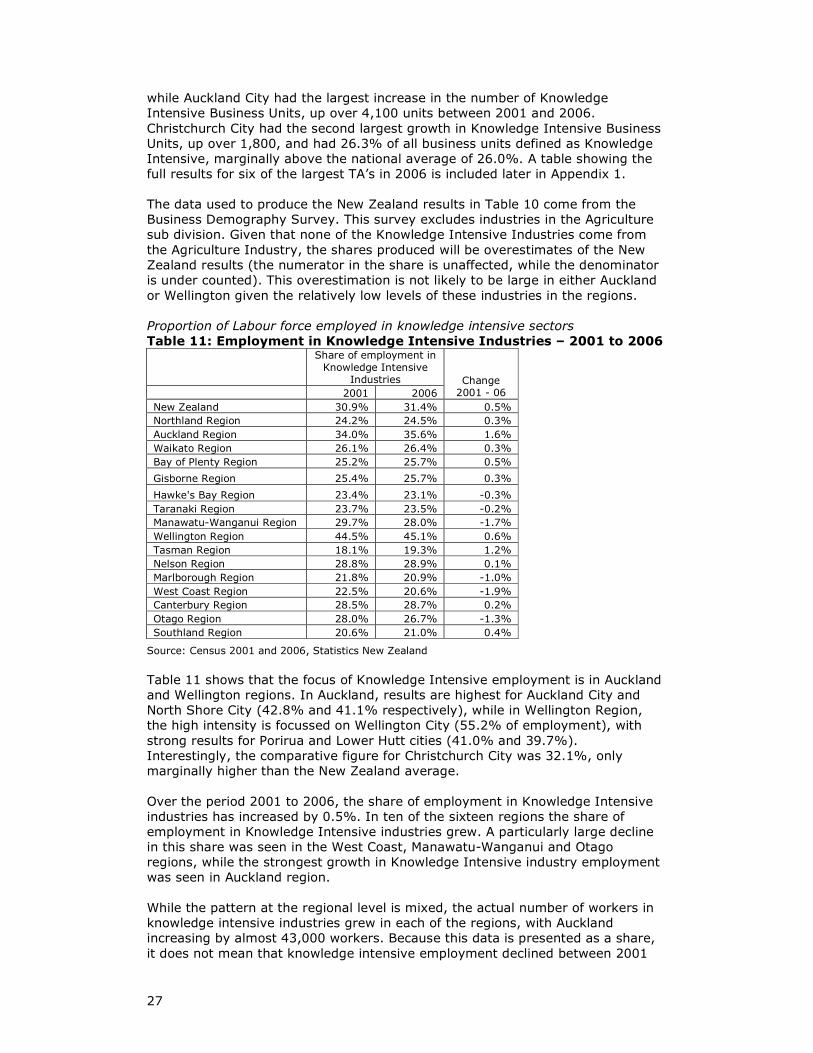
Proportion of Labour force employed in knowledge intensive sectors
Table 11: Employment in Knowledge Intensive Industries – 2001 to 2006
Share of employment in
Knowledge Intensive Industries
2001 2006
Change 2001 - 06
New Zealand 30.9% 31.4% 0.5%
Northland Region 24.2% 24.5% 0.3%
Auckland Region 34.0% 35.6% 1.6%
Waikato Region 26.1% 26.4% 0.3%
Bay of Plenty Region 25.2% 25.7% 0.5%
Gisborne Region 25.4% 25.7% 0.3%
Hawke's Bay Region 23.4% 23.1% -0.3%
Taranaki Region 23.7% 23.5% -0.2%
Manawatu-Wanganui Region 29.7% 28.0% -1.7%
Wellington Region 44.5% 45.1% 0.6%
Tasman Region 18.1% 19.3% 1.2%
Nelson Region 28.8% 28.9% 0.1%
Marlborough Region 21.8% 20.9% -1.0%
West Coast Region 22.5% 20.6% -1.9%
Canterbury Region 28.5% 28.7% 0.2%
Otago Region 28.0% 26.7% -1.3%
Southland Region 20.6% 21.0% 0.4%
Source: Census 2001 and 2006, Statistics New Zealand
Table 11 shows that the focus of Knowledge Intensive employment is in Auckland
and Wellington regions. In Auckland, results are highest for Auckland City and
North Shore City (42.8% and 41.1% respectively), while in Wellington Region,
the high intensity is focussed on Wellington City (55.2% of employment), with
strong results for Porirua and Lower Hutt cities (41.0% and 39.7%).
Interestingly, the comparative figure for Christchurch City was 32.1%, only
marginally higher than the New Zealand average.
Over the period 2001 to 2006, the share of employment in Knowledge Intensive
industries has increased by 0.5%. In ten of the sixteen regions the share of
employment in Knowledge Intensive industries grew. A particularly large decline
in this share was seen in the West Coast, Manawatu-Wanganui and Otago
regions, while the strongest growth in Knowledge Intensive industry employment
was seen in Auckland region.
While the pattern at the regional level is mixed, the actual number of workers in
knowledge intensive industries grew in each of the regions, with Auckland
increasing by almost 43,000 workers. Because this data is presented as a share,
it does not mean that knowledge intensive employment declined between 2001
28
and 2006, only that it grew at a slower rate than non Knowledge Intensive
employment.
When compared to the results of The Work Foundation24, many of the New
Zealand regional results are quite low. The results for Wellington and Auckland
regions compare well to the UK findings, and the results cited earlier for the cities
within Auckland and Wellington compare particularly well (Wellington at 55.2% exceeds the results for Edinburgh and Manchester at 53%and 52% respectively.
It is particularly important to note that New Zealand figures are for 2006 while UK
figures are for 2001 and are therefore likely to be higher in 2006. A table showing
the full results for six of the largest TA’s in 2006 is included later in Appendix 1.
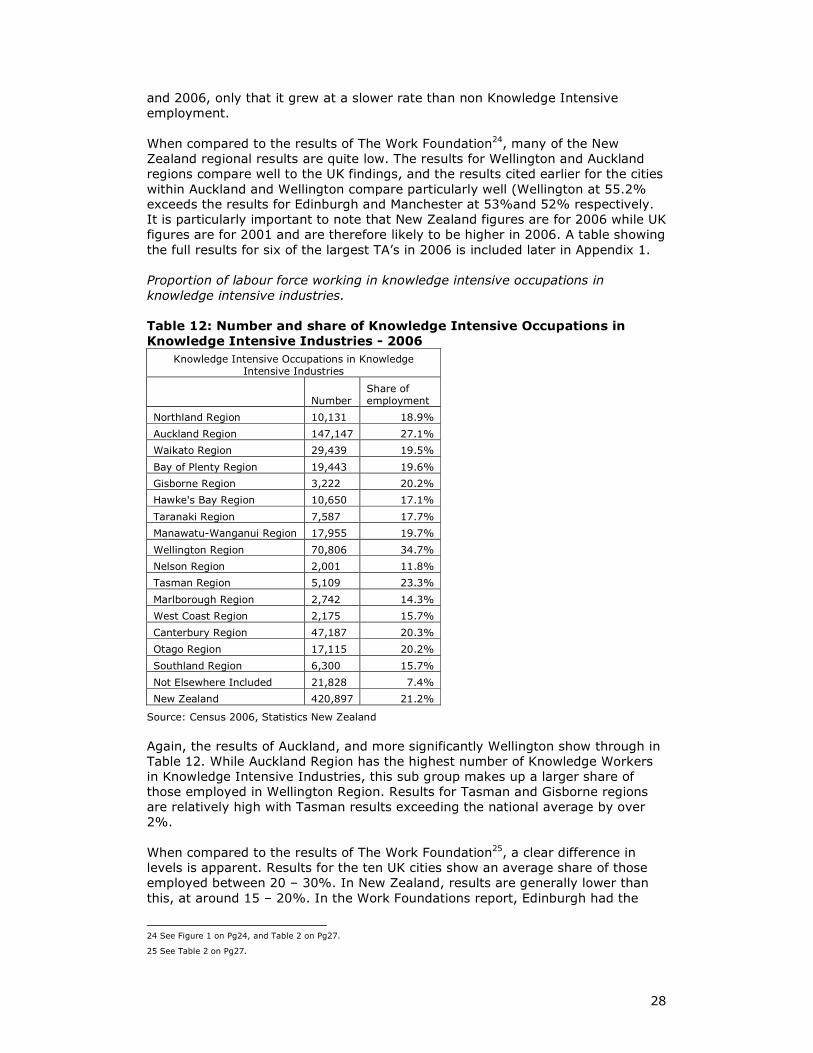
Proportion of labour force working in knowledge intensive occupations in
knowledge intensive industries.
Table 12: Number and share of Knowledge Intensive Occupations in
Knowledge Intensive Industries - 2006
Knowledge Intensive Occupations in Knowledge Intensive Industries
Number Share of employment
Northland Region 10,131 18.9%
Auckland Region 147,147 27.1%
Waikato Region 29,439 19.5%
Bay of Plenty Region 19,443 19.6%
Gisborne Region 3,222 20.2%
Hawke's Bay Region 10,650 17.1%
Taranaki Region 7,587 17.7%
Manawatu-Wanganui Region 17,955 19.7%
Wellington Region 70,806 34.7%
Nelson Region 2,001 11.8%
Tasman Region 5,109 23.3%
Marlborough Region 2,742 14.3%
West Coast Region 2,175 15.7%
Canterbury Region 47,187 20.3%
Otago Region 17,115 20.2%
Southland Region 6,300 15.7%
Not Elsewhere Included 21,828 7.4%
New Zealand 420,897 21.2%
Source: Census 2006, Statistics New Zealand
Again, the results of Auckland, and more significantly Wellington show through in
Table 12. While Auckland Region has the highest number of Knowledge Workers
in Knowledge Intensive Industries, this sub group makes up a larger share of
those employed in Wellington Region. Results for Tasman and Gisborne regions
are relatively high with Tasman results exceeding the national average by over
2%.
When compared to the results of The Work Foundation25, a clear difference in
levels is apparent. Results for the ten UK cities show an average share of those
employed between 20 – 30%. In New Zealand, results are generally lower than
this, at around 15 – 20%. In the Work Foundations report, Edinburgh had the
24 See Figure 1 on Pg24, and Table 2 on Pg27.
25 See Table 2 on Pg27.
29
highest level of Knowledge Workers in Knowledge intensive industries at 36%,
well in excess of the other surveyed cities. The results of Wellington, and to a
lesser extent Auckland, compare well to these UK results.
At the time of reporting, Territorial Authority level data is unavailable due to
difficulties being experienced by Statistics New Zealand. Should this data become
available, this analysis will be conducted in Phase Two of this project.
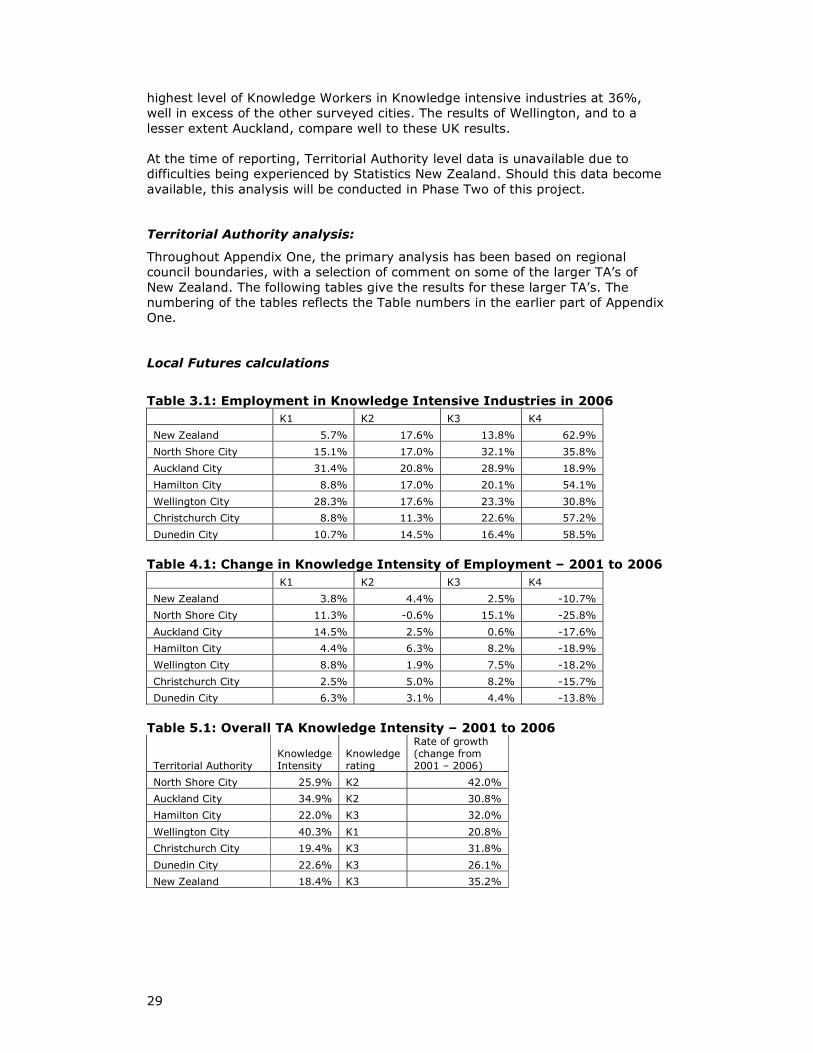
Territorial Authority analysis:
Throughout Appendix One, the primary analysis has been based on regional
council boundaries, with a selection of comment on some of the larger TA’s of
New Zealand. The following tables give the results for these larger TA’s. The
numbering of the tables reflects the Table numbers in the earlier part of Appendix
One.
Local Futures calculations
Table 3.1: Employment in Knowledge Intensive Industries in 2006
K1 K2 K3 K4
New Zealand 5.7% 17.6% 13.8% 62.9%
North Shore City 15.1% 17.0% 32.1% 35.8%
Auckland City 31.4% 20.8% 28.9% 18.9%
Hamilton City 8.8% 17.0% 20.1% 54.1%
Wellington City 28.3% 17.6% 23.3% 30.8%
Christchurch City 8.8% 11.3% 22.6% 57.2%
Dunedin City 10.7% 14.5% 16.4% 58.5%
Table 4.1: Change in Knowledge Intensity of Employment – 2001 to 2006
K1 K2 K3 K4
New Zealand 3.8% 4.4% 2.5% -10.7%
North Shore City 11.3% -0.6% 15.1% -25.8%
Auckland City 14.5% 2.5% 0.6% -17.6%
Hamilton City 4.4% 6.3% 8.2% -18.9%
Wellington City 8.8% 1.9% 7.5% -18.2%
Christchurch City 2.5% 5.0% 8.2% -15.7%
Dunedin City 6.3% 3.1% 4.4% -13.8%
Table 5.1: Overall TA Knowledge Intensity – 2001 to 2006
Territorial Authority Knowledge Intensity
Knowledge rating
Rate of growth (change from 2001 – 2006)
North Shore City 25.9% K2 42.0%
Auckland City 34.9% K2 30.8%
Hamilton City 22.0% K3 32.0%
Wellington City 40.3% K1 20.8%
Christchurch City 19.4% K3 31.8%
Dunedin City 22.6% K3 26.1%
New Zealand 18.4% K3 35.2%
30
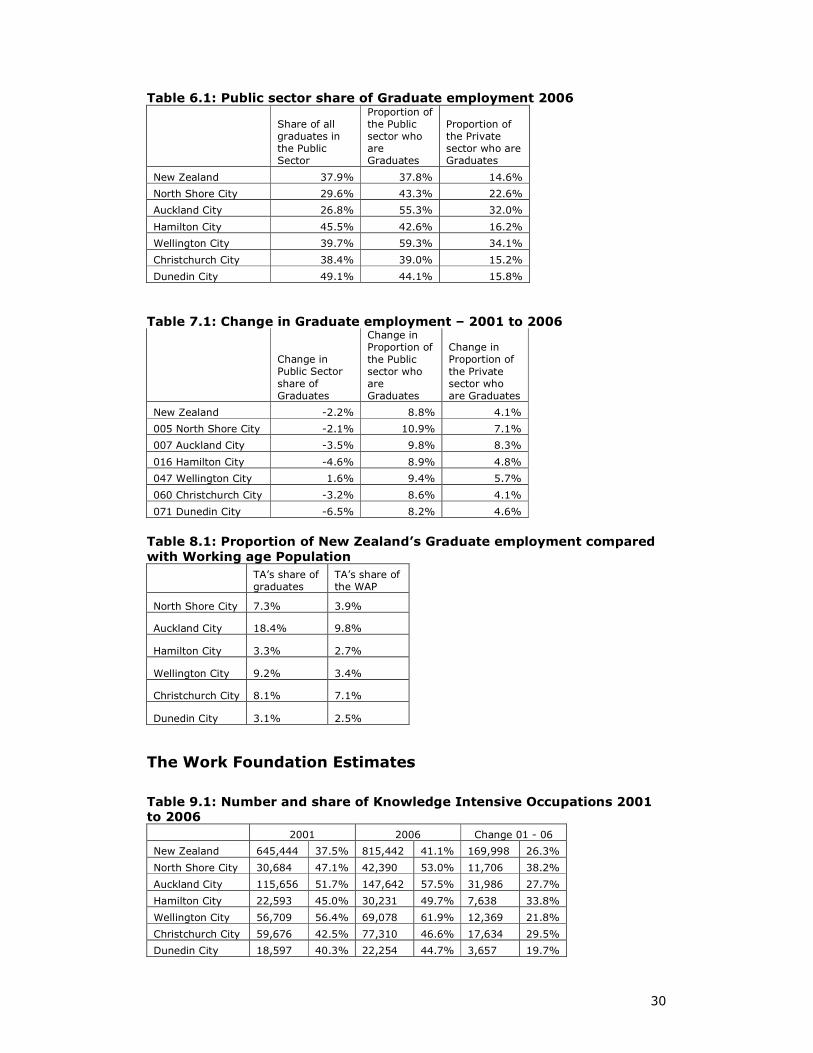
Table 6.1: Public sector share of Graduate employment 2006
Share of all graduates in the Public Sector
Proportion of the Public sector who are Graduates
Proportion of the Private sector who are Graduates
New Zealand 37.9% 37.8% 14.6%
North Shore City 29.6% 43.3% 22.6%
Auckland City 26.8% 55.3% 32.0%
Hamilton City 45.5% 42.6% 16.2%
Wellington City 39.7% 59.3% 34.1%
Christchurch City 38.4% 39.0% 15.2%
Dunedin City 49.1% 44.1% 15.8%
Table 7.1: Change in Graduate employment – 2001 to 2006
Change in Public Sector
share of Graduates
Change in Proportion of
the Public sector who are Graduates
Change in Proportion of
the Private sector who are Graduates
New Zealand -2.2% 8.8% 4.1%
005 North Shore City -2.1% 10.9% 7.1%
007 Auckland City -3.5% 9.8% 8.3%
016 Hamilton City -4.6% 8.9% 4.8%
047 Wellington City 1.6% 9.4% 5.7%
060 Christchurch City -3.2% 8.6% 4.1%
071 Dunedin City -6.5% 8.2% 4.6%
Table 8.1: Proportion of New Zealand’s Graduate employment compared
with Working age Population
TA’s share of graduates
TA’s share of the WAP
North Shore City 7.3% 3.9%
Auckland City 18.4% 9.8%
Hamilton City 3.3% 2.7%
Wellington City 9.2% 3.4%
Christchurch City 8.1% 7.1%
Dunedin City 3.1% 2.5%
The Work Foundation Estimates
Table 9.1: Number and share of Knowledge Intensive Occupations 2001 to 2006
2001 2006 Change 01 - 06
New Zealand 645,444 37.5% 815,442 41.1% 169,998 26.3%
North Shore City 30,684 47.1% 42,390 53.0% 11,706 38.2%
Auckland City 115,656 51.7% 147,642 57.5% 31,986 27.7%
Hamilton City 22,593 45.0% 30,231 49.7% 7,638 33.8%
Wellington City 56,709 56.4% 69,078 61.9% 12,369 21.8%
Christchurch City 59,676 42.5% 77,310 46.6% 17,634 29.5%
Dunedin City 18,597 40.3% 22,254 44.7% 3,657 19.7%
31
Table 10.1: Number of Knowledge Intensive Business Units, Change and
Share of all Businesses by TA
Knowledge Intensive Business Units
Share of KI Business Units
2001 2006
Chg 01 - 06 2001 2006
New Zealand 77,777 98,458 20,681 25.7% 26.0%
North Shore City 5,722 7,477 1,755 31.4% 32.6%
Auckland City 17,626 21,791 4,165 37.1% 38.3%
Hamilton City 2,359 2,960 601 26.3% 26.8%
Wellington City 8,778 10,094 1,316 46.9% 47.8%
Christchurch City 6,320 8,157 1,837 25.7% 26.3%
Dunedin City 1,892 2,219 327 25.7% 25.6%
Table 11.1: Employment in Knowledge Intensive Industries – 2001 to
2006 Share of employment in Knowledge Intensive
Industries
2001 2006
Change 2001 -
06
New Zealand 30.9% 31.4% 0.5%
North Shore City 39.8% 41.4% 1.5%
Auckland City 41.2% 42.8% 1.6%
Hamilton City 36.9% 35.9% -1.0%
Wellington City 54.3% 55.2% 1.0%
Christchurch City 32.1% 32.1% 0.1%
Dunedin City 35.6% 33.2% -2.4%
32
APPENDIX TWO – THE CANTERBURY KNOWLEDGE
ECONOMY.
The Knowledge Intensity of industries varies across the regions of New Zealand.
Comparing results for Canterbury against the national average shows some
interesting differences.
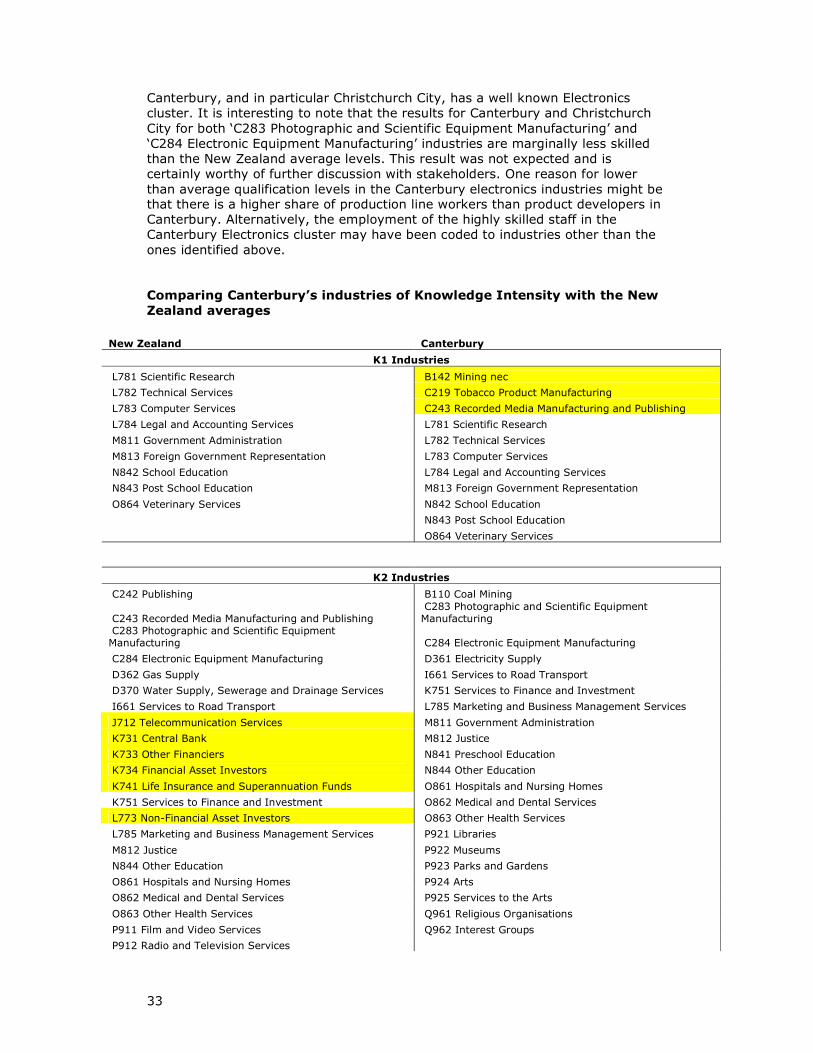
The industries with the highest levels of knowledge intensity (those with a K1
rating) are quite similar in Canterbury and New Zealand overall. The main
differences are that Canterbury does not have a significant Government Administration industry, and the Canterbury Mining, Tobacco Product and
Recorded Media industries having a higher than average skill level (although it
must be noted that the these industries are quite small in Canterbury, combining
to employee only 33 people).
The major differences in knowledge intensity between Canterbury and the
national average occur in the composition of the K2 and K3 industries26.
Nationally, the majority of Finance and Insurance sub industries (ANZSIC96
Division K) are coded with a K2 rating, while in Canterbury, most of these sub
industries have a K3 rating. Nationally, most of the Finance and Insurance sub
industries had a graduate employment rate of between 30 – 35%, while the
corresponding figure for Canterbury was a step lower at between 15 – 25%. A
table showing 3 digit ANZSIC96 industries by their knowledge intensity for both
New Zealand and Canterbury is included at the end of this section.
The difference in qualification levels may be due to the majority of regional
employment in the finance and insurance industries being in branch offices, with
the assumption being that the more highly skilled jobs in these industries being
located in the Head Offices, generally based in Auckland and Wellington.
This assumption is supported by the comparison of results between Canterbury
and Wellington regions. Canterbury has one of the eight Finance and Insurance
sub industries within the K1 and K2 categories (K751 Services to Finance and
Investment is rated K2), while Wellington has seven of the eight Finance and
Insurance sub industries within the K1 and K2 categories. This shows that
Wellington employment in these industries is generally more highly qualified. Results at the two digit level show the same basic pattern.
While the knowledge intensity of these sub industries for Canterbury trail the
national average, inter temporal analysis show recent improvement. Results from
the Annual In Depth Regional report (AIDR) for Canterbury27 show that
employment and Hours worked in ANZSIC Division K (Finance and Insurance)
grew faster than the New Zealand average between 2001 and 2006. Also, the
share of university graduates in the Canterbury workforce has increased markedly
in this industry between 2001 and 2006. On average, the share of graduates in
the eight Finance and Insurance sub industries has grown by around 5% each,
with 5 of the sub industries having a K4 rating in 2001, declining to only one K4
rating in 2006.
26 K2 Industries had between 25- 40% of their workforces as graduates, while K3 industries have between 15-25% of their
workforces as graduates
27 The Annual In Depth Regional report for Canterbury is available from the DoL website, here -
http://www.dol.govt.nz/publications/lmr/regional/indepth/canterbury/index.asp.
33
Canterbury, and in particular Christchurch City, has a well known Electronics
cluster. It is interesting to note that the results for Canterbury and Christchurch
City for both ‘C283 Photographic and Scientific Equipment Manufacturing’ and
‘C284 Electronic Equipment Manufacturing’ industries are marginally less skilled
than the New Zealand average levels. This result was not expected and is
certainly worthy of further discussion with stakeholders. One reason for lower
than average qualification levels in the Canterbury electronics industries might be that there is a higher share of production line workers than product developers in
Canterbury. Alternatively, the employment of the highly skilled staff in the
Canterbury Electronics cluster may have been coded to industries other than the
ones identified above.
Comparing Canterbury’s industries of Knowledge Intensity with the New
Zealand averages
New Zealand Canterbury
K1 Industries
L781 Scientific Research B142 Mining nec
L782 Technical Services C219 Tobacco Product Manufacturing
L783 Computer Services C243 Recorded Media Manufacturing and Publishing
L784 Legal and Accounting Services L781 Scientific Research
M811 Government Administration L782 Technical Services
M813 Foreign Government Representation L783 Computer Services
N842 School Education L784 Legal and Accounting Services
N843 Post School Education M813 Foreign Government Representation
O864 Veterinary Services N842 School Education
N843 Post School Education
O864 Veterinary Services
K2 Industries
C242 Publishing B110 Coal Mining
C243 Recorded Media Manufacturing and Publishing C283 Photographic and Scientific Equipment Manufacturing
C283 Photographic and Scientific Equipment Manufacturing C284 Electronic Equipment Manufacturing
C284 Electronic Equipment Manufacturing D361 Electricity Supply
D362 Gas Supply I661 Services to Road Transport
D370 Water Supply, Sewerage and Drainage Services K751 Services to Finance and Investment
I661 Services to Road Transport L785 Marketing and Business Management Services
J712 Telecommunication Services M811 Government Administration
K731 Central Bank M812 Justice
K733 Other Financiers N841 Preschool Education
K734 Financial Asset Investors N844 Other Education
K741 Life Insurance and Superannuation Funds O861 Hospitals and Nursing Homes
K751 Services to Finance and Investment O862 Medical and Dental Services
L773 Non-Financial Asset Investors O863 Other Health Services
L785 Marketing and Business Management Services P921 Libraries
M812 Justice P922 Museums
N844 Other Education P923 Parks and Gardens
O861 Hospitals and Nursing Homes P924 Arts
O862 Medical and Dental Services P925 Services to the Arts
O863 Other Health Services Q961 Religious Organisations
P911 Film and Video Services Q962 Interest Groups
P912 Radio and Television Services

34
P921 Libraries
P922 Museums
P923 Parks and Gardens
P924 Arts
P925 Services to the Arts
Q961 Religious Organisations
Q962 Interest Groups
K3 Industries
B120 Oil and Gas Extraction B151 Exploration
B151 Exploration C242 Publishing
C218 Beverage and Malt Manufacturing C254 Other Chemical Product Manufacturing
C253 Basic Chemical Manufacturing D370 Water Supply, Sewerage and Drainage Services
C254 Other Chemical Product Manufacturing G524 Recreational Good Retailing
D361 Electricity Supply G525 Other Personal and Household Good Retailing
F461 Machinery and Equipment Wholesaling I630 Water Transport
F472 Textile, Clothing and Footwear Wholesaling J712 Telecommunication Services
F479 Other Wholesaling K731 Central Bank
G525 Other Personal and Household Good Retailing K732 Deposit Taking Financiers
I630 Water Transport K733 Other Financiers
K732 Deposit Taking Financiers K734 Financial Asset Investors
K742 Other Insurance K741 Life Insurance and Superannuation Funds
K752 Services to Insurance K742 Other Insurance
L771 Property Operators and Developers L771 Property Operators and Developers
L772 Real Estate Agents L772 Real Estate Agents
L786 Other Business Services L773 Non-Financial Asset Investors
N841 Preschool Education O871 Child Care Services
O871 Child Care Services P911 Film and Video Services
P931 Sport P912 Radio and Television Services
P932 Gambling Services P931 Sport
P933 Other Recreation Services

DIR11063 MAY 09
Related Documents