The New Normals trt: 2:03 ClimateCenter #8 Taping: Thursday, Jan. 13 th , 2010

Welcome message from author
This document is posted to help you gain knowledge. Please leave a comment to let me know what you think about it! Share it to your friends and learn new things together.
Transcript

The New Normalstrt: 2:03
ClimateCenter #8Taping: Thursday, Jan. 13th, 2010


In fact, 2010 rests on top of decades of warming. 2000 to 2009 ranks as the warmest decade. And each of the past three decades were substantially hotter than any previous decade. This warming trend
raises the question about what is “normal” or average climate?

Technically, a climate “normal” is the weather of a particular region averaged over 30 years. But if the planet keeps warming up, then there isn’t really a “normal” or average climate for a given region.

The current “normals” rely on weather patterns that occurred between 1971 and 2000. The new “normals” will drop the 1970s -- a relatively cool decade -- and add the 2000s - the hottest decade on record. This map shows the difference between those two decades, in terms of January minimum temperatures. With all this red, it’s easy to see January has warmed up across most of the United States.

So why do these “new normals” matter?.

Energy companies, for example, use 30-year “normals” to forecast sales – heating demand - for the winter ahead. If your “normal” is not
accurate, your sales forecast won’t match your weather forecast.
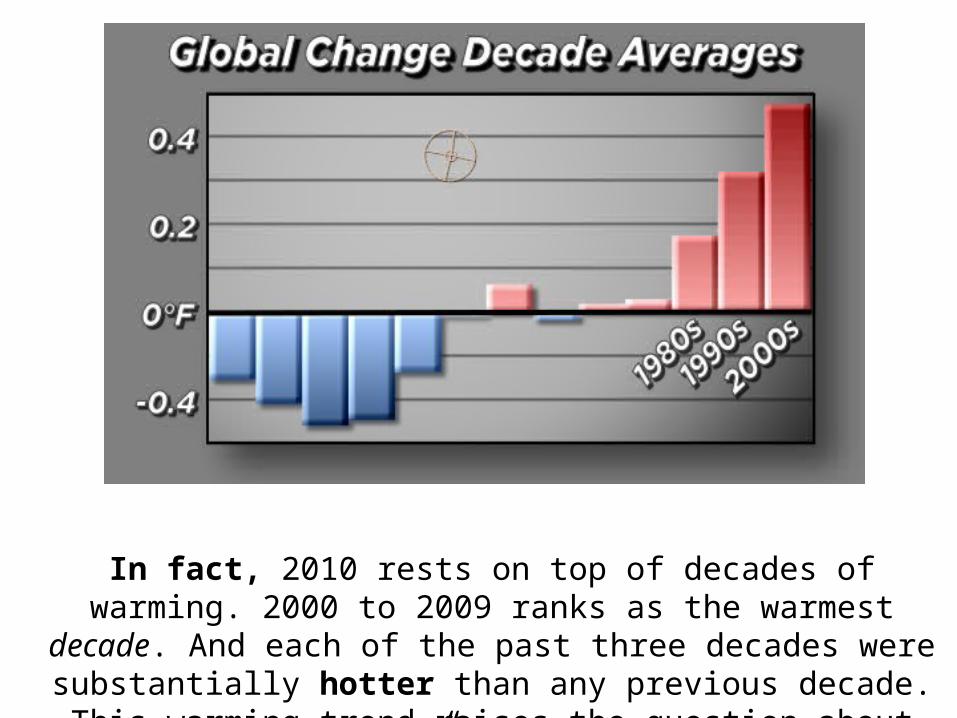
This is one reason why every decade the National Climatic Data Center releases new “normals” for 10,000 regions across the US.

Utilities aren't the only organizations that need high-quality climate information. Agriculture companies use“normals” to help determine what seeds to plant where.

And meteorologists use them to put daily weather in an historical context.

The new normals NCDC releases later this year will include not only new normals for temperature, but for rainfall and snow, too.

I’m Dr. Heidi Cullen. Check back soon for another climate update!
Related Documents