The new HBS Chisinau, 26 October 2007

The new HBS Chisinau, 26 October 2007. 1 Outline 1.How the HBS changed 2.Assessment of data quality 3.Data comparability 4.Conclusions.
Dec 25, 2015
Welcome message from author
This document is posted to help you gain knowledge. Please leave a comment to let me know what you think about it! Share it to your friends and learn new things together.
Transcript

The new HBS
Chisinau, 26 October 2007
2
Outline
1. How the HBS changed
2. Assessment of data quality
3. Data comparability
4. Conclusions

3
Key improvements in the HBS
• In 2006 the HBS was changed with respect to two major areas characterising a survey:
1) Sampling: the way in which the sample is selected was changed in the following aspects:
• Sampling frame• Sampling design• Practice of substitution
2) Questionnaires: these were changed to better monitor poverty and living standards
• We first look in detail at changes in sampling and then we explain those related to the questionnaire
4
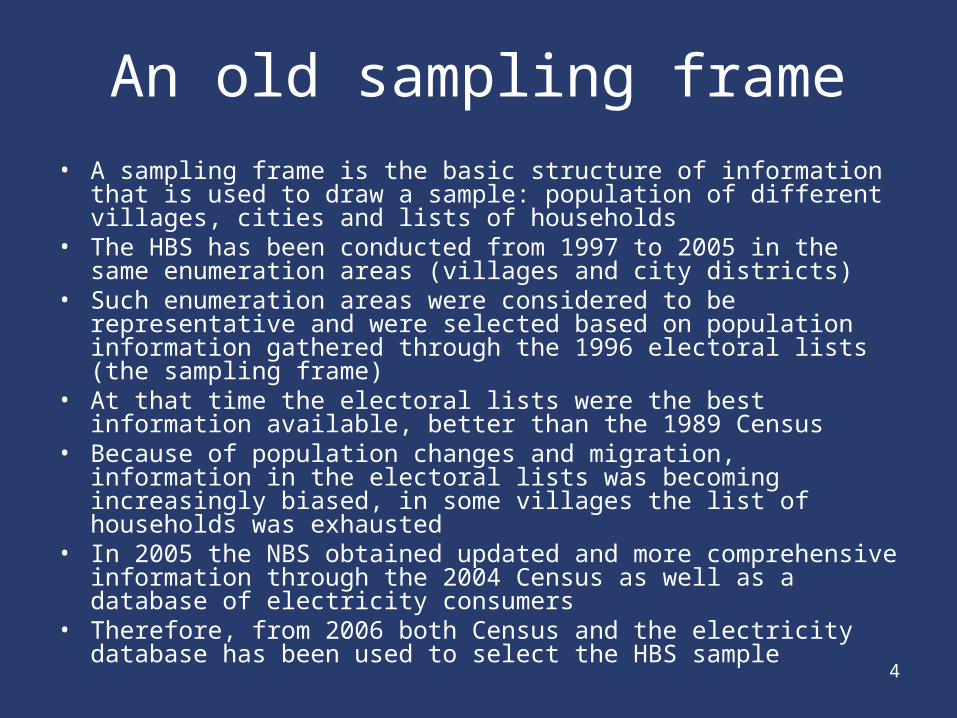
An old sampling frame
• A sampling frame is the basic structure of information that is used to draw a sample: population of different villages, cities and lists of households
• The HBS has been conducted from 1997 to 2005 in the same enumeration areas (villages and city districts)
• Such enumeration areas were considered to be representative and were selected based on population information gathered through the 1996 electoral lists (the sampling frame)
• At that time the electoral lists were the best information available, better than the 1989 Census
• Because of population changes and migration, information in the electoral lists was becoming increasingly biased, in some villages the list of households was exhausted
• In 2005 the NBS obtained updated and more comprehensive information through the 2004 Census as well as a database of electricity consumers
• Therefore, from 2006 both Census and the electricity database has been used to select the HBS sample

5
Sampling design
• The sampling design defines the main characteristics of the sample: number of enumeration areas, total number of households, country regions for which estimates are reliable
• Although the sample size in 2006 is the same as in 2005, the number of enumeration areas increased from 45 to 120, thus ensuring a better coverage of the country
• Until 2005 the sample was designed to be representative for three different regions: cities, towns and rural areas
• Now the sample is representative not only of these three regions, but also of four economic zones (North , Centre, Chisinau and South)
• Chisinau and Balti are now better covered and stratified for low and high income areas
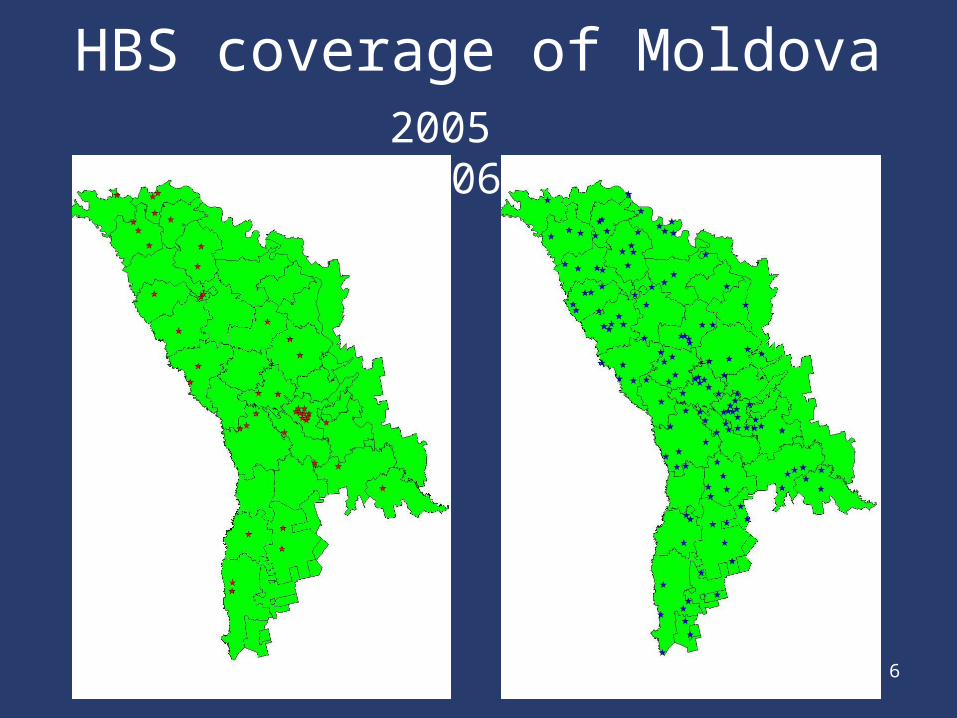
6
HBS coverage of Moldova 2005 2006

7
The practice of substitution
• Until 2005 if a household did not want to be interviewed it was substituted with another household
• This created a selection problem: households with children tend to refuse interviews more than old people
• From the enumerator perspective some households are easier to interview and the practice of substitution can create some distortions, the enumerator may not put all the efforts in trying to interview the originally selected households
• The consequence is that the sample becomes less representative: proportionally more elderly people than in the actual population are interviewed and this in turn affects some of the key estimates (consumption, income, etc.)
• From 2006 substitution is no longer allowed and enumerators are encouraged to interview only the initially selected households

8
Questionnaire improvements
• In 2004 and 2005 the NBS conducted various experiments in order to improve the questionnaire design, such experiments guided the changes implemented in 2006
• Questionnaire changes affected the following areas:– Changes in the reference period of some income sources and
expenditure items– Improved layout of the diary (the questionnaire booklet that
helps the household to record income and expenditure transactions)
– Food expenditure recorded only for half a month not the full month
– Changes in the definitions of employment indicators
9
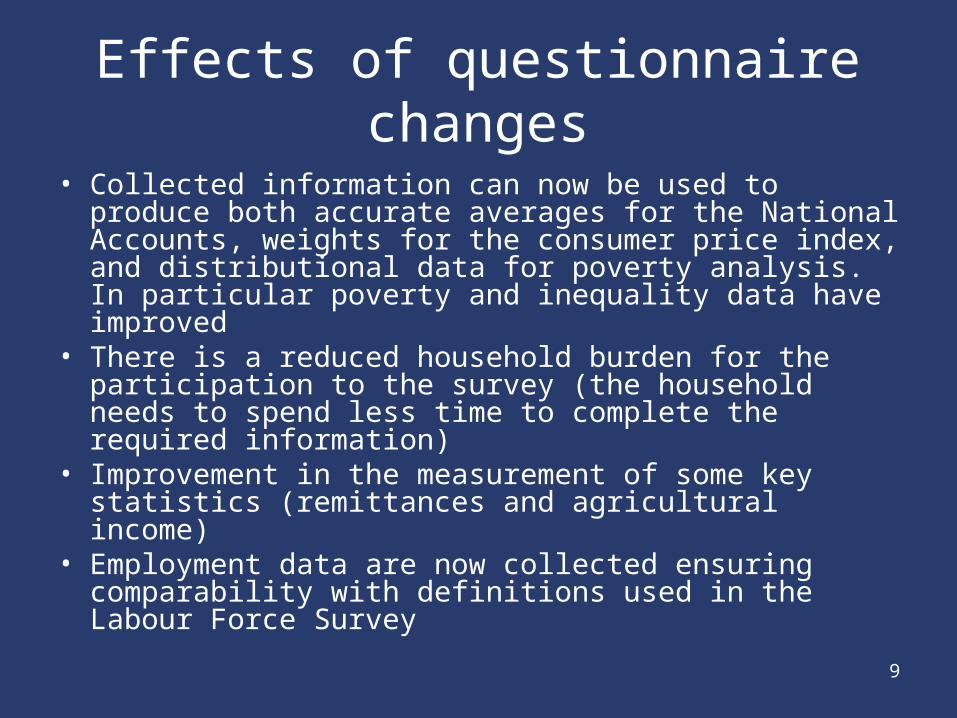
Effects of questionnaire changes
• Collected information can now be used to produce both accurate averages for the National Accounts, weights for the consumer price index, and distributional data for poverty analysis. In particular poverty and inequality data have improved
• There is a reduced household burden for the participation to the survey (the household needs to spend less time to complete the required information)
• Improvement in the measurement of some key statistics (remittances and agricultural income)
• Employment data are now collected ensuring comparability with definitions used in the Labour Force Survey
10
Outline
1. How the HBS changed2. Assessment of data quality
3. Data comparability
4. Conclusions

11
2006 data quality
• Data quality can be assessed looking at internal data consistency, but also through external validation
• Internal consistency:– Relationship between aggregates, prices capturing
inflation, etc.
• External validation:– Some HBS estimates can be compared to those
provided by other sources– Such comparisons need to take into account
differences in ways measures are obtained

12
Data validation with external sources
• Demographic indicators: Census– Composition by age– Household size
• National income and product accounts
• Social protection
• Labour Force Survey
• Agricultural statistics
• Let’s see some examples
13
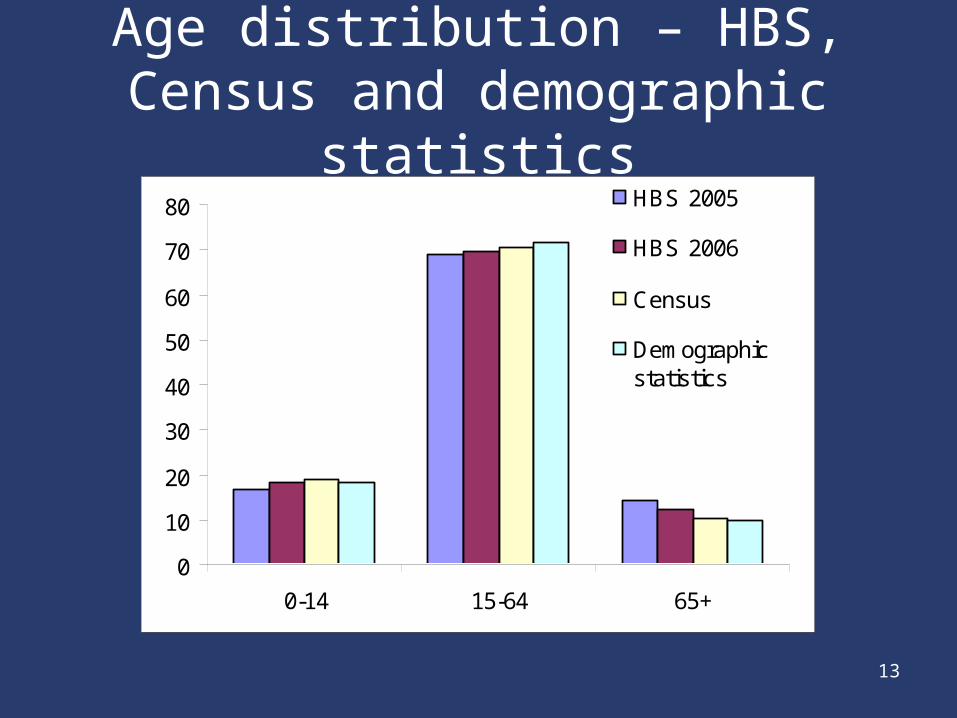
Age distribution – HBS, Census and demographic statistics
0
10
20
30
40
50
60
70
80
0-14 15-64 65+
HBS 2005
HBS 2006
Census
Demographicstatistics

14
Household size• Average household size, including people working
abroad, is the same in the 2006 HBS and in the Census, but in previous HBS was considerably lower
• In 2006 distribution of household size is much closer to that of the Census
Distribution of hh by size
0.0
5.0
10.0
15.0
20.0
25.0
30.0
1 2 3 4 5
2005 HBS 2006 HBS Census
15
Outline
1. How the HBS changed
2. Assessment of data quality3. Data comparability
4. Conclusions
16
Comparability issues
• The changes described earlier (sampling, questionnaires) affect the comparability of 2006 estimates with previous surveys
• It is not possible to compare 2006 with previous estimates• Let’s make a simple example: Assume that you are
looking at a room from one specific corner• This room between 1997 and 2007 has changed
considerably• The perspective that was good in 1997 is no longer
representative now, some parts of the room are no visible• In 2006 the perspective has changed and all the room
became visible again

17
No comparability
• Although the room is the same, we cannot compare 2005 and 2006 estimates because 2006 data allows us to see part of the room that were not visible in 2005
• This means that if estimates in 2006 are higher or lower than those in 2005, we cannot conclude that estimates have increased or decreased– For example, if the average household size in 2005
was 2.5 and in 2006 is 3. This does not mean that households are now larger than before. The part of the room that we did not see before has clearly an influence on the new estimate
18
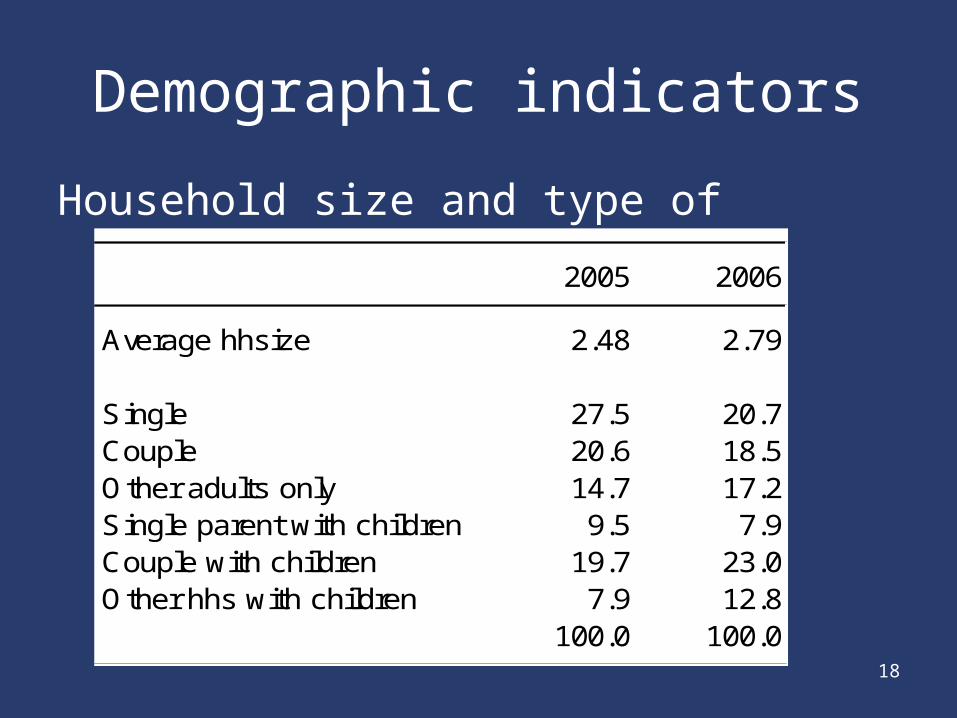
Demographic indicators
Household size and type of households
2005 2006
Average hhsize 2.48 2.79
Single 27.5 20.7Couple 20.6 18.5Other adults only 14.7 17.2Single parent with children 9.5 7.9Couple with children 19.7 23.0Other hhs with children 7.9 12.8
100.0 100.0

19
Example: House types in cities
• Detached houses in 2006 are included in the sample frame: they represent 16% of dwellings.
• In 2005 they appeared to be un-existent (due to the old sample frame)
0%
10%
20%
30%
40%
50%
60%
70%
80%
90%
100%
2005 2006
Private house
Hostels
Apartments

20
Example: income and consumption
• Both income and consumption are now estimated at much higher levels than in 2005
• This is in line with estimates from the National accounts
0
100
200
300
400
500
600
700
800
900
1000
2004 2005 2006
HBS NIPA

21
Conclusion• HBS quality improved substantially and now provides
data that are more representative of Moldova• Higher data quality means:
– Better understanding of poverty and its characteristics– Greater ability to inform policy making and monitor policy impact
in the future• However, 2006 data are not fully comparable with
previous estimates. The degree of incomparability was somewhat unexpected, but we need to consider that there was no point in keeping the old design if no longer fully representative
• To make sure that data remains representative, villages and enumeration areas will be changed over time and the sampling frame will also be updated using the electricity database and making a household listing of the new selected enumeration areas
Related Documents