The new building regulation plan schema in the town of Castelbuono (Sicily): the experience of FACTOR20- LIFE+ project Marco Beccali* Department of Energy, Information Engineering and Mathematical Models Università di Palermo, viale delle scienze, Ed.9, Palermo (Italy) email: [email protected] V. Lo Brano, G. Ciulla, E. Moreci. A. Galatioto Department of Energy, Engineering Information and Mathematical Models Università di Palermo, viale delle scienze, Ed.9, Palermo (Italy) email: [email protected], [email protected], [email protected], [email protected] ABSTRACT The LIFE+ Programme is the European Union’s funding instrument for the environment. The general objective of LIFE+ is to contribute to the implementation, updating and development of EU environmental policy and legislation by co-financing pilot or demonstration projects with European added value. In the framework of LIFE+, the project “Forwarding demonstrative ACTions On a Regional and local scale (FACTOR20) to reach EU targets of the European Plan 20/20/20” was founded by European Commission. FACTOR20 is aimed to define a set of tools to support the planning of regional and national policies for the reduction of greenhouse gas emissions and for the reduction of energy consumption. The knowledge of the existing building allow to quantify energy consumption of an urban area and to highlight what are the main energy problems on which to intervene. One of these tools is the definition of a new building regulation schema that identifies the best practices to improve the energy efficiency, to reduce the GHG emissions and to promote the use of RES. The authors, in order to assess the applicability and the effectiveness of some key actions proposed in the new building regulation plan schema, have performed a detailed dynamic analysis of energy consumptions related to typical building structures strongly representative of Sicilian context. The simulations, carried out by using TRNSYS17, have permitted to assess the actual energy consumptions and then to compare the new energy performances induced by the application of some key retrofit actions. In this way it was possible to identify which retrofit action is more convenient from the point of view of energy and environmental; also the designer have an indication to the designer on the priorities of retrofit actions. KEYWORDS Energy efficiency, building regulation, Kyoto protocol, FACTOR20, retrofit actions, dynamic simulation. INTRODUCTION The most important fraction of energy consumption in the European Union is due to the residential building sectors. A strategic plan aimed to energy saving coming from local authorities, could take advantage of a closer relationship with its citizens and territory. The building stock of Sicilian towns is characterised by several different types of buildings that now SDEWES2014.0324-1

Welcome message from author
This document is posted to help you gain knowledge. Please leave a comment to let me know what you think about it! Share it to your friends and learn new things together.
Transcript
The new building regulation plan schema in the town of Castelbuono
(Sicily): the experience of FACTOR20- LIFE+ project
Marco Beccali*
Department of Energy, Information Engineering and Mathematical Models Università di Palermo, viale delle scienze, Ed.9, Palermo (Italy)
email: [email protected]
V. Lo Brano, G. Ciulla, E. Moreci. A. Galatioto Department of Energy, Engineering Information and Mathematical Models
Università di Palermo, viale delle scienze, Ed.9, Palermo (Italy) email: [email protected], [email protected], [email protected],
ABSTRACT
The LIFE+ Programme is the European Union’s funding instrument for the environment. The
general objective of LIFE+ is to contribute to the implementation, updating and development
of EU environmental policy and legislation by co-financing pilot or demonstration projects
with European added value. In the framework of LIFE+, the project “Forwarding
demonstrative ACTions On a Regional and local scale (FACTOR20) to reach EU targets of
the European Plan 20/20/20” was founded by European Commission. FACTOR20 is aimed to
define a set of tools to support the planning of regional and national policies for the reduction
of greenhouse gas emissions and for the reduction of energy consumption.
The knowledge of the existing building allow to quantify energy consumption of an urban
area and to highlight what are the main energy problems on which to intervene. One of these
tools is the definition of a new building regulation schema that identifies the best practices to
improve the energy efficiency, to reduce the GHG emissions and to promote the use of RES.
The authors, in order to assess the applicability and the effectiveness of some key actions
proposed in the new building regulation plan schema, have performed a detailed dynamic
analysis of energy consumptions related to typical building structures strongly representative
of Sicilian context. The simulations, carried out by using TRNSYS17, have permitted to
assess the actual energy consumptions and then to compare the new energy performances
induced by the application of some key retrofit actions. In this way it was possible to identify
which retrofit action is more convenient from the point of view of energy and environmental;
also the designer have an indication to the designer on the priorities of retrofit actions.
KEYWORDS
Energy efficiency, building regulation, Kyoto protocol, FACTOR20, retrofit actions, dynamic
simulation.
INTRODUCTION
The most important fraction of energy consumption in the European Union is due to the
residential building sectors. A strategic plan aimed to energy saving coming from local
authorities, could take advantage of a closer relationship with its citizens and territory. The
building stock of Sicilian towns is characterised by several different types of buildings that now
SDEWES2014.0324-1
are inadequate to achieve the minimum of energy performance ruled by the European Union. A
detailed knowledge about the energy effects that different retrofitting solutions induce on
building stock, could represent a useful decision support tool to help local authorities in defining
more effective policy actions. This approach should permit to draft new guidelines for building
regulations that takes into account also greenhouse gases (GHG) emissions linked to the
building-plant systems. Under this perspective, the residential sector could be at the same time an
important “consumer” but also a strategic “actor”.
Based on these considerations, a LIFE+ Environment Policy and Governance project was funded
by European Commission. The “Forwarding demonstrative ACTions On a Regional and local
scale to reach EU targets of the European Plan 20/20/20” (FACTOR20) is aimed to define a set
of tools to support the planning of regional and national policies for the reduction of greenhouse
gas emissions, the reduction of energy consumption and dissemination of renewable energy
sources (RES). One of these tools is the definition of a new building regulation schema that
identifies the best practices to improve the energy efficiency, to reduce the GHG emissions and
to promote the use of RES.
The authors, have carried out a detailed dynamic energy analysis by using TRNSYS17, applying
some key actions to typical building structures strongly representative of Sicilian context.
The obtained results allow highlighting the priorities of the retrofit actions, allowing the local
authorities to choose the best policies to increase the energy efficiency. Moreover, extending the
results to the entire city territory, it is possible to quantify the overall energy savings potential.
In detail in this work, it was analysed the built heritage of the town of Castelbuono identifying
three representative residential buildings of the building context: a single Family House, a
Townhouse and a Multy-family house. The thermo physical analysis of the plant-building
system of these constructions allow evaluating the global energy efficiency and the extension
of these results to the entire urban area can help the municipality to encourage citizens on the
correct retrofit action depending on the type of building.
MICROCLIMATIC AND ENVIRONMENTAL CONTEXT
Castelbuono is a little Sicilian town in the province of Palermo, located at 423 m above sea level,
on the slopes of the hill Milocca. The town is part of Madonie Park belonging to the altitude
zone of the Coastal Mountains. Castelbuono has a mild Mediterranean climate with cold and wet
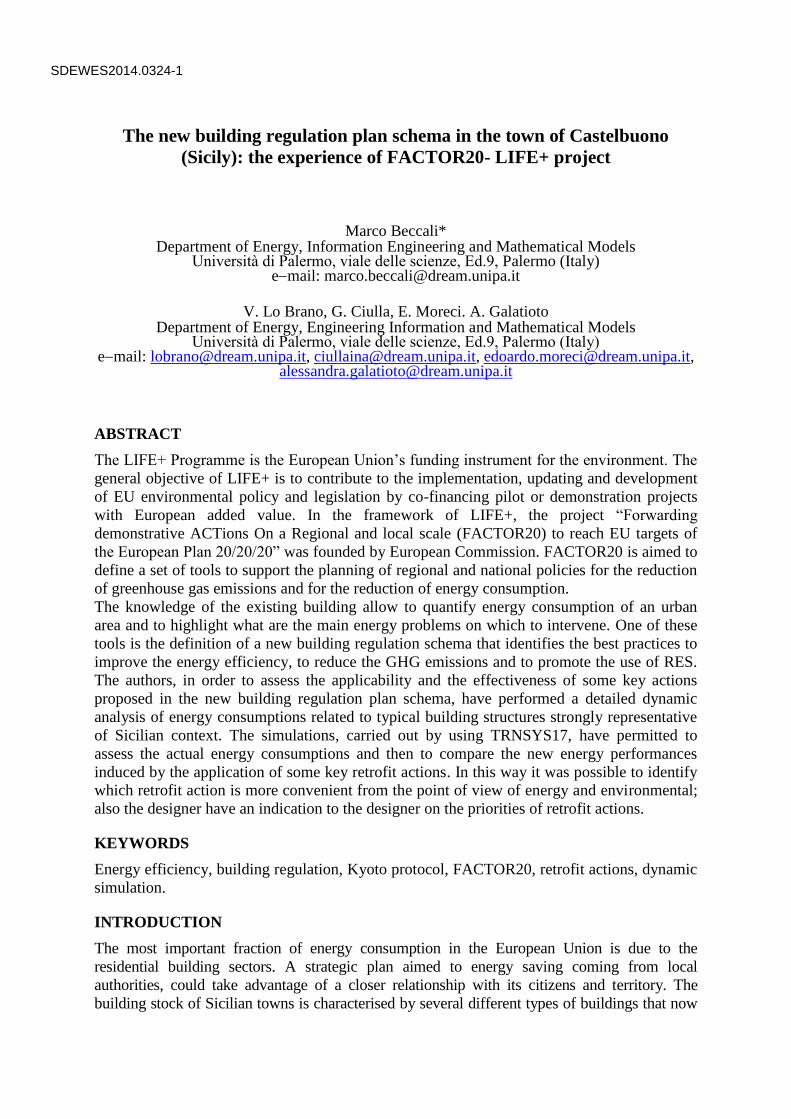
winters and warm summers. In winter, the average temperature is between 10° to 12° C and
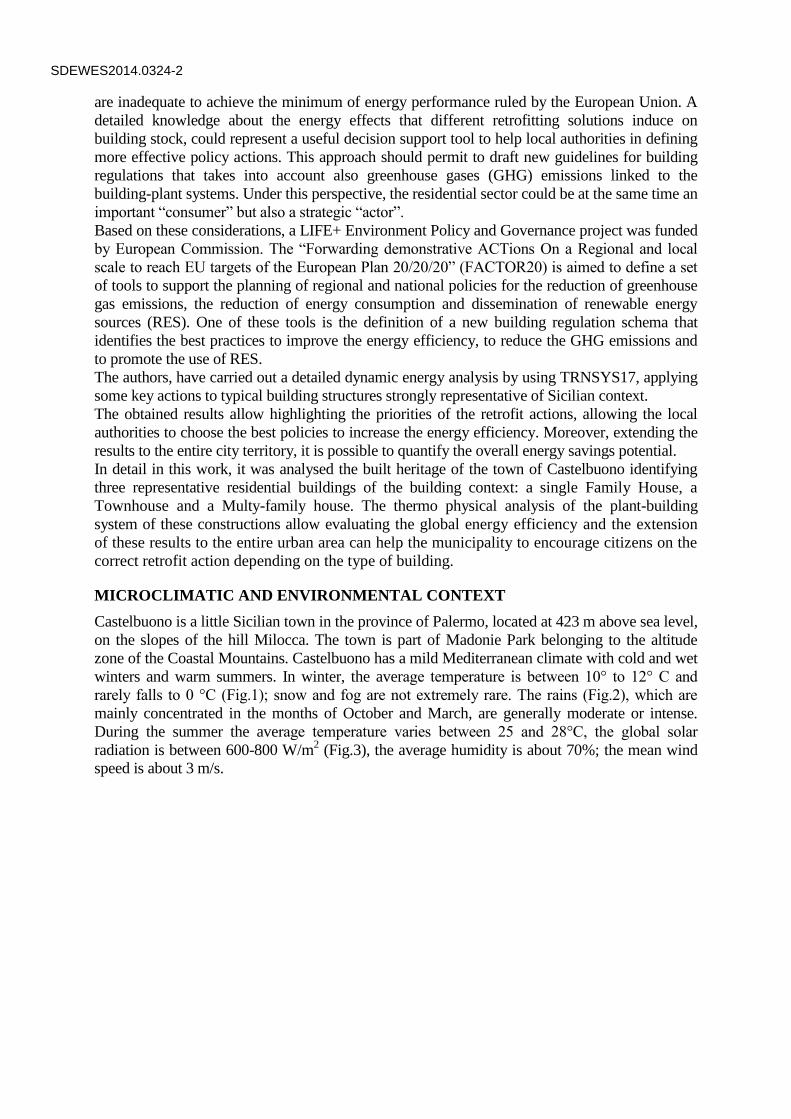
rarely falls to 0 °C (Fig.1); snow and fog are not extremely rare. The rains (Fig.2), which are
mainly concentrated in the months of October and March, are generally moderate or intense.
During the summer the average temperature varies between 25 and 28°C, the global solar
radiation is between 600-800 W/m2 (Fig.3), the average humidity is about 70%; the mean wind
speed is about 3 m/s.
SDEWES2014.0324-2
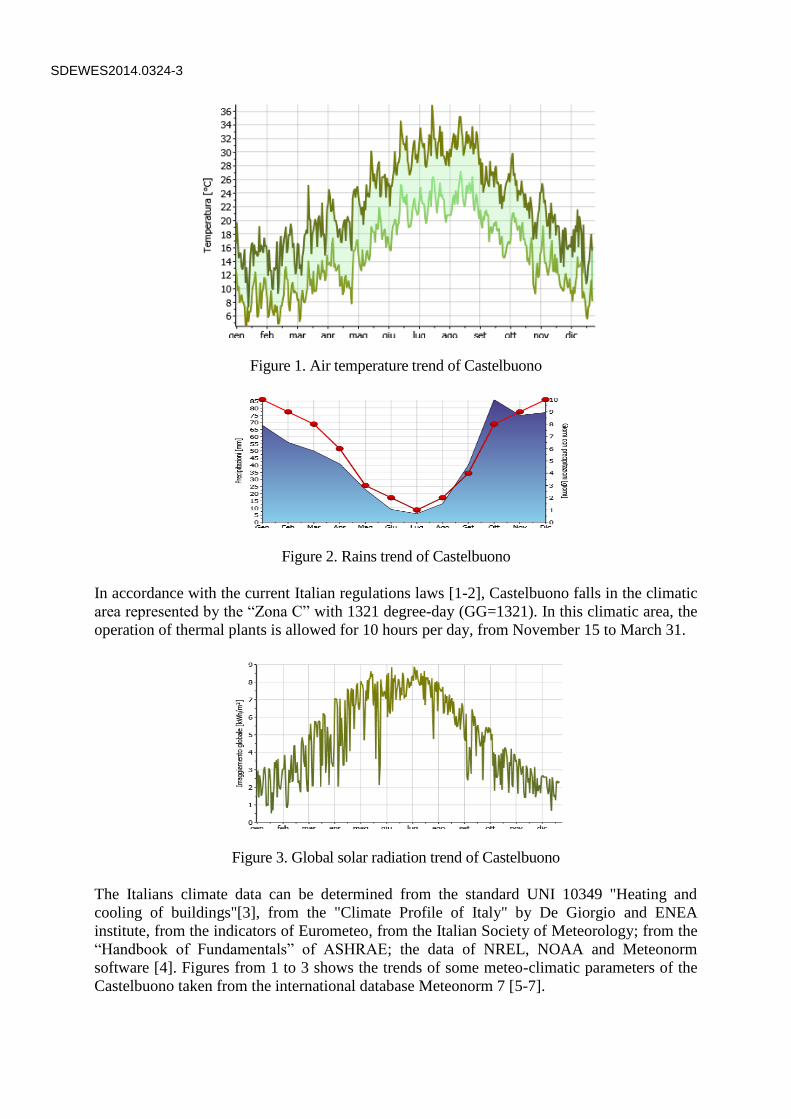
Figure 1. Air temperature trend of Castelbuono
Figure 2. Rains trend of Castelbuono
In accordance with the current Italian regulations laws [1-2], Castelbuono falls in the climatic
area represented by the “Zona C” with 1321 degree-day (GG=1321). In this climatic area, the
operation of thermal plants is allowed for 10 hours per day, from November 15 to March 31.
Figure 3. Global solar radiation trend of Castelbuono
The Italians climate data can be determined from the standard UNI 10349 "Heating and
cooling of buildings"[3], from the "Climate Profile of Italy" by De Giorgio and ENEA
institute, from the indicators of Eurometeo, from the Italian Society of Meteorology; from the
“Handbook of Fundamentals” of ASHRAE; the data of NREL, NOAA and Meteonorm
software [4]. Figures from 1 to 3 shows the trends of some meteo-climatic parameters of the
Castelbuono taken from the international database Meteonorm 7 [5-7].
SDEWES2014.0324-3
ANALISYS OF THE ACTUAL BUILDING CONTEXT
Basing on the ”Report of testing activities promoted by Region of Sicily DELIVERABLE-
13” it is possible to classify buildings according to their use; the building classification is
defined by Presidential Decree 412/93 [1] on the basis of the following Table 1:
Table 1. Building Classification based on DPR 412/93
Category Description
E.1 (1) RESIDENTIAL BUILDINGS- continuous employment
E.1 (2) RESIDENTIAL BUILDINGS -occasional employment
E.1 (3) BUILDINGS USED to HOTEL, HOSTEL and similar activities
E.2 BUILDINGS USED to OFFICE and similar activities
E.3 HOSPITALS, HOMES CARE, and CLINICAL
E.4 BUILDINGS used for recreational, community or religion and similar
E.5 COMMERCIAL BUILDINGS
E.6 SPORTS BUILDINGS
E.7 SCHOLASTIC BUILDINGS
E.8 INDUSTRIAL BUILDINGS AND CRAFT heated for the comfort of the
occupants
In detail, for the town of Castelbuono the following percentages have been identified:
Table 2. Classification of Castelbuono buildings
Category [%] E.1 (1) 86.71
Different from E1 5.57
Not used 7.75
In total, the residential buildings are 4,396: only about 1/3 are houses scattered in the outer
zones, while 2/3 are built near the centre of the town.
From the structural point of view, taking into account the material used in different historical
periods, and also data obtained from the last Italian National Census, it was possible to
classify the buildings as:
Self-supporting Masonry walls: 2,868;
Reinforced Concrete: 1,010;
Others: 518,
of which 16.36% in excellent condition, 50.48% in good condition, 29.30% in a poor state
and only 3.86% in very poor conditions.
The assessment and calculation of thermo-physical properties of building materials is very
important for the overall evaluation of the global energy efficiency; indeed, the conduction
heat transmission through the envelope represents the main contribution of total energy
balance [8-9].
In order to make a good analysis that represents the existing building heritage of Castelbuono,
three sample buildings were selected. According to the above considerations, the following
sample buildings were identified:
Sample A: Single Family House
The single family house is designed to accommodate a single family, it is isolated and
independent from other building units and usually has a private garden. This type of housing
requires a considerable development of roads and services.
SDEWES2014.0324-4
Sample B: Townhouse
This typology of house is characterized by adjacent buildings, with a small footprint on
multiple floors. The single unit generally has a narrow front that grows in depth and height
with several floors. Often presents a garden or a backyard with an internal scale can lead to
the upper floors. Generally, it is a mono-family house and this is the typical building
construction of Sicilian urban centres.
Sample C: Multi-family house
The Multi-family is a condominium consisting of a building usually free from any side, built
on relatively narrow areas, with 2-6 apartments per floor and a variable number of floors,
usually 3-6. Characteristic of this type of housing are the internal courtyards. After the Second
World War, this housing solution has become widespread in the peripheral areas of large
cities, not always with positive results in terms of urban quality. This kind of buildings is
typical of the 80’s and it is developed in the area outside the city centre, adjacent to it.
Thermo-physical evaluation
To properly analyse the energy requirements of existing buildings, three buildings that
actually exist in Castelbuono, representing the three above identified categories, have been
chosen,. Thanks to the documents provided by the technical office of Castelbuono, the
following buildings have been identified:
Sample A : a single house family located in Contrada Vinzeria;
Sample B: a building for residential site in Via Abruzzi 51-53, located in the centre of
the town;
Sample C: a residential complex located in via Geraci.
For each building, all thermo-physically characteristics of the enclosures, the heating/cooling
and DHW systems present, the type of lighting, estimating the thermal and electrical
consumptions have been analysed.
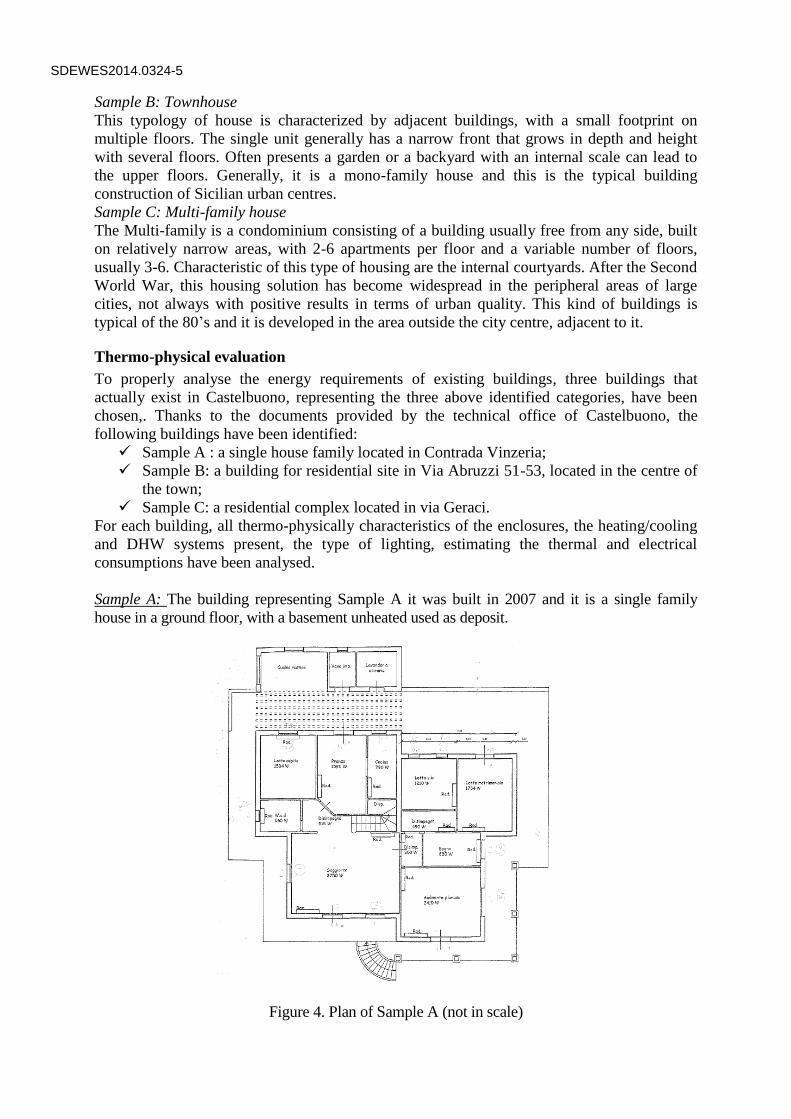
Sample A: The building representing Sample A it was built in 2007 and it is a single family
house in a ground floor, with a basement unheated used as deposit.
Figure 4. Plan of Sample A (not in scale)
SDEWES2014.0324-5
From the structural point of view, the Sample A has a reinforced concrete. It is surrounded by
a portico and has a pitched roof with red tiles.
The ground floor, for residential use, consisting of: 1 lounge, n. 3 bedrooms, n. 1 living room,
n.1 kitchen, n.3 hall, n. 1 bathroom, n. 1 toilet and an internal staircase connecting the floor to
the deposit, for a total are surface of about 156 m2.
The height is 2.7 m for a total heated volume of 617.2 m3; the basement is devoid of any type
of plant and is in contact with approximately 50% of the upper surface of the ground floor.
The remaining floor is a technical unheated room.
By the documentation provided by the technical department of the City of Castelbuono was
possible to identify the stratigraphy of the outside vertical walls. As regards the other
envelope surfaces (coverage and inter- slab) in the absence of data, were assumed two
stratigraphy that comply the transmittance legal limits values Ulim in 2007. In detail, the
thermo- physical characteristics of the envelopes surfaces are:
Table 3. Transmittance of the opaque envelope of Sample A
Surface U
[W/m2K]
Ulim
[W/m2K]
External vertical Wall 0.361 0.54
Coverage 0.53 0.55
Internal floor 0.542 0.55
In all apartments aluminium windows with thermal break double-glazed (4-6-4) with
aluminium shutters are installed. According to UNI 10077-1 [10], UNI 6946 [11], and [12-13]
the following thermo-physical parameters were calculated:
transmittance of the glass: Ug = 3 W/m2K;
transmittance of the frame: Uf = 2.8 W/m2K;
coefficient of thermal linear transmission: = 0.08 W/m2K;
Because all windows are fitted with shutters, it was necessary to evaluate the additional
resistance, according to the UNI 10077-1 Standard; the value of thermal resistance for
aluminium shutters is 0.02 m2K/W. For each type of frame the respective Uw transmittance
values has been determined:
Table 4. Thermo-physical and geometry properties of Windows (Sample A)
Types Description Number Width
[m]
Heigh
[m]
Uw
F1 two-wing window 1 1.8 1.5 2.98
F2 two-wing window 4 1.2 1.5 2.99
F3 one-wing window 3 0.7 1.5 3.06
PF1 Door window-two-wing 4 1.2 2.4 2.98
PF2 Door window-one-wing 1 0.9 2.4 3.03
PF3 Door window-four-wing 1 2.4 2.4 2.95
These values of transmittances are all within the legal limit in 2007 (Uw =3.3 W/m2K).
In the apartment, there is an autonomous heating plant with two 24 kW heaters radiators in all
rooms.
The thermal plant was built with horizontal distribution and insulated copper pipe embedded
in the floor. The plant is controlled by an ON/OFF room thermostat adaptable for different
SDEWES2014.0324-6
areas. For each room the power provided by the radiating elements for a total of 15,378W was
estimated.
Furthermore, the following electrical loads have been estimated: n. 1 refrigerator; n. 1
washing machine, n.1 dishwasher, 5W/m2 of lighting with incandescent lamps, n. 1 PC, n. 3
TVs, n. 1 electric oven; a family of four people occupies the building.
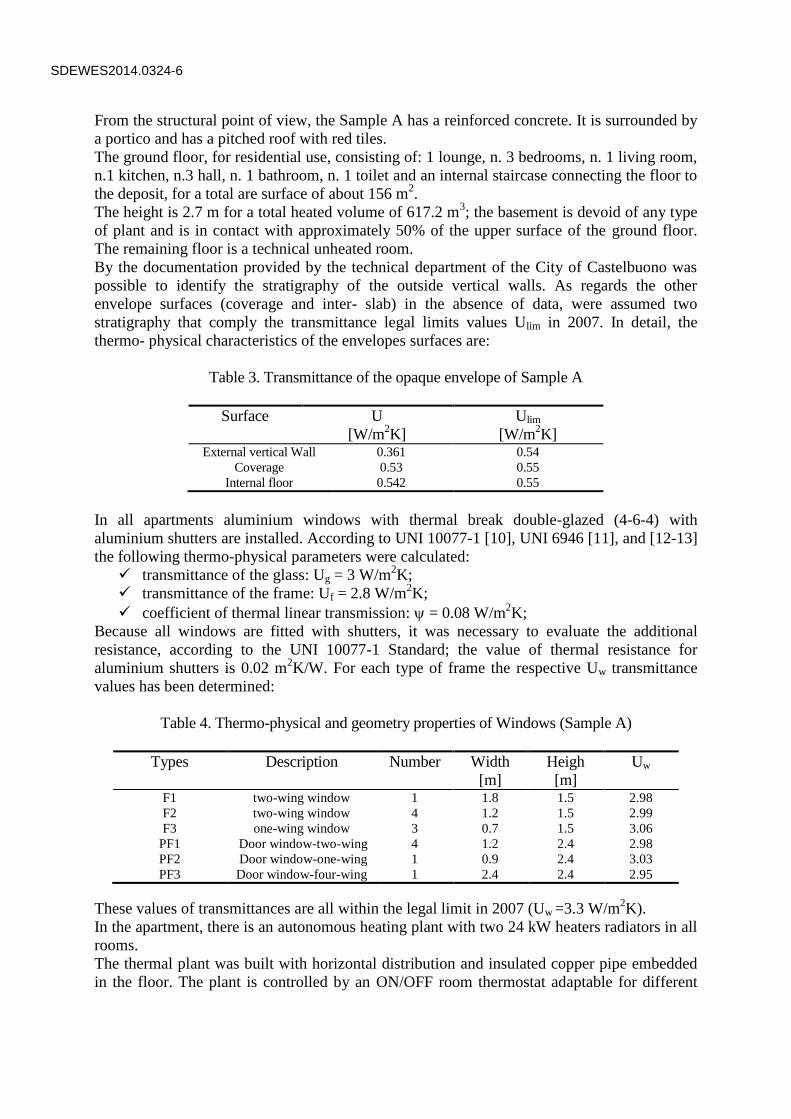
Sample B: is a residential building sited in Via Abruzzi 51-53, located in the centre of
Castelbuono. It is a typical construction of nineteenth-century with mono-functional volumes
from ground to roof. The building has a body of 13 m x 5 m with the access from Via Abruzzi
and borders on three sides to two floors (ground floor and first floor) and on two sides to a
floor (second floor). As it can be seen from the floor plans, the building consists of a ground
floor, a first floor, a second floor with a little attic.
Figure 5. Plan of Sample B (not in scale)
The ground floor and the first floor borders with Abruzzo Street. The entire surface was
redone with mortar of lime in light colors. The staircase is internal to the building and is
developed from the ground floor to the second floor.
From the structural point of view, the building was consolidated in 2004 and it is
characterized by a load-bearing masonry variable with height:
1. Ground and first floor: continuous Masonry with shapeless stone;
2. Second floor and attic: continuous masonry with bricks.
During the consolidation phase, the entire masonry has been reclaimed by a hydraulic
injection of lime mortar at low pressure. In detail, the envelope surfaces characteristic are
illustrated in the following tables:
Table 5. Transmittance of the opaque envelope of Sample B
Surface U
[W/m2K]
Ulim
[W/m2K]
External vertical Wall
(ground and 1° floor)
0.906 0.54
External vertical Wall
(2° floor)
0.917 0.54
Coverage 0.429 0.55
Ground floor 0.314 0.55
In the building, there are wooden windows with single glazing and shutters. According to
UNI 10077-1 [10], UNI 6946 [11], and [12-13] the following thermo-physical parameters
were calculated:
Glass transmittance: Ug = 5.8 W/m2K;
SDEWES2014.0324-7
Frame transmittance: Uf = 2 W/m2K;
coefficient of thermal linear transmission: = 0 W/m2K;
additional resistance of wooden shutters:R = 0.20 m2K /W;
for each type of frame the respective value of transmittance Uw was calculated.
Table 6. Thermo-physical and geometry properties of Windows (Sample B)
Types Description Number Width
[m]
Heigh
[m]
Uw
F1 one-wing window 1 0.4 0.5 1.93
F2 two-wing window 1 0.8 1.5 2.36
PF1 Door-window two-wing 2 1.2 2.4 2.36
PF2 Door-window two-wing 1 1 2.4 2.30
In this building, there is no heating and cooling facilities; for this reason in the first analysis, it
is assumed that the heating and the domestic hot water (DHW) productions are guaranteed by
electrical equipment, such as stoves and boilers. In the sample B the following electrical loads
have been supposed: 1 refrigerator; n. 1 washing machine, 1 dishwasher, 5W/m2 of
incandescent lighting lamps, 1 PC, n. 2 TVs, 1 electric oven. It is assumed that there is a
family composed by two people.
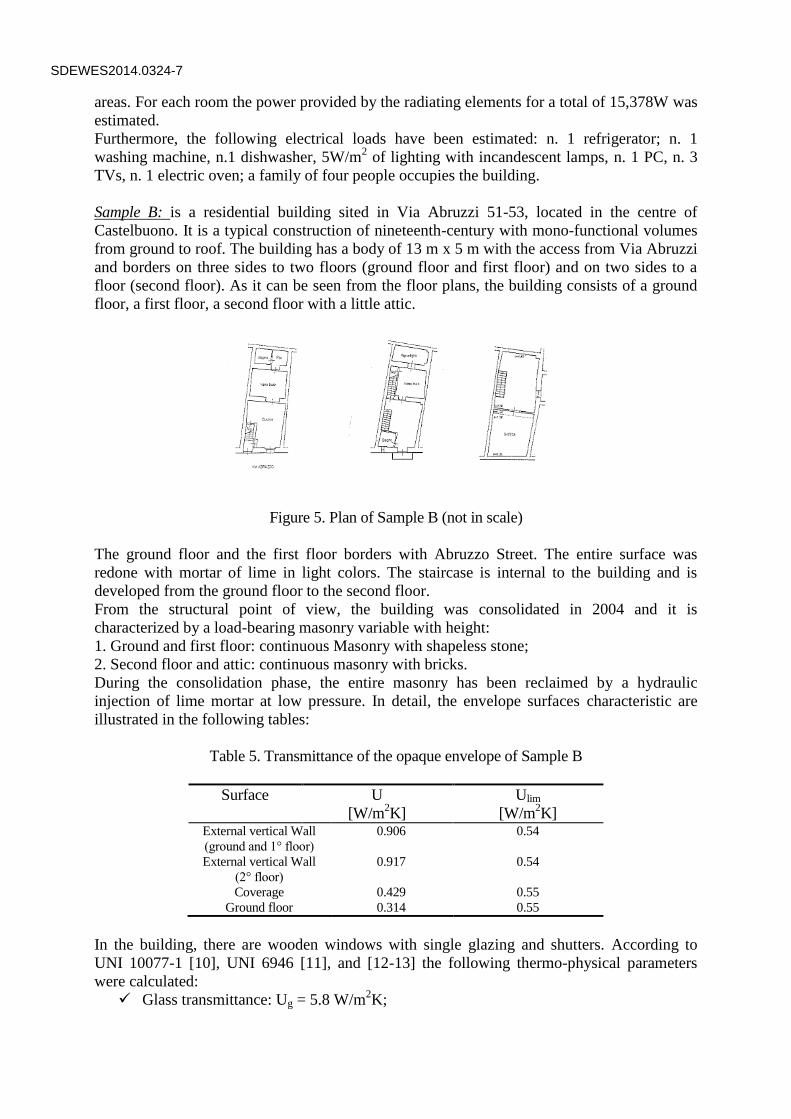
Sample C: The sample C is a residential complex sited in the Geraci Street. The building was
built in 2001, and is a residential condominium with four apartments, two business areas and
two attics. More in detail, there are two apartments on the first floor and two apartments on
the second floor, in the ground floor there are the two business areas.
Figure 6. Plan of Sample C (ground and 1thfloor)
SDEWES2014.0324-8
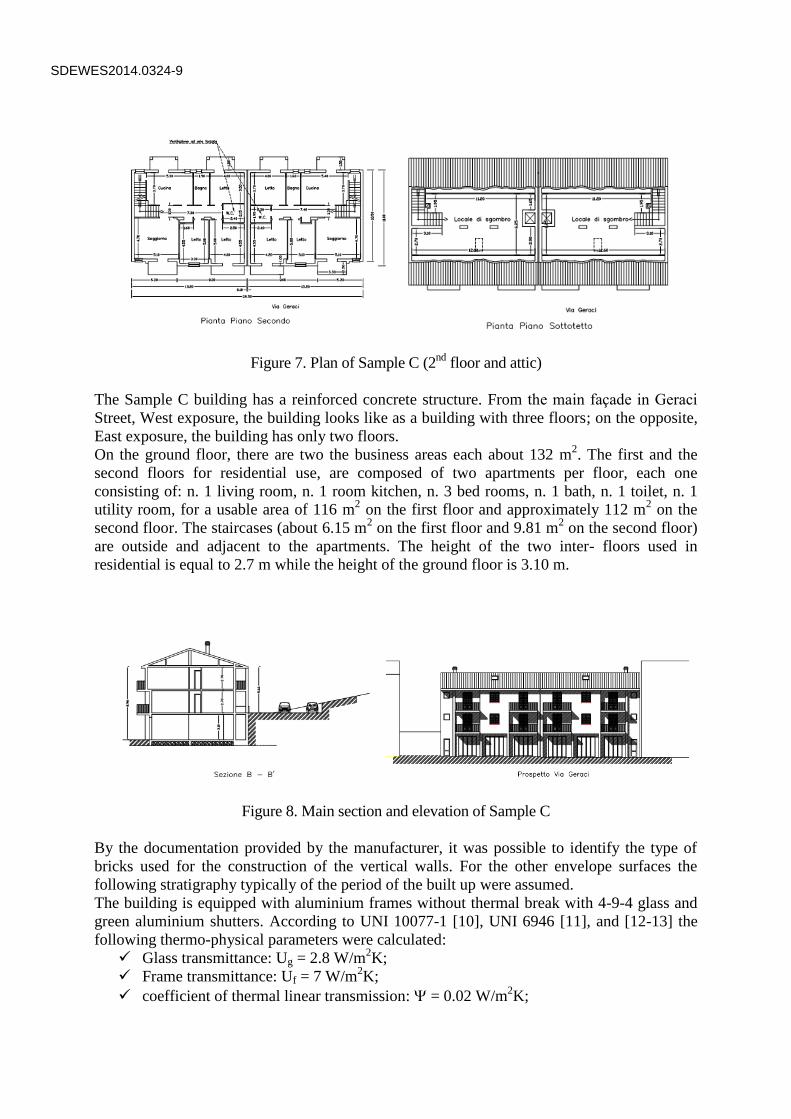
Figure 7. Plan of Sample C (2nd
floor and attic)
The Sample C building has a reinforced concrete structure. From the main façade in Geraci
Street, West exposure, the building looks like as a building with three floors; on the opposite,
East exposure, the building has only two floors.
On the ground floor, there are two the business areas each about 132 m2. The first and the
second floors for residential use, are composed of two apartments per floor, each one
consisting of: n. 1 living room, n. 1 room kitchen, n. 3 bed rooms, n. 1 bath, n. 1 toilet, n. 1
utility room, for a usable area of 116 m2 on the first floor and approximately 112 m
2 on the
second floor. The staircases (about 6.15 m2 on the first floor and 9.81 m
2 on the second floor)
are outside and adjacent to the apartments. The height of the two inter- floors used in
residential is equal to 2.7 m while the height of the ground floor is 3.10 m.
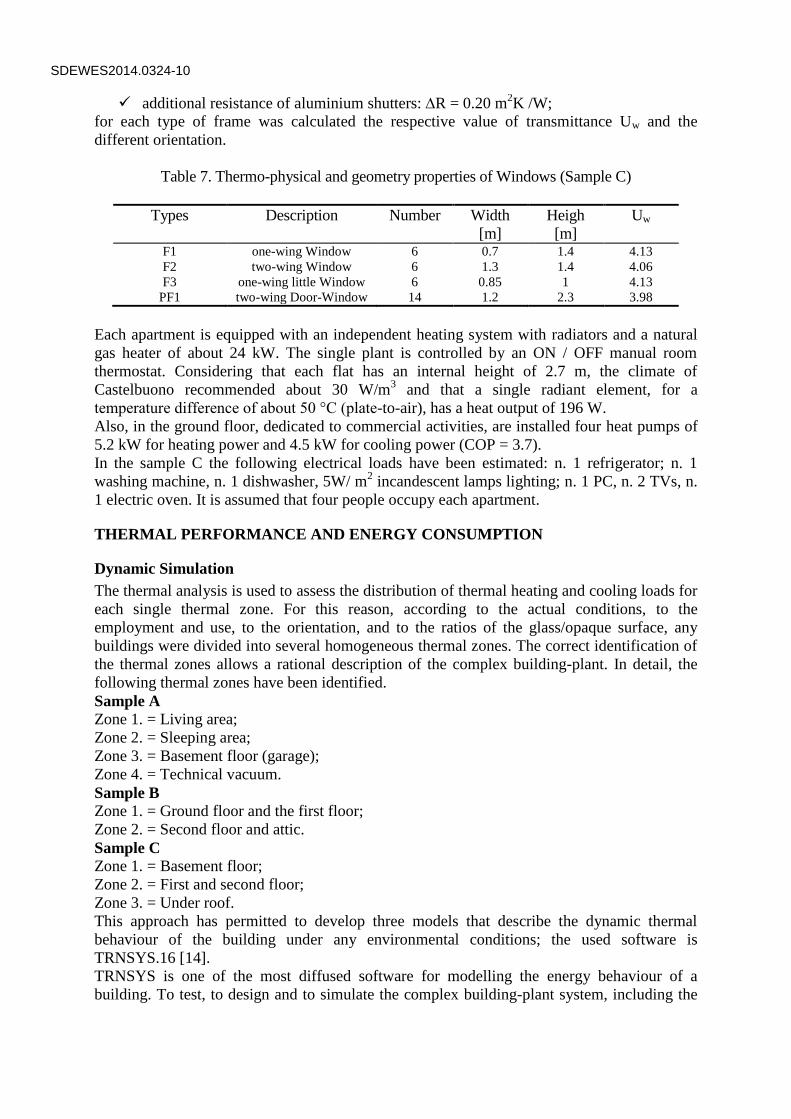
Figure 8. Main section and elevation of Sample C
By the documentation provided by the manufacturer, it was possible to identify the type of
bricks used for the construction of the vertical walls. For the other envelope surfaces the
following stratigraphy typically of the period of the built up were assumed.
The building is equipped with aluminium frames without thermal break with 4-9-4 glass and
green aluminium shutters. According to UNI 10077-1 [10], UNI 6946 [11], and [12-13] the
following thermo-physical parameters were calculated:
Glass transmittance: Ug = 2.8 W/m2K;
Frame transmittance: Uf = 7 W/m2K;
coefficient of thermal linear transmission: = 0.02 W/m2K;
SDEWES2014.0324-9
additional resistance of aluminium shutters:R = 0.20 m2K /W;
for each type of frame was calculated the respective value of transmittance Uw and the
different orientation.
Table 7. Thermo-physical and geometry properties of Windows (Sample C)
Types Description Number Width
[m]
Heigh
[m]
Uw
F1 one-wing Window 6 0.7 1.4 4.13
F2 two-wing Window 6 1.3 1.4 4.06
F3 one-wing little Window 6 0.85 1 4.13
PF1 two-wing Door-Window 14 1.2 2.3 3.98
Each apartment is equipped with an independent heating system with radiators and a natural
gas heater of about 24 kW. The single plant is controlled by an ON / OFF manual room
thermostat. Considering that each flat has an internal height of 2.7 m, the climate of
Castelbuono recommended about 30 W/m3 and that a single radiant element, for a
temperature difference of about 50 °C (plate-to-air), has a heat output of 196 W.
Also, in the ground floor, dedicated to commercial activities, are installed four heat pumps of
5.2 kW for heating power and 4.5 kW for cooling power (COP = 3.7).
In the sample C the following electrical loads have been estimated: n. 1 refrigerator; n. 1
washing machine, n. 1 dishwasher, 5W/ m2 incandescent lamps lighting; n. 1 PC, n. 2 TVs, n.
1 electric oven. It is assumed that four people occupy each apartment.
THERMAL PERFORMANCE AND ENERGY CONSUMPTION
Dynamic Simulation
The thermal analysis is used to assess the distribution of thermal heating and cooling loads for
each single thermal zone. For this reason, according to the actual conditions, to the
employment and use, to the orientation, and to the ratios of the glass/opaque surface, any
buildings were divided into several homogeneous thermal zones. The correct identification of
the thermal zones allows a rational description of the complex building-plant. In detail, the
following thermal zones have been identified.
Sample A
Zone 1. = Living area;
Zone 2. = Sleeping area;
Zone 3. = Basement floor (garage);
Zone 4. = Technical vacuum.
Sample B
Zone 1. = Ground floor and the first floor;
Zone 2. = Second floor and attic.
Sample C
Zone 1. = Basement floor;
Zone 2. = First and second floor;
Zone 3. = Under roof.
This approach has permitted to develop three models that describe the dynamic thermal
behaviour of the building under any environmental conditions; the used software is
TRNSYS.16 [14].
TRNSYS is one of the most diffused software for modelling the energy behaviour of a
building. To test, to design and to simulate the complex building-plant system, including the
SDEWES2014.0324-10
control strategies, and several alternative energy systems (wind, solar, photovoltaic, hydrogen
systems), etc, the software is used.
Energy performance of the actual state
For each sample, the heating and cooling thermal energy consumptions and the DHW
production have been analysed. The following schema described in Table 8 characterized the
consumptions and use of the electrical equipment:
Table 8. Consumption and use of electrical equipment
Types Electrical
Power
[W]
use Thermal
gains [W]
refrigerator 200 continuous 180
lighting 5 [W/m2] 3 h 30 min/day 4.5
[W/m2]
washing
machine
2000 4 washes/week at 60°C 1200
dishwasher 2000 4 washes/week 1800
television 100 4 h/day (without stand by) 90
oven 1000 4 times/week 1000
computer 100 2 h /day 90
refrigerator 200 continuous 180
Results of the status quo
Sample A: Status quo
Simulation Heating Cooling DHW
kWh Heat.
load
Primary
Energy
Cool.
Load
Primary
Energy
Primary
Energy without use of
electrical equipment 6825 7583 0 0 2799 3110
with use of electrical
equipment 6139 6921 0 0 2799 3110
On the bases of the heater and plants, it was valuated a global efficiency of 0.9; the electrical
consumptions in a year are more of 1972 kWh.
Sample B: Status quo
For this building, without any type of thermal plant, the study was carried out evaluating the
heating and cooling load to achieve comfort conditions. The DHW is provided by an electric
water boiler of 50 litres.
Simulation Heating Cooling DHW
kWh Heat. load Cool. Load
Primary Energy
without use of
electrical equipment 8622 185 1061
with use of electrical
equipment 8038 341 1061
SDEWES2014.0324-11
The estimated value of annual electricity consumption for the use of the equipment is 1,626
kWh, while for the production of DHW was estimated according to the following formula:
365HW p pQ m c n T (1)
Where:
m is the DHW rate required for a single person (at 50 l / day),
cp is the specific heat of water (4186 kJ / kgK),
np is the number of people;
T is the difference of temperature between the inlet and outlet water (25 °C),
365 are the days in a year.
Based on these considerations for Sample B was assessed an annual energy consumption of
1,061 kWh.
Sample C: Status quo
Simulation Heating Cooling DHW
kWh Heat. Load
(heater+HP
)
Primary
Energy
(heater)
Cool. Load Primary
Energy
Primary
Energy
without use of electrical equipment
25138
(17823+7315) 20254 7403 2001 7804 8868
with use of electrical
equipment 22519
(15626+6893) 17757 8269 2235 7804 8868
Depending on the heater type and on the type of thermal plant, a global efficiency of 0.88 was
evaluated. Concerning the energy consumption, Sample C needs an annual value of 13,710
kWh.
APPLICATION OF SOME KEY ACTIONS, PART OF THE NEW BUILDING
REGULATION PLAN
Based on the new building regulation plan of the City of Castelbuono some actions were
chosen:
Thematic Area 1: Performance of the building envelope;
Thematic Area 2: Energy Efficiency of Plant;
Thematic Area 3: Renewable Energy Sources.
These key actions were applied to all sample buildings.
Thematic Area 1: Performance of the building; it was decided to evaluate the actions related
to:
1.1 Orientation of the building
1.2 Thermal transmittance of opaque envelope components
1.3 Thermal transmittance of transparent components of the enclosure.
1.8 Eco-friendly materials
1.10 Ratio of heat exchanging Surface/ heated Volume (S/V)
In this case, some retrofitting actions that reduce the transmittance values of the opaque and
glazed surfaces have been implemented. Furthermore, according to the 1.8 eco-friendly
materials sheet, solutions that are efficient and at the same time able to reduce the
environmental impact were proposed. The ratio of S/V is calculated as the ratio between the
heat exchanging Surface (S) of the building and the heated volume (V). This parameter on the
1.10 sheet it was assessed for each sample.
SDEWES2014.0324-12
Thematic Area 2: Energy Efficiency of Equipment; it was chosen to evaluate:
2.1 High efficiency heat pumps
2.3 High efficiency heat pumps
2.5 Efficiency of lighting systems
2:10 Energy Performance Index of buildings [kWh/m2]
It was assessed the substitution of the actual heating and / or cooling plants with a high-
efficiency thermal systems and with an high-efficiency lighting systems. Finally, based on the
2:10 sheet, it was evaluated the primary energy demand before and after retrofit actions.
Depending on the S/V factor and the number of Degree Day (DD) it is possible to evaluate
the value of Limit Energy Performance for heating EPHlimit, defined by law [15-16]. The
EPHlimit was compared by the energy performance of the buildings EPH assessed in the
samples.
Thematic Area 3: Renewable Energy Sources, it was decided to evaluate the production of
thermal and electric energy from renewable sources, applying the following actions:
3.1.1 Production of domestic DHW with solar panels;
3.1.2 Photovoltaic panels.
Each sheet, and retrofit action, is associated with a score that allows getting monetary
incentives.
Application of some actions of thematic area A
In accordance with current legislation for the climate zone C, the limit transmittance values
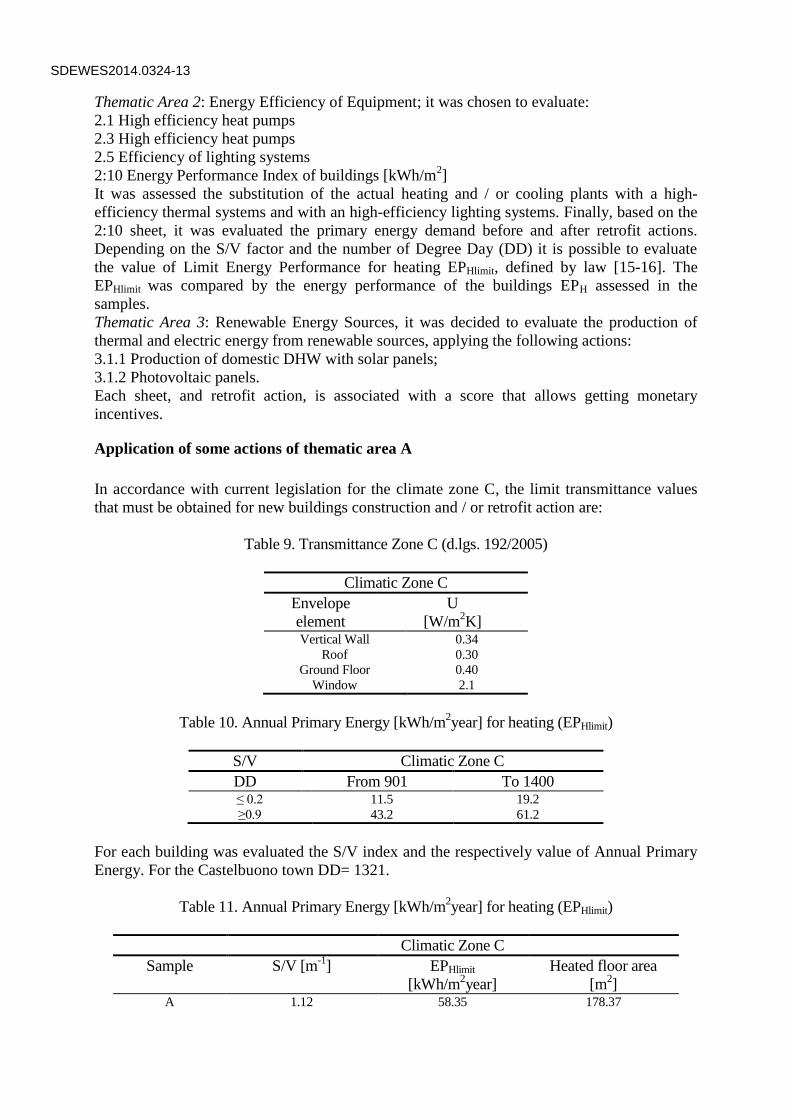
that must be obtained for new buildings construction and / or retrofit action are:
Table 9. Transmittance Zone C (d.lgs. 192/2005)
Climatic Zone C
Envelope
element
U
[W/m2K]
Vertical Wall 0.34
Roof 0.30
Ground Floor 0.40
Window 2.1
Table 10. Annual Primary Energy [kWh/m2year] for heating (EPHlimit)
S/V Climatic Zone C
DD From 901 To 1400 ≤ 0.2 11.5 19.2
≥0.9 43.2 61.2
For each building was evaluated the S/V index and the respectively value of Annual Primary
Energy. For the Castelbuono town DD= 1321.
Table 11. Annual Primary Energy [kWh/m2year] for heating (EPHlimit)
Climatic Zone C
Sample S/V [m-1
] EPHlimit
[kWh/m2year]
Heated floor area
[m2]
A 1.12 58.35 178.37
SDEWES2014.0324-13
B 0.32 24.91 173.88
C 0.54 37.59 834.75
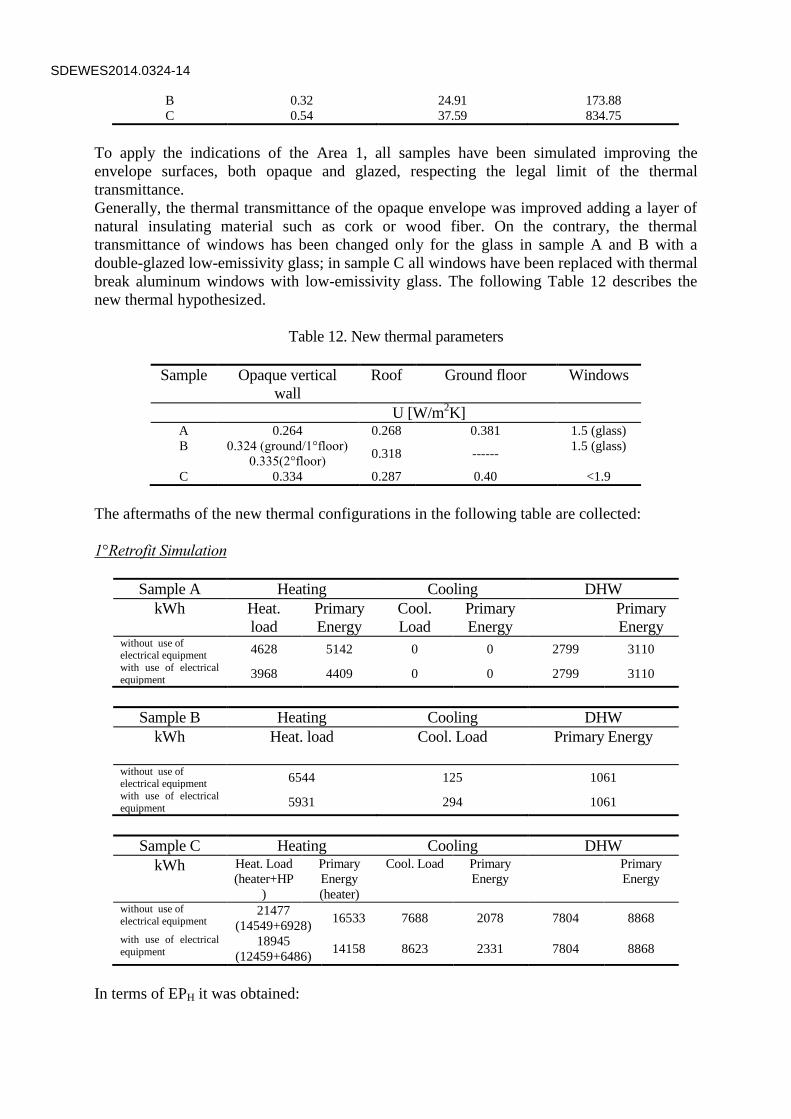
To apply the indications of the Area 1, all samples have been simulated improving the
envelope surfaces, both opaque and glazed, respecting the legal limit of the thermal
transmittance.
Generally, the thermal transmittance of the opaque envelope was improved adding a layer of
natural insulating material such as cork or wood fiber. On the contrary, the thermal
transmittance of windows has been changed only for the glass in sample A and B with a
double-glazed low-emissivity glass; in sample C all windows have been replaced with thermal
break aluminum windows with low-emissivity glass. The following Table 12 describes the
new thermal hypothesized.
Table 12. New thermal parameters
Sample Opaque vertical
wall
Roof Ground floor Windows
U [W/m2K]
A 0.264 0.268 0.381 1.5 (glass)
B 0.324 (ground/1°floor)
0.335(2°floor) 0.318 ------
1.5 (glass)
C 0.334 0.287 0.40 <1.9
The aftermaths of the new thermal configurations in the following table are collected:
1°Retrofit Simulation
Sample A Heating Cooling DHW
kWh Heat.
load
Primary
Energy
Cool.
Load
Primary
Energy
Primary
Energy without use of electrical equipment
4628 5142 0 0 2799 3110
with use of electrical
equipment 3968 4409 0 0 2799 3110
Sample B Heating Cooling DHW
kWh Heat. load Cool. Load
Primary Energy
without use of electrical equipment
6544 125 1061
with use of electrical
equipment 5931 294 1061
Sample C Heating Cooling DHW
kWh Heat. Load
(heater+HP
)
Primary
Energy
(heater)
Cool. Load Primary
Energy
Primary
Energy
without use of
electrical equipment 21477
(14549+6928) 16533 7688 2078 7804 8868
with use of electrical
equipment 18945
(12459+6486) 14158 8623 2331 7804 8868
In terms of EPH it was obtained:
SDEWES2014.0324-14
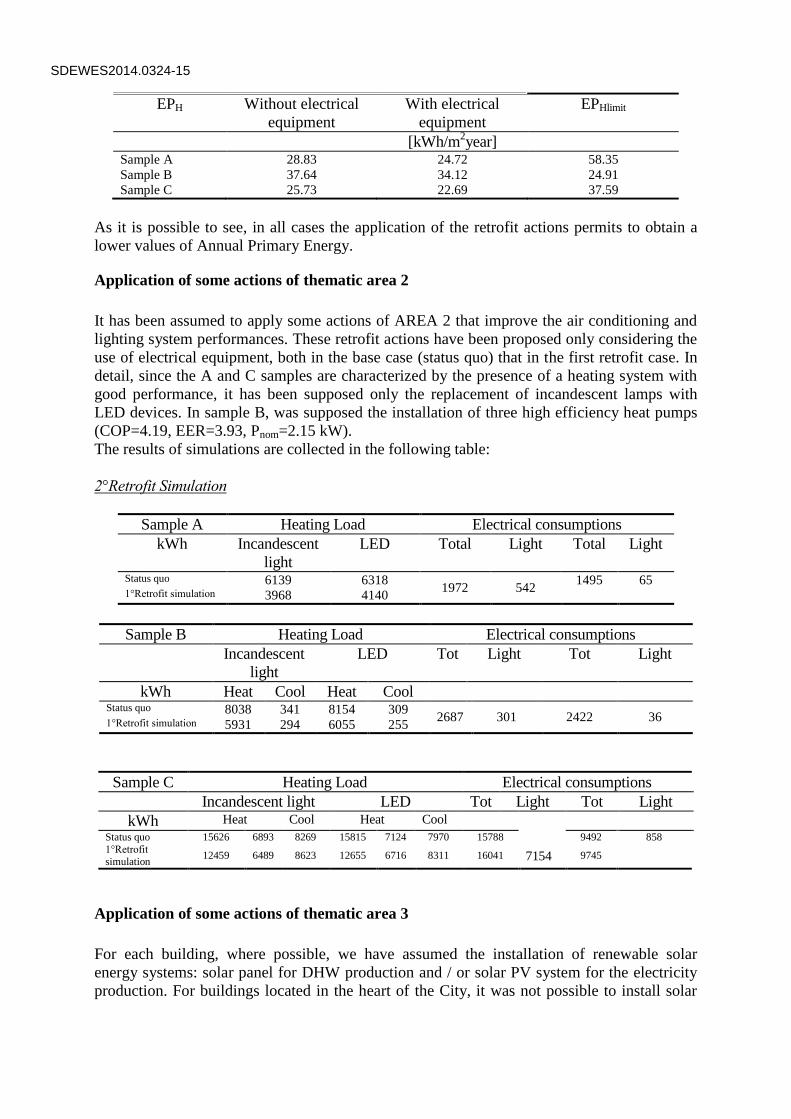
EPH Without electrical
equipment
With electrical
equipment
EPHlimit
[kWh/m2year]
Sample A 28.83 24.72 58.35
Sample B 37.64 34.12 24.91
Sample C 25.73 22.69 37.59
As it is possible to see, in all cases the application of the retrofit actions permits to obtain a
lower values of Annual Primary Energy.
Application of some actions of thematic area 2
It has been assumed to apply some actions of AREA 2 that improve the air conditioning and
lighting system performances. These retrofit actions have been proposed only considering the
use of electrical equipment, both in the base case (status quo) that in the first retrofit case. In
detail, since the A and C samples are characterized by the presence of a heating system with
good performance, it has been supposed only the replacement of incandescent lamps with
LED devices. In sample B, was supposed the installation of three high efficiency heat pumps
(COP=4.19, EER=3.93, Pnom=2.15 kW).
The results of simulations are collected in the following table:
2°Retrofit Simulation
Sample A Heating Load Electrical consumptions
kWh Incandescent
light
LED Total Light Total Light
Status quo 6139 6318 1972 542
1495 65 1°Retrofit simulation 3968 4140
Sample B Heating Load Electrical consumptions
Incandescent
light
LED Tot Light Tot Light
kWh Heat Cool Heat Cool Status quo 8038 341 8154 309
2687 301 2422 36 1°Retrofit simulation 5931 294 6055 255
Sample C Heating Load Electrical consumptions
Incandescent light LED Tot Light Tot Light
kWh Heat Cool Heat Cool
7154
Status quo 15626 6893 8269 15815 7124 7970 15788 9492 858
1°Retrofit
simulation 12459 6489 8623 12655 6716 8311 16041 9745
Application of some actions of thematic area 3
For each building, where possible, we have assumed the installation of renewable solar
energy systems: solar panel for DHW production and / or solar PV system for the electricity
production. For buildings located in the heart of the City, it was not possible to install solar
SDEWES2014.0324-15
devices due to national restrictions [17]. For this reason, it was not evaluated the integration
of RES in sample B.
The estimated monthly energy production has been evaluated by using the software System
Advisor Model (SAM).
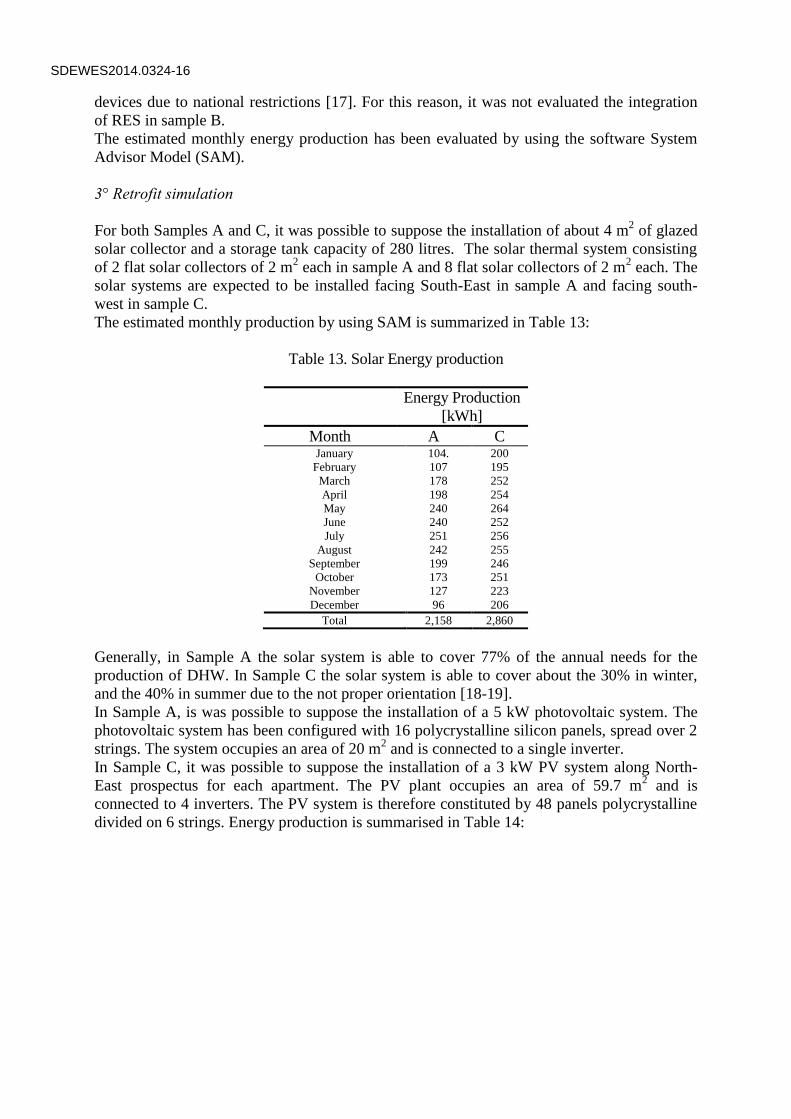
3° Retrofit simulation
For both Samples A and C, it was possible to suppose the installation of about 4 m2 of glazed
solar collector and a storage tank capacity of 280 litres. The solar thermal system consisting
of 2 flat solar collectors of 2 m2 each in sample A and 8 flat solar collectors of 2 m
2 each. The
solar systems are expected to be installed facing South-East in sample A and facing south-
west in sample C.
The estimated monthly production by using SAM is summarized in Table 13:
Table 13. Solar Energy production
Energy Production
[kWh]
Month A C January 104. 200
February 107 195
March 178 252
April 198 254
May 240 264
June 240 252
July 251 256
August 242 255
September 199 246
October 173 251
November 127 223
December 96 206
Total 2,158 2,860
Generally, in Sample A the solar system is able to cover 77% of the annual needs for the
production of DHW. In Sample C the solar system is able to cover about the 30% in winter,
and the 40% in summer due to the not proper orientation [18-19].
In Sample A, is was possible to suppose the installation of a 5 kW photovoltaic system. The
photovoltaic system has been configured with 16 polycrystalline silicon panels, spread over 2
strings. The system occupies an area of 20 m2 and is connected to a single inverter.
In Sample C, it was possible to suppose the installation of a 3 kW PV system along North-
East prospectus for each apartment. The PV plant occupies an area of 59.7 m2 and is
connected to 4 inverters. The PV system is therefore constituted by 48 panels polycrystalline
divided on 6 strings. Energy production is summarised in Table 14:
SDEWES2014.0324-16
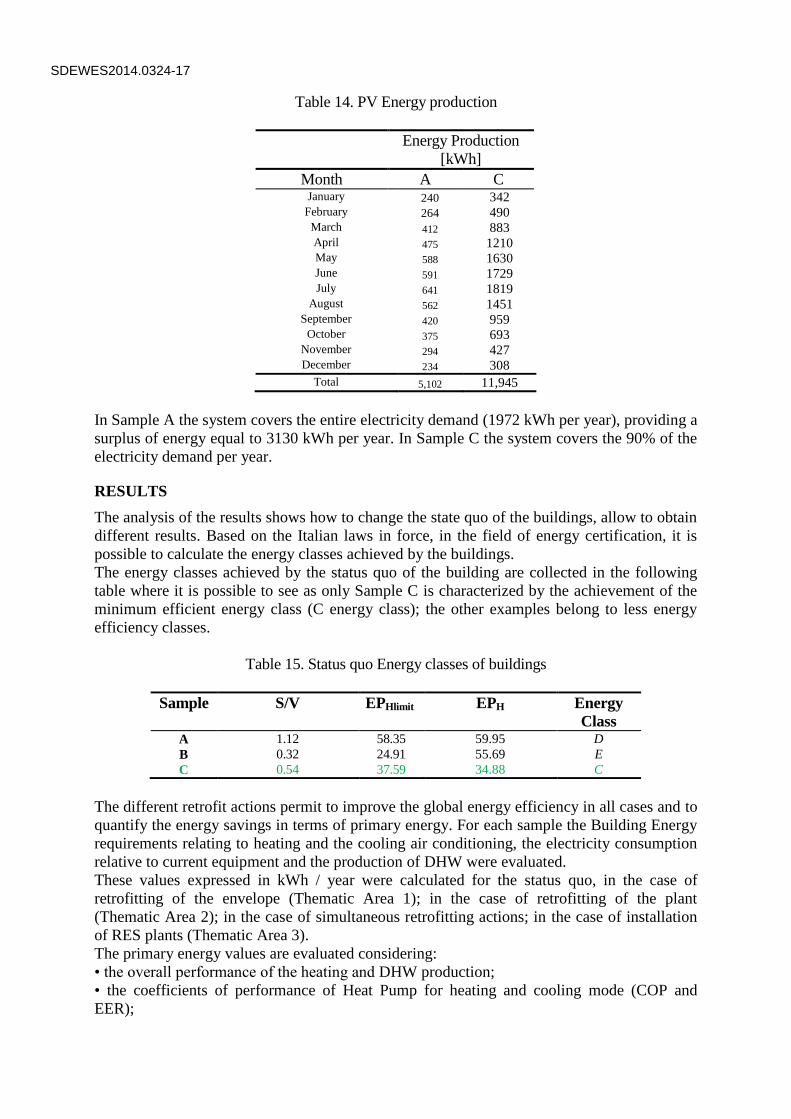
Table 14. PV Energy production
Energy Production
[kWh]
Month A C January 240 342
February 264 490 March 412 883 April 475 1210 May 588 1630 June 591 1729 July 641 1819
August 562 1451 September 420 959
October 375 693 November 294 427 December 234 308
Total 5,102 11,945
In Sample A the system covers the entire electricity demand (1972 kWh per year), providing a
surplus of energy equal to 3130 kWh per year. In Sample C the system covers the 90% of the
electricity demand per year.
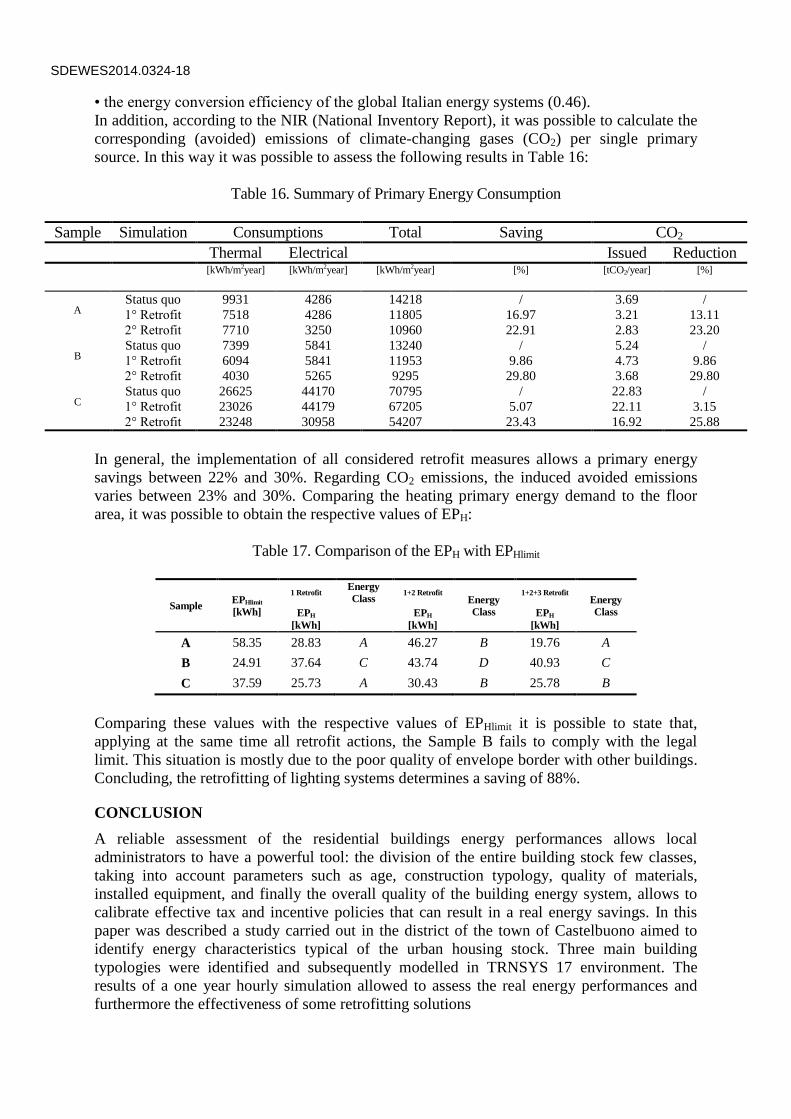
RESULTS
The analysis of the results shows how to change the state quo of the buildings, allow to obtain
different results. Based on the Italian laws in force, in the field of energy certification, it is
possible to calculate the energy classes achieved by the buildings.
The energy classes achieved by the status quo of the building are collected in the following
table where it is possible to see as only Sample C is characterized by the achievement of the
minimum efficient energy class (C energy class); the other examples belong to less energy
efficiency classes.
Table 15. Status quo Energy classes of buildings
Sample S/V EPHlimit EPH Energy
Class A 1.12 58.35 59.95 D
B 0.32 24.91 55.69 E
C 0.54 37.59 34.88 C
The different retrofit actions permit to improve the global energy efficiency in all cases and to
quantify the energy savings in terms of primary energy. For each sample the Building Energy
requirements relating to heating and the cooling air conditioning, the electricity consumption
relative to current equipment and the production of DHW were evaluated.
These values expressed in kWh / year were calculated for the status quo, in the case of
retrofitting of the envelope (Thematic Area 1); in the case of retrofitting of the plant
(Thematic Area 2); in the case of simultaneous retrofitting actions; in the case of installation
of RES plants (Thematic Area 3).
The primary energy values are evaluated considering:
• the overall performance of the heating and DHW production;
• the coefficients of performance of Heat Pump for heating and cooling mode (COP and
EER);
SDEWES2014.0324-17
• the energy conversion efficiency of the global Italian energy systems (0.46).
In addition, according to the NIR (National Inventory Report), it was possible to calculate the
corresponding (avoided) emissions of climate-changing gases (CO2) per single primary
source. In this way it was possible to assess the following results in Table 16:
Table 16. Summary of Primary Energy Consumption
Sample Simulation Consumptions Total Saving CO2
Thermal Electrical Issued Reduction
[kWh/m2year] [kWh/m2year] [kWh/m2year] [%] [tCO2/year] [%]
A Status quo 9931 4286 14218 / 3.69 /
1° Retrofit 7518 4286 11805 16.97 3.21 13.11
2° Retrofit 7710 3250 10960 22.91 2.83 23.20
B Status quo 7399 5841 13240 / 5.24 /
1° Retrofit 6094 5841 11953 9.86 4.73 9.86
2° Retrofit 4030 5265 9295 29.80 3.68 29.80
C Status quo 26625 44170 70795 / 22.83 /
1° Retrofit 23026 44179 67205 5.07 22.11 3.15
2° Retrofit 23248 30958 54207 23.43 16.92 25.88
In general, the implementation of all considered retrofit measures allows a primary energy
savings between 22% and 30%. Regarding CO2 emissions, the induced avoided emissions
varies between 23% and 30%. Comparing the heating primary energy demand to the floor
area, it was possible to obtain the respective values of EPH:
Table 17. Comparison of the EPH with EPHlimit
Sample EPHlimit
[kWh]
1 Retrofit Energy
Class 1+2 Retrofit
Energy
Class
1+2+3 Retrofit Energy
Class EPH
[kWh]
EPH
[kWh]
EPH
[kWh]
A 58.35 28.83 A 46.27 B 19.76 A
B 24.91 37.64 C 43.74 D 40.93 C
C 37.59 25.73 A 30.43 B 25.78 B
Comparing these values with the respective values of EPHlimit it is possible to state that,
applying at the same time all retrofit actions, the Sample B fails to comply with the legal
limit. This situation is mostly due to the poor quality of envelope border with other buildings.
Concluding, the retrofitting of lighting systems determines a saving of 88%.
CONCLUSION
A reliable assessment of the residential buildings energy performances allows local
administrators to have a powerful tool: the division of the entire building stock few classes,
taking into account parameters such as age, construction typology, quality of materials,
installed equipment, and finally the overall quality of the building energy system, allows to
calibrate effective tax and incentive policies that can result in a real energy savings. In this
paper was described a study carried out in the district of the town of Castelbuono aimed to
identify energy characteristics typical of the urban housing stock. Three main building
typologies were identified and subsequently modelled in TRNSYS 17 environment. The
results of a one year hourly simulation allowed to assess the real energy performances and
furthermore the effectiveness of some retrofitting solutions
SDEWES2014.0324-18

The values of energy consumption obtained by an accurate modelling of buildings and
installations were compared with the minimum values ruled by the regional laws; in some
cases it has been shown that the poor quality of the materials used for the building envelope
makes useless or unprofitable the application incentives for renewable energy plants.
The methodology described in the case study of Castelbuono is an example of an analysis
model that can be replicated in any other context, and that can represent a valuable decision
support tool for local governments to measure the sharpness of tax and incentives policies to
improve the energy efficiency the building stock and in order to guide the municipality in the
drafting of a modern and efficient building regulation plan.
SDEWES2014.0324-19
REFERENCES
1. D.P.R. 26 Agosto 1993, n. 412. “Regolamento recante norme per la progettazione,
l'installazione, l'esercizio e la manutenzione degli impianti termici degli edifici ai fini del
contenimento dei consumi di energia, in attuazione dell'art. 4, comma 4, della L. 9
gennaio 1991, n. 10”
2. Decreto legislativo 19 agosto 2005, n. 192: "Attuazione della direttiva 2002/91/CE
relativa al rendimento energetico nell’edilizia"
3. UNI 10349 "Heating and cooling of buildings" Riscaldamento e raffrescamento degli
edifici - Dati climatici
4. Masotti, C. (2012). Comfort estivo e risparmio energetico in architettura. Maggioli
Editore.
5. Remund, J., & Kunz, S. (1997). METEONORM: Global meteorological database for
solar energy and applied climatology. Meteotest.
6. Remund, J., Müller, S. C., Schilter, C., & Rihm, B. (2010, September). The use of
Meteonorm weather generator for climate change studies. In 10th EMS Annual Meeting,
10th European Conference on Applications of Meteorology (ECAM) Abstracts, held
Sept. 13-17, 2010 in Zürich, Switzerland. http://meetings. copernicus. org/ems2010/, id.
EMS2010-417 (Vol. 1, p. 417).
7. Boland, J., Huang, J., & Ridley, B. (2013). Decomposing global solar radiation into its
direct and diffuse components. Renewable and Sustainable Energy Reviews, 28, 749-
756.
8. Ciulla, G., Lo Brano, V., & Orioli, A. (2010). A criterion for the assessment of the
reliability of ASHRAE conduction transfer function coefficients. Energy and Buildings,
42(9), 1426-1436.
9. Beccali, G., Cellura, M., Brano, V. L., & Orioli, A. (2005). Is the transfer function
method reliable in a European building context? A theoretical analysis and a case study
in the south of Italy. Applied thermal engineering, 25(2), 341-357
10. UNI 10077-1:2007 Prestazione termica di finestre, porte e chiusure oscuranti - Calcolo
della trasmittanza termica - Parte 1: Generalità
11. UNI 6946: 2008, Componenti ed elementi per edilizia - Resistenza termica e trasmittanza
termica - Metodo di calcolo
12. Ardente, F., Beccali, M., Cellura, M., & Mistretta, M. (2011). Energy and environmental
benefits in public buildings as a result of retrofit actions. Renewable and Sustainable
Energy Reviews, 15(1), 460-470.
13. Cellura, M., Ciulla, G., Lo Brano, V., Orioli, A., Campanella, L., Guarino, F., &
Cesarini, D. N. (2011). The Redesign of an Italian Building to Reach Net Zero Energy
Performances: A Case Study of the SHC Task 40-ECBCS Annex 52. ASHRAE
transactions, 117(2).
14. Klein, S. A., Beckman, W. A., Mitchell, J. W., Duffie, J. A., Duffie, N. A., Freeman, T.
L., & Kummert, M. (2004). TRNSYS 16–A TRaNsient system simulation program, user
manual. Solar Energy Laboratory. Madison: University of Wisconsin-Madison.
15. Decreto legislativo 29 dicembre 2006, n.311 Disposizioni correttive ed integrative al
decreto legislativo 19 agosto 2005, n. 192, recante attuazione della direttiva 2002/91/CE,
relativa al rendimento energetico nell'edilizia.
16. Decreto edifici: DECRETO 19 febbraio 2007 come modificato dal decreto 26 ottobre
2007 e coordinato con il decreto 7 aprile 2008 e con il decreto 6 agosto 2009 -
Disposizioni in materia di detrazioni per le spese di riqualificazione energetica del
patrimonio edilizio esistente, ai sensi dell'art. 1, comma 349 della legge 27 dicembre
2006, n. 296
SDEWES2014.0324-20

17. Lo Brano, V., & Ciulla, G. (2013). An efficient analytical approach for obtaining a five
parameters model of photovoltaic modules using only reference data. Applied Energy,
111, 894-903.
18. Ciulla, G., Lo Brano, V., Moreci, E. (2013). Forecasting the cell temperature of PV
modules with an adaptive system. International Journal of Photoenergy, 2013.
19. Lo Brano, V., Ciulla, G., Piacentino, A., & Cardona, F. (2013). On the Efficacy of PCM
to Shave Peak Temperature of Crystalline Photovoltaic Panels: An FDM Model and
Field Validation. Energies, 6(12), 6188-6210
SDEWES2014.0324-21
Related Documents