Discovery & CO+CO2 Bauer et al. 2015 1 9/28/15 12:07 PM The NEOWISEDiscovered Comet Population and the CO+CO2 production rates. James M. Bauer 1,2 , Rachel Stevenson 1 , Emily Kramer 1 , A. K. Mainzer 1 ,Tommy Grav 3 , Joseph R. Masiero 1 , Yan R. Fernández 4 , Roc M. Cutri 2 , John W. Dailey 2 , Frank J. Masci 2 , Karen J. Meech 5,6 , Russel Walker 7 , C. M. Lisse 8 , Paul R. Weissman 1 , Carrie R. Nugent 1 , Sarah Sonnett 1 , Nathan Blair 2 , Andrew Lucas 2 , Robert S. McMillan 9 , Edward L. Wright 10 , and the WISE and NEOWISE Teams 1 Jet Propulsion Laboratory, California Institute of Technology, 4800 Oak Grove Drive, MS 183-401, Pasadena, CA 91109 (email: [email protected]) 2 Infrared Processing and Analysis Center, California Institute of Technology, Pasadena, CA 91125 3 Planetary Science Institute, 1700 East Fort Lowell, Suite 106, Tucson, AZ 85719-2395 4 Department of Physics, University of Central Florida, 4000 Central Florida Blvd., P.S. Building, Orlando, FL 32816-2385 5 Institute for Astronomy, University of Hawaii, 2680 Woodlawn Dr., Manoa, HI 96822 6 NASA Astrobiology Institute, Institute for Astronomy, University of Hawaii, Manoa, HI 96822 7 Monterey Institute for Research in Astronomy, 200 Eighth Street, Marina, CA 93933 8 Applied Physics Laboratory, Johns Hopkins University, 11100 Johns Hopkins Road Laurel, MD 20723--‐6099 9 Lunar and Planetary Laboratory, University of Arizona, 1629 East University Blvd., Kuiper Space Science Bldg. 92, Tucson, AZ 85721-0092, 10 Department of Physics and Astronomy, University of California, PO Box 91547, Los Angeles, CA 90095-1547 Submitted to Astrophysical Journal May 1, 2015, revised September 2, 2015. Abstract: The 163 comets observed during the WISE/NEOWISE prime mission represent the largest infrared survey to date of comets, providing constraints on dust, nucleus sizes, and CO+CO2 production. We present detailed analyses of the WISE/NEOWISE comet discoveries, and discuss observations of the active comets

Welcome message from author
This document is posted to help you gain knowledge. Please leave a comment to let me know what you think about it! Share it to your friends and learn new things together.
Transcript

Discovery & CO+CO2 Bauer et al. 2015
1 9/28/15 12:07 PM
The NEOWISE-‐Discovered Comet Population and the CO+CO2 production rates.
James M. Bauer1,2, Rachel Stevenson1, Emily Kramer1, A. K. Mainzer1,Tommy Grav3, Joseph R. Masiero1, Yan R. Fernández4, Roc M. Cutri2, John W. Dailey2, Frank J. Masci2, Karen J. Meech5,6, Russel Walker7, C. M. Lisse8, Paul R. Weissman1, Carrie R. Nugent1,
Sarah Sonnett1, Nathan Blair2, Andrew Lucas2, Robert S. McMillan9, Edward L. Wright10, and the WISE and NEOWISE Teams
1Jet Propulsion Laboratory, California Institute of Technology, 4800 Oak Grove Drive, MS 183-401, Pasadena, CA 91109 (email: [email protected]) 2Infrared Processing and Analysis Center, California Institute of Technology, Pasadena, CA 91125 3Planetary Science Institute, 1700 East Fort Lowell, Suite 106, Tucson, AZ 85719-2395 4Department of Physics, University of Central Florida, 4000 Central Florida Blvd., P.S. Building, Orlando, FL 32816-2385 5Institute for Astronomy, University of Hawaii, 2680 Woodlawn Dr., Manoa, HI 96822 6NASA Astrobiology Institute, Institute for Astronomy, University of Hawaii, Manoa, HI 96822 7Monterey Institute for Research in Astronomy, 200 Eighth Street, Marina, CA 93933 8 Applied Physics Laboratory, Johns Hopkins University, 11100 Johns Hopkins Road Laurel, MD 20723--‐6099 9Lunar and Planetary Laboratory, University of Arizona, 1629 East University Blvd., Kuiper Space Science Bldg. 92, Tucson, AZ 85721-0092, 10Department of Physics and Astronomy, University of California, PO Box 91547, Los Angeles, CA 90095-1547 Submitted to Astrophysical Journal May 1, 2015, revised September 2, 2015. Abstract: The 163 comets observed during the WISE/NEOWISE prime mission
represent the largest infrared survey to date of comets, providing constraints on
dust, nucleus sizes, and CO+CO2 production. We present detailed analyses of the
WISE/NEOWISE comet discoveries, and discuss observations of the active comets

Discovery & CO+CO2 Bauer et al. 2015
2 9/28/15 12:07 PM
showing 4.6 µm band excess. We find a possible relation between dust and CO+CO2
production, as well as possible differences in the sizes of long and short period
comet nuclei.
1 Introduction
When the Wide-‐field Infrared Survey Explorer (WISE) mission was launched on 14
December 2009, the complete sky had not been surveyed at thermal infrared (IR)
wavelengths since IRAS. The primary purpose of the WISE mission was to conduct
an all-‐sky survey at 3.4, 4.6, 12, and 22 µm (referred to as W1, W2, W3, and W4) at
unprecedented sensitivity and spatial resolution (Wright et al. 2010). An
enhancement to the WISE mission was funded by NASA’s Planetary Science Division,
called NEOWISE, to detect moving objects in the data and to develop a searchable
archive of moving object photometry and images to facilitate precovery and analysis
of subsequent discoveries (Mainzer et al. 2011c, 2012a). Both aspects of NEOWISE
were successful, with over 158,000 small bodies observed including 34000
discoveries. More than 616 NEOs were detected (Mainzer et al. 2012a) during the
prime mission, from January 14, 2010 through February 1, 2011. NEOWISE has
provided the largest catalog of thermal-‐infrared solar-‐system object data to date.
The observations have yielded an unprecedented number of size measurements for
a wide array of classes of solar system bodies using radiometric modeling
techniques (cf. Bauer et al. 2013, Bauer et al. 2012a, Bauer et al. 2012b, Bauer et al.
2011, Mainzer et al. 2011a, Mainzer et al. 2011b, Mainzer et al. 2011c, Masiero et al.
2011, Masiero et al. 2012, Grav et al. 2011, Grav et al. 2012). However, NEOWISE

Discovery & CO+CO2 Bauer et al. 2015
3 9/28/15 12:07 PM
also observed the largest number of comets to date in the IR; a total of 163 comets
have been identified in the data, a sample that offers a unique set of constraints on
cometary physical properties. In addition to measuring the nucleus size distribution
of comets, the data are used to quantify dust characteristics and mass loss, as well as
gas production of rarely-‐observed species (Bauer et al. 2011, Bauer et al. 2012b;
Stevenson et al. 2014, Stevenson et al. 2015).
The WISE/NEOWISE survey began regular survey operations on 14 January 2010
(Modified Julian Date [MJD] 55210). The secondary cryogen reservoir of solid
hydrogen was depleted on 4 August 2010 (MJD 55412), resulting soon after in the
saturation of the W4 channel. The survey then continued in W1-‐3, the so-‐called 3-‐
band cryogenic phase, until the primary reservoir was depleted at the end of
September 2010 (MJD 55469). After this, science survey operations were extended
for the next 4 months in the W1 and W2 until 1 February 2011 (MJD 55593), when
the “post-‐cryogenic” mission phase ended (Mainzer et al. 2012, Masiero et al. 2012).
At this point the spacecraft was placed into a hibernation state. The success of
NEOWISE in this first period, a little more than a year of survey operations referred
to as the “prime mission”, led to the decision to restart the WISE spacecraft and the
survey in 2013 exclusively for the purposes of surveying solar system bodies. The
reactivated spacecraft was renamed NEOWISE, after the planetary mission, and the
survey has been underway since 23 December 2013 (MJD 56649; Mainzer et al.
2014). Since the reactivation, NEOWISE has detected > 12000 minor planets,
including 260 NEOs and 63 comets at 3.4 and 4.6 µm.

Discovery & CO+CO2 Bauer et al. 2015
4 9/28/15 12:07 PM
1.1 WISE/NEOWISE Cometary Discoveries:
During the cryogenic mission, NEOWISE was the most prolific discoverer of comets,
other than the sun-‐grazing comets observed by SOHO. NEOWISE discovered 18
comets during the prime mission and discovered activity on an additional three
small bodies. Since the beginning of the reactivated mission, NEOWISE has
discovered four additional comets.1 For the prime mission discoveries, about half of
the comets are designated long-‐period comets (LPCs; comets with orbital periods
>200 years). For the reactivated mission half of the comets discovered are LPCs.
The new NEOWISE comets (see Figure 1) form an interesting population that has
been discovered based on their thermal emission in the infrared, rather than
reflected visible light. This is particularly important as the low albedos of the nuclei
(Lamy et al. 2004) and potentially the darker refractory grains (Bauer et al. 2012b)
make discovery in reflected light difficult until cometary activity increases the
brightness dramatically upon approach to perihelion. The large-‐grain dust
component may be comprised of dark, refractory grains that facilitate detection and
study at IR wavelengths out to greater distances than can be reached by reflected
light. Finally, strong gas emission lines of CO (4.67 µm) and CO2 (4.23 µm) fall within
the NEOWISE 4.6 µm channel (≥80% peak throughput from 4.13 to 5.14 µm; Wright
et al. 2010), allowing abundance constraints to be set on these species. CO is
otherwise only observable from the ground for bright comets, or if the comet’s
1 2010 KG43 is not included in this tally, since while activity has been reported (Waszczac et al. 2013), it has not been designated as a comet yet. The NEOWISE observations of this body are discussed in that reference. On 15 May, 2015, the NEOWISE reactivated mission discovered its 4th comet, P/2015 J3.
Discovery & CO+CO2 Bauer et al. 2015
5 9/28/15 12:07 PM
geocentric velocity is large enough that the comet lines are sufficiently Doppler
shifted from their telluric counterparts (cf. Dello Russo et al. 2009). Emitted CO2 is
only detectable directly from space (Bockelee-‐Morvan et al. 2004). In this paper, we
describe this NEOWISE-‐discovered population in detail, including analysis of the
dust, constraints on the nucleus sizes, and gas production rates of various species.
We provide a wider context for the CO+CO2 analyses by exploring the CO+CO2
production in the full comet sample from the 163 comets, roughly a quarter of
which show 4.6 µm band excess attributable to CO or CO2 gas emission. Because the
NEOWISE W2 band encompasses both CO and CO2 features, it is difficult to separate
their relative contributions; however, CO is generally more than a factor of 11 times
weaker than the CO2 feature (see section 4.6).
1.2 CO+CO2 production rates:
Where H2O-‐driven sublimation begins beyond 6 AU and can lift optically detectable
sub-‐micron dust, comets are variable objects that become obviously active typically
somewhere inside 4 AU when they cross the point at which water-‐ice sublimation
becomes the dominant driver of activity (Meech & Svøren, 2004). However, the
exact details of when and how active they will become remains difficult to predict as
these events are sensitive to variations in their compositions. In the outer solar
system, water-‐ice is very common, yet other common ices exist as well that can
sublimate rapidly at distances greater than 4 AU. For the last several decades,
comets have been grouped into dust-‐rich and gas-‐rich categories that may not
Discovery & CO+CO2 Bauer et al. 2015
6 9/28/15 12:07 PM
necessarily correlate with their dynamical age or origin (A’Hearn et al. 1995). In
most circumstances, water-‐ice sublimation likely drives their activity near
perihelion, but at larger distances other common volatile constituents like CO and
CO2 may be the primary driver. Recent studies have shown that the CO or CO2
production rate relative to H2O increases with heliocentric distance (A’Hearn et al.
2012), but these analyses are based on a limited sample. Some in-‐situ
measurements, for example with comet 103P/Hartley 2 (cf. A’Hearn et al. 2011),
suggest different source regions for CO2 and H2O on the surface. To date, only 40
comets have had their CO or CO2 production rates constrained from space-‐based
observations (cf. Bockelee-‐Morvan et al. 2004, Pittichova et al. 2008, Ootsubo et al.
2012, Reach et al. 2013, Bauer et al. 2011 & 2012b). The NEOWISE sample
represents a uniform survey of CO+CO2 production collected with a single space-‐
based instrument with consistent instrumental response. This sample nearly
doubles the sample of measured CO+CO2 production rates in comets reported in the
literature. Moreover, the 12 and 22 µm channel observations set firmer constraints
on the nucleus and dust contributions to the signal than do 2-‐band constraints such
as those provided by Spitzer Space Telescope (SST; Reach et al. 2013), allowing the
gas contribution to be separated.
2 Observations
2.1 WISE spacecraft observations.

Discovery & CO+CO2 Bauer et al. 2015
7 9/28/15 12:07 PM
During the fully cryogenic portion of the mission, simultaneous exposures in the
four WISE wavelength bands were taken once every 11 s, with exposure durations
of 8.8 s in W3 and W4, and 7.7 s in W1 and W2 (Wright et al. 2010). The number of
exposures acquired for each moving object depends on its rate of motion across the
sky, as well as the rate of survey progression. A total of 8 exposures were collected
for areas on the sky on the ecliptic on average at each pass, rising to several
hundreds of exposures near the ecliptic poles. For most moving objects, this
cadence resulted in collecting ~12 exposures uniformly spaced over ~36 hours
(Mainzer et al. 2011a; Cutri et al. 2012). Note that WISE may have observed a subset
of its full sample of observations of any particular solar system object while it was in
different parts of the sky, i.e., when several weeks or months had passed since the
previous exposure (e.g., comet 67P; Bauer et al. 2012b), often providing data at
different viewing geometries. Henceforth, we refer to the series of exposures
containing the object in the same region of sky as a “visit”, or “epoch”. The spatial
resolution in the WISE images varies with the wavelength of the band. The FWHM of
the mean point-‐spread-‐function (PSF), in units of arcseconds was 6.1, 6.4, 6.5, and
12.0 arcsec for W1, W2, W3, and W4, respectively (Wright et al. 2010; Cutri et al.
2012).
As with the comets we have previously studied (Bauer et al. 2011, 2012a, 2012c),
some analysis was improved by stacking at the objects’ rates of motion to increase
the signal-‐to-‐noise ratio (SNR). For each body, the images were identified using the
WISE image server (http://irsa.ipac.caltech.edu/applications/wise), as described by
Cutri et al. (2012). Images were stacked using the moving object routine, “A WISE

Discovery & CO+CO2 Bauer et al. 2015
8 9/28/15 12:07 PM
Astronomical Image Co-‐adder” (AWAIC; Masci & Fowler 2009). Figure 1 shows the
variation in morphology of the subset of cometary objects discovered by
WISE/NEOWISE.
During the fully cryogenic prime mission, 163 comets were detected by
WISE/NEOWISE with an SNR ≥ 5 in the stacked image from at least one band. Of
these, 94 were detected with an SNR ≥ 5 in single-‐exposure images by the WISE
moving-‐object pipeline sub-‐system (WMOPS). The additional 69 comets were found
by co-‐adding the exposures at each visit. Of the comets detected, 57 were LPCs and
106 were short-‐period comets (SPCs; comets with orbital periods <200 years),
according to present designations.2
We report here on the comets discovered by WISE/NEOWISE. We also discuss the
total sample of comets that show 4.6 µm excess, likely attributable to CO+CO2
emission. A summary of their WISE/NEOWISE observations are shown in Table 1.
Note that LPCs are indicated by a “C/” prefix to their designations.
2 JPL’s Horizon’s ephemeris service; http://ssd.jpl.nasa.gov

Discovery & CO+CO2 Bauer et al. 2015
9 9/28/15 12:07 PM
2.2 Discovery Objects
As of June, 2015, there were a total of 25 cometary body discoveries made by data
from the WISE spacecraft. These include three distinct categories. Comets 237P,
Figure 1: Discovery images of WISE/NEOWISE comets shown in 3-‐colors. The prime mission comets have the 22 µm image mapped to the image’s red channel, the 12 µm image mapped to green, and the 4.6 µm image mapped to blue. The comets for which the activity, and not the object, were discovered by NEOWISE are shown with blue labels, in the upper left. In the case of the four comets discovered to date by the NEOWISE Reactivation (yellow text labels, on the bottom row), the 4.6 µm image is mapped to red, and the 3.4 µm image to both green and blue. The images are 6 arcmin on a side. The comets span a wide range of morphologies and activity levels; over half are LPCs.
C/2010&G3&(WISE)&
C/2010&E3&(WISE)&C/2010&D3&(WISE)& C/2010&D4&(WISE)&C/2010&D2&(WISE)& C/2010&DG56&(WISE)&
P/2010&D1&(WISE)&P/2010&B2&(WISE)&P/2009&WX51&(Catalina)&
C/2010&L4&(WISE)&
C/2010&FB87&(GarraddBWISE)& C/2010&J4&(WISE)*&
237P/LINEAR&(2002&LN13)&
245P/2010&L1&(WISE)&
P/2010&K2&(WISE)&
C/2010&L5&(WISE)*& P/2010&P4&(WISE)&P/2010&N1&(WISE)&
233P/La&Sagra&(2009&WJ50)&
&C/2010&KW7&(WISE)&
P/2010&JC81&(WISE)& C/2014&C3&(NEOWISE)& P/2014&L2&(NEOWISE)& C/2014&N3&(NEOWISE)& P/2015&J3&(NEOWISE)&

Discovery & CO+CO2 Bauer et al. 2015
10 9/28/15 12:07 PM
233P, and P/2009 WX51 (Catalina) were known objects at the time of the discovery
of their activity, but were not known to be previously active. NEOWISE reported
coma and trails for these objects as they were imaged during the prime mission.
Additionally, WISE discovered 18 new comets during the prime mission, which were
named for the spacecraft discovery. These two groups represent a significantly
different sample apart from other cometary discoveries, since each comet, or its
active nature, was first discovered at thermal IR wavelengths, while comets
discovered from ground-‐based telescopes are selected based on optical
observations. Note that this sample could include a further member, 2010 KG43, a
body on a centaur-‐like orbit that was reported to have activity when viewed by the
Palomar Transient Survey (Wasczac et al. 2013). The WISE discovery observations
of this object, taken at a significantly different epoch, showed no coma or extended
emission.
In the first year, the reactivated NEOWISE mission has discovered three new active
comets. These comets (each called NEOWISE) were discovered from their 4.6 µm
signal, and so may have yet a different set of selection biases apart from those found
in the prime mission or ground-‐based searches. A fourth comet, P/2015 J3
(NEOWISE) was discovered on 15 May, 2015, after the first submission of this
manuscript.
2.3 Comets with significant 4.6 µm signal
Throughout the fully cryogenic portion of the WISE/NEOWISE mission most comets

Discovery & CO+CO2 Bauer et al. 2015
11 9/28/15 12:07 PM
exhibited their highest signal-‐to-‐noise ratio in the 12 and 22 µm channels, as the
dust, often dark and composed of refractory grains (cf. Bauer et al. 2011 and Bauer
et al 2012b), provided strong thermal signal relative to the background. However, a
total of 56 comets showed some signal in the 4.6 µm channel, and often also at 3.4
µm. While dust thermal emission dominates the 12 and 22 µm bands, the 3.4 µm
channel is dominated by the reflected light of the dust. Weak molecular emission
lines, primarily from O-‐H and C-‐H related species, fall within this channel, but this
signal typically is significantly less than that of the dust signal, i.e. ~30% or less of
the total signal (cf. Bockelee-‐Morvan 1995, Reach et al. 2013). However, strong
molecular emission lines of CO (4.67 µm) and CO2 (4.23 µm) exist within the 4.6 µm
bandpass (cf. Pittichova et al. 2008, Bauer et al. 2011, and Reach et al. 2013). The
CO and CO2 emission bands are strong enough to manifest excess flux within the 4.6
µm channel, apparent when the dust signal contribution is constrained by the 3.4
µm signal and the 12 and 22 µm thermal flux. Often, there are additional
morphological differences between the 4.6 µm signal and the other bands. Moreover,
the shape of the comets in the 3.4 µm channel often matches better the 12 and 22
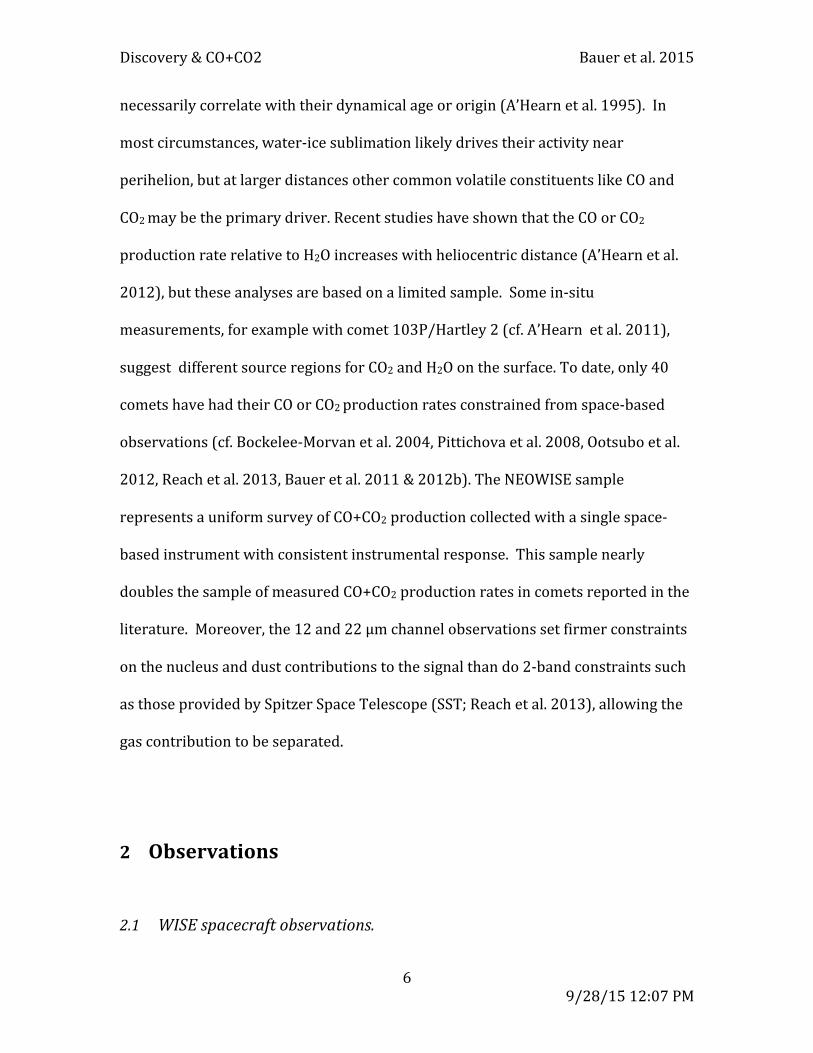
µm signal, likely attributable to dust (Figure 2).
Discovery & CO+CO2 Bauer et al. 2015
12 9/28/15 12:07 PM
A total of 39 comets observed during the prime mission exhibited 4.6 µm band flux
excess, attributable to CO to CO2 emission; two of the comets, C/2009 K5 and
Figure 2: Morphological differences for comet C/2007 Q3 (Siding Spring); see Tables 1 and 2 for observation times and distances . The top three panels (left to right) show 3.4 µm image contours (green) overlaid onto W1, W2 (blue contours), and W3 (red contours) band images. The bottom panels show (from left to right) the peak-‐normalized difference images of W2-‐W1, W2-‐W3, and W1-‐W3. Note the miss-‐match between shape of the contours of W2 and W3 in the top panels, and the better match between the contours of W1 and W3. Also, note the asymmetries in the difference images for W2 that are not present in the W1-‐W3 image. W1 and W3 trace the dust, while a more spherical component, likely gas emission, is present in the W2 flux. Note also the point-‐spread function’s width is larger in W3 than in W1 or W2. This is the cause of the brightness peak and more extended dark regions when W3 is subtracted from W1 in the lower right panel.
W2-‐W1 W2-‐W3 W1-‐W3
W1 W2 W3

Discovery & CO+CO2 Bauer et al. 2015
13 9/28/15 12:07 PM
C/2010 FB87, exhibited 4.6 µm band excess in the post-‐cryo mission observations. A
quarter of the comets observed during the prime mission, then, exhibited 4.6 µm
excess. The rate of occurrence of W2 excess differed for the comets observed thus
far during the NEOWISE-‐Reactivation mission, which are about 2/3rds of the total
(Bauer et al. 2014). However, the match is nearly identical among the prime and
reactivated mission comets observed with any significant W2 signal; both samples
have ~ 2/3 with 4.6 µm excess. We included in our sample of W2 excess the comets
NEOWISE from the reactivated mission, three of which show 4.6 µm excess.
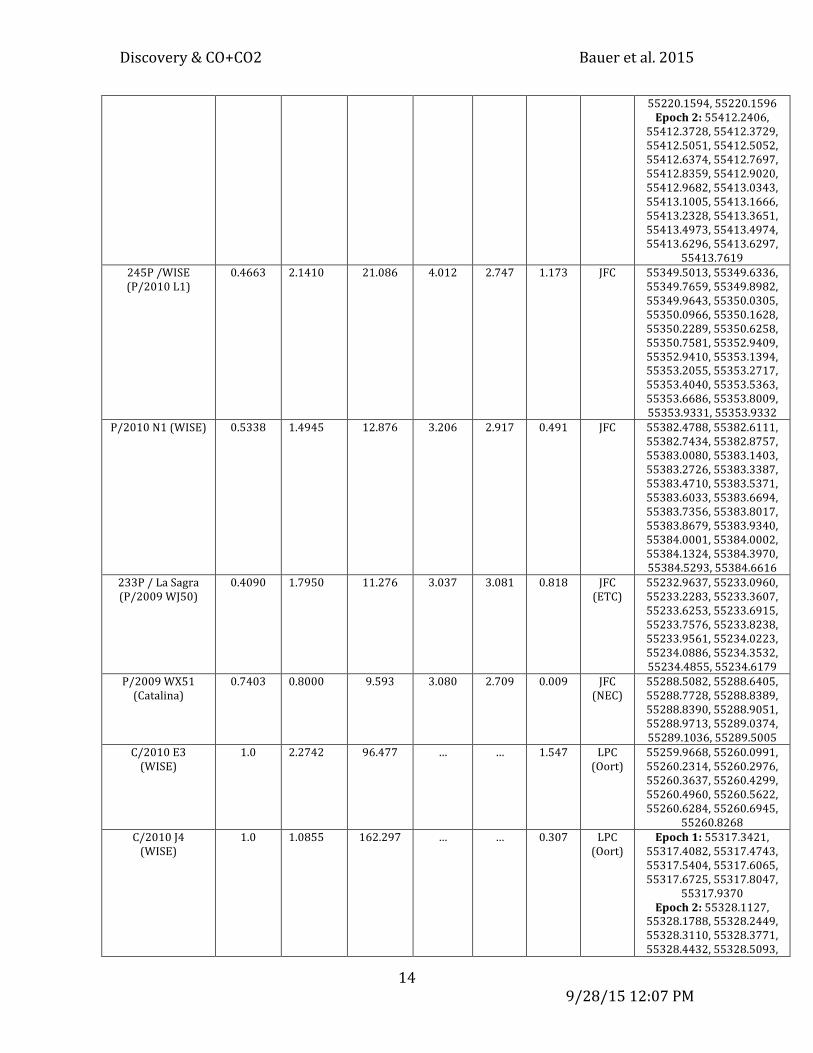
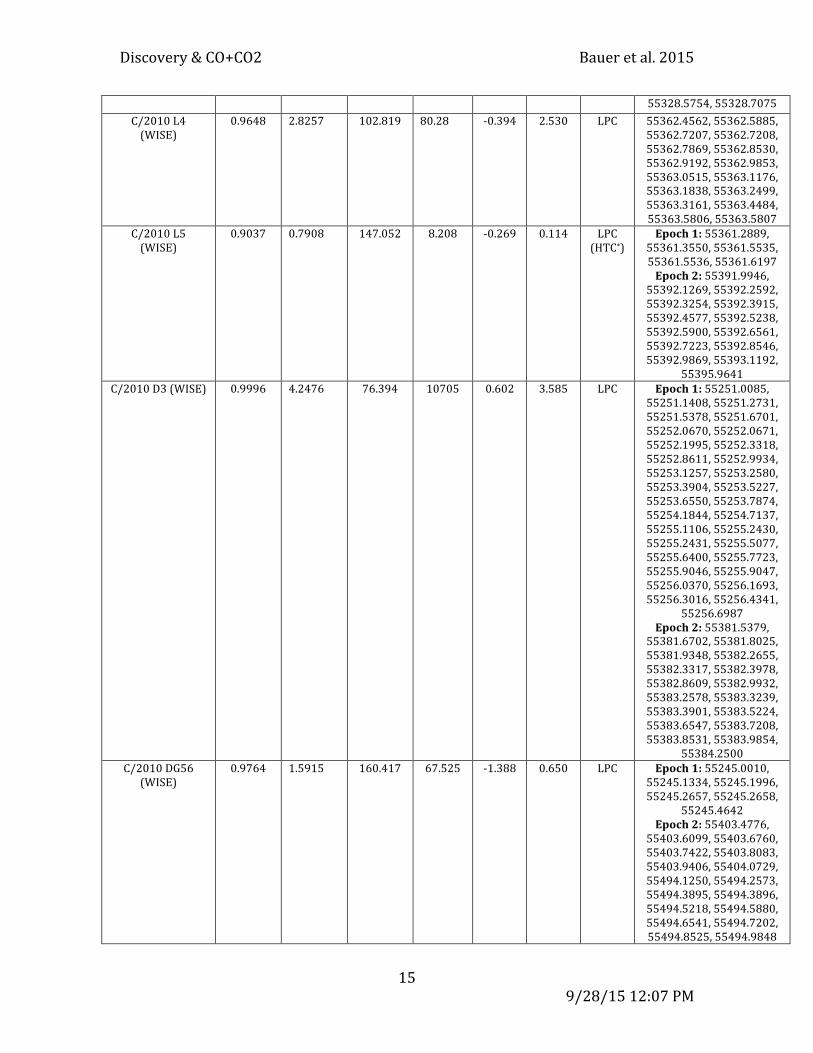
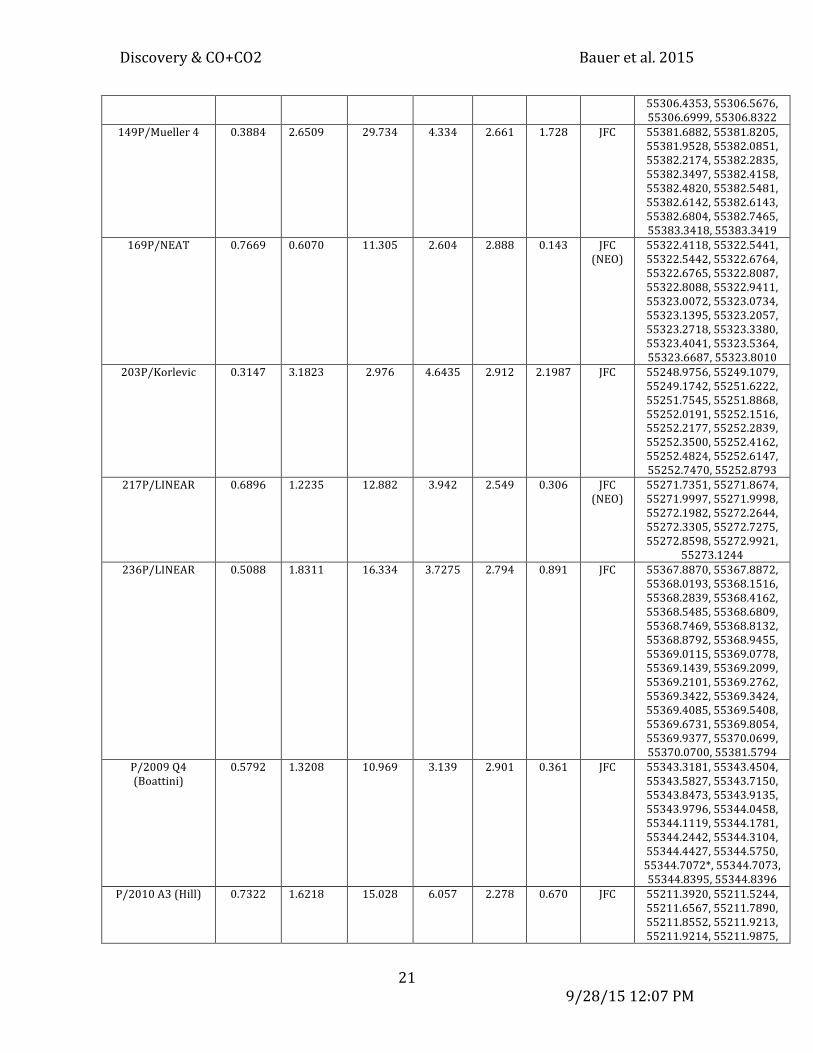
Table 1: Comets Discovered by NEOWISE & with observed 4.6 µm Excess*
Comet Ecc q (AU) Incl (deg)
a (AU) TJ Earth MOID (AU)
Class Observation MJDs (exposure mid-‐point times)
P/2010 K2 (WISE) 0.5894 1.1982 10.642 2.918 2.972 0.204 JFC 55343.1806, 55343.3129, 55343.4452, 55343.5775, 55343.7098, 55343.8421, 55343.9744, 55344.0406, 55344.1067, 55344.1729, 55344.2390, 55344.3052, 55344.3713, 55344.4375, 55344.5036, 55344.5699, 55344.6359, 55344.7022, 55344.8345, 55344.9668, 55345.0991, 55345.2314, 55345.3637, 55345.4960
P/2010 D1 (WISE) 0.3566 2.6691 9.647 4.148 2.899 1.683 JFC 55244.3420, 55244.4742, 55244.6065, 55244.7389, 55244.7390, 55244.8713, 55244.9374, 55245.0036, 55245.1359, 55245.2021, 55245.4667, 55245.5991
P/2010 D2 (WISE) 0.4531 3.6590 57.175 6.691 1.874 2.944 JFC* 55252.6899, 55252.8223, 55252.9546, 55253.0869, 55253.2192, 55253.2854, 55253.3515, 55253.3516, 55253.5500, 55253.6823, 55253.7485, 55253.8146, 55253.8147, 55253.8808, 55253.9470, 55254.0131, 55254.2116, 55254.3439
P/2010 B2 (WISE) 0.4803 1.6164 8.931 3.110 3.013 0.630 JFC (ETC)
Epoch 1: 55218.6376, 55218.7699, 55218.9022, 55219.0347, 55219.1670, 55219.2331, 55219.2332, 55219.4316, 55219.4978, 55219.5640, 55219.7625, 55219.8948, 55220.0271,
Discovery & CO+CO2 Bauer et al. 2015
14 9/28/15 12:07 PM
55220.1594, 55220.1596 Epoch 2: 55412.2406,
55412.3728, 55412.3729, 55412.5051, 55412.5052, 55412.6374, 55412.7697, 55412.8359, 55412.9020, 55412.9682, 55413.0343, 55413.1005, 55413.1666, 55413.2328, 55413.3651, 55413.4973, 55413.4974, 55413.6296, 55413.6297,
55413.7619 245P /WISE (P/2010 L1)
0.4663 2.1410 21.086 4.012 2.747 1.173 JFC 55349.5013, 55349.6336, 55349.7659, 55349.8982, 55349.9643, 55350.0305, 55350.0966, 55350.1628, 55350.2289, 55350.6258, 55350.7581, 55352.9409, 55352.9410, 55353.1394, 55353.2055, 55353.2717, 55353.4040, 55353.5363, 55353.6686, 55353.8009, 55353.9331, 55353.9332
P/2010 N1 (WISE) 0.5338 1.4945 12.876 3.206 2.917 0.491 JFC 55382.4788, 55382.6111, 55382.7434, 55382.8757, 55383.0080, 55383.1403, 55383.2726, 55383.3387, 55383.4710, 55383.5371, 55383.6033, 55383.6694, 55383.7356, 55383.8017, 55383.8679, 55383.9340, 55384.0001, 55384.0002, 55384.1324, 55384.3970, 55384.5293, 55384.6616
233P / La Sagra (P/2009 WJ50)
0.4090 1.7950 11.276 3.037 3.081 0.818 JFC (ETC)
55232.9637, 55233.0960, 55233.2283, 55233.3607, 55233.6253, 55233.6915, 55233.7576, 55233.8238, 55233.9561, 55234.0223, 55234.0886, 55234.3532, 55234.4855, 55234.6179
P/2009 WX51 (Catalina)
0.7403 0.8000 9.593 3.080 2.709 0.009 JFC (NEC)
55288.5082, 55288.6405, 55288.7728, 55288.8389, 55288.8390, 55288.9051, 55288.9713, 55289.0374, 55289.1036, 55289.5005
C/2010 E3 (WISE)
1.0 2.2742 96.477 … … 1.547 LPC (Oort)
55259.9668, 55260.0991, 55260.2314, 55260.2976, 55260.3637, 55260.4299, 55260.4960, 55260.5622, 55260.6284, 55260.6945,
55260.8268 C/2010 J4 (WISE)
1.0 1.0855 162.297 … … 0.307 LPC (Oort)
Epoch 1: 55317.3421, 55317.4082, 55317.4743, 55317.5404, 55317.6065, 55317.6725, 55317.8047,
55317.9370 Epoch 2: 55328.1127,
55328.1788, 55328.2449, 55328.3110, 55328.3771, 55328.4432, 55328.5093,
Discovery & CO+CO2 Bauer et al. 2015
15 9/28/15 12:07 PM
55328.5754, 55328.7075 C/2010 L4 (WISE)
0.9648 2.8257 102.819 80.28 -‐0.394 2.530 LPC 55362.4562, 55362.5885, 55362.7207, 55362.7208, 55362.7869, 55362.8530, 55362.9192, 55362.9853, 55363.0515, 55363.1176, 55363.1838, 55363.2499, 55363.3161, 55363.4484, 55363.5806, 55363.5807
C/2010 L5 (WISE)
0.9037 0.7908 147.052 8.208 -‐0.269 0.114 LPC (HTC*)
Epoch 1: 55361.2889, 55361.3550, 55361.5535, 55361.5536, 55361.6197 Epoch 2: 55391.9946,
55392.1269, 55392.2592, 55392.3254, 55392.3915, 55392.4577, 55392.5238, 55392.5900, 55392.6561, 55392.7223, 55392.8546, 55392.9869, 55393.1192,
55395.9641 C/2010 D3 (WISE) 0.9996 4.2476 76.394 10705 0.602 3.585 LPC Epoch 1: 55251.0085,
55251.1408, 55251.2731, 55251.5378, 55251.6701, 55252.0670, 55252.0671, 55252.1995, 55252.3318, 55252.8611, 55252.9934, 55253.1257, 55253.2580, 55253.3904, 55253.5227, 55253.6550, 55253.7874, 55254.1844, 55254.7137, 55255.1106, 55255.2430, 55255.2431, 55255.5077, 55255.6400, 55255.7723, 55255.9046, 55255.9047, 55256.0370, 55256.1693, 55256.3016, 55256.4341,
55256.6987 Epoch 2: 55381.5379,
55381.6702, 55381.8025, 55381.9348, 55382.2655, 55382.3317, 55382.3978, 55382.8609, 55382.9932, 55383.2578, 55383.3239, 55383.3901, 55383.5224, 55383.6547, 55383.7208, 55383.8531, 55383.9854,
55384.2500 C/2010 DG56
(WISE) 0.9764 1.5915 160.417 67.525 -‐1.388 0.650 LPC Epoch 1: 55245.0010,
55245.1334, 55245.1996, 55245.2657, 55245.2658,
55245.4642 Epoch 2: 55403.4776,
55403.6099, 55403.6760, 55403.7422, 55403.8083, 55403.9406, 55404.0729, 55494.1250, 55494.2573, 55494.3895, 55494.3896, 55494.5218, 55494.5880, 55494.6541, 55494.7202, 55494.8525, 55494.9848

Discovery & CO+CO2 Bauer et al. 2015
16 9/28/15 12:07 PM
C/2010 KW7 (WISE)
0.9743 2.5704 147.061 99.85 -‐1.606 1.626 LPC Epoch 1: 55223.9376, 55224.0699, 55224.2022, 55224.2684, 55224.3345, 55224.3346, 55224.4007, 55224.4669, 55224.5330, 55224.5992, 55224.6654, 55224.7977, 55224.9300 Epoch2: 55332.0641,
55332.1964, 55332.2627, 55332.3288, 55332.3950, 55332.5273, 55332.6596
P/2010 JC81 (WISE)
0.7773 1.8108 38.690 8.133 1.868 0.827 HTC 55326.6203, 55326.8849, 55327.0172, 55327.2156, 55327.2158, 55327.2819, 55327.3481, 55327.5465, 55327.6127, 55327.6788, 55327.7450, 55327.8773, 55328.0096, 55328.2742
P/2010 P4 (WISE) 0.4987 1.8565 24.102 3.703 2.740 0.854 JFC 55414.5897, 55414.7221, 55414.8544, 55414.9867, 55415.1190, 55415.1851, 55415.2511, 55415.2513, 55415.3174, 55415.3834, 55415.5157, 55415.5820, 55415.7143, 55415.8464, 55415.9787, 55416.2434
237P/LINEAR (P/2002 LN13)
0.3526 2.4193 16.155 3.737 2.916 1.411 JFC 55357.3037, 55357.4360, 55357.5684, 55357.7007, 55357.8328, 55357.8330, 55357.8990, 55357.9651, 55358.0314, 55358.0974, 55358.1637, 55358.2297, 55358.2960, 55358.4283, 55358.5606, 55358.6929
C/2010 G3 (WISE) 0.9981 4.9076 108.268 2597 -‐0.859 4.492 LPC Epoch 1: 55300.1382, 55300.2705, 55300.4028, 55300.4690, 55300.5351, 55300.6674, 55300.6676, 55300.7997, 55300.7999, 55300.8659, 55300.9320, 55300.9322, 55301.0643, 55301.0645, 55301.1306, 55301.2629, 55301.3291, 55301.3952, 55301.4614, 55301.5275, 55301.5937, 55301.6598, 55301.7260, 55301.7921, 55301.8583, 55301.9244, 55302.0567,
55302.1890 Epoch 2: 55380.2411,
55380.3073, 55380.3734, 55380.4396, 55380.5057, 55380.6380, 55380.7041, 55380.7703, 55380.8364
C/2010 FB87 (WISE-‐Garradd)
0.9905 2.8428 107.625 299.3 -‐0.614 2.538 LPC Epoch 1: 55283.2198, 55283.4846, 55283.6169, 55283.6830, 55283.8154, 55283.9477, 55284.3446 Epoch 2: 55399.5316,
55399.5976, 55399.6639, 55399.7300, 55399.8623,

Discovery & CO+CO2 Bauer et al. 2015
17 9/28/15 12:07 PM
55399.9285, 55400.2592 Epoch 3 (post-‐cryo):
55573.6618, 55573.7941, 55573.9263, 55573.9264, 55573.9925, 55574.0586, 55574.1909, 55574.2570, 55574.3232, 55574.5877,
55574.8523 C/2010 D4 (WISE) 0.8894 7.1482 105.659 64.66 -‐0.789 6.373 LPC Epoch 1: 55255.0178,
55255.1501, 55255.4809, 55255.5470, 55255.6795, 55255.7456, 55256.4072, 55256.5395, 55256.6719 Epoch 2: 55381.6953,
55381.8276, 55381.9599, 55382.0261, 55382.1583, 55382.2906, 55382.3568, 55382.4229, 55382.6214, 55382.6875, 55382.7536, 55382.8859, 55383.0182, 55383.0844, 55383.1505, 55383.2167, 55383.2828, 55383.3490, 55383.4151, 55383.4812, 55383.4813, 55383.6135, 55383.7458
2010 KG43 (undesig. periodic
comet)
0.4826 2.8894 13.616 5.584 2.695 1.876 JFC (Chiron-‐type)
55336.4042, 55336.4043, 55336.5365, 55336.5366, 55336.6688, 55336.6689, 55336.8011, 55336.8673, 55336.9334, 55336.9996, 55337.0657, 55337.1319, 55337.1980, 55337.2642, 55337.3965, 55337.5288,
55337.6611 C/2014 C3 (NEOWISE)
0.9828 1.8620 151.783 108.5 -‐1.437 0.866 LPC (re-‐activated) 56702.7097, 56702.8415, 56702.9073, 56702.9731, 56703.0390, 56703.1708,
56703.3024 P/2014 L2 (NEOWISE)
0.6464 2.2344 5.1844 6.32 2.498 1.223 JFC (re-‐activated) 56815.4086, 56815.5402, 56815.6718, 56815.8034, 56815.9350, 56816.0007, 56816.0666, 56816.1324, 56816.1982, 56816.2639, 56816.3298, 56816.3956, 56816.4613, 56816.5271, 56816.6588, 56816.7904, 56816.9219, 56816.9220,
56817.0536 C/2014 N3 (NEOWISE)
0.9999 3.8774 61.642 40131. 1.160 2.884 LPC (Oort Cloud comet)
Epoch 1 (re-‐activated): 56841.6682, 56841.7997, 56841.9314, 56842.2603, 56842.3261, 56842.3918, 56842.4577, 56842.5235, 56842.5892, 56842.6550, 56842.7209, 56842.7866, 56842.9182, 56843.0498,
56843.1813 Epoch 2(re-‐activated): 57003.7988, 57003.9302,

Discovery & CO+CO2 Bauer et al. 2015
18 9/28/15 12:07 PM
57004.0618, 57004.1932, 57004.2589, 57004.3246, 57004.3903, 57004.4562, 57004.5219, 57004.6533, 57004.7847, 57004.9162,
P/2015 J3 (NEOWISE)
0.5538 1.4941 8.125 3.348 2.876 0.499 JFC (re-‐activated) 57157.0565, 57157.1877, 57157.1878, 57157.3190, 57157.4502, 57157.5815, 57157.7128, 57157.7784, 57157.8440, 57157.9097, 57157.9753, 57158.0408, 57158.0410, 57158.1065, 57158.1721, 57158.3034, 57158.4347, 57158.5660, 57158.6971, 57158.8284
Additional Comets with Tentative CO+CO2 Detections Based on 4.6 µm Excess 9P/Tempel 1 0.5116 1.5334 10.503 3.140 2.970 0.519 JFC 55296.0844, 55296.6798,
55296.2167, 55296.3490, 55296.8121, 55296.4813, 55296.6136, 55297.0768, 55296.9444, 55296.4151, 55295.9521, 55295.9520, 55296.6797, 55296.5474
10P/Tempel 2 0.5372 1.4179 12.029 3.064 2.964 0.406 JFC 55313.1161, 55313.2484, 55313.3807, 55313.5130, 55313.5132, 55313.6453, 55313.6455, 55313.7778, 55313.9101, 55314.0424, 55314.1747, 55314.3070, 55314.3731, 55314.4393, 55314.5054, 55314.5716, 55314.6377, 55314.6378, 55314.7039, 55314.7700, 55314.7701, 55314.8362, 55314.9023, 55314.9024, 55314.9685, 55315.0347, 55315.1008, 55315.1670, 55315.2331, 55315.2993, 55315.4316, 55315.5640, 55315.6963, 55315.8286, 55315.9609, 55316.0932, 55316.2255, 55316.3578, 55316.4901, 55322.5102, 55322.5763, 55322.5765, 55322.6425, 55322.7086, 55322.7088, 55322.8411, 55322.9734, 55323.1057, 55323.2380, 55323.3703, 55323.5026, 55323.6349, 55323.7672, 55323.8995,
55324.0318 29P/Schwassmann-‐Wachmann 1
0.0419 5.7580 9.3761 6.009 2.985 4.762 JFC 55319.1040, 55319.2363, 55319.3686, 55319.5009, 55319.5672, 55319.6332, 55319.6995, 55319.7655, 55319.8318, 55319.9641, 55320.0964, 55320.2287
30P/Reinmuth 1 0.5012 1.8832 8.1227 3.775 2.838 0.900 JFC 55262.6049, 55262.7372, 55262.8695, 55262.8697,

Discovery & CO+CO2 Bauer et al. 2015
19 9/28/15 12:07 PM
55263.0020, 55263.1343, 55263.2004, 55263.2666, 55263.3327, 55263.3989, 55263.4651, 55263.5312, 55263.5974, 55263.7297, 55263.8620, 55263.9943, 55264.1266, 55264.1267,
55264.2591 65P/Gunn 0.2607 2.8698 9.2362 3.882 2.987 1.857 JFC 55310.2078, 55310.3401,
55310.4724, 55310.6047, 55310.6709, 55310.8693, 55310.9355, 55311.0016, 55311.3325, 55311.4648,
55311.5971 67P/Churyumov-‐Gerasimenko
0.6410 1.2432 7.0402 3.4628 2.746 0.257 JFC see Bauer et al. 2012b
74P/Smirnova-‐Chernykh
0.1488 3.5419 6.6513 4.161 3.007 2.558 Encke-‐type
Epoch 1: 55214.7988, 55214.9311, 55215.0634, 55215.0635, 55215.1958, 55215.2619, 55215.3281, 55215.3943, 55215.5266, 55215.6589, 55215.7913,
55215.7914 Epoch 2: 55384.3289,
55384.4612, 55384.5935, 55384.7258, 55384.8581,
55384.9244 77P/Longmore 0.3579 2.3107 24.399 3.599 2.860 1.316 JFC 55320.9284, 55321.0607,
55321.1930, 55321.3253, 55321.3914, 55321.3915, 55321.4576, 55321.5238, 55321.5899, 55321.6561, 55321.7222, 55321.7884, 55323.8392, 55323.9715, 55324.2361, 55324.3022, 55324.3023, 55324.3684, 55324.8316, 55324.9639
81P/Wild 2 0.5380 1.5931 3.2390 3.449 2.879 0.599 JFC Epoch 1 (four band): 55414.0950, 55414.2273,
55414.3596 Epoch 2 (three band): 55414.4919, 55414.6242, 55414.6903, 55414.7565, 55414.8226, 55414.8888, 55414.9549, 55415.0211, 55415.0872, 55415.1534, 55415.2195, 55415.3518, 55415.4841, 55415.6164,
55415.7487 94P/Russell 4 0.3643 2.2315 6.1847 3.511 3.003 1.249 Encke-‐
type 55335.1146, 55335.1147, 55335.5115, 55335.5116, 55335.6438, 55335.6439, 55335.7761, 55335.7762, 55335.9084, 55335.9746, 55336.0407, 55336.1069, 55336.2392, 55339.0837, 55339.2821, 55339.3483, 55339.4806, 55339.5467,
55340.0759 100P/Hartley 1 0.4172 1.9909 25.662 3.416 2.851 0.985 JFC 55302.4044, 55302.4045,

Discovery & CO+CO2 Bauer et al. 2015
20 9/28/15 12:07 PM
55302.5368, 55302.6691, 55302.9337, 55302.9998, 55303.0000, 55303.0660, 55303.1323, 55303.1984, 55303.2646, 55303.3307, 55303.4630, 55303.5292, 55304.0584, 55304.0585, 55304.1908, 55304.3231,
55304.4554 103P/Hartley 2 0.6938 1.0642 13.604 3.475 2.641 0.072 JFC
(NEO) 55326.3456, 55326.4779, 55326.6102, 55326.7425, 55326.8748, 55326.9409, 55327.0071, 55327.0732, 55327.1394, 55327.2055, 55327.2717, 55327.3378, 55327.4040, 55327.4701, 55327.6024, 55327.7347, 55327.8670, 55327.9994
107P/Wilson-‐Harrington
0.6238 0.9938 2.7824 2.642 3.082 0.047 Near-‐Earth Comet (NEC)
55244.6083, 55244.7408, 55244.8731, 55245.0054, 55245.1377, 55245.2700, 55245.3362, 55245.4024, 55245.4685, 55245.5347, 55245.6008, 55245.6009, 55245.6670, 55245.7332, 55245.7993, 55245.8655, 55245.9317, 55245.9978, 55246.1301, 55246.2624, 55246.2626, 55246.3949, 55246.5272, 55246.6595, 55249.7692, 55249.8354, 55249.9015, 55249.9016, 55249.9677, 55250.0339, 55250.1000, 55250.1662, 55250.2325, 55250.2985, 55250.3648, 55250.4971, 55250.6294, 55250.7617, 55250.8940, 55250.8941
116P/Wild 4 0.3726 2.1851 3.6077 3.483 3.009 1.184 Encke-‐type
55302.5333, 55302.6656, 55302.6657, 55302.7980, 55302.9303, 55303.0626, 55303.1287, 55303.1949, 55303.2610, 55303.3272, 55303.3933, 55303.5256,
55303.5257 118P/Shoemaker-‐
Levy 4 0.4284 1.9803 8.5131 3.464 2.960 1.011 JFC 55277.0276, 55277.5569,
55277.7553, 55277.7555, 55277.8216, 55277.8878, 55277.9539, 55278.0201, 55280.6003, 55280.7326, 55280.8649, 55280.8651, 55280.9974, 55281.1297, 55281.1958, 55281.2620, 55281.3281, 55281.3282, 55281.3943, 55281.4605, 55281.5266, 55281.5928, 55281.7251, 55281.8574, 55281.9897, 55282.1220
143P/Kowal-‐Mrkos
0.4101 2.5382 4.6897 4.303 2.863 1.538 JFC 55305.5752, 55305.8399, 55305.9722, 55306.0384, 55306.1045, 55306.3030,
Discovery & CO+CO2 Bauer et al. 2015
21 9/28/15 12:07 PM
55306.4353, 55306.5676, 55306.6999, 55306.8322
149P/Mueller 4 0.3884 2.6509 29.734 4.334 2.661 1.728 JFC 55381.6882, 55381.8205, 55381.9528, 55382.0851, 55382.2174, 55382.2835, 55382.3497, 55382.4158, 55382.4820, 55382.5481, 55382.6142, 55382.6143, 55382.6804, 55382.7465, 55383.3418, 55383.3419
169P/NEAT 0.7669 0.6070 11.305 2.604 2.888 0.143 JFC (NEO)
55322.4118, 55322.5441, 55322.5442, 55322.6764, 55322.6765, 55322.8087, 55322.8088, 55322.9411, 55323.0072, 55323.0734, 55323.1395, 55323.2057, 55323.2718, 55323.3380, 55323.4041, 55323.5364, 55323.6687, 55323.8010
203P/Korlevic 0.3147 3.1823 2.976 4.6435 2.912 2.1987 JFC 55248.9756, 55249.1079, 55249.1742, 55251.6222, 55251.7545, 55251.8868, 55252.0191, 55252.1516, 55252.2177, 55252.2839, 55252.3500, 55252.4162, 55252.4824, 55252.6147, 55252.7470, 55252.8793
217P/LINEAR 0.6896 1.2235 12.882 3.942 2.549 0.306 JFC (NEO)
55271.7351, 55271.8674, 55271.9997, 55271.9998, 55272.1982, 55272.2644, 55272.3305, 55272.7275, 55272.8598, 55272.9921,
55273.1244 236P/LINEAR 0.5088 1.8311 16.334 3.7275 2.794 0.891 JFC 55367.8870, 55367.8872,
55368.0193, 55368.1516, 55368.2839, 55368.4162, 55368.5485, 55368.6809, 55368.7469, 55368.8132, 55368.8792, 55368.9455, 55369.0115, 55369.0778, 55369.1439, 55369.2099, 55369.2101, 55369.2762, 55369.3422, 55369.3424, 55369.4085, 55369.5408, 55369.6731, 55369.8054, 55369.9377, 55370.0699, 55370.0700, 55381.5794
P/2009 Q4 (Boattini)
0.5792 1.3208 10.969 3.139 2.901 0.361 JFC 55343.3181, 55343.4504, 55343.5827, 55343.7150, 55343.8473, 55343.9135, 55343.9796, 55344.0458, 55344.1119, 55344.1781, 55344.2442, 55344.3104, 55344.4427, 55344.5750, 55344.7072*, 55344.7073, 55344.8395, 55344.8396
P/2010 A3 (Hill) 0.7322 1.6218 15.028 6.057 2.278 0.670 JFC 55211.3920, 55211.5244, 55211.6567, 55211.7890, 55211.8552, 55211.9213, 55211.9214, 55211.9875,

Discovery & CO+CO2 Bauer et al. 2015
22 9/28/15 12:07 PM
55212.0537, 55212.1198, 55212.1200, 55212.1860, 55212.2523, 55212.3846, 55212.5169, 55212.6493
P/2009 T2 (La Sagra)
0.7690 1.7548 28.106 7.5960 2.048 0.822 JFC 55217.6080, 55217.7403, 55217.8726, 55218.0049, 55218.0050, 55218.1373, 55218.2034, 55218.2696, 55218.3358, 55218.4019, 55218.4681, 55218.5342, 55218.5344, 55218.6004, 55218.6667, 55218.7327, 55218.8652, 55218.9975, 55219.1298, 55220.7839, 55220.7840, 55220.9163, 55221.0486, 55221.1809, 55221.3133, 55221.3134, 55221.3795, 55221.4457, 55221.5118, 55221.5780, 55221.6442, 55221.7103, 55221.7765, 55221.8426, 55221.9088, 55222.0411, 55222.1734, 55222.1735, 55222.3059, 55222.4382
P/2009 Y2 0.6405 2.3392 29.93 6.5071 2.288 1.357 JFC 55210.0061, 55210.0721, 55210.0723, 55210.1384, 55210.2707, 55210.4030, 55210.4031, 55210.5354
P/2010 A5 0.6643 1.7120 5.784 5.1001 2.493 0.711 JFC 55215.8599, 55215.9922, 55216.1245, 55216.2570, 55216.3893, 55216.4554, 55216.4555, 55216.5216, 55216.5878, 55216.6539, 55216.7201, 55216.7863, 55216.8524, 55216.9848, 55217.1172, 55217.2495,
55217.3818 P/2010 H2 (Vales) 0.1929 3.1077 14.253 3.850 2.988 2.130 JFC 55383.0064, 55383.0065,
55383.1387, 55383.2710, 55383.4033, 55383.5356, 55383.6018, 55383.6679, 55383.7340, 55383.7341, 55383.8002, 55383.8663, 55383.9986, 55384.1309, 55384.2632, 55384.3955
C/2005 L3 (McNaught)
0.9996 5.5936 139.449 13392. -‐2.228 4.712 “Comet”
55337.1708, 55340.2798, 55340.2799, 55340.4121, 55340.5444, 55340.6106, 55340.6767, 55340.7429, 55340.8090, 55340.8752, 55340.9413, 55341.0075, 55341.1398, 55341.2721,
55341.4044 C/2006 S3 (LONEOS)
1.0030 5.1311 166.033 -‐1688.7 -‐2.728 4.131 Hyperbolic Comet
55338.7823, 55338.9146, 55339.0469, 55339.1792, 55339.2453, 55339.2454, 55339.3115, 55339.3776, 55339.3777, 55339.4438, 55339.5099, 55339.5100, 55339.6422, 55339.6423,
55339.7745

Discovery & CO+CO2 Bauer et al. 2015
23 9/28/15 12:07 PM
C/2006 W3 (Christensen)
0.9998 3.1262 127.075 17989. -‐1.321 2.299 “Comet”
55305.9747, 55306.1070, 55306.2393, 55306.4377, 55306.4378, 55306.5039, 55306.5701, 55306.7024,
55306.8347 C/2007 G1 (LINEAR)
1.0015 2.6462 88.359 -‐1783.0 -‐-‐-‐ 1.843 Hyperbolic Comet
55240.4971, 55240.9603, 55241.0264, 55241.0926, 55241.1588, 55241.2249, 55241.2911, 55241.3572, 55241.3573, 55241.4234, 55241.4897, 55241.6220,
55241.7543 C/2007 Q3 (Siding
Spring) 1.0002 2.2517 65.650 -‐9454.1 0.767 1.262 Hyperb
olic Comet
Epoch 1: 55206.1909, 55206.2570, 55206.3232,
55206.3894 Epoch 2: 55349.1498,
55349.2821, 55349.4144, 55349.5467, 55349.6790, 55349.7451, 55349.7452, 55349.8113, 55349.8774, 55349.9436, 55350.0097, 55350.0759, 55350.1420, 55350.2082, 55350.2743, 55350.3405, 55350.4066, 55350.4728, 55350.5389, 55350.6051, 55350.6712, 55350.7373, 55350.7374, 55350.8035, 55350.8696, 55350.8697, 55350.9358, 55351.0019, 55351.0681, 55351.1342, 55351.2004, 55351.2665, 55351.3327, 55351.3988, 55351.4650, 55351.5311, 55351.5973, 55351.6634, 55351.7296, 55351.8618, 55351.8619, 55351.9941, 55351.9942, 55352.1264, 55352.2587
C/2007 VO53 (Spacewatch)
0.999603 4.8427 86.995 12194.4 0.143 4.499 “Comet”
55219.3447, 55219.5433, 55219.6093, 55221.0651, 55221.1974, 55221.3297, 55221.3298, 55221.3959, 55221.5944, 55221.6606, 55221.7267, 55221.7929, 55221.8590, 55221.8592, 55221.9252, 55221.9915, 55222.0575, 55222.1238, 55222.2561, 55222.3223, 55222.3884, 55222.3885, 55222.5869, 55222.7193
C/2008 FK75 (Lemmon-‐Siding
Spring)
1.0027 4.5109 61.175 -‐1670.3 -‐-‐-‐ 4.056 Hyperbolic Comet
55273.5466, 55273.5467, 55273.6790, 55273.8113, 55273.9436, 55274.0097, 55274.0759, 55274.1420, 55274.1421, 55274.2082, 55274.2744, 55274.3405, 55274.4067, 55274.4728, 55274.5390, 55274.6051,
55275.2006 C/2008 N1 (Holmes)
0.9971 2.7835 115.521 973.12 -‐0.885 2.351 “Comet”
Epoch 1: 55228.2909, 55228.7541, 55228.8203,

Discovery & CO+CO2 Bauer et al. 2015
24 9/28/15 12:07 PM
55228.8864, 55229.0187, 55229.0188, 55229.1511,
55232.9888 Epoch 2: 55351.5219,
55351.6541, 55351.6542, 55351.7864, 55351.9187, 55351.9849, 55352.0510, 55352.1172, 55352.1833, 55352.2495, 55352.3817, 55352.3818, 55352.5140
C/2008 Q3 (Garradd)
0.9998 1.7982 140.707 8926.0 -‐1.286 0.814 “Comet”
55307.9318, 55310.8425, 55310.8426, 55310.9087, 55310.9749, 55311.0410, 55311.1072, 55311.2395, 55311.3718, 55311.5041
C/2009 F6 0.9975 1.274 85.765 512.2 0.113 0.505 LPC 55256.2415, 55256.3738, 55256.5061, 55256.5724, 55256.6384, 55256.7047, 55256.7708, 55256.7709, 55256.8370, 55256.9032, 55256.9693, 55257.0355, 55257.1017, 55257.2340, 55257.3001, 55257.3663, 55257.4986, 55257.5648, 55257.6309, 55257.6971, 55257.7633, 55257.8957,
55258.0280 C/2009 K5 (McNaught)
1.0008 1.4224 103.879 -‐1694.6 -‐-‐-‐ 0.798 Hyperbolic Comet
(post-‐cryo) 55482.4446, 55482.5768, 55482.7091, 55482.7752, 55482.8414, 55482.9075, 55482.9736, 55482.9737, 55483.0398
C/2009 P1 (Garradd)
1.0002 1.5513 106.168 -‐6285.8 -‐0.432 1.255 Hyperbolic Comet
55351.6232, 55354.1369, 55354.2692, 55354.5999, 55354.6661, 55354.7322, 55354.7985, 55354.8645, 55354.9968, 55355.1291,
55355.2615 C/2009 U3 (Hill) 0.9916 1.4144 51.261 167.88 0.952 0.868 “Comet
” 55212.1920, 55212.3243, 55212.4568, 55212.5229, 55212.5891, 55212.6553, 55212.7214, 55212.7876, 55212.9199, 55213.0523,
55213.1846 C/2010 J1 (Boattini)
0.9538 1.6957 134.385 36.723 -‐0.975 0.735 “Comet”
Epoch 1: 55287.9769, 55288.1092, 55288.1093, 55288.2416, 55288.3077, 55288.3738, 55288.3739, 55288.4400, 55288.5723,
55288.7046 Epoch 2: 55378.1164,
55378.2487, 55378.3810, 55378.4471, 55378.5133, 55378.5794, 55378.6456, 55378.7117, 55378.8440,
55378.9763

Discovery & CO+CO2 Bauer et al. 2015
25 9/28/15 12:07 PM
3 Analysis The WISE image data were processed using the scan/frame pipeline, which applied
instrumental, photometric, and astrometric calibrations (Cutri et al. 2012). Image
stacking and photometric analysis was conducted as in previous analyses (Bauer et
al. 2011, 2012a, 2012b, and 2013; Stevenson et al. 2012 and 2015). The images
were visually inspected and compared to the WISE Atlas (cf. Cutri et al. 2012) to
ensure there were no inertially fixed background sources. Aperture photometry was
performed on the stacked images of the 25 discovered comets and the 42 additional
comets with 4.6 µm signal. Aperture radii of 9, 11 and 22 arcsec were used, the
aperture sizes necessary to obtain the full signal from W3 and W4, the poorest
resolution WISE bands.
3.1 Flux Values
The counts were converted to fluxes using the band-‐appropriate magnitude zero-‐
points and 0th magnitude flux values provided in Wright et al. (2010). An iterative
fitting to a black-‐body curve was conducted on the two long-‐wavelength bands to
*Orbital properties and observation dates of comets discovered, or with activity discovered, by WISE/NEOWISE, and of comets with noted 4.6 µm excess detected during the prime mission. Orbital properties were recorded from JPL’s Small Body Database (http://ssd.jpl.nasa.gov/sbdb.cgi) on 2015-‐05-‐15. The orbital properties include the comet’s orbital eccentricity (Ecc), perihelion distance (q) in AU, orbital inclination (Inc) in degrees, orbital semi-‐major axis (a) in AU, Minimum Earth-‐Orbit intersect distance (MOID) in AU, the Jupiter Tisserand parameter, and the comet’s dynamical classification. Comet names are in the IAU-‐standard format. If an object was observed at multiple epochs these are tabulated separately in the observation dates column, as are the phases of the mission for each epoch if any were not in the fully cryogenic mission phase.

Discovery & CO+CO2 Bauer et al. 2015
26 9/28/15 12:07 PM
determine the appropriate color correction as listed in the same. The extracted
magnitudes for the 11 arcsec aperture were then converted to fluxes (Wright et al.
2010; Mainzer et al. 2011b) and are listed in Table 2. Proper aperture corrections
are required for accurate photometry (Cutri et al. 2012), in addition to the color
corrections mentioned above. With these corrections, the derived magnitudes are
equivalent to the profile-‐derived magnitudes providing there are no artifacts,
saturation, or confusion with other sources in the apertures of the objects.
Table 2: Comet Flux Measurements Comet W1 Flux
(mJy) W2 Flux (mJy)
W3 Flux (mJy)
W4 Flux (mJy) Apparent Activety? (Y/N/U)
Image Stack Mid-‐point (MJDs)
P/2010 K2 0.24+/-‐0.03 2.2+/-‐0.5 41+/-‐8 67+/-‐12 Y 55344.2734 P/2010 D1 -‐-‐ -‐-‐ 2.7+/-‐0.5 17+/-‐3 Y 55244.9688 P/2010 D2 0.05+/-‐0.01 -‐-‐ 1.9+/-‐0.4 21+/-‐4 Y 55244.9688 P/2010 B2 -‐-‐ 0.24+/-‐0.06 11+/-‐2 26+/-‐5 Y 55219.3984
-‐-‐ -‐-‐ 1.6+/-‐0.3 4+/-‐1 U 55413.0013 245P -‐-‐ -‐-‐ 5+/-‐1 17+/-‐3 Y 55351.7173
P/2010 N1 0.10+/-‐.02 0.7+/-‐0.2 20+/-‐ 4 42+/-‐8 Y 55383.0741 233P 0.10+/-‐.02 0.15+/-‐0.04 9+/-‐2 24+/-‐5 Y 55233.7908
P/2009 WX51 0.16+/-‐.03 0.7+/-‐0.2 12+/-‐ 2 23+/-‐4 Y 55289.0044 C/2010 E3 -‐-‐ -‐-‐ 5 +/-‐ 1 21 +/-‐ 4 N 55260.4630 C/2010 J4
0.5+/-‐.1 1.5+/-‐0.4 55 +/-‐ 11 92 +/-‐ 22 Y 55317.6396 0.4+/-‐.05 2.3+/-‐0.5 99 +/-‐ 18 140+/-‐ 25 Y 55328.4101
C/2010 L4 -‐-‐ -‐-‐ 7 +/-‐ 1 38+/-‐ 7 Y 55363.0185 C/2010 L5 0.04 +/-‐ .01 0.4+/-‐0.1 18 +/-‐ 3 52 +/-‐ 10 Y 55361.4543
0.8+/-‐.1 6+/-‐1 180+/-‐33 360+/-‐66 Y 55393.9793 C/2010 D3 0.025+/-‐0.08 -‐-‐ 0.8+/-‐.2 17+/-‐3 Y 55253.8536
55382.7616 -‐-‐ -‐-‐ 1.8+/-‐.3 22+/-‐4 Y 55382.7616
C/2010 DG56 .13+/-‐.02 .13+/-‐.04 3.0+/-‐.6 9+/-‐2 N 55245.2326 .16+/-‐.02 .8+/-‐.2 74+/13 145+/-‐27 Y 55403.7753
C/2010 KW7 -‐-‐ -‐-‐ 1.5+/-‐.3 7+/-‐2 N 55224.4338 -‐-‐ -‐-‐ 5.0+/-‐.9 17+/-‐3 N 55332.3477
P/2010 JC81 0.1+/-‐0.02 0.14+/-‐0.04 12+/-‐2 52+/-‐10 N 55327.4473 P/2010 P4 -‐-‐ -‐-‐ 4+/-‐.7 13+/-‐3 Y 55414.9204 237P -‐-‐ -‐-‐ 4.7+/-‐.9 21+/-‐4 Y 55357.9983
C/2010 G3 -‐-‐ -‐-‐ 0.9+/-‐0.2 23+/-‐5 Y 55301.1636 -‐-‐ -‐-‐ 2.6+/-‐.5 26+/-‐5 Y 55381.0017
C/2010 FB87 -‐-‐ -‐-‐ 2.9+/-‐.5 26+/-‐5 Y 55283.7822 0.9+/-‐.1 0.6+/-‐.1 12+/-‐2 142+/-‐26 Y 55399.8954 0.9+/-‐.2 1.2+/-‐.3 -‐-‐ -‐-‐ Y 55574.2571

Discovery & CO+CO2 Bauer et al. 2015
27 9/28/15 12:07 PM
C/2010 D4 -‐-‐ -‐-‐ 0.9+/-‐.2 16+/-‐3 N 55255.8449 -‐-‐ -‐-‐ 0.6+/-‐.1 18+/-‐4 N 55381.8276
C/2014 C3 0.28+/-‐0.03 1.0+/-‐0.2 -‐-‐ -‐-‐ Y 56703.0061 P/2014 L2 1.0+/-‐0.2 10+/-‐2 -‐-‐ -‐-‐ Y 56816.2311 C/2014 N3 0.24+/-‐.06 .37+/-‐.09 -‐-‐ -‐-‐ Y 56842.4248
0.86+/-‐.19 1.2+/-‐.3 -‐-‐ -‐-‐ Y 57004.0486 C/2015 J3 0.11+/-‐.03 .43+/-‐.11 -‐-‐ -‐-‐ U 57157.9097
Short-‐Period Comets 9P 0.10+/-‐.02 0.22+/-‐ 0.06 18.7+/-‐ 3.4 46 +/-‐ 9 Y 55296.2167 10P 3.1 +/-‐ 0.3 21+/-‐ 5 924+/-‐170 1109+/-‐203 Y 55314.7701 29P 1.39+/-‐ 0.14 3.17+/-‐ 0.72 50+/-‐ 9 1316+/-‐241 Y 55317.4994 30P 0.91+/-‐ 0.09 3.04+/-‐ 0.69 277+/-‐ 50 678+/-‐124 Y 55263.3989 65P 2.10+/-‐ 0.20 8.41+/-‐ 1.89 209+/-‐ 38 1499+/-‐275 Y 55310.9025 67P 0.01+/-‐0.007 0.18+/-‐0.05 10.2+/-‐0.4 50+/-‐4 Y 55225.130 74P 0.21+/-‐ 0.03 0.23+/-‐ 0.06 19.3+/-‐ 3.5 157+/-‐ 29 Y 55215.2620
0.28+/-‐ 0.04 0.39+/-‐ 0.10 21.5+/-‐ 3.9 196.7+/-‐ 36.3 Y 55384.5936 77P 0.10+/-‐ 0.02 0.14+/-‐ 0.04 15.2+/-‐ 2.8 78.6+/-‐14.7 Y 55321.6562 81P 3.63+/-‐ 0.34 9.92+/-‐ 2.22 446+/-‐ 82 2386+/-‐437 Y 55414.2273 94P 0.20+/-‐ 0.03 0.54+/-‐ 0.13 35+/-‐ 6 171 +/-‐ 32 Y 55337.5953 100P 0.16+/-‐ 0.02 0.28+/-‐ 0.07 14 +/-‐ 3 36 +/-‐ 7 Y 55303.1984 103P 0.08+/-‐ 0.01 0.31+/-‐ 0.08 11.1+/-‐ 2.0 34.1+/-‐ 6.5 Y 55327.1395 107P -‐-‐ 0.44+/-‐ 0.10 42.2+/-‐ 7.7 67+/-‐ 13 N 55245.9978 116P 0.23+/-‐ 0.03 0.31+/-‐ 0.08 24.6+/-‐ 4.5 206+/-‐ 38 Y 55303.0296 118P 1.47+/-‐ 0.14 3.85+/-‐ 0.87 124+/-‐23 744+/-‐137 Y 55279.5749 143P -‐-‐ 0.09+/-‐ 0.03 10.9+/-‐ 2.0 57+/-‐ 11 N 55306.2038 149P 0.07+/-‐ 0.01 0.12+/-‐ 0.03 5.8+/-‐1.1 42+/-‐ 8 U 55382.5151 169P -‐-‐ 0.35+/-‐.08 16+/-‐3 49+/-‐9 N 55323.1064 203P 0.27+/-‐ 0.03 0.14+/-‐ 0.04 20 +/-‐4 216 +/-‐ 40 Y 55252.2508 217P 0.21+/-‐ 0.03 0.54+/-‐ 0.13 28.4+/-‐ 5.2 180+/-‐ 33 Y 55272.4298 236P 0.05+/-‐ 0.01 0.21+/-‐ 0.05 13.2+/-‐ 2.4 25.2+/-‐ 4.9 Y 55316.6008
P/2009 Q4 0.05+/-‐ 0.01 0.11+/-‐ 0.03 4.0+/-‐ 0.7 20+/-‐ 4 Y 55344.0789 P/2009 T2 0.41+/-‐ 0.05 1.58+/-‐ 0.36 130+/-‐ 24 245+/-‐ 45 Y 55219.1298 P/2009 Y2 0.08+/-‐ 0.02 0.16+/-‐ 0.04 10+/-‐2 55.1+/-‐ 10.4 U 55210.2707 P/2010 A3 0.26+/-‐ 0.03 0.77+/-‐ 0.18 35.0+/-‐ 6.4 143+/-‐ 26 Y 55212.0207 P/2010 A5 0.26+/-‐ 0.03 0.97+/-‐ 0.22 100+/-‐ 18 229+/-‐ 42 Y 55216.6539 P/2010 H2 0.30+/-‐ 0.04 0.34+/-‐ 0.08 14.1+/-‐ 2.6 184+/-‐ 34 Y 55383.7010
Long-‐Period Comets C/2005 L3 .16+/-‐.02 .21+/-‐ .05 1.2+/-‐ 0.2 79+/-‐ 15 Y 55340.7430 C/2006 S3 .17+/-‐ .02 .18+/-‐ .05 1.4+/-‐ 0.2 105 +/-‐ 20 Y 55339.2785 C/2006 W3 5.4 +/-‐ 0.5 10.2 +/-‐ 2.3 239+/-‐ 44 4679+/-‐856 Y 55306.4048 C/2007 G1 0.04+/-‐ 0.01 0.11+/-‐ 0.03 1.1+/-‐ 0.2 48+/-‐ 9 Y 55241.1257 C/2007 Q3 14+/-‐ 1 25 +/-‐ 6 2670 +/-‐ 490 10250+/-‐ 1880 Y 55206.2567
1.17 +/-‐ 0.12 1.40 +/-‐ 0.32 84 +/-‐ 15 1039 +/-‐ 190 Y 55350.7043 C/2007 VO53 0.15+/-‐ 0.02 0.09+/-‐ 0.03 1.3+/-‐ 0.2 52.+/-‐ 10 Y 55221.0320
C/2008 FK75 0.25+/-‐ 0.03 0.19+/-‐ 0.05 4.7+/-‐ 0.9 149+/-‐ 28 Y 55274.3736 C/2008 N1 0.25+/-‐ 0.03 0.30+/-‐ 0.07 17.2+/-‐ 3.2 178+/-‐ 33 Y 55230.6399
0.10+/-‐ 0.02 0.17+/-‐ 0.04 3.0+/-‐ 0.6 52+/-‐ 10 Y 55352.0180 C/2008 Q3 0.08+/-‐ 0.01 0.37+/-‐ 0.09 5.9+/-‐ 1.1 93+/-‐ 17 Y 55309.7180 C/2009 F6 -‐-‐ 0.02+/-‐0.01 1.0+/-‐ 0.2 25+/-‐ 5 Y 55256.9693

Discovery & CO+CO2 Bauer et al. 2015
28 9/28/15 12:07 PM
C/2009 K5 1.47+/-‐ 0.33 4.46+/-‐ 1.14 -‐-‐ -‐-‐ Y 55482.7423 C/2009 P1 0.35+/-‐ 0.04 0.67+/-‐ 0.16 4.4+/-‐ 0.8 221+/-‐ 41 Y 55353.4424 C/2009 T1 0.07+/-‐ 0.01 0.06+/-‐ 0.02 0.37+/-‐ 0.07 27.2+/-‐ 5.2 Y 55211.2139 C/2009 U3 0.69+/-‐ 0.07 2.82+/-‐ 0.64 56+/-‐ 10 192+/-‐ 36 Y 55212.6884 C/2010 J1 1.13+/-‐ 0.12 2.97+/-‐ 0.67 230+/-‐ 42 521+/-‐ 96 Y 55288.3078
0.06+/-‐ 0.01 0.45+/-‐ 0.11 36+/-‐ 7 85+/-‐ 16 Y 55378.5134
3.2 Nucleus Sizes
In order to extract the nucleus signal for the WISE/NEOWISE comet discoveries, we
used routines developed by our team (Lisse et al. 1999 and Fernandez et al. 2000) to
fit the coma as a function of angular distance from the central brightness peak along
separate azimuths, as applied in Bauer et al. 2011, and 2012b. As per the description
in Lisse et al. (1999), the model dust coma was created using the functional form f
(Θ) × ρ−n, where ρ is the projected distance on the sky from the nucleus and Θ is the
azimuthal angle. In order to compensate for the WISE instrumental effects, the
model coma was then convolved with the instrumental PSF appropriate for AWAIC
co-‐added images for the matching phase of the mission (see Cutri et al. 2012). Radial
cuts through an image of the comet were made every 3◦ in azimuth, and the best-‐fit
radial index, n, and scale, f, at each specific azimuth were found by a least-‐squares
minimization fit of the model to the data along that azimuth. The pixels between 5
and 20 arcsec of the brightness peak were used to fit the model coma. For most
comets, the coma model fit residuals yielded uncertainty in the photometry of the
*Fluxes from stacked images of comets observed by WISE/NEOWISE. If an object was observed at multiple epochs these are tabulated separately in the observation dates column. Apertures of 11 arcsec in radius were used for the flux values, and the uncertainties were derived from the background noise statistics measured in the stacked images. Whether the comet had apparent coma (Y=Yes, N=No, U=Uncertain), and the mid-‐point times of each combined image set from each visit are listed in the table’s last two columns.

Discovery & CO+CO2 Bauer et al. 2015
29 9/28/15 12:07 PM
extracted point-‐source ∼10% for the W3 and W4 images; these uncertainties were
similar to the photometric uncertainties in the combined nucleus and coma signals.
However, higher residuals ~30% were seen for comets C/2010 L5 and C/2010 J4,
and are therefore noted as possible upper limits to the nucleus sizes. We also note
below that WISE imaged the predicted position of C/2010 L5 in January, before its
discovery and did not detect the comet. The detection threshold is less than, but on
the order of, the listed nucleus size in Table 3 (Kramer et al. 2015).
The extracted nucleus signals in W3 and W4 were fit to a NEATM model (Harris
1998, Delbo et al. 2003, and Mainzer et al. 2011b) with fixed beaming (η)
parameters. The fits to only 2 extracted thermal flux points, with increased
uncertainties from the raw extractions, were too poorly constrained to leave η as a
free parameter to the fit such that it converged to physically realistic values
between 0.5 and 3.0. For each comet, fits were used with beaming parameter values
fixed to 0.8, 1.2 (Stansberry et al. 2008), and 1.0 (Fernandez et al. 2013). Note that
each attempt of a fit requires an interpolation for surface temperature in the WISE
bands (Wright et al. 2010), so that different flux values are derived for each final fit.
Table 3 presents the fit results and uncertainties, while it should be noted that,
owing to the uncertainty inherent in the thermal models, there is an additional
∼10% uncertainty in the derived diameter values (Mainzer et al. 2011b, 2011c). The
interpolated corrections for temperature are largest in W3. Note that for P/2015 J3
(NEOWISE), the size was based on the W2 signal assuming no coma contamination
for an object with a beaming parameter of 1.

Discovery & CO+CO2 Bauer et al. 2015
30 9/28/15 12:07 PM
Unlike the asteroids, in most cases the visual band magnitudes of the nuclei were
unmeasured. Nuclei were either obscured by activity at shorter wavelengths, or
were not measured at distances where they were inactive. Since only the 12 and 22
µm channel images were used (except for P/2015 J3), the albedo was relatively
unconstrained. For the thermal fits of the diameters, the geometric visible albedo
(pv) was free, but always converged near the initial condition of a few percent. We
used the beaming parameter that provided the smallest fit residuals; those η values
are listed in Table 3. An assumed 0.2 uncertainty in is included in the listed
diameter uncertainty. However, the uncertainty in pv would have negligible effect,
and so no uncertainty from that term is included with the diameter values listed in
Table 3.
Table 3: Nucleus Sizes of the Cryogenic Mission Cometary Discoveries.
Comet Diameter [km] η pv Comments
P/2010 D1 2.53+/-‐0.89 1.2 0.04
P/2010 D2 4.65+/-‐1.05 1.2 0.04
P/2010 B2 0.99+/-‐0.22 1.2 0.04
245P 1.50+/-‐0.33 1.2 0.04
P/2010 N1 0.86+/-‐0.26 0.8 0.04
233P 1.08+/-‐0.22 1.2 0.04
P/2009 WX51 0.43+/-‐0.10 1.2 0.04
C/2010 E3 1.73+/-‐0.36 1.2 0.04 No coma seen during WISE observations; JPL Horizon’s nucleus magnitude yields pv=0.023+/-‐0.01
C/2010 J4 0.56+/-‐0.2 1.2 0.03 possible upper limit

Discovery & CO+CO2 Bauer et al. 2015
31 9/28/15 12:07 PM
C/2010 L4 3.4+/-‐0.72 1.2 0.04
C/2010 L5 2.2+/-‐0.86 1.0 0.05 possible upper limit
C/2010 D3 4.3+/-‐0.96 1.0 0.04
C/2010 DG56 1.51+/-‐0.27 1.2 0.04 No coma seen; JPL Horizon’s nucleus visible magnitude yields pv=0.021+/-‐0.005
C/2010 KW7 5.69+/-‐1.6 1.0 0.04 JPL Horizon’s nucleus magnitude yields pv=0.025+/-‐0.005
P/2010 JC81 15.7+/-‐4.74 0.8 0.03 No coma seen; JPL Horizon’s nucleus visible magnitude yields pv=0.03+/-‐0.02
P/2010 P4 0.94+/-‐0.16 1.2 0.05
237P 2.06+/-‐0.34 1.0 0.04
C/2010 G3 7.84+/-‐1.44 1.2 0.04
C/2010 FB87 4.88+/-‐1.12 1.2 0.04
C/2010 D4 25.6+/-‐6.8 0.8 0.05 No coma seen; JPL Horizon’s nucleus visible magnitude yields pv=0.05+/-‐0.02
P/2010 K2 0.74+/-‐0.11 1.0 0.05
P/2015 J3 2.3+/-‐0.82 1.0 0.02 No coma seen during NEOWISE observations; JPL Horizon’s nucleus magnitude yields pv=0.02+/-‐0.02
3.3 Dust Photometry, Temperature, and CO2/CO Production Measurements
From the total NEOWISE/WISE-‐observed sample of comets during the prime
mission, 62 comets (or 38%) showed significant signal in W2, as shown in Tables 1
and 2. Not all comets that show significant signal in W2 have significant 4.6 µm flux
excess. Some of the signal in W2 is due to the thermal and reflected light emission of
the dust. In order to constrain the dust (and potentially nucleus) thermal and
reflected light flux component, it is necessary to extrapolate from the thermal and
shorter wavelengths. We fit a Planck function to the W3 and W4 flux, and a solar

Discovery & CO+CO2 Bauer et al. 2015
32 9/28/15 12:07 PM
spectrum to the W1 flux for each comet. Using these two components, we
determined the predicted flux at W2 (see Figure 3). We consider the flux in excess
of the dust (and nucleus) signal when the flux is significantly (at the 3-‐sigma level)
above the estimated dust and nucleus signal. We use this criterion to be certain of
the excess. For those few cases (107P, 169P, and C/2009 F6) where there is weak or
no significant W1 signal, we calculate the reflected light signal from the dust thermal
signal and assume a corresponding emissivity of 0.9, and a surface reflectance of
~0.1 to convert this to a reflected light component. For the objects lacking thermal
flux measurements (C/2014 C3, P/2014 L2, C/2014 N3, and C/2009 K5), we make
the reverse assumptions and extrapolate the thermal component (Stevenson et al.
2015). Using these methods, 42 comets show W2 excess. The excess flux is then
converted into CO2 production estimates using the method described in Bauer et al.
(2011, 2012a,b).
We noted in section 2.3 that the 3.4 µm coma signal is likely dominated by dust.
However we note here that though that is probably true in most cases when the
comet has a moderate to high dust-‐to-‐gas ratio, for rare gassy comets it may be that
a small but significant component of the signal may be due to weak emission lines,
leading to an overall significant contribution to the signal by emissions from
organics and OH. Because this is the only reflected light baseline point, the 3.4 µm–
based dust reflected light scaling could lead to uncertainties in the baseline fit in
some cases. The result would be an underestimate of the CO+CO2 production. We
also note, however, the case of C/2006 W3 (Christiansen), which had a reportedly
Discovery & CO+CO2 Bauer et al. 2015
33 9/28/15 12:07 PM
high gas content (cf. de Val-Borro et al. 2014), yet for which we had no significant
W1 signal, and derived a high CO+CO2 production.
The CO2 production rates (QCO2) are provided as a proxy for the combine CO+CO2
production (see Section 4.6), and as a convenience for analysis of the behavior of the
comets, with noted limitations regarding the true fraction of the CO and CO2 species
present. The listed uncertainties in the derived CO2 production rates are the
combination of two components. The first component is the uncertainty in the
calculated dust contribution as constrained by the W1, W3, and W4 photometry, a
comparatively small component owing to the requirement that the flux is
significantly (at the 3-‐sigma level) above the estimated dust and nucleus signal. The
second component in the listed uncertainty is from the uncertainty in the W2 signal
photometry, and is added in quadrature with the dust model uncertainty. Possible
systematic sources of uncertainties, such as large variations in the fraction of CO
relative to CO2 or contributions to the W1 flux from non-‐dust signal, are not
included in the tabulated uncertainty values.
Lisse et al. 1998 demonstrated how broadband photometry can be applied to
determine the quantity and temperature of the coma dust. As in Bauer et al. (2011,
2012a,b), we performed blackbody temperature fits to the dust coma region
surrounding the nucleus, extracting the W3 and W4 measured nucleus flux
contribution from the thermal signal. We calculate the effective area for the dust
using 9, 11 and 22 arcsec radius apertures. For the thermal bands, this derived area

Discovery & CO+CO2 Bauer et al. 2015
34 9/28/15 12:07 PM
has a factor of the emissivity, ε, incorporated into the result. Division by the
projected length scale of the apertures, i.e., the ρ value, and by the constant π,
provides an aperture-‐independent means of comparison to the quantity of dust
visible at particular wavelengths analogous to Afρ (A’Hearn et al. 1984). We call this
factor εfρ, as introduced by Lisse et al. (2002) and used in Kelley et al. (2012), which
is listed in Table 4. The value of εfρ assumes that the observed flux is attributable
primarily to the dust continuum emission and is the product of the emissivity, ε, the
fractional area within an aperture filled by the dust, f, and the projected length scale
of the aperture radius on the sky at the distance of the comet, ρ, expressed in
centimeters. We compute our εfρ values multiplying the observed surface
brightness of the comet, Iλ, by ρ and dividing by the Planck function, Bλ (Tb), where
Tb is the fitted blackbody temperature of the dust. The effective area is derived from
this quantity by multiplying by πρ/ε using an assumed value of ε ≈ 0.9. Our
uncertainties come from the standard deviation between the derived values for 9,
11, and 22 arcsecond apertures. Note that we do not correct εfρ values for phase
angle (the Sun-‐target-‐observer angle) effects, and where we are assuming an
idealized 1/ behavior in our estimates of uncertainty, we do not find strong
deviations in most cases.
The derived dust and production rates are listed in Table 4. It should be noted that
for the comets without W3 or W4 signal, it is not possible to derive εfρ values
directly from measurements. Therefore, we estimated these values based on the
means of the (εf -‐ Af) values (denoted (f f )) from our comet sample that had
W1 and W3 or W4 signal. We found a mean value of (f f) = 0.74 +/-‐ 0.29 from
Discovery & CO+CO2 Bauer et al. 2015
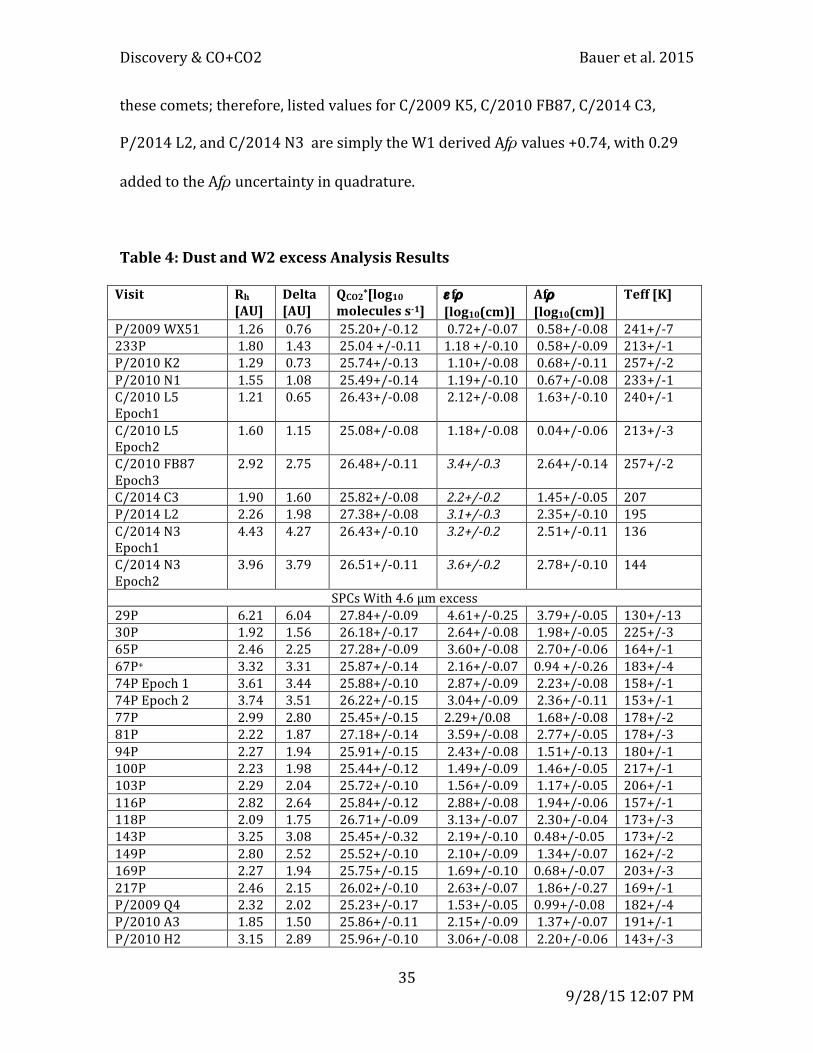
35 9/28/15 12:07 PM
these comets; therefore, listed values for C/2009 K5, C/2010 FB87, C/2014 C3,
P/2014 L2, and C/2014 N3 are simply the W1 derived Af values +0.74, with 0.29
added to the Af uncertainty in quadrature.
Table 4: Dust and W2 excess Analysis Results
Visit Rh [AU]
Delta [AU]
QCO2*[log10 molecules s-‐1]
f [log10(cm)]
Af [log10(cm)]
Teff [K]
P/2009 WX51 1.26 0.76 25.20+/-‐0.12 0.72+/-‐0.07 0.58+/-‐0.08 241+/-‐7 233P 1.80 1.43 25.04 +/-‐0.11 1.18 +/-‐0.10 0.58+/-‐0.09 213+/-‐1 P/2010 K2 1.29 0.73 25.74+/-‐0.13 1.10+/-‐0.08 0.68+/-‐0.11 257+/-‐2 P/2010 N1 1.55 1.08 25.49+/-‐0.14 1.19+/-‐0.10 0.67+/-‐0.08 233+/-‐1 C/2010 L5 Epoch1
1.21 0.65 26.43+/-‐0.08 2.12+/-‐0.08 1.63+/-‐0.10 240+/-‐1
C/2010 L5 Epoch2
1.60 1.15 25.08+/-‐0.08 1.18+/-‐0.08 0.04+/-‐0.06 213+/-‐3
C/2010 FB87 Epoch3
2.92 2.75 26.48+/-‐0.11 3.4+/-‐0.3 2.64+/-‐0.14 257+/-‐2
C/2014 C3 1.90 1.60 25.82+/-‐0.08 2.2+/-‐0.2 1.45+/-‐0.05 207 P/2014 L2 2.26 1.98 27.38+/-‐0.08 3.1+/-‐0.3 2.35+/-‐0.10 195 C/2014 N3 Epoch1
4.43 4.27 26.43+/-‐0.10 3.2+/-‐0.2 2.51+/-‐0.11 136
C/2014 N3 Epoch2
3.96 3.79 26.51+/-‐0.11 3.6+/-‐0.2 2.78+/-‐0.10 144
SPCs With 4.6 µm excess 29P 6.21 6.04 27.84+/-‐0.09 4.61+/-‐0.25 3.79+/-‐0.05 130+/-‐13 30P 1.92 1.56 26.18+/-‐0.17 2.64+/-‐0.08 1.98+/-‐0.05 225+/-‐3 65P 2.46 2.25 27.28+/-‐0.09 3.60+/-‐0.08 2.70+/-‐0.06 164+/-‐1 67P+ 3.32 3.31 25.87+/-‐0.14 2.16+/-‐0.07 0.94 +/-‐0.26 183+/-‐4 74P Epoch 1 3.61 3.44 25.88+/-‐0.10 2.87+/-‐0.09 2.23+/-‐0.08 158+/-‐1 74P Epoch 2 3.74 3.51 26.22+/-‐0.15 3.04+/-‐0.09 2.36+/-‐0.11 153+/-‐1 77P 2.99 2.80 25.45+/-‐0.15 2.29+/0.08 1.68+/-‐0.08 178+/-‐2 81P 2.22 1.87 27.18+/-‐0.14 3.59+/-‐0.08 2.77+/-‐0.05 178+/-‐3 94P 2.27 1.94 25.91+/-‐0.15 2.43+/-‐0.08 1.51+/-‐0.13 180+/-‐1 100P 2.23 1.98 25.44+/-‐0.12 1.49+/-‐0.09 1.46+/-‐0.05 217+/-‐1 103P 2.29 2.04 25.72+/-‐0.10 1.56+/-‐0.09 1.17+/-‐0.05 206+/-‐1 116P 2.82 2.64 25.84+/-‐0.12 2.88+/-‐0.08 1.94+/-‐0.06 157+/-‐1 118P 2.09 1.75 26.71+/-‐0.09 3.13+/-‐0.07 2.30+/-‐0.04 173+/-‐3 143P 3.25 3.08 25.45+/-‐0.32 2.19+/-‐0.10 0.48+/-‐0.05 173+/-‐2 149P 2.80 2.52 25.52+/-‐0.10 2.10+/-‐0.09 1.34+/-‐0.07 162+/-‐2 169P 2.27 1.94 25.75+/-‐0.15 1.69+/-‐0.10 0.68+/-‐0.07 203+/-‐3 217P 2.46 2.15 26.02+/-‐0.10 2.63+/-‐0.07 1.86+/-‐0.27 169+/-‐1 P/2009 Q4 2.32 2.02 25.23+/-‐0.17 1.53+/-‐0.05 0.99+/-‐0.08 182+/-‐4 P/2010 A3 1.85 1.50 25.86+/-‐0.11 2.15+/-‐0.09 1.37+/-‐0.07 191+/-‐1 P/2010 H2 3.15 2.89 25.96+/-‐0.10 3.06+/-‐0.08 2.20+/-‐0.06 143+/-‐3

Discovery & CO+CO2 Bauer et al. 2015
36 9/28/15 12:07 PM
LPCs with 4.6 µm excess C/2005 L3 8.21 8.08 26.91+/-‐0.10 3.92+/-‐0.08 3.15+/-‐0.09 102+/-‐2 C/2006 S3 7.23 7.16 26.55+/-‐0.14 3.93+/-‐0.07 3.05+/-‐0.05 104+/-‐1 C/2006 W3 4.15 4.02 27.88+/-‐0.09 4.76+/-‐0.07 3.83+/-‐0.01 133+/-‐3 C/2007 Q3 Epoch 1
2.50 2.25 27.55+/-‐0.10 4.18+/-‐0.08 3.53+/-‐0.05 192+/-‐2
C/2007 Q3 Epoch 2
3.45 3.27 26.68+/-‐0.10 3.85+/-‐0.07 2.91+/-‐0.04 144+/-‐1
C/2008 FK75 4.77 4.66 25.97+/-‐0.12 3.53+/-‐0.09 2.65+/-‐0.08 120+/-‐1 C/2008 N1 Epoch 1
3.08 2.93 25.93+/-‐0.10 2.96+/-‐0.08 2.07+/-‐0.08 150+/-‐2
C/2008 N1 Epoch 2
3.76 3.53 25.99+/-‐0.32 2.68+/-‐0.09 2.01+/-‐0.09 136+/-‐2
C/2008 Q3 3.97 3.79 26.47+/-‐0.10 2.95+/-‐0.08 1.98+/-‐0.06 139+/-‐3 C/2009 K5 2.65 2.45 27.06+/-‐0.10 3.35+/-‐0.2 2.63+/-‐0.09 176+/-‐1 C/2009 P1 6.33 6.23 27.16+/-‐0.10 4.03+/-‐0.09 3.17+/-‐0.10 111+/-‐1 C/2009 U3 1.67 1.29 26.34+/-‐0.10 2.15+/-‐0.08 1.64+/-‐0.05 201+/-‐2 C/2010 J1 Epoch 1
1.84 1.56 25.94+/-‐0.37 2.48+/-‐0.08 2.07+/-‐0.07 229+/-‐5
C/2010 J1 Epoch 2
2.49 2.20 25.71+/-‐0.16 1.88+/-‐0.09 1.23+/-‐0.08 222+/-‐3
* QCO2 production rates are a proxy for the combined rates derived from CO+CO2 emission (Section 3.3). + from Bauer et al. 2012b.

Discovery & CO+CO2 Bauer et al. 2015
37 9/28/15 12:07 PM
Fitting of dust and CO2 excess (Figure 3).
4 Discussion
The comets observed by the WISE/NEOWISE and Reactivated NEOWISE missions
represent the largest sample of comets observed in the near infrared, as
summarized in Table 5. The data sets, though obtained with the same spacecraft,
Figure 3: WISE 4.6 µm band (W2) contains CO 4.7 µm and CO2 4.3 µm emission lines. C/2009 P1 Garradd’s 4.6 µm band excess not consistent with reflected or thermal contributions of coma or nucleus, but are with CO2 & CO emission. The flux from the 3.4 µm (left red triangle), 4.6 µm (right red triangle), 12 µm (left orange diamond) and 22 µm (right orange diamond) channels are shown. Also the reflected light model (dotted line) thermal model (solid line) and combined signal (dashed line) are over-‐plotted.
1 10 100Wavelength (microns)
0.00010
0.0010
0.010
0.10
1.0
10.
1.0E+02
1.0E+03
Flux
(mJy
)
Teff = 110K
W4 W3 W2 W1
C/2009&P1&(Garradd)&
Discovery & CO+CO2 Bauer et al. 2015
38 9/28/15 12:07 PM
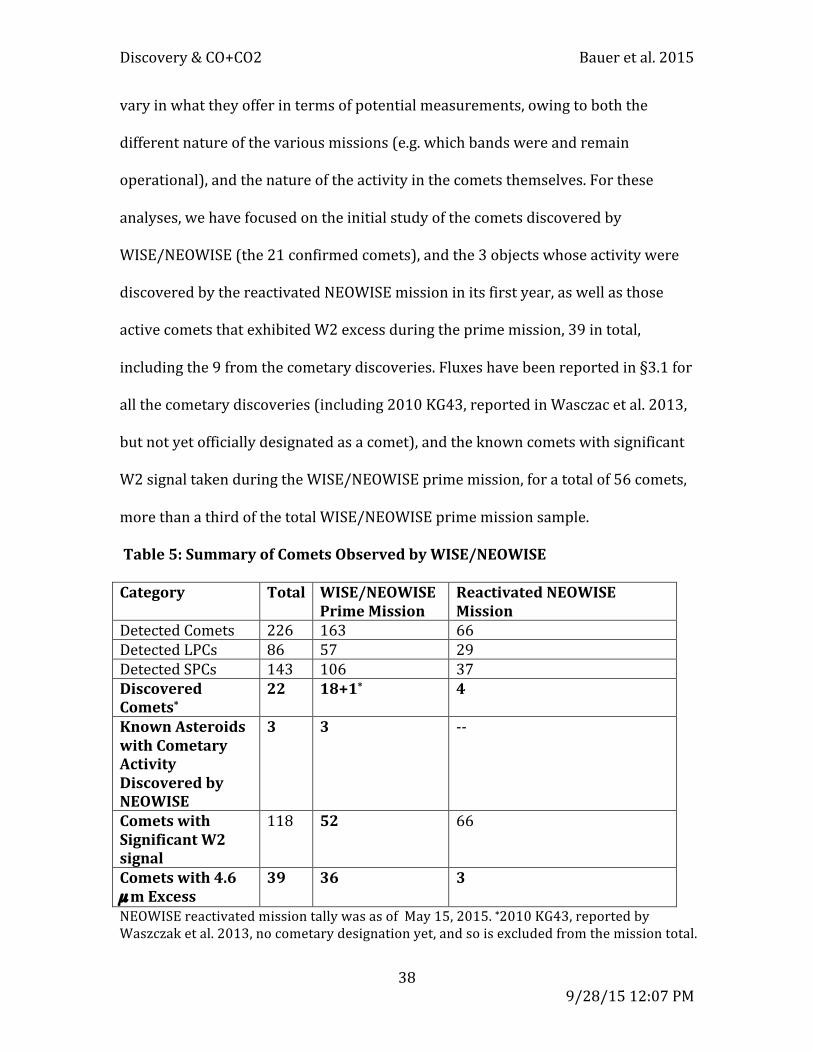
vary in what they offer in terms of potential measurements, owing to both the
different nature of the various missions (e.g. which bands were and remain
operational), and the nature of the activity in the comets themselves. For these
analyses, we have focused on the initial study of the comets discovered by
WISE/NEOWISE (the 21 confirmed comets), and the 3 objects whose activity were
discovered by the reactivated NEOWISE mission in its first year, as well as those
active comets that exhibited W2 excess during the prime mission, 39 in total,
including the 9 from the cometary discoveries. Fluxes have been reported in §3.1 for
all the cometary discoveries (including 2010 KG43, reported in Wasczac et al. 2013,
but not yet officially designated as a comet), and the known comets with significant
W2 signal taken during the WISE/NEOWISE prime mission, for a total of 56 comets,
more than a third of the total WISE/NEOWISE prime mission sample.
Table 5: Summary of Comets Observed by WISE/NEOWISE
Category Total WISE/NEOWISE Prime Mission
Reactivated NEOWISE Mission
Detected Comets 226 163 66 Detected LPCs 86 57 29 Detected SPCs 143 106 37 Discovered Comets*
22 18+1* 4
Known Asteroids with Cometary Activity Discovered by NEOWISE
3 3 -‐-‐
Comets with Significant W2 signal
118 52 66
Comets with 4.6 µm Excess
39 36 3
NEOWISE reactivated mission tally was as of May 15, 2015. *2010 KG43, reported by Waszczak et al. 2013, no cometary designation yet, and so is excluded from the mission total.

Discovery & CO+CO2 Bauer et al. 2015
39 9/28/15 12:07 PM
4.1 Thermal Dust:
The values for (f f ) were for active comets. The distributions of (f f ) were
similar for long and short period comets. The mean offset in the log values
corresponds roughly to the a factor of 5.5 difference, which is less than, but within a
factor if 1.6 of, what may be expected for a 3.4 µm albedo of ~0.1 and emissivity of
~0.9 for the same dust particles. The mean for (f f ), however, is notably
different when considering Rh (see Figure 4). The number of SPCs in this sample is
too small at large Rh to be statistically significant. Yet, for the LPCs in our sample, for
Rh < 3 AU, <(f f)> = 0.57 +/-‐ 0.14, and for Rh < 3 AU, <(f f)> = 0.86 +/-‐ 0.10.
This could be indicative of larger grains being lifted by activity at greater distances
rather than shorter, or possibly, and perhaps more likely, the persistence of larger
grains that remain in the dust coma after peak activity.

Discovery & CO+CO2 Bauer et al. 2015
40 9/28/15 12:07 PM
Figure 4: The difference between the log f values derived from 11 and 22 µm dust emission and the log Af values derived from 3.4 µm dust reflectance. LPCs (red symbols), and SPCs (blue) are show, with the WISE/NEOWISE discovered comets represented using triangles, and the remaining sample by filled circles. 4.2 NEOWISE Discovered Comets:
A total of 21 comets were discovered by WISE/NEOWISE during the prime mission,
and 4 additional comets have been discovered during the first year of the NEOWISE
reactivated mission. Of these 25 objects, 12 are designated LPCs, and those 10
observed during the prime mission have yielded constraints on their nucleus size
and dust, along with CO2 production rates. This gives us a good statistical basis to
search for differences between SPCs and LPCs that may be attributed to formation
conditions. This small set, a subset of the larger set of 163 comets observed, allows
for an unprecedented comparison of nucleus sizes between SPCs and LPCs, for

Discovery & CO+CO2 Bauer et al. 2015
41 9/28/15 12:07 PM
example, using the same methods for each comet. The same methodology does not
mean there is no variation on the efficacy of the methods, however, as each comet’s
behavior varies greatly. Constraints on dust and CO2 production require the comet
be active, or recently active in the case of the dust, where the presence of strong
activity during the WISE observations obviously hampers the derivation of nucleus
sizes. We provide a description for each comet’s behavior below (see also Figure 1).
237P/LINEAR (2002 LN13): Activity was first seen in this JFC by WISE 190 days after
its perihelion while at a distance of 2.70 AU from the sun. No significant signal was
observed in W1 or W2. A faint dust tail was apparent, as was a central condensation,
easily separable from the dust, which yielded a nucleus size of ~2 km.
233P/La Sagra (2009 WJ50): WISE viewed this Encke-‐type comet very close to its
perihelion distance, at 1.81 AU from the sun, just 34 days before perihelion. The
comet’s faint tail indicated activity, and significant W2 excess that yielded a CO2
production rate of 1.1×1025 molecules per second. A strong central peak in the
stacked image yielded an extracted nucleus flux corresponding to a size ~1 km.
P/2009 WX51 (Catalina): WISE viewed this NEC 61 days after its perihelion (q = 0.8
AU), when it was at a distance of 1.26 AU from the sun. The comet displayed a tail,
and significant W2 excess yielded a CO2 production rate of 1.6×1025 molecules per
second. The W3 and W4 signals showed a strong central condensation, and the
extracted nucleus flux yielded a size of <0.5 km.
P/2010 B2 (WISE): The first WISE-‐discovered comet, 2010 B2 (WISE), was detected
on 23 Jan 2010, just 32 days after its perihelion, at 1.64 AU, and again on 5 Aug 2010,
at an outbound heliocentric distance of 2.49 AU. With a Jupiter Tisserand invariant

Discovery & CO+CO2 Bauer et al. 2015
42 9/28/15 12:07 PM
(TJ) of > 3, and a semi-‐major axis less than Jupiter’s, the comet was categorized as an
Encke-‐type JFC. The first visit in January showed obvious activity, and detections in
all four bands. The second visit showed significant signal only at 12 and 22 µm. The
extracted flux from W3 and W4 in the first visit yielded nucleus size estimates, and
showed W2 excess in the total signal. Our size estimate of 0.99 +/-‐ 0.15 km implies
the nucleus comprises less than a quarter of the total signal in the bands. The
strength of the thermal signal in the second visit suggests the comet was still active
at a distance of 2.5 AU, or that the dust component was still significant (~50% of the
total signal), but did not have sufficient extended signal to remove the coma as was
possible in the images from the first visit.
P/2010 D1 (WISE): This comet, the second discovered by WISE on 17 February
2010, was detected only at one visit by WISE, 237 days after its perihelion, at a
heliocentric distance of 3.02 AU. A faint coma and tail was shown in the stacked W3
and W4 images, making it identifiably a comet. However, extracted W1 and W2
signals were very faint, near the level of the noise, at or below 3-‐sigma. The
extracted nucleus signal yielded a diameter of 2.5 km.
P/2010 D2 (WISE): The third comet discovered by WISE was also a JFC, and it was
detected only at one epoch by WISE curing the fully cryogenic mission, on 26
February, 2010. The images were taken very near to its perihelion, within 8 days, at
3.66 AU. As with P/2010 D1, the coma was faint, but present, yet lacked a distinctly
extended tail. Removal of the coma signal yielded a nucleus size estimate of 4.65 km.
In addition to strong flux in W3 and W4, the signal in the stacked images showed
faint (5-‐sigma) signal in W1, but no significant signal in W2 that may have indicated

Discovery & CO+CO2 Bauer et al. 2015
43 9/28/15 12:07 PM
CO2 or CO emission down to production limits (1-‐sigma) of 3×1025 and 3×1026
molecules s-‐1 , respectively.
C/2010 D3 (WISE): The first LPC discovered by WISE was detected at two separate
epochs during the cryogenic survey. The first visit spanned 5 days centered around
26 February 2010 when the comet was 189 days prior to perihelion at a distance of
4.28 AU, and again outbound, 60 days after perihelion, when the comet was at a
heliocentric distance of 4.52 AU. No significant W2 was detected in either visit,
although weak W1 signal was seen during the first visit, allowing for CO2 and CO
production rate limits of 4×1025 and 4×1026 molecules s-‐1, respectively. Faint coma
is discernable in the stacked images of W3 and W4 during both visits, and the
extracted nucleus signal yielded an estimated size of 4.3 km.
C/2010 D4 (WISE): This LPC was discovered on 28 February 2010, 335 days after it
perihelion, at a rather distant 7.43 AU from the sun. A second visit occurred over 5
July 2010, when the comet was at a larger heliocentric distance of 7.66 AU. The
comet is not very active in the WISE images. No significant signal is present in W1 or
W2, and the signal in W3 and W4 nearly match the WISE PSF, and are likely
dominated by the nucleus. The 12 and 22 µm flux measurements from both visits
yield a diameter of ~25km.
C/2010 DG56 (WISE): When this LPC was discovered, at a distance of 1.95 AU from
the Sun, 3 months prior to it perihelion, no signs of significant activity were
apparent. The stack of its PSF-‐like images for this first visit yielded a diameter of 1.5
km. When the comet was imaged again at a heliocentric distance of 1.87 AU on 26
July 2010, the comet was quite active, enough to sufficiently obscure the nucleus, so
Discovery & CO+CO2 Bauer et al. 2015
44 9/28/15 12:07 PM
that its signal could not be extracted from this second visit. However, though a slight
W2 excess was possibly present, it was not above a 3-‐sigma uncertainty.
C/2010 E3 (WISE): Imaged when it was only marginally active, this LPC is on a
parabolic orbit. The extracted nucleus signal yielded a size of 0.4 km, and no
significant W2 or W1 signal was present. The comet was at a distance of 2.3 AU from
the Sun at the time, very near its perihelion distance of 2.27 AU, which occurred one
month after its discovery.
C/2010 FB87 (WISE-‐Garradd): First observed inbound, the comet’s image nearly
matched the WISE spacecraft’s PSF in W3 and W4, and showed no significant signal
in W1 or W2. These first observations were made when the comet was at a distance
of 3.62 AU from the Sun, 224 days before perihelion. The comet was imaged a
second time, still 108 days before its perihelion, while at a heliocentric distance of
3.04 AU. A faint coma and tail were apparent in the images. WISE detected W1 and
W2 signal during its second visit, but no significant W2 excess. However, when the
comet was imaged by WISE a third time, in the post-‐cryogenic portion of the prime
mission, W2 excess was present. The comet was then outbound at a heliocentric
distance of 2.92 AU, 66 days following its perihelion at 2.84 AU.
C/2010 G3 (WISE): This LPC was detected on two separate visits, both during the
fully cryogenic phase of the WISE mission, and both while the comet was outbound.
The first was within 4 days of perihelion, and the second 83 days after perihelion.
With the furthest perihelion distance (4.9 AU) of the WISE/NEOWISE-‐discovered
comets, one might expect CO or CO2 to have driven the activity. Surprisingly, no
significant W1 or W2 signal was seen at either visit, yet W3 and W4 images revealed

Discovery & CO+CO2 Bauer et al. 2015
45 9/28/15 12:07 PM
both dust coma and tail. However, the dust modeling suggests that the activity
occurred more than a year prior to the observations, and that potentially, the dust
was composed of large-‐particles that lingered after the outburst. At such distances it
was unlikely that CO2, but rather that CO, was a possible driver. If so, the time of
outburst, 726 days prior to perihelion, would have sufficiently preceded the WISE
observations that the CO would have photo-‐dissociated. The predicted time scales
for CO dissociation at 4.9 AU are ~370 days or less (Huebner et al. 1992), and ~90
days for CO2.
C/2010 J4 (WISE): Comet C/2010 J4 was detected on two visits in May of 2010, the
first two days before its 3 May 2010 perihelion and the second 9 days after. This
parabolic comet had a perihelion distance of 1.09 AU, and came within 0.31 AU of
the Earth’s orbit. Both sets of observations showed significant coma and dust tails.
W2 signal was significant in the stacked images of both visits; however, no
significant excess above the dust thermal contribution was seen. The dust signal
heavily dominated the total signal, and the extracted nucleus flux and derived
diameter should therefore be taken as an upper limit.
P/2010 JC81 (WISE): This comet was detected twice during the WISE prime mission.
The first visit was during the 4-‐band fully cryogenic period, when the comet was at a
heliocentric distance of 3.9 AU, and the second was during the post-‐cryogenic period,
when the comet was 2.65 AU from the sun. The first and second visits were 350 and
180 days, respectively, before the comet reached its perihelion at 1.8 AU from the
sun, and before activity was noted by ground-‐based observations. The stacked
images of both visits show a near-‐bare PSF-‐like surface brightness profile. The fitted

Discovery & CO+CO2 Bauer et al. 2015
46 9/28/15 12:07 PM
temperature, about 40K above the black-‐body temperature, was consistent with a
nucleus with a beaming parameter ~0.8. No strong indication of W2 excess was
present in the fully cryogenic mission data, and the W1 and W2 fluxes in the second
visit were also consistent with a bare nucleus with a beaming parameter near 0.8,
and a visual-‐wavelength albedo on the order of a few percent. We note that it is
possible for comets to be very active even out to large heliocentric distances, though
small comets have been observed without coma as well. P/2010 JC81 should be an
interesting candidate for study upon its return in 2034 for signs of a large nucleus.
P/2010 K2 (WISE): This JFC was detected only once during the WISE fully cryogenic
mission, and it exhibited a faint tail in W3 and W4. The images were taken when the
comets was at a distance of 1.29 AU from the Sun, less than a tenth of an AU from its
perihelion distance, and within 41 days of its perihelion passage. There was a clear
W2 excess in the flux, which yielded a CO2 production value of 1.3×1025 molecules
per second. The extracted nucleus flux was consistent with a sub-‐km size diameter.
C/2010 KW7 (WISE): This LPC was imaged by WISE during the fully cryogenic
mission 255 days prior to its perihelion and again 148 days before perihelion, at
heliocentric distances of 3.7 and 3.0 AU, respectively. No significant W1 or W2
signal was seen in either data set. However, the W3 and W4 signals were strong, and
the W3 and W4 brightness profiles matched WISE PSFs for the two band-‐passes.
The data yielded a nucleus size for this body of ~6 km. Activity was later identified
by observations taken at Spacewatch (c.f. Scotti, J.V., Williams, G. V. 2010. Comet
C/2010 KW7 (WISE). Minor Planet Electronic Circulars 20.) 17 days following is
perihelion at 2.57 AU from the Sun.
Discovery & CO+CO2 Bauer et al. 2015
47 9/28/15 12:07 PM
245P/WISE (2010 L1): Activity was clearly shown in the first set of images WISE
obtained of this JFC. The stacked images yielded no significant W1 or W2 flux values.
The data were taken 120 days after the comet’s perihelion, when it was at a distance
of 2.6 AU from the sun. The nucleus signal extracted from the stacked images yields
a diameter of ~1.5 km.
C/2010 L4 (WISE): A dust coma and tail were apparent in the individual images of
this LPC, taken 112 days before its perihelion while the comet was at a distance of 3
AU. The stacked images showed no significant signal in the two shortest band passes.
The extracted nucleus signal corresponded to a diameter of 3.4 km.
C/2010 L5 (WISE): The comet C/2010 L5 was the only WISE-‐discovered Halley type
comet (HTC). It was strongly active when it was first detected 52 days after its
perihelion, and again 85 days after. W2 excess was apparent in both of these visits,
and yielded CO2 production rates of 2.7×1026 and 1.2×1025 molecules per second,
respectively. Because the comet was so active, the extracted nucleus signal, yielding
a diameter of ~2 km, should be regarded as an upper limit. This is further supported
by a non-‐detection at the comet’s predicted location in January (Kramer et al. 2015).
Large-‐grain dust modeling suggests that the comet’s peak activity was near
perihelion (Table 6). However, its worth noting that CO2 dissociation lifetimes are
~5 and 10 days for the comet’s heliocentric distances of 1.2 and 1.6 AU, respectively,
while CO2 and CO lifetimes are ~22 and 39 days at these distances. It is unlikely,
then, that outgassing had completely ceased very soon after perihelion. This
particular case is discussed in detail in Kramer et al. 2015.

Discovery & CO+CO2 Bauer et al. 2015
48 9/28/15 12:07 PM
P/2010 N1 (WISE): This inbound JFC was discovered at a heliocentric distance of
1.55 AU, 41 days prior to its perihelion. The comet was moderately active, but
showed a strong W2 excess and yielded CO2 production rates of 3.1×1025 molecules
per second. The extracted nucleus flux was consistent with a solid surface diameter
of 0.9km.
P/2010 P4 (WISE): The final comet WISE discovered during the prime mission was a
JFC, detected 31 days after its perihelion. The stacked image revealed a faint tail
with a morphology consistent with dust particles emitted long before perihelion. No
significant W1 or W2 signal was detected, and the extracted nucleus signal matched
a body with a diameter of 1.2km.
C/2014 C3 (NEOWISE): As with all three comets discovered during the first year of
the NEOWISE reactivated mission, no nucleus sizes could be confidently derived
from the W1 and W2 images, owing to the level of activity and dust signal observed
at these bandpasses. However, all three comets discovered by the reactivated
NEOWISE mission to date showed 4.6 µm channel excess. This long-‐period comet
showed W2 excess that yielded CO2 production rates of 6.6×1025 molecules per
second at a heliocentric distance of 1.9 AU, 29 days after its perihelion.
P/2014 L2 (NEOWISE): The second comet discovered during the reactivated
NEOWISE mission was a JFC. NEOWISE imaged the comet 37 days before it reached
perihelion, at a distance of 2.26AU from the sun. The stack images revealed a
remarkably extended morphology in W2 relative to the more compact dust coma
and tail in W1, and yielded a CO2 production rate of 2.4×1027 molecules per second.

Discovery & CO+CO2 Bauer et al. 2015
49 9/28/15 12:07 PM
C/2014 N3 (NEOWISE): This LFC was discovered by NEOWISE at a distance of 4.4
AU, 251 days prior to its perihelion, and it showed a faint tail and coma in the
stacked images. The W2 excess yielded a corresponding CO2 production rate of
2.7×1026 molecules per second, although CO production at a rate of 2.9×1027
molecules per second is the more likely driver at the distances the comet was
observed. A second visit occurred 90 days before perihelion (Rh=3.96 AU), and
apparent W2 excess yielded CO production rates of 3.9×1027 molecules per second.
P/2015 J3 (NEOWISE): The latest NEOWISE comet discovery was made on May 15,
2015 at a distance of 1.67AU from the Sun. The JFC showed no indication of activity
morphologically, but in ground-‐based follow-‐up images there was a faint tail. Size
estimates for the nucleus are 2.3 +/-‐ 0.7 kilometers, and reflectance 0.02 +/-‐ 0.02,
based on JPL’s Horizons rough estimate of the visual-‐band nuclear magnitude at
18.5.
2010 KG43: This body, on a centaur-‐like orbit, was found to be active by Waszczak et
al. (2013), but has not been confirmed as a comet. Significant flux values were
observed in W3 (3.3 +/-‐ 0.6 mJy) and W4 (9 +/-‐2 mJy) during the prime mission,
yielding a preliminary diameter of 4 +/-‐ 1 km, and an albedo of 0.02 +/-‐ 0.02 for the
object, assuming a beaming parameter near 1. This body is not included in the
further analyses, since it’s official cometary status remains undetermined.
4.3 Nucleus Size: The nucleus sizes of the discovery comets listed in Table 3 are
shown as cumulative distribution plots in Figure 5. This sample is not large enough
to make definitive conclusions as to the size frequency distribution power-‐law
Discovery & CO+CO2 Bauer et al. 2015
50 9/28/15 12:07 PM
exponents for the total or sub-‐samples of LPCs and SPCs. Additionally, these
samples are not de-‐biased in any way. However, because they were discovered by
the WISE spacecraft, neither are they pre-‐selected by a strong visual reflectance bias.
The data also includes two possible upper limits for the LPCs. However, these fall
well below sizes that would influence the mean fractional sizes of the samples. An
analysis using a minimum-‐variance unbiased estimator (MVUE) routine based on
Feigelson and Babu (2012) was utilized to examine a power-‐law relation. The
results were inconclusive, with the LPC sample yielding a size frequency
distribution power-‐law exponent, , of 1.4 +/-‐ 0.2, and the SPC sample yielding
=1.6 +/-‐ 0.2.
Figure 5 suggests that the LPC nuclei are, on average, larger than the SPC nuclei, by
something like a factor of ~2. This conclusion is consistent with a similarly sized
sample of LPCs presented in Lamy et al. (2004) compiled from sizes in the literature.
Statistically, however, the sample sizes are small; a Kolmogorov–Smirnov test of the
NEOWISE discovered LPC and SPC size distributions yields a 94% confidence that
the diameters come from different distributions. One of the sources in the Lamy et al.
(2004) compilation of diameters was Meech et al. (2004), which concluded from
visual-‐wavelength data that there was no average size difference between LPCs and
SPCs while using an assumed geometric albedo. Note also that our sample contains
SPCs with nuclei larger than 10 km in diameter. SPC nuclei on these scales were also
measured in the SEPPCoN sample reported by Fernández et al. (2013).

Discovery & CO+CO2 Bauer et al. 2015
51 9/28/15 12:07 PM
1 100
0.2
0.4
0.6
0.8
1
Figure 5: The cumulative size distribution of the nuclei of comets discovered by WISE/NEOWISE, including the 3 discoveries of activity (P/2002 LN31, P/2009 WX51, P/2009 WJ50), and P/2015 J3 from the NEOWISE reactivated mission, but not including the remaining 3 comets discovered during the reactivated mission since they had no 11 and 22 µm measurements and appeared active.
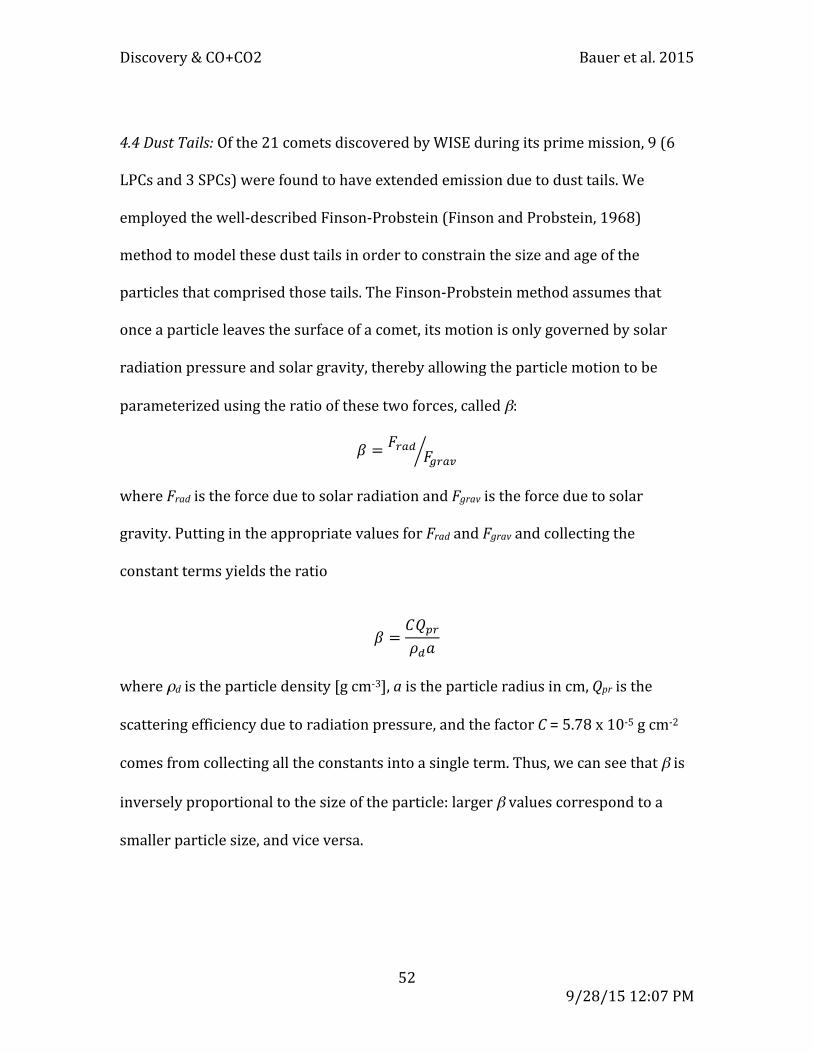
Discovery & CO+CO2 Bauer et al. 2015
52 9/28/15 12:07 PM
4.4 Dust Tails: Of the 21 comets discovered by WISE during its prime mission, 9 (6
LPCs and 3 SPCs) were found to have extended emission due to dust tails. We
employed the well-‐described Finson-‐Probstein (Finson and Probstein, 1968)
method to model these dust tails in order to constrain the size and age of the
particles that comprised those tails. The Finson-‐Probstein method assumes that
once a particle leaves the surface of a comet, its motion is only governed by solar
radiation pressure and solar gravity, thereby allowing the particle motion to be
parameterized using the ratio of these two forces, called β:
𝛽 = 𝐹!"#𝐹!"#$
where Frad is the force due to solar radiation and Fgrav is the force due to solar
gravity. Putting in the appropriate values for Frad and Fgrav and collecting the
constant terms yields the ratio
𝛽 =𝐶𝑄!"𝜌!𝑎
where ρd is the particle density [g cm-‐3], a is the particle radius in cm, Qpr is the
scattering efficiency due to radiation pressure, and the factor C = 5.78 x 10-‐5 g cm-‐2
comes from collecting all the constants into a single term. Thus, we can see that β is
inversely proportional to the size of the particle: larger β values correspond to a
smaller particle size, and vice versa.

Discovery & CO+CO2 Bauer et al. 2015
53 9/28/15 12:07 PM
The β parameter is incorporated into the equation of motion, which is then
integrated for a range of β values using a numerical integrator (based on the work of
Lisse et al., 1998, with the version used here described in further detail in Kramer
2014). For each comet, we ran the models for 5 years in 1-‐day increments, with β
values ranging from 0.0001 (roughly cm-‐sized particles) to 3.0 (sub-‐micron sized
particles). This allowed us to fully explore the reasonable parameter space for each
comet tail. The software returns a matrix of points that can be plotted as curves of
constant emission date (synchrones) or curves of constant β (syndynes). The
models were over-‐plotted on each corresponding W4 image, allowing the best β and
time since emission to be found for each comet.
In order to determine the heliocentric distance at which strong emission
occurred, we find the synchrone that most closely matches the brightest part of the
tail, giving the number of days since the emission occurred. We then step back in the
comet's orbit using the online tool Horizons from JPL to find the heliocentric
distance of the comet at that time. The values listed in Table 6 do not mean that
there were no small grains released, but more likely that either they have all been
swept away already or that they are not optically active at W3 and W4 wavelengths.
We further emphasize that this is not necessarily the only time that emission
occurred for the comet; it is only where strong emission of particles which are still
in the image frame occurred. Similarly for the interpretation of the syndynes, we
note that the β values listed in Table 6 correspond to the brightest part of the tail,

Discovery & CO+CO2 Bauer et al. 2015
54 9/28/15 12:07 PM
and there are likely particles both larger and smaller than suggested by the best β.
The results of this method are shown in Table 6, as well as in Figure 6.
Table 6: WISE/NEOWISE Discovery Comets Dust Model Summary Name Approx.
β Approx. Em. (yrs)
Approx. Em. (days)
Days since Perihelion
Approx. Rh at Em. (AU)
C/2010 DG56 (B) 0.003 0.2 73 73 1.59 C/2010 FB87 (B) 0.01 0.25 90 -‐107 3.46 C/2010 G3 (A) 0.001 2 730 4 7.3 C/2010 G3 (B) 0.001 2.25 821.25 84 7.35 C/2010 J4 (A) 0.003 0.1 30 -‐2 1.21 C/2010 J4 (B) 0.01 0.1 30 9 1.14 C/2010 L4 0.003 1 365 112 3.75 C/2010 L5 (B) 0.001 0.2 60 52 0.81 C/2010 L5 (C) 0.001 0.25 90 84 0.80 245P 0.003 0.25 90 119 2.16 P/2010 D1 1 1 1 238 1 P/2010 P4 0.001 1 365 32 3.18 P/2009 WX51 2 2 2 2 233P 0.1 0.1 30 -‐34 1.85 237P 2 2 2 2 1: Tail is present, but too short or faint to make even make an estimate. 2 Orbit plane angle separation is too small to separate syndynes and synchrones. Figure 6: Panel A (LHS) – example of FP modeling for comet C/2010 L5 (WISE). Panel B (RHS) – Plot of days from perihelion verses best fit (by eye) of ejection time. Note no obvious trend is discernable. Note that the = 0.1 for 233P is indicated by the blue arrow near the top of the page.

Discovery & CO+CO2 Bauer et al. 2015
55 9/28/15 12:07 PM
4.5 Dust Temperature: Figure 7 shows the distribution of effective dust temperature
based on the W3 and W4 band thermal fluxes. These may be effected by more than
the dust temperature, namely variations in emissivity with silicate emission features
(cf. Hanner et al. 2004). However, in a gross sense, these values are consistent with
isothermal bodies with emissivity ~0.9. The standard deviation of the points from
the thermal curve is +/-‐ 17K.
Figure 7: Teff is plotted as a function of Rh. As with previous plots, LPCs are indicated by read symbols, and SPCs by blue. The dashed line indicates the temperature of an isothermal body at the same distance from the sum with an emissivity of ~0.9. 4.6 CO+CO2: The presence of CO or CO2 manifests as a flux excess above the dust
signal, as well as a difference in the morphology in W2 (Sections 2.3 and 3.3). WISE
detected 163 comets during the prime WISE/NEOWISE mission. We found
significant W2 flux excess in 40 comets, listed in Table 4. Assuming CO2 was the
dominant source of the W2 excess for all 40, we have converted the flux excess into
CO2 production rate values (molecules per second), or QCO2. Of course, this is not
Discovery & CO+CO2 Bauer et al. 2015
56 9/28/15 12:07 PM
valid for all the 40 comets. We know significant CO was detected for 29P (Senay &
Jewitt 1994) and for C/2009 P1 (Garradd; Feage et al. 2014), observed at 6.2 and 6.3
AU, respectively, in the NEOWISE data. However, these values are readily
convertible to approximate CO production rates (QCO) by multiplication of the ratio
of CO2 to CO fluorescence efficiencies (gCO2/gCO = 11.6; c.f. Crovisier & Encrenaz
1983). The conversion to hypothetical QCO2 production rates facilitates possible
comparisons between CO2 and CO dominant behavior, and how it may be related to
the quantity of dust present. We note, as discussed in Section 3.3, the listed
uncertainties in the derived CO2 production rates are the combination of the
uncertainty in the calculated dust contribution as constrained by the W1, W3, and
W4 photometry, added to the uncertainty from the W2 signal. Possible systematic
sources of uncertainties, such as large variations in the fraction of CO relative to CO2
or contributions to the W1 flux from non-‐dust signal, are not included in the
tabulated values.
The QCO2 proxy and f values are plotted as a function of heliocentric distance in
Figure 8. Except that the 15 LPCs may be more active than 24 SPCs at heliocentric
distances greater than 4AU, no differentiating trend is readily apparent for CO2
production. To identify correlations, a Kendall-‐ test was applied to the LPC and SPC
distributions for comet heliocentric distance with CO2 production and with f; high
values near 1 indicate a correlation between the two parameters, and low values
(~-‐1) indicate anti-‐correlations, where values near zero indicate no correlation. A
second variable, the two-‐sided probability parameter, or p-‐value, is a test for a null
hypothesis, such that a low p-‐value indicates a higher likelihood of the result
Discovery & CO+CO2 Bauer et al. 2015
57 9/28/15 12:07 PM
indicated by the value. For example, a well-‐correlated pair of parameters, but
poorly sampled, would have and p-‐value close to 1, and well-‐sampled correlated
pair would have ~1 and the p-‐value ~0, but a well-‐sampled, but random, pair of
parameters would have both values close to zero. Inside of 4 AU, the Kendall-‐ test
yielded values near 0 (0.18 and -‐0.10 for LPCs and SCPs, respectively), with low
significance (p-‐values of 0.39 and 0.57 for LPCs and SPCs, respectively). Both SPCs
and LPCs appear to have similar distributions given the limited sample. This find, in
and of itself is a significant constraint on current solar system formation theories.
Dones et al. (2004), for example, place the source of Oort cloud comets and KBOs to
be near Jupiter and near Neptune, respectively. However, A’Hearn et al. (2012)
suggests that volatile abundances are similar for differing dynamical classes of
comets, implying a comparable formation environment between the CO and CO2
sublimation zones. This data set may affirm this notion, which places profound
constraints on the various solar system scenarios, specifically regarding planetary
migration. Such theories (cf. Walsh et al. 2011, Morbidelli et al. 2008) which have
previously suggested different formation regions for cometary types, may have to
account for the comparable compositional profiles between differing comet
dynamical populations.

Discovery & CO+CO2 Bauer et al. 2015
58 9/28/15 12:07 PM
Unsurprisingly, f values correlate well with SPCs (=0.5, p-‐value = 0.02) and LPCs
(=0.4, p-‐value = 0.02) alike, as suggested previously (cf. Kelley et al. 2013). When
the two values are ratio-‐ed (log10 QCO2 – log10 f), as in Figure 9, we find a relation
of Rh-‐2. Inverse proportionality with Rh have been seen with OH and CN (A’Hearn et
al. 1995), yet the relationship with CO2 is particularly clear. Furthermore, where the
A’Hearn et al. (1995) gas-‐to-‐dust ratio appears to go as Rh-‐1/2, what we find with
respect to CO2 gas is considerably steeper. Such behavior, whereby an increase in
CO2 gas production lacks a corresponding increase in dust production, was noted in
103P (A’Hearn et al. 2011). This relation persists out to 4AU, where the trend
deviates. If CO2 is expected to drive activity more within these ranges of Rh, this may
indicate that the bulk of CO2 may be endogenic with the dust. Alternatively, or
possibly concurrently, it may be that CO reaches its maximum production before
4AU if it resides at depth and its sublimation is not driven directly by surface
insolation of, say, near-‐surface CO ice, while CO2 is.
Figure 8: Panel A (LHS) excess flux in 4.6 µm channel converted to CO2 production plotted WRT heliocentric distance. Panel B (RHS) f as a function of heliocentric distance. Note the distributions for LPCs and SPC are similarly scattered.
Rh [AU] Rh [AU]
f
(log 1
0[cm
])
QCO
2%%[m
olec
ules
/s]
• LPCs • SPCs
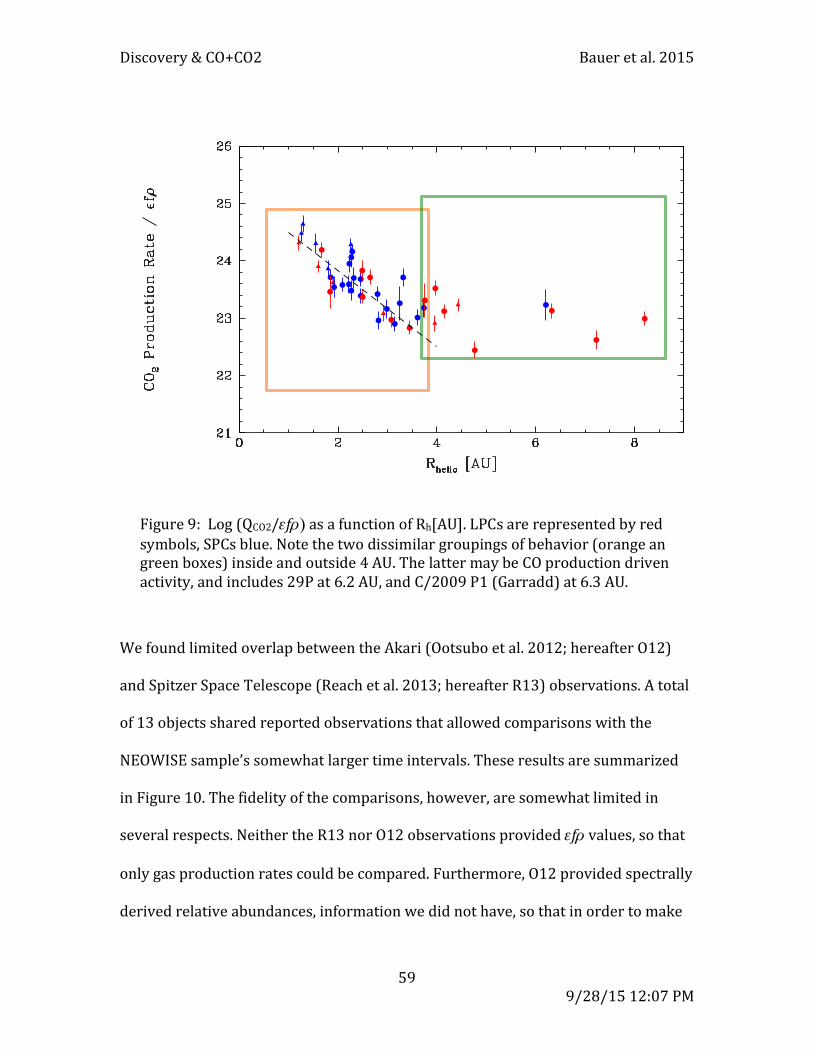
Discovery & CO+CO2 Bauer et al. 2015
59 9/28/15 12:07 PM
We found limited overlap between the Akari (Ootsubo et al. 2012; hereafter O12)
and Spitzer Space Telescope (Reach et al. 2013; hereafter R13) observations. A total
of 13 objects shared reported observations that allowed comparisons with the
NEOWISE sample’s somewhat larger time intervals. These results are summarized
in Figure 10. The fidelity of the comparisons, however, are somewhat limited in
several respects. Neither the R13 nor O12 observations provided f values, so that
only gas production rates could be compared. Furthermore, O12 provided spectrally
derived relative abundances, information we did not have, so that in order to make
Figure 9: Log (QCO2/f) as a function of Rh[AU]. LPCs are represented by red symbols, SPCs blue. Note the two dissimilar groupings of behavior (orange an green boxes) inside and outside 4 AU. The latter may be CO production driven activity, and includes 29P at 6.2 AU, and C/2009 P1 (Garradd) at 6.3 AU.

Discovery & CO+CO2 Bauer et al. 2015
60 9/28/15 12:07 PM
comparisons with our values, we converted the CO and CO2 rates into proxy CO2
production rates by dividing the O12 CO rate by 11.6, the scaling factor between the
line strengths, and adding it to the reported CO2 rate. Also, many of the comets that
overlapped nonetheless were observed at similar times and heliocentric distances.
Finally, we did not compare the limits of the non-‐detections in O12 and R13, but
only detections. We found that, similar to the behavior for other species as analyzed
in A’Hearn et al. (1995), variations in individual comet behavior did not clearly
indicate trends with heliocentric distance for our proxy CO2 values. What we found
with the aggregate total sample shown in Figure 8, with dispersed behavior, seemed
to match with the stochastic nature of cometary emission seen in Figure 10.
Figure 10: The comparative production rates of CO2 as a function of heliocentric distance in individual comets. SPCs (blue) and LPCs (red) observed by Akari (Ootsubo et al. 2012), Spitzer Space Telescope (Reach et al. 2013) and WISE/NEOWISE are shown with distinguishing symbols, and with their data points connected. The Akari CO and CO2 production rates were converted to proxy CO2 rates for comparison with the Spitzer and WISE data sets (See text).

Discovery & CO+CO2 Bauer et al. 2015
61 9/28/15 12:07 PM
5 Conclusions
The 25 NEOWISE cometary discoveries are a relatively small but important and
representative sample of comets detected by WISE/NEOWISE. We find the
following from our analysis of this smaller sample:
• Long period comet nuclei may be, on average, larger than small period comet
nuclei. Though the evidence from the sample is suggested, it must be
confirmed by later efforts to account for the effects of biases as a function of
orbital elements and size, as well as using the larger expanded sample from
the WISE data.
• Dust detected at longer thermal wavelengths is large, often up to sizes of
millimeters. Few comets reach peak activity after perihelion.
A total of 39 comets out of 163 detected by WISE/NEOWISE showed W2 excess,
comprising nearly a quarter of the total sample detected in the WISE prime mission
data. Our analysis of the sample of active comets, which have dust temperature
constraints and differ morphologically in the 4.6 µm band, suggests:
• There is little difference between the nature of the dust production of LPCs
and SPCs as a function of heliocentric distance.
• Similarly, the distribution of CO or CO2 production as a function of
heliocentric distance looks comparable for LPCs and SPCs, though
fractionally more LPCs may be producing CO or CO2 at heliocentric distances
greater than 4 AU. The appearance of more LPCs exhibiting CO+CO2 at these
greater distances may suggest an evolutionary effect, such that LPCs retain
Discovery & CO+CO2 Bauer et al. 2015
62 9/28/15 12:07 PM
their more volatile CO, while both LPCs and SPCs may have on average
similar CO2 abundances.
• Temperatures of dust seen at 12 and 22 µm are to first order well-‐
approximated by an isothermal black body with emissivity ~0.9 and with a
temperature range within +/-‐ 17K (1-‐ dispersion).
• The ratio of CO or CO2 production to the quantity of dust observed (f) may
follow a relation of ~Rh-‐2 within 4AU. No similar relation seems to persist for
greater distances. This may be attributable to different source regions
(surface vs. sub-‐surface) for cometary CO and CO2 emissions.
Acknowledgements
This publication makes use of data products from the Wide-‐field Infrared Survey
Explore, which is a joint project of the University of California, Los Angeles, and the
Jet Propulsion Laboratory/California Institute of Technology, funded by the National
Aeronautics and Space Administration. This publication also makes use of data
products from NEOWISE, which is a project of JPL/Caltech, funded by the Planetary
Science Division of NASA. This material is based in part upon work supported by the
NASA through the NASA Astrobiology Institute under Cooperative Agreement No.
NNA09DA77A issued through the Office if Space Science. R. Stevenson and E.
Kramer were supported by the NASA Postdoctoral Program, and E. Kramer
acknowledges her support through the NASA Earth and Space Science Fellowship
program. We thank the Astrophysical Journal Editor for the very helpful comments
regarding manuscript drafts, and the anonymous reviewer for providing valuable

Discovery & CO+CO2 Bauer et al. 2015
63 9/28/15 12:07 PM
comments, both of whom greatly improved the paper content. The lead author also
benefited greatly from a discussion with Nader Haghighipour of the Institute for
Astronomy and NASA Astrobiology Institute, University of Hawaii-‐Manoa.
References A'Hearn, M. F., Millis, R. L., Schleicher, D. G., Osip, D. J., Birch, P. V. 1995. The ensemble properties of comets: Results from narrowband photometry of 85 comets, 1976-1992.. Icarus 118, 223-270. A'Hearn, M. F. et al. 2012. Cometary Volatiles and the Origin of Comets. ApJ 758 29 A’Hearn, M. F., Belton, M. J. S., Delamere, W. A., et al. 2011. EPOXI at Comet Hartley 2. Science, 332, 1396. A’Hearn, M. F., Schleicher, D. G., Feldman, P. D., Millis, R. L., and Thompson, D. T. 1984. Comet Bowell 1980b. Astron. J. 89, 579-591. Bauer, J. M., Stevenson, R. A., Kramer, E., et al. 2014. Comparative CO/CO2 Production in NEOWISE-Observed Comets. AAS/Division for Planetary Sciences Meeting Abstracts, 46, #103.07. Bauer, J.M., Grav, T., Blauvelt, E., Mainzer, A.K., Masiero, J., Stevenson, R., Kramer, E., et al. 2013.Centaurs and Scattered Disk Objects in the Thermal Infrared: Analysis of WISE/NEOWISE Observations. ApJ., 773, 22. Bauer, J.M., Mainer, A.K., Grav, T., Walker, R.G., Masiero, J.R., et al., “WISE/NEOWISE Observations of Active Bodies in the Main Belt”, 2012a, ApJ. 747, 49. Bauer, J.M., Kramer, E., Mainzer, A. K., Stevenson, R., Grav, T., and 13 colleagues 2012b. WISE/NEOWISE Preliminary Analysis and Highlights of the 67p/Churyumov-Gerasimenko near Nucleus Environs. ApJ 758, 18. Bauer, J.M., Walker, R.G., Mainer, A.K., Masiero, J.R., Grav, T., et al., “WISE/NEOWISE Observations of Comet 103P/Hartley 2”, 2011, ApJ. 738, 171. Bockelée-Morvan, D., Crovisier, J. , Mumma, M. J., and Weaver, H. A., 2004. “The Composition of Cometary Volatiles.” In Comets II, Ed. by Festou, M. C., Keller, H. U. & Weaver, H. A., 391. Bockelée-Morvan, D., Brooke, T. Y., Crovisier, J. 1995. “On the Origin of the 3.2- to

Discovery & CO+CO2 Bauer et al. 2015
64 9/28/15 12:07 PM
3.6-µm Emission Feature in Comets.” Carus 116, 18. Chen J, Gupta AK (2000). Parametric Statistical Change Point Analysis. Birkhauser. Crovisier, J., Encrenaz, Th., Lelloouch, E., et al. 1999. “ISO spectroscopic observations of short-period comets.”, in The Universe as Seen by ISO, ed. P. Cox & M. F. Kessler (ESA SP-427; Noordwijk: ESA), 161. Cutri, R. M., Wright, E. L., Conrow, T., Bauer, J., Benford, D., Brandenburg, H., Dailey, J., Eisenhardt, P. R. M., et al. 2012. Explanatory Supplement to the WISE All-sky Data Release, 2011. (http://wise2.ipac.caltech.edu/docs/release/allsky/expsup/). de Val-Borro, M., Bockelée-Morvan, D., Jehin, E., et al. 2014, Asteroids, Comets, Meteors 2014, 545 Delbo, M. & Harris, A.W. 2002. Physical Properties of Near-Earth Asteroids from Thermal Infrared Observations and Thermal Modeling. M&PS 37, 1929-1936. Dello Russo, N., Vervack, R. J., Weaver, H. A., and Lisse, C. M. 2009. Infrared measurements of the chemical composition of C/2006 P1 McNaught. Icarus, 200, 271 Dones, L., Weissman, P. R., Levison, H. F., Duncan, M. J. 2004. “Oort cloud formation and dynamics.”, In Comets II, Ed. by Festou, M. C., Keller, H. U. & Weaver, H. A., 153. Feaga, L. M., A'Hearn, M. F., Farnham, T. L., et al. 2014. Uncorrelated Volatile Behavior during the 2011 Apparition of Comet C/2009 P1 Garradd., AJ, 147, 24. Fernández, Y.R., Lisse, C.M., Kaufl, H.U., Peschke, S.B., Weaver, H.A., A'Hearn, M.F., Lamy, P.P., Livengood, T.A., Kostiuk, T. 2000. Physical Properties of the Nucleus of Comet 2P/Encke. Icarus 147, 145-160. Fernández, Y. R., Kelley, M. S., Lamy, P. L., Toth, I., Groussin, O., Lisse, C. M., A’Hearn, M. F., Bauer, J. M., Campins, H. Fitzsimmonsg, A., Licandro, J., Lowry, S. C., Meech, K. J., Pittichová, J., Reach, W. T., Snodgrass, C., Weaver, H. A. 2013. Thermal Properties, Sizes, and Size Distribution of Jupiter-Family Cometary Nuclei. Icarus, 226, 1138. Finson, M. J., & Probstein, R. F. 1968. A theory of dust comets. I. Model and equations. ApJ, 154, 327 Fulle, M. 2004. Motion of cometary dust. In Comets II, Ed. by Festou, M. C., Keller, H. U. & Weaver, H. A., pp. 565-575.
Discovery & CO+CO2 Bauer et al. 2015
65 9/28/15 12:07 PM
Grav, T., Mainzer, A. K., Bauer, J., Masiero, J., Spahr, T., and 12 colleagues. 2012a. WISE/NEOWISE Observations of the Hilda Population: Preliminary Results. The Astrophysical Journal 744, 197. Grav, T., Mainzer, A. K., Bauer, J., Masiero, J., Spahr, T., and 12 colleagues. 2011. WISE/NEOWISE Observations of the Jovian Trojans: Preliminary Results. The Astrophysical Journal 742, 40. Hanner, M. S. and Bradley, J. P., 2004. Composition and Mineralogy of Cometary Dust. “The Sizes, Shapes, Albedos, and Colors of Cometary Nuclei.” in Comets II, ed. M. C. Festou, et al. (Tucson: Univ. of Arizona), 555. Harris, A. W. 1998. A Thermal Model for Near-‐Earth Asteroids. Icarus 131, 291-‐301. Huebner, W. F., Keady, J. J., & Lyon, S. P. 1992. Solar photo rates for planetary atmospheres and atmospheric pollutants. Ap&SS, 195, 1. M.S. Kelley et al. 2013. The persistent activity of Jupiter-‐family comets at 3–7 AU. Icarus 225, 475 Kramer, E., Bauer, J. M., Fernandez, Y. R., et al. 2015. The Perihelion Outburst Of Comet C/2010 L5 (WISE), ApJ. In prep. Kramer, E. , 2014. A Dynamical Analysis of Cometary Dust Tails Observed by WISE/NEOWISE. Ph.D. Dissertation, Univ. of Central Florida. Lamy, P. L. , Toth, I., Fernandez, Y. R., and Weaver, H. A. 2004. “The Sizes, Shapes, Albedos, and Colors of Cometary Nuclei.” in Comets II, ed. M. C. Festou, et al. (Tucson: Univ. of Arizona), 223. Lisse, C. M., A’Hearn, M. F., Hauser, M. G., Kelsall, T., Lein, D. D., Moseley, S. H., Reach, W. T., and Silverberg, R. F. 1998. Infrared Observations of Comets by COBE. ApJ. 496, 971-991. Lisse, C. M., Fernández, Y. R., Kundu, A., et al. 1999. The Nucleus of Comet Hyakutake (C/1996 B2) Icarus, 140, 189. Lisse, C. M., A'Hearn, M. F., Fernández, Y. R., and Peschke, S. B. 2002. A search for trends in cometary dust emission. IAU Colloq. 181: Dust in the Solar System and Other Planetary Systems 259. Mainzer, A., Bauer, J., Grav, T., Masiero, J., Cutri, R. M., Dailey, J., Eisenhardt, P.,

Discovery & CO+CO2 Bauer et al. 2015
66 9/28/15 12:07 PM
McMillan, R. S., Wright, E., Walker, R., Jedicke, R., Spahr, T., Tholen, D., Alles, R., Beck, R., Brandenburg, H., Conrow, T., Evans, T., Fowler, J., Jarrett, T., Marsh, K., Masci, F., McCallon, H., Wheelock, S., Wittman, M., Wyatt, P., DeBaun, E., Elliott, G., Elsbury, D., Gautier, T., Gomillion, S., Leisawitz, D., Maleszewski, C., Micheli, M. & Wilkins, A. 2011a. Preliminary Results from NEOWISE: An Enhancement to the Wide- field Infrared Survey Explorer for Solar System Science. ApJ. 731, 53-66. Mainzer, A., Grav, T., Masiero, J. et al. 2011b. Thermophysical Model Calibration for Minor Planets Observed with WISE/NEOWISE. ApJ. 736, 100-109. Mainzer, A., Grav, T., Masiero, J. et al. 2011c. Thermal Model Calibration for Minor Planets Observed with WISE/NEOWISE: Comparison with Infrared Astronomical Satellite, ApJL, 737, L9. Mainzer, A., Grav, T., Masiero, J., Bauer, J., McMillan, R. S., Giorgini, J., Spahr, T., Cutri, R. M., Tholen, D. J., Jedicke, R., Walker, R., Wright, E., Nugent, C. R. 2012. Characterizing Subpopulations within the near-Earth Objects with NEOWISE: Preliminary Results. ApJ 752, 110. Mainzer, A., Bauer, J., Cutri, R. M., et al. 2014. Initial Performance of the NEOWISE Reactivation Mission. ApJ, 792, 30. Masci, F. J. and Fowler, J.W. 2009. AWAIC: A WISE Astronomical Image Co-adder. In Astronomical Data Analysis Software and Systems XVIII ASP Conference Series, Vol. 411, proceedings of the conference held 2-5 November 2008 at Hotel Loews Le Concorde, Québec City, QC, Canada. Edited by David A. Bohlender, Daniel Durand, and Patrick Dowler. San Francisco: Astronomical Society of the Pacific, p.67 Masiero, J. R., Mainzer, A. K., Grav, T., Bauer, J. M., Cutri, R. M., and 13 colleagues 2011. Main Belt Asteroids with WISE/NEOWISE. I. Preliminary Albedos and Diameters. ApJ 741, 68. Masiero, Joseph R., Mainzer, A. K., Grav, T., Bauer, J. M., Cutri, R. M., Nugent, C., Cabrera, M. S. 2012. Preliminary Analysis of WISE/NEOWISE 3-Band Cryogenic and Post-cryogenic Observations of Main Belt Asteroids. ApJ. 159, 8 Meech, K.J., Hainaut, O. R., & Marsden, B. G. 2004. Comet nucleus size distributions from HST and Keck telescopes. Icarus 170, 463. Meech, K. J., & Svøren, J. 2004. “Using Cometary Activity to Trace the Physical and Chemical Evolution of Cometary Nuclei” in Comets II, ed. M. C. Festou, et al. (Tucson: Univ. of Arizona), 317. Morbidelli, A., Levison, H. F., Gomes, R.The Dynamical Structure of the Kuiper Belt and Its Primordial Origin. In: The Solar System Beyond Neptune, M. A. Barucci, H. Boehnhardt, D. P. Cruikshank, and A. Morbidelli (eds.), University of Arizona Press, Tucson, 592 pp., p.275-292

Discovery & CO+CO2 Bauer et al. 2015
67 9/28/15 12:07 PM
Ootsubo, T. et al. 2012. AKARI Near-infrared Spectroscopic Survey for CO2 in 18 Comets. ApJ 752 15 Pittichová, J., Woodward, C. E., Kelley, M. S. & Reach, W. T. 2008. Ground-Based Optical and Spitzer Infrared Imaging Observations of Comet 21P/GIACOBINI-ZINNER. Astron. J. 136, 1127-1136. Reach, W.T., Kelley, M.S., and Vaubaillon, J. 2013. Survey of cometary CO2, CO, and particulate emissions using the Spitzer Space Telescope. Icarus, 226, 777 Senay, M.C., and Jewitt, D. 1994. Coma formation driven by carbon monoxide release from comet Schwassmann-‐Wachmann 1, Nature 371, 229. Scotti, J.V., and Williams, G.V. 2010. Comet C/2010 KW7 (wise). Minor Planet Electronic Circulars 2010-W20. Stansberry, J., Grundy, W., Brown, M., Cruikshank, D., Spencer, J., Trilling, D., Margot, J.-L. 2008. Physical Properties of Kuiper Belt and Centaur Objects: Constraints from the Spitzer Space Telescope. In: The Solar System Beyond Neptune, M. A. Barucci, H. Boehnhardt, D. P. Cruikshank, and A. Morbidelli (eds.), University of Arizona Press, Tucson 592, pp.161-179. Stevenson, R., Bauer, J. M., Cutri, R. M., Mainzer, A. K., and Masci, F. J. 2015. NEOWISE Observations of Comet C/2013 A1 (Siding Spring) as It Approaches Mars. ApJ, 798, L31. Stevenson, R., Bauer, J. M., Kramer, E. A., Grav, T., Mainzer, A. K., Masiero, J. R. 2014. Lingering grains of truth around comet 17P/Holmes. ApJ.787, 116. Waszczak, A. and 10 co-authors. 2013. A Search for Main-Belt Comets in the Palomar Transient Factory Survey: I. Extended-Object Analysis. MNRAS, Submitted. Walsh, K. J., and Morbidelli, A. 2011. The effect of an early planetesimal-driven migration of the giant planets on terrestrial planet formation. Astron & Astroph. 526, 126. Knight, W.R. , “A Computer Method for Calculating Kendall’s Tau with Ungrouped Data”, Journal of the American Statistical Association, Vol. 61, No. 314, Part 1, pp. 436-439, 1966. Wright et al. 2010. The Wide-field Infrared Survey Explorer (WISE): Mission Description and Initial On-orbit Performance. ApJ. 140, 1868-1881.
Related Documents