The Nationwide Forest Imputation Study (NaFIS): Challenges, results and recommendations from the western United States Matt Gregory 1 , Emilie Grossmann 2 , Janet Ohmann 3 , Heather Roberts 1 1 Forest Ecosystems and Society, Oregon State University 2 Institute for Natural Resources, Oregon State University 3 PNW Research Station, USDA Forest Service

The Nationwide Forest Imputation Study (NaFIS): Challenges, results and recommendations from the western United States Matt Gregory 1, Emilie Grossmann.
Dec 14, 2015
Welcome message from author
This document is posted to help you gain knowledge. Please leave a comment to let me know what you think about it! Share it to your friends and learn new things together.
Transcript
The Nationwide Forest Imputation Study
(NaFIS): Challenges, results and
recommendations from the
western United States
Matt Gregory1, Emilie Grossmann2,
Janet Ohmann3, Heather Roberts1
1Forest Ecosystems and Society, Oregon State University2 Institute for Natural Resources, Oregon State University
3PNW Research Station, USDA Forest Service

The Genesis of NaFIS Loose affiliation of researchers from USFS and
universities split into eastern and western teams Core objective: Assess the utility of nearest-
neighbors mapping as a basis for nationwide: resource estimation landscape scenario/ecosystem modeling forest threats assessment and forest health monitoring
Develop tools and software to aid mapping Funding from FHTET, WWETAC and FIA
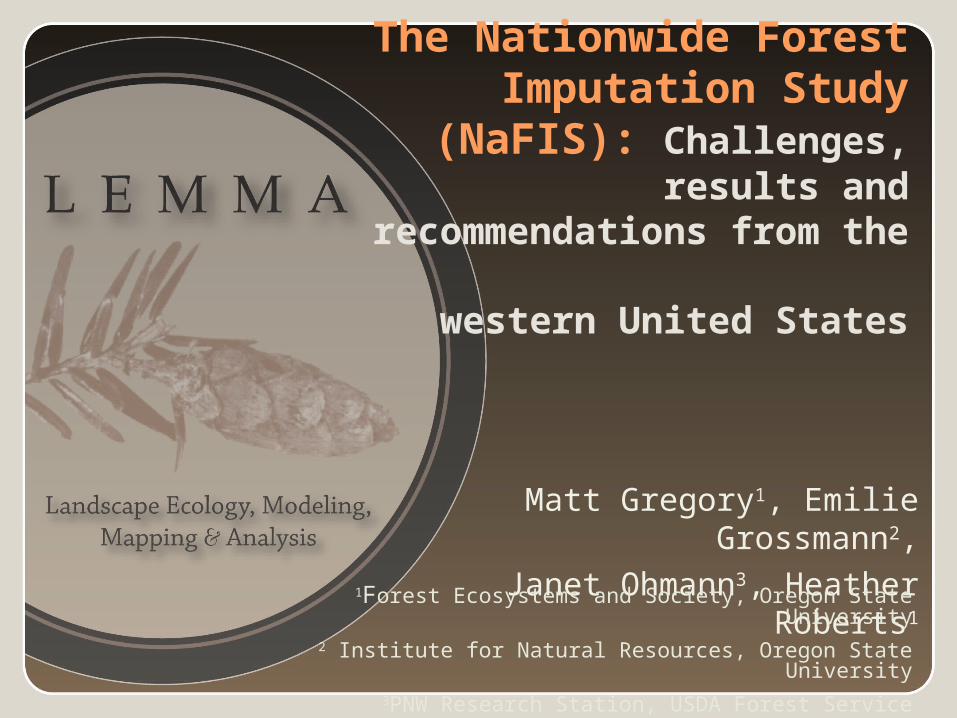
Why Use Nearest Neighbor Techniques
in Forest Mapping? Spatially explicit forest assessments for simulation
modeling, e.g. studies require tree lists for growth and yield modeling multivariate maps for habitat capability modeling
Small area estimation for national level inventories Role of forest inventories expanding from not only
answering “How much?” but also “Where?” (McRoberts and Tomppo, 2007)

7
19
28
43
51
54
63
NaFIS Pilot Areas
7
19
28
43
51
54
63

Oregon (7) Montana (19) Colorado (28)
Plot count 1468 1179 1787
Year range 2001 – 2006 2003 – 2007 2002 – 2007
Total area (mi. ha) 9.39 10.82 10.28*
Forest percentage estimate
69.2 45.5 60.1
NaFIS West Pilot AreasOregon Montana Colorado
Plot Database
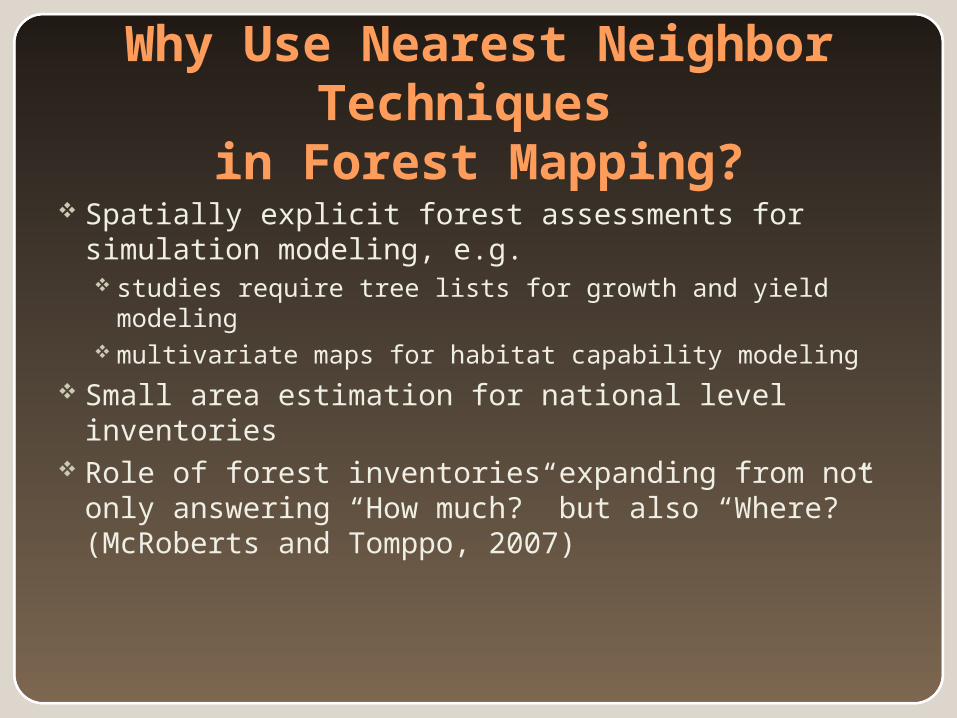
NaFIS data and methodology concepts Geospatial datasetsFIA Annual plot data
ID Species 1 BA
Species 2 BA
Species 3 BA
1 12.2 5.7 4.3
2 1.4 4.4 1.4
3 0.0 13.4 1.4
4 10.5 0.0 0.0Response variables | Species matrix | Y matrix
1
2
Topography
ClimateLandsat TM

Plot Database
NaFIS data and methodology concepts Geospatial datasetsFIA Annual plot data
ID Species 1 BA
Species 2 BA
Species 3 BA
1 12.2 5.7 4.3
2 1.4 4.4 1.4
3 0.0 13.4 1.4
4 10.5 0.0 0.0Response variables | Species matrix | Y matrix
1
2
ID ANNPRE TM4 DEM
1 741.0 2808.4 200.6
2 767.7 4263.3 385.0
3 724.5 3516.2 341.2
4 698.3 3216.8 271.4
Environmental variables | Covariates | X matrix

Design Choices for Nearest Neighbors Mapping
Distance metric to use to determine neighbor plotsEuclidean (EUC), CCorA (MSN), CCA (GNN),
Random Forest NN (RFNN) Number of neighbors (k) used in prediction With k>1, weighting of neighbor distances
none, inverse distance, inverse squared distance
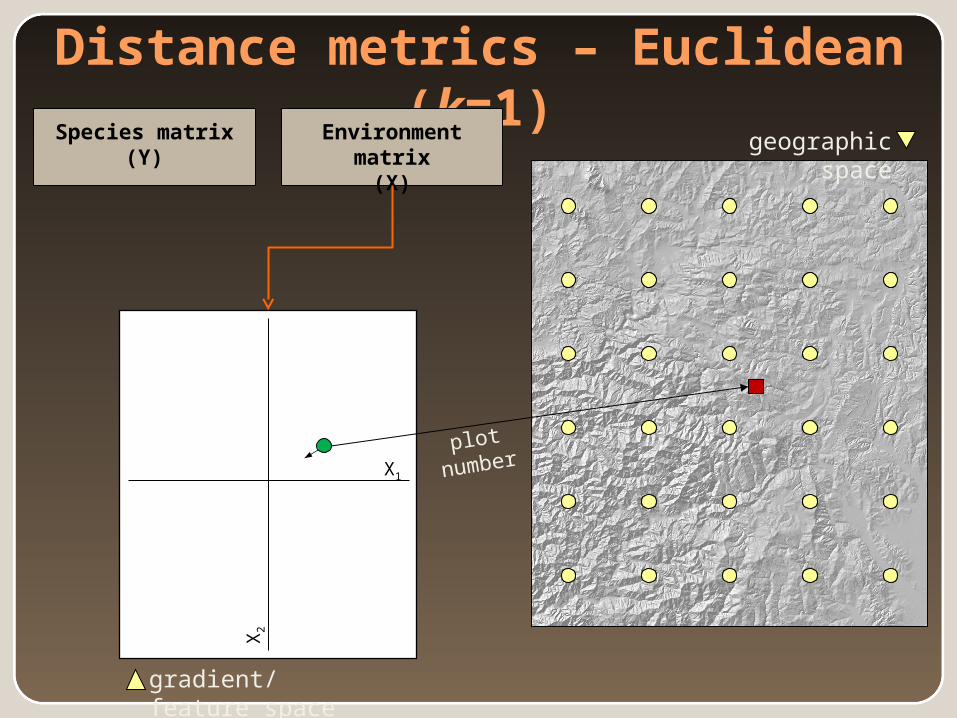
Distance metrics – Euclidean (k=1)
Environment matrix
(X)
Species matrix(Y)
geographic space
X1
X2
gradient/feature space
plot
number
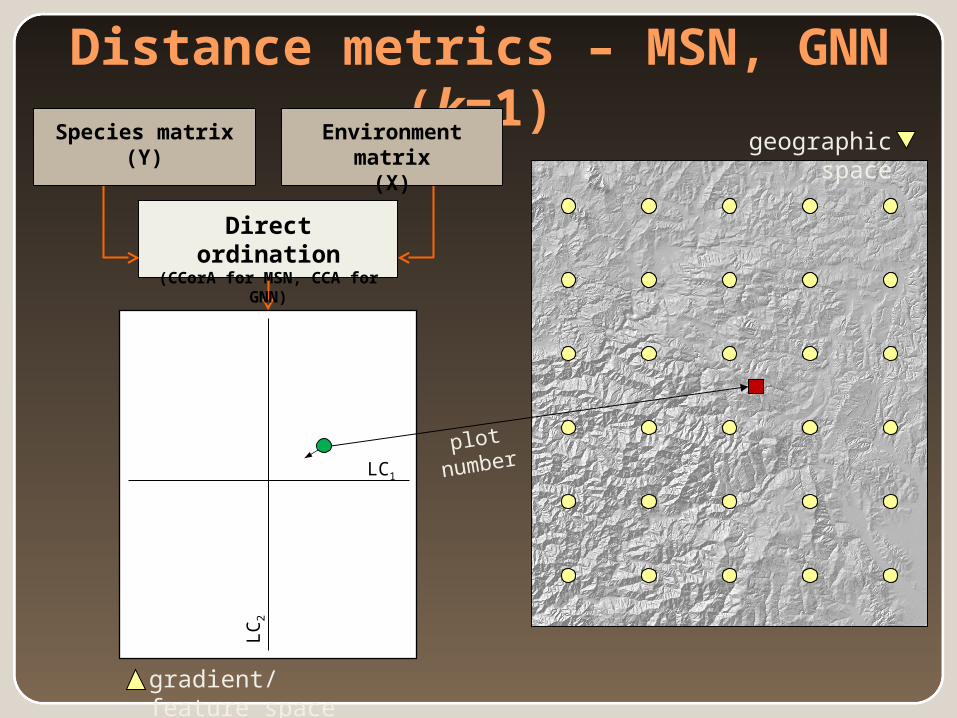
Distance metrics – MSN, GNN (k=1)
geographic space
LC1
LC2
gradient/feature space
plot
number
Direct ordination(CCorA for MSN, CCA for
GNN)
Environment matrix
(X)
Species matrix(Y)
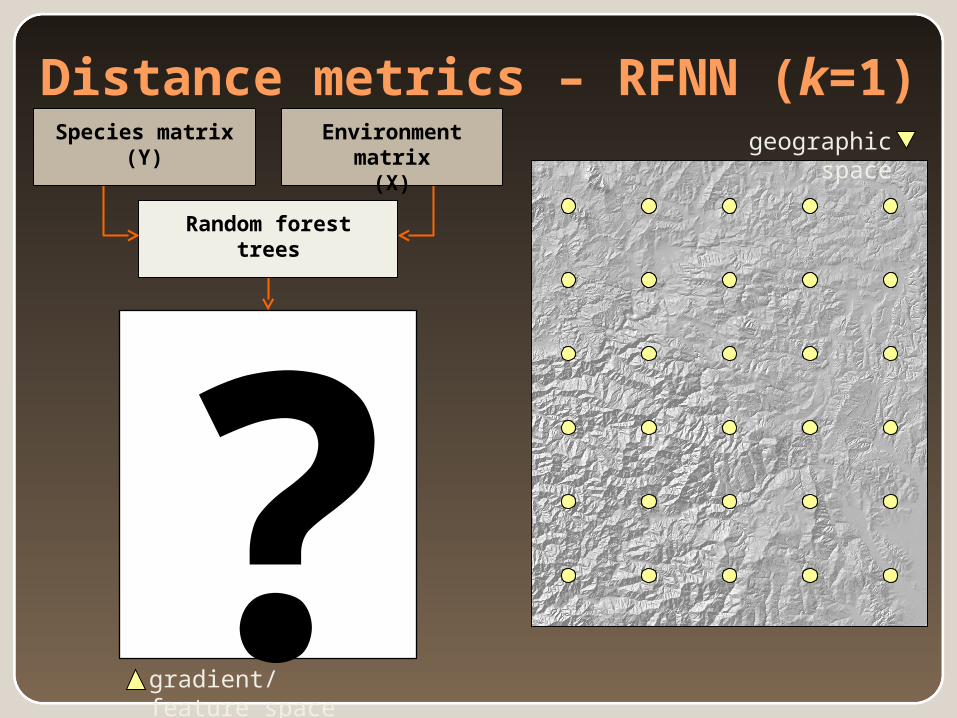
Distance metrics – RFNN (k=1)geographic
space
gradient/feature space
Random foresttrees
Environment matrix
(X)
Species matrix(Y)
?

Distance metrics – RFNN (k=1)
|
August maximum temp < 23.24
PSME TSHEPSME THPL
ABAM TSME PSME PIPO
High elevation (> 1244)High August temperature (> 23.24°C)High reflectance in TM Band 5 (> 24)
Elevation < 1625
TM Band 5 < 24
August maximum temp < 25.60
Summer meantemp < 12.79
Season temperaturedifference <
12.79
Elevation < 1244
Simple classification tree for dominant species

Distance metrics – RFNN (k=1)
|| |
|| |
20 43 32 16 40 31 23 25 13 42 38 16 4 12 22 28
27 23 31 19 18 47 3 12
8 14
13 22
7
16 12
31 3
2714 32
20 25
8
Distance = number of trees minus number of times a plot was picked
Random Forest - A “Forest” of classification trees Each tree is built from a random subset of plots
and variables

Values of kgeographic
spacegradient/feature space
Axis 1
Axis
2
k=5
(Weighted) average value of attribute
Absent
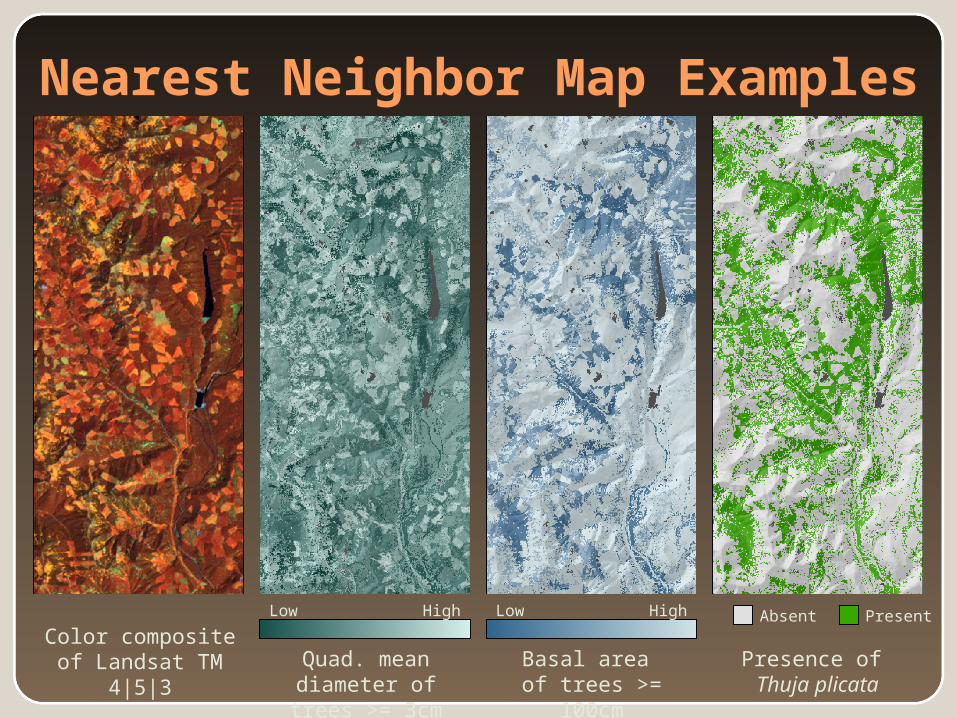
Nearest Neighbor Map Examples
Color composite of Landsat TM 4|
5|3Quad. mean
diameter of trees >= 3cm
Basal area of trees >=
100cm
Presence of Thuja plicata
Low High Low High Present
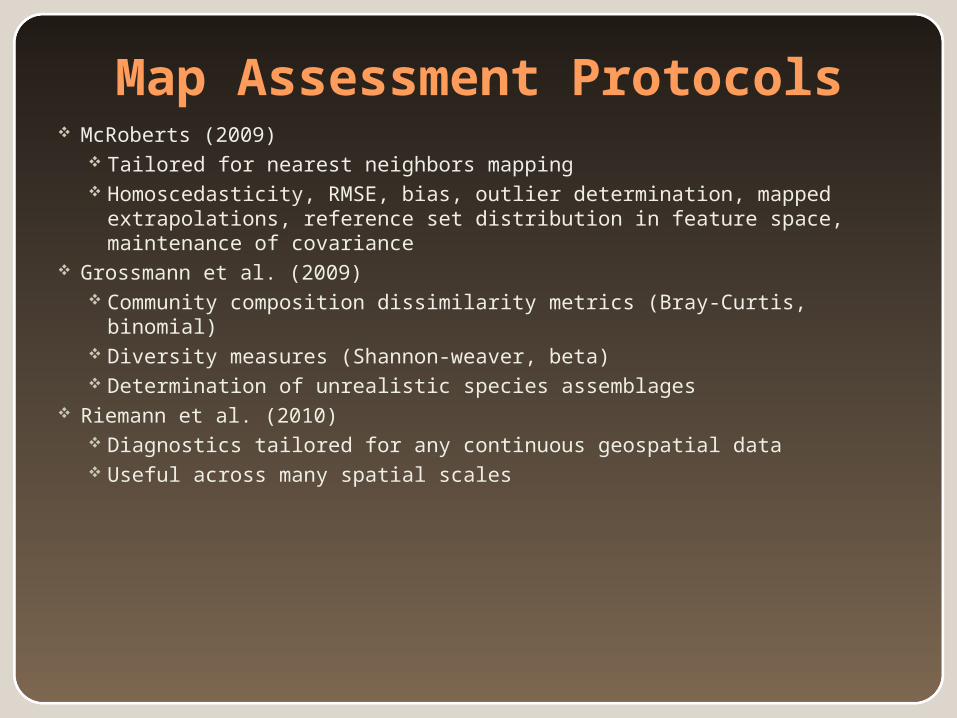
Map Assessment Protocols McRoberts (2009)
Tailored for nearest neighbors mapping Homoscedasticity, RMSE, bias, outlier determination, mapped
extrapolations, reference set distribution in feature space, maintenance of covariance
Grossmann et al. (2009) Community composition dissimilarity metrics (Bray-Curtis, binomial) Diversity measures (Shannon-weaver, beta) Determination of unrealistic species assemblages
Riemann et al. (2010) Diagnostics tailored for any continuous geospatial data Useful across many spatial scales
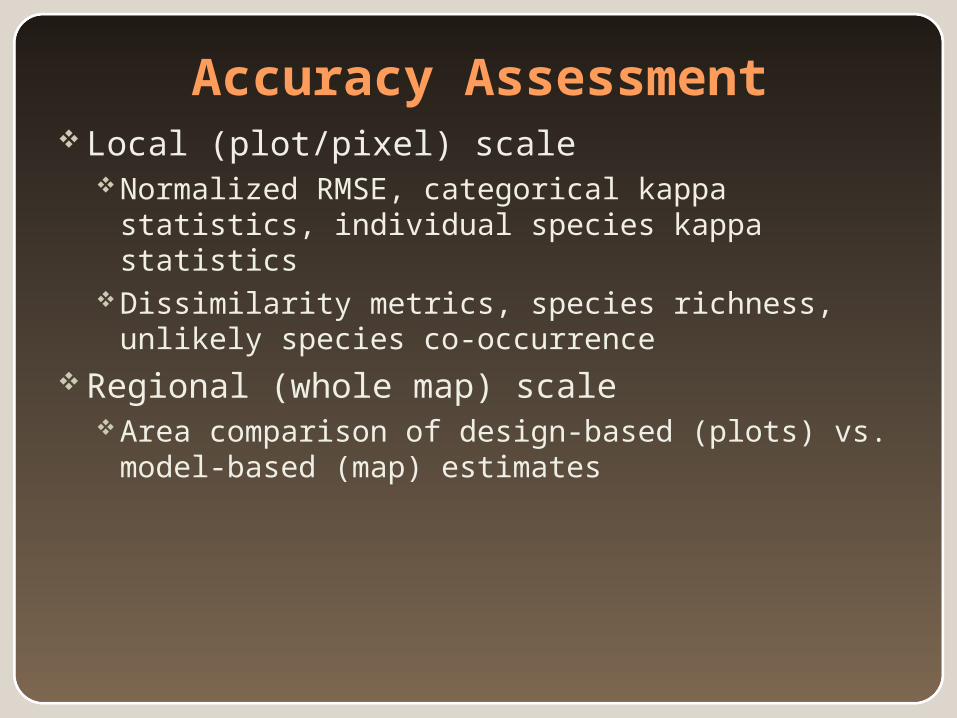
Accuracy Assessment Local (plot/pixel) scale
Normalized RMSE, categorical kappa statistics, individual species kappa statistics
Dissimilarity metrics, species richness, unlikely species co-occurrence
Regional (whole map) scaleArea comparison of design-based (plots) vs.
model-based (map) estimates

Accuracy Assessment – Distance metric
Normalized RMSEBAA_GE_3
Basal area per hectare of trees >= 2.5 cmBAA_GE_100
Basal area per hectare of trees >= 100 cmQMDA_GE_3
Quadratic mean diameter of trees >= 2.5 cmQMDA_GE_13
Quadratic mean diameter of trees >= 12.5 cmVPH_GE_3
Volume per hectare of trees >= 2.5 cmForest type kappa statisticsFOR_TYPE_AN
Forest type as determined by FIAFOR_TYPE_GR
Forest type group as determined by FIA
From Oregon models with k=1 neighbor
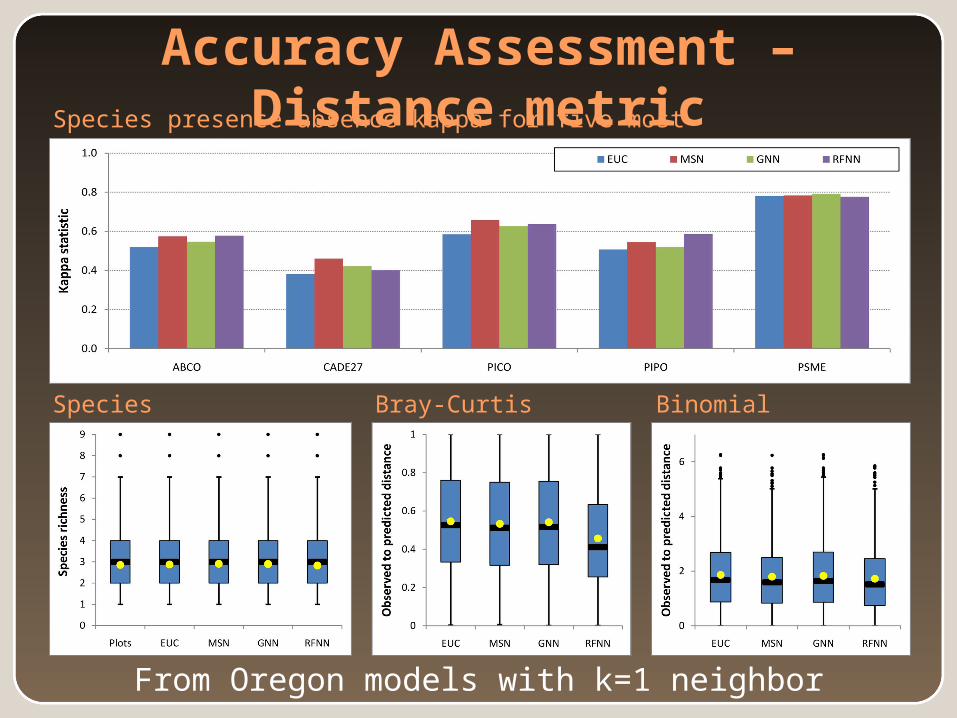
Accuracy Assessment – Distance metric
From Oregon models with k=1 neighbor
Species presence-absence kappa for five most common species
Species richness
Bray-Curtis dissimilarity
Binomial dissimilarity
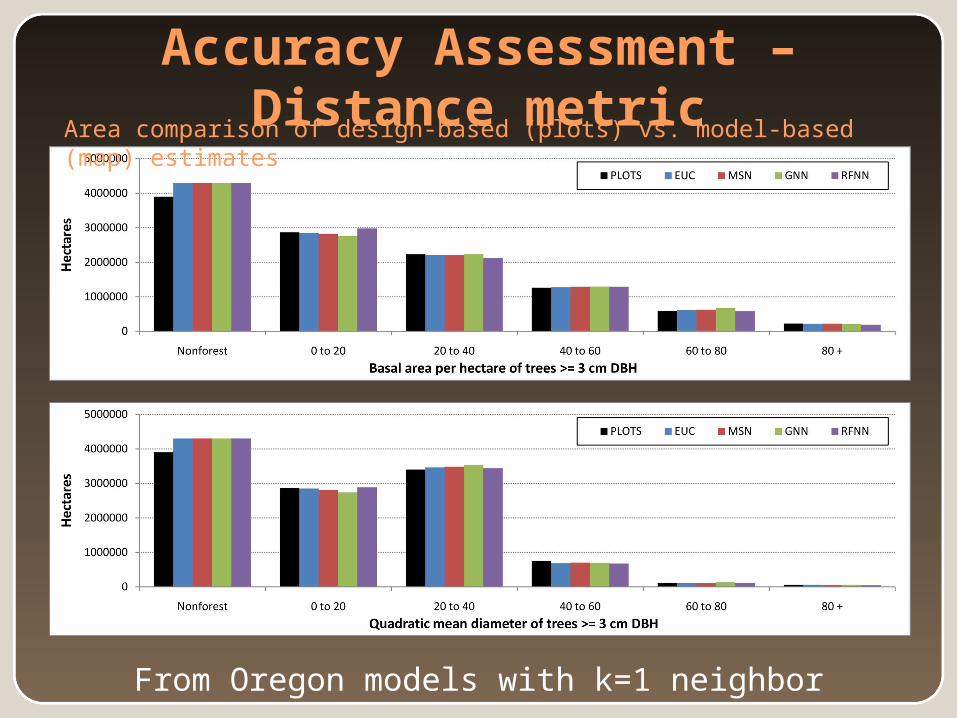
Accuracy Assessment – Distance metric
From Oregon models with k=1 neighbor
Area comparison of design-based (plots) vs. model-based (map) estimates
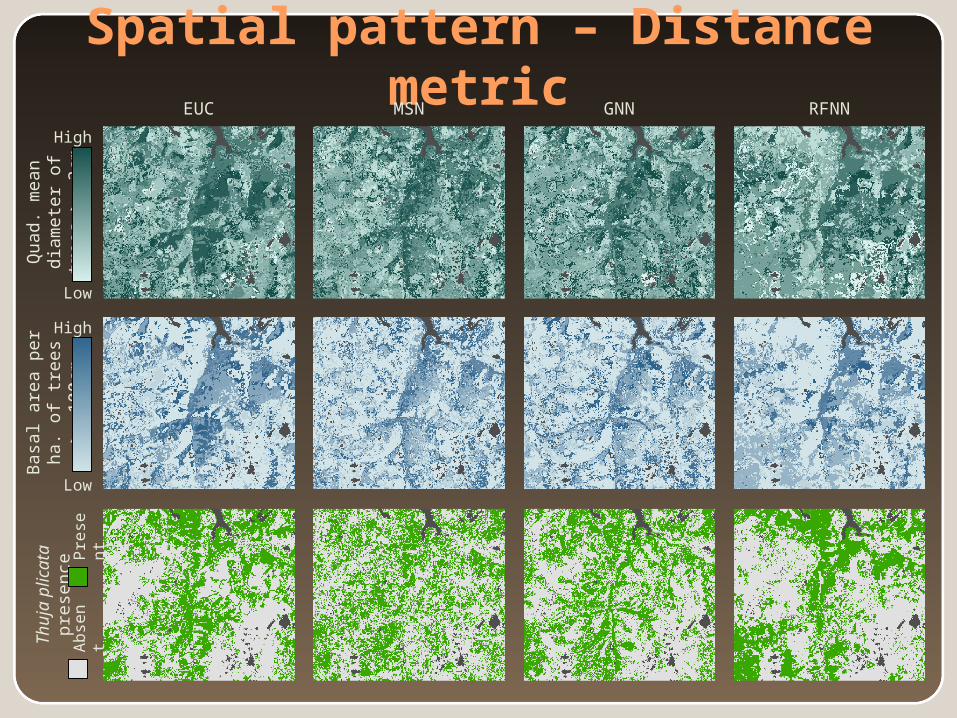
Spatial pattern – Distance metric
Low
Quad
. m
ean
dia
mete
r of
trees
>=
3cm
High
Basa
l are
a p
er
ha. of
trees
>=
1
00
cm
Low
High
Thuja
plic
ata
p
rese
nce
EUC MSN GNN RFNN
Abse
nt
Pre
sen
t
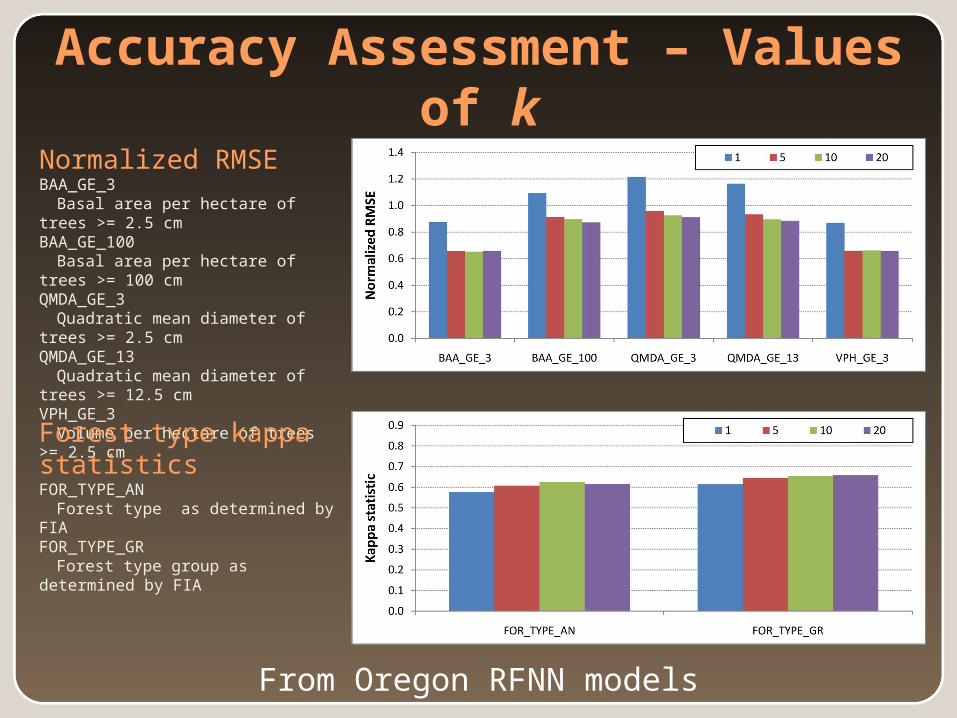
Accuracy Assessment – Values of k
Normalized RMSEBAA_GE_3
Basal area per hectare of trees >= 2.5 cmBAA_GE_100
Basal area per hectare of trees >= 100 cmQMDA_GE_3
Quadratic mean diameter of trees >= 2.5 cmQMDA_GE_13
Quadratic mean diameter of trees >= 12.5 cmVPH_GE_3
Volume per hectare of trees >= 2.5 cmForest type kappa statisticsFOR_TYPE_AN
Forest type as determined by FIAFOR_TYPE_GR
Forest type group as determined by FIA
From Oregon RFNN models
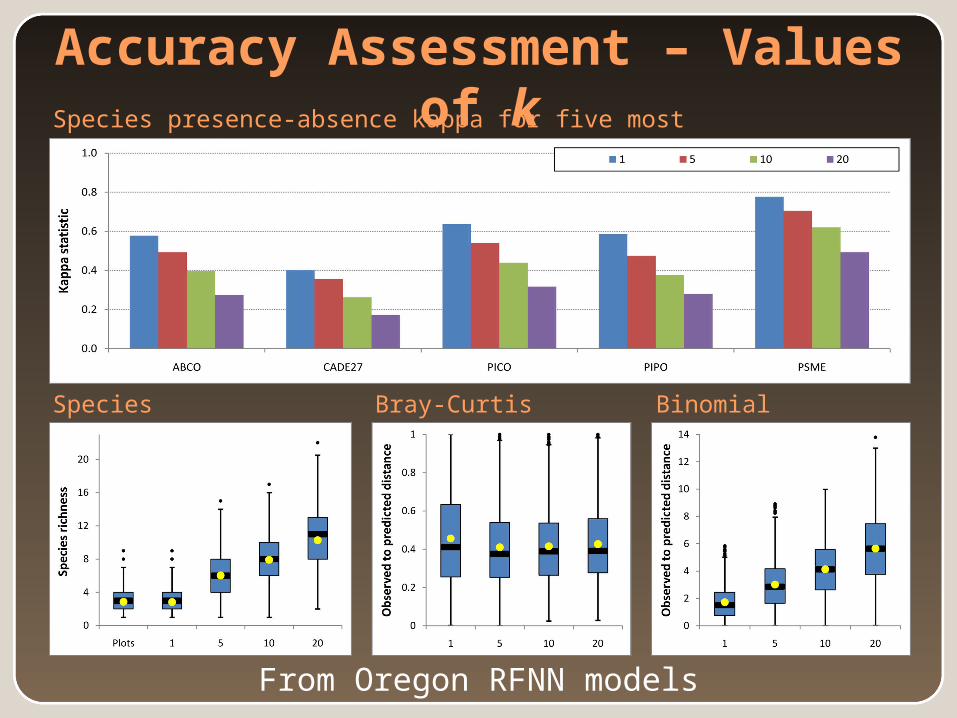
Accuracy Assessment – Values of k
From Oregon RFNN models
Species presence-absence kappa for five most common species
Species richness
Bray-Curtis dissimilarity
Binomial dissimilarity

Accuracy Assessment – Values of k
From Oregon RFNN models
Area comparison of design-based (plots) vs. model-based (map) estimates

Accuracy Assessment – Values of kErrors of species
omissionErrors of species commission
Areal extent of common species
From Oregon RFNN models

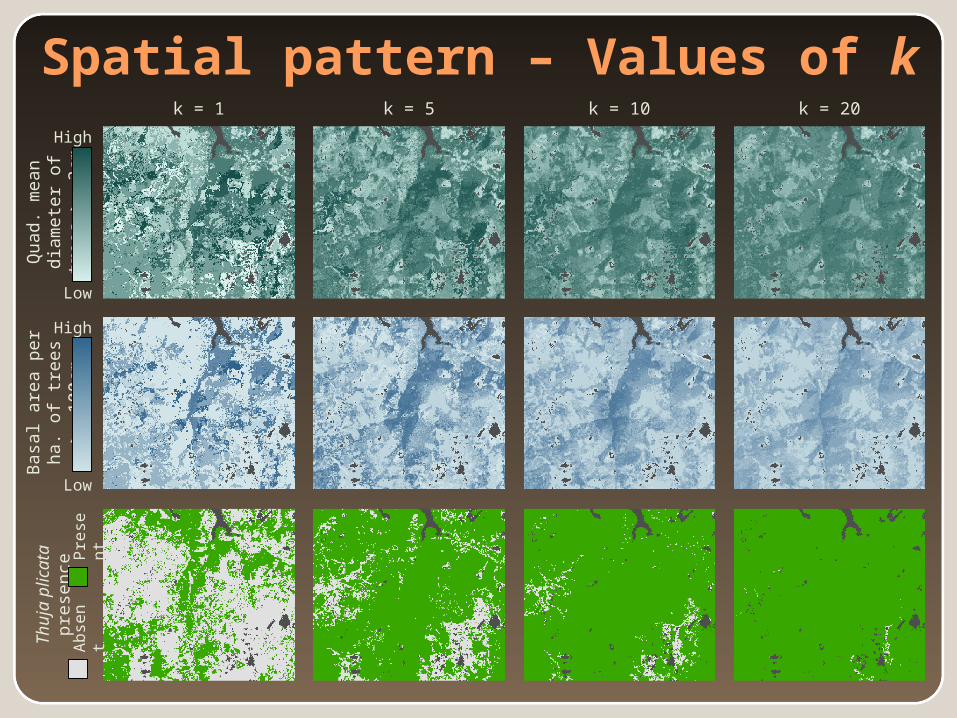
Spatial pattern – Values of k
k = 1 k = 5 k = 10 k = 20
Nonforest Both species absent
Both species present
Tsuga heterophylla
Pinus ponderosa
From Oregon RFNN models
Percent overlap of unlikely co-occurring species
Spatial pattern – Values of k
Low
Quad
. m
ean
dia
mete
r of
trees
>=
3cm
High
Basa
l are
a p
er
ha. of
trees
>=
1
00
cm
Low
High
Thuja
plic
ata
p
rese
nce
k = 1 k = 5 k = 10 k = 20
Abse
nt
Pre
sen
t
Key Findings - Accuracy Assessment
Accuracy varied little across distance metrics, although RFNN slightly better with categorical variables (such as forest type or forest type group)
Accuracy varied substantially across values of k RMSE, forest type kappa improve with higher k Area distributions, species community metrics degrade
with higher k New assessment protocols will help guide users on
appropriate uses of nearest neighbors maps

The “k conundrum” Need for structural attribute accuracy must be
weighed against need for reasonable forest community composition
Possible approaches:Two step modeling where candidate neighbors
must come from appropriate composition classes (McRoberts, 2009)
Hierarchical nearest neighbor modeling – iterative neighbor finding based on spatial patterning grains

NaFIS implementation challenges
Consistency/currency of plot data (greatly eased with FIA annual design)
Mapping nonforest areas (some preliminary products have been developed)
Currency of mapped information – how best to account for disturbance
Incorporating emerging science into a production mapping environment
For more information
NaFIS products and software http://blue.for.msu.edu/NAFIS/
NaFIS west final report http://www.fsl.orst.edu/lemma/pubs/ Track me down for PDF
NaFIS collaborators (in alphabetical order) Jerry Beatty (WWETAC), Ken Brewer (formerly
RSAC), Mark Finco (RSAC), Andy Finley (MSU), Matt Gregory (OSU), Emilie Grossmann (OSU), Ron McRoberts (NRS), Janet Ohmann (PNWRS), Heather Roberts (OSU), Frank Sapio (FHTET), Eric Smith (FHTET), and Brian Roberts (MSU)
Related Documents