The National Development Plan of The Bahamas: Human Capital and Resilient Youth The National Development Plan Secretariat 1

The National Development Plan of The Bahamas: Human Capital and Resilient Youth The National Development Plan Secretariat 1.
Dec 26, 2015
Welcome message from author
This document is posted to help you gain knowledge. Please leave a comment to let me know what you think about it! Share it to your friends and learn new things together.
Transcript
The National Development Plan of The Bahamas:
Human Capital and Resilient Youth
The National Development Plan Secretariat
1
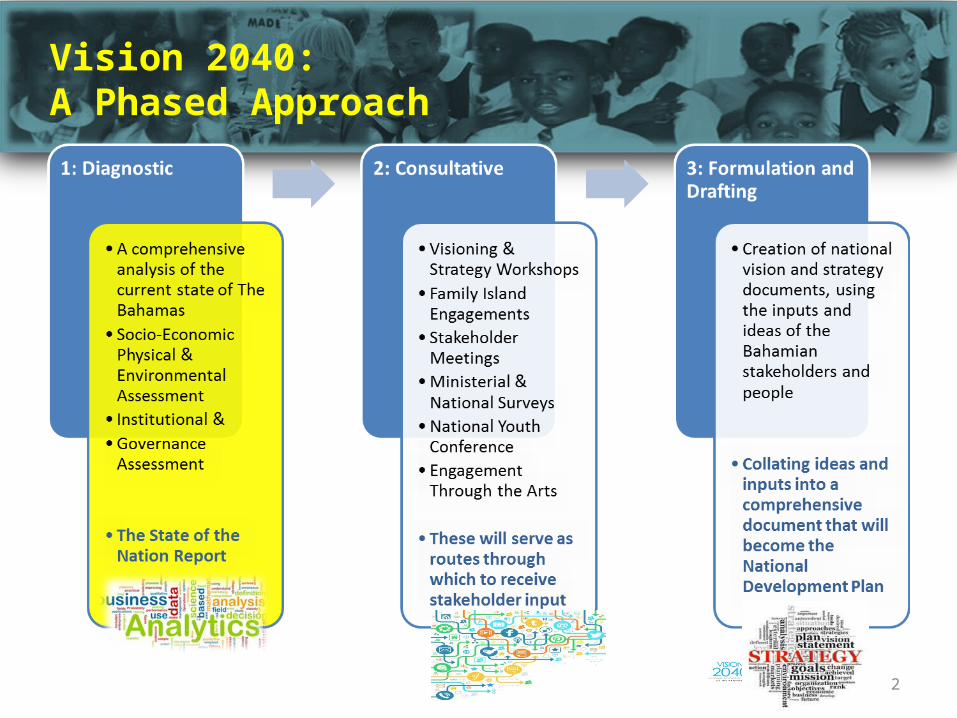
Vision 2040: A Phased Approach
2
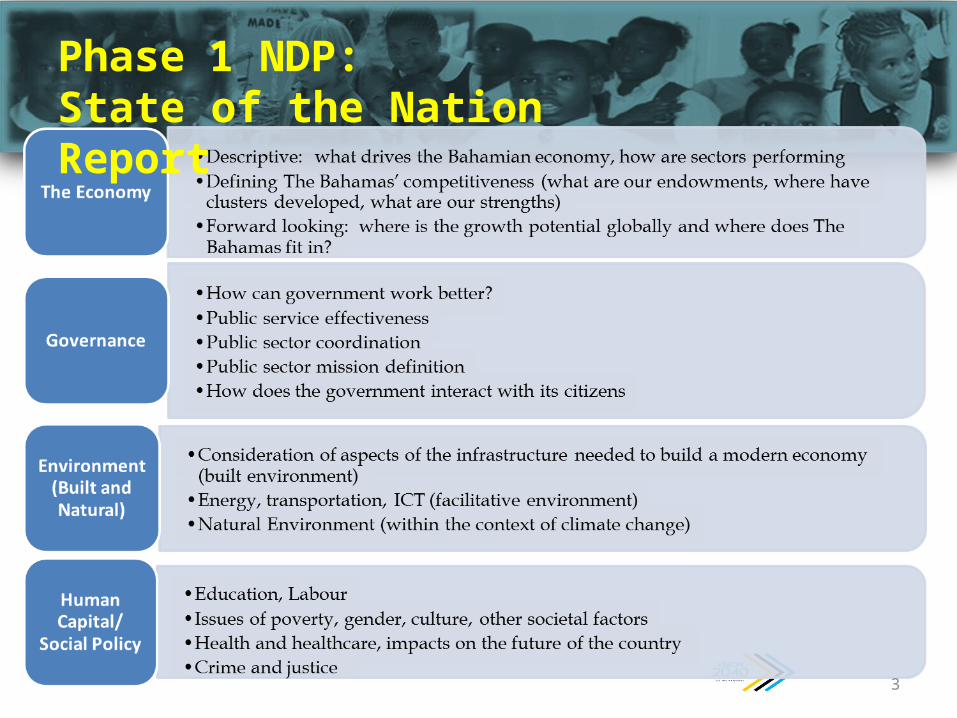
Phase 1 NDP: State of the Nation Report
3
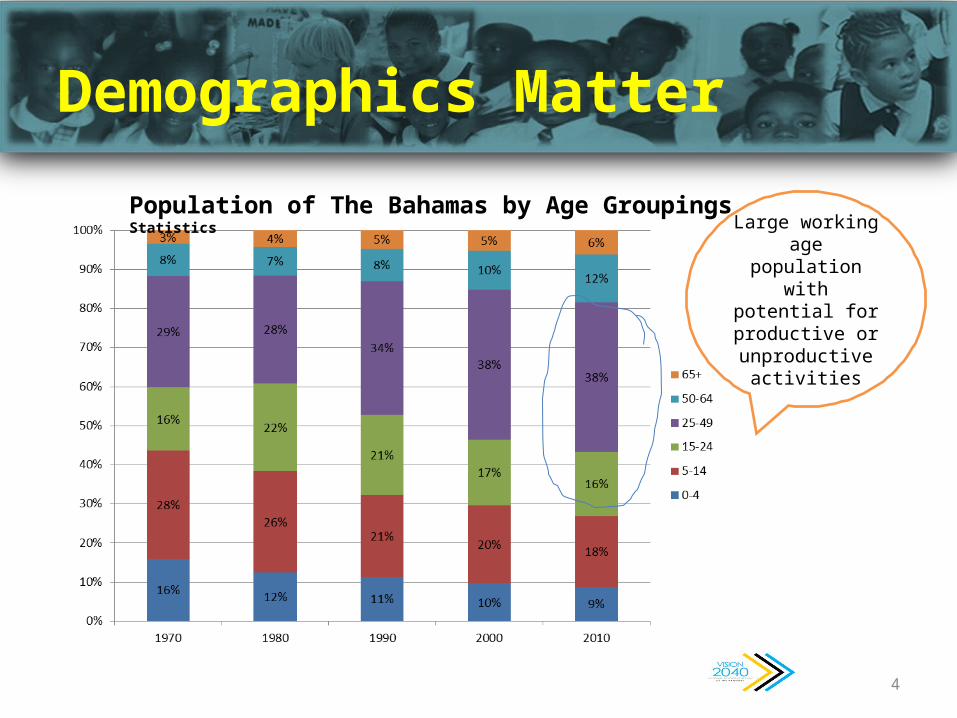
Demographics Matter
4
Population of The Bahamas by Age Groupings, Dept of Statistics
Large working age population with
potential for productive or unproductive
activities
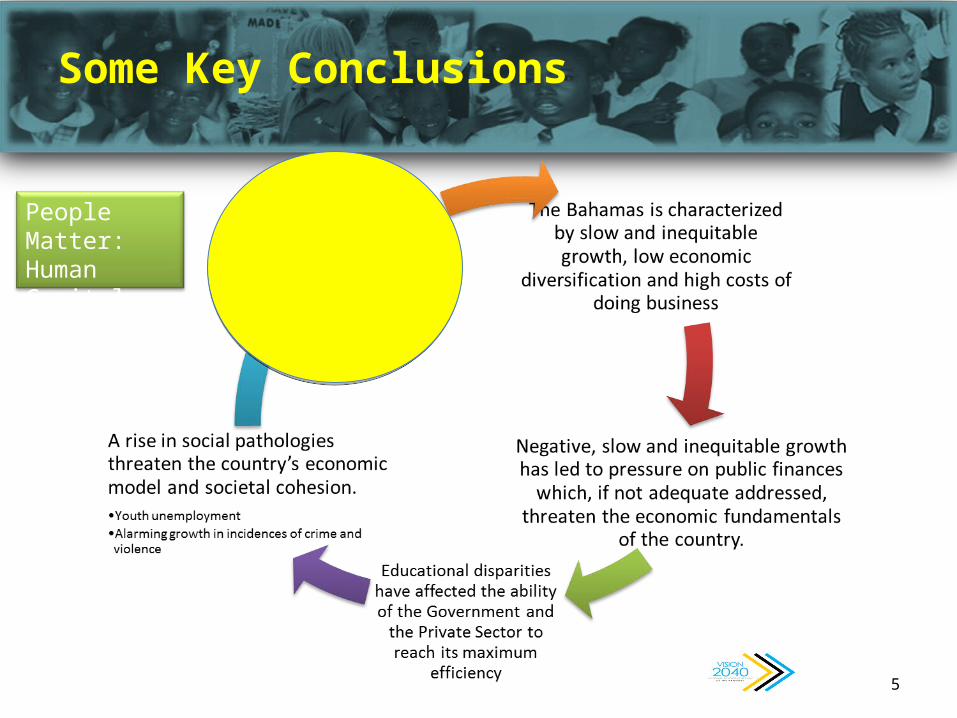
Some Key Conclusions
5
People Matter:Human Capital Pillar Critical
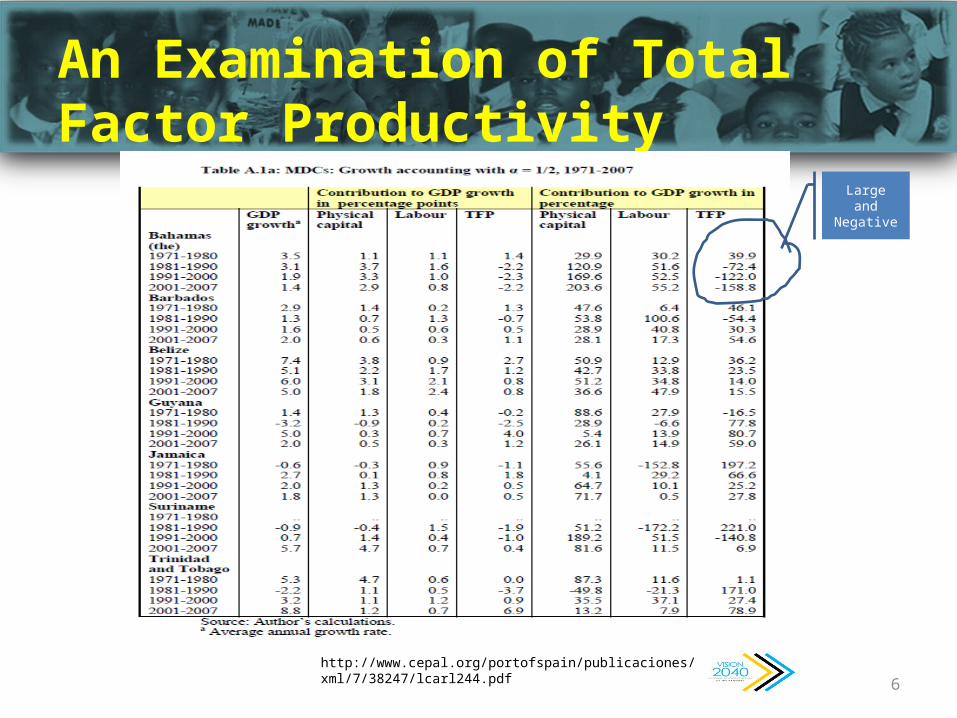
An Examination of Total Factor Productivity
6http://www.cepal.org/portofspain/publicaciones/xml/7/38247/lcarl244.pdf
Large and Negative

The Importance of Social Policy to Development
7
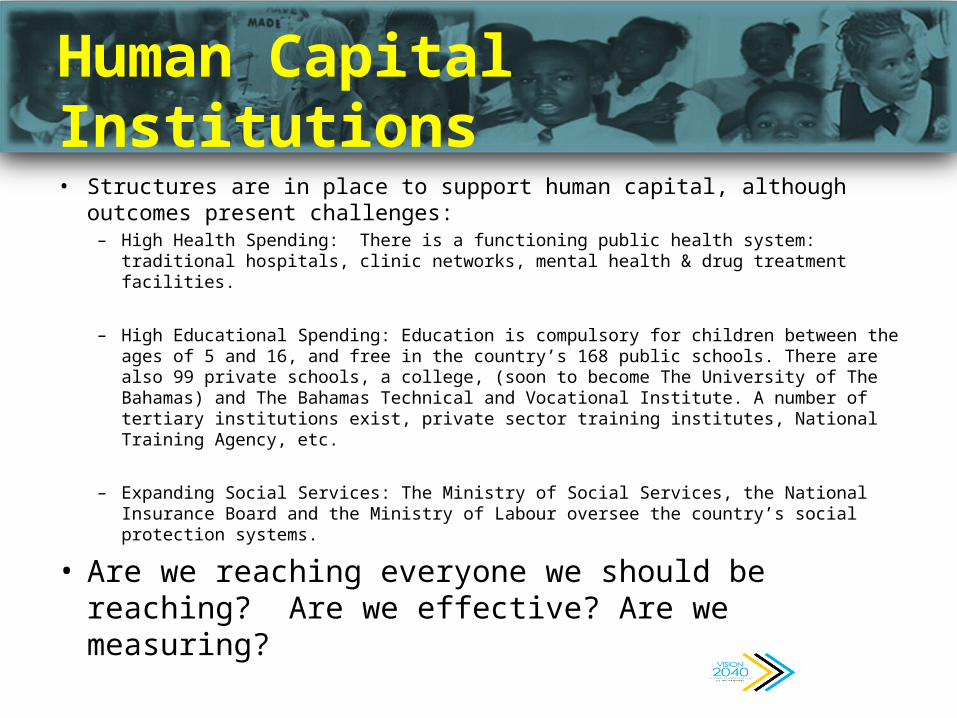
Human Capital Institutions• Structures are in place to support human capital, although outcomes
present challenges: – High Health Spending: There is a functioning public health system: traditional hospitals,
clinic networks, mental health & drug treatment facilities.
– High Educational Spending: Education is compulsory for children between the ages of 5 and 16, and free in the country’s 168 public schools. There are also 99 private schools, a college, (soon to become The University of The Bahamas) and The Bahamas Technical and Vocational Institute. A number of tertiary institutions exist, private sector training institutes, National Training Agency, etc.
– Expanding Social Services: The Ministry of Social Services, the National Insurance Board and the Ministry of Labour oversee the country’s social protection systems.
• Are we reaching everyone we should be reaching? Are we effective? Are we measuring?

Human Capital Conclusions, cont’d
• HDI relatively good – but other indicators show lackluster human capital
outcomes: 50% vocational school graduation rate, a rise in poverty, violent crime, income inequity, poor educational outcomes and skills training.
• Employers often note difficulty in finding employees with the right skill set which is exacerbated by brain drain.
9
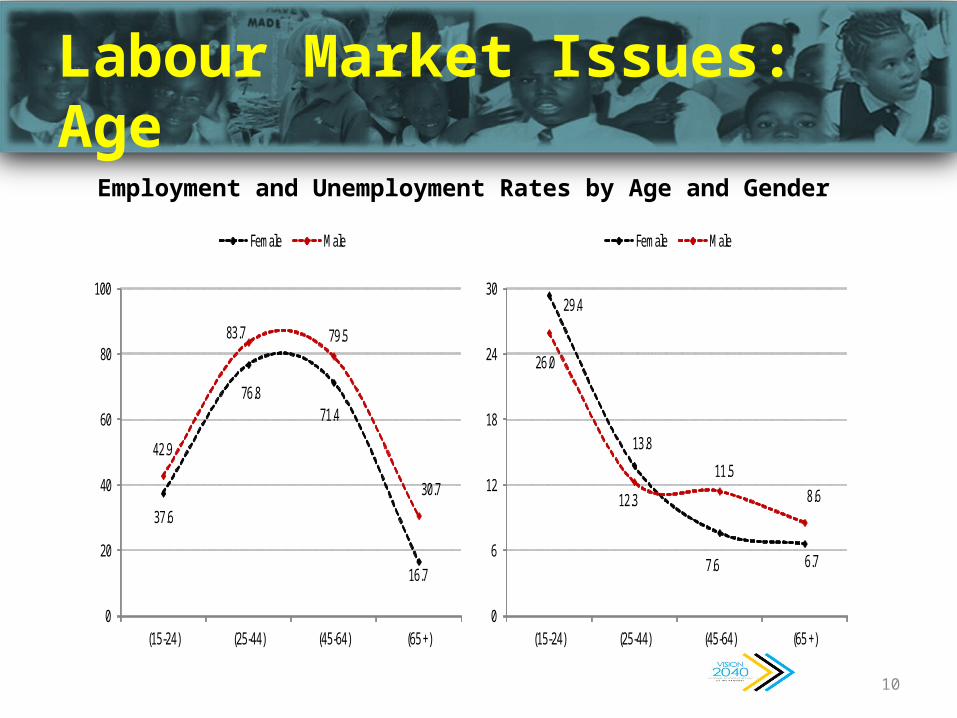
Labour Market Issues: Age
10
37.6
76.871.4
16.7
42.9
83.7 79.5
30.7
0
20
40
60
80
100
(15-24) (25-44) (45-64) (65 +)
Female Male
29.4
13.8
7.6 6.7
26.0
12.3
11.58.6
0
6
12
18
24
30
(15-24) (25-44) (45-64) (65 +)
Female Male
Employment and Unemployment Rates by Age and Gender
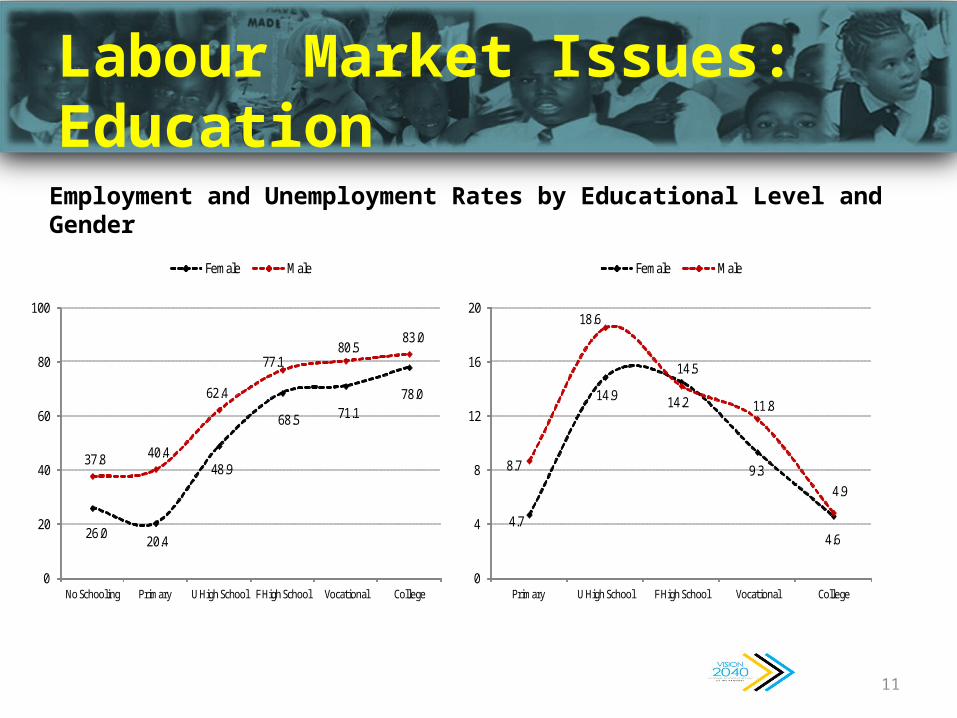
Labour Market Issues: Education
11
4.7
14.9
14.5
9.3
4.6
8.7
18.6
14.2 11.8
4.9
0
4
8
12
16
20
Primary U High School F High School Vocational College
Female Male
26.0 20.4
48.9
68.5 71.178.0
37.8 40.4
62.4
77.180.5
83.0
0
20
40
60
80
100
No Schooling Primary U High School F High School Vocational College
Female Male
Employment and Unemployment Rates by Educational Level and Gender

Population Educational Profile
12

Spending on Education
13
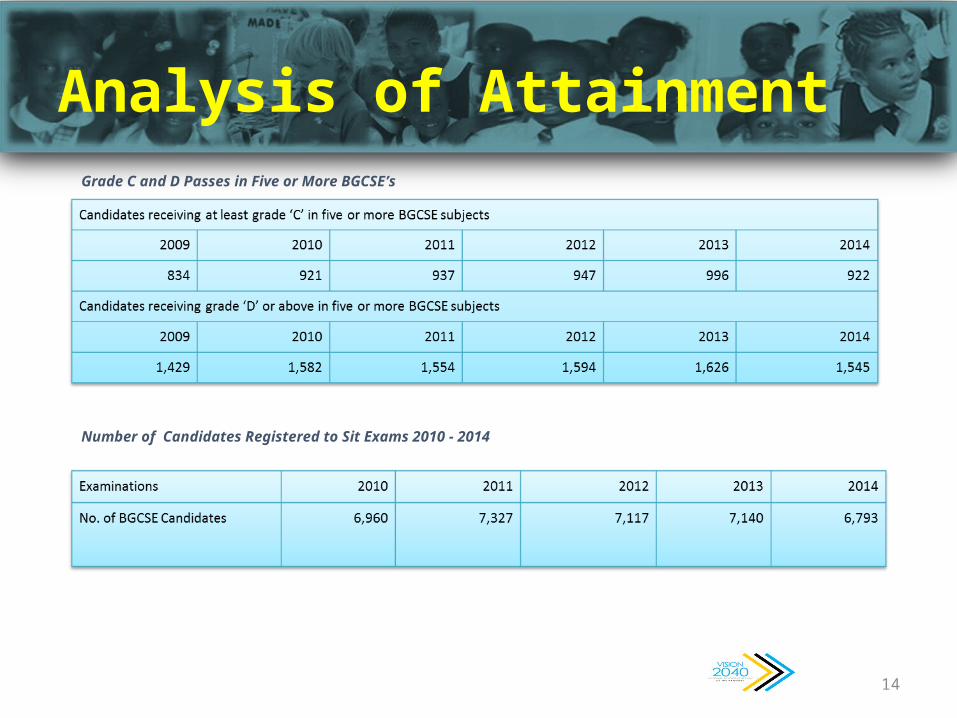
Analysis of Attainment
14
Grade C and D Passes in Five or More BGCSE’s
Number of Candidates Registered to Sit Exams 2010 - 2014

BGCSE Results: Looking Beyond the Averages to Students Passions. Making School Interesting Again is Key
15
Subject 2005 2006 2007 2008 2009 2010 2011 2012 2013 2014
Art and Design A C- C- C- C C- C+ C- C+ C C-
Art and Design B C+ C C+ C+ C+ C+ C B- C+ C+
Art and Design C C C C- C C- C+ C- C C- C-
Auto Mechanics D- D+ C- C- C C C C+ C- C-
Biology D- D- D- D- D- D- D- D- D- D-
Bookkeeping E E F+ E E- E- D- D E+ D
Carpentry/Joinery C+ C C+ C- B- C+ B- C C- C-
Chemistry C- C- C- C- C- C- C- C- C- C-
Clothing Construction C D+ D- D D D- D D+ D D+
Combined Science D D D+ D D D D+ C- D+ D+
Commerce D D D D D D D D+ C- C-
Economics D D D D- D D+ D D+ D+ D+
Electrical Installation D+ C- C- D D+ D+ D- D+ D C-
English Language D D- D- D D D D D D D+
Foods and Nutrition C+ C C C C C C- C- C- C-
French D+ C- C- C- C- C- C- C C- C-
Geography C- C- C C C C C C C C
Graphical Communication D+ C- D+ D+ C- C- C- C C- C
History C- C C C C C- C- C- C D+
Literature D+ C- C- D+ C- C- C- C- C- C
Mathematics E E E E E- E- E- E+ E E
Music B- C+ C+ C+ C+ C C- C C+ B-
Office Procedures D+ D E D D- D+ D C- C- C-
Physics C- C- C- C- C- C- C- C- C- C
Religious Studies C C C C C C C- C- C C
Spanish C- C- C- C- C C- C C C C
Typewriting/Keyboarding C- C- D- D+ C D+ D+ D+ D+ DTable 9 Mean Grade by Subject, BGCSE 2005 - 2014Source: National Examination Confidential Report BGCSE 2014, MOEST
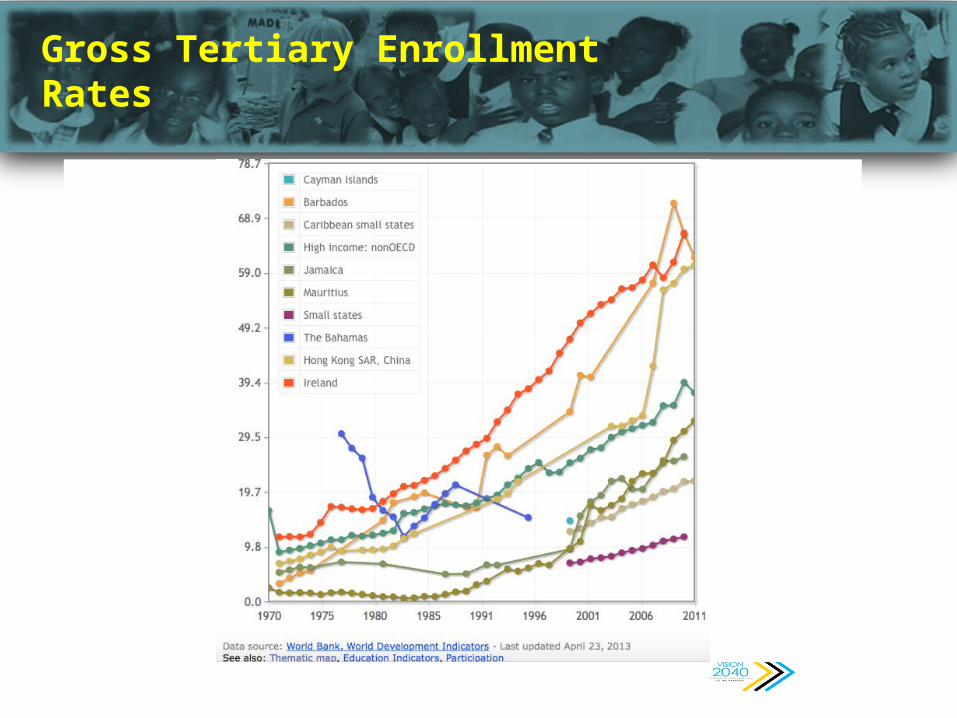
Gross Tertiary Enrollment Rates
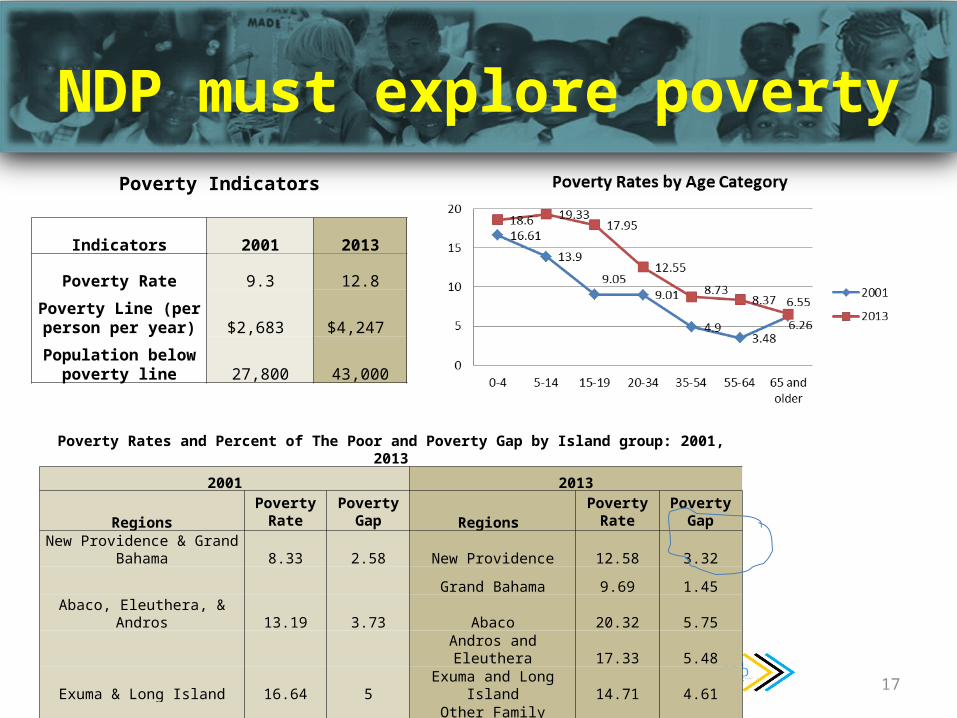
NDP must explore poverty
17
Poverty Indicators
Indicators 2001 2013
Poverty Rate 9.3 12.8
Poverty Line (per person per year) $2,683 $4,247
Population below poverty line 27,800 43,000
Poverty Rates and Percent of The Poor and Poverty Gap by Island group: 2001, 2013
2001 2013
RegionsPoverty Rate Poverty Gap
Regions Poverty Rate Poverty Gap
New Providence & Grand Bahama 8.33 2.58 New Providence 12.58 3.32
Grand Bahama 9.69 1.45
Abaco, Eleuthera, & Andros 13.19 3.73 Abaco 20.32 5.75
Andros and Eleuthera 17.33 5.48
Exuma & Long Island 16.64 5 Exuma and Long Island 14.71 4.61
Other Family Islands 20.96 6.35 Other Family Islands 11.44 0.82

Poverty and Education
18
Highest Levels of Education Competed and Highest Academic Exam Passed among Poor and None Poor : 2001, 2013
2001 2013Education level
completed Non-Poor Poor All PersonsEducation level
completed Non-Poor Poor All PersonsNo Schooling 2.18 6.97 2.51 No Schooling 6.55 12.18 7.26
Preschool/Kindergarten 4.21 6.01 4.44Primary School 11.43 21.8 12.16 Primary School 15.56 22.2 16.41
High School 65.45 68.6 65.67 High School 47.57 55.68 48.6College /University 16.65 1.28 15.58 College/ University 18.71 1.1 16.46
Technical/Vocational 4.29 1.35 4.08 Technical/Vocational 6.93 1.71 6.27 Other 0.3 0 0.26 Not Stated 0.17 1.12 0.29
Qualification Non-Poor Poor All Persons Qualification Non-Poor Poor All PersonsNone 52.13 85.32 54.9 None 38.49 66.79 42.1
School Leaving certificate 6.83 4.21 6.61 School Leaving certificate 10.61 11.84 10.77BJC, CXC Basix 15.36 7.37 14.69 BJC/PITMAN 1/ RSA/CXC 12.36 11.2 12.21
O Level, CXC General 12.39 2.33 11.55 GCE O Level/BGCSE/Pit 13.39 6.06 12.45A level, Associate 4.51 0.41 4.16 GCE A Level / RSA 3/ 1.31 0.4 1.19
Degree or Certificate 6.16 0.78 5.47Bachelor 3.61 0 3.31 Degree at Bachelor's 6.86 0.29 6.03
Other degree 5.17 0.37 4.77 Degree above Bachelor 2.87 0 2.5 Professional Certificate 1.29 0 1.12 Other Trade Certificate 6.36 1.25 5.71 Not Stated 0.31 1.38 0.45
SOURCE: The Department of Statistics
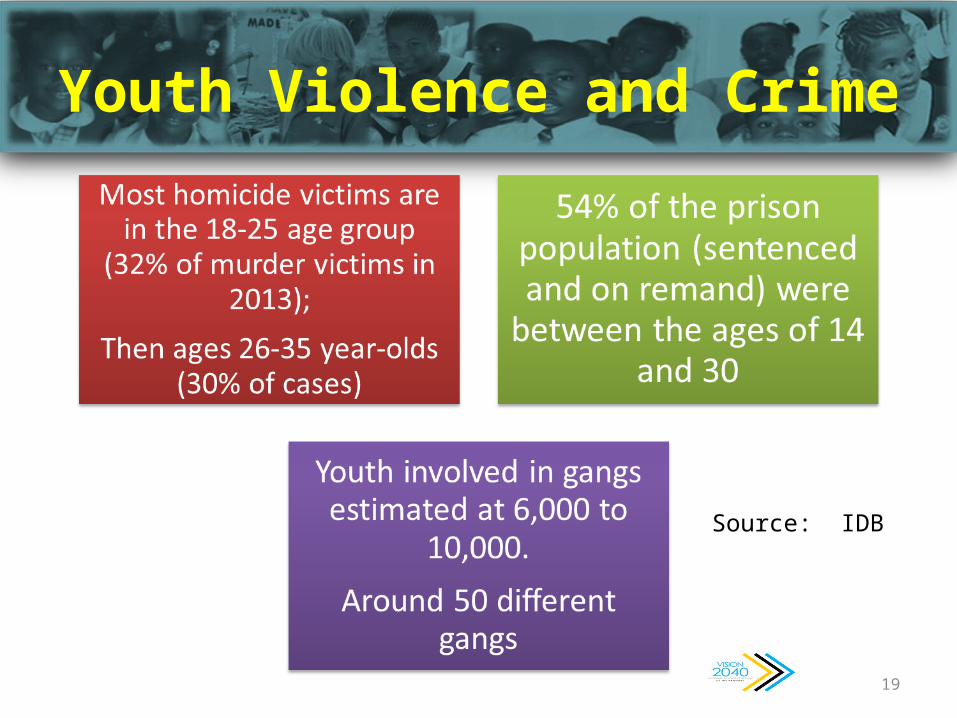
Youth Violence and Crime
19
Source: IDB

Bahamas Crime Statistics
20
Crime Statistics 2011-2014
2011 2012 % chge 2013 % chge 2014 % chgeCrimes Against Persons
Murder 127 111 -13 119 7 123 3Attempted Murder 12 19 58 15 -21 22 47
Manslaughter 1 1 0 4 300 3 -25Rape 107 97 -9 105 8 75 -29
Attempted Rape 28 12 -57 22 83 12 -45Unlawful Sexual Intercourse 179 167 -7 165 -1 111 -33
Armed Robbery 998 1,099 10 1,022 -7 920 -10Robbery 369 361 -2 365 1 350 -4
Attempted Robbery 43 31 -28 30 -3 31 3Sub-total 1,864 1,898 1,847 -3 1,647
Crime Against Property Burgulary 340 309 -9 275 -11 188 -32
Housebreaking 3,242 2,875 -11 2,265 -21 1,756 -22Shopbreaking 942 971 3 912 -6 785 -14
Stealing 1,940 1,909 -2 1,952 2 1,558 -20Stealing from Vehicle 2,490 2,284 -8 2,465 8 2,066 -16
Stolen Vehicle 1,330 1,332 0 1,157 -13 879 -24Sub-total 10,284 9,680 -7 9,026 4 7,232
Total 12,148 11,578 10,873 8,879
SOURCE:- Fielding "Crime and Criminal Justice in The Bahamas" RBPF statistics for 2013-2014; US Department of State "Crime and Safety Report" for 2011-2012

Homicide Rate Map
21
Source: https://www.unodc.org/documents/gsh/pdfs/2014_GLOBAL_HOMICIDE_BOOK_web.pdf
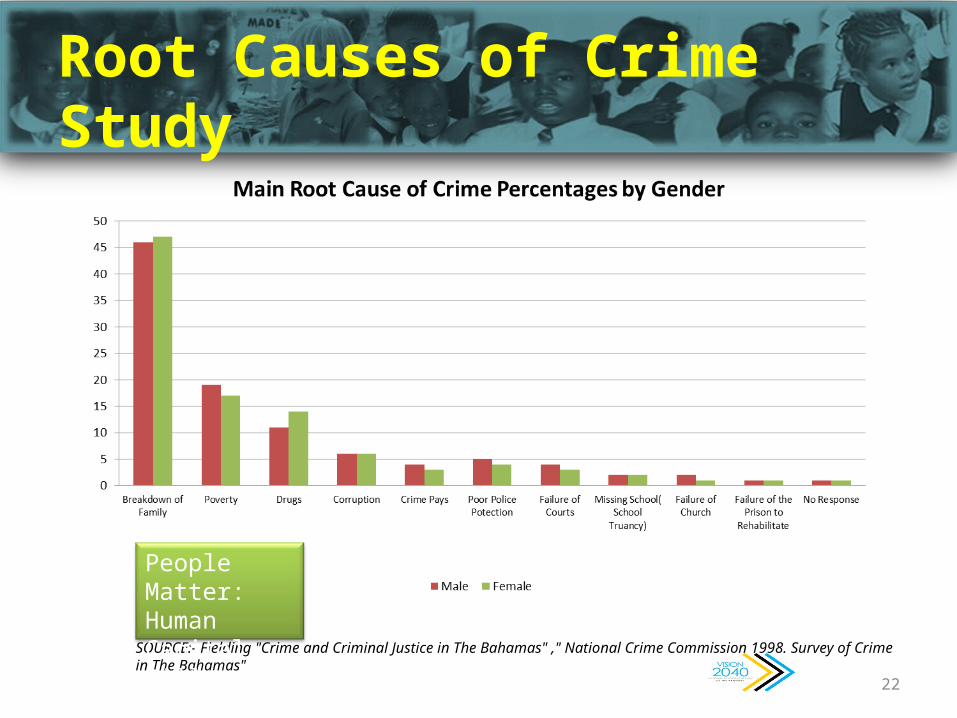
Root Causes of Crime Study
22
SOURCE:- Fielding "Crime and Criminal Justice in The Bahamas" ," National Crime Commission 1998. Survey of Crime in The Bahamas"
People Matter:Human Capital Pillar Critical
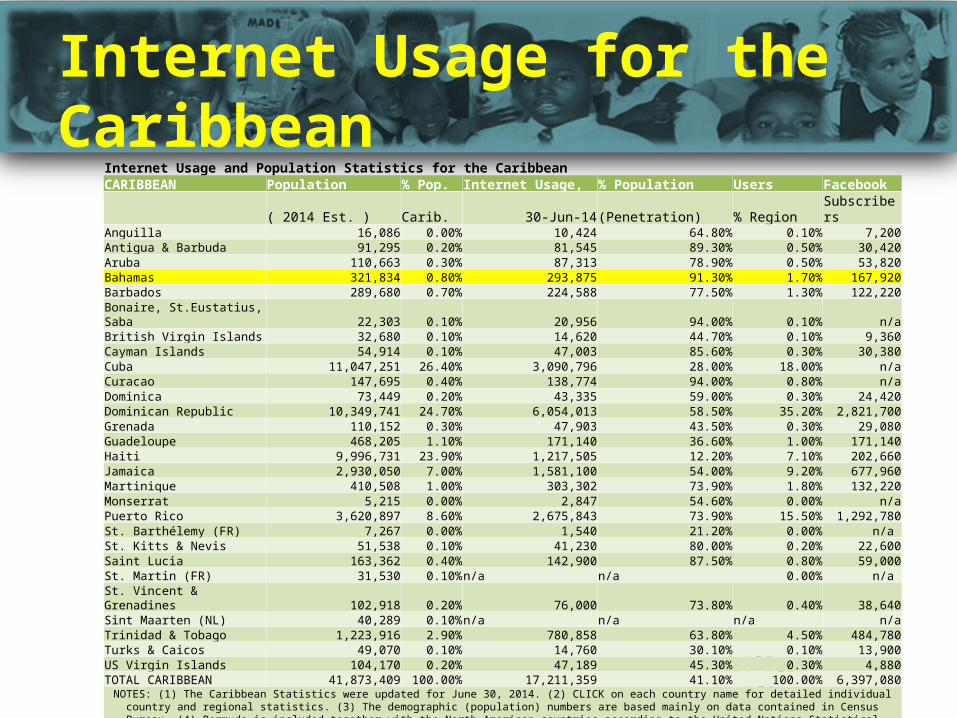
Internet Usage for the Caribbean
23
Internet Usage and Population Statistics for the CaribbeanCARIBBEAN Population % Pop. Internet Usage, % Population Users Facebook
( 2014 Est. ) Carib. 30-Jun-14(Penetration) % Region SubscribersAnguilla 16,086 0.00% 10,424 64.80% 0.10% 7,200Antigua & Barbuda 91,295 0.20% 81,545 89.30% 0.50% 30,420Aruba 110,663 0.30% 87,313 78.90% 0.50% 53,820Bahamas 321,834 0.80% 293,875 91.30% 1.70% 167,920Barbados 289,680 0.70% 224,588 77.50% 1.30% 122,220Bonaire, St.Eustatius, Saba 22,303 0.10% 20,956 94.00% 0.10% n/aBritish Virgin Islands 32,680 0.10% 14,620 44.70% 0.10% 9,360Cayman Islands 54,914 0.10% 47,003 85.60% 0.30% 30,380Cuba 11,047,251 26.40% 3,090,796 28.00% 18.00% n/aCuracao 147,695 0.40% 138,774 94.00% 0.80% n/aDominica 73,449 0.20% 43,335 59.00% 0.30% 24,420Dominican Republic 10,349,741 24.70% 6,054,013 58.50% 35.20% 2,821,700Grenada 110,152 0.30% 47,903 43.50% 0.30% 29,080Guadeloupe 468,205 1.10% 171,140 36.60% 1.00% 171,140Haiti 9,996,731 23.90% 1,217,505 12.20% 7.10% 202,660Jamaica 2,930,050 7.00% 1,581,100 54.00% 9.20% 677,960Martinique 410,508 1.00% 303,302 73.90% 1.80% 132,220Monserrat 5,215 0.00% 2,847 54.60% 0.00% n/aPuerto Rico 3,620,897 8.60% 2,675,843 73.90% 15.50% 1,292,780St. Barthélemy (FR) 7,267 0.00% 1,540 21.20% 0.00% n/a St. Kitts & Nevis 51,538 0.10% 41,230 80.00% 0.20% 22,600Saint Lucia 163,362 0.40% 142,900 87.50% 0.80% 59,000St. Martin (FR) 31,530 0.10%n/a n/a 0.00% n/a St. Vincent & Grenadines 102,918 0.20% 76,000 73.80% 0.40% 38,640Sint Maarten (NL) 40,289 0.10%n/a n/a n/a n/aTrinidad & Tobago 1,223,916 2.90% 780,858 63.80% 4.50% 484,780Turks & Caicos 49,070 0.10% 14,760 30.10% 0.10% 13,900US Virgin Islands 104,170 0.20% 47,189 45.30% 0.30% 4,880TOTAL CARIBBEAN 41,873,409 100.00% 17,211,359 41.10% 100.00% 6,397,080
NOTES: (1) The Caribbean Statistics were updated for June 30, 2014. (2) CLICK on each country name for detailed individual country and regional statistics. (3) The demographic (population) numbers are based mainly on data contained in Census Bureau. (4) Bermuda is included together with the North American countries according to the United Nations
Statistical Division listings. (5) The most recent usage information comes mainly from the data published by Nielsen Online , ITU, Facebook , and other reliable sources. (6) Facebook subscriber data is for December 31, 2012, the last data available. (7) Data may be cited, giving due credit and establishing an active link back back to Internetworldstats.com. (7) For
definitions and help, see the site surfing guide. Copyright © 2014, Miniwatts Marketing Group. All rights reserved.

Business Climate Matters: Functions of Productivity, Competitiveness
24
Green outline indicates that there are improvements underway

Looking Forward: Using SDG 8 as a Guide
25
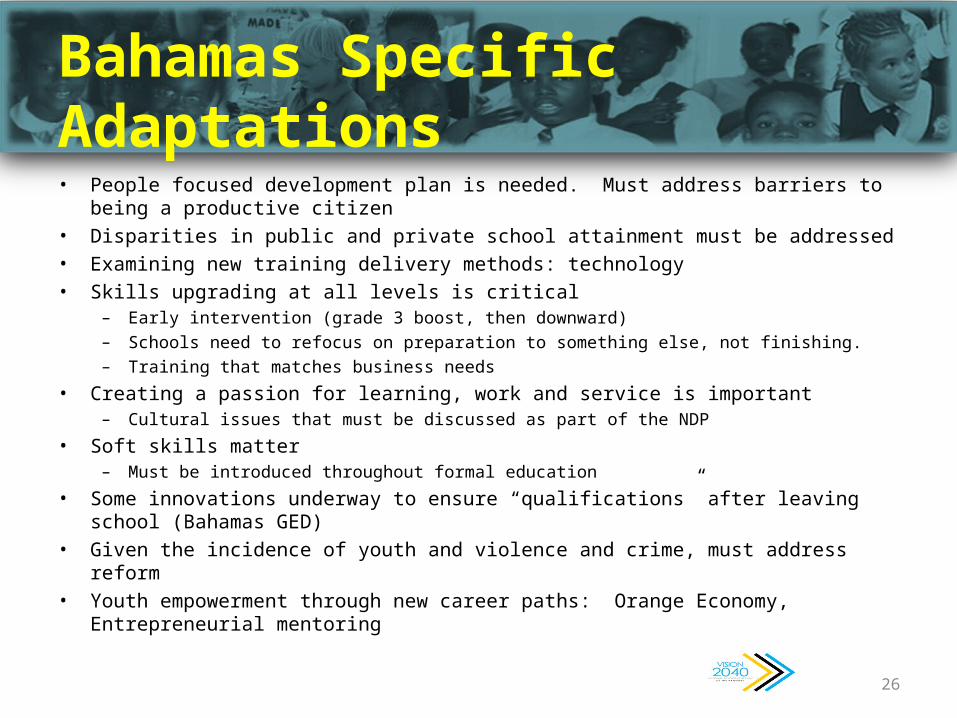
Bahamas Specific Adaptations• People focused development plan is needed. Must address barriers to being a productive
citizen• Disparities in public and private school attainment must be addressed• Examining new training delivery methods: technology• Skills upgrading at all levels is critical
– Early intervention (grade 3 boost, then downward)– Schools need to refocus on preparation to something else, not finishing.– Training that matches business needs
• Creating a passion for learning, work and service is important– Cultural issues that must be discussed as part of the NDP
• Soft skills matter– Must be introduced throughout formal education
• Some innovations underway to ensure “qualifications” after leaving school (Bahamas GED)• Given the incidence of youth and violence and crime, must address reform• Youth empowerment through new career paths: Orange Economy, Entrepreneurial
mentoring
26

Questions?

The National Development Plan
Related Documents