This article was downloaded by: [SLU Library] On: 07 November 2012, At: 00:42 Publisher: Taylor & Francis Informa Ltd Registered in England and Wales Registered Number: 1072954 Registered office: Mortimer House, 37-41 Mortimer Street, London W1T 3JH, UK Acta Agriculturae Scandinavica, Section B - Soil & Plant Science Publication details, including instructions for authors and subscription information: http://www.tandfonline.com/loi/sagb20 The N and S status in cropping systems with white cabbage as influenced by organic fertilizers Sara Elfstrand a , Birgitta Båth a & Bengt Lundegårdh b a Department of Crop Production Ecology, SLU, Uppsala, Sweden b The Biodynamic Research Institute, Järna, Sweden Accepted author version posted online: 07 Jun 2012.Version of record first published: 08 Aug 2012. To cite this article: Sara Elfstrand, Birgitta Båth & Bengt Lundegårdh (2012): The N and S status in cropping systems with white cabbage as influenced by organic fertilizers, Acta Agriculturae Scandinavica, Section B - Soil & Plant Science, 62:8, 711-719 To link to this article: http://dx.doi.org/10.1080/09064710.2012.698640 PLEASE SCROLL DOWN FOR ARTICLE Full terms and conditions of use: http://www.tandfonline.com/page/terms-and-conditions This article may be used for research, teaching, and private study purposes. Any substantial or systematic reproduction, redistribution, reselling, loan, sub-licensing, systematic supply, or distribution in any form to anyone is expressly forbidden. The publisher does not give any warranty express or implied or make any representation that the contents will be complete or accurate or up to date. The accuracy of any instructions, formulae, and drug doses should be independently verified with primary sources. The publisher shall not be liable for any loss, actions, claims, proceedings, demand, or costs or damages whatsoever or howsoever caused arising directly or indirectly in connection with or arising out of the use of this material.

Welcome message from author
This document is posted to help you gain knowledge. Please leave a comment to let me know what you think about it! Share it to your friends and learn new things together.
Transcript
This article was downloaded by: [SLU Library]On: 07 November 2012, At: 00:42Publisher: Taylor & FrancisInforma Ltd Registered in England and Wales Registered Number: 1072954 Registered office: MortimerHouse, 37-41 Mortimer Street, London W1T 3JH, UK
Acta Agriculturae Scandinavica, Section B - Soil &Plant SciencePublication details, including instructions for authors and subscription information:http://www.tandfonline.com/loi/sagb20
The N and S status in cropping systems with whitecabbage as influenced by organic fertilizersSara Elfstrand a , Birgitta Båth a & Bengt Lundegårdh ba Department of Crop Production Ecology, SLU, Uppsala, Swedenb The Biodynamic Research Institute, Järna, SwedenAccepted author version posted online: 07 Jun 2012.Version of record first published: 08Aug 2012.
To cite this article: Sara Elfstrand, Birgitta Båth & Bengt Lundegårdh (2012): The N and S status in cropping systems withwhite cabbage as influenced by organic fertilizers, Acta Agriculturae Scandinavica, Section B - Soil & Plant Science, 62:8,711-719
To link to this article: http://dx.doi.org/10.1080/09064710.2012.698640
PLEASE SCROLL DOWN FOR ARTICLE
Full terms and conditions of use: http://www.tandfonline.com/page/terms-and-conditions
This article may be used for research, teaching, and private study purposes. Any substantial or systematicreproduction, redistribution, reselling, loan, sub-licensing, systematic supply, or distribution in any form toanyone is expressly forbidden.
The publisher does not give any warranty express or implied or make any representation that the contentswill be complete or accurate or up to date. The accuracy of any instructions, formulae, and drug dosesshould be independently verified with primary sources. The publisher shall not be liable for any loss, actions,claims, proceedings, demand, or costs or damages whatsoever or howsoever caused arising directly orindirectly in connection with or arising out of the use of this material.
ORIGINAL ARTICLE
The N and S status in cropping systems with white cabbage asinfluenced by organic fertilizers
SARA ELFSTRAND1, BIRGITTA BATH1 & BENGT LUNDEGARDH2
1Department of Crop Production Ecology, SLU, Uppsala, Sweden, 2The Biodynamic Research Institute, Jarna, Sweden
AbstractFresh and anaerobically digested red clover were compared as N and S sources in a incubation experiment without plantsand a pot experiment with white cabbage, both conducted in climate chambers. The hypothesis was that anaerobic digestionwould increase S availability in relation to N and that arylsulphatase activity would be higher in treatments with S deficiency.Besides the two red clover-based treatments, two treatments, one unamended and the other Biofer, an organic fertilizer with7% S containing by-products from the slaughter industry, were included in the experiments. The availability of S in relationto N was higher in biogas slurry than in fresh red clover. In the incubation, an equal percentage (approx. 50%) of N wasmineralized from all three fertilizers, while in the pot experiment, N mineralization was highest in the red clover treatment(approximately 70%). The highest S mineralization in both experiments occurred in the Biofer treatment. Growth of whitecabbage was higher in the biogas slurry than in the red clover treatment despite high N availability in the latter treatment.Immobilization of S due to more readily available C in the clover treatment could have reinforced the difference and given aless well adjusted relationship between N and S for white cabbage demand than in the biogas slurry treatment.Arylsulphatase activity in the bulk soil was higher in the red clover-based treatments than with Biofer, while the activity inthe rhizosphere soil did not differ between treatments. Arylsulphatase activity in the bulk soil was negatively correlated withwhite cabbage S concentration and positively correlated with N:S ratio in white cabbage shoots, while that in the rhizospheresoil was positively correlated with white cabbage S concentration.
Keywords: Anaerobic digestion, Brassica oleraceae L., nitrogen, red clover, sulphur, Trifolium pratense L., white cabbage.
Introduction
Sulphur (S) deficiency is recognized as one of the
major nutritional problems in northern European
crop production (Scherer, 2001; Nziguheba et al.,
2006). Brassica crops, such as white cabbage, are
particularly S-demanding. Cereals have been re-
ported to require 15�20 kg S ha�1, whereas rape
has been reported to require 30�40 kg S ha�1 (Zhao
et al., 1996) and cabbage 45�70 kg S ha�1
(Tabatabai, 1984). This high S demand may con-
stitute a problem in cropping systems with Brassica
crops where directly incorporated green manure
crops are the main nutrient source. The reason is
the low S content in green manures in relation to
nitrogen (N) and the high S requirement of Brassica
crops. Since N and S are closely associated in protein
synthesis, the S demand varies with the supply of N
to crops (Tabatabai, 1984) and S deficiency can limit
the uptake of available N (Eriksen et al., 2001).
In addition to direct incorporation, green manures
may also be harvested and used to produce biogas
via anaerobic digestion. The by-product from this
process, slurry, may be used as a fertilizer. In
contrast to fresh plant materials, in which N is
mainly organically bound, about 40�60% of the N in
biogas slurry occurs as mineral (mainly ammonium)
N (Nordberg & Edstrom, 1997; Bath & Ramert,
2000). The S in fresh plant material is mainly
organically bound, but may also occur in relatively
large amounts as sulphate (Bergmann, 1992), a
direct S source for plants. The S forms in biogas
slurry have not been investigated to the same extent
as those in fresh plant material, but a large propor-
tion appears to be in reduced form (Elfstrand et al.,
2007), that is in the form of sulphides, the stage in
Correspondence: Birgitta Bath, Department of Crop Production Ecology, SLU, Box 7043, SE-750 07 Uppsala, Sweden. Tel: �46 18 67 23 10.
E-mail: [email protected]
Acta Agriculturae Scandinavica Section B � Soil and Plant Science, 2012; 62: 711�719
(Received 31 January 2012; revised 11 May 2012; accepted 23 May 2012)
ISSN 0906-4710 print/ISSN 1651-1913 online # 2012 Taylor & Francis
http://dx.doi.org/10.1080/09064710.2012.698640
Dow
nloa
ded
by [
SLU
Lib
rary
] at
00:
42 0
7 N
ovem
ber
2012
decomposition of organic S prior to oxidation into
sulphate.
The mineralization of sulphate esters, which plays
an important role in the release of sulphate (Scherer,
2001), is mediated by sulphatase enzymes originat-
ing from microorganisms and plants (Knauff et al.,
2003). Plants respond to an insufficient S supply by
increased production and excretion of sulphatases to
a higher extent than at sufficient S supply. The
ability to exude sulphatases also differs between
plant species and has been shown to be higher with
Brassica species than with grasses at S deficiency
levels (Knauff et al., 2003). Arylsulphatase is a
generally occurring sulphatase enzyme and may
hence be used as an indicator of biochemical
mineralization intensity of organic sulphate esters
in the soil (Kotkova et al., 2008).
Due to differences in availability and the fact that
both total N and S content and N:S ratio can vary
considerably between different forms of organic
fertilizers (Eriksen, 2005), it is difficult to assess
their agronomic significance in terms of N and S
supply (Scherer, 2001). In the present study, two
forms of red clover (fresh and anaerobically digested
red clover shoots) were compared as N and S sources
in white cabbage production. The hypothesis was
that anaerobic digestion would increase the avail-
ability of S in relation to N compared with fresh red
clover shoots. A further hypothesis was that arylsul-
phatase activity would be higher in treatments with
S deficiency and thus functions as an indicator of the
S status of the cropping systems.
Materials and methods
To quantify the amount of N and S released from the
different organic amendments, an initial incubation
experiment without a crop (Experiment I) was
conducted prior to a pot experiment with white
cabbage (Experiment II). Besides the red clover and
biogas slurry treatments, two control treatments, one
unamended and one with Biofer 6-3-12, were
included in each of the two experiments. Biofer, an
organic fertilizer with 7% S, contains by-products
from the slaughter industry such as meat, bone and
blood meal (Gyllebo Godning AB, Lantmannen AB,
Sweden).
Preparation of red clover
Red clover (Trifolium pratense L. var. Vivi) was grown
in a greenhouse and fertilized with a complete liquid
fertilizer (Wallco 51-10-43�micro; Cederoth Inter-
national AB), starting two months after sowing.
After three months, the red clover was harvested
by cutting with scissors close to the stem base and
used in the incubation experiment (Experiment I).
The re-growth of clover was cut after one month to
prevent it from flowering. The second re-growth was
harvested after an additional month and used in the
pot experiment with white cabbage (Experiment II).
The biogas slurry was produced from ensiled,
fresh red clover shoots in an earlier experiment (Bath
& Elfstrand, 2008). The clover was rowed and left
lying in the field to dry for two days. Bulk masses of
3150 kg clover, DM content 43%, were ensiled in
large bales. Biodigestion was carried out in a biogas
digester with a total volume of 30 m3, to which was
added 7000 l water and 3000 l inoculants in the form
of cattle slurry. The silage was fed continuously into
the digester, starting with small amounts that were
gradually increased. The anaerobic digestion, a one
step mesophilic (378C) process, ran for approxi-
mately 100 days.
For analysis the red clover was dried at a tem-
perature of 308C for four days and thereafter milled
while the biogas slurry and Biofer were stored frozen
until analysis.
Characteristics of soil and fertilizers
The soil used in the two experiments consisted of 9%
clay, 20% silt and 71% sand and had an organic
matter content of 2.5%. Soil texture was character-
ized by mechanical fractionation (Ljung, 1987) and
organic matter concentration by loss on ignition,
corrected for H2O in the clay fraction. Before
chemical characterization, the soil was dried at
358C and sieved (mesh 2 mm).
The total amount of C, N and S in the incubated
soil and the amounts added with fertilizers are shown
in Table I, as is the N:S ratio for the two experi-
ments. In both experiments the fertilizer doses were
based on the same amount of N.
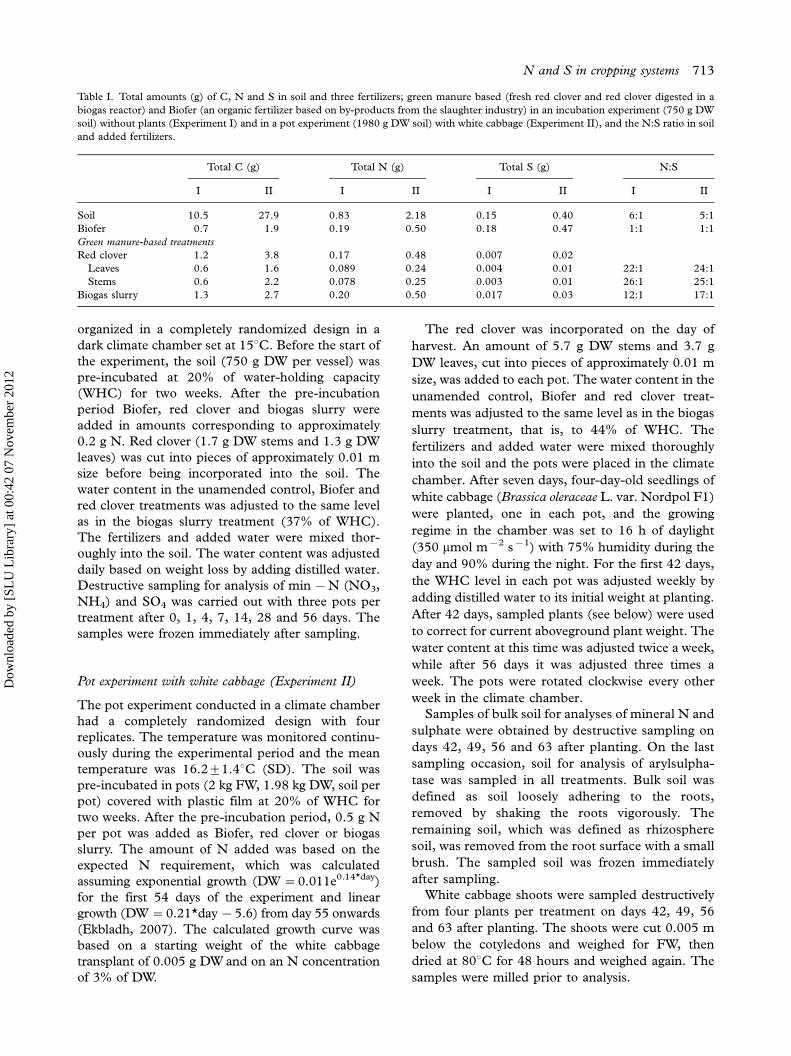
In Experiment I, about the same amounts of N
and C was added with the two forms of green
manure-based treatments (Table I). Since C abducts
in the biogas process, this suggests losses of N. The
losses may have occurred at the harvesting and post-
harvest of red clover and the further treatment of the
slurry after the anaerobic digestion process. As a
consequence of this, the N:S ratio was lower in the
biogas slurry treatment than in the red clover
treatment. In Experiment II, differences in C input
were larger while the difference in N:S ratio between
the two forms of green manure-based treatments was
smaller.
Incubation experiment (Experiment I)
The incubation experiment was conducted in 1-L
vessels without lids, with three replicates per treatment
712 S. Elfstrand et al.
Dow
nloa
ded
by [
SLU
Lib
rary
] at
00:
42 0
7 N
ovem
ber
2012
organized in a completely randomized design in a
dark climate chamber set at 158C. Before the start of
the experiment, the soil (750 g DW per vessel) was
pre-incubated at 20% of water-holding capacity
(WHC) for two weeks. After the pre-incubation
period Biofer, red clover and biogas slurry were
added in amounts corresponding to approximately
0.2 g N. Red clover (1.7 g DW stems and 1.3 g DW
leaves) was cut into pieces of approximately 0.01 m
size before being incorporated into the soil. The
water content in the unamended control, Biofer and
red clover treatments was adjusted to the same level
as in the biogas slurry treatment (37% of WHC).
The fertilizers and added water were mixed thor-
oughly into the soil. The water content was adjusted
daily based on weight loss by adding distilled water.
Destructive sampling for analysis of min �N (NO3,
NH4) and SO4 was carried out with three pots per
treatment after 0, 1, 4, 7, 14, 28 and 56 days. The
samples were frozen immediately after sampling.
Pot experiment with white cabbage (Experiment II)
The pot experiment conducted in a climate chamber
had a completely randomized design with four
replicates. The temperature was monitored continu-
ously during the experimental period and the mean
temperature was 16.291.48C (SD). The soil was
pre-incubated in pots (2 kg FW, 1.98 kg DW, soil per
pot) covered with plastic film at 20% of WHC for
two weeks. After the pre-incubation period, 0.5 g N
per pot was added as Biofer, red clover or biogas
slurry. The amount of N added was based on the
expected N requirement, which was calculated
assuming exponential growth (DW�0.011e0.14*day)
for the first 54 days of the experiment and linear
growth (DW�0.21*day�5.6) from day 55 onwards
(Ekbladh, 2007). The calculated growth curve was
based on a starting weight of the white cabbage
transplant of 0.005 g DW and on an N concentration
of 3% of DW.
The red clover was incorporated on the day of
harvest. An amount of 5.7 g DW stems and 3.7 g
DW leaves, cut into pieces of approximately 0.01 m
size, was added to each pot. The water content in the
unamended control, Biofer and red clover treat-
ments was adjusted to the same level as in the biogas
slurry treatment, that is, to 44% of WHC. The
fertilizers and added water were mixed thoroughly
into the soil and the pots were placed in the climate
chamber. After seven days, four-day-old seedlings of
white cabbage (Brassica oleraceae L. var. Nordpol F1)
were planted, one in each pot, and the growing
regime in the chamber was set to 16 h of daylight
(350 mmol m�2 s�1) with 75% humidity during the
day and 90% during the night. For the first 42 days,
the WHC level in each pot was adjusted weekly by
adding distilled water to its initial weight at planting.
After 42 days, sampled plants (see below) were used
to correct for current aboveground plant weight. The
water content at this time was adjusted twice a week,
while after 56 days it was adjusted three times a
week. The pots were rotated clockwise every other
week in the climate chamber.
Samples of bulk soil for analyses of mineral N and
sulphate were obtained by destructive sampling on
days 42, 49, 56 and 63 after planting. On the last
sampling occasion, soil for analysis of arylsulpha-
tase was sampled in all treatments. Bulk soil was
defined as soil loosely adhering to the roots,
removed by shaking the roots vigorously. The
remaining soil, which was defined as rhizosphere
soil, was removed from the root surface with a small
brush. The sampled soil was frozen immediately
after sampling.
White cabbage shoots were sampled destructively
from four plants per treatment on days 42, 49, 56
and 63 after planting. The shoots were cut 0.005 m
below the cotyledons and weighed for FW, then
dried at 808C for 48 hours and weighed again. The
samples were milled prior to analysis.
Table I. Total amounts (g) of C, N and S in soil and three fertilizers; green manure based (fresh red clover and red clover digested in a
biogas reactor) and Biofer (an organic fertilizer based on by-products from the slaughter industry) in an incubation experiment (750 g DW
soil) without plants (Experiment I) and in a pot experiment (1980 g DW soil) with white cabbage (Experiment II), and the N:S ratio in soil
and added fertilizers.
Total C (g) Total N (g) Total S (g) N:S
I II I II I II I II
Soil 10.5 27.9 0.83 2.18 0.15 0.40 6:1 5:1
Biofer 0.7 1.9 0.19 0.50 0.18 0.47 1:1 1:1
Green manure-based treatments
Red clover 1.2 3.8 0.17 0.48 0.007 0.02
Leaves 0.6 1.6 0.089 0.24 0.004 0.01 22:1 24:1
Stems 0.6 2.2 0.078 0.25 0.003 0.01 26:1 25:1
Biogas slurry 1.3 2.7 0.20 0.50 0.017 0.03 12:1 17:1
N and S in cropping systems 713
Dow
nloa
ded
by [
SLU
Lib
rary
] at
00:
42 0
7 N
ovem
ber
2012
Analyses
The total content of C and N in soil, plants and
fertilizers was analysed on a LECO analyser (CN
2000 USA) according to the Dumas method (Brem-
ner & Hauk, 1982) except for N in the biogas slurry,
which was analysed according to the Kjeldahl
method (Bremner & Mulvaney, 1982). Analyses of
S content were performed using an inductively
coupled plasma emission spectrometer (Perkin El-
mer Optima 3000 DV) after wet digestion with nitric
acid (HNO3). Total C, N and S contents were
calculated based on dry weight (1058C).
Analyses of mineral N in soil samples (NO3, NH4)
were carried out after soil samples had been milled
frozen and extracted with 250 mL 2 M KCl per 100
g FW soil (Linden, 1981). The extract was analysed
by colorimetry on a TRAACS 800 (Bran Lubbe).
For analysis of sulphate, 5 g FW soil were shaken on
a rotary shaker with 25 mL of 500 mg L�l P-solution
(16 mM KH2PO4) for 30 min (Tabatabai, 1982).
Extracts were centrifuged for 10 min at 4000 rev
min�1 and filtered. Extracts were then Millipore-
filtered (0.22 mm) before determination of sulphate
concentration by ion chromatography (Dionex).
Arylsulphatase activity was determined according
to Tabatabai (1994) with a few modifications. Field-
moist soil (equivalent to 1 g DW) was incubated
together with 1 mL 0.1 M p-nitrophenylsulphate
solution and 4 mL acetate buffer (0.5 M, pH 5.8) for
1 h in a rotating water bath at 378C. After addition of
1 mL 0.5 M CaCl2 and 4 mL 0.5 M NaOH, the
samples were filtered and the concentration of
p-nitrophenol released was determined at 400 nm
(Perkin-Elmer Lambda 25 UV/vis). The arylsulpha-
tase activity was calculated based on soil dry weight
(1058C).
Statistical analyses and calculations
Due to the irregular sampling occasions, data on
N and S mineralization in the incubation experiment
(Experiment I) and arylsulphatase in the pot experi-
ment (Experiment II) were analysed with a general
linear model to compare treatment means at each
sampling occasion separately. All other data from soil
and plant samples were analysed with a general linear
model with treatment and day, and the interactions
between these, as model components. When signifi-
cant effects (pB0.05) of treatment or day were
found, Tukey’s test was used to compare means.
When the residuals indicated that the require-
ments of normal distribution and equal variances
were not fulfilled, the data were either log- or arcsin-
transformed (shoot N and S concentrations) before
being subjected to analysis of variance. However,
untransformed data are shown in tables and figures.
The analyses were performed in Minitab 16 (Mini-
tab Inc, State College, PA, USA).
Net N and S mineralization from the fertilizers
was calculated by the difference method, that is as
½ððN or S in treatment � N or S in controlÞ=N or S in controlÞ � 100�:
Results
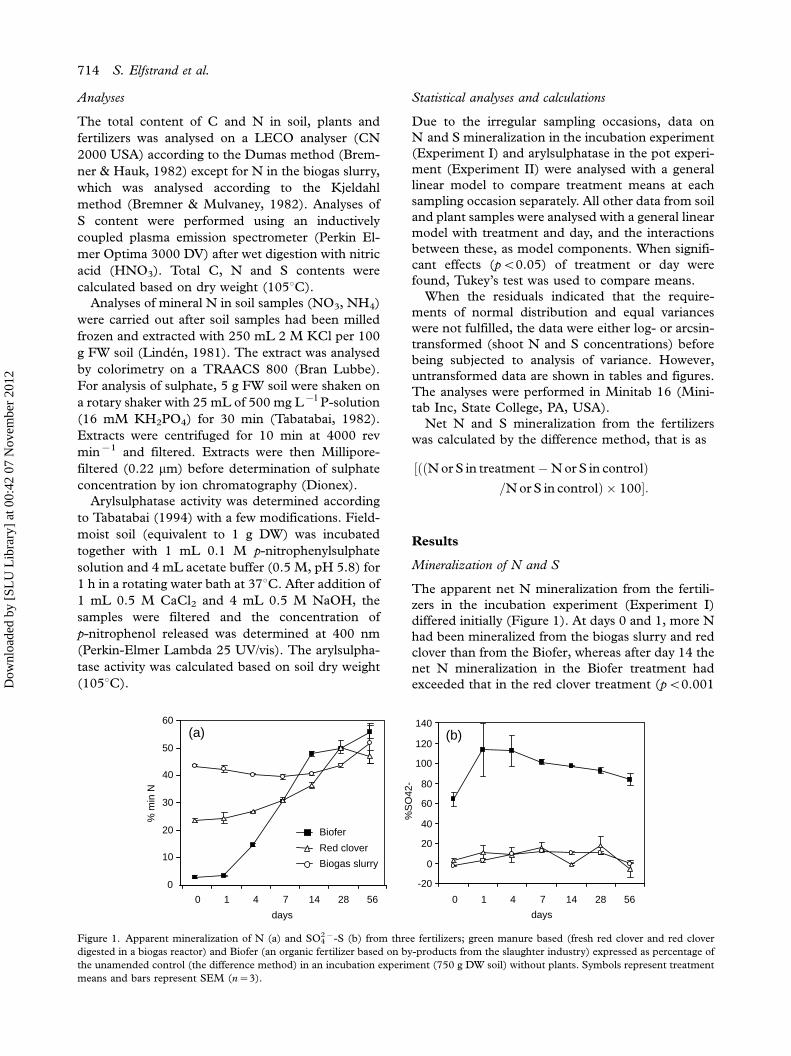
Mineralization of N and S
The apparent net N mineralization from the fertili-
zers in the incubation experiment (Experiment I)
differed initially (Figure 1). At days 0 and 1, more N
had been mineralized from the biogas slurry and red
clover than from the Biofer, whereas after day 14 the
net N mineralization in the Biofer treatment had
exceeded that in the red clover treatment (pB0.001
0
10
20
30
40
50
60
days
% m
in N
0 1 4 7 14 28 56 0 1 4 7 14 28 56
Biofer
Red clover
Biogas slurry
-20
0
20
40
60
80
100
120
140
days
%S
O42
-
(a) (b)
Figure 1. Apparent mineralization of N (a) and SO42�-S (b) from three fertilizers; green manure based (fresh red clover and red clover
digested in a biogas reactor) and Biofer (an organic fertilizer based on by-products from the slaughter industry) expressed as percentage of
the unamended control (the difference method) in an incubation experiment (750 g DW soil) without plants. Symbols represent treatment
means and bars represent SEM (n�3).
714 S. Elfstrand et al.
Dow
nloa
ded
by [
SLU
Lib
rary
] at
00:
42 0
7 N
ovem
ber
2012
on all occasions). However, at the end of the
incubation, equal percentages (approximately 50%)
of N had been mineralized from all three fertilizers
(p�0.05 at day 56). The highest net SO42�-S
mineralization throughout the incubation was mea-
sured in the Biofer treatment. The explanation for
the high variance for sulphate on days 0�4 and the
high percentages may be an uneven soil distribution
of the Biofer pellets.
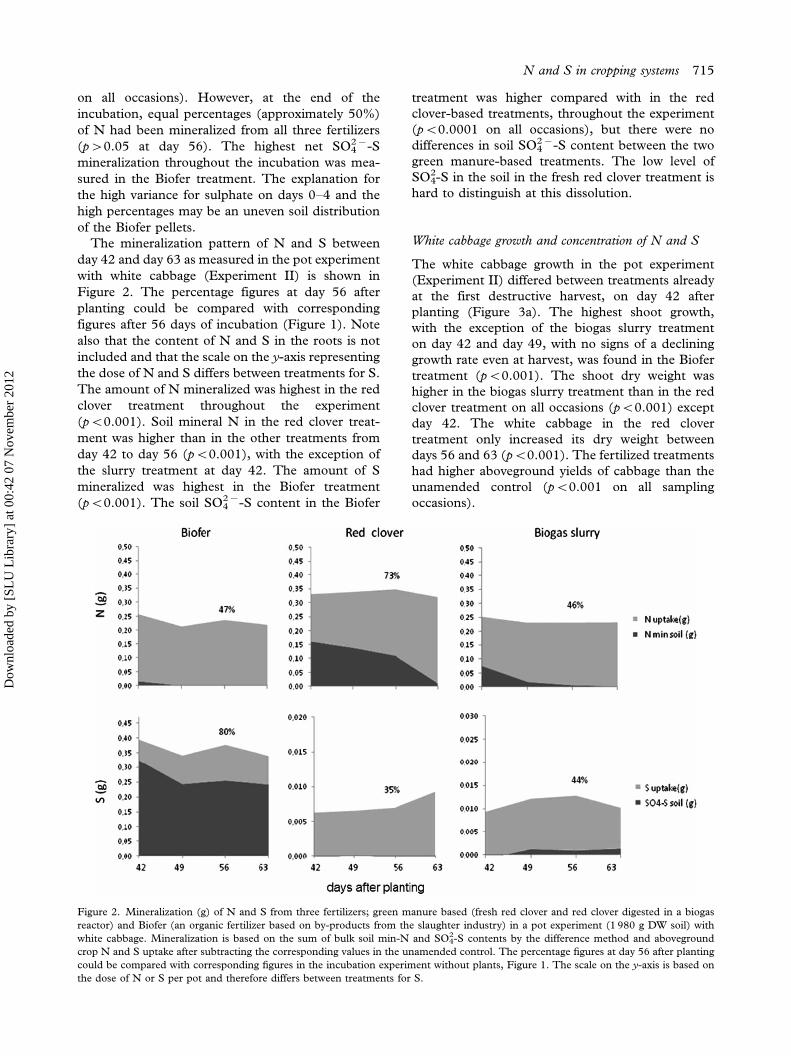
The mineralization pattern of N and S between
day 42 and day 63 as measured in the pot experiment
with white cabbage (Experiment II) is shown in
Figure 2. The percentage figures at day 56 after
planting could be compared with corresponding
figures after 56 days of incubation (Figure 1). Note
also that the content of N and S in the roots is not
included and that the scale on the y-axis representing
the dose of N and S differs between treatments for S.
The amount of N mineralized was highest in the red
clover treatment throughout the experiment
(pB0.001). Soil mineral N in the red clover treat-
ment was higher than in the other treatments from
day 42 to day 56 (pB0.001), with the exception of
the slurry treatment at day 42. The amount of S
mineralized was highest in the Biofer treatment
(pB0.001). The soil SO42�-S content in the Biofer
treatment was higher compared with in the red
clover-based treatments, throughout the experiment
(pB0.0001 on all occasions), but there were no
differences in soil SO42�-S content between the two
green manure-based treatments. The low level of
SO42-S in the soil in the fresh red clover treatment is
hard to distinguish at this dissolution.
White cabbage growth and concentration of N and S
The white cabbage growth in the pot experiment
(Experiment II) differed between treatments already
at the first destructive harvest, on day 42 after
planting (Figure 3a). The highest shoot growth,
with the exception of the biogas slurry treatment
on day 42 and day 49, with no signs of a declining
growth rate even at harvest, was found in the Biofer
treatment (pB0.001). The shoot dry weight was
higher in the biogas slurry treatment than in the red
clover treatment on all occasions (pB0.001) except
day 42. The white cabbage in the red clover
treatment only increased its dry weight between
days 56 and 63 (pB0.001). The fertilized treatments
had higher aboveground yields of cabbage than the
unamended control (pB0.001 on all sampling
occasions).
Figure 2. Mineralization (g) of N and S from three fertilizers; green manure based (fresh red clover and red clover digested in a biogas
reactor) and Biofer (an organic fertilizer based on by-products from the slaughter industry) in a pot experiment (1 980 g DW soil) with
white cabbage. Mineralization is based on the sum of bulk soil min-N and SO42-S contents by the difference method and aboveground
crop N and S uptake after subtracting the corresponding values in the unamended control. The percentage figures at day 56 after planting
could be compared with corresponding figures in the incubation experiment without plants, Figure 1. The scale on the y-axis is based on
the dose of N or S per pot and therefore differs between treatments for S.
N and S in cropping systems 715
Dow
nloa
ded
by [
SLU
Lib
rary
] at
00:
42 0
7 N
ovem
ber
2012
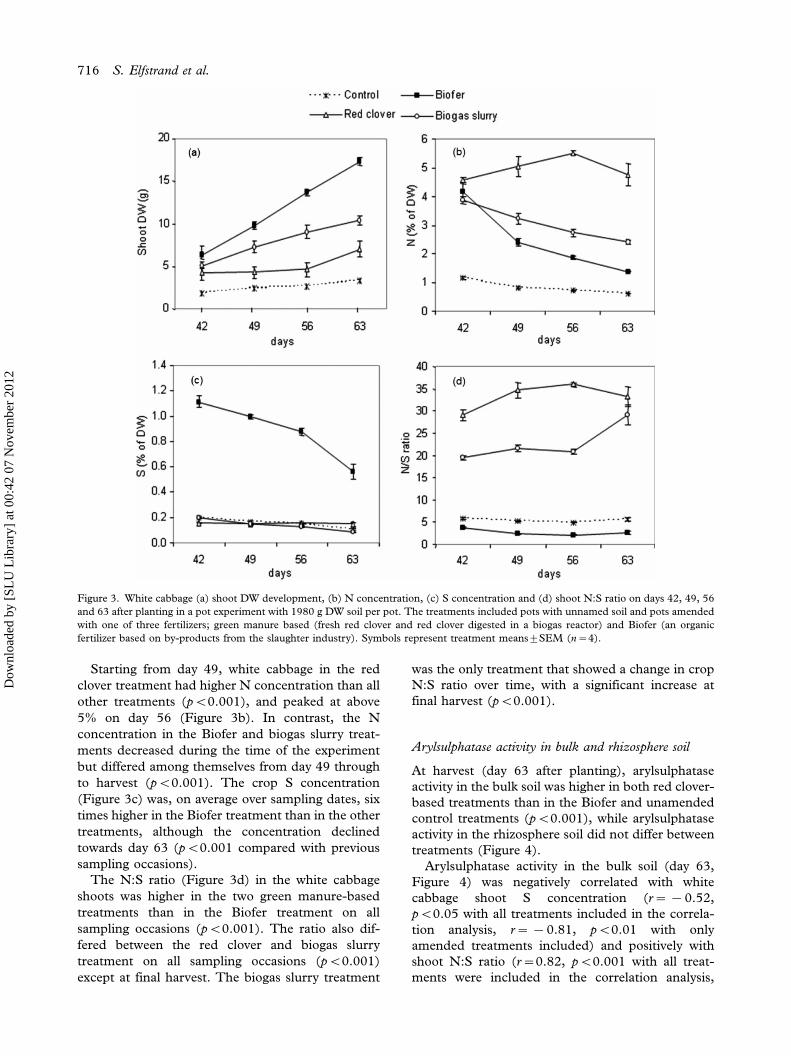
Starting from day 49, white cabbage in the red
clover treatment had higher N concentration than all
other treatments (pB0.001), and peaked at above
5% on day 56 (Figure 3b). In contrast, the N
concentration in the Biofer and biogas slurry treat-
ments decreased during the time of the experiment
but differed among themselves from day 49 through
to harvest (pB0.001). The crop S concentration
(Figure 3c) was, on average over sampling dates, six
times higher in the Biofer treatment than in the other
treatments, although the concentration declined
towards day 63 (pB0.001 compared with previous
sampling occasions).
The N:S ratio (Figure 3d) in the white cabbage
shoots was higher in the two green manure-based
treatments than in the Biofer treatment on all
sampling occasions (pB0.001). The ratio also dif-
fered between the red clover and biogas slurry
treatment on all sampling occasions (pB0.001)
except at final harvest. The biogas slurry treatment
was the only treatment that showed a change in crop
N:S ratio over time, with a significant increase at
final harvest (pB0.001).
Arylsulphatase activity in bulk and rhizosphere soil
At harvest (day 63 after planting), arylsulphatase
activity in the bulk soil was higher in both red clover-
based treatments than in the Biofer and unamended
control treatments (pB0.001), while arylsulphatase
activity in the rhizosphere soil did not differ between
treatments (Figure 4).
Arylsulphatase activity in the bulk soil (day 63,
Figure 4) was negatively correlated with white
cabbage shoot S concentration (r��0.52,
pB0.05 with all treatments included in the correla-
tion analysis, r��0.81, pB0.01 with only
amended treatments included) and positively with
shoot N:S ratio (r�0.82, pB0.001 with all treat-
ments were included in the correlation analysis,
Figure 3. White cabbage (a) shoot DW development, (b) N concentration, (c) S concentration and (d) shoot N:S ratio on days 42, 49, 56
and 63 after planting in a pot experiment with 1980 g DW soil per pot. The treatments included pots with unnamed soil and pots amended
with one of three fertilizers; green manure based (fresh red clover and red clover digested in a biogas reactor) and Biofer (an organic
fertilizer based on by-products from the slaughter industry). Symbols represent treatment means9SEM (n�4).
716 S. Elfstrand et al.
Dow
nloa
ded
by [
SLU
Lib
rary
] at
00:
42 0
7 N
ovem
ber
2012
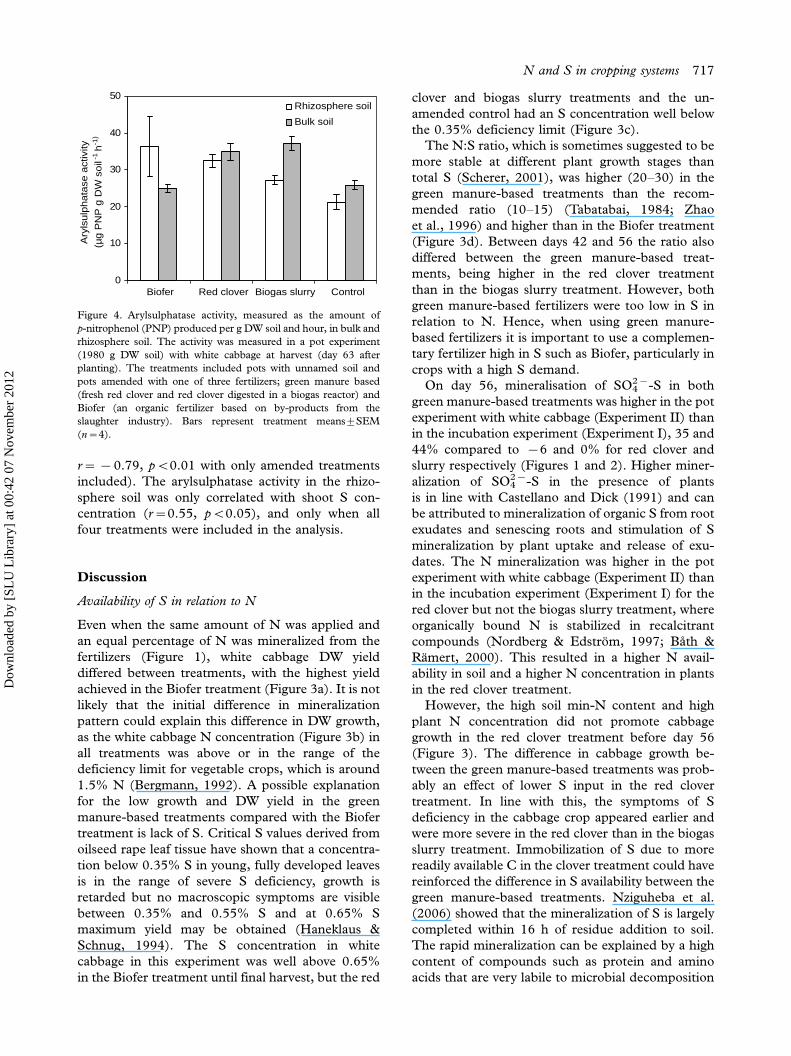
r��0.79, pB0.01 with only amended treatments
included). The arylsulphatase activity in the rhizo-
sphere soil was only correlated with shoot S con-
centration (r�0.55, pB0.05), and only when all
four treatments were included in the analysis.
Discussion
Availability of S in relation to N
Even when the same amount of N was applied and
an equal percentage of N was mineralized from the
fertilizers (Figure 1), white cabbage DW yield
differed between treatments, with the highest yield
achieved in the Biofer treatment (Figure 3a). It is not
likely that the initial difference in mineralization
pattern could explain this difference in DW growth,
as the white cabbage N concentration (Figure 3b) in
all treatments was above or in the range of the
deficiency limit for vegetable crops, which is around
1.5% N (Bergmann, 1992). A possible explanation
for the low growth and DW yield in the green
manure-based treatments compared with the Biofer
treatment is lack of S. Critical S values derived from
oilseed rape leaf tissue have shown that a concentra-
tion below 0.35% S in young, fully developed leaves
is in the range of severe S deficiency, growth is
retarded but no macroscopic symptoms are visible
between 0.35% and 0.55% S and at 0.65% S
maximum yield may be obtained (Haneklaus &
Schnug, 1994). The S concentration in white
cabbage in this experiment was well above 0.65%
in the Biofer treatment until final harvest, but the red
clover and biogas slurry treatments and the un-
amended control had an S concentration well below
the 0.35% deficiency limit (Figure 3c).
The N:S ratio, which is sometimes suggested to be
more stable at different plant growth stages than
total S (Scherer, 2001), was higher (20�30) in the
green manure-based treatments than the recom-
mended ratio (10�15) (Tabatabai, 1984; Zhao
et al., 1996) and higher than in the Biofer treatment
(Figure 3d). Between days 42 and 56 the ratio also
differed between the green manure-based treat-
ments, being higher in the red clover treatment
than in the biogas slurry treatment. However, both
green manure-based fertilizers were too low in S in
relation to N. Hence, when using green manure-
based fertilizers it is important to use a complemen-
tary fertilizer high in S such as Biofer, particularly in
crops with a high S demand.
On day 56, mineralisation of SO42�-S in both
green manure-based treatments was higher in the pot
experiment with white cabbage (Experiment II) than
in the incubation experiment (Experiment I), 35 and
44% compared to �6 and 0% for red clover and
slurry respectively (Figures 1 and 2). Higher miner-
alization of SO42�-S in the presence of plants
is in line with Castellano and Dick (1991) and can
be attributed to mineralization of organic S from root
exudates and senescing roots and stimulation of S
mineralization by plant uptake and release of exu-
dates. The N mineralization was higher in the pot
experiment with white cabbage (Experiment II) than
in the incubation experiment (Experiment I) for the
red clover but not the biogas slurry treatment, where
organically bound N is stabilized in recalcitrant
compounds (Nordberg & Edstrom, 1997; Bath &
Ramert, 2000). This resulted in a higher N avail-
ability in soil and a higher N concentration in plants
in the red clover treatment.
However, the high soil min-N content and high
plant N concentration did not promote cabbage
growth in the red clover treatment before day 56
(Figure 3). The difference in cabbage growth be-
tween the green manure-based treatments was prob-
ably an effect of lower S input in the red clover
treatment. In line with this, the symptoms of S
deficiency in the cabbage crop appeared earlier and
were more severe in the red clover than in the biogas
slurry treatment. Immobilization of S due to more
readily available C in the clover treatment could have
reinforced the difference in S availability between the
green manure-based treatments. Nziguheba et al.
(2006) showed that the mineralization of S is largely
completed within 16 h of residue addition to soil.
The rapid mineralization can be explained by a high
content of compounds such as protein and amino
acids that are very labile to microbial decomposition
0
10
20
30
40
50
Biofer Red clover Biogas slurry Control
Ary
lsu
lph
ata
se a
ctiv
ity
(µ
g P
NP
g D
W s
oil -
1 h -1
)
Rhizosphere soil
Bulk soil
Figure 4. Arylsulphatase activity, measured as the amount of
p-nitrophenol (PNP) produced per g DW soil and hour, in bulk and
rhizosphere soil. The activity was measured in a pot experiment
(1980 g DW soil) with white cabbage at harvest (day 63 after
planting). The treatments included pots with unnamed soil and
pots amended with one of three fertilizers; green manure based
(fresh red clover and red clover digested in a biogas reactor) and
Biofer (an organic fertilizer based on by-products from the
slaughter industry). Bars represent treatment means9SEM
(n�4).
N and S in cropping systems 717
Dow
nloa
ded
by [
SLU
Lib
rary
] at
00:
42 0
7 N
ovem
ber
2012
(Tabatabai & Chae, 1991). In our experiment, how-
ever, immobilization of S would not have been regis-
tered, since the first sampling took place after 24 h.
Arylsulphatase activity and its correlation to N and S
status of the cropping systems
Sinsabaugh et al. (1993) suggested that the sub-
strate-enzyme feedback mechanisms regulating soil
enzyme activity could be used to indicate nutrient
limitations, since high enzyme activities could in-
dicate substrate deficiency, while low activities in-
dicate synthesis suppression when substrate is
available in high concentrations (Dilly & Nannipieri,
1998). In line with this, we expected the arylsulpha-
tase activity to be highest in treatments with poor S
status. The S concentration and N:S ratios of the
white cabbage crop were used as indicators of S
availability in the treatments. The strong correlation
between arylsulphatase activity and both white
cabbage shoot S concentration and shoot N:S ratio
suggests that arylsulphatase activity in the bulk soil
may serve an indicator of the S status in controlled
pot experiments (Figure 4). However, arylsulphatase
activity in the rhizosphere soil did not follow the
same pattern as in the bulk soil. On the contrary, the
Biofer treatment that had the highest crop S
concentration at harvest also tended to have higher
arylsulphatase activity. The rhizosphere soil can be
expected to better reflect the current S status of the
crop than the bulk soil, since the root can alter the
availability of nutrients in the rhizosphere. Thus, it is
possible that the contradictory pattern of the activity
levels in the rhizosphere and bulk soil in the Biofer
treatment can be explained by a recent change in
crop S status. Indeed, the shoot S concentration in
the Biofer treatment declined significantly in the
week before harvest of the white cabbage (Figure 3).
As arylsulphatase activity has been shown to increase
in response to S deficiency in plants (Knauff et al.,
2003), it is possible that the observed decline in white
cabbage S status stimulated arylsulphatase activity in
the rhizosphere. It could also be a microbial response
to S deficiency in the rhizosphere, as plant uptake of S
increased with plant growth. However, since S con-
centration was only measured in the bulk soil and not
in the rhizosphere, this scenario cannot be confirmed
by this experiment.
The unamended control treatment also deviated
from the hypothesized pattern, that is, the relation-
ship between low S status and high arylsulphatase
activity. However, this can be explained by lower
availability of C in the control treatment compared
with the treatments amended with organic fertilizers,
and also by the poor growth of the white cabbage
crop, which was likely to result in less exudation and
rhizodeposition by the crop. These factors probably
resulted in an overall lower microbial activity and
consequently a lower enzymatic activity level in this
treatment. This illustrates the difficulty in correlating
the arylsulphatase activity to S status of a complex
cropping system.
References
Bath, B. & Elfstrand, S. (2008) Use of red clover-based green
manure in leek cultivation. Biological Agriculture and
Horticulture, 25, 269�286.Bath, B. & Ramert, B. (2000). Organic household wastes as a
nitrogen source in leek production. Acta Agriculturae Scandi-
navica, Section B, Soil and Plant Science, 49, 201�208.Bergmann, W. (1992) Nutritional Disorder of Plants: Development,
Visual and Analytical Diagnosis (New York: G. Fisher).
Bremner, J. M. & Hauk, R. D. (1982) Advances in methodology
for research on nitrogen transformation in soil. In F. J.
Stevenson (ed.) Nitrogen in Agricultural Soils (Madison, WI:
American Society of Agronomy), pp. 467�502.
Bremner, J. M. & Mulvaney C. S. (1982) Nitrogen-total. In A. L.
Page, R. H. Miller & D. R. Keeney (eds.), Methods of Soil
Analysis, American Society of Agronomy (Madison, WI: Soil
Science Society of America), pp. 595�624.
Castellano, S. D. & Dick, R. P. (1991) Cropping and sulphur
fertilization influence on sulphur transformations. Soil
Science Society of America Journal, 55, 114�121.Dilly, O. & Nannipieri, P. (1998) Intracellular and extracellular
enzyme activity in soil with reference to elemental cycling.
Zeitschrift fur Pflanzenernahrung und Bodenkunde, 161, 243�248.Ekbladh, G. (2007) Plant Analysis as a Tool to Determine Crop
Nitrogen Status. Doctoral theses no. 2007:109, Appendix IV.
SLU, Uppsala.
Elfstrand, S., Bath, B. & Martensson, A. (2007). Influence of
various forms of green manure amendment on soil microbial
community composition, enzyme activity and nutrient levels
in leek. Applied Soil Ecology, 36, 70�82.Eriksen, J. (2005). Gross sulphur mineralisation-immobilisation
turnover in soil amended with plant residues. Soil Biology &
Biochemistry, 37, 2216�2224.Eriksen, J., Nielsen, M., Mortensen, J. V. & Schjorring, J. K.
(2001) Redistribution of sulphur during generative growth of
barley plants with different sulphur and nitrogen status. Plant
and Soil, 230, 239�246.Haneklaus, S. & Schnug, E. (1994) Diagnosis of crop sulphur
status and application of X-ray fluorescence spectroscopy for
the sulphur determination in plant and soil materials.
Sulphur in Agriculture, 18, 31�40.Knauff, U., Schulz, M. & Scherer, H. W. (2003) Arylsulfatse
activity in the rhizosphere and roots of different crop species.
European Journal of Agronomy, 19, 215�223.Kotkova, B., Balık, J., Cerny, J., Kulhanek, M. & Bazalova, M.
(2008) Crop influence on mobile sulphur content and
arylsulphatase activity in the plant rhizosphere. Plant, Soil
and Environment, 54, 100�107.Linden, B. (1981) Movements and distribution of ammonium-
and nitrate-N in the soil. II. Methods of sampling and
analysing mineral nitrogen. Avdelningen for Vaxtnaringslara,
Rapport, 137. SLU; Uppsala, Sweden. (In Swedish; English
summary).
Ljung, G. (1987) Mekanisk analys � Beskrivning av en rationell
metod for jordartbestamning. Avdelningen for Lantbrukets
Hydroteknik, Avdelnings meddelande, 87. SLU; Uppsala,
Sweden. (In Swedish)
718 S. Elfstrand et al.
Dow
nloa
ded
by [
SLU
Lib
rary
] at
00:
42 0
7 N
ovem
ber
2012
Nordberg, A. & Edstrom, M. (1997) Co-digestion of a ley crop
silage, source-sorted municipal solid waste and municipal
sewage sludge. In W. Verstraete (ed.) Anaerobic Conversion for
Environmental Protection, Sanitation and Re-use of Residues
REUR technological series 52, FAO reginal office for Europe
(Belgium: University Gent), pp. 162�172.
Nziguheba, G., Smolders, E. & Merckx, R. (2006) Mineralization
of sulphur from organic residues assessed by inverse isotope
dilution. Soil Biology & Biochemistry, 38, 2278�2284.Scherer, H. W. (2001) Sulphur in crop production � Invited
paper. European Journal of Agronomy, 14, 81�111.Sinsabaugh, R. L., Antibus, R. K., Linkins, A. E., McClaugherty,
C. A., Rayburn, L., Repert, D. & Weiland, T. (1993). Wood
decomposition over a first-order watershed: Nitrogen and
phosphorus dynamics in relation to extracellular enzyme
activities. Ecology, 74, 1586�1593.
Tabatabai, M. A. (1982) Sulfur. In A. L. Page, R. H. Miller & D. R.
Keeney (eds.) Methods of Soil Analysis, Part 2 (Madison, WI:
SSSA), pp. 501�538.
Tabatabai, M. A. (1984) Importance of sulphur in crop produc-
tion. Biogeochemistry, 1, 45�62.Tabatabai, M. A. (1994) Soil enzymes. In R. W. Weaver & S. H.
Mickelson (eds.) Methods of Soil Analysis, Part 2 Microbio-
logical and Biochemical Properties � SSSA Book Series 5
(Madison, WI: SSSA), pp. 814�818.
Tabatabai, M. A. & Chae, Y. M. (1991) Mineralization of sulphur
in soils amended with organic wastes. Journal of Environ-
mental Quality, 20, 684�690.Zhao, F. J., Hawkesford, M. J., Warrilow, A. G. S., McGrath, S. P.
& Clarkson, D. T. (1996). Responses of two wheat varieties to
sulphur addition and diagnosis of sulphur deficiency. Plant and
Soil, 181, 317�327.
N and S in cropping systems 719
Dow
nloa
ded
by [
SLU
Lib
rary
] at
00:
42 0
7 N
ovem
ber
2012
Related Documents