PROSIDING PERKEM VI, JILID 1 (2011) 450 – 467 ISSN: 2231-962X Persidangan Kebangsaan Ekonomi Malaysia ke VI (PERKEM VI), Ekonomi Berpendapatan Tinggi: Transformasi ke Arah Peningkatan Inovasi, Produktiviti dan Kualiti Hidup, Melaka Bandaraya Bersejarah, 5 – 7 Jun 2011 The Multidimensional Poverty Index (MPI) and its Application In Malaysia: A Case Study UiTM Students, Shah Alam Campus Nadia Nabila Ibrahin ([email protected]) Fairuz Nabilla Mohamed Husain ([email protected]) Rahana Abdul Rahman ([email protected]) Faculty of Business Management Universiti Teknologi MARA (UiTM) Shah Alam ABSTRACT Defining the term “poverty” from multidimensional concept and applying into specific environment is the best way to understand the term “poverty” in this century. With the introduction of the Multidimensional Poverty Index (MPI) by the Oxford Poverty and Human Development Initiative (OPHI) in July 2010, this paper aims at bridging the gap between development and national policy from multidimensional perspective. By applying into an academic environment, with students of UiTM Shah Alam as subject matter, we will be able to bridge the gap between student’s academic performance with their quality of life from three major components - education, health and standard of living. This study reveals great variation of MPI among UiTM students. Most of the students were found to be in category of ‘multidimensionally poor’ where their MPI values range between 0.71 to 0.9. But despite this results, we also found that despite the fact that these students come from poor family and poor quality of life, but they still can perform in their final exam, a negative relationship between student achievement and student’s family income and quality of life. Keywords: Poverty, Multidimensional Poverty, development, students, quality of life. INTRODUCTION Poverty remains widespread in many parts of the world due to the complexity issues of the term “poverty” since booming economic are associates with material deprivation, unalterable characteristics (such as race and ethnicity) and shocks (such as health pandemics and environmental catastrophes) while while depression are associate with safety trap and poverty trap (UNDP, 2009). Economic growth, inequality disparities and poverty have indirect conection but closely related. The poorest consists of 40 per cent of the world’s population and account for only 5 per cent of global income while the richest 20 per cent that account for 75 per cent of world income (UNDP, 2007). Thus sustaining poverty reduction highly depends on a fast pace of economic growth with distribution of additional income and the features of the employment component play a crucial impacts to poverty outcomes. In short, high degree of equal distribution of national assets and additional income will lead for faster economic growth, higher productivity among smallholders and significant human capital investments. Large economies of scale linked to larger domestic markets and greater political stability, rapid expansion of industrial investment and jobs enabling to the absorption of surplus labour (Khan, 2007). Under the Millennium Development Goals (MDG), Malaysia has achieved its objective in halving poverty rate 15 years earlier than expected in 2015 (Rao, 2006). From year 1990, Malaysia had impressive reduction of people living on less than 1 USD per day from 17 per cent to below 4 per cent in year 2009. According to Figure 1.1 below, Malaysia had created the inclusive development approach that based on four perspectives - the 1Malaysia Perspective, Geographic Perspective, Income Perspective and Social Perspective. All of these perspectives are helping in reducing the poverty level in Malaysia and increasing the standard of living among Malaysian (see Figure 1) A major policy review is necessary towards increasing outreach and maximizing impact in line with the national goal of zero hardcore poor by the end of the 9th Malaysia Plan (2006-2010). In 10th Malaysia Plan (2011-2015), government is focusing on moving towards inclusive socio-economic development. By increasing the well-being of the poor, it is believed that the students that come from poor background family will be able to achieve good academic performance. In order to understand the students overall deprivation level in Malaysia, I will be focusing on measuring the overall deprivation level among UiTM students in Shah Alam by using non-income approach, the Multidimensional Poverty Index. This paper aims at bridging the gap between development and national policy from multidimensional perspective. By applying into an academic environment, with students of UiTM Shah

Welcome message from author
This document is posted to help you gain knowledge. Please leave a comment to let me know what you think about it! Share it to your friends and learn new things together.
Transcript
PROSIDING PERKEM VI, JILID 1 (2011) 450 – 467
ISSN: 2231-962X
Persidangan Kebangsaan Ekonomi Malaysia ke VI (PERKEM VI),
Ekonomi Berpendapatan Tinggi: Transformasi ke Arah Peningkatan Inovasi, Produktiviti dan Kualiti Hidup,
Melaka Bandaraya Bersejarah, 5 – 7 Jun 2011
The Multidimensional Poverty Index (MPI) and its Application In
Malaysia: A Case Study UiTM Students, Shah Alam Campus
Nadia Nabila Ibrahin ([email protected])
Fairuz Nabilla Mohamed Husain ([email protected])
Rahana Abdul Rahman ([email protected])
Faculty of Business Management
Universiti Teknologi MARA (UiTM) Shah Alam
ABSTRACT
Defining the term “poverty” from multidimensional concept and applying into specific environment is
the best way to understand the term “poverty” in this century. With the introduction of the
Multidimensional Poverty Index (MPI) by the Oxford Poverty and Human Development Initiative
(OPHI) in July 2010, this paper aims at bridging the gap between development and national policy
from multidimensional perspective. By applying into an academic environment, with students of UiTM
Shah Alam as subject matter, we will be able to bridge the gap between student’s academic
performance with their quality of life from three major components - education, health and standard of
living. This study reveals great variation of MPI among UiTM students. Most of the students were
found to be in category of ‘multidimensionally poor’ where their MPI values range between 0.71 to
0.9. But despite this results, we also found that despite the fact that these students come from poor
family and poor quality of life, but they still can perform in their final exam, a negative relationship
between student achievement and student’s family income and quality of life.
Keywords: Poverty, Multidimensional Poverty, development, students, quality of life.
INTRODUCTION
Poverty remains widespread in many parts of the world due to the complexity issues of the term
“poverty” since booming economic are associates with material deprivation, unalterable characteristics
(such as race and ethnicity) and shocks (such as health pandemics and environmental catastrophes)
while while depression are associate with safety trap and poverty trap (UNDP, 2009). Economic
growth, inequality disparities and poverty have indirect conection but closely related. The poorest
consists of 40 per cent of the world’s population and account for only 5 per cent of global income while
the richest 20 per cent that account for 75 per cent of world income (UNDP, 2007). Thus sustaining
poverty reduction highly depends on a fast pace of economic growth with distribution of additional
income and the features of the employment component play a crucial impacts to poverty outcomes. In
short, high degree of equal distribution of national assets and additional income will lead for faster
economic growth, higher productivity among smallholders and significant human capital investments.
Large economies of scale linked to larger domestic markets and greater political stability, rapid
expansion of industrial investment and jobs enabling to the absorption of surplus labour (Khan, 2007).
Under the Millennium Development Goals (MDG), Malaysia has achieved its objective in
halving poverty rate 15 years earlier than expected in 2015 (Rao, 2006). From year 1990, Malaysia had
impressive reduction of people living on less than 1 USD per day from 17 per cent to below 4 per cent
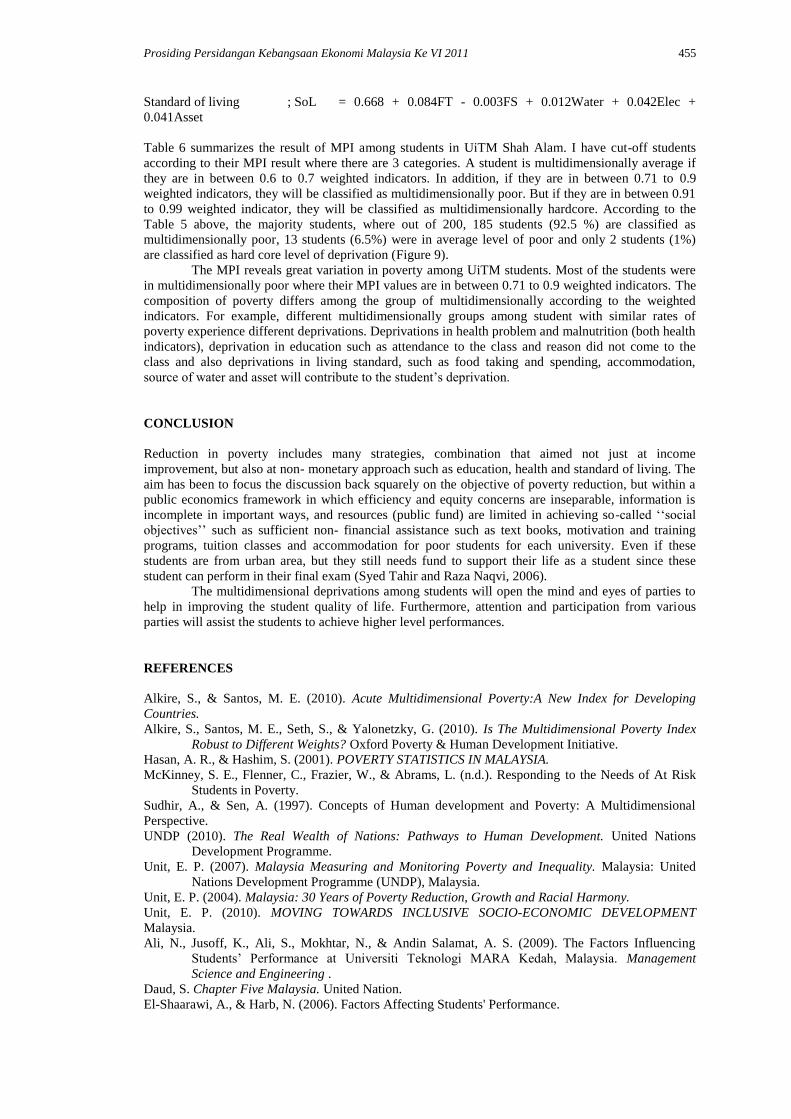
in year 2009. According to Figure 1.1 below, Malaysia had created the inclusive development approach
that based on four perspectives - the 1Malaysia Perspective, Geographic Perspective, Income
Perspective and Social Perspective. All of these perspectives are helping in reducing the poverty level
in Malaysia and increasing the standard of living among Malaysian (see Figure 1)
A major policy review is necessary towards increasing outreach and maximizing impact in
line with the national goal of zero hardcore poor by the end of the 9th Malaysia Plan (2006-2010). In
10th Malaysia Plan (2011-2015), government is focusing on moving towards inclusive socio-economic
development. By increasing the well-being of the poor, it is believed that the students that come from
poor background family will be able to achieve good academic performance. In order to understand the
students overall deprivation level in Malaysia, I will be focusing on measuring the overall deprivation
level among UiTM students in Shah Alam by using non-income approach, the Multidimensional
Poverty Index. This paper aims at bridging the gap between development and national policy from
multidimensional perspective. By applying into an academic environment, with students of UiTM Shah
Prosiding Persidangan Kebangsaan Ekonomi Malaysia Ke VI 2011 451
Alam as subject matter, we will be able to bridge the gap between student’s academic performance
with their quality of life from three major components - education, health and standard of living.
This study is conducted to measure the multidimensional deprivations among students in
Peninsular Malaysia by focusing on UiTM Shah Alam students for year 2011. This studies also
regarding academic performance and its impact to student’s well-being. In this paper, we have
examined the poverty level using the Multidimensional Poverty Index (MPI) that has been introduced
by The Oxford Poverty and Human Development Initiative (OPHI) in July 2010 with few adjustments
based on students perspective
This paper consists of 5 parts. Part 1 is the Introductory of this paper, Part 2 explains the
previous studies on the poverty reduction trend, the measurement of poverty level and the studies
regarding academic performance and its impact to student’s well-being. Part 3 presents the
methodology of this paper followed by Part 4 that shows the analysis of the primary data that have
been conducted among UiTM students. In Part 5, conclusion and recommendations that can be used by
several parties that related to this study.
PREVIOUS STUDIES
The global food, energy, and financial and economic crises, or knwon as multiple crises has been
reversing the modest progress of poverty reduction. In addition, climate change is posing a serious risk
to poverty reduction and threatening to undo decades of development efforts (Table 1). Poverty is the
deprivation of one’s ability to live as a free and dignified human being with the full potential to achieve
one’s desired goals in life - including lack of income and productive resources sufficient to ensure
sustainable livelihoods; hunger and malnutrition; ill health; limited or lack of access to education and
other basic services; increased morbidity and mortality from illness; homelessness and inadequate
housing; unsafe environments; and social discrimination and exclusion. It is also characterized by a
lack of participation in decision making and in civil, social and cultural life (UN, 2006).
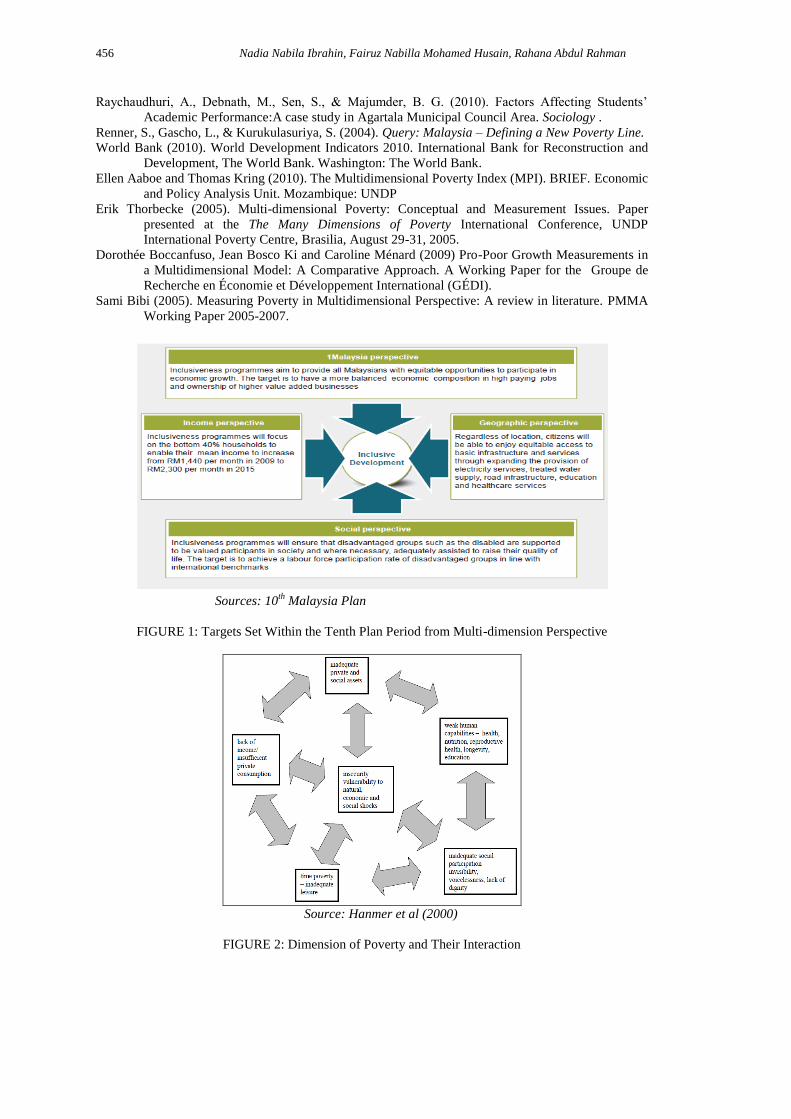
Poverty is being viewed conceptually in absolute and relative terms, associated closely with
inequity, and often correlated with vulnerabilities and social exclusion (Lok-Dessallien, 1999). These
dimensions and their interaction (Figure 2) shows that many participatory in poverty assessments
multi-interlocking factors that cluster in the poor experiences and definitions of poverty (Narayan,
2000). According to the World Development 2000/2001, deprivation in well-being encompassed
material deprivation (concept of income or consumption) and non-material (education, health report,
vulnerability and exposure to risk, voiceless and powerlessness). The extension of multidimensional
poverty involved the term vulnerability, uninsurable risks such also been studies by Christiaensen and
Boisvert (2000), Dercon (2005b), (Dercon, 2000a), Ligon and Schechter (2003), and de Janvry and
Sadoulet (2005).
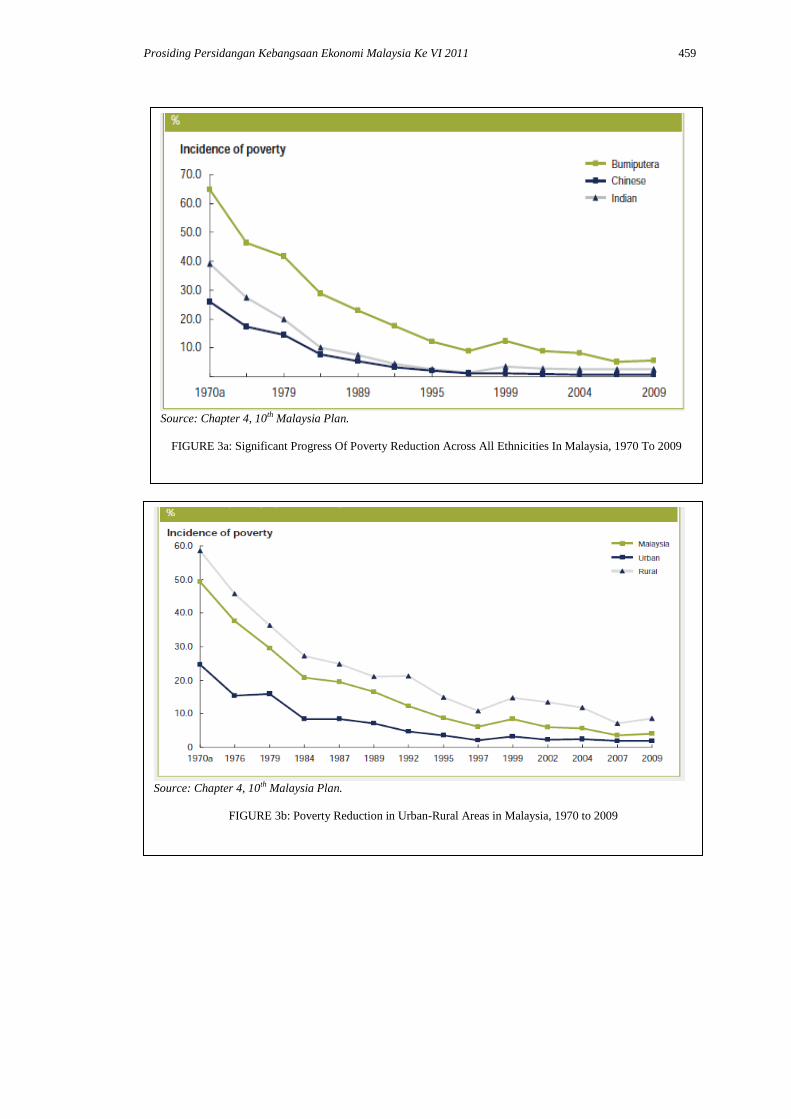
Malaysia has successfully reduced its poverty level drastically from year 1970 to 2009. Since
1970, the government targeted for poverty level eliminate across the ethnicity (Figure 3a below). The
New Economic Policy (NEP) had been introduced to reduce the extreme economic imbalances at that
time. In 1970, almost 49.3per cent of Malaysian was living below poverty line where 64.8per cent of
them are Malays, following by Indians, 39.2per cent and Chinese, 26.0per cent. In 2009, the poverty
has been significantly eliminated from 49.3per cent to 3.8per cent. It shows that the standard living
among Malaysian has been increased. In addition, government wants to increase the income levels up
to 40per cent of household. For year 2009, there were 2.4 million of household who had income less
than RM 2300 per month. This is where 1.8per cent of household is under hardcore poor, following by
7.6per cent is under poor group and the remaining is under the low-income group. Average monthly
income for bottom 40per cent household was RM1, 440. In figure 1.4, it shows the incidence of
poverty by strata for year 1970 to 2009. According to the diagram, the rural area have the higher
poverty level for year 1970 where it was close to 60per cent compared to urban area, 50per cent. Then
poverty level in rural area starts to decline until it reached below 20per cent in year 2009.
In addition, the government wants to increase the income levels up to 40per cent of household.
For year 2009, there were 2.4 million of household who had income less than RM 2300 per month.
This is where 1.8per cent of household is under hard core poor, followed by 7.6per cent is under poor
group and the remaining is under the low-income group. Average monthly income for bottom 40per
cent household was RM1, 440. In Figure 3b, it shows the incidence of poverty by strata for year 1970
to 2009. According to the diagram, the rural area have higher poverty level for year 1970 where it was
close to 60per cent compared to urban area, 50per cent. Then poverty level in rural area starts to
decline until it reached below 20per cent and the urban area below 10per cent. In 1995, the incidence of
452 Nadia Nabila Ibrahin, Fairuz Nabilla Mohamed Husain, Rahana Abdul Rahman
rural poverty decreased from 14.9per cent to 12.4per cent in 1999 while in the urban area, the poverty
had decreased from 3.6per cent to 3.4per cent.
The issue of poverty not solely applied to households, but also in case of student wellbeing.
Poverty among poor students has lead to low academic performance. According to Aremu (2003), poor
academic performance is a performance that is adjudged by the examinee and some other significant as
falling below an expected standard. Aremu (2000) has stresses that academic failure is not only
frustrating to the students and the parents but it also effects are equally grave on the society in terms of
death of manpower in the economy and politics. Morakinyo (2003) believe that the falling level of
academic achievement is attributable to teacher’s non-use of verbal reinforcement strategy. In addition,
the lecturers attitude towards poor students also will reflects to the their poor attendance to the class,
lateness to the campus, unsavory comments about student’s performance that could damage their ego,
poor method of teaching and at last it effects the student’s academic performance. The biasness of
lecturers will give negative impacts towards student’s performance. Aremu and Sokan (2003) stated
that the search for the causations of weak academic performance is unending and some of the factors
they put forward such as motivational orientation, self- esteem, emotional problems, study habits,
teacher consultation and poor interpersonal relationships. There are also several reasons against
academic performance among poorer students according Bakare (1994). The first reason is causation
resident in the child such as basic cognitive skills, physical and health factors, psycho-emotional
factors, lack of interest in school program. Second causations are the resident in the family such as
cognitive stimulation/basic nutrition during the first two years, type of discipline at home, lack of role
model and finance problem. In addition, the causation resident in the school such as school location
and physical building, interpersonal relationship among the school personnel will also affect the
students’ academic performance. At last, the causations resident in the society such as instability of
educational policy, under-funding of educational sector and leadership will gives less opportunity to
the poor students (Table 2).
The persistence of poverty existence has shift poverty dimension from single dimension
(focusing economic growth for income-generating earning opportunities to the poor) to many
dimensions (focusing on the poor specific basic needs, especially food, health care, and education)
appears in all segments in the society. This potray the lack of the economic, social and cultural means
necessary to procure the acceptable levels of living and liveliness in the society. (UNDP, 2010).
In short, poverty phenomena, from households or students perspective can be viewed from
various context and perspective:
“it is a multidimensional phenomenon that extends beyond the economic arena to
encompass factors such as the inability to participate in social and political life.”
Sen (1979; 1985; 1987)
“poverty is that characteristic of being in a state of joblessness, illiteracy, landlessness,
homelessness, lack of adequate capital, facilities and food to earn a decent living and
also powerlessness” – by Professor Dr. Muhammad Yunus, the Noble Peace Prize
winner 2006.
August (2009)
Poverty Measurement
Currently, the trend of poverty level is being sourced by the Poverty Line (PL) of each country. The PL
is supposed to determine the terms of the money income needed to avoid going hungry in principally.
But the large discrepancy between the numbers for poverty and hunger, especially between their
apparent trends raised number of fundamental concerns about the significance of the measures being
used and cited globally (UN, 2009). The measurement of absolute poverty in Malaysia is called as
Poverty Line Income (PLI). PLI is an income approach where it based on the gross monthly income
household income. According to PLI, absolute poor is where the household’s gross income below the
PLI. Furthermore, the hardcore poor are where their income is half of the PLI. The National Economic
Action Council and the Economic Planning Unit (EPU) get the poverty information from the
Household Income Survey (HIS), Household Expenditure Survey (HES) and Consumer Price Index
(CPI). Since the average cost of living and household size vary among the three major regions of
Malaysia, which are Peninsular Malaysia, Sabah and Sarawak, PLIs evaluate for each region without
separately for urban and rural areas (Japan Bank for International Cooperation, 2001).
On July 2010, the Oxford Poverty and Human Development Initiative (OPHI) introduced the
Prosiding Persidangan Kebangsaan Ekonomi Malaysia Ke VI 2011 453
Multidimensional Poverty Index, or MPI, the substitution to the Human Poverty Index in
complementing the HDI and other poverty and human development measures. MPI is the summary of
three internationally comparable surveys - the Demographic and Health Survey (DHS) for 48 countries,
the Multiple Indicators Cluster Survey (MICS) for 35 countries and the World Health Survey (WHS).
It can assist policy makers to identify the poorest households and groups, and the different deprivations
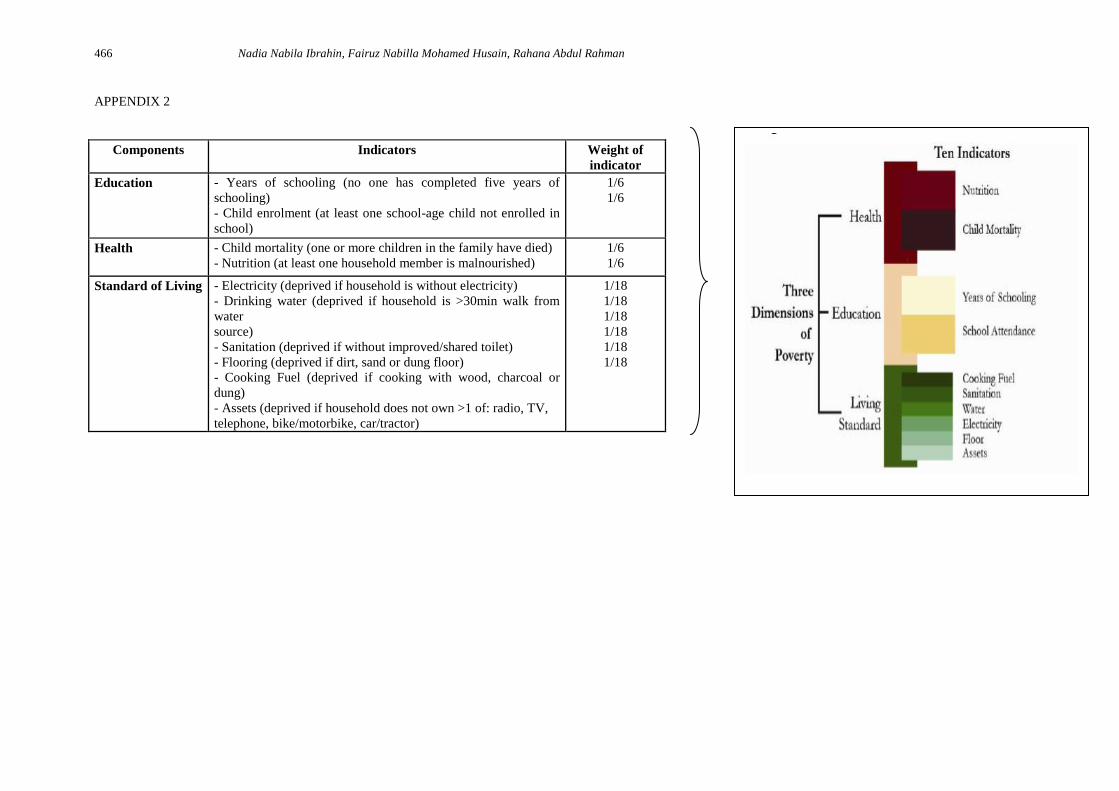
that they face. The MPI is composed of three factors and ten indicators as shown in figure 1.0 below. A
household is defined as ‘multidimensional poor’ if it is deprived in some combination equal to more
than 30 per cent of the weighted indicators, and vulnerable to becoming multidimensional poor if the
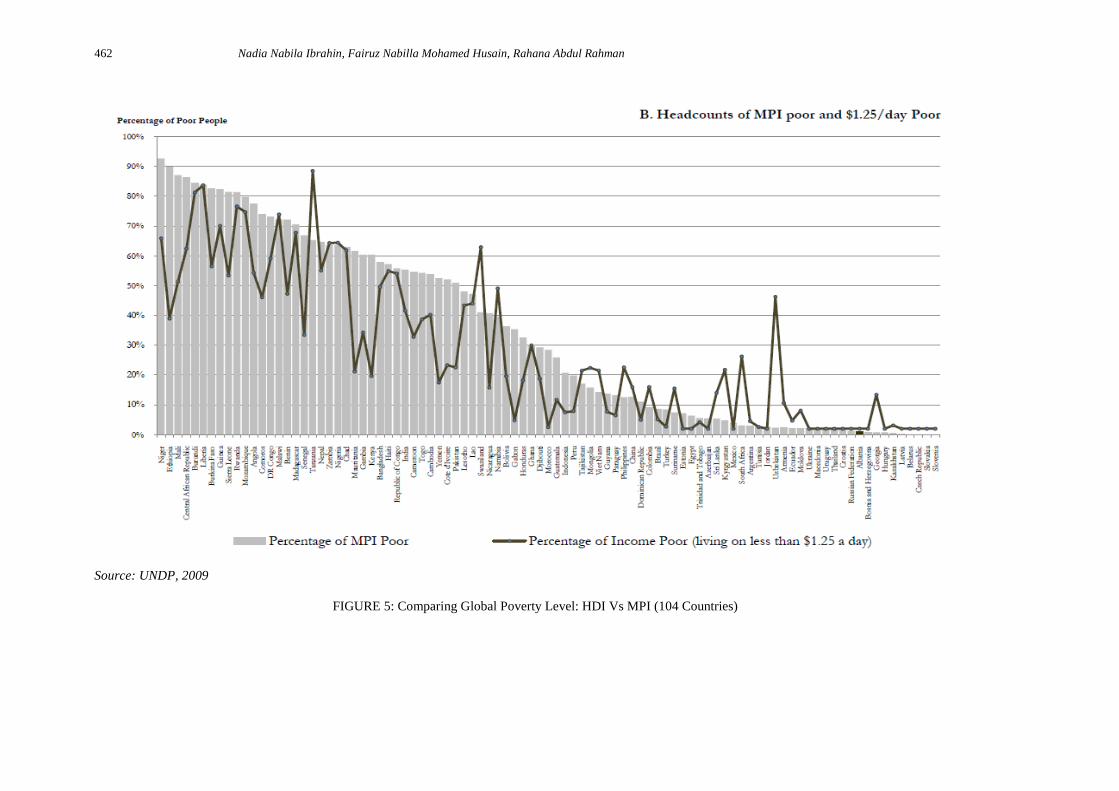
result between 20-30 per cent of the indicators (Appendix 2). A study conducted by OPHI in 2010 found that the MPI reflected deprivations in very
rudimentary services and core human functioning for people across 104 countries (Figure 5 below).
Although deeply constrained by data limitations, the MPI reveals a different pattern of poverty than
income poverty, as it illuminates a different set of deprivations. The results of MPI indicate that 1,700
million people in the world live in severe poverty, a figure that is between the $1.25/day and $2/day
poverty rates.. According to OPHI, (2010), the MPI reveals the combination of deprivations that batter
a household at the same time. A household is identified as multi dimensionally poor if, and only if, it is
deprived in some combination of indicators whose weighted sum exceeds 30per cent of deprivations.
The different between MPI and others poverty measurement is MPI is nonincome approach. Most
of the approach measures the poverty according to the household income. According to Anand and Sen
(1997), “the human development approach has long argued that although income is important, it needs
to be complemented by more direct measures”. The MPI was introduced by UNDP as the first
international measure that reflect the intensity of poverty. This is the unique approach where analyze
based on education, health and standard of living. The most UNDP HDR hope is to encourage this non-
income approach use and apply by governments, development agencies and other institutions in order
to evaluate the poverty level.
METHODOLOGY
For this purpose of study, the primary data was used in order to collect all the data and information
using questionnaire. The respondents were selected among the 200 selected poorer students in
Universiti Teknologi MARA (UiTM) students. In the questionnaire design, the questionnaire are
divided into four (4) sections which consist of section A (demographic background), section B (health),
section C (education), section D (standard of living) and section E (recommendation/ suggestion). The
questionnaire consist a total of 22 close ended questions and 2 open-questions. The questionnaires are
distributed by hand directly to the respondents. The descriptive statistics available in the Explore
function in SPSS17.0 had been used to clean the data and to examine the properties. It had been used to
determine the level of all variables. The most important tool in measuring poverty by using non-income
approach is MPI.
The MPI value is the product of two measures: the multidimensional headcount ratio and the
intensity (or breadth) of poverty. The headcount ratio, H, is the proportion of the population who are
multidimensionally poor:
H=
where q is the number of people who are multidimensionally poor and n is the total population. The
intensity of poverty, A, reflects the proportion of the weighted component indicators, d, in which, on
average, poor people are deprived. For poor households only, the deprivation scores are summed and
divided by the total number of indicators and by the total number of poor persons:
where c is the total number of weighted deprivations the poor experience and d is the total number of
component indicators considered (10 in this case). Weighted count of deprivations in household 1:
= 2.22
Headcount ratio
454 Nadia Nabila Ibrahin, Fairuz Nabilla Mohamed Husain, Rahana Abdul Rahman
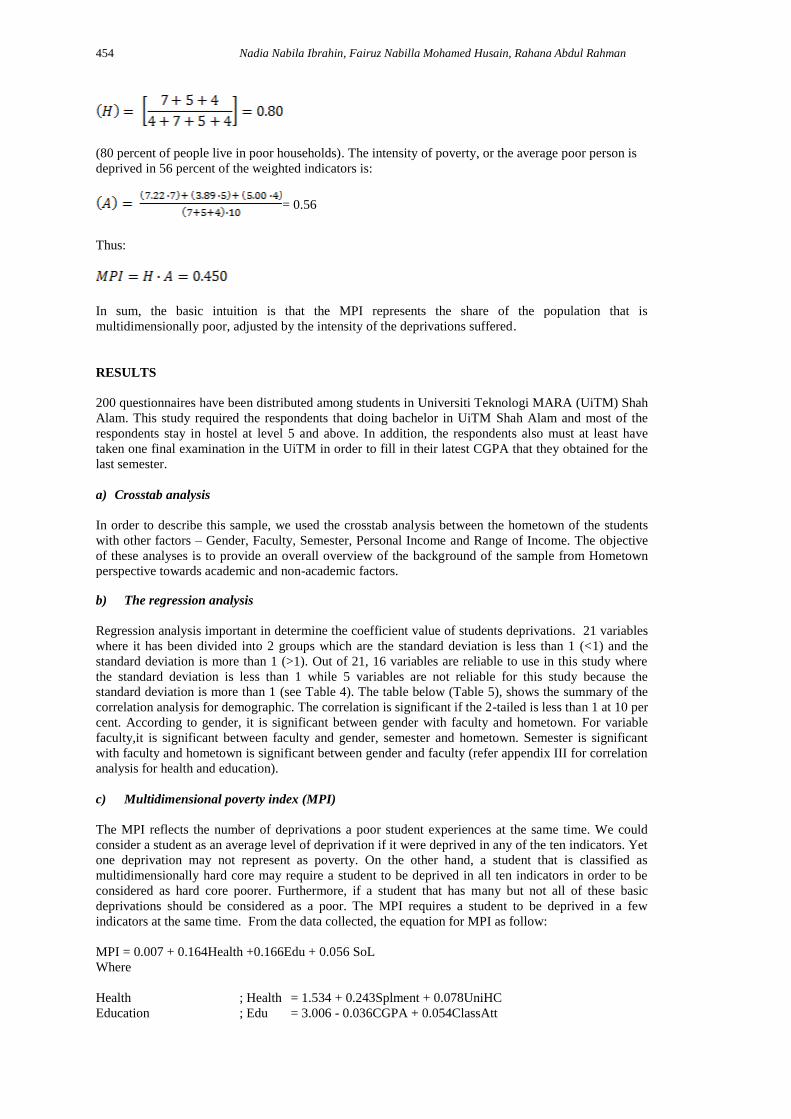
(80 percent of people live in poor households). The intensity of poverty, or the average poor person is
deprived in 56 percent of the weighted indicators is:
= 0.56
Thus:
In sum, the basic intuition is that the MPI represents the share of the population that is
multidimensionally poor, adjusted by the intensity of the deprivations suffered.
RESULTS
200 questionnaires have been distributed among students in Universiti Teknologi MARA (UiTM) Shah
Alam. This study required the respondents that doing bachelor in UiTM Shah Alam and most of the
respondents stay in hostel at level 5 and above. In addition, the respondents also must at least have
taken one final examination in the UiTM in order to fill in their latest CGPA that they obtained for the
last semester.
a) Crosstab analysis
In order to describe this sample, we used the crosstab analysis between the hometown of the students
with other factors – Gender, Faculty, Semester, Personal Income and Range of Income. The objective
of these analyses is to provide an overall overview of the background of the sample from Hometown
perspective towards academic and non-academic factors.
b) The regression analysis
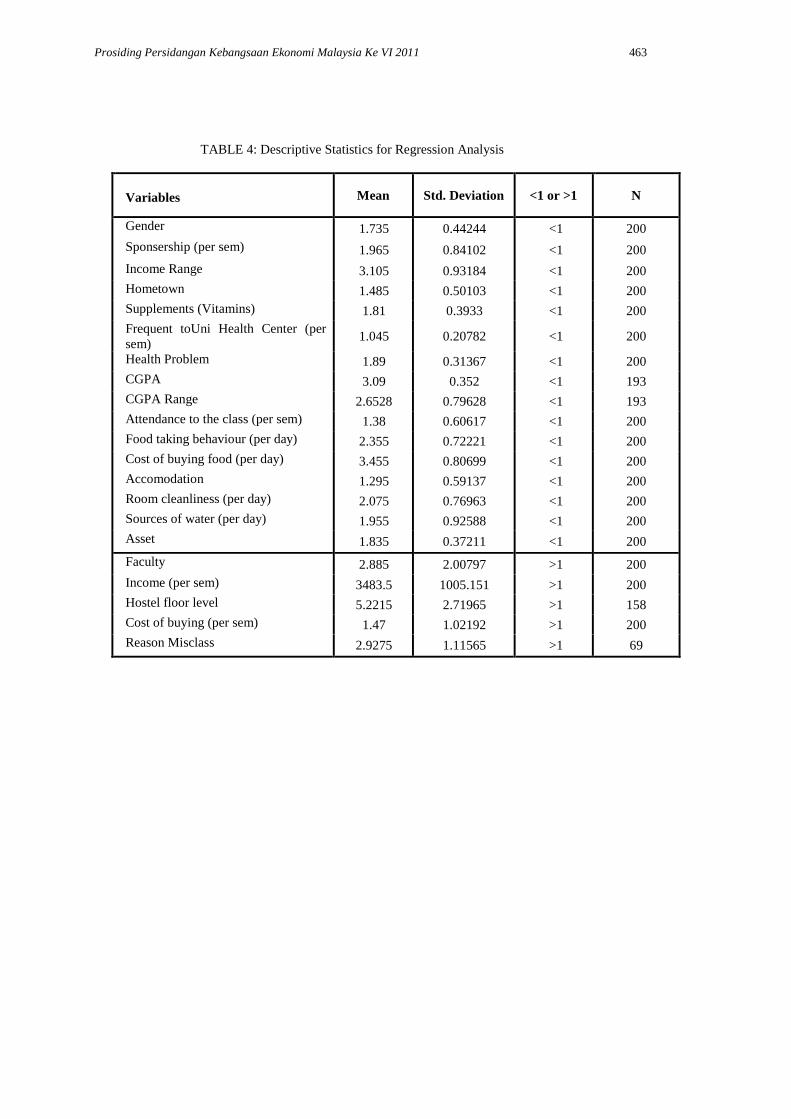
Regression analysis important in determine the coefficient value of students deprivations. 21 variables
where it has been divided into 2 groups which are the standard deviation is less than 1 (<1) and the
standard deviation is more than 1 (>1). Out of 21, 16 variables are reliable to use in this study where
the standard deviation is less than 1 while 5 variables are not reliable for this study because the
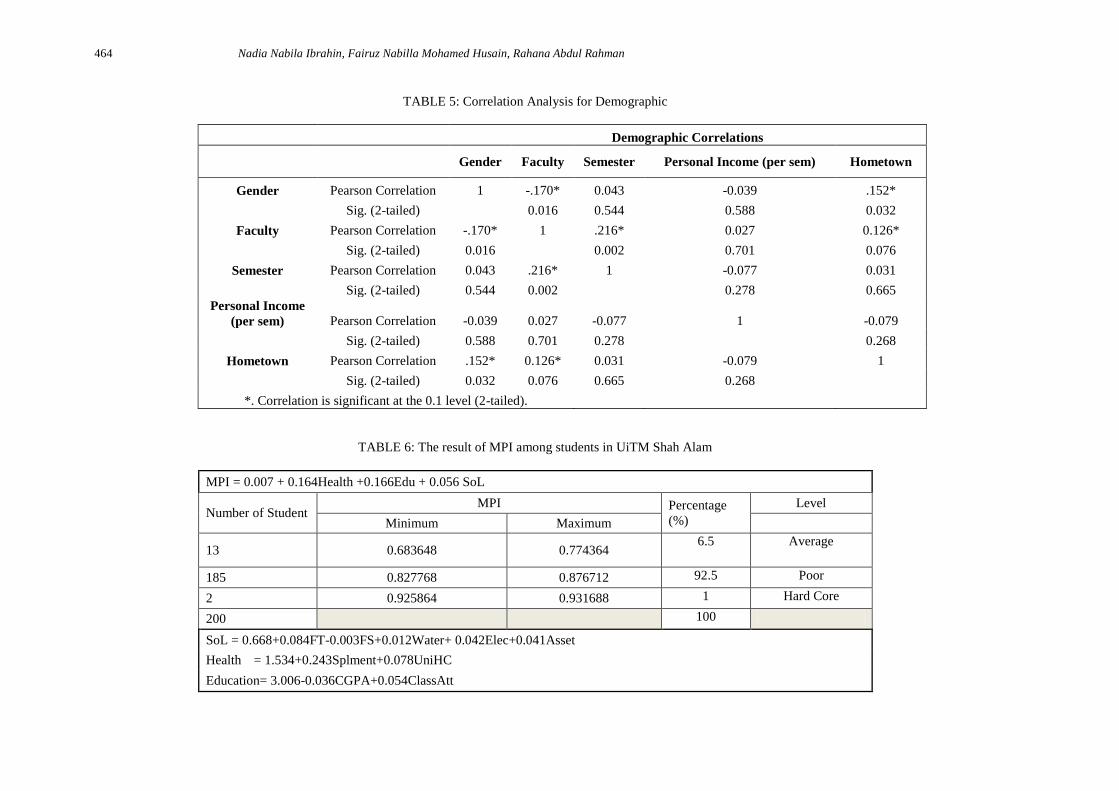
standard deviation is more than 1 (see Table 4). The table below (Table 5), shows the summary of the
correlation analysis for demographic. The correlation is significant if the 2-tailed is less than 1 at 10 per
cent. According to gender, it is significant between gender with faculty and hometown. For variable
faculty,it is significant between faculty and gender, semester and hometown. Semester is significant
with faculty and hometown is significant between gender and faculty (refer appendix III for correlation
analysis for health and education).
c) Multidimensional poverty index (MPI)
The MPI reflects the number of deprivations a poor student experiences at the same time. We could
consider a student as an average level of deprivation if it were deprived in any of the ten indicators. Yet
one deprivation may not represent as poverty. On the other hand, a student that is classified as
multidimensionally hard core may require a student to be deprived in all ten indicators in order to be
considered as hard core poorer. Furthermore, if a student that has many but not all of these basic
deprivations should be considered as a poor. The MPI requires a student to be deprived in a few
indicators at the same time. From the data collected, the equation for MPI as follow:
MPI = 0.007 + 0.164Health +0.166Edu + 0.056 SoL
Where
Health ; Health = 1.534 + 0.243Splment + 0.078UniHC
Education ; Edu = 3.006 - 0.036CGPA + 0.054ClassAtt
Prosiding Persidangan Kebangsaan Ekonomi Malaysia Ke VI 2011 455
Standard of living ; SoL = 0.668 + 0.084FT - 0.003FS + 0.012Water + 0.042Elec +
0.041Asset
Table 6 summarizes the result of MPI among students in UiTM Shah Alam. I have cut-off students
according to their MPI result where there are 3 categories. A student is multidimensionally average if
they are in between 0.6 to 0.7 weighted indicators. In addition, if they are in between 0.71 to 0.9
weighted indicators, they will be classified as multidimensionally poor. But if they are in between 0.91
to 0.99 weighted indicator, they will be classified as multidimensionally hardcore. According to the
Table 5 above, the majority students, where out of 200, 185 students (92.5 %) are classified as
multidimensionally poor, 13 students (6.5%) were in average level of poor and only 2 students (1%)
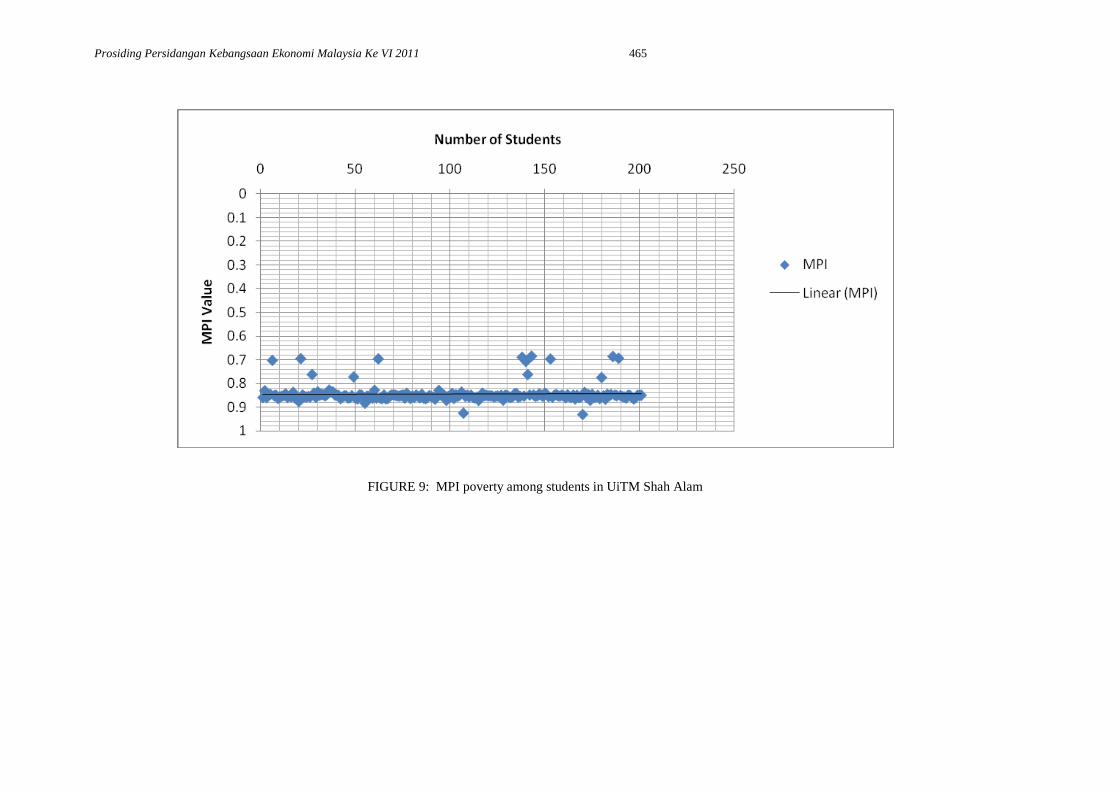
are classified as hard core level of deprivation (Figure 9).
The MPI reveals great variation in poverty among UiTM students. Most of the students were
in multidimensionally poor where their MPI values are in between 0.71 to 0.9 weighted indicators. The
composition of poverty differs among the group of multidimensionally according to the weighted
indicators. For example, different multidimensionally groups among student with similar rates of
poverty experience different deprivations. Deprivations in health problem and malnutrition (both health
indicators), deprivation in education such as attendance to the class and reason did not come to the
class and also deprivations in living standard, such as food taking and spending, accommodation,
source of water and asset will contribute to the student’s deprivation.
CONCLUSION
Reduction in poverty includes many strategies, combination that aimed not just at income
improvement, but also at non- monetary approach such as education, health and standard of living. The
aim has been to focus the discussion back squarely on the objective of poverty reduction, but within a
public economics framework in which efficiency and equity concerns are inseparable, information is
incomplete in important ways, and resources (public fund) are limited in achieving so-called ‘‘social
objectives’’ such as sufficient non- financial assistance such as text books, motivation and training
programs, tuition classes and accommodation for poor students for each university. Even if these
students are from urban area, but they still needs fund to support their life as a student since these
student can perform in their final exam (Syed Tahir and Raza Naqvi, 2006).
The multidimensional deprivations among students will open the mind and eyes of parties to
help in improving the student quality of life. Furthermore, attention and participation from various
parties will assist the students to achieve higher level performances.
REFERENCES
Alkire, S., & Santos, M. E. (2010). Acute Multidimensional Poverty:A New Index for Developing
Countries.
Alkire, S., Santos, M. E., Seth, S., & Yalonetzky, G. (2010). Is The Multidimensional Poverty Index
Robust to Different Weights? Oxford Poverty & Human Development Initiative.
Hasan, A. R., & Hashim, S. (2001). POVERTY STATISTICS IN MALAYSIA.
McKinney, S. E., Flenner, C., Frazier, W., & Abrams, L. (n.d.). Responding to the Needs of At Risk
Students in Poverty.
Sudhir, A., & Sen, A. (1997). Concepts of Human development and Poverty: A Multidimensional
Perspective.
UNDP (2010). The Real Wealth of Nations: Pathways to Human Development. United Nations
Development Programme.
Unit, E. P. (2007). Malaysia Measuring and Monitoring Poverty and Inequality. Malaysia: United
Nations Development Programme (UNDP), Malaysia.
Unit, E. P. (2004). Malaysia: 30 Years of Poverty Reduction, Growth and Racial Harmony.
Unit, E. P. (2010). MOVING TOWARDS INCLUSIVE SOCIO-ECONOMIC DEVELOPMENT
Malaysia.
Ali, N., Jusoff, K., Ali, S., Mokhtar, N., & Andin Salamat, A. S. (2009). The Factors Influencing
Students’ Performance at Universiti Teknologi MARA Kedah, Malaysia. Management
Science and Engineering .
Daud, S. Chapter Five Malaysia. United Nation.
El-Shaarawi, A., & Harb, N. (2006). Factors Affecting Students' Performance.
456 Nadia Nabila Ibrahin, Fairuz Nabilla Mohamed Husain, Rahana Abdul Rahman
Raychaudhuri, A., Debnath, M., Sen, S., & Majumder, B. G. (2010). Factors Affecting Students’
Academic Performance:A case study in Agartala Municipal Council Area. Sociology .
Renner, S., Gascho, L., & Kurukulasuriya, S. (2004). Query: Malaysia – Defining a New Poverty Line.
World Bank (2010). World Development Indicators 2010. International Bank for Reconstruction and
Development, The World Bank. Washington: The World Bank.
Ellen Aaboe and Thomas Kring (2010). The Multidimensional Poverty Index (MPI). BRIEF. Economic
and Policy Analysis Unit. Mozambique: UNDP
Erik Thorbecke (2005). Multi-dimensional Poverty: Conceptual and Measurement Issues. Paper
presented at the The Many Dimensions of Poverty International Conference, UNDP
International Poverty Centre, Brasilia, August 29-31, 2005.
Dorothée Boccanfuso, Jean Bosco Ki and Caroline Ménard (2009) Pro-Poor Growth Measurements in
a Multidimensional Model: A Comparative Approach. A Working Paper for the Groupe de
Recherche en Économie et Développement International (GÉDI).
Sami Bibi (2005). Measuring Poverty in Multidimensional Perspective: A review in literature. PMMA
Working Paper 2005-2007.
Sources: 10
th Malaysia Plan
FIGURE 1: Targets Set Within the Tenth Plan Period from Multi-dimension Perspective
Source: Hanmer et al (2000)
FIGURE 2: Dimension of Poverty and Their Interaction
Prosiding Persidangan Kebangsaan Ekonomi Malaysia Ke VI 2011 457
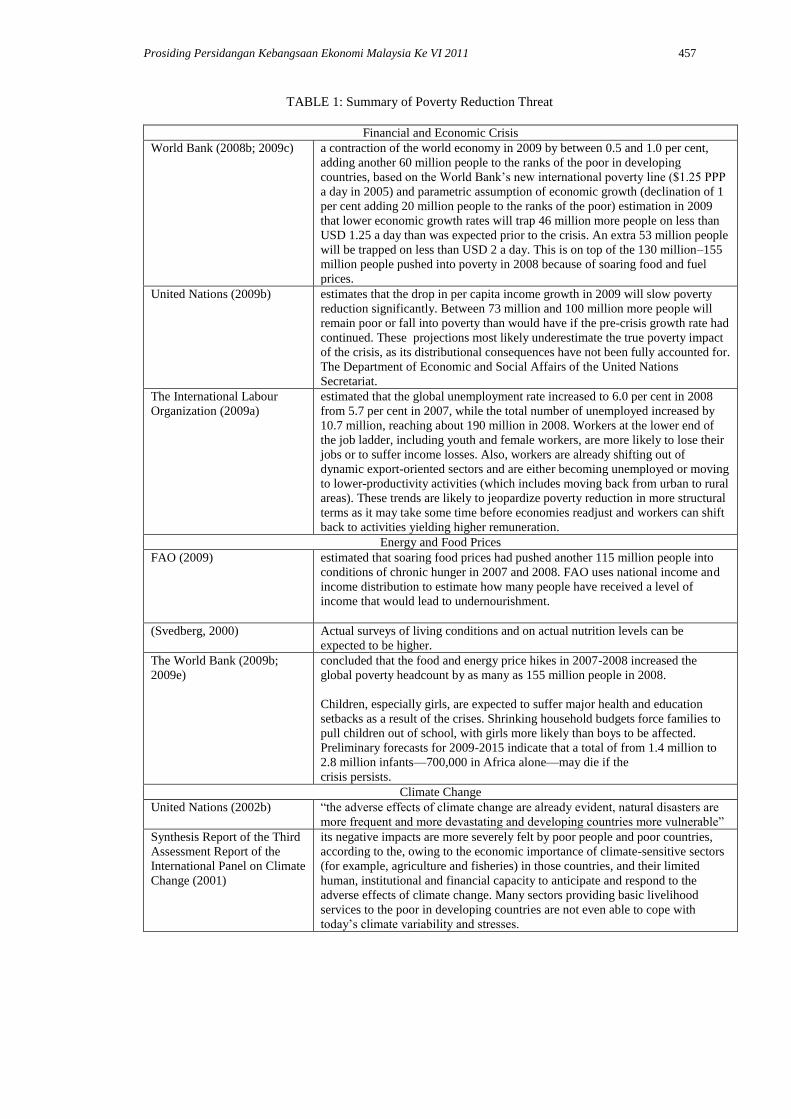
TABLE 1: Summary of Poverty Reduction Threat
Financial and Economic Crisis
World Bank (2008b; 2009c) a contraction of the world economy in 2009 by between 0.5 and 1.0 per cent,
adding another 60 million people to the ranks of the poor in developing
countries, based on the World Bank’s new international poverty line ($1.25 PPP
a day in 2005) and parametric assumption of economic growth (declination of 1
per cent adding 20 million people to the ranks of the poor) estimation in 2009
that lower economic growth rates will trap 46 million more people on less than
USD 1.25 a day than was expected prior to the crisis. An extra 53 million people
will be trapped on less than USD 2 a day. This is on top of the 130 million–155
million people pushed into poverty in 2008 because of soaring food and fuel
prices.
United Nations (2009b) estimates that the drop in per capita income growth in 2009 will slow poverty
reduction significantly. Between 73 million and 100 million more people will
remain poor or fall into poverty than would have if the pre-crisis growth rate had
continued. These projections most likely underestimate the true poverty impact
of the crisis, as its distributional consequences have not been fully accounted for.
The Department of Economic and Social Affairs of the United Nations
Secretariat.
The International Labour
Organization (2009a)
estimated that the global unemployment rate increased to 6.0 per cent in 2008
from 5.7 per cent in 2007, while the total number of unemployed increased by
10.7 million, reaching about 190 million in 2008. Workers at the lower end of
the job ladder, including youth and female workers, are more likely to lose their
jobs or to suffer income losses. Also, workers are already shifting out of
dynamic export-oriented sectors and are either becoming unemployed or moving
to lower-productivity activities (which includes moving back from urban to rural
areas). These trends are likely to jeopardize poverty reduction in more structural
terms as it may take some time before economies readjust and workers can shift
back to activities yielding higher remuneration.
Energy and Food Prices
FAO (2009) estimated that soaring food prices had pushed another 115 million people into
conditions of chronic hunger in 2007 and 2008. FAO uses national income and
income distribution to estimate how many people have received a level of
income that would lead to undernourishment.
(Svedberg, 2000) Actual surveys of living conditions and on actual nutrition levels can be
expected to be higher.
The World Bank (2009b;
2009e)
concluded that the food and energy price hikes in 2007-2008 increased the
global poverty headcount by as many as 155 million people in 2008.
Children, especially girls, are expected to suffer major health and education
setbacks as a result of the crises. Shrinking household budgets force families to
pull children out of school, with girls more likely than boys to be affected.
Preliminary forecasts for 2009-2015 indicate that a total of from 1.4 million to
2.8 million infants—700,000 in Africa alone—may die if the
crisis persists.
Climate Change
United Nations (2002b) “the adverse effects of climate change are already evident, natural disasters are
more frequent and more devastating and developing countries more vulnerable”
Synthesis Report of the Third
Assessment Report of the
International Panel on Climate
Change (2001)
its negative impacts are more severely felt by poor people and poor countries,
according to the, owing to the economic importance of climate-sensitive sectors
(for example, agriculture and fisheries) in those countries, and their limited
human, institutional and financial capacity to anticipate and respond to the
adverse effects of climate change. Many sectors providing basic livelihood
services to the poor in developing countries are not even able to cope with
today’s climate variability and stresses.
458 Nadia Nabila Ibrahin, Fairuz Nabilla Mohamed Husain, Rahana Abdul Rahman
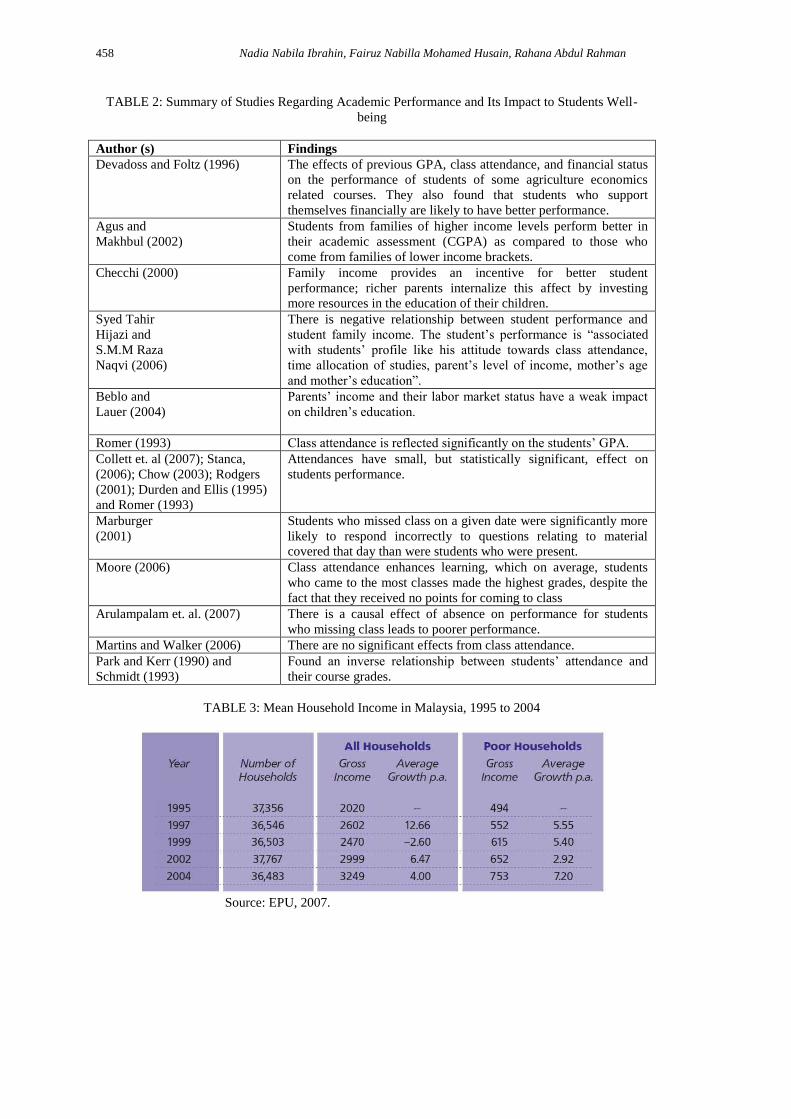
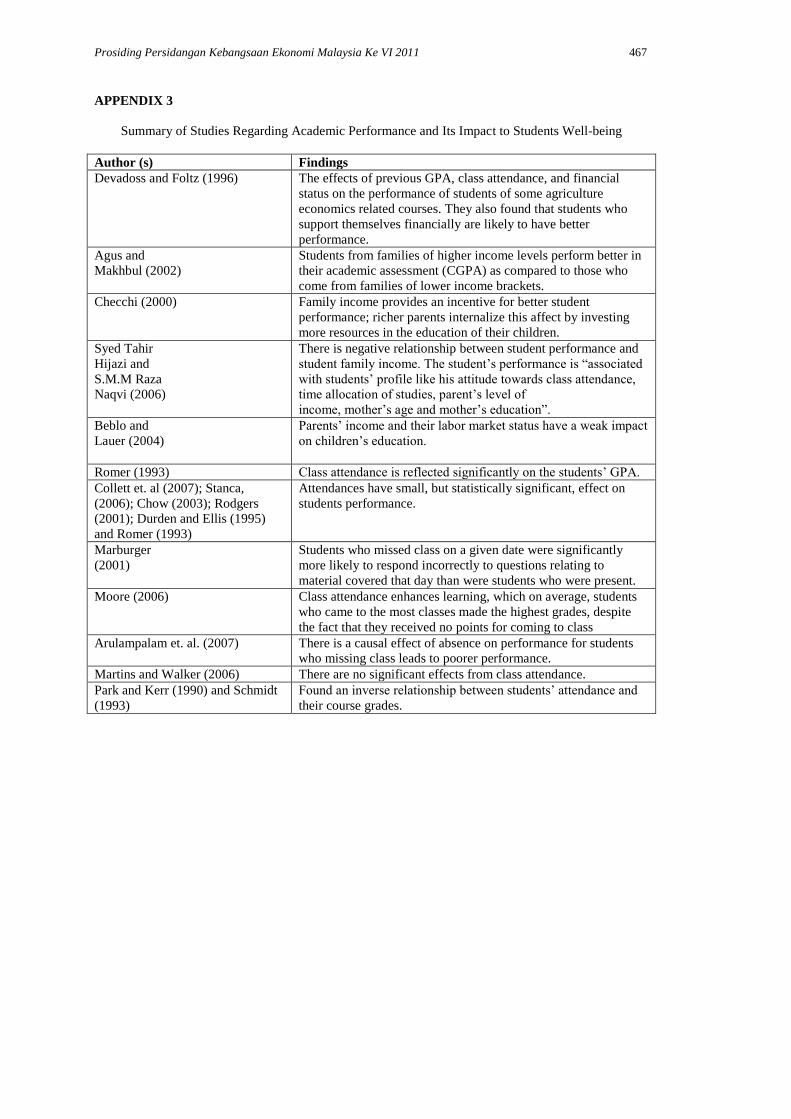
TABLE 2: Summary of Studies Regarding Academic Performance and Its Impact to Students Well-
being
Author (s) Findings
Devadoss and Foltz (1996)
The effects of previous GPA, class attendance, and financial status
on the performance of students of some agriculture economics
related courses. They also found that students who support
themselves financially are likely to have better performance.
Agus and
Makhbul (2002)
Students from families of higher income levels perform better in
their academic assessment (CGPA) as compared to those who
come from families of lower income brackets.
Checchi (2000) Family income provides an incentive for better student
performance; richer parents internalize this affect by investing
more resources in the education of their children.
Syed Tahir
Hijazi and
S.M.M Raza
Naqvi (2006)
There is negative relationship between student performance and
student family income. The student’s performance is “associated
with students’ profile like his attitude towards class attendance,
time allocation of studies, parent’s level of income, mother’s age
and mother’s education”.
Beblo and
Lauer (2004)
Parents’ income and their labor market status have a weak impact
on children’s education.
Romer (1993) Class attendance is reflected significantly on the students’ GPA.
Collett et. al (2007); Stanca,
(2006); Chow (2003); Rodgers
(2001); Durden and Ellis (1995)
and Romer (1993)
Attendances have small, but statistically significant, effect on
students performance.
Marburger
(2001)
Students who missed class on a given date were significantly more
likely to respond incorrectly to questions relating to material
covered that day than were students who were present.
Moore (2006) Class attendance enhances learning, which on average, students
who came to the most classes made the highest grades, despite the
fact that they received no points for coming to class
Arulampalam et. al. (2007) There is a causal effect of absence on performance for students
who missing class leads to poorer performance.
Martins and Walker (2006) There are no significant effects from class attendance.
Park and Kerr (1990) and
Schmidt (1993)
Found an inverse relationship between students’ attendance and
their course grades.
TABLE 3: Mean Household Income in Malaysia, 1995 to 2004
Source: EPU, 2007.
Prosiding Persidangan Kebangsaan Ekonomi Malaysia Ke VI 2011 459
Source: Chapter 4, 10th Malaysia Plan.
FIGURE 3a: Significant Progress Of Poverty Reduction Across All Ethnicities In Malaysia, 1970 To 2009
Source: Chapter 4, 10th Malaysia Plan.
FIGURE 3b: Poverty Reduction in Urban-Rural Areas in Malaysia, 1970 to 2009
460 Nadia Nabila Ibrahin, Fairuz Nabilla Mohamed Husain, Rahana Abdul Rahman
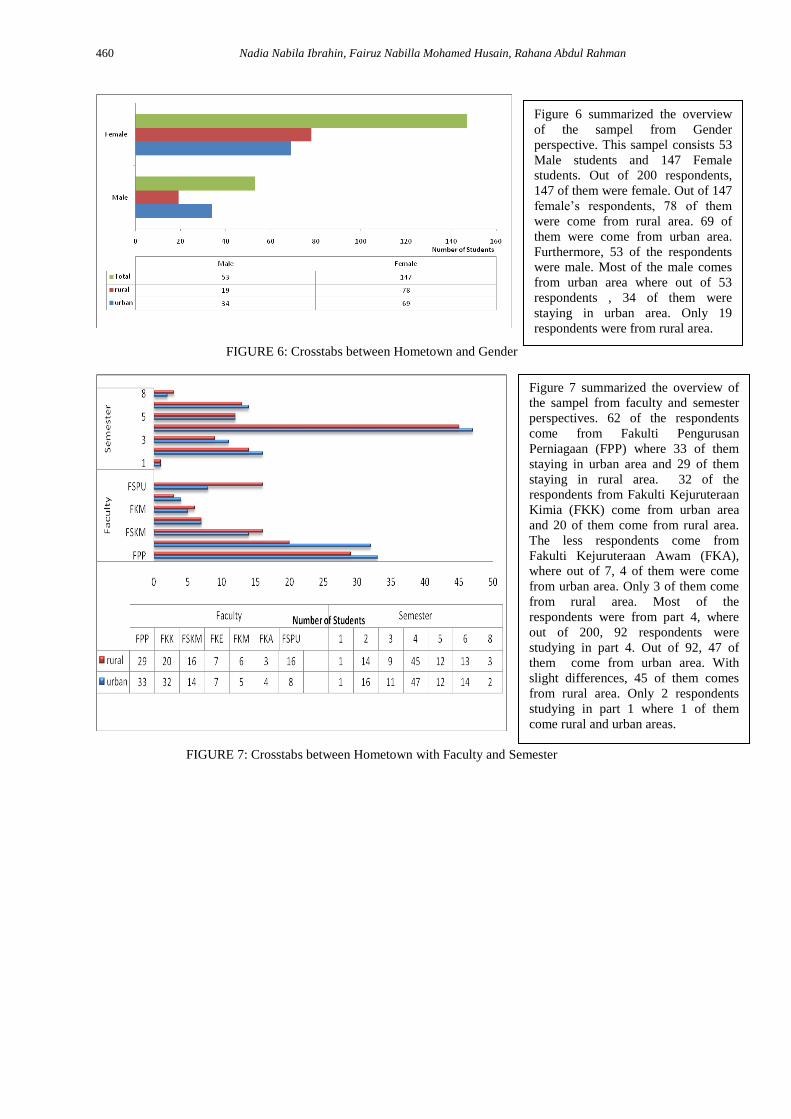
FIGURE 6: Crosstabs between Hometown and Gender
FIGURE 7: Crosstabs between Hometown with Faculty and Semester
Figure 6 summarized the overview
of the sampel from Gender
perspective. This sampel consists 53
Male students and 147 Female
students. Out of 200 respondents,
147 of them were female. Out of 147
female’s respondents, 78 of them
were come from rural area. 69 of
them were come from urban area.
Furthermore, 53 of the respondents
were male. Most of the male comes
from urban area where out of 53
respondents , 34 of them were
staying in urban area. Only 19
respondents were from rural area.
Figure 7 summarized the overview of
the sampel from faculty and semester
perspectives. 62 of the respondents
come from Fakulti Pengurusan
Perniagaan (FPP) where 33 of them
staying in urban area and 29 of them
staying in rural area. 32 of the
respondents from Fakulti Kejuruteraan
Kimia (FKK) come from urban area
and 20 of them come from rural area.
The less respondents come from
Fakulti Kejuruteraan Awam (FKA),
where out of 7, 4 of them were come
from urban area. Only 3 of them come
from rural area. Most of the
respondents were from part 4, where
out of 200, 92 respondents were
studying in part 4. Out of 92, 47 of
them come from urban area. With
slight differences, 45 of them comes
from rural area. Only 2 respondents
studying in part 1 where 1 of them
come rural and urban areas.
Prosiding Persidangan Kebangsaan Ekonomi Malaysia Ke VI 2011 461
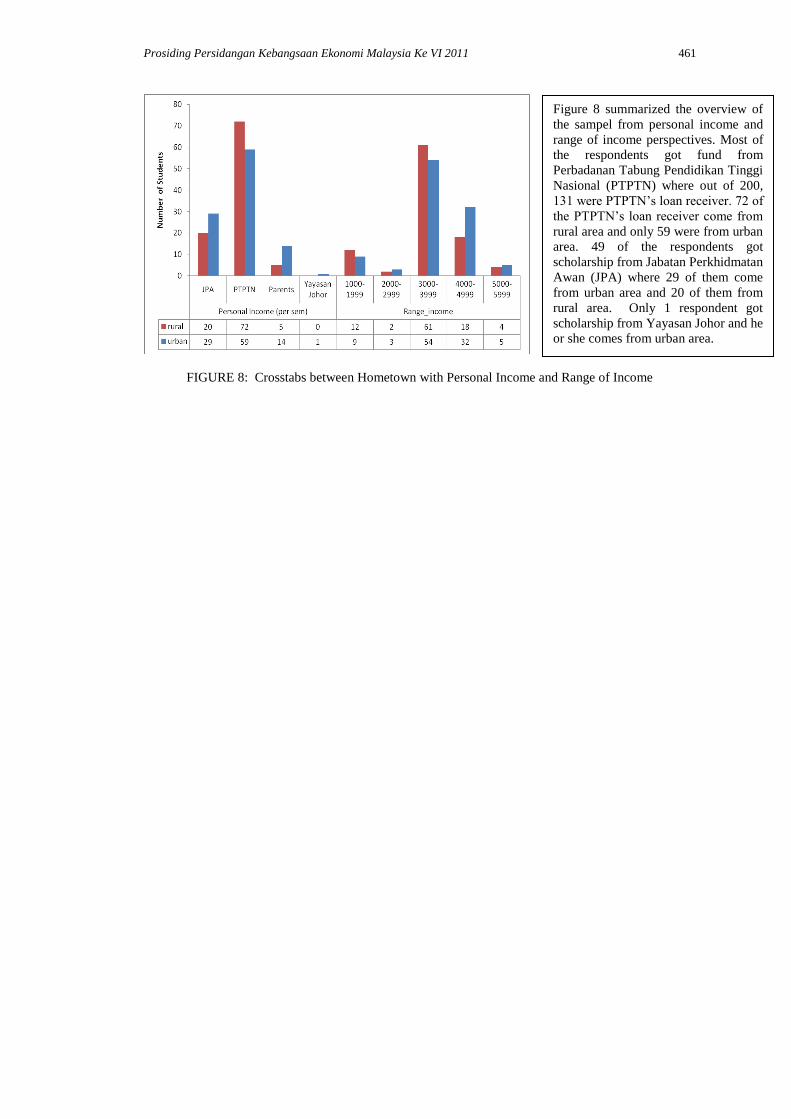
FIGURE 8: Crosstabs between Hometown with Personal Income and Range of Income
Figure 8 summarized the overview of
the sampel from personal income and
range of income perspectives. Most of
the respondents got fund from
Perbadanan Tabung Pendidikan Tinggi
Nasional (PTPTN) where out of 200,
131 were PTPTN’s loan receiver. 72 of
the PTPTN’s loan receiver come from
rural area and only 59 were from urban
area. 49 of the respondents got
scholarship from Jabatan Perkhidmatan
Awan (JPA) where 29 of them come
from urban area and 20 of them from
rural area. Only 1 respondent got
scholarship from Yayasan Johor and he
or she comes from urban area.
462 Nadia Nabila Ibrahin, Fairuz Nabilla Mohamed Husain, Rahana Abdul Rahman
Source: UNDP, 2009
FIGURE 5: Comparing Global Poverty Level: HDI Vs MPI (104 Countries)
Prosiding Persidangan Kebangsaan Ekonomi Malaysia Ke VI 2011 463
TABLE 4: Descriptive Statistics for Regression Analysis
Variables Mean Std. Deviation <1 or >1 N
Gender 1.735 0.44244 <1 200
Sponsership (per sem) 1.965 0.84102 <1 200
Income Range 3.105 0.93184 <1 200
Hometown 1.485 0.50103 <1 200
Supplements (Vitamins) 1.81 0.3933 <1 200
Frequent toUni Health Center (per
sem) 1.045 0.20782 <1 200
Health Problem 1.89 0.31367 <1 200
CGPA 3.09 0.352 <1 193
CGPA Range 2.6528 0.79628 <1 193
Attendance to the class (per sem) 1.38 0.60617 <1 200
Food taking behaviour (per day) 2.355 0.72221 <1 200
Cost of buying food (per day) 3.455 0.80699 <1 200
Accomodation 1.295 0.59137 <1 200
Room cleanliness (per day) 2.075 0.76963 <1 200
Sources of water (per day) 1.955 0.92588 <1 200
Asset 1.835 0.37211 <1 200
Faculty 2.885 2.00797 >1 200
Income (per sem) 3483.5 1005.151 >1 200
Hostel floor level 5.2215 2.71965 >1 158
Cost of buying (per sem) 1.47 1.02192 >1 200
Reason Misclass 2.9275 1.11565 >1 69
464 Nadia Nabila Ibrahin, Fairuz Nabilla Mohamed Husain, Rahana Abdul Rahman
TABLE 5: Correlation Analysis for Demographic
Demographic Correlations
Gender Faculty Semester Personal Income (per sem) Hometown
Gender Pearson Correlation 1 -.170* 0.043 -0.039 .152*
Sig. (2-tailed)
0.016 0.544 0.588 0.032
Faculty Pearson Correlation -.170* 1 .216* 0.027 0.126*
Sig. (2-tailed) 0.016
0.002 0.701 0.076
Semester Pearson Correlation 0.043 .216* 1 -0.077 0.031
Sig. (2-tailed) 0.544 0.002
0.278 0.665
Personal Income
(per sem) Pearson Correlation -0.039 0.027 -0.077 1 -0.079
Sig. (2-tailed) 0.588 0.701 0.278
0.268
Hometown Pearson Correlation .152* 0.126* 0.031 -0.079 1
Sig. (2-tailed) 0.032 0.076 0.665 0.268
*. Correlation is significant at the 0.1 level (2-tailed).
TABLE 6: The result of MPI among students in UiTM Shah Alam
MPI = 0.007 + 0.164Health +0.166Edu + 0.056 SoL
Number of Student MPI Percentage
(%)
Level
Minimum Maximum
13 0.683648 0.774364 6.5 Average
185 0.827768 0.876712 92.5 Poor
2 0.925864 0.931688 1 Hard Core
200
100
SoL = 0.668+0.084FT-0.003FS+0.012Water+ 0.042Elec+0.041Asset
Health = 1.534+0.243Splment+0.078UniHC
Education= 3.006-0.036CGPA+0.054ClassAtt
Prosiding Persidangan Kebangsaan Ekonomi Malaysia Ke VI 2011 465
FIGURE 9: MPI poverty among students in UiTM Shah Alam
466 Nadia Nabila Ibrahin, Fairuz Nabilla Mohamed Husain, Rahana Abdul Rahman
APPENDIX 2
Components Indicators Weight of
indicator
Education - Years of schooling (no one has completed five years of
schooling)
- Child enrolment (at least one school-age child not enrolled in
school)
1/6
1/6
Health - Child mortality (one or more children in the family have died)
- Nutrition (at least one household member is malnourished)
1/6
1/6
Standard of Living - Electricity (deprived if household is without electricity)
- Drinking water (deprived if household is >30min walk from
water
source)
- Sanitation (deprived if without improved/shared toilet)
- Flooring (deprived if dirt, sand or dung floor)
- Cooking Fuel (deprived if cooking with wood, charcoal or
dung)
- Assets (deprived if household does not own >1 of: radio, TV,
telephone, bike/motorbike, car/tractor)
1/18
1/18
1/18
1/18
1/18
1/18
Prosiding Persidangan Kebangsaan Ekonomi Malaysia Ke VI 2011 467
APPENDIX 3
Summary of Studies Regarding Academic Performance and Its Impact to Students Well-being
Author (s) Findings
Devadoss and Foltz (1996)
The effects of previous GPA, class attendance, and financial
status on the performance of students of some agriculture
economics related courses. They also found that students who
support themselves financially are likely to have better
performance.
Agus and
Makhbul (2002)
Students from families of higher income levels perform better in
their academic assessment (CGPA) as compared to those who
come from families of lower income brackets.
Checchi (2000) Family income provides an incentive for better student
performance; richer parents internalize this affect by investing
more resources in the education of their children.
Syed Tahir
Hijazi and
S.M.M Raza
Naqvi (2006)
There is negative relationship between student performance and
student family income. The student’s performance is “associated
with students’ profile like his attitude towards class attendance,
time allocation of studies, parent’s level of
income, mother’s age and mother’s education”.
Beblo and
Lauer (2004)
Parents’ income and their labor market status have a weak impact
on children’s education.
Romer (1993) Class attendance is reflected significantly on the students’ GPA.
Collett et. al (2007); Stanca,
(2006); Chow (2003); Rodgers
(2001); Durden and Ellis (1995)
and Romer (1993)
Attendances have small, but statistically significant, effect on
students performance.
Marburger
(2001)
Students who missed class on a given date were significantly
more likely to respond incorrectly to questions relating to
material covered that day than were students who were present.
Moore (2006) Class attendance enhances learning, which on average, students
who came to the most classes made the highest grades, despite
the fact that they received no points for coming to class
Arulampalam et. al. (2007) There is a causal effect of absence on performance for students
who missing class leads to poorer performance.
Martins and Walker (2006) There are no significant effects from class attendance.
Park and Kerr (1990) and Schmidt
(1993)
Found an inverse relationship between students’ attendance and
their course grades.
Related Documents