Santa Clara University Scholar Commons Economics Leavey School of Business 1977 e multi-output translog production cost function: the case of law enforcement agencies John Heineke Santa Clara University, [email protected] M. N. Darrough Follow this and additional works at: hp://scholarcommons.scu.edu/econ Part of the Economics Commons is Article is brought to you for free and open access by the Leavey School of Business at Scholar Commons. It has been accepted for inclusion in Economics by an authorized administrator of Scholar Commons. For more information, please contact [email protected]. Recommended Citation Heineke, John, and M. N. Darrough. "e Multi-output Translog Production Cost Function: e Case of Law Enforcement Agencies." Santa Clara Business Review 8.1 (1977): 32-48.

Welcome message from author
This document is posted to help you gain knowledge. Please leave a comment to let me know what you think about it! Share it to your friends and learn new things together.
Transcript

Santa Clara UniversityScholar Commons
Economics Leavey School of Business
1977
The multi-output translog production costfunction: the case of law enforcement agenciesJohn HeinekeSanta Clara University, [email protected]
M. N. Darrough
Follow this and additional works at: http://scholarcommons.scu.edu/econ
Part of the Economics Commons
This Article is brought to you for free and open access by the Leavey School of Business at Scholar Commons. It has been accepted for inclusion inEconomics by an authorized administrator of Scholar Commons. For more information, please contact [email protected].
Recommended CitationHeineke, John, and M. N. Darrough. "The Multi-output Translog Production Cost Function: The Case of Law Enforcement Agencies."Santa Clara Business Review 8.1 (1977): 32-48.
Santa Clara Business R eview
THE MULTI-OUTPUT TRANSLOG PRODUCTION COST FUNCTION:
THE CASE OF LAW ENFORCEMENT AGENCIES
M N. Darrough and J. M. Heineke*
In this paper we study the relationship between costs, input prices and activity levels in a sample of approximately thirty medium sized city police departments for the years 1968, 69, 71 and 73. Our interest lies in determining the functional structure of law enforcement production technology .
Since efficient allocation o f resources to activities requires knowledge of relative incremental costs for the activities involved, we are particularly interested in determining marginal cost functions for, and rates of transformation between the various outputs. Since past studies have adopted func tional specifications which have implicitly maintained strong hypotheses about the underlying technology, we adopt a quite general functional specification which permits testing the appropriateness of these hypotheses. In a more general context we model and estimate the structu re of production for a multiple o utput-multiple input firm in a manner which places few restrictions on first and second order parameters of the underlying structure.
INTRODUCTION
One question which arises immediately in any discussion of cost or production functions associated wi th law enforcement agencies concerns the appropriate measure of "output." Clearly police departments produce multiple o utputs (services) for a community, ranging fro m directing traffic, quieting family squabbles, and providing emergency first aid, to pre-
*Professor Reineke's participation in this study was supported by U.S. Department of Justice Grant # 75-Nl-99-01 23 to the Hoover Institut ion at Stanford University. We have benefited from discussions with M. K . Block, L. J. Lau and F. C. Nold.
venting crimes and solving existing crimes. In this study we view police output as being of essentially two types: (1) general service activities as epitomized by the traffic control and emergency first aid care functions of police departments; and (2) activities directed to solving existing crimes. Strictly speaking, "solving existing crimes" is an intermediate output with deterrence or prevention of criminal activity being the final product. But due to the difficulty of measuring crime prevention we use the number of "solutions" by type of crime as output measures. I
In the past few years a number of authors have, to one degree or another, addressed the problem of determining the structure of production in law enforcement agencies. Since under certain rather mild regularity conditions there exists a duality between cost and production functions, either the cost function or the production function may be used to character· ize the technological structure of a firm. The studies of Chap· man,Hirsch and Sonenblum (1975), Ehrlich (1973, 1975) , and Wilson and Boland (1977) all proceed by estimating production functions while Popp and Sebold (1972) and Walzer (1972) estimate cost functions. It is of some interest to briefly review the findings of these authors.
Chapman, Hirsch and Sonenblum estimate a rather traditional production function, at least from a theoretical point of view. All police outputs are collapsed in to one aggregate, which is then regressed on input use levels utilizing data from the city of Los Angeles for the years 1956-70. They find strongly increasing returns to scale-often a two to four percent output response to a one percent change in input usage.
I see Chapman, Hirsch and Sonenblum ( 1975) fo r an attempt to measure cr ime preven tion as an o utput of po lice agencies.
Dr. Reineke (Ph .D., University of Iowa) is Professor of Economics at the Unjversity of Santa Clara. His publications have appeared in the American Economic R eview, the Journal of Political Economy, the R eview of Econon~ic Studies, the R eview of E co nom ics a lid Statistics, the Santa Clara Business R eview, and numerous other journals.
Dr. Darrough (Ph.D. , University of British Columbia) is an Assistant Professor of Economics at the University o f Santa Clara. She has published papers in the International Economic Review and the Canadian Journal of Economics.
32
The Multi-Output Translog Production Cost Function: The Case of Law Enforcement Agencies - Darrough and Heineke
Ehrlich also uses an aggregate solution rate as the output measure, but ins tead of employing trad itional input measures he regresses the aggregate solution rate on per capita expenditures on police, the aggregate offense rate and a series o f exogenous ("environmen tal") variables. The expenditure variable is, of course, an index of overall input use levels while the aggregate offense ra te is included to measure the effects of "crowding" or capacity constrain ts on ou tput. This is a substantial depar ture fro m a neoclassical approach in wh ich the shape of the production funct ion itself will reflect diminishing returns as capacity is pressed. But it is a specification that has been widely adopted by th ose who have followed Ehrlich. (For example, see Vandaele (1975) or Voley and Phillips (1972). Using per capita expenditures to measure the scale of output, Ehrlich finds that a one percent increase in expenditures per cap ita leads to much less than a one percent increase
in the solution rate. Votey and Phillips estimate production functions which
link solution rates for the properly crimes of auto theft, burglary, larceny and robbery to input usage. As with Ehrlich and Vandaele, the authors include the level of offenses as an argument in the production function along with more traditional input measures.
The Wilson a nd Bo land study is similar to the work of Votey and Phil lips in that they study the production of solutions to several properly cr imes. But instead of input levels as determinants of solutions, they utilize the ever present "capacity" variable and variab les meant to account for productivity differences between departments. Here as with Vandaele and Votey and Philips, the authors cannot address the question of scale economies due to the fac t that only a subset of all outputs are includ ed in these studies,
Finally, both Po pp and Sebold, and Walzer estimate cost fun ctions and attempt to measure sca le economies. The former use population size in the pol ice jurisdiction as their measure of " scale" along with a large number of demographic and e nvironmental variables to estimate the per capita costs of po lice service. Given the appropria teness of these variables for explaining costs, the authors find diseconomies of scale throughout the en tire range of population sizes. Of course the population variable provides a considerably different concept of scale than economists are accustomed to considering, an d in fact , Walzer has argued that population size is a poor measure of scale for several reasons-the most important being a te ndency on the part of police administrators to determine manpower needs as a proportion of population size. In such a case there is obviously a strong bias toward constant re turns to scale. In his study Walzer recognizes that offenses cleared, accidents investigated, etc., all make up the outpu t of a police department. But instead of estimating a multiple output cost function, he creates an "index of police service" by collapsing all outputs into one.2 Once again the estima ted cost func tion contains a capacity measure (the offense rate), in add it ion to measure of input prices, input usage and several variables meant to pick up externally determined differences in productivity .
2The weights used are average times spent on each type of act ivit y.
-33
Using the service index to measure output Walzer finds evidence of economies of scale , although they seem to be rather sligh t. Interes tingly enough he also finds that input costs are not significantly related to overall production costs.
OUTLINE OF THE PAPER
A number of strong hypotheses concerning U1e production structure of law enforcement agencies have been implicitly maintained in the studies we have ske tched. First, the arguments entering cost and production functions have for the most part differed considerably from what one would expect from classical production theory. In addit ion, in the one case where input costs do enter the cost function (Walzer), linear homogeneity in input costs has not been imposed on the estimated cos t function . One possible explanation for these deviations from classical production and cost specifications is U1at classical theory , and cost minimizing behavior in particular, is not capable of explaining observed choices in public agencies. While tllis is a plausib le hy pothesis, it should be tested rather than maintained)
Second, each of the estimated production fun ctio n s upon which we have reported is either linear or linear logarithmic. Such functions may be viewed as first order approximations to an arbitrary production function. It is well known tha t fi rst order approximations severely restrict admissable patterns of substitution among inputs and admissable rates of transformation among o utputs as well as having other undesirable empirical implications.4 An addition al problem with linear logarithmic production or cost functions arises if one is interested in determining the extent of scale econo mies, since these functions do not permit scale economies to vary with output. On a related point, we noted above that each of the production studies su rveyed included a " capacity" measure as an argument. A possible explanation for this inclusion might be based upon the restrictiveness of the chosen functional forms and a consequent attempt on the part of the au thors to provide output responses wllich do vary with the scale of operation, in functions which do not naturally possess th is property. For these reasons and o thers we adopt a second order approximation to the underly ing cost and production structure thereby leaving the various elasticity measures of common interest free to be dete rmined by t he data.S
Third , since the Chapman, Hirsch and Sonenblum, Walzer and Ehrlich studies all utilize single output aggregates they implicitly maintain the existence of an ind ex over all police outputs which allows outputs to be consistently aggregated into a single measure. l n what follows we estimate a multiple output cost function and test whe ther the various subsets of outputs may be consistently aggregated into single ca tegories.
3Th is hypothesis is ex plicit in Wilson and B<:>land , p. 8, who s tate, " In our view, police departments do not behave in accordance w ith the e co nomic mod el of the firm. " 4For exa mple, lin ear logarithmic production functions imply input ex· pend iture shares which are independent o f the level of ex penditure, while linear production fu nctions imp ly perfect in put substitutabilit y and con · sequcntly ru le out internal solutions to the cost minimizatio n prob lem. S(n th e Popp and Sebold , and Walzer st ud ies the production cost func tion is specified to be q uadratic in the scale argument alt hough all o ther second order parameters are restricted to be zero.
Santa Clara Business Review
Fourth, the Wilson and Bolan d, Votey and Phillips and Vandaele studies each implicitly maintain the hypothesis of nonjoint outputs by estimating separate production functions for different types of solutions. Again, instead of maintaining this hypothesis we estimate a multiple output function and then test the nonjointness hypothesis.
To summarize, in this study we characterize the structure of production in a combined cross section and time series analysis of U.S. police departments in a sufficiently general manner to permit testing of each of the major maintained hypotheses in past studies. This amounts, primarily, to testing for existence of consistent aggregate indices of police output, for nonjointness of output, and for consistency of our estimated equations with the optimizing behavior of classical theory. In addition, we calculate (1) marginal cost functi.ons for solutions to the property crimes of burglary, robbery, larceny and motor vehicle theft, and for solutions to crimes against the person; (2) marginal rates of transformation between these activities; and (3) an estimate of scale economies based upon the response of total cost to a simultaneous variation in all police outputs. In the next two sections we provide definitions, theorems and the conceptual structure which underpin the parameter estimation and testing which follow.
THEORETICAL BACKGROUND
The following definitions and theorems provide precise meaning to many of the concepts discussed above and the basis for testing the maintained hypotheses of earlier studies.
Let F (y, v) = 0 represent the production possibility front ier, where y is an n vector of outputs and v is an m vector of inputs, and C (y, w) the associated production cost function, where w is an m vector of input prices.
T11eorem 1: C (y, w) =min wTv veL (y)
where L (y) = { v IF (y, v) ~ 0 } is the input requirement set and T denotes transposition. The function C (y, w) is unique and is a positive linear homogeneous, differentiable and nonincreasing function of input prices, w. (See Uzawa (1964) or Shephard (J 970).)
Wedenote thesetsofn outputs and m inputs as N= {1, 2, 3, ... , n} and M = { I , 2, . . . , m} and partition these sets into p and o mutually exclusive and exhaustive subsets, respectively, N = {N 1, N2, ... , Np } and M = { M1, M2, ... , M
0.}The elements of
Ni are denoted Yi, the elements of~· Vj .
Definition 1: lf marginal rates of transformation between any two outputs from the subset Nk are independent of all other out-
puts, not in Nk then the production function is separable (weak
ly) with respect to the partition { Nk, N2, \LQ * k}. A similar de
finition holds for input partitions. Formally, the production func
tion F (y, v) = 0 is output separable with respect to the partition
34
and is input separable with respect to the partition { M , M Vs r s• * r} iff
Theorem 2: Separability with respect to the output partition { N1, N2, .. . , Np} and the input partition { M 1, M2, . .. , M
0} is
necessary and sufficient for the production function to be writ
ten asF(y, v)= F* (h 1 (Y 1), ... , hp (YP)' gl (V 1 ) , ... , g0
(V 0
))
where hi and gj are called category functions and are functions of
the elements ofNi and Mj only .(See Goldman and Uzawa (1964).)
Definition 2: A technology with production function F (y, v) is
nonjoint if there exists functions f1 (v), f2 (v), .. . , fn(v) with
the property that fi (v) is independent ofyj, i * j .
So to show that a technology is nonjoint, the functions fi 0 must exist and be free of any economies or diseconomies of joint
ness. As Hall (1973) has pointed out, this does not require
physically separate processes producing the various outputs, nor
does the fact that two or more outputs are produced in the same
plant rule out nonjointness.
Theorem 3: A technology is nonjoint iff the joint cost function
can be written as C (y, w) = c1 (y 1, w) + c2 (y2, w) + ... +C11
(y11' w). (See Hall (1973).)
Definition 3: Aggregation is said to be consistent if the solutions
to a problem at hand are identical regardless of whether one uses
aggregate indices or the micro level variables.
Definition 4: If a function is separable and each of the category functions is homothetic, the function is said to be homothetically separable.
Theorem 4: Homothetic separability is sufficient for consistent aggregation.lf a function is separable, homo the tic separability is necessary for consistent aggregation. (See Blackerby, Primont & Russell (1977).)
MOTIVATION OF AGENCIES
We next present two alternative models of the decision process oflawenforcement agencies. One model focuses on input decis· ions, the other on output decisions. It should be kept in mind that the model chosen to represent agency behavior will likely have a major influence on the va lues of estimated parameters. Hence one should consider the alternative specifications with one eye on stat istical tractability and data limitations, and the other on the "realism" of the implied decision process.

> T11e Multi-Ou tput Translog Production Cost Function: The Case of Law Enforcement A gencies - DarrouJ.;h and Heineke
Cost Minimization-The formal structure provided by the cost minimization behavioral hypothesis can be imposed on the estimation process in several ways. To begin , we generalize the
traditional cost minimization paradigm to include the multiple output firm. ln particular, we assume that law enforcement a encies are given a vector of outputs which is minimally a~ceptable to the community and are instructed to provide at least that level of service at minimum cost. 6 Formally the
agency's problem is to
(s.t.) F(y0,v)=O
where yO is the minimally acceptable output vector. Optimization problem (3) provides the system
(4) = 0,
i, j = 1, 2, ... , m, i =F j
of m+ 1 equations which may be used in estimating F. If equations (4) are assumed to be associated with a well behaved minimum, we know that a solution for vas a function of wand yO exists. In addition, as long as input prices are exogenously determined as far as an individual agency is concerned, the solution yields the n endogenous factor demand as functions of strictly exogenous variables. Because factor demands are simultaneously determined, disturbances, given by the stochastic specification into which the model must event ually be imbedded, will be correlated across equations. As a consequence, it will usually be necessmy to treat the solution to (4) as a system for purposes of parameter estimation, if efficiency is a cri terion.
Two other points concerning the system implied by equations ( 4) are of interest: First, if ( 4) can be solved for the V· as functions of w and yO, these functions may well be non-' linear in the parameters. This need not be a major obstacle ,
but for large systems nonlinear estimation is expensive and one is never sure of estimability (convergence). Secondly, and more important, is the fact that although we know a solution to ( 4) exists in principle, this is cold comfort to the econometrician charged with estimating F(-). Since for even modestly general functional specifications for F(·), it will generaiJy be impossible to express the vi as explicit functions of wand yO.
An alternative to the approach we have just described for estimating the production structure is to focus on the cost function rather than the production function. Due to the duality between cost and production functions, once one function is given the other is uniquely determined) So it matters not a whit which fu nction is estimated, and the choice of estimating the cost function or the production function should be made on purely statistical grounds.
6In a democratic society , voter s through their elected representatives provide this info rmation. 7See Diewert (1 974).
35
One way of proceeding to estimate the production cost function would be to use OLS to directly estimate C (y, w). Since both w and y are exogenous in the present framework, OLS is an appropriate procedure. In con trast to the system we have just discussed this is a welcome respite. But a caveat must be added: lf C (y, w) is estimated via OLS then one ends up not exploiting the information available in the maintained hypothesis or cost minimization , which might have been used to add precision to parameter eslimates.8 Furthermore, unless there is significant variation in y and w across the sample, multicollinearity could be a problem. (One might expect this problem to crop up especially with input prices.) An additional advantage of imposing the structure implied by cost minimization is that the resulting restrictions across parameters will help circumvent multicollinearity problems which may be present.
The economical way to add the structure implied by cost minimization is to call upon Shephards' Lemma (1953) which gives cost minimizing factor demands as a function o f the partial derivatives of the cost function with respect to input prices:
(5) v. = ac;aw. 1 1
i = 1, 2, ... , m.
ln general, estimation of (5) will no t be sufficient to determine all of the parameters of the production cost function.9 This can be remedied merely by including CO as an equation in the system to be estin1ated . ln which case
(6) v. = ac;aw. 1 I '
i = 1, 2, .. . , m
C = C (y, w).
lt is important to keep in mind that a maintained hypothesis of this section has been that law enforcement agencies are assigned minimal output requirements and that input prices are exogenous as far as any single agency is concerned. As wi th the dual system (4) above, right hand variables in system (6) will be uncorrelated with stochas tic disturban ces in the econometric version of (6). Hence estimation of equations (6) will most assuredly identify the parameters of the cost function . But since the V· are simultaneously de termined, disturbances
I will be correlated across equations as before, necessitating estimating (6) as a simultaneous system if efficient estimates are desired.
An additional advatnage of estimating (6) instead of (4) stems from the fact that equations (6) will be lineaJ in the parameters for any polynomial approximation to an arbitrary cost function.
Value Maximization-In this section we.provide an alternative framework within which the structure of law enforcement production technology could be estimated . The model is essen-
Bof cou rse this information was present in system (4) above.
9For example if C (Y, w) is a polynomial in y and w, parameters associated with terms in elements of y alone will be missing from equation (5).

Santa Clara Business Review
ially a value maximization model and of course still implies that input decisions are reached in a cost minimizing manner. The value maximization model has the advantage of not requiring that police decision makers take the community's final output vector as a datum. Indeed the focus of the model shifts from determination of optimal input usage given an output vector, to determination of the optimal mix of outputs.
Using Pi to represent the value to the community of a solution to a crime of type i, P = (P1, P2, . .. , P
11) , the
police agency's decision problem is
(7) max pTy - C (y, w) · y
Decision problem (7) provides the familiar system
i =I , 2, ... , n
which may be used to estimate C (y, w). As was the case with equations (5) above, if C (y, w) is approximated with a polynomial in y and w, equations (8) alone will not be sufficient to determine the cost function. This can be remedied by including C (y, w) itself in the system to be estimated. In which case
(9) Pi - actoyi = o,
C - C(y,w) = 0
i = 1, 2, ... , n
is the system of interest. Assuming that the values P and input costs are exogenously determined, equations (9) determine the n endogenous solution levels as functions of P and w.l 0
One problem in implementing this system is an econometric context is obvious: The values to a community of the various types of solution are at best difficult to obtain. In the case of property crimes one might consider using average values stolen for each of the several types of property crimes to approximate the loss to society. Although this measure is far from perfect, it does provide a means for studying the mix of property crime solutions and is used in tllis capacity below.l1 But for the case of "crimes against lhe person," e.g., homicide, rape and assault, such a convenient proxy is not available.
To circumvent this problem we assume that there exists functions C* and f such that the cost function can be written as
(10) C = C* (f (y1, ... , Yp' w), Yp+l• ... , Yn, w)
where y 1, ... , Yp represent solutions to crimes against property
and Yp+ 1, ... , y n represent solutions to crimes against lhe
person and the service activities performed by police. That is, we assume that solutions to crimes against property are func-
1 Oro genera l, the e lements of P are at least partially determined by the output mix chose n by police decision makers, e .g., increased solu tions for crime i will, ceteris paribus, lower ex peeled returns to crime and he nce Pi.
1 I Average values sto len are an approximat ion to the direct financial loss suffered by society, on average, from an offense of type i. To the ex tent that so lving crimes has a deterrent effect , this measure will underestimate the value of a solution to offense i by the value of illega l transfers deterred per so lution.
36
tionally separable from all other police activities. As we indi. cated above, (Theorem 2) this is equivalent to requiring that marginal rates of transformation between solutions to all pairs of property crimes be invariant to the level of nonproperty crime solutions and to the level of other services provided, e.g., traffic control, emergency first aid, etc. In this case, optimiza. tion (7) may be treated as two problems: The optimal mix of property crime solutions, non property crime solutions and services is determined in a first step after which a second optimization is performed to determine the optimal mix of property crime solutions. See Strotz (1957). System (9) then becomes
(11) Pi- ac*/ayi = o, i = 1, 2, ... , p
C- C* (f (y1, y2, ... , Yp' w), Yp+1• ... , Yn' w) = 0
and is estimated below for the case of four property crimes, burglary, robbery, motor vehicle theft and larceny ,an aggregate of crimes against the person and an aggregate service indicator.
We have chosen to estimate the production cost function utilizing equations (11) rather than (6) for several reasons: First, costs in law enforcement agencies tend to be predominately labor costs (approximately ninety percent). And as one would expect, salaries of police employees by rank are highly correlated. Therefore, il will not be possible to include more than one, or at most two input demand equations if structure (6) is imposed. In addit ion, we approximate C* with a second order expansion in the logarithms of y and wand factor demand equations will impose no restrictions across the coefficien ts of lnyi and lnyi lnyj. If these terms are highly collinear, which is likely to be the case, then system (11) places restrictions across coefficients of terms in y and reduces the collinearity between the elements of y. The second reason for choosing (I I) as the basis for estimation is that it explicitly addresses the output mix problem rather than assuming that the decision is exogeneous to police administntors as in (6).
THE TRANSLOG MODEL
From an econometric point of view equation system (11) is only of limited interest until a specific functiona l form has been assigned to the cost function C* (y, w). The primary concern in choosing a function form for C* is that the chosen class of functions be capable of approximating the unknown cost function to the desired degree of accuracy. ln widespread use in the literature in the past few years are the class of so called "flexible" functional forms which includes the generalized Leontief function, tl1e generalized Cobb-Douglas function, the transcendental logarithmic function and many hybrids.12 These functions are all second order approximations to arbitrary differentiable, primal or dual objective functions and in particular place no restrictions on elasticities of substitution between inputs or elasticities of transformat ion between outputs and allow returns to scale to vary with the level of output. We have chosen to approximate C*(y, w) with a translog funct ion due primarily to the fact that most past studies of law enforce·
I2see Diewert (1971, 1973, 1974) and Ch ristiansen, Jorgensen and Lau (197 1, 1973, 1975).

- The Multi-Output Translog Production Cost Function: The Case of Law Enforcement Agencies - Darrough and Hezi1eke
rnent agency production technology have adopted linear logarithmic production structures.l3
The translog cost function may be written as
n n1 n n (12) lnC (y, w) = a0 +~a- lny- + ~ b- 1nw- + J-2 ~ ~ ~-· 1ny- lny
l I I 1 I I I 1. 1J I J
mm mn + J-2 ~ ~ f3·· 1nw- I nw· + ~ ~1' .. Jny- 1nw-.
1 I IJ I J I 1 IJ 1 J
Since logar ithmic functions are continuously differentiable,
the parameters ~ij and (3ij will be symmetric, i.e., ~ij = ~ji and
(3·· = f3· i , Vi, j. Our maintained hypothesis of functional separab~tty, Jsee equation (lO),between property crime solutions and aU other activities of the police agency implies the following restrictions on equation (1 2):
(1 3) ~ij = 0, i = 1, 2, . .. , p, j = p+ 1, p+2 , .. 14 ., 11 •
The hypothesis of linear homogenity of the cost fun ction in factor prices, nonjointness of outputs and existence of consisten t indices of outpu t discussed above are not main tained, but rather tested.
Testing for linear homogenity of C (y, w) in inputs prices may be interpreted as a test for cost minimizing behavior and implies t he following restr ictions on the translog cost function :
m m m m (14) ~b- = 1 ~f3·· = ~f3· · = ~r .. = o
. 1 ' . 1) . 1) . 1J I J 1 1
It will also be of interest to test for constant returns to scale in output. Constant re turns to scale implies
n n n n (1 5) ~ai = 1, ~~ij = ~~ij =~rij = 0
1 J I I
lf outputs are nonjoint, all cross second order terms in y ar e zero, i.e.,
(16) ~- · = 0 lJ , i, j = 1 , 2, . . . , n, i -=!= j.
THE ECONOMETRIC MODEL
In this section we specialize the n output, m input production model to the model which is estimated and provide the stochastic specifica tion needed for estima tion. We had available
13These s tudies have utilized linear logarithmic produc tion f un c tio n s which in turn imply Line ar logarith mic productio n cost functio ns. This property of linear logarithmic primal and dual functions is termed self duality, The linear logar ithmic fun ction is the o nly self dual translog function. 14see Bernd t and Christiansen ( 1974) for more detail on these cond itio ns. We have im posed w hat is called linear se parabilit y o f pro perty crim e solutions from o ther activities which implies InC (Y, w) = InC
1 (Y
1, y
2, ...
Y p' w) + I nC2 (y p+l , Y p+ 2 . .. , y n ' w) w here 1 nC 1 and 1 nC2 are tra ns-'
log fu nctions (See Blackorby, Primont a nd Russell (1974). Functiona l separability may also be ach ieved via a set of nonlinear rest rictions(see Berndt and Chris tiansen {1 974).) Blackorby, Pri mont and Russell ( 1 974) have shown t hat nonlinear separabili ty implies I nC (Y, w) = F (O
1 (Y
1,
Y 2' .. ·, Y p' w), 0 2 (y p' Y p+1' ... , y n' w)}where D 1 a nd 0 2 are li,near logarithmic func tions.
Linear logarithmic "aggregator" functions are q uite restrictive and for th~ reaso n we consider o nly the case of linear separability througho ut thts paper.
37
for this study information on annual police bud gets for the years 1968, 1969, 197 1 and 1973 for a sample of approximately thirty five medium size cities; the average wages of officers by rank, the number of crimes of type i cleared by arrest
("clearances") and the average value s tolen for each of the proper ty crimes in the FBI index.15 The police budget and
wage information was gathered by the Kansas City Police Department and circula ted for use by participating cities under the title of the Annual General Administrative Survey. The data on clearances and average values stolen is from unpublished sources at the FBI . Because of limitations on the number of variables which could ultimately be allowed in the model, we decided to use clearances by arrest for the seven FBI index crimes as our measures of "solutions." In par ticular, we have called burglary clearances (solutions), y 1, robbery clearances,
y2 , motor vehicle theft clearances y3, and larceny clearances,
y 4. We have used the aggregate number of homicide, rape and assault clearances to represent solutions to crimes against the person and have labeled t his output , y 5. Finally, a very large
component of the output of all law enforcement agencies are the rather mundane but important service fu.nc tions: Directing traffic, investigating accidents, breaking up fights, providing emergen cy first aid , etc. We group all such service functions together as y 6. The question is wha t to use to measure these
activ it ies. We have ad opted the hypothesis that the quant ity of services of the type we have been discussing is proportional to the size of the city in which the agen cy is located . This gives a cost function with six outputs and a s till unspecified number of input prices.
We had available wage information on e igh t grades of police officers from pat rolman to chief. As one might expect these wage rises are highly collinear. To test for the existence of a Hicksian price index we computed correlation coefficients between the wages of the various ranks and found very high coefficients. For example, the correlation between wages of patrolmen and a weighted average of the wages of all o ther ranks is .955. Unfortuna tely , t here does not appear to be a way of testing whe ther a sample correlation is sign ificantly d ifferent from one since the distribution of this statistic is degenerate at tha t point. But with correlations this high it appears safe to assume the cond itions for Hicks' aggrega tion are fulfilled and hence we use a weighted average of all police wages as an aggregate measure of unit labor costs, deno ted w.l6
The translog cos t function of (2) above may now be written as
15fhe largest city in o ur sa mple is Ho usto n , Texas, ( I ,230,000), the sma llest is Birmingham, Alabama (300,000) . Mean population over the sample is 56 1,000. 16Budget and w age series have been deflated using an index based upon BLS Intermed iate Family Budget data. (See B.L.S. Bu lletins No. I 570-7 and the Monthly Labor Review. )

Santa Clara Business Review
TABLE I
Parameter Restrictions for Linear Functional Separability 19
-Aggregate Pa ra meter Restrictions Aggregate Parameter Restrictions
-(yl , Y2) a = a = a = a = 1'1 = 1'2 =0 (y 1 ,y2,y3) a = a = a = 1'1 = 1'2 = 'Y == o
13 14 23 24 14 24 34 3
(y1 , y3) a = a = a = a = 1'1 = 1'3 =0 CY t ,y2,y4) a = a = a = 'Yl = 1'2
= 'Y ::::0 12 14 23 34 13 23 34 4
(yl , Y4) a =a = a = a = 'Yl = 1'4 =0 (yl ,y3,y 4) a = a = a = 1'1 = 1'3 = 'Y == o 12 13 24 34 12 23 24 4
(Y2, y3) a =a = a = a = 1'2 = 1'3 = 0 (y2,y3,y4) a = a = a = 1'2 = 1'3 = 'Y ==o
12 24 13 34 12 13 14 4
(y2, y 4) a = a = a = a = 1'2 = 1'4 = 0 (y 1 ,y2,Y3 ,Y 4) 1'1 = 1'2
= 1'3 = 1'4 = 12 23 14 34 0
(y3, y 4) a =a = a = a = 1'3 = 1'4 = 0 13 23 14 24
l 9These restr ict ions are cond itiona l on the fu nc tional separability o f pro pert y cri me so lutions and all o t her po lice act ivities.
TABLE II
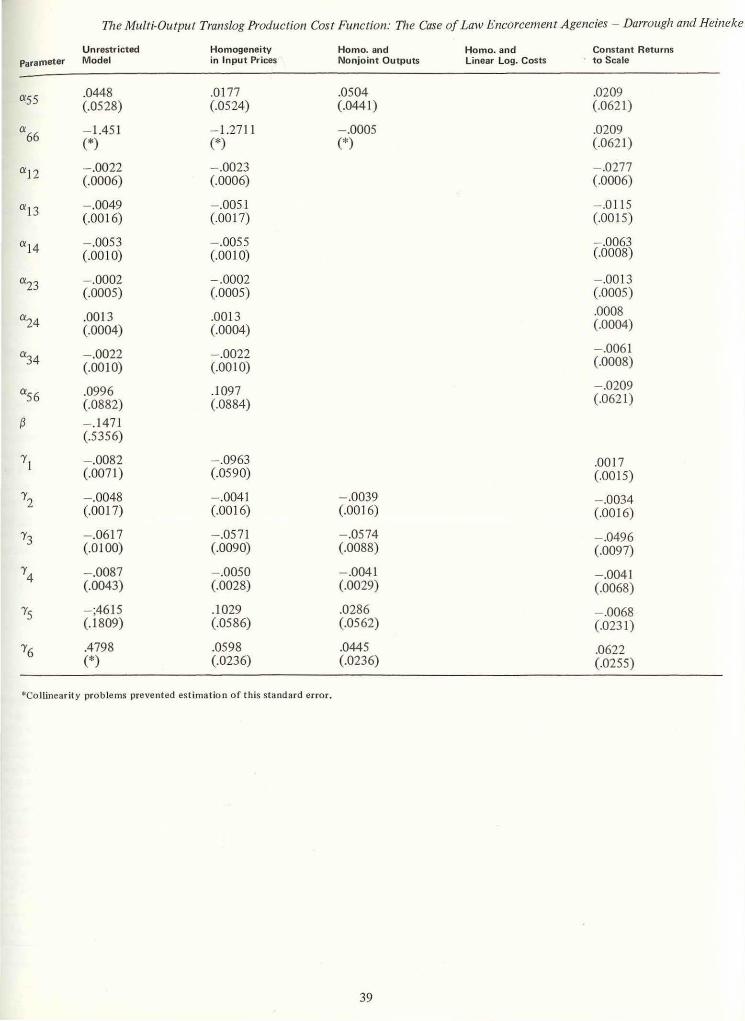
Parameter Estimates for Five Cost Models
Unrestricted Homogeneity Homo. and Homo. a nd Constant Returns Para meter Mode l in Input Prices Nonjo in t Outputs Linear Log. Costs to Scale
ao - 108.68 - 98.899 -75.949 - 4.469 - .7190 (27.23) (7.5 12) (2.190) (1.092) (1.332)
a1 - .0049 - .0542 - .1 326 .0292 .0053 (.0478) (.0168) (.0127) (.0016) (.0 1 14)
a2 .0244 .0203 .0 129 .0065 .0314 (.011 8) (.0 11 0) (.0108) (.0003) (.0 109)
a3 .3262 .2989 .2378 .0459 .3956 (.0679) (.0615) (.0603) (.0026) (.0646)
a4 .0252 .003 1 - .0467 .01 98 .0378 (.0293) (.0205) (.0203) ( .0009) ( .0 190)
as 1.657 - 2. 118 - .4037 .2448 .4127 ( 1.682) (1.084) (.4853) ( .0376) ( .4088)
a6 16 .01 6 16.38 12.259 .91 13 .1 170 (.591 7) (.6349) (.1848) (.0902) (.4147)
b .7123 (7.393)
a ll .01 27 .J199 .0296 .0206 (.0020) (.059 1) ( .0561) (.00 14)
a 22 .0033 .0034 .0032 .0032 (.0005) (.0005) ( .0003) (.0005)
a33 .0287 .0284 .0294 .0 189 (.0022) (.0022) (.0019) (.0019)
a44 .01 25 .01 25 .0 119 .0115 (.0009) (.0009) ( .0009) (.0007)
38
111e Multi-Output Translog Production Cost Function: The Case of Law Encorcement Agencies - Darrough and Heineke
Unrestricted Homogeneity Homo. and Homo. and Constant Returns Parameter Model in Input Prices Nonjoint Outputs Linear Log. Costs · to Sca le
ass .0448 .0177 .OS04 .0209 (.OS28) (.OS24) (.0441) (.0621)
a66 - l.4S1 - 1.2711 - .OOOS .0209 (*) (*) (*) (.0621)
a12 - .0022 - .0023 - .0277 (.0006) (.0006) (.0006)
a13 - .0049 - .OOS1 - .011S (.0016) (.0017) (.001S)
a 14 - .OOS3 - .OOSS - .0063 (.0010) (.001 0) (.0008)
a23 - .0002 - .0002 - .0013 (.OOOS) (.OOOS) (.0005)
a24 .0013 .0013 .0008
(.0004) (.0004) (.0004)
~4 - .0022 - .0022 - .0061
(.0010) (.0010) (.0008)
aS6 .0996 .1097 - .0209
(.0882) (.0884) (.0621)
~ - .1471 (.5356)
1'1 - .0082 - .0963 .0017 (.0071) (.0590) (.001S)
1'2 - .0048 - .0041 - .0039 - .0034 (.0017) (.0016) (.0016) (.0016)
1'3 - .0617 - .0571 - .OS74 - .0496 (.0100) (.0090) (.0088) (.0097)
1'4 - .0087 - .OOSO - .0041 - .0041 (.0043) (.0028) (.0029) (.0068)
~'5 - ;4615 .1029 .0286 - .0068 (.1809) (.OS86) (.0562) (.0231)
~'6 .4798 .0598 .044S .0622 (*) (.0236) (.0236) (.025S)
*Co !linearity problems prevented estimatio n of t his standard error.
39

Santa Clara Business Review
TABLE IV (Continued) POTENTIAL OUTPUT AGGREGATES
Parameter (1 , 2, 3) (1, 2, 4) (1 , 3, 4) (2,3. 4) (1. 2. 3, 4)
0:23 .0005 - .0005 - .0003 (.0005) (.0005) (.0005)
0:24 .0013 .0010 .0013 (.0004) (.0003) (.0004)
0:34 - .0028 - .0021 - .0029 (.0010) (.0009) (.0010)
0:56 .0802 .0932 .1222 .1 245 .1032 (.0870) (.0881) (.0984) (.0881) (.0889)
{3
'Y1
'Y2 - .0003 (.001 5)
'Y3 - .0504 (.0012)
'Y4 .0019 (.0026)
'Y - .4038 - .4184 -.4522 .0336 - .4546 5 (.1939) (.J 969) (.1984) ( .0570) (.1989)
'Y6 .1873 .2501 .2186 - .0327 .2192 (.0992) (.1011) (.0105) (.0190) (.1017)
*Collinearity problems prevented estimates of this s tandard error.
TABLE V
Marginal Costs of Outputs, Rates of Transformation between urpu san eturns to ca e at samp: e means ' 0 t t d R S I ( I )~
€ 1.069 MC5 2448.00 MRT24 .607 (.0817)
€ .3429 MRT12 .191 MRT25 10.77 (.0571)
MC 1 11 86.87 MRT13 .992 MRT34 .117 (543.35)
MC2 227.24 MRT14 .116 MRT35 2.08 (11.04)
MC3 1177.18 MRT15 2.06 MRT45 17.74 (45.51)
MC4 138.01 MRT23 5.1 8 (5 .81)
*Standard errors are in parentheses.
40 --

The Multi-Output Translog Production Cost Function: The Case of Law Enforcement Agencies - Darrough and Heineke
where a: 15 = a: 16 = o:25 = o:26 = 0:35 = o:36 = 0:45 = o:46 = 0
due to the imposed functional separability of property cr ime solutions and all other police activities.
Linear homogenity of C* in w imposes the fu rther restric-
tions
6 (18) b=l, 13=0, L-y-=0
1 I
while constant returns to scale imply
6 6 6 6 (19) Lai = I , ~ o:ij = ~ o:ij = 0, v i, j and L
1 -y i = 0 .
1 1 J
If property crime solutions are non joint then
(20) o:ij = 0 • i, j = 1, 2, 3, 4, i * j The latter imposes only six additional restrictions, since differentiabil ity of 1 nC* implies symmetry of the o:ij.
Finally, given the hypothesis of functional separability between property crime solutions and all other police activities there are a total of eleven possible groupings of property crime solutions which might be considered for indexing. Our question here is not whether an index exists in any of these cases because an index can always be found, but whether a consistent index exists. J 7 The eleven candidates for aggregat ion and indexing are displayed in Table I along with the implied linear separability restrictions. 18 It is important to keep in mind that the existence of an aggregate (a functionally separate group) does not in general imply existence of a consistent index for the aggregate. (See Theorem 4).
For the case at hand, system (11) may be written as
l 7 An example of such a question is whether it is possible to aggregate burglary, robbery and larcen y solut io ns into a co mposite category su ch as "non au tomobile theft" solutions. Given the nu mbers of burglary, robbery and larceny solutions a nd their impu ted values, how does one derive quantity and value ind ices fo r "non auto mobile theft" solutions? Su ppose burglar y solu t ions, robbery solutions and larceny solutions are separable from other police ou tputs and input prices, then the cost function
~ay be written as C(y, w) = C(c 1(y 1, y2 , y4
}, y 3, y5, y6, w). In addihon, if c
1 is homothetic then y
1, y
2 and y
4 may be aggregated into a
category. The quantity index for sample pointy* :=(y•, y•, y*) is de-t
. I 2 4 . ermmed by the function c 1 (·) and th:_ values of (y i, y i• y 4>· Since t he mdex shou ld be linear homogenous in y, the problem is to find an aggregator function for¢ (c1 (y )} which is lin ear homogeneous in y. The
· quantity (solu tio n) in~ex is_ then ¢ (c 1 (y*)) at y*. T he correspond ing
value (price) index is P* = (Piyi + PiYi + P4y4) 1¢ (c1 (y*)}. Eva luattng two "non automobile theft" solution vec tors (y•1, y*, y*), and (y0
, o o - - o 2 4 1
Y 2• Y 4
J, given r • and P , but without knowledge of t he function c (·}, is th e analog to the more traditional index problem.
1
18As was pointed out in footnote 14 above, there are also sets of nonlinear restrictions which lead to functiona l separab ility. The implica tions of these conditions are so res tr ic t ive that more nonlinear separabi lity is not considered in the tests repor ted below.
41
6 (2 1) Piy/C* = ai + LO:iJ·lnyJ. +-y. I nw, i = 1, 2, 3, 4
1 I
where a: ij = 0, i = 1, 2, 3, 4, j = 5, 6 and a: ij = o:ji• \Li , j. (The
fust four equations here given the value to society of Y· 1
. I so utwns to property crime i as a proportion of total police expenditures.) The next step in implementing the econometric version of the model is to provide a stochastic framework for equations (21). We do this by appending classical additive disdisturbances arise either as a result of random error in the maximizing behavior of police administrators, or as a result of the fact that the translog function provides only an approximation of the "true" underlying production structure. We assume that noncontemporaneous disturbances are uncorrelatcd both within and across equations. We make no other assumptions about the distribution of disturbances other than they be uncorrelated with right hand variables in each equation.20
EMPIRICA L RESULTS
We have fitted the five equations of system (21) under the stochastic specification outlined above. There were 125 observations available for estimating each equation in the system so that the total number of degrees of freedom for statistical tests is 625. Since no assumption has been made concerning the distribution of disturbances, our estimation procedure may be thought of as multiequation , nonlinear least squares. In the computations we used the Gauss-Newton method to locate minima. The results of estimation are presented in Table II.
The estimates reported in column two contain no restrictions other than the symmetry implied by the continuous differentiability of 1nC* and entails estimating twenty-eight parameters. Given the primarily cross section nature of the data, the model fits quite well with R2 figures of .74 for the cost function and .36, .13, .46, and .29 for the value of solution equations Piy/C*, i = 1, 2, 3, 4, respectively. Durbin-Watson statistics are 1.8 1, 1.94, 2.41, 2.53, and 2.18, respectively. It appears that disturbances associated with each equation are serially independent)!
In column three, we report estimates of the model with homogeneity in input prices imposed. As w,e have noted previously, cost minimizing input decis ions imply a production cost function with this property and for this reason we may consider a test of the fit of the homogeneous model as a test of the consistency of the data with cost minimizing behavior.
20The latt er is in fact a rather stro ng assumption. It may be eliminated by using a set of instrumental variab les to generate "predicted" values of y i' say 9i' and then rep lacing yi w ith 9i when estimating system (2 1 ). This approach will be reported on in a later version of this paper. 2 ! James Durbin has argued that the conven tional sing le equation DurbinWatson s tatistic be used to check for serial corre lat io n in sim u lt aneous equation systems.

Santa Clara Business Review
Homogeneity in prices reduces the number of parameters to be estimated from twenty-eight to twenty-five (see equation (18) ). Traditional R 2 statistics are . 72 for the cost equation and .35, .12, .46 and .28 respectively for the value share equations. Durbin-Watson statistics for the five equations are 1.75, 1.94, 2.41, 2.5I and 2.2I, respectively. With the possible exception of the cost equation, it again appears that disburbances are serially independent.
In columns four, five and six are reported parameter estimates for the case of nonjoint outputs, linear logarithmic costs and constant returns to scale, each conditional on linear homogeneity in input prices. In column four are the estimates with input price homogeneity and nonjointness of output imposed. These restrictions reduce the number of parameters to eighteen. The linear logarithmic cost function (column five) was estimated primarily to contrast· the functional form of the cost function presented in this paper with that implied by the linear logarithmic production functions which have been estimated in the maiority of earlier papers.22 The total number of parameters to be estimated is now reduced to seven. The final column contains our estimate of the model with constant returns to scale imposed.
Our tests of the various hypotheses which have been discussed are based upon the test statistic
(22) n = max LR/max L R where max LR is the maximum value of the likelihood funct ion for the model with restrictions Rand max L R is the maximum value of the likelihood function without restriction . Minus twice the logarithm of n is asymptotically distributed as chisquared with number of degrees of freedom equal to the number of restrictions imposed . Throughout we choose critical regions based upon the .OI level of significance.
Logarithms of the likelihood function are given in Table III for each of the model specifications to be evaluated. We first test the hypothesis that police agencies make cho ices in a cost minimizing manner, which imJ?lies C* is linearly homogeneous in w. Comparing the homogeneous model with the unrestric ted model we find that minus twice the logarithm o f the likelihood ratio is 4.52. Since there are but three restrictions imposed, we easily accept the hypothesis of a cost structure which is linearly homogeneous in input prices. That is, the data in our sample of police departments are cons istent with cost minimizing behavior.
Conditional on linear homogeneity in input prices we next test the validity of the hypothesis of non joint outputs- a hypothesis which has been maintained in past studies whenever single output aggregates have not been utilized. Minus twice the logarithm of the likelihood ratio is 53 .08 and the nonjointness hypothesis is resoundingly rejected. We conclude that one may not go about estimating separate production functions or separate cost functions for each of the outputs of police agencies. The interaction between outputs must be accounted for if one is to adequately characterize the structure of cost and produc tion in this "industry."
22 Recall that a linear logarithmic production funct io n is self dual and hence implies a cost function of the same functional form.
42
TABLE III
Estimated Values of Ln of Likelihood Function
Mod el Functional Separability Imposed Unrestricted 1654.57 {1, 2) 1628.94 (1, 2, 3) 1616.43
Homogeneous in Input Prices 1652.31 (1, 3) 1613.50 (1, 2, 4) 1645.79
Homog. in Input Prices and Nonjoint 1625.77 (1, 4) 1640.13 (1, 3, 4) 1628.40
Linear Logarith-mic Costs 1483.57 (2,4) 1627.16 (1, 2, 3, 4) 1636.79
Homog. in Input Prices and Output 1613.23 (2, 3) 1619.70 (2,3,4) 1612.56
h (yl' y2, y4) is
homo the tic 1628.52 (3, 4) 1611.56
It is instructive to contrast the linear logarithmic cost and production structure implied by these data, with our more general model. Columns three and five of Table II contain parameter estimates for the cost models which maintain homogeneity in prices, and a linear logarithmic production structure . in addition to linear homogeneity in prices.23 The fac t that twice the logarithm of the likelihood ratio for this test is 337.48 is a fairly accurate indication of the magnitude of the loss in explanatory power resulting from adopting the CobbDouglas functional form fo r C*.
Parameter estimates for the models associated with each of the eleven possible output aggregates are presented in Table IV with corresponding logarithms o f likelihood funct ions tabulated in the right-hand columns of Table Ti l. Since we have accepted the hypothesis of linear homogene ity in input prices, we test these restr ictions conditional on the validity of this hypothesis. To begin we choose the prospective aggregate (y 1, y2 , Y 4) with the largest likelihood function. Minus twice the logarithm of the likelihood ratio is 13.04 in this case. Since there are a total of six additional restrictions the chi-square (.01) critical value is J 6.18 and functional separability of burglary, robbery and larceny solutions from the remaining outputs and from input prices is accepted. Perusal of Table lll indicates tha t all other potential aggregates are rejected and hence, say, h(y1, y2 , y 4) is the only category function.
According to Theorem 4, if either the cost fu nction is homothet ic or if C* is not homothetic, but the category function for (y I, y2 , y 4) is homo the tic, then a consistent aggregate index of burglary, robbery and larceny exists. Barring each of these cases another possibility for consistent aggregation remains; the values for y 1, y2 andy 4 (PI , P2, P 4) (or for that matter, the values of any subgroup of (y 1, y2 , y3, y4) are
perfectly correlated. (See Hicks' Aggregation Theorem above). To begin these tests we have calculated returns to scale at the mean of (y I , y2 , y3 , y 4 , y 5, y 6,w) and the standard error of this
statis tic and find we cannot reject the hypothesis of constant returns to scale. (See Table V below.) The fact that C* is
2 3of co urse, linear logarith mic cost and production functions main· tain the nonjo intness hypothesis.

111e Multi-Output Translog Production Cost Function: The Case of Law Enforcement Agencies - Darrough and Heineke
TABLE IV
Parameter Estimates: Linear Homogeneity in Input Prices and Functional Separability Imposed POTENTIAL OUTPUT AGGREGATES
Parameter (2, 3) (1, 3) (1, 4) (1 , 2) (2, 4) (3, 4)
ao - 95 .5161 - 95.75 - 106.47 - 101.42 - 98.5637 - 89.6617 (33.8291) (33.53) (7.280) (7.212) (33.4918) (7.4351)
a1 -.073 1 - .1348 - .0683 - .1199 - .1 325 - .1228 (.0173) (.0129) (.0171) (.0137) (.0131) (.0138)
a2 - .0090 - .0148 .0113 - .0066 - .0150 - .0078 (.0027) (.0101) (.0103) (.0033) (.0037) (.0097)
a3 -.1 259 - .1306 .2494 .2059 .1887 - .1265 (.0158) (.1 075) (.0581) (.OS68) (.OS66) (.0168)
a4 -.0526 - .0892 - .0368 -.OS06 - .07S3 - .06S9 (.1867) (.OI9S) (.0099) (.01 92) (.0083) (.0078)
as -2.1855 - 1.84S 1.237 1.320 -1.8340 - 1.8721 (1.2147) (1.187) (1.761) (1.741) (1.2022) (1.0716)
a6 16.4742 16.47 15.976 1S .31 16.5406 IS.4808 (S.3143) (S.277) ( .8S3S) (.8442) (S .2618) (.6226)
b 1.0 1.0 1.0 1.0 1.0 1.0
all .0621 .0278 .0187 .0209 .0327 .0491 (.OS87) (.0077) (.0017) (.00 18) (.OS84) (.OS74)
~2 .0029 .0030 .0028 .0033 .0028 .0036 (.0004) (.0004) (.OOOS) (.0004) (.0004) (.OOOS)
~3 .0268 .0321 .026S .0283 .0309 .0289 (.0023) (.0023) (.0021) (.0020) (.0021) (.0023)
a44 .0124 .011 9 .0122 .0123 .1174 .0126 (.0009) (.0094) (.0009) (.0009) (.0009) (.001 0)
ass .0177 .0321 .0393 .0454 .0282 .026S (.0527) (.0521) (.0523) (.0516) (.OOS2) (.OS18)
a66 - 1.247 - 1.238 -1.348 - 1.280 - 1.2747 - 1.1S82 (.4224) (.4201) (*) (*) (.4182) (*)
a12 -.0010 - .0010 (.0005) (.0006)
al3 - .0043 - .003S (.0016) (.0015)
Ql4 -.OOSO - .0052 (.0010) (.0009)
Q23 -.0004 - .0003 (.0005) (.OOOS)
Q24 .0006 .ooos (.0004) (.0004)
Q34 -.001 9 - .0020 (.0008) (.0009)
Q56 .1320 .1147 .1120 .0941 .1183 .1084 (.0995) (.0982) (.0880) (.0871) ( .0984) (.0876)
~
~'1
· *Collinear ity problems prevented estima tes of this st andard error.
43

Santa Clara Business Review
TABLE IV (Continued) POTENTIAL OUTPUT AGG RE GATES
Parameter (2. 3 ) (1 , 3) (1, 4 ) (1, 2) (2, 4 ) (3, 4)
'Y2 - .0003 - .0030 - .00001 (.OOIS) (.001S) (.OO IS)
'Y3 - .OS60 - .0493 - .047S (.008S) (.0083) (.0082)
'Y4 .0019 .0018 - .0020 (.002S) (.0029) (.0027)
rs .0678 .0362 -.4201 - .4043 .0320 .OS81 (.OS8S) (.026S) (.1966) (.1942) (.OS79) (.OS73)
'Y6 - .0266 - .03S8 .263S .2429 .0233 - .030S (.0192) (.0226) (.1009) (.0997) (.0213) (.0194)
POTE NTIA L OUTPUT AGGR~GATES Para meter (1 , 2, 3 ) (1 , 2, 4) (1, 3, 4 ) (2.-3 . 4 ) (1, 2. 3, 4)
ao -102.00 - 114.68 - .113 .77 - 100.124 - 121.61 (7.208) (7 .306) (32.S7) (7.4896) (7.372)
a1 - .1276 - .06S6 - .0673 - .13 11 - .0612 (.01 22) (.0169) (.0163) ( .0141) (.016S)
a2 - .0097 - .0082 - .0064 - .0169 - .0070 (.0032) ( .0039) (.0094) (.0037) (.0040)
a3 - .1233 .212 1 - .0811 - .1317 - .0736 (.0166) (.OS62) (.0204) (.017S) (.0213)
a4 ~.0827 -.0368 - .03S9 - .0744 - .0331 (.0186) (.0100) (.009S) (.0083) (.0100)
as 1.444 1.4S2 1.29S - 1.91S7 l.S46 (1.739) (L76S) (1.848) (1.0807) (1.782)
a6 1S.74 17.199 17.40 17.1S49 18.438 (.8408) (.8SS 1) (S.l49) (.6260) (.8603)
b 1
all .0262 .0210 .0229 .022S .0246 (.0021) (.00 17) (.0020) (.OS71) (.0020)
a22 .0034 .0032 .0024 .0030 .0034 (.0004) (.0004) (.0004) (.0004) (.OOOS)
a33 .0311 .0261 .0299 .0304 .0294 (.0023) (.0021) (.0024) (.0023) (.0024)
a44 .0114 .0121 .0126 .0130 .0127 (.0009) (.0008) (.0009) (.0010) (.0009)
ass .OS32 .0431 .0446 .0267 .0477 (.OS16) (.OS23) (.OS27) (.OS23) (.OS28)
a66 - 1.278 - 1.426 - 1.436 - 1.29SO - 1.504 (*) (*) (.409S) (*) (*)
a12 -.001 1 - .0021 - .0021 (.0006) (.0006) (.0006)
al3 - .0048 - .0066 - .0064 (.001S) (.001 7) (.0017)
a14 - .0062 - .0039 - .0048 (.0010) (.001 0) (.0010)
*Co llincarity pro ble ms prevented est imates of this standard error.
44
- The Multi-Output Translog Production Cost Function: The Case of Law Hnforcement Agencies - Darrough and Heineke
linearly homogeneous in outputs at the sample means certainly does not imply constant returns to scale throughout the relevant output region (and consequently a homothetic cost function), but does suggest that it is of interest to test this hypothesis. The logarithm of the likelihood function associa ted with this model (linear homogeneity in input prices and outputs) is reported in Table llJ. According to equation ( 19) above, linear homogeneity in outputs imposes seven additional restrictions on the mode[.24 The value of the test statistics is 78. 16 and hence these data lend no support whatever to the constant returns hypothesis.
We next reestimated the model for the case when h (y 1, y2,
y 4J is constained to be homo the tic, maintaining the hypotheses of linear homogeneity in prices and functional separability of (y 1, y 2, y 4). This imposes llu-ce add itional restrictions on the
model, all= --a-12 - al4• a22 = - a12 -~4anda44 = - a14
-a24. The value of the log likelihood function is reported in the last, left hand row or Table lH and yields a test statistic of 35.54 which leads to reje ction of the homotheticity hypothesis.25 We conclude that although an aggregator function, h O. exists for (y 1, y2, y 4) , a consistent index, via homothetic
separability, cannot be found.26 Finally, we have calculated the correlation matrix for P to
check for the possibility of a Hicksian aggregate. The correlations are r 12 = .065, r13 = .065, r14 = .901 , r23 = .197, r24 =
.014 and r34 = 0.026. Of course,such calculations permit testing only pairwise groupings of outputs in the first step. It is interesting to note that the only highly correlated val ues (P1 and P4) are associated with the outputs (y 1, y4) which in
turn have the smallest test statistic among all pairs in our tests of functional separability. (See Table Il l.) Although rr4= .901 is far from a perfect correlation and the functional separability of (y 1, y 4) was rejected above, both the size of the correlation coefficient and the size of the tes t statistic suggest that burglary solutions and larceny solutions may in some situations be consistently aggregated.
MARGINAL COSTS, RATES OF TRANSFORMATION AND RETURNS TO SCALE
The marginal cost fu nction for activity i is given by 3C*/3yi
= (31nC*/3lnyi) (C*/yi), i = 1, 2, 3, 4, 5, and may be calculated using the formula
(23) 3C*/3yi = (ai + ~ai}nYj +f'ilnw) (e1nC*/yi), i = 1, 2, ... , 5 I
As indicated, (23) will be valid for each of the crime solving outputs, y 1, y2, ... , y5 and not for y6. Recall that the sixth
24Sy m metry of the a .. reduces the restrictions in (19) from thirteen to seven. Recail that Lf'i ~ 0 .is already imposed. 25A necessary and sufficient cond ition for homotheticity of the trans· log function h(y 1, y
2, y
4) (see footnote 14) is that h O be homogeneous,
wh ich implies the conditions g ive n. 26We have tested thr ee in creasingly special cases of the cost model in this seq uence of tests, (homogeneity in input pr ices, fu nctional separab ilit y of (y 1• Y 2, Y 4) from other outputs and w, give n ho mogeneity in input prices
and homo thet icity of h (Y 1, y 2
, y 4
) given· ho mogeneit y in in put prices
and functional separability of (y 1, y 2
, y 4) ). T he overa U level o f sign ifi-
45
output was an aggregate of tl1e "non-crime solving" services provided by police. Since we have postulated only that the production of this output is proportional to population size, it will be possible to determine 3C*/3y6 only up to this factor of proportionality.
The rate of transformation of output i for output j gives the number of solutions to crimes of type i which must be forgone for an additional solution to a crime of type j, given fixed levels of all other outputs. Formally , the rate of transformation betwe:nout~u~s-iand j may ~e v.:ritten as -3yj/3Yj =@C*/3_yj) I ( ac /3yi), t,J- 1, 2, ... , 5, 1 =I= J, and may be calculated usmg the formula
(24) - ,i, j = 1,2, ... ,5, i =t= j
As with marginal cost functions, it will not be possible to obtain transformation rates between outpu t six and other ou tputs.
Traditional measures of scale economies (or diseconomies) are predicated on the single output firm and must be modified for use here. We measure scale economies as the percentage response of costs to a small equal percentage change in all outputs. That is,
6 (25) e = dC*/C* = L(a I nC*/3 1ny) (dq/q) ,
1
where dq/q is the percentage change in outputs.27 Of course one may calculate e for subsets of outputs holding the remaining outputs fixed. Here we report on two scale measures, e and E. The former measures the percentage responses of c.osts to an equal percentage change in all solutions and in the service output , y 6.28 The latter concept will measure the percentage response of costs to a change only in crime solving activities and is calculated according to the formula
5 (26) e = L (31nC*/a i nyi) (dq/q),
Marginal cost functions (MCi), rates of transformation
(MRTij) and returns to scale functions (€and e) evalua ted at
sample means are presented in Table V. To aid in evaluating these· figures we have calculated standard errors (in paren(thesis) for the two scale measures and each or the marginal costs. Since MC 1 is the only marginally significant, one should
not put too much faith in the computed marginal cost of burglary solutions and the rates of transformation which depend upon it. All other statistics are highly significant. Also, because these functions are h ighly nonlinear one must take care in intepreting the values in the table.
cance for such co-caUed " nested" tests is approx imately the su m of signi
ficance levels for individual tests in the sequence. -27 E.G., if dqfq = I, and ~:< tat y*, the n the production funct ion ex hibits increas ing returns to scale at the o utput m ix y*, etc.
28The proportionality between population size and y 6
causes no pro blem
here s ince the perce ntage change in y 6
is equa l to the percentage c hange in popu latio n s ize.

._----------------------------------------------------------Y4
1.0
.50
2 .0
1.258
1.0
Figure ! - Marginal Cost Function for Activity 4.
- - - - - - - - - - - - - - - - - - - - --:_::- :_:::..- ;;;..;:.- -;;...=- -=----- -='"'- -~-=-=--·- - -
€
Figure 2 - Returns to Scale over Crime Solving Activities.
Figure 3- Returns to Scale over All Activities 46
€ linear logarithmic costs
dq/q
e linear logarithmic costs
Jq/q
-

The Multi-Output Translog Production Cost Function: The Case of Law Enforcement Agencies - Darrough and Heineke
At the sample means equal percentage changes in all outputs lead to approximately equal percentage changes in cost; while costs are much less responsive when only crime solving outputs are varied, holding services, y 6, constant. According to our estimates, incremental costs for clearing larcenies are the lowest ($138.01), followed by robbery ($227.24), motor vehicle thefts ($1 177. 18) and crimes against the person ($2448.-00). As we have noted, each of these estimates is highly significant.
Rates of transformation between outputs at sample means range from .11 7 between motor vehicle theft solutions and larceny solutions to almost eighteen between larceny solutions and solutions to crimes against the person. Hence, the estimated cost function predicts that on average it will be necessary to forego between eight and nine larceny solutions to solve one additional motor vehicle theft (at the mean) and approximately eigh teen larceny solu tions to solve the "average" crime against the person. Similar interpretations hold for the other transformation rates.
Figures 1-3 indicate the general curvature of the estimated marginal functions and re turns to scale functions.29 Tn figures 2 and 3 we have for contrast included plots of the scale measures ( EQ and €Q) associated with a linear logarithmic production structure. Of course in this case these functions are constant and are .346 and 1.258, respectively. The marginal cost function for output i has been graphed by evaluating (23) at (Y1' y2, . . . , Yi· ... , Y6, w), where the over bar indicates
sample means, and allowing Yi to vary over the sample.
SUMMARY AND CONCLUSION
In this paper we have adopted the economic model of an optimizing fi rm as a framework for characterizing the production structure of a sample of medium sized U.S. law enforcement agencies. Unlike previous studies we have begun with a second order approximation to an arbitrary multi-outputmulti-input production possibilities function. This rather general functional specification has permitted us to test a number of hypotheses which have been implicitly maintained in earlier work. Of particular interes t is the finding that at least in our sample, the decisions of police administrators are consisten t with cost minimization and th at outputs are very defin itely joint- thereby effectively precluding estimation of separate production and/or cost functions for the different outputs of police agencies. ln addition we strongly rejected the hypothesis of constant returns to scale and indeed found that scale economies varied considerably with activity levels. Finally, our sample contained no evidence suppor ting the existence of a consistent index by which certain subse ts of property crime solutions could be aggregated.
29E was ca lculated hy evaluating equatio n (25) at (min y (1 + o)i, w) for ~ <8 < I and i > 0. Also i was chosen so that m in y (I + o) < max y. 1 he analogous procedure was used to graph €. Here w re presen ts the sample mean o f w.
REFERENCES
1. Annual General Administrative Survey, prepared by Kansas City Police Department for limited circulation, 1968, 1969, 1971, 1973.
2. Berndt , E. R., and L. R. Christensen, "The Translog Function and the Substitution of Equipment , Structures and Labor in U.S. Manufacturing, 1929-68 ," Journal of Econometrics, p. 81 -113, 1974.
3. Blackorby, C., D. Primont and R. Russell, " Dual P rice and Quantity Aggregation," Journal of Economic Theory, 14, pp. 130-48, 1977.
4 . , _ _ and , "On the Flexibility of the Translog Function ." Discussion Paper 74-26, Departmen t of Economics, University of Brit ish Columbia, 1974.
5. Chapman , J. I. , W. Z. Hirschand S. Sonenblum, "Crime Prevent ion, The Police Production Function and Budgeting," Public Finance, Vol. XXX, no. 2, 1975 pp. 197-215.
6. Christensen, L. R., D. W. Jorgensen and L. J. Lau, "Conjugate Duality and the Transcendental Logarithmic Production Function," Econometrica, 39, pp. 255-56, J 97 1.
7. , and ,"Transcendental Logari th-mic Production Frontiers," · Review of Economics and Statistics, 55, pp. 28-45 , 1973 .
8. , and , " Transcendental Logarith-mic Utility Functions," A merican Economic Review, 65 , pp. 367-83, 1975 .
9. Diewert, W. E., " Aggregation Problems in the Measurement of Capital." Paper presented to the Conference on Research in Income and Wealth , National Bureau of Economic Research, Toronto, 1977.
10. "Applications of Duali ty Theory," in Frontiers of Quantitative Economics, Volume IT, eds. M. lntriligator and D. A. Kendrick, North-Holland Publishing Co., 1974.
I 1. "An Application of the Shephard Duality The-orem: A Generalized Leontief Prod uction Function," Journal of Political Economy, 79 pp. 48 1-507, 1971.
12. "Separability and a Generalization of the Cobb-Douglas Cost , Production and Indirect Utili ty Functions," Technical Report No . 86, TMSSS, Stanford University, 1973 .
J 3. Durbin, J ., " Testing fo r Serial Correlation in Simultaneous Regression Equations," Biometrika, December 1957, pp. 370-77.
47

Santa Clara Business Review
14. Ehrlich, 1., "Participation in lUegitimate Activities: An Economic Analysis," in Essays in the Economics of Crime and Punishment, edited by G. Becker and W. Landes, NBER, 1975.
15. ___ ,"Participation in Illegitimate Activities: A Theoretical and Empirical Analysis," Journal of Political Economy, 81, pp. 521 -67, 1973.
16. Goldman, S., and H. Uzawa, "A Note on Separability in Demand Analysis," Econometrica, 32, pp. 387-98, 1964.
17. Hall, R. E., "The Specification of Technology with Several Kinds of Output," Journal of Political Economy, 81' pp. 878-92, 1973.
18. Hicks, J. R., Value and Capital, Oxford: 2nd ed., Clarendon Press, 1946.
19. Popp, D. 0., and F. D. Sebold, "Quasi Returns to Scale in the Provision of Police Service," Public Finance, Vol. 27, no. 1, pp. 1-18, 1972.
48
20. Shephard, R. W., Cost and Production Functions, Princeton University Press, 1953.
21. Strutz, R. H., "The Empirical Implication of a Utility Tree," Econometrica, April 1957, pp. 269-80.
22. Vandaele, Walter, "The Economics of Crime: An Econometric Investigation of Auto Theft in the United States," unpublished Ph.D. dissertation, University of Chicago, 1975.
23. Votey, H.L., and L. Phillips, "Police Effectiveness and the Production Function for Law Enforcement," Journal of Legal Studies, Vol. 1, 1972, pp. 423-36.
24. Walzer, Norman, "Economies of Scale and Municipal Police Services: The Illinois Experience," Review of Economics and Statistics, Vol. 54, no. 2, 1972, pp. 431-38.
25. Wilson, James Q., and Ba·rbara Boland, " The Effect of Police on Crime Rates," Urban Institute Working Paper, April 1977.
Related Documents