University of Arkansas, Fayeeville ScholarWorks@UARK School Choice Demonstration Project Education Reform 3-1-2009 e MPCP Longitudinal Educational Growth Study Second Year Report John F. Wie University of Arkansas, Fayeeville Patrick J. Wolf University of Arkansas, Fayeeville, [email protected] Joshua M. Cowen University of Arkansas, Fayeeville David J. Fleming University of Arkansas, Fayeevile Juanita Lucas-McLean Westat Follow this and additional works at: hps://scholarworks.uark.edu/scdp Part of the Education Policy Commons , Public Policy Commons , and the Social Policy Commons is Report is brought to you for free and open access by the Education Reform at ScholarWorks@UARK. It has been accepted for inclusion in School Choice Demonstration Project by an authorized administrator of ScholarWorks@UARK. For more information, please contact [email protected], [email protected]. Recommended Citation Wie, John F.; Wolf, Patrick J.; Cowen, Joshua M.; Fleming, David J.; and Lucas-McLean, Juanita, "e MPCP Longitudinal Educational Growth Study Second Year Report" (2009). School Choice Demonstration Project. 50. hps://scholarworks.uark.edu/scdp/50

Welcome message from author
This document is posted to help you gain knowledge. Please leave a comment to let me know what you think about it! Share it to your friends and learn new things together.
Transcript

University of Arkansas, FayettevilleScholarWorks@UARK
School Choice Demonstration Project Education Reform
3-1-2009
The MPCP Longitudinal Educational GrowthStudy Second Year ReportJohn F. WitteUniversity of Arkansas, Fayetteville
Patrick J. WolfUniversity of Arkansas, Fayetteville, [email protected]
Joshua M. CowenUniversity of Arkansas, Fayetteville
David J. FlemingUniversity of Arkansas, Fayettevile
Juanita Lucas-McLeanWestat
Follow this and additional works at: https://scholarworks.uark.edu/scdp
Part of the Education Policy Commons, Public Policy Commons, and the Social PolicyCommons
This Report is brought to you for free and open access by the Education Reform at ScholarWorks@UARK. It has been accepted for inclusion in SchoolChoice Demonstration Project by an authorized administrator of ScholarWorks@UARK. For more information, please contact [email protected],[email protected].
Recommended CitationWitte, John F.; Wolf, Patrick J.; Cowen, Joshua M.; Fleming, David J.; and Lucas-McLean, Juanita, "The MPCP LongitudinalEducational Growth Study Second Year Report" (2009). School Choice Demonstration Project. 50.https://scholarworks.uark.edu/scdp/50

The MPCP Longitudinal Educational Growth Study
Second Year Report
John F. Witte
Patrick J. Wolf
Joshua M. Cowen
David J. Fleming
Juanita Lucas-McLean
SCDP Milwaukee Evaluation Report #10
March 2009

The University of Arkansas
was founded in 1871 as the flagship institution of higher education for the state of Arkansas.
Established as a land grant university, its mandate was threefold: to teach students, conduct research, and perform service and outreach.
The College of Education and Health Professions established the Department of Education Reform in 2005. The department’s mission is to advance education and economic development by focusing on the improvement of academic achievement in elementary and secondary schools. It conducts research and demonstration projects in five primary areas of reform: teacher quality, leadership, policy, accountability, and school choice.
The School Choice Demonstration Project (SCDP), based within the Department of Education Reform, is an education research center devoted to the non-partisan study of the effects of school choice policy and is staffed by leading school choice researchers and scholars. Led by Dr. Patrick J. Wolf, Professor of Education Reform and Endowed 21st Century Chair in School Choice, SCDP’s national team of researchers, institutional research partners and staff are devoted to the rigorous evaluation of school choice programs and other school improvement efforts across the country. The SCDP is committed to raising and advancing the public’s understanding of the strengths and limitations of school choice policies and programs by conducting comprehensive research on what happens to students, families, schools and communities when more parents are allowed to choose their child’s school.

The MPCP Longitudinal Educational Growth Study Second Year Report
John F. Witte
Patrick J. Wolf
Joshua M. Cowen
David J. Fleming
Juanita Lucas-McLean
SCDP Milwaukee Evaluation Report #10March 2009
School Choice Demonstration Project Department of Education Reform
University of Arkansas 201 Graduate Education Building
Fayetteville, AR 72701
479-575-6345
http://www.uark.edu/ua/der/SCDP/Research.html

MPCP Longitudinal Educational Growth Study Second Year Report

MPCP Longitudinal Educational Growth Study Second Year Report
CONTENTS:
EXECUTIVE SUMMARY . . . . . . . . . . . . . . . . . . . . . . . . . . . . . . . . . . . . . . . . . . . . . . . . . . 1
INTRODUCTION . . . . . . . . . . . . . . . . . . . . . . . . . . . . . . . . . . . . . . . . . . . . . . . . . . . . . . . . 3
STUDENT ACHIEVEMENT GAINS: 2006 to 2007 . . . . . . . . . . . . . . . . . . . . . . . . . . . . 6
SCHOOL SWITCHING, SECTOR SWITCHING, AND STUDY ATTRITION . . . . . . . 18
SUMMARY AND CONCLUSIONS . . . . . . . . . . . . . . . . . . . . . . . . . . . . . . . . . . . . . . . . 22
APPENDIX A: Additional Tables . . . . . . . . . . . . . . . . . . . . . . . . . . . . . . . . . . . . . . . . . 24
APPENDIX B: Constructing the Sample for Study . . . . . . . . . . . . . . . . . . . . . . . . . 27

MPCP Longitudinal Educational Growth Study Second Year Report

MPCP Longitudinal Educational Growth Study Second Year Report
1March 2009
EXECUTIVE SUMMARY
This is the second year report in a five-year evaluation of the Milwaukee Parental Choice Program (MPCP). This program, which began in 1990, provides government-funded vouchers for low-income children to attend private schools in the City of Milwaukee. The maximum voucher amount in 2007-08 was $6,607, and approximately 20,000 children use a voucher to attend either secular or religious private schools. The MPCP is the oldest and largest urban educational voucher program in the United States. This evaluation was authorized by Wisconsin Act 125 enacted in 2005.
The general purposes of the evaluation are to analyze the effectiveness of the MPCP in terms of longitudinal student achievement growth and grade attainment, dropping out, and graduating from high school. The former will be primarily accomplished by measuring and estimating student growth in achievement as measured by the Wisconsin Knowledge and Concepts Examinations (WKCE) in math and reading in grades three through eight over a five-year period. The latter will be accomplished by following the 2006-07J12
and ninth grade cohorts over a five-year period or longer. The general research design consists of a comparison between a random sample of MPCP students and a matched sample of Milwaukee Public School (MPS) students.
The February 2008 baseline report (Witte et al. 2008) presented sample means and standard deviations of student test scores in math and reading subjects on the November 2006 WKCE tests. In this Year 2 report, we present results from the November 2007 WKCE tests as the first measures of student achievement growth in MPCP relative to a matched MPS sample. We provide varying descriptive statistics comparing test score means and distributions for math and reading for 2006-07 and 2007-08 for each sample. We also analyze achievement growth using varying multivariate techniques and models. The primary finding in all these comparisons is that there is no overall statistically significant difference between MPCP and MPS student achievement growth in either math or reading one year after they were carefully matched to each other. Average achievement growth in the MPCP panel tended to be somewhat higher than average achievement growth in the MPS panel, especially in math, but those differences failed to reach the normal 95 percent certainty level for statistical significance.

MPCP Longitudinal Educational Growth Study Second Year Report
2 March 2009
We also examine students who switched between schools and between the MPCP and MPS sectors. Considerably more MPS students switched schools from October 2006 to October 2007 than students in the MPCP. However, over the year more MPCP students switched to MPS than MPS students switched to become voucher students. Student switching between schools was incorporated in some of our achievement gain estimates and always predicted lower achievement growth.
Finally, we provide a preliminary assessment of missing cases, defined as students we could not locate in the second year of the study. Approximately nine percent of the total samples drawn in 2006-07 could not be located. This number is considerably below our initial assumption of 20 percent when we conceived sample sizes and the need to refresh the samples. A somewhat greater percentage of MPS students (11%) than MPCP students (7%) were lost. There were few discernable differences between missing and non-missing students on baseline test scores or demographic variables. Further, in examining missing students, there were almost no differences in student characteristics between those missing from the MPCP or the MPS panels.
Throughout the report, we describe a range of cautions and caveats, with the most important being that this is only the second year of a five-year study, and that student achievement trajectories often take time to change. Thus, while at the present time in terms of achievement as measured by one year of achievement growth we conclude that there is no significant difference overall between MPS students and MPCP students, this result may change in future analyses.
This report and its companion reports continue a series of annual reports on the Milwaukee Parental Choice Program (MPCP) that will be conducted by the School Choice Demonstration Project (SCDP). An initial draft of this report was greatly improved based on comments from the SCDP Research Advisory Board and research team, particularly David Figlio of Northwestern University and Paul Peterson of Harvard University. All remaining errors are the responsibility of the authors alone.
This ongoing research project is being funded by a diverse set of philanthropies including the Annie E. Casey, Joyce, Kern Family, Lynde and Harry Bradley, Robertson, and Walton Family Foundations. We thank them for their generous support and acknowledge that the actual content of this report is solely the responsibility of the authors and does not necessarily reflect any official positions of the various funding organizations, the University of Arkansas, the University of Wisconsin, the University of Kentucky, or Westat, Inc. We also express our deep gratitude to MPS, the private schools in the MPCP, and the state Department of Public Instruction for willing cooperation, advice, and assistance.

MPCP Longitudinal Educational Growth Study Second Year Report
3March 2009
INTRODUCTION
This is the second year report in a five-year evaluation of the Milwaukee Parental Choice Program (MPCP). This program, which began in 1990, provides government-funded vouchers for low-income children to attend private schools in the City of Milwaukee. The maximum voucher amount in 2007-08 was $6,607, and approximately 20,000 children now use a voucher to attend either secular or religious private schools. The MPCP is the oldest and largest urban educational voucher program in the United States. This evaluation was authorized by Wisconsin Act 125 enacted in 2005.
The general purposes of the evaluation are to analyze the effectiveness of the MPCP in terms of longitudinal student achievement growth and grade attainment, dropping out, and graduating from high school. The former will be primarily accomplished by measuring and estimating student growth in achievement as measured by the Wisconsin Knowledge and Concepts Examinations (WKCE) in math and reading in grades three through eight over a five-year period. The latter will be accomplished by following the 2006-07 eighth and ninth grade cohorts over a five-year period or longer.1 The general research design consists of a comparison between a random sample of MPCP students and a matched sample of Milwaukee Public School (MPS) students. The procedures for obtaining that sample are briefly discussed in the next section and described in detail in Appendix B.
In the first year report, we described baseline test scores in a number of ways. The results revealed, by design, very similar baseline scores for the MPCP and matched MPS samples on the WKCE math and reading tests. The similarity was one indicator of the success of our matching algorithm. In this report, we present data on the growth in student achievement between 2006-07 and 2007-08. We caution readers that these data are far from conclusive in terms of the final outcomes of this evaluation. Evaluations now routinely cover a number of years, not just one, especially if growth in achievement is the focus of the evaluation. These “value-added” models are being used to evaluate school and even classroom success in affecting student achievement. Thus, we hope to emulate and improve upon these studies over the next three years. Further, while the literature on prior voucher programs is admittedly both controversial and has come to divergent conclusions as to the success of vouchers, some studies indicate that the impact of attending a private school may take a number of years to become apparent (Greene, Peterson, and Du 1999; Rouse 1998).
To begin our evaluation of achievement differences between the two samples, we first provide a range of descriptive statistics in terms of achievement growth. These include measures of central tendency, such as
1 Because there is no current research on student attainment in voucher studies in the United States, we hope to be able to obtain further research funding to continue tracking these students beyond high school. This is extremely important because substantial research indicates the great advantages that accrue to students who graduate from high school, experience post-secondary education, and attain a college degree.

MPCP Longitudinal Educational Growth Study Second Year Report
4 March 2009
average gains by grade, and comparisons of the entire distribution of scores using frequency graphs. We also use a simple but intuitively appealing method to describe the chances that MPCP students did better than MPS students in the prior year. This method of ordinal data analysis compares the growth of each student in the MPCP sample to that of each student in the MPS group, and results in the calculation of a Somer’s d statistic, a nonparametric measure that can be considered the difference in the probability that a student from one sector will have gained more than a student in the other sector from baseline to the first year follow-up.2
More elaborate comparisons are made using multivariate methods in which we control for the prior test score of a student in 2006-07 and a number of other demographic and independent variables. Our objective is to determine if the coefficient for the variable indicating which sector the student is in (MPCP or MPS) is statistically significantly different from zero, thereby allowing us to reject the “null hypothesis” of zero difference in gains across the two school sectors. Although these models are very standard in analyses of this sort, we caution readers against several possible problems. The first, mentioned above, is drawing summative conclusions from only one year of achievement growth. The second is that, especially in the base year, we have significant numbers of missing test scores, with relatively more occurring in the MPCP sample. One reason for this is that prior to the passage of Act 125 and this evaluation, the private schools in the MPCP were not required to test students or report the results of those tests. Some private schools had no testing programs and most used non-WKCE norm-referenced tests. Thus, these challenges prevented us from testing all sampled students during the same November/December 2006 test window in which MPS students were tested. What this means is that the final analysis after five years will have the majority of students with a base year of 2006-07, but some students with a base year of 2007-08.
A final problem—which is characteristic of all student longitudinal studies, but even more so for those conducted in high poverty areas—is student mobility. Mobility occurs between schools, between school districts, and through dropping out of school altogether. Mobility poses several problems and raises a number of issues. First, either dropping out of school or moving to another school district, in Wisconsin or in another state, effectively ends the acquisition of test and other data for a student. This study attrition reduces sample sizes and could introduce biased results if the missing cases are dissimilar on relevant variables depending on whether they are missing from the MPCP or the MPS panel. We examine this issue for the first two years in this report. In addition, to combat the erosion of “study power” due to shrinking longitudinal panels, we have “refreshed” the samples in both 2007-08 and 2008-09 by adding in another randomly selected cohort of third grade students in MPCP matched with similar students in MPS. As with students missing test scores in 2006-07, these newer panel members will experience shorter periods of achievement growth than the original panelists, assuming that data collection ends as planned
2 This method is explicitly suggested in Ballou (2008) to compare differences between students with different teachers rather than different school sectors.

MPCP Longitudinal Educational Growth Study Second Year Report
5March 2009
in 2011-12. However, these additional students will allow us to maintain suitable sample sizes assuming attrition levels continue to be at or lower than the assumptions in our original research design.3
Second, because this is not a controlled experiment, some students switch from the public to the private sector or vice versa. Although we can capture these sector switchers and test them, one important research issue is the way we account for them in the long term. Should, for example, a student who begins in the MPCP sample, but after several years moves to a public school, be counted for all the years as a MPCP student? That is what is done in most medical or drug clinical trials. Another way to account for that student would be to simply drop the student from the analysis once the move occurs and only estimate achievement growth for those years for which the student was in the MPCP school. Alternatively one could use a “dosage” measure where the student stays in the study through all years, but the student is weighted in proportion to their years in the MPCP.4 We do not have to deal with sector-switching concerns this year, since fall testing meant that any students who switched sectors over the summer experienced nearly all of their education for the previous year in their original school sector. In future reports, we will employ the methodologically best approach for handling sector-switchers for our primary analysis and attempt to replicate our findings using the other valid approaches as a test of the robustness of our main results.5
A final challenge posed by students switching schools and/or sectors is the growing body of literature that switching schools has a negative effect on student achievement (e.g. Hanushek, Kain, and Rivkin 2004). This raises the issue of whether we should control in our growth estimating models for the fact that some students switch schools during the year in which growth is being estimated. One could argue that this switching is really part of the program effect itself. To reach this conclusion one would assume that the schools themselves are the primary reason for switching. On the other hand, if alternative reasons are the primary cause, then switching schools should be included as an external control in the estimation equation. Research indicates that switching schools has more to do with changes in family life than in school performance or parental dissatisfaction with that performance (Witte 2000; Rumberger 2003; Lavertu and Witte 2008). Therefore, we control for non-structural “discretionary” school switching in our estimation models but do not control for the structural switches required when students complete the policy-determined grade-range of their existing school. Because both sample attrition and school-switching introduce complications into our analysis, we include a section on these issues in this report. We are also making every effort to follow students in all categories for five years, measuring their school
3 The good news reported below is that attrition between years one and two was about half of our assumed 20 percent.
4 The rationale for these approaches would be that by switching sectors one is effectively replacing the treatment with the comparison and that it would be inappropriate to attribute what would be the effects of MPS education to MPCP schools.
5 As with all significant methodological issues that we encounter, we will obtain guidance from our Research Advisory Board to help us determine which methods to use for the primary analysis and sensitivity tests.

MPCP Longitudinal Educational Growth Study Second Year Report
6 March 2009
attendance through a number of indicator variables. We will devote more space in future reports to analyses of these conditions.
The report to follow has three basic sections. The first analyzes achievement gains from 2006 to 2007; the second describes switching and sample attrition; and the last offers a summary and a set of current conclusions. Appendix A provides several additional data tables, and Appendix B describes our matching algorithm in considerable detail.
STUDENT ACHIEVEMENT GAINS: 2006 to 2007
The February 2008 baseline report (Witte et al. 2008) presented sample means and standard deviations of student test scores in math and reading subjects on the November 2006 WKCE tests. We intended these statistics to provide benchmark measures of achievement current to the onset of the longitudinal study, and to serve as indicators for the success of our sample selection methodology. In this Year 2 report, we present results from the November 2007 WKCE tests as the first measures of student achievement growth in MPCP relative to a matched-MPS sample.
Average Math and Reading Achievement and Growth
The baseline report detailed the sample selection methodology that provides valid comparisons of MPS and MPCP students. In brief, we used students’ neighborhood location, baseline test scores, and demographic information to construct MPS and MPCP samples that were demonstrably similar in terms of observable characteristics. As importantly, we argued that the matching algorithm—in particular the emphasis on neighborhood location—accounts for unobserved characteristics that may bias comparisons of student outcomes between the two sectors. We supported this assertion in part through rich survey data collected after the matching process, which showed very similar patterns of home environment, parental education, and educational experiences for students and their parents from the same neighborhoods, regardless of whether the students were in the MPCP or the MPS. See the baseline report (Witte et al. 2008) for these survey results and Appendix B for additional detail on the matching methodology.
Because we are confident that our matching process largely eliminated differences between the samples on factors systematically influencing student achievement, we believe that simple comparisons of Year 2 mean achievement between the sectors is a valid statistical indication of any outcome differences in 2007-2008 between students learning in the MPS and MPCP sectors. Tables 1 and 2 provide weighted mean WKCE scale scores for both the 2006-2007 and 2007-2008 academic years for students in grades four

MPCP Longitudinal Educational Growth Study Second Year Report
7March 2009
through eight.6,7 These students were in grades three through seven at baseline and are the cohort of study participants for whom we have two years of WKCE achievement scores at this point in the study. We refreshed the baseline sample with a new cohort of students who were in grade three in 2007-2008 and have provided mean scores for that year and grade as the refreshed sample baseline.8 Students in grade nine at baseline (2006-2007) did not take the WKCE that year but did so in grade 10 in 2007-2008. Although no subsequent scores will be available for these students, we provide a snapshot in time of the achievement scores for these students because they were matched via our algorithm.
Because of variations in grade-level ranges in scale scores that are purposely built into the test design, comparing average group-level scale scores across grades is not appropriate. For example, we cannot say that MPCP fifth graders are doing better than MPS fourth graders simply because the mean is higher for fifth graders. The comparison must be relative: a measure of the extent to which students gained in achievement between the years. The important point, however, is that the range of possible scores for each grade is the same for MPS and MPCP, so cross-sector comparisons within grades are valid.
Tables 1 and 2 indicate a few systematic differences between the two sectors using difference-in-means tests—especially in early grades. For math scores, MPCP fourth graders had a lower average score in 2007, although the difference in growth is not statistically significant. There is a difference in math change scores favoring the MPCP students in grades seven and eight. Eighth graders in math in both sectors actually had zero gain or even net loss from the previous year. We believe this is a feature of the testing instrument itself (it occurs for both MPS and MPCP students) and are currently studying the issue for a more elaborate explanation. On the reading exam (Table 2), only the average of achievement in 2007-08 for fifth and eighth graders was statistically significantly different between the two sectors. The fifth grade scores favored MPS students, while the eighth grade scores favored MPCP students. There are no significant sector effects for growth in reading achievement in any grade.
6 Scale scores are scores generated from basic data on the number of correct answers on a multiple choice (or other) standardized test. They fall within ranges for each grade that increase in each higher grade as tests become more complex (and the variance between students increases). They are approximately normally distributed and are integer-level measures. They are designed to measure the development of a child in each subject area and are calculated using a psychometric process called Item Response Theory or IRT.
7 Weights were created to adjust for missing test scores. The results using unweighted scores were nearly identical to those using the weighted scores. Of all the comparisons in this report only one statistic was significant in the weighted data that was not significant in the unweighted data. However, accepted research protocols call for use of weighted data in this research design. For information regarding the response weights used in our analysis, see Appendix B.
8 Demographic information about the new third grade samples is in Appendix Table A-1.

MPCP Longitudinal Educational Growth Study Second Year Report
8 March 2009
Table 1: Mean Math Achievement by Grade, 2006-7 to 2007-8
Grade2007 Group 2006-07 2007-08 Change
Mean s.e. (diff ) Mean s.e.
(diff ) Mean s.e. (diff.)
3 MPS Matched - - 387.0 - -MPCP - - 376.3 - -(Difference) - - (10.7)*** 1.7 - -
4 MPS Matched 393.0 429.2 36.2MPCP 383.2 418.5 35.3(Difference) (9.8)** 4.1 (10.7)** 4.3 (0.9) 3.5
5 MPS Matched 426.1 444.4 18.3MPCP 418.5 439.4 20.9(Difference) (7.6)* 4.3 (5.0) 4.7 (-2.6) 3.1
6 MPS Matched 446.2 465.8 19.7MPCP 439.8 460.5 20.7(Difference) (6.4)* 3.7 (5.3) 3.8 (-1.0) 2.8
7 MPS Matched 473.9 491.4 17.5MPCP 468.3 491.3 23.0(Difference) (5.6) 3.5 (0.1) 3.4 (-5.6)** 2.8
8 MPS Matched 494.7 488.0 -6.6MPCP 494.6 495.2 0.6(Difference) (0.1) 4.1 (-7.1) 5.3 (-7.2)** 3.4
10 MPS Matched - - 517.8 - -MPCP - - 509.7 - -(Difference) - - (8.1)*** 1.4 - -
Stars indicate MPS different from MPCP statistics at ***p<0.01, **p<0.05, *p<0.10, based on a two-tailed T-Test. Figures include
only students with valid test scores in both 2006-07 and 2007-08 academic years. Mean changes may not sum perfectly due to
rounding. Response weights were used for those in grades 4-8 in 2007.

MPCP Longitudinal Educational Growth Study Second Year Report
9March 2009
Table 2: Mean Reading Achievement by Grade, 2006-7 to 2007-8
Grade 2007 Group 2006-07 2007-08 Change
Mean s.e. (diff ) Mean s.e.
(diff ) Mean s.e. (diff )
3 MPS Matched - - 420.0 - -MPCP - - 416.0 - -(Difference) - - (4.0) 3.2 - -
4 MPS Matched 433.2 438.0 4.8MPCP 429.9 439.3 9.4(Difference) (3.3) 3.6 (-1.3) 4.5 (-4.6) 3.3
5 MPS Matched 439.7 448.1 8.4MPCP 435.1 439.4 4.3(Difference) (4.6) 4.6 (8.7)* 4.8 (4.1) 3.5
6 MPS Matched 440.3 453.0 12.7MPCP 440.5 457.0 16.5(Difference) (-0.3) 4.4 (-4.0) 4.5 (-3.8) 3.6
7 MPS Matched 467.3 475.4 8.1MPCP 465.0 475.3 10.4(Difference) (2.3) 4.3 (0.1) 4.5 (-2.3) 3.4
8 MPS Matched 468.2 480.8 12.6MPCP 476.0 492.9 16.9(Difference) (-7.8)* 4.7 (-12.2)** 4.9 (-4.4) 3.7
10 MPS Matched - - 493.0 - -MPCP - - 490.6 - -(Difference) - - (2.4) 3.6 - -
Stars indicate MPS different from MPCP statistics at ***p<0.01, **p<0.05, *p<0.10, based on a two-tailed T-Test. Figures include
only students with valid test scores in both 2006-07 and 2007-08 academic years. Mean changes may not sum perfectly due to
rounding. Response weights were used for those in grades 4-8 in 2007.
For simple comparison purposes, we present 2007-08 achievement data for students in the state of Wisconsin and in Milwaukee Public Schools in Appendix Tables A-2 and A-3. The tables provide the means and standard deviations for both all students and only those who are economically disadvantaged. As is apparent, the 2007-08 test scores from the MPCP sample and matched MPS sample are below the state averages. The MPCP and MPS-Matched samples are somewhat behind the MPS district means in the early grades. MPS-Matched and MPCP students generally scored lower than economically disadvantaged students in the Milwaukee school district in the lower grades, but outpaced the disadvantaged students in Milwaukee’s public schools in higher grades. This is consistent with the baseline

MPCP Longitudinal Educational Growth Study Second Year Report
10 March 2009
results in 2006-07. However, what is critical in this report is growth in student achievement, which is the focus of the remainder of this report.
The Distribution of Math and Reading Growth
It is possible that similar mean achievement levels, or changes in those levels, could mask differences at different levels of achievement. For example, high achieving MPS students could outperform their matched MPCP counterparts, while the opposite takes place at the bottom of the distribution. In computing the means, these would cancel each other out for no effect. We demonstrate that is not the case graphically in Figures 1 and 2. The figures are Kernel densities, which are similar to histograms and represent estimates of the underlying probability distributions of the change scores reported in the second to last columns of Tables 1 and 2. These figures provide perhaps the most concise comparisons of academic achievement between similar MPS and MPCP students currently available. They indicate that mean growth is not only very similar between the sectors at this early point in our study, but is also distributed in much the same way. In other words, similar frequencies of MPCP and MPS students were among the highest and lowest observed scores.9
Figure 1: November 2007 Math Growth for All Students in Grades 4-8
9 We also checked extensively for differential regression to the mean effects between the two sectors by analyzing achievement growth for students with 2006-07 baseline scores that were either very low or very high. We found no substantial evidence of differential effects by sector. Results are available upon request from the authors.

MPCP Longitudinal Educational Growth Study Second Year Report
11March 2009
Figure 2: November 2007 Reading Achievement for All Students in Grades 4-8
We use a method of ordinal data analysis to develop this point further. This method compares the gain score (by subject) for each MPCP student in a given grade to the gain score of each MPS student in the same grade. For each comparison, if the MPCP student had higher growth, they were given a +1; if the MPS student did better, they were given a -1; if they were tied, a score of 0 was recorded. The results are then summed across all comparisons and the result is divided by the number of comparisons. The result is Somers’ d, a nonparametric measure that represents the difference between the probability that a given MPCP student will gain more than a MPS student and the probability of the opposite occurring. We also conducted the analysis on all grades pooled, since growth scores are on the same scales for each grade.10 Table 3 reports the results of this analysis. Positive Somers’ d coefficients favor MPCP students.
10 See Reynolds (1977) for a further description of this procedure.

MPCP Longitudinal Educational Growth Study Second Year Report
12 March 2009
Table 3: Somers’ d Statistics for Math and Reading Growth: 2006-7 to 2007-8
Subject/Grade Somers’ d Coeff. (s.e.)Math 4 -0.02 (0.05)Math 5 0.04 (0.05)Math 6 -0.01 (0.05)Math 7 0.07 (0.05)Math 8 0.12 (0.05)**Math All Grades 0.04 (0.02)*Reading 4 0.05 (0.05)Reading 5 -0.07 (0.05)Reading 6 0.05 (0.05)Reading 7 0.02 (0.05)Reading 8 0.04 (0.05)Reading All Grades 0.02 (0.02)
***p<0.01, **p<0.05, *p<0.10, two-tailed. Results unweighted
The coefficients in Table 3 should be interpreted as follows: for example, the probability that an MPCP fourth grader gained more than an MPS fourth grader in Math is .02 (or 2 %) smaller than the probability of the reverse occurring. The probability that an MPCP seventh grader gained more than an MPS seventh grader in math is 0.07 (or 7%) higher than the probability of the reverse occurring. These are very small figures, and—more importantly—only one of the grade-specific coefficients (eighth grade math) in Table 3 is statistically significant, indicating that the probability of an MPCP eighth grader outgaining an MPS eighth grader in math was 12 percent higher than the probability of the reverse occurring. Still, the dominant finding of no significant grade-level differences in achievement growth between the MPCP and MPS students comports with the findings in Table 1. Because of the size of the eighth grade effect, there is a barely significant overall advantage for MPCP students in all math scores at the 90% level of certainty. There are no significant differences for any grade, or overall in reading.
Models of Math and Reading Achievement
We are confident that the strength of our matching algorithm allows us to present the above results as valid comparisons of MPCP and MPS academic achievement growth in Year 2. However, even in the context of a random assignment study—considered by many evaluators to be the “gold standard” for internal validity—there is still analytical benefit to more elaborately modeling achievement as a function of observable student characteristics (e.g. Wolf et al. 2007, p. 33). In particular, the addition of a prior test

MPCP Longitudinal Educational Growth Study Second Year Report
13March 2009
score as a covariate can improve the precision of the estimate of a program effect. We formulate a simple model of Year 2 achievement conditioned on prior achievement, public/private school status, and student grade level:
(eq1) Y2007, i = β0 + β1Ci + β2Y2006, i + β3Gi + εi
In this equation β1 represents the impact of MPCP participation (C=1), β2 is the impact of baseline achievement, and β3 represents a vector of grade-specific contributions to the intercept (especially important in this context because the dependent variable by design increases by grade). With this specification, the contribution of the baseline test to the estimate of the second year test is unconstrained in that β2 can take any value.11
Although the prior achievement variable is perhaps the most important covariate, it is not the only conceivable control variable relevant to a model of student achievement. We formulate Equation 2 as:
(eq2) Y2007, i = β0 + β1Ci + β2Y2006, i + β3Gi + β4Xi + εi
where β4 represents the impact of a set of student-level characteristics, Xi, such as gender and race/ethnicity.
Previous work in different educational contexts largely confirms a negative impact of school switching on student outcomes. As elaborated below, in the context of school choice in Milwaukee, MPS students switched schools within the MPS system at a far greater rate than MPCP students did within the MPCP sector. Because school switching took place after our matching algorithm, we could not control for it in the original design, and its potential negative impact is important to check in light of the disproportionate switching rate in MPS. For that reason, we formulate Equation 3 as:
(eq3) Y2007, i = β0 + β1Ci + β2Y2006, i + β3Gi + β4Xi + β5Si + εi
where β5 represents the impact of switching schools within sectors (Si =1) for non-structural reasons—in other words, for students not in grade six in 2007 (students in grade nine in 2007 are not in the model because they do not take the WKCE). See Table A-4 in the Appendix for descriptive sample statistics for the covariates used in Equations 1-3.
Table 4 provides estimates of the models specified in Equations 1-3. The Model 1 column for math and reading reports results from an estimate of Equation 1. The Model 2 column corresponds to estimates of Equation 2, and so on. The results in Table 4 tell the same story as the more simple comparisons
11 Some researchers have used differences in test scores as the dependent variable by subtracting the first year test score from the second. However, if we want to model achievement growth controlling for prior achievement, this has the effect of constraining the effect of prior achievement to 1.0, which empirically is not the true parameter. Thus, we favor the estimation model in Equation 1.

MPCP Longitudinal Educational Growth Study Second Year Report
14 March 2009
presented above. Namely, there is no statistically significant average difference between MPCP and MPS students in growth in math or reading achievement. In Models 1 and 2, the effect of being an MPCP student on achievement growth is positive but not statistically significant. The Model 2 and 3 columns indicate that this result appears robust to controls for grade, race, gender, and, most importantly, prior academic achievement. Moreover, as the Model 3 column indicates, the approximately similar growth rates between the two sectors is not driven by the disproportionate rate of school switching among MPS students. These results are all the more supported by the estimates of the other covariates on achievement. African-American and Hispanic students score lower on average than their white counterparts—a widespread phenomenon in education research. Consistent with previous research (e.g. Hanushek, Kain, and Rivkin 2004; Lavertu and Witte 2008) there is a strong negative effect associated with school switching for both math and reading achievement.
Table 4: Growth Models of Math and Reading Achievement, 2006-7 to 2007-8
MATH READINGModel 1 2 3 1 2 3
Est. (s.e.)
Est. (s.e.)
Est. (s.e.)
Est. (s.e.)
Est. (s.e.)
Est. (s.e.)
MPCP 2006
1.43 (1.35)
1.12(1.34)
0.02(1.37)
1.77(1.48)
1.59(1.48)
0.08(1.50)
2006 Score 0.78***(0.02)
0.75***(0.02)
0.75***(0.02)
0.76***(0.02)
0.74*** (0.02)
0.74***(0.02)
Native Amer.
-4.39(7.22)
-4.64 (7.15)
-9.00(15.63)
-8.71(14.80)
Asian -5.26(4.92)
-5.38 (4.92)
2.17(3.97)
1.95 (3.95)
Black -13.63***(2.10)
-13.25***(2.09)
-8.13***(2.24)
-7.63***(2.23)
Hispanic -7.43***(2.21)
-7.36***(2.19)
-2.90(2.39)
-2.85(2.38)
Female 2.02(1.37)
1.84(1.37)
1.18(1.49)
0.94(1.48)
Switch Sch.
-7.13***(2.68)
-9.97***(2.84)
Intercept 119.74***(8.31)
140.39***(8.98)
142.62***(8.99)
109.84***(9.66)
122.26***(10.25)
125.74***(10.27)
R-sq 0.62 0.63 0.63 0.55 0.55 0.56F 506.97*** 290.41*** 268.98*** 317.88*** 178.13*** 166.01***N 2,510 2,510 2,510 2,501 2,501 2,501
***p<0.01, **p<0.05, *p<0.10, two-tailed. All models also include indicator variables for grades 5-8, with grade 4 as the reference
category; Race variables are indicator variables with “White” as the reference category. Response weights were used. Robust standard
errors are in parentheses.
MPCP Longitudinal Educational Growth Study Second Year Report
15March 2009
It is possible, however, that in a city as diverse as Milwaukee, and in a program as large as the MPCP, different groups of students may be affected differently by the choice program. To explore the possibility of differential effects of MPCP by race or gender, we formulate
(eq4) Y2007, i = β0 + β1Ci + β2Y2006, i + β3Gi + β4Xi + β5Si + β6 (MPCP*Race) + εi
and
(eq5) Y2007, i = β0 + β1Ci + β2Y2006, i + β3Gi + β4Xi + β5Si + β6 (MPCP*Female) + εi
where β6 represents the differential effect of a particular racial/ethnic classification in MPCP (equation 4)12 or the differential effect of being a girl in MPCP (equation 5). Table 5 presents these results. The Model 4 column corresponds to Equation 4, and the Model 5 column corresponds to Equation 5. For reading, the Model 4 estimates are consistent with those reported in Table 4: there appears to be no direct effect of MPCP participation, and no differential effect by race. There is a significant MPCP/Native-American interaction effect in math. However, we caution readers that this effect is based on only five Native-American students in the MPCP sample. The estimate of Model 5 for reading tells an interesting story. Although there is no overall direct effect of gender on test-score gains (Model 3, Table 4), there is a negative differential effect for girls in MPCP: girls in MPCP appear to be gaining less in reading than girls in MPS. However, this negative impact on girls’ reading score gains in MPCP is more than offset by a positive impact, relative to MPS, on boys’ reading score gains.13 Table 6 presents predicted reading outcomes separately by sector and gender (other covariates held at their means) to further illustrate this slight but statistically significant difference. There were no significant gender/sector interaction effects for math.14
12 Race in Equation 4 actually represents a vector of race dummies: Black, Hispanic, Asian, and Native American, where white is the reference group.
13 Because the MPCPxFemale interaction combines with the MPCP and Female coefficients to represent this differential effect, the coefficient on MPCP in Model 5 should be interpreted as the effect of MPCP on reading for boys.
14 Some school voucher evaluations that include various subgroups in the analysis add a statistical adjustment to the significance levels of the estimates to reduce the risk of false discoveries merely due to chance (e.g. Wolf et al. 2007 p. 49; Wolf et al. 2008, p. 38). When the Benjamini-Hochberg sequential adjustment (Schochet 2007; Benjamini and Hochberg 1995) is applied to the subgroup results in our study, the negative effect of the MPCP on reading achievement growth for girls loses statistical significance, suggesting it may be a false discovery. The finding of a positive effect of the MPCP on reading achievement growth for boys remains significant after adjustments for multiple comparison, as does the negative effect of the MPCP on math achievement growth for Native Americans. Because there is no clear scholarly consensus regarding the requirement to adjust significance levels to account for multiple comparisons, and because these subgroup findings are highly preliminary in any case, we caution readers against drawing strong conclusions from these results unless they are confirmed in subsequent analyses.

MPCP Longitudinal Educational Growth Study Second Year Report
16 March 2009
Table 5: Interacted Growth Models of Math and Reading Achievement, 2006-7 to 2007-8
MATH READINGModel 4 5 4 5
Est. (s.e.)
Est. (s.e.)
Est. (s.e.)
Est. (s.e.)
MPCP 2006 -4.57 (3.58)
0.49(2.12)
-2.25(3.96)
6.34***(2.34)
2006 Score 0.75***(0.02)
0.75***(0.02)
0.74***(0.02)
0.74***(0.02)
Native American 0.21 (6.86)
-4.69(7.15)
-9.87(17.38)
-9.61(14.63)
Asian -2.38 (4.81)
-5.39(4.92)
4.85 (5.16)
1.90(3.93)
Black -15.71*** (3.01)
-13.26***(2.09)
-9.45***(3.13)
-7.61***(2.22)
Hispanic -9.90***(3.19)
-7.35***(2.20)
-2.60(3.32)
-2.69(2.37)
Female 1.79 (1.37)
2.22(1.94)
0.96(1.48)
6.16***(2.07)
Switch Sch. -6.95**(2.69)
-7.10***(2.68)
-9.64***(2.87)
-9.53***(2.83)
MPCPxNativeAmer. -35.90***(7.95)
2.60 (33.33)
MPCPxAsian -7.58(10.77)
-7.27(7.88)
MPCPxBlack 5.60 (4.01)
4.07 (4.43)
MPCPxHisp 5.66(4.30)
-0.22(4.72)
MPCPxFemale -0.86 (2.74)
-11.50***(3.00)
Intercept 144.45***(9.15)
142.46***(9.03)
126.81*** (10.39)
122.89***(10.28)
R-sq 0.63 0.63 0.56 0.56F 233.37*** 248.29*** 125.63*** 154.78***N 2,510 2,510 2,501 2,501
***p<0.01, **p<0.05, *p<0.10, two-tailed. All models also include indicator variables for grades 5-8, with grade 4
as the reference category; Race variables are indicator variables with “White” as the reference category. Response
weights were used. Robust standard errors are in parentheses.

MPCP Longitudinal Educational Growth Study Second Year Report
17March 2009
Table 6: Predicted Reading Outcomes by Gender
MPCP MPS DifferenceGIRLS 456.2 461.4 -5.2***BOYS 461.6 455.2 6.4***
Outcomes calculated using results from Model 5 in Table 5.
Other values held at their mean.
Caveats
These results are limited in their explanatory power in several important ways. Nearly all concern missing data in some way or another. Unlike MPS (and other public school systems), no administrative or institutional sources exist as a single repository of demographic information for MPCP students. The extent to which we are able to include information on students’ race, gender, English Language Learning (ELL) status, disability status, and even free or reduced lunch participation in our analyses is determined by the extent to which more than one hundred different MPCP schools actually label students in those ways and are able to gather these data for participants in our study. Our research team has great experience with data collection in similar environments, and we believe that the data collection process meets or exceeds that in other such studies. However, missing data do exist, particularly for students in the MPCP sample. The race and gender variables are complete for more than 90 percent of MPCP students at Year 2, and essentially all students in MPS. We are confident in our ability to continue to “backfill” this information as the study progresses so that we will have close to 100 percent actual values on baseline demographic variables by the end of the study.
A potentially more serious data and analysis problem pertains to the differences between public and private schools in identifying and educating students with exceptional education needs. We have very little administrative data from MPCP schools on the number of exceptional education students. Our baseline survey results indicated that the parents of nine percent of MPCP students identified their child in this way. The results are closer to 20 percent for the MPS sample. Given these differences it is possible that private schools do not attract or retain exceptional education students, that private schools under-identify exceptional education students, or that public schools over-identify them. Thus the questions that remain for further analysis are: (1) Do private schools not educate as many exceptional education students as public schools, or do they simply not identify such students? (2) Do public schools over-identify exceptional education students? and (3) How much bias does this introduce in estimating achievement growth? We will be working on these issues by trying to better understand how public and private schools admit and identify exceptional education students. In future work, we hope to include exceptional education parameters in our estimation models and produce sensitivity analyses by assuming different patterns of identification. We should note, however, that we have carefully matched our MPCP and MPS panels of students on their test-score performance at baseline and that will accommodate starting achievement differences regardless of how students are labeled as exceptional education.

MPCP Longitudinal Educational Growth Study Second Year Report
18 March 2009
SCHOOL SWITCHING, SECTOR SWITCHING, AND STUDY ATTRITION
School and Sector Switching
As indicated above, some students in both MPS and MPCP switched schools between the baseline and Year 2 of the study. We anticipate this phenomenon at each stage of the study, in part due to the extensive set of school choice options available to all Milwaukee students. The first type of switching, within-sector switching, was included as a control variable specified in the final models above. As Table 7 indicates, this was largely an MPS phenomenon: 35 percent of MPS students switched schools and remained in MPS between baseline and Year 2. Only eight percent did so within MPCP. School switching can come in two forms, which we call “structural” and “non-structural” switching. Structural switching includes students who change schools mainly because their current grade was not available at their previous school. Although this can happen at various grade cut-points, the most common occur between elementary and middle school (typically fifth to sixth grade) and between middle school and high school (typically eighth to ninth grade). Non-structural switching occurs when students change schools for reasons unrelated to grade (e.g. a fourth grader moves to a new school despite the fact that her old school included fifth grade). Although both types of switching are thought to induce a potentially negative impact in the next immediate measure of achievement, it is non-structural switching that is most concerning, and it is for this reason that we include it in the models above. At the moment, we lack complete information about structural differences for all schools in MPS and MPCP, and so as a proxy for a full non-structural switching variable, we have temporarily excluded fifth-to-sixth and eighth-to-ninth grade school switchers from the non-structural count.
Table 7: Switching, by Sector and Type of Switch, 2006-07 to 2007-08
Switching Category MPS Matched (%)
MPCP (%)
Non-Switchers 1,510***(62.0)
1,898(75.1)
All Within Sector Switchers 856***(35.1)
198(7.8)
Structural 393*** (16.1)
108 (4.3)
Non-Structural 463*** (19.0)
90(3.6)
Between Sector Switchers 71***(2.9)
430(17.0)
Total Nonmissing N 2,437 2,526Stars indicate MPS different from MPCP statistics at ***p<0.01, **p<0.05, *p<0.10, based on
a a two-tailed T-Test. Structural switchers are students in grade 5 in 2006-07 and grade 6 in
2007-8, as well as those in grade 8 in 2006-07 and grade 9 in 2007-08. Missing cases do not
identify school in 2007. Although it seems reasonable to assume that these cases are inherently
mobile, we do not want to systematically assign them to the switching category. Thus, the
figures in Table 7 report only data on those for whom we have concrete school information.

MPCP Longitudinal Educational Growth Study Second Year Report
19March 2009
The second form of switching occurred when a student left his or her baseline sector for the other. Seventy-one students in the MPS matched sample at baseline moved to MPCP for Year 2. Far more (430) went from MPCP to MPS. Approximately half of the students who left MPCP for MPS did so in either the eighth or ninth grades. This is undoubtedly linked to a move to an MPS high school.
Because this type of switching involves moving from one administrative regime to the other, it is considerably more difficult to track such students over time. We were not able to track all MPS-to-MPCP switchers in time for testing in 2007, but have identified those for 2008. For MPCP-to-MPS switchers who moved in time for November 2007 testing, we obtained test data from MPS along with non-switching MPS matched panel members and included these results in the models estimated above. We believe, however, that some year-to-year switching occurs within a school year (e.g. a student moves to MPS from MPCP in January), and this may be an additional source of missing data within a given year of the study. We have explicitly omitted sector switching controls from the models above to avoid inferring an effect in one direction (MPCP to MPS) without current ability to make an inference about the effect in the other (MPS to MPCP). Future models should account for this and will need to address the issues involved in sector switching discussed in the introduction.
As the study progresses, and as a matter of procedure, at the start of each academic year, we search for all students in each sector of our panel in the administrative databases of both sectors. The figures reported in Table 7 represent the switching status of these students. The table also includes both structural and non-structural sector switchers as defined above. Future analyses will continue to track these changes and assess (using surveys) why students are switching between schools and sectors. We hope to model these behaviors and include the results in our achievement estimates in more complex ways in future reports. For now, we conclude that MPS students switch schools at considerably higher rates than MPCP students, but that MPCP students are more likely to switch sectors than are MPS students.
Study Attrition
Of the original 5,454 students in the combined MPS and MPCP panels, we were unable to locate 491 (9%) in Year 2. The rate is slightly higher for MPS students (11%) compared to students who began in our study in the MPCP (7%), but we believe these figures are comparable. Some of these students may have left Milwaukee entirely, while others may have entered independent charter schools or some other educational environment outside the scope of this report. We consider these students to be our first examples of study sample attrition, or missing cases. Study sample attrition is a hurdle for nearly all analyses, and our initial sample construction was designed in part to account for steady attrition. It is possible that there are cases that are missing for nonrandom reasons—that there are systematic differences between those students we “lose” and those who remain in the study. We would be particularly concerned if sample attrition differed in terms of test scores or demographic characteristics of students. Table 8

MPCP Longitudinal Educational Growth Study Second Year Report
20 March 2009
indicates that these concerns are not serious problems.15 Differences are due to the grade of the students. In particular, students who were in eighth or ninth grade at baseline make up 57 percent of all students missing from our Year 2 sample. Both grades could be transition grades and the point at which students begin dropping out of school. We will continue to try to locate these students through parental and student phone surveys and annual data base searches.
Table 8: Sample Attrition Statistics 2006-7 to 2007-8
Non-Missing Students
Missing Students
Average of Mean Baseline Math^ 451.5 446.0Average of Mean Baseline Reading^ 454.6 450.8% Female 53.8 52.4% White 8.5 9.2% Black 66.9 67.7 % Hispanic 21.1 19.1% Asian 3.1 2.9% Native Amer. 0.3 0.7% Baseline Grade 3 12.9*** 8.8% Baseline Grade 4 12.1 10.0% Baseline Grade 5 12.6* 10.0% Baseline Grade 6 12.6*** 7.3% Baseline Grade 7 11.5*** 6.9% Baseline Grade 8 9.9*** 18.3% Baseline Grade 9 28.5*** 38.7
^See Appendix Tables A-5 and A-6 for more information about these averages. Stars indicate Non-Attritors
different from Attritor statistics at ***p<0.01, **p<0.05, *p<0.10, based on a two-tailed T-Test.
Although Table 8 does not indicate differences between study attritors and non-attritors in achievement and demographic characteristics, such differences—if they existed—would only be problematic for inferences about MPCP effects on achievement growth if they systematically differed between the MPCP and MPS samples. Table 9 provides little evidence that this is the case. Among students we were not able to locate at Year 2, mean baseline reading and math scores were similar for those who began in MPS and those who began in MPCP.16 Missing MPS students were less likely to be white. There are some grade
15 See Appendix Table A-5 for mean test scores by grade comparisons for non-missing and missing students.
16 For mean baseline test scores by grade, see Appendix Table A-6.
MPCP Longitudinal Educational Growth Study Second Year Report
21March 2009
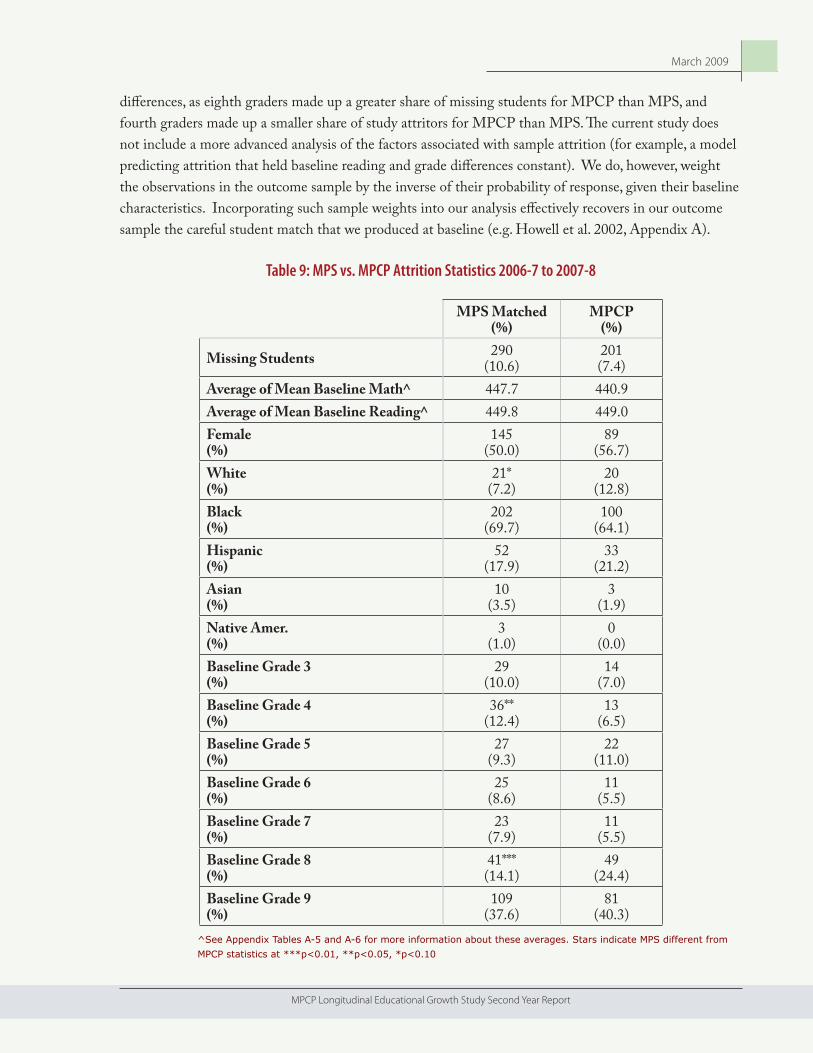
differences, as eighth graders made up a greater share of missing students for MPCP than MPS, and fourth graders made up a smaller share of study attritors for MPCP than MPS. The current study does not include a more advanced analysis of the factors associated with sample attrition (for example, a model predicting attrition that held baseline reading and grade differences constant). We do, however, weight the observations in the outcome sample by the inverse of their probability of response, given their baseline characteristics. Incorporating such sample weights into our analysis effectively recovers in our outcome sample the careful student match that we produced at baseline (e.g. Howell et al. 2002, Appendix A).
Table 9: MPS vs. MPCP Attrition Statistics 2006-7 to 2007-8
MPS Matched(%)
MPCP(%)
Missing Students 290(10.6)
201(7.4)
Average of Mean Baseline Math^ 447.7 440.9Average of Mean Baseline Reading^ 449.8 449.0Female(%)
145(50.0)
89(56.7)
White(%)
21*(7.2)
20(12.8)
Black(%)
202(69.7)
100(64.1)
Hispanic(%)
52(17.9)
33(21.2)
Asian(%)
10(3.5)
3(1.9)
Native Amer.(%)
3(1.0)
0(0.0)
Baseline Grade 3(%)
29(10.0)
14(7.0)
Baseline Grade 4(%)
36**(12.4)
13(6.5)
Baseline Grade 5(%)
27(9.3)
22(11.0)
Baseline Grade 6(%)
25(8.6)
11(5.5)
Baseline Grade 7(%)
23(7.9)
11(5.5)
Baseline Grade 8(%)
41***(14.1)
49(24.4)
Baseline Grade 9(%)
109(37.6)
81(40.3)
^See Appendix Tables A-5 and A-6 for more information about these averages. Stars indicate MPS different from
MPCP statistics at ***p<0.01, **p<0.05, *p<0.10

MPCP Longitudinal Educational Growth Study Second Year Report
22 March 2009
SUMMARY AND CONCLUSIONS
This report presents the second year, follow-up analysis of academic achievement in the Milwaukee Parental Choice Program (MPCP). The analysis compares a sample of MPCP students to a sample of very similar (and in most observable ways statistically identical) MPS students. Neither a comparison of inter-sector means, nor regression-adjusted comparisons accounting for grades, race, gender, and school-mobility indicated significant differences between the programs in terms of achievement growth in either math or reading. In general, students for whom we have two years of valid test scores appear to be performing at similar levels. Moreover, their scores appear to be similarly distributed: the gap between the highest performing students and the lowest performing students is approximately the same in the two sectors. Estimates of one model, which accounted for differential program effects associated with student gender, found statistically significant and negative effects for MPCP girls in reading, and positive effects for MPCP boys also in reading, relative to students of the same gender in MPS. In future years, we will explore this result further to test whether it is an artifact of the current year of data or whether it represents true differences in program effects associated with gender.17
We also examined students who switched between schools and between the MPCP and MPS sectors. Considerably more MPS students switched schools from October 2006 to October 2007 than students in the MPCP. However, over the year more MPCP students switched to MPS than MPS students switched to become voucher students. Finally, we provided a preliminary assessment of sample attrition, defined as students we could not locate in the second year of the study. Approximately nine percent of the total samples drawn in 2006-07 could not be located. This number is considerably below our initial assumption of 20 percent when we conceived sample sizes and the need to refresh the samples. A somewhat greater percentage of MPS students (11%) than MPCP students (7%) were lost. There were few discernable differences between missing and non-missing students on baseline test scores or demographic variables. Further, in examining missing students, there were almost no differences in student characteristics between those missing from the MPCP and those missing from the MPS.
Throughout the report, we describe a range of cautions and caveats, with the most important being that this is only the second year of a five-year study, and that student achievement trajectories often take time to change. Thus, while at the present time in terms of achievement as measured by one year of achievement growth we conclude that MPS and MPCP students appear to be approximately similar but emphasize this result may change in future analyses.
17 Given that one method of adjusting these results for multiple comparisons weakened this result is further need for future exploration. See footnote 14 above.

MPCP Longitudinal Educational Growth Study Second Year Report
23March 2009
Aaronson, Daniel. 1998. “Using Sibling Data to Estimate the Impact of Neighborhoods of Children’s Educational Outcomes.” Journal of Human Resources. 33(4): 915-946.
Ballou, Dale. 2008. “Test Scaling and Value Added Measurement.” Paper Presented at the National Conference on Value Added Modeling, Wisconsin Center of Education Research, April 22-24, 2008.
Benjamini, Yoav, and Yosef Hochberg. 1995. “Controlling for the False Discovery Rate: A Practical and Powerful Approach to Multiple Testing.” Journal of the Royal Statistical Society, Series B (Methodological), 57(1): 289-300.
Cullen, Julie Berry, Brian A. Jacob, and Steven D. Levitt. 2005. “The Impact of School Choice on Student Outcomes: an Analysis of the Chicago Public Schools.” Journal of Public Economics. 89(5-6): 729-760.
Greene, Jay P., Paul E. Peterson, and Jiangtao Du. 1999. “Effectiveness of School Choice: The Milwaukee Experiment.” Education and Urban Society. 31(January): 190-213.
Hanushek, Eric A., John F. Kain, and Steven G. Rivkin. 2004. “Disruption Versus Tiebout Improvement: The Costs and Benefits of Switching Schools.” Journal of Public Economics. 88: 1721-1746.
Heckman, James J. 1996. “Randomization as an Instrumental Variable.” The Review of Economics and Statistics. 78(2): 336-341.
Howell, William G. and Paul E. Peterson, with Patrick J. Wolf and David E. Campbell. 2002. The Education Gap: Vouchers and Urban Schools. Washington, D.C.: Brookings Institution Press.
Lavertu, Stephane and Witte, John. 2008. “A Multifaceted Analysis of Milwaukee Charter Schools.” Paper presented at the American Political Science Association Annual Meeting, August 28-31, Boston, MA.
Leventhal, Tama and Jeanne Brooks-Gunn. 2004. “A Randomized Study of Neighborhood Effects on Low-Income Children’s Educational Outcomes.” Developmental Psychology. 40(4): 488-507.
Ludwig, Jens, Helen Ladd, and Greg J. Duncan. 2001. “The Effects of Urban Poverty on Educational Outcomes: Evidence from a Randomized Experiment.” In Urban Poverty and Educational Outcomes. Brookings-Wharton Papers on Urban Affairs. Edited by William Gale and Janet Rothenberg Pack. Washington, DC: Brookings Institution Press. pp.147-201.
Reynolds, H.T. 1977. The Analysis of Cross-Classifications. New York, NY. The Free Press
Rosenbaum, Paul R. and Donald B. Rubin. 1983. “The Central Role of the Propensity Score in Observational Studies for Causal Effects” Biometrika. 70(1): 41-55.
Rouse, Cecilia Elena. 1998. “Private School Vouchers and Student Achievement: An Evaluation of the Milwaukee Parental Choice Program.” The Quarterly Journal of Economics. 113(2): 553–602.
Rumberger, Russell W. 2003. “The Causes and Consequences of Student Mobility.” The Journal of Negro Education. 72(1): 6-21.
Sampson, Robert J., Jeffrey D. Morenoff, and Thomas Gannon-Rowley. 2002. “Assessing ‘Neighborhood Effects’: Social Processes and New Directions in Research.” Annual Review of Sociology. 28: 443-478.
Schochet, Peter Z. 2007. Guidelines for Multiple Testing in Experimental Evaluations of Educational Interventions, Revised Draft Report. MPR Reference No: 6300-080. Cambridge, MA: Mathematica Policy Research.
Witte, John F., Patrick J. Wolf, Joshua M. Cowen, David J. Fleming and Juanita Lucas-McLean. 2008. Milwaukee Parental Choice Program Longitudinal Educational Growth Study. Baseline Report.
Witte, John F. 2000. The Market Approach to Education: An Analysis of America’s First Voucher Program. Princeton, NJ: Princeton University Press.
Wolf, Patrick J., Babette Gutmann, Michael Puma, Lou Rizzo, and Nada O. Eissa, 2007. Evaluation of the DC Opportunity Scholarship Program: Impacts After One Year, U.S. Department of Education, Institute for Education Sciences, National Center for Education Evaluation and Regional Assistance, Washington, DC: U.S. Government Printing Office, NCEE 2007-4009, available at: http://ies.ed.gov/ncee/pubs/20074009/.
Wolf, Patrick J., Babette Gutmann, Michael Puma, Brian Kisida, Lou Rizzo, and Nada O. Eissa, 2008. Evaluation of the DC Opportunity Scholarship Program: Impacts After Two Years, U.S. Department of Education, Institute for Education Sciences, National Center for Education Evaluation and Regional Assistance, Washington, DC: U.S. Government Printing Office, NCEE 2008-4023, available at: http://ies.ed.gov/ncee/pubs/20084023/.
REFERENCES

MPCP Longitudinal Educational Growth Study Second Year Report
24 March 2009
APPENDIX A—Additional Tables
Table A-1: MPCP and MPS Matched Demographics for 2007 Third Grade Refreshed Sample
MPS Matched (%) MPCP (%)
Female 211* (47.3) 168 (53.7)White 23* (5.2) 26 (8.3)Black 316 (70.9) 214 (68.4)Hispanic 83 (18.6) 59 (18.9)Asian 17 (3.8) 13 (4.2)Native Amer. 1 (0.2) 1 (0.3)Total Nonmissing N 446 313Total Sample N 446 446
Stars indicate MPS different from MPCP statistics at ***p<0.01, **p<0.05, *p<0.10, based on a two-tailed T-Test.
Table A-2: Mean Math Scale Scores by Grade, 2007-8
Grade
Group
All Students Economically Disadvantaged
Mean s.d. Mean s.d.3 Milwaukee Public Schools 402.0 47.4 398.6 45.1
State of Wisconsin 431.7 44.4 412.4 42.84 Milwaukee Public Schools 434.1 51.3 430.4 49.5
State of Wisconsin 466.3 45.5 446.3 45.25 Milwaukee Public Schools 455.0 52.2 451.2 49.9
State of Wisconsin 493.1 48.7 470.1 47.86 Milwaukee Public Schools 472.5 49.6 468.3 48.5
State of Wisconsin 513.8 46.5 489.7 46.77 Milwaukee Public Schools 490.6 44.2 487.3 42.7
State of Wisconsin 533.4 44.6 509.4 43.28 Milwaukee Public Schools 494.0 55.4 489.0 54.1
State of Wisconsin 541.5 49.9 514.2 51.810 Milwaukee Public Schools 511.5 48.7 507.7 46.7
State of Wisconsin 561.3 48.7 532.9 48.4Source: Wisconsin Department of Public Instruction, “WKCE Data Summaries,” http://dpi.wi.gov/oea/hist/
summaries.html

MPCP Longitudinal Educational Growth Study Second Year Report
25March 2009
Table A-3: Mean Reading Scale Scores by Grade, 2007-8
Grade
Group
All Students Economically Disadvantaged
Mean s.d. Mean s.d.3 Milwaukee Public Schools 432.7 44.5 429.2 43.0
State of Wisconsin 457.5 40.3 439.9 41.54 Milwaukee Public Schools 444.3 52.1 438.8 50.5
State of Wisconsin 476.2 47.2 454.5 49.35 Milwaukee Public Schools 452.1 51.5 446.7 50.6
State of Wisconsin 484.5 46.5 462.5 49.16 Milwaukee Public Schools 464.0 54.0 458.2 52.2
State of Wisconsin 503.1 48.9 477.2 50.97 Milwaukee Public Schools 474.2 52.8 469.5 50.3
State of Wisconsin 513.8 48.4 488.6 50.48 Milwaukee Public Schools 485.9 56.5 480.7 54.8
State of Wisconsin 527.6 52.0 500.6 54.110 Milwaukee Public Schools 485.3 63.4 478.3 60.1
State of Wisconsin 538.6 60.0 504.6 61.0Source: Wisconsin Department of Public Instruction, “WKCE Data Summaries,” http://dpi.wi.gov/oea/
hist/summaries.html
Table A-4: Descriptive Statistics for Variables Used in Achievement Model
MPS Matched (%) MPCP (%)Female 1,456 (53.4) 1,381 (55.0)White 246 (9.0) 216 (8.7)Black 1,831 (67.1) 1,646 (65.9)Hispanic 538*** (19.7) 574 (23.0)Asian 89 (3.3) 64 (2.6)Native Amer. 15** (0.6) 5 (0.2)Missing Race or Gender 0*** (0.0) 259 (9.5)Switched School (Non-structural) 463*** (18.9) 90 (3.3)Missing School Status 292*** (10.7) 199 (7.3)Stars indicate MPS different from MPCP statistics at ***p<0.01, **p<0.05, *p<0.10, based on a two-tailed T-Test.

MPCP Longitudinal Educational Growth Study Second Year Report
26 March 2009
Table A-5: Sample Attrition Statistics-Mean Scale Scores, 2006-7 to 2007-8
Group Non-Missing Students
Missing Students
Baseline Grade 3 Math (s.d.) 386.1 (43.2) 378.2 (43.2)Baseline Grade 4 Math (s.d.) 419.3 (50.3) 418.6 (46.5)Baseline Grade 5 Math (s.d.) 442.1 (42.6) 434.2 (39.3)Baseline Grade 6 Math (s.d.) 470.7*** (40.0) 451.2 (48.8)Baseline Grade 7 Math (s.d.) 493.4 (43.4) 490.4 (40.8)Baseline Grade 8 Math (s.d.) 497.3 (44.7) 503.4 (46.5)Average of Mean Baseline Math^ 451.5 446.0Baseline Grade 3 Reading (s.d.) 429.6 (43.7) 420.1 (39.2)Baseline Grade 4 Reading (s.d.) 437.2 (49.2) 430.9 (54.4)Baseline Grade 5 Reading (s.d.) 441.0 (50.0) 442.9 (39.3)Baseline Grade 6 Reading (s.d.) 466.1** (47.9) 447.6 (68.3)Baseline Grade 7 Reading (s.d.) 469.9 (51.1) 468.2 (34.7)Baseline Grade 8 Reading (s.d.) 483.5* (57.5) 495.1 (50.0)Average of Mean Baseline Reading^ 454.6 450.8^Averages represent the mean of the six baseline grade means. Stars indicate Non-Attritors different from Attritor
statistics at ***p<0.01, **p<0.05, *p<0.10, based on a two-tailed T-Test.
Table A-6: MPS vs. MPCP Attrition Statistics – Mean Scale Scores 2006-7 to 2007-8
Group MPS Matched MPCPBaseline Grade 3 Math (s.d.) 374.3 (46.5) 387.5 (33.9)Baseline Grade 4 Math (s.d.) 420.1 (44.8) 413.3 (54.7)Baseline Grade 5 Math (s.d.) 440.1 (37.3) 424.2 (41.8)Baseline Grade 6 Math (s.d.) 453.6 (46.6) 442.7 (59.3)Baseline Grade 7 Math (s.d.) 493.8 (42.6) 474.8 (30.3)Baseline Grade 8 Math (s.d.) 504.1 (52.2) 502.8 (40.7)Average of Mean Baseline Math^ 447.7 440.9Baseline Grade 3 Reading (s.d.) 414.2 (42.8) 434.4 (24.9)Baseline Grade 4 Reading (s.d.) 428.7 (57.7) 439.4 (40.5)Baseline Grade 5 Reading (s.d.) 440.5 (40.7) 446.9 (37.9)Baseline Grade 6 Reading (s.d.) 453.0 (66.8) 428.3 (75.6)Baseline Grade 7 Reading (s.d.) 474.9** (31.0) 442.3 (38.9)Baseline Grade 8 Reading (s.d.) 487.2 (54.8) 502.8 (44.2)Average of Mean Baseline Reading^ 449.8 449.0^Averages represent the mean of the six baseline grade means. Stars indicate MPS different from MPCP statistics at
***p<0.01, **p<0.05, *p<0.10, based on a two-tailed T-Test.

MPCP Longitudinal Educational Growth Study Second Year Report
27March 2009
APPENDIX B: Constructing the Study Sample
Due to the longitudinal nature of the study, as well as its emphasis on several forms of data (achievement scores, demographic information, and survey data), we developed a method to observe and analyze very similar individual students across five years’ time. Our task to this end was to identify two comparable samples of students: one from the MPCP students and one from MPS students. Samples were required (rather than entire populations) because of resource limits on surveying parents, testing students, and tracking students over time. The initial step was a power analysis, in which we estimated the size of the samples needed for having possible success at identifying statistically significant results after five years, given anticipated attrition. We focused on grades three to eight because tests were required in those grades under No Child Left Behind (NCLB) federal legislation and MPS was therefore testing in those grades. We selected all the Choice students in the ninth grade in MPCP schools so that we had a large enough sample to withstand attrition for our five-year attainment study.
Drawing the MPCP Sample
To identify a representative sample of students to study over the 5-year duration of the Longitudinal Educational Growth Study (LEGS) Achievement and Attainment studies, we first selected a random sample of participants in the Milwaukee Parental Choice Program (MPCP) from a September 1, 2006 list of applied and accepted students. To obtain a sample of students for the LEGS Achievement study in grades 3-8 that was representative of the MPCP population, we stratified the selection by the number of students in each grade in the program. We then drew random samples for each grade, for a total of 2,184 students. For the LEGS Attainment study, we selected all of those in ninth grade (911 students). The samples combined for a total of 3,095 students comprising 18 percent of the population of all MPCP participants in grades three to nine.
We then examined the audited list of voucher recipients on the 3rd Friday count (September 15, 2006) from the Department of Public Instruction.18 Two hundred twenty-seven students were not on this list or had duplicate records and were dropped from the study.19 We informed each MPCP school as to which of their students had been selected. The parents or guardian of each student were informed via letter from their child’s school of their child’s selection into the study, and were given the opportunity to decline participation. Of those students in the sample, 134 (4.67%) opted out of the study. An additional seven students were not included in the study because their grade levels were no longer within grades three through eight. For those students who remained after
18 The 3rd Friday in September is used in Wisconsin as the official enrollment count for all public schools. State aid and other formulas and aid programs depend on this count.
19 The 3rd Friday list included only students who applied, were accepted and were enrolled on that date in the private schools. The students who were dropped were on the original September 1st list, but were not in the schools on September 15th, the third Friday of the month. That is very common in Milwaukee where students often apply to multiple schools under a number of choice programs (charter schools, magnet schools, and suburban schools).

MPCP Longitudinal Educational Growth Study Second Year Report
28 March 2009
these adjustments, we obtained information on students’ race, gender, and other variables through school records. The final analytic sample contains 2,727 students in the MPCP program.
Constructing the MPS Comparison Sample
The more challenging question centered on the design of a comparable sample of MPS students. The ideal arrangement would be to have a randomized field trial (RFT) in which all students desiring a voucher would be randomly offered the stipend via some form of lottery. Previous and ongoing research (Howell et al. 2002; Wolf et al. 2007) has made use of such designs in voucher evaluations. In our case, there is no statutory provision for random assignment under Wisconsin Act 125. Furthermore, since the student limits on the program had been increased in anticipation of increasing demand, it was impossible to construct a comparable group from waiting lists or students not picked in school and grade-level lotteries.20 Thus, this study must rely on non-experimental, observational data to estimate the effects of MPCP participation on student outcomes
The problems with estimating causal effects of policy interventions using observational data are well known, as are several of the leading statistical techniques that mitigate these difficulties. We anticipate employing one or more of these techniques in our actual estimations of models of the voucher effects. However, unlike many researchers analyzing policy outcomes with observational data, we are faced with the task of gathering our own data prior to analysis. Our approach takes advantage of this requirement by constructing a sample of MPS students who are comparable to MPCP students in both observable and, we argue, unobservable ways.
The Problem with Observational Comparisons Between Sectors
Because participation in MPCP is not a random phenomenon, any simple comparison between educational outcomes for MPCP students and a sample (or population) of MPS students may suffer from the classic problem of selection bias. In this case, consider a simple model of achievement, Y, for student i:
(eq1) Yi = β0 + β1Ci + εi
where the parameter, β1, is the impact of the choice, Ci, to participate in MPCP (C=1; C=0 for public students), and ε is the model residual. In a conventional Ordinary Least Squares (OLS) framework, an estimate of β1 is an unbiased estimate of the effect of MPCP participation only if, among other assumptions:
(eq2) E(εi | Ci ) = 0
In other words, we can estimate the effect of MPCP participation only when students’ status as voucher users tells us nothing about their unobservable characteristics. In the case of school choice decisions, and education-related
20 For the problems with using “rejects” from school lotteries as a control group, see Witte (2000, p. 136-42). Using waiting lists may be problematic in that the schools with waiting lists may not be representative of the population of Choice schools. One would have to assume that waiting lists indicate more desirable schools, and thus the full impact of the program (i.e. the full set of private schools) would not be adequately assessed using wait-listed students as a control group.

MPCP Longitudinal Educational Growth Study Second Year Report
29March 2009
decisions in general, this is highly unlikely. In the case of an RFT, noted above, randomization can serve to distribute, on average, the potential bias on β1 equally between the groups offered the voucher and those denied it (e.g. Heckman 1996).21
If the assumption specified in Equation 2 does not hold, and the reason is simply that an easily observed or measured characteristic is left outside the model, that characteristic—students’ race or gender, for example—can simply be included as a covariate in the model (i.e. no longer captured by the residual). The problem is that although there are multiple determinants of parents’ and students’ educational decisions that researchers can readily observe, there may still be unobserved variables that are correlated, perhaps strongly so, with the decision to use a voucher. Other observational studies have used statistical adjustments such as instrumental variables (IV) or some other estimation of a selection model in the analysis stages of their research. Such approaches are certainly valid and, in our own analysis stage, we may employ them at minimum as robustness checks against our own basic models.
Many other observational studies, however, have little control over the inclusion or exclusion of particular observations in their samples. In this study, as noted above, we are free to design our own samples in such a way as to minimize observable and unobservable selection bias. As noted, we selected the MPCP sample at random. Although a random sample of MPS students is a potential counterpart, if that sample is truly random, it should contain precisely the same unequal distribution of potential bias effecting β1 as in the MPS population as a whole. A more refined approach is to design a sample of public school students, p, in which the unobserved characteristics, Uip, related to the decision to choose an educational sector occur with comparable frequency to those unobserved characteristics, Uic, of voucher students, c.
To see how such a design yields the effect of MPCP participation, consider an expanded form of Equation 1:
(eq3) Yi = β0 + β1Ci + β2 Xi + β3 Ui + εi
where β2 is the impact of a particular student covariate, Xi, and β3 is the impact of unobserved characteristics, Ui. If all potential unobserved characteristics affecting Y are captured in Ui , then the expanded assumption in Equation 2 holds:
(eq4) E(εi | Ci, Xi, Ui) = 0
and so Equation 3 can be re-written as:
(eq 5) E(Y | Ci, Xi, Ui ) = β0 + β1Ci+ β2Xi+ β3Ui
21 This is only true in the rudimentary case where there is no non-compliance with the treatment offer, and/or no attrition from the samples. The statistical issues raised when these conditions do not hold are quite similar to those confronting us here.

MPCP Longitudinal Educational Growth Study Second Year Report
30 March 2009
Now, if the sample has been designed in such a way as to distribute Ui equally between the samples of c and p students,22 then:
(eq 6) E(Uic - Uip | Ci) = 0
and Equation 5 can be re-written in terms of observable variables:
(eq 7) E(Y | Ci, Xi) = β0 + β1Ci + β2 Xi
so that the impact of MPCP participation can be isolated as:
(eq8) E(Y | Ci=1) - E(Y | Ci=0)
= (β0 + β1Ci + β2 Xi) - (β0 + β2 Xi)
= β1
With this objective, we designed a three-step process to produce a sample of public school students that will allow what we may call an “apples-to-apples” comparison to the MPCP students.
Step 1: Student Neighborhoods
The school choice literature suggests that students’ family background plays a critical role in determining parental decisions. The literature on education outcomes in general has also attributed student achievement differences to variation in family characteristics. This evidence suggests that accounting for student background, especially those unobservable features that may influence both choice and achievement, is the most important step in designing comparison samples of public and private school students. Moreover, residents of the city of Milwaukee have access to arguably the most diverse set of school choice options—publicly funded vouchers, public charters, open-enrollment and out-of-district transferring—of any similar geographic environment in the country. At baseline of this study (2006-2007), there were more than 120 private schools participating in the voucher program, more than 20 charter schools operating in concert with Milwaukee Public Schools, 12 independent charter schools, and 180 public schools fixed within approximately 96 square miles of city boundaries. This translates into approximately 1.25 voucher schools, 1.88 public schools, or nearly 3.5 schools of any type per square mile—all theoretically accessible to students in the city.
For these reasons, we chose as the first and most important step in our matching process the linkage of a given MPCP student in our randomly drawn sample to an MPS student in the same neighborhood (and same baseline grade). We operationalized student neighborhood as the U.S. Census tract associated with the student’s contact address, after being advised by Milwaukee city planners that in this urban setting, Census tracts correspond to local neighborhood boundaries. In our sample, MPCP students come from 213 different Census
22 In our estimation of choice effects (i.e. the “treatment”), we will include multiple observable covariates for precision, just as we would the Ui if we could actually measure them. For this reason, we leave the Xi in the general framework.

MPCP Longitudinal Educational Growth Study Second Year Report
31March 2009
tracts. We believe that student neighborhood not only allows us to capture very local environmental effects on choice, such as the role of social networks and the availability of information, but also serves to proxy for family and socioeconomic background that we were unable to observe initially in the construction of our sample.23
One indication that our categorization of neighborhoods has substantive support comes from the survey results obtained after sample construction, and outlined in the baseline report (Witte et al. 2008). For example, a question regarding neighborhood characterization prompted nearly identical responses from MPCP and MPS parents regarding the safety of their neighborhoods. Seven percent of MPCP and eight percent of MPS respondents designated their neighborhoods “very unsafe,” while roughly 20 percent (20.2% for MPCP, and 20.8% for MPS) responded that their neighborhoods are “very safe.”
Step 2: Prior Achievement
After limiting the set of potential matches for a given MPCP student to those in her same Census tract (and grade), we limited the match further to those with very similar baseline test scores. We believe this measure of “initial status” in this panel not only serves as a benchmark for predictions of the specific dependent variable in future years, but also as a rough indicator of students’ prior academic ability. Students in Milwaukee Public Schools take the criterion-referenced Wisconsin Knowledge and Concepts Exam (WKCE) as part of the state’s compliance with the federal No Child Left Behind accountability law. Raw WKCE scores are computed by the test designers (McGraw Hill) into scale scores that allow year-by-year indications of student progress. In this study, we are focused specifically on math and reading outcomes, but for matching purposes, we calculated the average of the math and reading scores for a given observation to better summarize initial status and ability.
To assure that we had as many potential test score matches as possible given our restriction to those living in the same Census tract, we did not match on exact test score. Rather, we allowed the pool of potential matches to include all MPS students within the MPCP student’s test score bandwidth, which we defined as one of 20 test score quantiles based on the grade-specific distribution of MPCP test scores. In the first band were students whose scores fell between the 1st and the 5th percentile. In the twentieth band were students whose scores fell on or exceeded the 95th percentile. For example, if a given MPCP fourth grader scored between the 0 and 5th percentile of combined mean reading and math scores for all MPCP fourth graders in the sample, the pool of potential MPS matches was limited to fourth graders (within the same Census tract) whose combined scale score fell within the numerical range associated with the 5th percentile of MPCP scores. Despite the fact that we matched only on combined mean math and reading scores, this process yielded very similar average baseline scores for separated math and reading scores between the two samples.
23 Evidence for neighborhood on social outcomes is presented across several social science disciplines. See, e.g., Aaronson (1998) for evidence of neighborhood effects on educational outcomes even after family characteristics are taken into account; Ludwig, Ladd, and Duncan (2001) and Leventhal and Brooks-Gunn (2004) for experimental evidence linking neighborhood improvements to improvements in student outcomes; and Sampson, Morenoff and Gannon-Rowley (2002) for a general discussion; See also Cullen, Jacob and Levitt (2005) for use of Census tract information in research on school choice.

MPCP Longitudinal Educational Growth Study Second Year Report
32 March 2009
Step 3: Propensity Scores
Finally, we narrowed potential matches further by accounting for the influence of students’ race, gender, English language learner (ELL) status, and baseline test score on the decision to select private education (MPCP=1). Because we had prioritized neighborhood and then test score matches, we did not believe we would find identical one-to-one matches for each of these demographic characteristics. Instead, we estimated a propensity score (Rosenbaum and Rubin 1983) predicting choice, using a logit model:
(eq 9) choice= P(MPCP=1) = exβ / (1 + exβ)
for each student based on these characteristics, X, with models estimated separately by grade. Within Census tracts and test bands, MPS students were matched to MPCP students by selecting the MPS student with the closest raw value of choice to the MPCP student. The MPS student with the closest propensity score to the MPCP student was selected as the student’s match and became a final addition to the MPS sample.
The Final Samples
The results of this matching process were two baseline samples: 2,727 MPCP students and 2,727 MPS students distributed between grades three through nine. At this point it is important to restate that the despite the one-to-one nature of the matching process it is not our intention to base our analysis on any comparison between two individual observations, one in each sector. We designed the process above to create two samples of students whose observable and unobservable characteristics related to both school choice and student achievement are, on average, equally distributed between the two samples, as specified in the sections above (and in particular in Equation 6). Our analysis of MPCP-MPS differences in achievement will include all students in these samples, and will be based on statistical models of educational outcomes recognized and specified in the school choice literature.
In order to ensure a proper sample size for future statistical analyses, we added a new third grade sample in 2007-08 and will do so in future year as well. We drew a random sample of 500 MPCP third grade students. We removed one duplicate record and 53 students who were not in the DPI audited file of confirmed MPCP enrollees. This left a final sample of 446 MPCP third grade students in 2007-08. We used the matching algorithm outlined above to create a sample of 446 matched MPS third grade students. See Table A-1 for descriptive statistics.
Non-Response in 2007
Of those students for whom we expected both years of test scores (2006 and 2007: baseline grades 3-7) 77 percent of MPS students and 78 percent of MPCP students had the second year score. The figures were comparable for reading and math tests. To adjust for this “non-response” we created sample weights equal to 1/f(x), where f(x) defines the probability of a non-missing test as a function of student’s sector (MPCP or MPS), race, gender, baseline test score and grade. These weights were calculated separately for reading and math. At this point in time, no substantive differences exist in the statistics and models estimated with weighted and unweighted data. However, we report weighted results in the text in recognition that missing test data present a lingering issue—albeit one with no discernible implications for the year 2 results.

MPCP Longitudinal Educational Growth Study Second Year Report
33March 2009
MPCP Longitudinal Educational Growth Study Baseline Report
About the AuthorsJohn F. Witte is a Professor in the Department of Political Science and the Robert M. La Follette School of Public Affairs at the University of Wisconsin - Madison. He received his Ph.D. in political science from Yale University. He has been a fellow at the Russell Sage Foundation and at the Center for Advanced Study in the Behavioral Sciences. His latest book from Princeton University Press is The Market Approach to Education: An Analysis of America’s First Voucher Program.
Patrick J. Wolf is Professor of Education Reform and 21st Century Endowed Chair in School Choice at the University of Arkansas in Fayetteville. He also is principal investigator of the School Choice Demonstration Project. Wolf has authored, co-authored, or co-edited three books and nearly 30 articles and book chapters on school choice, special education, and public management. A 1987 summa cum laude graduate of the University of St. Thomas (St. Paul, MN), he received his Ph.D. in Political Science from Harvard University in 1995.
Joshua Cowen is assistant professor of public policy at the Martin School of Public Policy and Administration at the University of Kentucky, and is a senior analyst on a new and official evaluation of the Milwaukee voucher program He has published papers on charter school sponsorship and compliance models in school voucher randomized trials, and current research includes extensions of these models in other educational settings, including science and technology interventions in different school districts. He holds a Ph.D. in political science from the University of Wisconsin-Madison, where he was among the inaugural fellows in the interdisciplinary training program in education science, funded by the U.S. Department of Education. At the Martin School, he teaches courses in public policy and program evaluation.
David Fleming is a doctoral candidate in the Department of Political Science, and a graduate research fellow in the Interdisciplinary Training Program in Education Sciences at the University of Wisconsin-Madison. His dissertation project examines the effects of vouchers on recipients’ political participation and attitudes. His research interests include public policy, political behavior and quantitative methods. He has recently accepted an offer to become an assistant professor in the political science department at Furman University.
Juanita Lucas-McLean is a Senior Study director at Westat located in Rockville, Maryland. She has more than 30 years of experience in survey research, project management, program evaluation and qualitative analysis. Ms. Lucas-McLean has managed data collection for several large-scale national surveys funded by federal agencies including the Department of Education, the Department of Labor, and the Department of Agriculture. She has a B.A. from Syracuse University and a M.S.W. from Howard University.

School Choice Demonstration Project
Department of Education Reform
University of Arkansas
201 Graduate Education Building
Fayetteville, AR 72701
479-575-6345
http://www.uark.edu/ua/der/SCDP/Research.html
Related Documents