THE MOVEMENT AND POSITIONING OF SOCCER OFFICIALS IN RELATION TO THEIR DECISION MAKING Abdulrhman D. Alhazmi (n7398077) BHSc (Umm Al-Qura University) MAS in PHE (Wollongong University) MAS in PHE (Umm Al-Qura University) Supervisors: Professor Keith Davids (Principal) (Queensland University of Technology, Australia) Doctor Charles Worringham (Associate Supervisor) (Queensland University of Technology, Australia) Doctor Ian Renshaw (Associate Supervisor) (Queensland University of Technology, Australia) Submitted in fulfillment of the requirements for the degree of Doctor of Philosophy (Research) School of Exercise & Nutrition Sciences Institute of Health & Biomedical Innovation Faculty of Health Queensland University of Technology 2016

Welcome message from author
This document is posted to help you gain knowledge. Please leave a comment to let me know what you think about it! Share it to your friends and learn new things together.
Transcript
THE MOVEMENT AND POSITIONING OF
SOCCER OFFICIALS IN RELATION TO THEIR
DECISION MAKING
Abdulrhman D. Alhazmi (n7398077)
BHSc (Umm Al-Qura University) MAS in PHE (Wollongong University) MAS
in PHE (Umm Al-Qura University)
Supervisors:
Professor Keith Davids (Principal)
(Queensland University of Technology, Australia)
Doctor Charles Worringham (Associate Supervisor)
(Queensland University of Technology, Australia)
Doctor Ian Renshaw (Associate Supervisor)
(Queensland University of Technology, Australia)
Submitted in fulfillment of the requirements for the degree of
Doctor of Philosophy (Research)
School of Exercise & Nutrition Sciences
Institute of Health & Biomedical Innovation
Faculty of Health
Queensland University of Technology
2016

i
Keywords
Qatar
Soccer
Soccer Officials
Referees
Movement
Positioning
Decision-Making
Distance
Viewing angle
Ecological Dynamics

ii
Abstract
Soccer referees have been accused of being subjective, inconsistent, and biased
in their decision-making. Following this possibly improper accusation, the purpose
of this programme of research was to explore some of the factors predicting the
quality of soccer referees’ decision-making. Based on a literature review, a total of
14 qualitative and quantitative factors were identified. The potential effects of five
quantitative factors were analysed, specifically (a) the position of the ball; (b) the
position of the referee relative to the ball; (d) the referee’s ball tracking ability; (c)
the position of the foul; (d) the viewing angle between the referee, the assistant
referee, and the ball; and (e) the experience level of the referee.
The secondary archival data used for the statistical analysis concerned 3464
potential fouls committed in 104 matches officiated by 25 referees taking place in the
Qatar Stars League (QSL) in the 2011/2012 season. The QSL is the top professional
soccer league in Qatar with 14 teams. Kinematic match analysis data were obtained
from QSL in the proprietary format of the Prozone ® system Version 10 (Prozone
Sports Ltd, Leeds, UK), a leading optical tracking system widely used in professional
soccer. This system comprises a network of eight video cameras capable of tracking
the players, ball and match officials. The number of fouls per match ranged from 19
to 52 with an average of 33 fouls per match. The quality of the referees’ decisions
about each foul was measured on a scale from 0 to 4 (where 4 is strong agreement
with the referee’s decision and 0 is strong disagreement).
A structural equation modelling approach was used to test nine hypotheses
concerning the performance of soccer referees, broadly underpinned by the
approaches associated with the ecological dynamics theory. In the context of
ecological dynamics, the models had sufficient validity in terms of effect size. The
ball position strongly predicted the referee position, demonstrating that the
intentional adaptation of movement by the referee was a function of the information
perceived by the referee regarding the position of the ball. Soccer referees may
couple their movements to perceived information sources, equivalent to the way in
which soccer players intercept a passing ball. The referee attributes (specifically a
combination of nationality, referee experience, and FIFA class) predicted the ability

iii
of the referees to keep up with the play, or ball tracking, consistent with previous
studies on the spatial positioning of soccer referees, which concluded that ball
tracking is a very important performance characteristic and that referee performance
may be constrained by their level of experience. The ball position, the referee
position and the viewing angles were not significant predictors of the quality of the
referees’ decisions. The quality of the referees’ decisions was associated with the
positions of the fouls on the pitch. The mean distance of the referee from the ball at
the time of each foul was 17.5 m. In the central mid-field area, correct decisions were
made when the referees were closest to the foul (mean = 12.07 m). In the lateral
zones or the areas of influence of the assistant referees the referees made correct
decisions at much larger distances from the foul (mean = 25.97 m). The referee
attributes and ball tracking significantly predicted the quality of the referees’
decision-making. These results were consistent with the view that experience, based
on knowledge of past and present situations, predicted the referees’ decision-making.
FIFA Class 1 referees who only qualified as national referees during the 2011/2012
season tended to have the lowest quality of decisions, followed by the Class 2
referees who became internationally qualified during the 2011/12 season and the
highest quality of decisions were found among Class 3 referees who were already
internationally qualified at the start of the 2011/12 season.
The dynamic systems theory emphasizes that it is critical to observe
interactions between the participants in space and time during the emergence of
different patterns of play; however, few observations that took place over time
relating to the coordination of soccer officials were analysed. Limited evidence could
be provided from the analysis of referee errors to support the components of the
dynamic systems theory associated with coordination.
The findings supported the ecological dynamics theory by showing the
decision making of referees involves affordances. These include (a) an ability of the
referee to attune to changes in the performance environment (meaning the choice of
various possibilities for action, resulting in effective ball tracking and decision
making); as well as (b) the physical abilities and psychological status of the referee
(reflected by their experience) as well as (c) the situational characteristics of the
performance environment. The ecological dynamics framework needs to be further
developed to explain how referees can improve their experience, and to adapt their
iv
distances from the play to guide their decision-making. The researcher also
recommends the more widespread use of technology to improve the quality of the
decision making of soccer officials. Technology may help to minimize the subjective
errors associated with the many constraints and affordances related to incorrect
decision making.
The results were derived from match data collected in one league in one
season, and included less than half of the possible number of predictive factors.
Furthermore, the mobility, positioning, and experience of the referees could not
explain all of the variance in the quality of their decision-making. The door is left
open for future studies to include data from more matches including other situational
variables (e.g., crowd noise, player reactions, and time factors) as well as referee-
specific factors (e.g., personality, opinion, and fitness) and environmental factors
(e.g., home team advantage) to predict the quality of referee decision-making.
v
Table of Contents
Keywords .................................................................................................................................. i
Abstract .................................................................................................................................... ii
Table of Contents ......................................................................................................................v
List of Figures ....................................................................................................................... viii
List of Abbreviations .............................................................................................................. xi
Acknowledgements ................................................................. Error! Bookmark not defined.
Chapter 1: Introduction ...................................................................................... 1
1.1 Background .....................................................................................................................1
1.2 PROBLEM STATEMENT .............................................................................................2
1.3 Purpose Statement ..........................................................................................................3
1.4 RESEARCH QUESTIONS ............................................................................................5
1.5 DEFINITIONS ...............................................................................................................6
1.6 Thesis Outline .................................................................................................................6
Chapter 2: Literature Review ............................................................................. 9
2.1 INTRODUCTION ..........................................................................................................9
2.2 IDEAL DECISION MAKING .......................................................................................9 2.2.1 Soccer Laws .......................................................................................................10 2.2.2 Accuracy/Error ...................................................................................................10 2.2.3 Professionalism ..................................................................................................11 2.2.4 Fitness .................................................................................................................11
2.3 INDIVIDUAL FACTORS ............................................................................................12 2.3.1 Opinion ...............................................................................................................12 2.3.2 Concentration .....................................................................................................13 2.3.3 Control ................................................................................................................13 2.3.4 Nationality ..........................................................................................................14 2.3.5 Mobility ..............................................................................................................15 2.3.6 Personality ..........................................................................................................17 2.3.7 Perceptual cognitive performance ......................................................................19 2.3.8 Expertise .............................................................................................................20
2.4 SITUATIONAL FACTORS .........................................................................................21 2.4.1 Crowd Factors ....................................................................................................21 2.4.2 Player Reactions .................................................................................................22 2.4.3 Environmental Factors .......................................................................................22 2.4.4 Positions of Officials ..........................................................................................23 2.4.5 Viewing Angle ...................................................................................................25
2.5 theoretical Framework ..................................................................................................26 2.5.1 Ecological Psychology .......................................................................................27 2.5.2 Dynamic Systems ...............................................................................................28 2.5.3 Perceived Information and Intentional Adaptation of Movement ......................29 2.5.4 Constraints ..........................................................................................................31

vi
2.5.5 Affordances ........................................................................................................32 2.5.6 Four Cornerstones Model ...................................................................................35
2.6 CRITIQUE ....................................................................................................................36 2.6.1 Critique of empirical studies ..............................................................................36 2.6.2 Critique of theory ...............................................................................................38
2.7 conclusion .....................................................................................................................40
Chapter 3: Research Methods .......................................................................... 42
3.1 Research Design ...........................................................................................................42
3.2 Participants ...................................................................................................................44
3.3 Instruments ...................................................................................................................44
3.4 DATA COLLECTION .................................................................................................46 3.4.1 Digitization of Prozone Data ..............................................................................46 3.4.2 Conversion of Prozone Data to Video files ........................................................46 3.4.3 Conversion of Video files to Individual Image Files .........................................46 3.4.4 Quality of Referee’s Decision ............................................................................49 3.4.5 Positions of Officials ..........................................................................................50 3.4.6 Position of Ball ...................................................................................................50 3.4.7 Viewing angles ...................................................................................................51 3.4.8 Referee Attributes ...............................................................................................51
3.5 Analysis ........................................................................................................................52 3.5.1 Descriptive Statistics ..........................................................................................52 3.5.2 Inferential Statistics ............................................................................................52 3.5.3 Multivariate Statistics .........................................................................................53
3.6 Ethics ............................................................................................................................57
3.7 STRUCTURE OF RESULTS .......................................................................................57
Chapter 4: Results .............................................................................................. 59
4.1 INTRODUCTION ........................................................................................................59
4.2 VARIABLES ................................................................................................................60
4.3 REFEREE ATTRIBUTES ............................................................................................61
4.4 POSITION OF BALL...................................................................................................62
4.5 POSITION OF REFEREE ............................................................................................64
4.6 BALL TRACKING ......................................................................................................67
4.7 TESTING OF HYPOTHESES .....................................................................................70
Chapter 5: Spatial Characteristics of Fouls and Referee Positioning at Time
of Foul .......................................................................................................... 75
5.1 INTRODUCTION ........................................................................................................75
5.2 POSITION O EACH FOUL .........................................................................................75
5.3 DISTANCE OF REFEREE FROM EACH FOUL.......................................................78
5.4 VIEWING ANGLES ....................................................................................................84
5.5 REFEREE ATTRIBUTES AND POSITIONING ........................................................89
Chapter 6: Decision Making of Referees ......................................................... 91
6.1 INTRODUCTION ........................................................................................................91

vii
6.2 QUALITY OF REFEREES’ DECISIONS ...................................................................91 6.2.1 Inter-rater Agreement .........................................................................................91 6.2.2 Frequency Distribution of Decision Scores ........................................................92
6.3 FACTORS ASSOCIATED WITH DECISION QUALITY .........................................93 6.3.1 Position on the Pitch ...........................................................................................93 6.3.2 Referees’ Distances from Fouls..........................................................................94 6.3.3 Viewing angles ...................................................................................................98 6.3.4 Experience of Referee ........................................................................................99
6.4 TESTING OF HYPOTHESES ...................................................................................100
Chapter 7: Discussion ...................................................................................... 106
7.1 INTRODUCTION ......................................................................................................106
7.2 RESEARCH QUESTIONS ........................................................................................107 7.2.1 RQ1: To what extent does the relative position of the ball and the referee
on the pitch predict the quality of the referee’s decision? ................................107 7.2.2 RQ2: To what extent does the position of the foul on the pitch predict the
quality of the referee’s decision? ......................................................................109 7.2.3 RQ3: To what extent does the distance of the referee from the foul predict
the quality of the referee’s decision? ................................................................111 7.2.4 RQ4: To what extent does the viewing angle predict the quality of the
referee’s decision? ............................................................................................114 7.2.5 RQ5: To what extent do the attributes of the referee predict the quality of
the referee’s decision? ......................................................................................116
7.3 CO-ORDINATION ....................................................................................................117
7.4 recommendations ........................................................................................................119
7.5 LIMITATIONS ..........................................................................................................121
7.6 FUTURE RESEARCH ...............................................................................................121
Bibliography ........................................................................................................... 125
viii
List of Figures
Figure 2.1. The different styles of referee movement during a match (Gordon,
2014) ............................................................................................................ 15
Figure 2.2 .Classification of the pitch into lateral zones and central zone
(Source: Mallo et al., 2012) ......................................................................... 24
Figure 3.1. Schematic diagram of Prozone® analysis system ................................... 45
Figure 3.2. Path diagram drawn using SmartPLS ..................................................... 54
Figure 4 -4.1. Relationships between ball positions in left, right, and middle of
pitch.............................................................................................................. 63
Figure 4.2. Dendrogram of 25 referees (A to Y) clustered by their positions on
the pitch (1 to 5). .......................................................................................... 66
Figure 4.3. Relationships between B-R Dist Ave, B-R X Corr, B-R Corr Max,
and B-R Corr Max Lag ................................................................................ 70
Figure 4.4.PLS path model to predict Referee Position from Ball Position .............. 71
Figure 4.5.PLS path model linking Ball Position, Referee Position, Ball
Tracking, and Referee Attributes (Path coefficients and R2) ....................... 72
Figure 4.6.PLS path model linking Ball Position, Referee Position, Ball
Tracking, and Referee Attributes (t-tests for significance of path
coefficients) .................................................................................................. 72
Figure 5.1.Nine Ball X, Y zones on aerial view of pitch ............................................ 76
Figure 5.2. Frequencies of fouls in X, Y zones in first and second halves ................. 77
Figure 5.3. Frequency distribution of referees’ distances from fouls ....................... 79
Figure 5.4. Correlation between mean distance of referee from foul and ball ......... 80
Figure 5.5.Mean distances (± 95% CI) of referees from fouls in nine X, Y
Zones ............................................................................................................ 81
Figure 5.6.Contour plot of referees’ distances 5 s before foul vs. X, Y
coordinates ................................................................................................... 82
Figure 5.7.Contour plot of referees’ distances at time of foul vs. X, Y
coordinates ................................................................................................... 82
Figure 5.8.Mean distances (± 95% CI) moved by the referee at 0 to 5 s before
the fouls. ....................................................................................................... 83
Figure 5.9. Contour plot of referees’ movement at 0 to 5 s before the foul vs. X,
Y coordinates of pitch .................................................................................. 84
Figure 5.10.Frequency distributions of viewing angles ............................................ 85
Figure 5.11.Contour plots of viewing angles vs. X, Y coordinates of pitch ............... 87
Figure 5.12.Mean distances of referees from fouls (± 95% CI) vs referee
attributes (FIFA Class 1, 2, or 3; NQ = Not Qatari, Q = Qatari) .............. 89
ix
Figure 6.1.Frequency distributions of Basic and Severity Decision Scores .............. 93
Figure 6.2. Mean distances of referees from fouls (± 95% CI) vs. Basic and
Severity Scores ............................................................................................. 94
Figure 6.3.Mean distances of referees from fouls (± 95% CI) in Zone 5 vs.
Basic and Severity Scores ............................................................................ 95
Figure 6.4.Mean distances of referees from fouls (± 95% CI) in Zone 1 vs.
Basic and Severity Scores ............................................................................ 96
Figure 6.5.Viewing angles vs. Severity and Basic Scores.......................................... 99
Figure 6.6. Quality of Referee’s Decision Scores vs. Referee Experience .............. 100
Figure 6.7.PLS path model of relationships between Ball Position, Referee
Position, Viewing angles, Distance of Referee from Ball, Referee Ball
Tracking, and Referee Attributes (path coefficients and R2) ..................... 102
Figure 6.8.PLS path model of relationships between Ball Position, Referee
Position, Viewing angles, Distance of Referee from Ball, Referee Ball
Tracking, and Referee Attributes) (t-tests for significance of path
coefficients) ................................................................................................ 103
Figure 7.1. PLS path model of relationship between distance of referee from
foul and decision quality of referee (path coefficient and R2)................... 114
Figure.7.2. Proposed path model ............................................................................. 124

x
List of Tables
Table 3-1 Definitions of Variables Extracted from the Kinematic Data ................... 47
Table 3-2 Ratings of Referee’s Decisions for 58 incidents (E = Expert; R =
Researcher) .................................................................................................. 49
Table 4-1 Attributes of 25 Referees ............................................................................ 61
Table 4-2 Referee Classes and Nationality ................................................................ 62
Table 4-3 Ball Position in First and Second Halves .................................................. 62
Table 4-4 Referee Position in First and Second Halves ............................................ 64
Table 4-5 Profile of 25 Referees by their Positioning on the Pitch ........................... 67
Table 4-6 Ball Tracking in First and Second Halves ................................................. 68
Table 4-7 Comparison of B-R Corr Max Lag in 25 Referees .................................... 69
Table 5-1 Relationship between Position of Ball, Position of Referee, and
Frequency of Fouls ...................................................................................... 78
Table 5-2 Descriptive Statistics for Referees’ Distances from Fouls ........................ 79
Table 6-1 Relationship between Positions of Foul and Referee Decision
Making ......................................................................................................... 93
Table 6-2 Descriptive Statistics for Distances From Fouls When Referee
Decisions Were Correct ............................................................................... 97
Table 6-3 Descriptive Statistics for Referees’ Movements Before Fouls When
Decisions Were Correct ............................................................................... 98
Table 7-1 Factors Associated with the Quality of a Soccer Referee’s Decision
Making ....................................................................................................... 122
xi
List of Abbreviations
β Path coefficient
CI Confidence interval
CV Coefficient of variation
FA Football Association
FIFA Fédération Internationale de Football Association
ICC Intraclass Correlation Coefficient
p Probability
PLS-SEM Partial least squares structural equation modelling
QSL Qatar Stars League
r Pearson’s r correlation coefficient
R2 Effect size (proportion of variance explained)
SD Standard deviation
SPSS Statistical Package for Social Sciences
t t-test statistic

xii
Statement of Original Authorship
The work contained in this thesis has not been previously submitted to meet
requirements for an award at this or any other higher education institution. To the
best of my knowledge and belief, the thesis contains no material previously
published or written by another person except where due reference is made.
Signature:
Date: 7th
November 2016
QUT Verified Signature
xiii
Acknowledgements
Firstly, I would like to thank Allah (God), who helped me to achieve my goals
and finish my PhD thesis, by giving me strength and patience. Without his
assistance, bounty, grace and mercy this work would never have been completed.
Not easy (PhD) – so well done. In addition, there are lots of ways you can learn
about life, and undertaking research has been an effective one. I have the utmost
respect for my lecturers and colleagues, who have all been through this similar
process to reach this moment.
My very sincere and grateful thanks go to soul of my father, Dyab, and my
mother, Nagmah, who supported and encouraged me from the beginning of my
school life through my postgraduate years. My very sincere and grateful thanks to
my beloved wife Norah for her support to achieve my goals, although she never
stopped taking care of our children when I was busy. Her responsible attitude
increased my desire to achieve my goals. My love and gratitude also goes to my
oldest son, Wassem, who cared for his brothers and sisters when I was abroad. My
heartfelt thanks also to my other children, Sarrah, Lammar and Ammar, who
cooperated with each other to face any family challenge, and to meet the family’s
needs in the absence of their father. In addition, my special thanks and appreciation
to all of my brothers and sisters who prayed supported and encouraged me to achieve
my goals. Many thanks go to my extended family (all my nieces and nephews), who
believed that my success was a prize for the whole family; I could not have done it
without you.
I wish to express my sincere appreciation and gratitude to my supervision
team. Prof. Keith Davids who has the attention to detail and ability to see the golden
thread, also, he was instrumental in making the pieces fall together. Dr. Charles
Worringham probably deserves the most praise of anyone I have ever met for being
able to understand what I am trying to say before I have managed to come close to
saying it. Thanks Dr. Ian Renshaw, for his guidance, encouragement and support. I
appreciated their valuable comments, encouragement and positive criticism
throughout the development of this thesis. I learnt from their knowledge and
experience how to be a successful academically and a one who cared about their

xiv
students, their students’ outcomes, and the quality of their research. I take these
lessons with me to incorporate into my own academic career.
Many grateful thanks go to all of the Mr. Hani Ballan, Chief Executive Officer
of Qatar Stars league, who talked to Referees Committee in the Qatar Football
Association (RCQFA) and encouraged them to involve in my research. Similarly, I
express my appreciation for the help given by my friends Captain Abdulaziz Al-
eddan and Captain Abdulrhman Al-Zaid who were the expert panel. Moreover, I
thank all the referees and assistant referees who contributed to the research.
Likewise, I thank employs of the QSL, Prozone Sports Ltd and RCQFA who helped
to conduct in my research. I offer my thanks to all my friends who assisted me.
I am very grateful to technical help from HPCI Mr. Simon Denman. Also,
Many grateful thanks go to my statistical consulting Dr. Rabbea and Mr. David
Hardwick. Last but not least, I thank all the staff at QUT, especially those in the
School of Exercise & Nutrition Sciences who discussed with me many relevant
topics related to my thesis. My thanks also to the research centre staff especially
Miss Emma for their kindness, technical support, and access to the research facilities.
Finally, to my colleagues who shared the research room with me every day, thanks
for their smiles and daily support.
1
Chapter 1: Introduction
This chapter outlines the background the research (section 1.1) and presents the
research problem (section 1.2). The purpose of the research, the research questions,
defines the aims and objectives of the research are outlined in Section 1.4. Section
1.5 provides definitions of the terms used. Finally, section 1.6 outlines the remaining
chapters of the thesis.
1.1 BACKGROUND
The term soccer official refers to both the referee and the assistant referee in
the game of association football. Every soccer match is controlled by three officials:
a referee and two assistant referees, who have full authority to enforce the laws of the
game, in connection with the match to which they have appointed (FIFA, 2012). The
main role of a soccer official is to regulate the interaction of players by making
decisions to enforce soccer laws. When the decisions of soccer officials are not
applied correctly, then the match outcomes, such as the wrong team winning, have
significant consequences in professional competition (Maruenda, 2004). Incorrect
decisions may inflame a match, cause resentment among supporters and coaches, and
lead players into misconduct. Correct decisions tend to calm down tensions and
diminish excessive behaviour (Friman et al., 2004). The fine line between success
and failure may have financial repercussions for many teams, and so referees have
become even more accountable for their decisions (Lovell et al., 2014). It is
becoming increasingly more important to identify the factors influencing the quality
of the decision making of soccer officials. Research has focused on the influence of
individual and experience factors on decision making, including (a) the fitness levels
and mobility skills of soccer officials (Ardigò 2010; Bambaeichi et al., 2010; Bartha
et al., 2009; Castagna et al., 2002; 2007; 2011; Kizilet et al., 2010; Krustrup &
Bangsbo, 2001; Krustrup et al., 2002; Mascarenhas et al., 2009); (b) the individual
differences between officials with respect to their perceived stress and ability to cope
under pressure (Folkesson, et al., 2002; Page & Page, 2010); (c) the social pressure
and nationality of the officials (Dawson & Dobson, 2010); and (d) the relative
amount of experience the officials have in international and national level matches
(Castagna et al., 2007; Fruchart & Carson, 2011; Catteeuw et al., 2009).
2
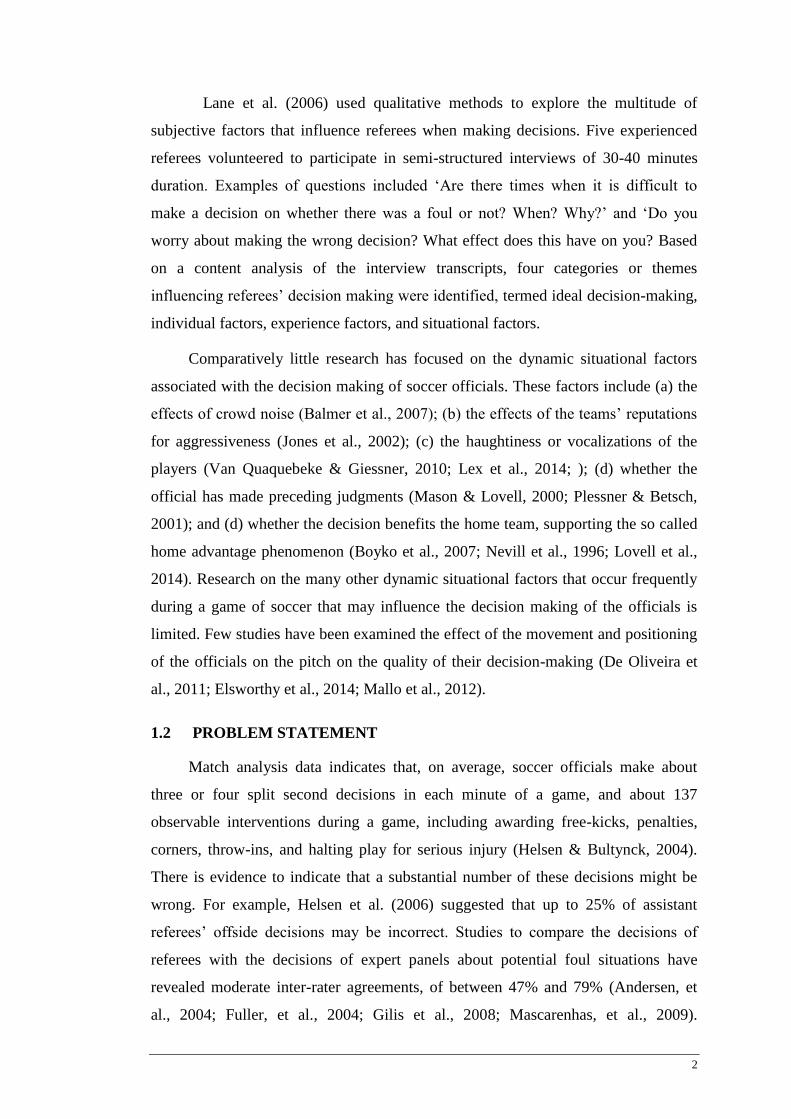
Lane et al. (2006) used qualitative methods to explore the multitude of
subjective factors that influence referees when making decisions. Five experienced
referees volunteered to participate in semi-structured interviews of 30-40 minutes
duration. Examples of questions included ‘Are there times when it is difficult to
make a decision on whether there was a foul or not? When? Why?’ and ‘Do you
worry about making the wrong decision? What effect does this have on you? Based
on a content analysis of the interview transcripts, four categories or themes
influencing referees’ decision making were identified, termed ideal decision-making,
individual factors, experience factors, and situational factors.
Comparatively little research has focused on the dynamic situational factors
associated with the decision making of soccer officials. These factors include (a) the
effects of crowd noise (Balmer et al., 2007); (b) the effects of the teams’ reputations
for aggressiveness (Jones et al., 2002); (c) the haughtiness or vocalizations of the
players (Van Quaquebeke & Giessner, 2010; Lex et al., 2014; ); (d) whether the
official has made preceding judgments (Mason & Lovell, 2000; Plessner & Betsch,
2001); and (d) whether the decision benefits the home team, supporting the so called
home advantage phenomenon (Boyko et al., 2007; Nevill et al., 1996; Lovell et al.,
2014). Research on the many other dynamic situational factors that occur frequently
during a game of soccer that may influence the decision making of the officials is
limited. Few studies have been examined the effect of the movement and positioning
of the officials on the pitch on the quality of their decision-making (De Oliveira et
al., 2011; Elsworthy et al., 2014; Mallo et al., 2012).
1.2 PROBLEM STATEMENT
Match analysis data indicates that, on average, soccer officials make about
three or four split second decisions in each minute of a game, and about 137
observable interventions during a game, including awarding free-kicks, penalties,
corners, throw-ins, and halting play for serious injury (Helsen & Bultynck, 2004).
There is evidence to indicate that a substantial number of these decisions might be
wrong. For example, Helsen et al. (2006) suggested that up to 25% of assistant
referees’ offside decisions may be incorrect. Studies to compare the decisions of
referees with the decisions of expert panels about potential foul situations have
revealed moderate inter-rater agreements, of between 47% and 79% (Andersen, et
al., 2004; Fuller, et al., 2004; Gilis et al., 2008; Mascarenhas, et al., 2009).

3
Consequently, referees have been accused of being subjective, inconsistent, and
biased in their decision-making (Boyko et al., 2007; Dawson et al., 2007; Garicano et
al., 2005; Lovell et al., 2014). Soccer officials must not only have a profound
knowledge of the laws of the game, they must also possess the perceptual-cognitive
skills, physical fitness, and mobility to take up appropriate positions on the pitch, so
that they can constantly keep up with the play, observing the movements of the
players and the ball (Gilis et al., 2008; Harley, Tozer, & Doust, 2002; Mallo et al.,
2012). Although several studies (e.g., Baláková et al., 2015; Casanova et al., 2009;
Helsen & Starkes 1999; Roca et al., 2013; Vilar et al., 2013; Ward & Williams,
2003; Williams, 2000) have focused on the perceptual-cognitive skills and of soccer
players during play, there has been limited research on the interactions between the
perceptions of soccer officials and their mobility and positioning on the pitch.
It is possible that incorrect positioning of the officials relative to the players
and the ball when an incident occurs might lead to erroneous or contentious decisions
(Elsworthy et al., 2014; Gilis et al., 2008; Krustrup & Bangsbo, 2001; Krustrup et al.,
2002; Oudejans et al., 2000, 2005). To date, the most intensive quantitative
investigation on the effect of positioning on the accuracy of the decision making of
top-class soccer officials was conducted by Mallo et al. (2012). Match analysis
revealed that the lowest number of referee decision errors occur in the central area of
pitch, when the referee observed the incidents from a critical range of 11 to 15 m.
It is evident that further research needs to be conducted on the movement and
spatial positioning of soccer officials on the pitch, as well as the position of the
incidents (e.g., corners, goal area or mid-field area, and distances from the goal) in
order to achieve more insight into how these situational factors influence the quality
of referees’ decision making. This gap in the research provided the rationale and
direction for the current programme of research.
1.3 PURPOSE STATEMENT
Lane et al. (2006) recommended that more quantitative research on the factors
that influence the decision-making processes of soccer officials should conducted.
Accordingly, a statistical analysis of match data was conducted to provide a better
understanding of how situational, individual, and experience factors influence the
quality of the decisions made by soccer officials. The secondary archival data used in
4
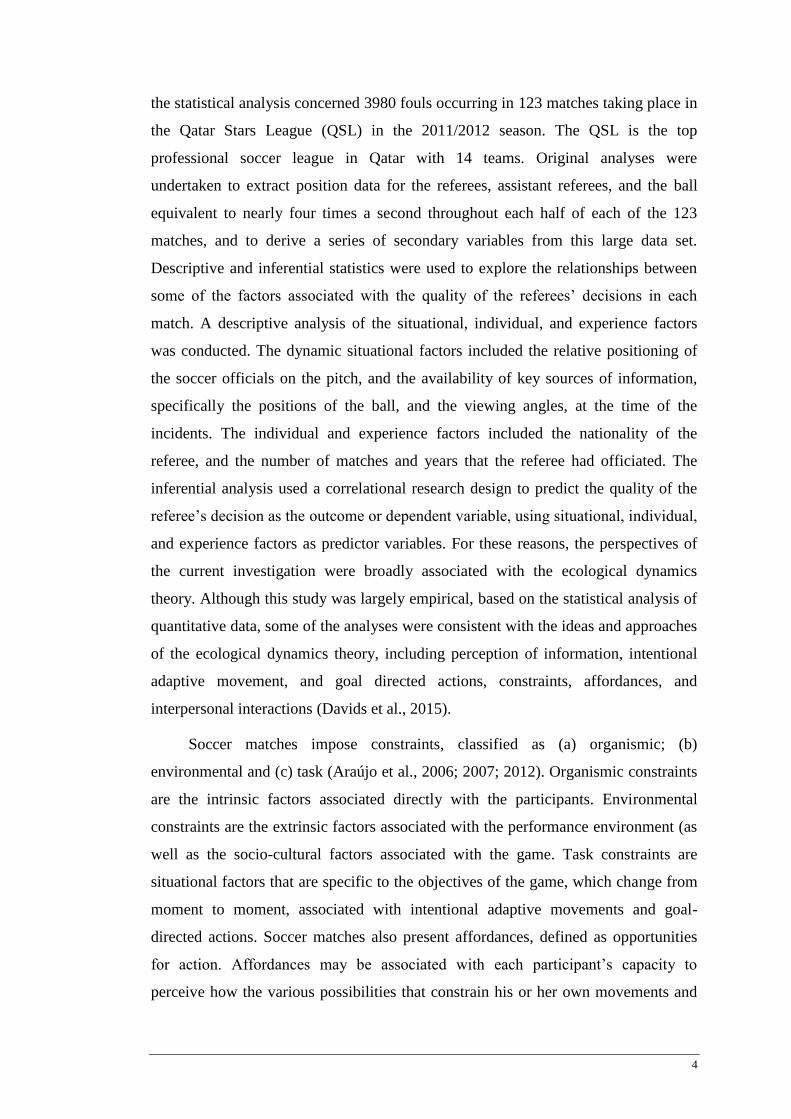
the statistical analysis concerned 3980 fouls occurring in 123 matches taking place in
the Qatar Stars League (QSL) in the 2011/2012 season. The QSL is the top
professional soccer league in Qatar with 14 teams. Original analyses were
undertaken to extract position data for the referees, assistant referees, and the ball
equivalent to nearly four times a second throughout each half of each of the 123
matches, and to derive a series of secondary variables from this large data set.
Descriptive and inferential statistics were used to explore the relationships between
some of the factors associated with the quality of the referees’ decisions in each
match. A descriptive analysis of the situational, individual, and experience factors
was conducted. The dynamic situational factors included the relative positioning of
the soccer officials on the pitch, and the availability of key sources of information,
specifically the positions of the ball, and the viewing angles, at the time of the
incidents. The individual and experience factors included the nationality of the
referee, and the number of matches and years that the referee had officiated. The
inferential analysis used a correlational research design to predict the quality of the
referee’s decision as the outcome or dependent variable, using situational, individual,
and experience factors as predictor variables. For these reasons, the perspectives of
the current investigation were broadly associated with the ecological dynamics
theory. Although this study was largely empirical, based on the statistical analysis of
quantitative data, some of the analyses were consistent with the ideas and approaches
of the ecological dynamics theory, including perception of information, intentional
adaptive movement, and goal directed actions, constraints, affordances, and
interpersonal interactions (Davids et al., 2015).
Soccer matches impose constraints, classified as (a) organismic; (b)
environmental and (c) task (Araújo et al., 2006; 2007; 2012). Organismic constraints
are the intrinsic factors associated directly with the participants. Environmental
constraints are the extrinsic factors associated with the performance environment (as
well as the socio-cultural factors associated with the game. Task constraints are
situational factors that are specific to the objectives of the game, which change from
moment to moment, associated with intentional adaptive movements and goal-
directed actions. Soccer matches also present affordances, defined as opportunities
for action. Affordances may be associated with each participant’s capacity to
perceive how the various possibilities that constrain his or her own movements and

5
actions are complemented, or perhaps not complemented, by the possibilities that
constrain the movements and actions of other players in the same or the opposing
team (Davids et al., 2015). Due to the limitations of the available data, it was not
possible in this study to fully explore constraints and affordances in relation to the
quality of the decision making of soccer referees.
The practical applications of the current research were to gain insight into the
quality of the decision making of soccer officials in order to develop more specific
and functional training programs. The findings of this study could be applied in
practice to develop training programmes to improve the decision-making abilities of
soccer officials. The training programmes could focus on the specific movement
patterns of soccer officials to optimize their positioning on the field at all times
during a match, and to optimize their decision-making capabilities.
1.4 RESEARCH QUESTIONS
The overall research question guiding this study was:
What factors predict the quality of a referee’s decision in a soccer match? The
overall research question has partitioned into the following five sub-questions:
RQ1: To what extent does the relative position of the ball and the referee on
the pitch (ball tracking) predict the quality of the referee’s decision?
RQ2: To what extent does the position of the foul on the pitch predict the
quality of the referee’s decision?
RQ3: To what extent does the distance of the referee from the foul predict the
quality of the referee’s decision?
RQ4: To what extent does the viewing angle predict the quality of the referee’s
decision?
RQ5: To what extent do the attributes of the referee predict the quality of the
referee’s decision?
How these research questions were related to prior studies are discussed in
the literature review.

6
1.5 DEFINITIONS
Activity Profile
The activity profiles of soccer officials undertaken during the match indicate
the different movement patterns and varying speed movements. The movement
patterns include standing still, walking, jogging, back running, side running, and
high-speed running.
Match Officials
Match officials means collectively all referees and the fourth official (FIFA,
2012).
Referee
The referee is a person who has full authority to enforce the laws of the game
in connection with the match to which he has been appointed (FIFA, 2012).
Assistant Referees
The two assistant referees also assist the referee in controlling the match in
accordance with the laws of the game. In particular, they may enter the field of play
to help control the 9.15 m (ten yards) distance. The referee can relieve an assistant
referee of his duties in the event undue interference or improper conduct and make a
report to the appropriate authorities (FIFA, 2012).
Referee’s Assessor: (Observer or raters)
A referee's assessor is a person evaluating and assessing the performance of
the referees by giving advice and constructive comments to help the development of
the referees while also using a marking system (FIFA, 2012).
Evaluation of Referee’s performance
The evaluation of the quality of referees’ decision-making was conducted
using a report template designed by the FIFA referees' committee to record relevant
information and to grade the performance of the referees objectively using a
numerical scale (FIFA, 2012).
1.6 THESIS OUTLINE
Chapter 2: presents a review to identify and discuss the multiple factors and
theories associated with the decision-making processes of soccer officials, using
qualitative and quantitative evidence collected from the literature. Chapter 3:
7
describes and discusses the research design, including the participants, the
instruments and procedures used in to collect the data, the methods of statistical
analysis, ethical considerations, and limitations. Chapter 4: presents the results of a
descriptive and inferential statistical analysis concerning the relationships between
the position of the ball and the position of the referee. Chapter 5: presents a
descriptive analysis of the spatial characteristics of the fouls and the referee
positioning and viewing angles at the times of the fouls. Chapter 6: focuses more
directly on answering the main research question of this study, specifically: What
factors predict the quality of a referee’s decision in a soccer match? The question
was answered by constructing empirical statistical models. Chapter 7 presents a
general discussion of the findings of this study, including its implications,
recommendations, limitations, and conclusions.

9
Chapter 2: Literature Review
2.1 INTRODUCTION
The purpose of this literature review is to summarize and discuss the empirical
and theoretical research associated with the decision-making processes of soccer
officials, using evidence collected from prior research. Empirical studies concerned
with the decision-making of soccer officials are reviewed in the first three sections,
without reference to a theoretical framework. Following the review of empirical
studies, a theoretical framework is introduced. The theory is included at the end of
the literature review, emphasizing its secondary importance, because the researcher
argues that research on the decision-making processes of referees cannot be
exclusively underpinned or sustained by existing theory.
2.2 IDEAL DECISION MAKING
Ideal decision-making, referring to the implicit desire to give a right and proper
decision, based on the correct enforcement of soccer laws, should be at the centre of
the mindset of all soccer officials. Ideally, all the decisions of soccer officials should
be correct, consistent, and impartial; however, there are famous examples of non-
ideal decision making, such as the infamous referee who allowed the so called "Hand
of God” goal when Diego Maradona punched the ball into the net (Murray, 2014).
Interviews with referees have indicated that they report a strong desire to
referee games properly; strictly performing to soccer laws, and be free from error.
(Lane et al., 2006). Correct decision-making based on good judgment, technical
exactness, impartiality, and immediate action are the ideal combination of attributes
that a soccer referee needs to ensure successful outcomes. In contrast, media reports
suggest that some referees appear not to be successful in promulgating this ideal.
Examples of some recent highly publicized non-ideal behaviours of soccer
referees include the internet report listing ten referee blunders in soccer (available at
http://worldsoccertalk.com/2014/04/08/top-10-referee-blunders-in-soccer/). Another
news report (Hooper, 2015) reveals a photograph of an extremely unusual incident
concerning a Brazilian referee, who also worked as a police officer, holding a gun in
one hand, whilst being held back by another official, after the referee had been
10
slapped and kicked by a player for declining to give a red-card to a player on the
opposing team. Another internet report (Moreno, 2015) describes cases of soccer
referees who have been accused of accepting bribes to fix the outcomes of matches.
It appears that the media have developed an increasingly more negative, biased, and
critical attitude toward the extreme behaviours of some soccer officials, explaining
why Lovell et al. (2014) asserted that some coaches, players, and supporters continue
to have a general lack confidence in the quality of referee decision-making.
2.2.1 Soccer Laws
The original laws of soccer were formulated in 1863 by the Football
Association (Dunning, 1999). The Soccer Law Book currently consists of seventeen
laws, formulated in order to achieve three key elements, which are freedom, justice,
and fun. The basic function of soccer officials is to regulate the interaction of soccer
players by enforcing these laws. The referee is a person who has full authority to
enforce the laws of the game in connection with the match to which he or she has
appointed (FIFA, 2012); however, all the match officials are required to make
appropriate decisions by interpreting the laws for every given situation that they
observe during a match. When the laws are not applied correctly, then the outcomes
of matches may be deleteriously affected (Byers, 2016).
The enforcement of the laws involves the need for soccer officials to
continuously perceive and process information. Enhanced fitness and mobility skills
are required for a referee to follow the play and to maintain a good position in order
to apply the laws of soccer in an accurate and consistent way. The problem is that
different referees may not enforce the same law in the same way (e.g., after
observing an illegal tackle or a foul in the penalty area) depending upon a multitude
of individual, situational, and environmental, factors (Mallo et al., 2012). Although
the laws of soccer are objective and mandatory, and are meant to promote
consistency, the ways in which the laws are interpreted in different situations and
contexts by different soccer officials is often subjective and inconsistent (Lane et al.,
2006).
2.2.2 Accuracy/Error
A correct decision has generally been perceived to be accurate whilst an
incorrect decision has generally perceived to be caused by human error.

11
Consequently, referees tend to equate their incorrect decisions to human tendencies.
Human error was highlighted by one of the participants interviewed by Lane et al.
(2006, p. 247) stating that “I just think that at the end of the day we’re human, and
we make mistakes. We probably do not make as many mistakes as the players do, but
unfortunately, all of our mistakes are highlighted. So nobody wants to make
mistakes, but we’re human, so we make mistakes”. Accepting incorrect decisions
simply as human error is a method that soccer officials and other professionals
appear use in order to cope with the stress and pressure that is inherent in trying to
always make correct decisions (Page & Page, 2010).
2.2.3 Professionalism
According to Lane et al. (2006) professionalism is a coping strategy, which has
used by soccer referees in the face of making inaccurate decisions. Professionalism
implies that the officials must maintain their objectivity and honesty and conform to
the high standards of skill in decision-making that supporters, players, and coaches
expect of them. It is not professional for a referee to want to “crawl up and want the
ground to swallow you” (p. 249) after making an inaccurate decision. A referee
cannot afford to show signs of being affected by pressure because supporters,
players, and coaches see this as a sign of weakness. If referees experience a negative
emotional reaction to a decision made early in a match, then this reaction may
influence the quality of their decision-making later in the match. For example, media
reports frequently allege that referees make so-called concession decisions, implying
that they are more likely to award a dubious penalty to the same team if no decision
had given to that team in an earlier similar situation in the match (Mason & Lovell,
2000; Plessner & Betsch, 2001).
2.2.4 Fitness
Harley et al. (2002) stated that, “An adequate level of physical fitness is
required not only for correct positioning but also to reduce fatigue and any
detrimental effects this may have on the referee’s decision-making.” (p. 137). Ideal
decision-making, involving the accurate enforcement of soccer laws and
professionalism is therefore considered to be a function of physical fitness. For this
reason, soccer officials must complete the FIFA fitness tests to be eligible to referee
in any competition regulated by the FIFA; however, research evidence indicates that
the outcomes of fitness tests do not necessarily predict the soccer officials’ match

12
related performance, reflected by their activity profiles during matches (Cerqueira et
al., 2011). Castagna et al. (2011) examined the relationships between fitness tests and
match-related performance of soccer officials and recommended that there should be
a change of direction test as part of the fitness test. The results demonstrated that the
50-m and 200-m sprint performance was poorly correlated with distance covered in
matches. Mallo et al. (2007) and Weston et al. (2004) also found that the results of
fitness tests were not correlated with the movement demands placed on soccer
officials during matches. The results showed that the top-class referees experienced
fatigue at different stages of the match despite passing the fitness tests. Mallo et al.
(2009a) examined the results of cardiovascular tests on top class soccer referees;
however, the heart-rate data did not correlate with total match distance or to distance
covered by high-speed running.
In conclusion, changes in the protocols defined for the FIFA referees’ fitness
tests are needed to predict a referee’s match-related fitness, and hence to improve the
quality of their decision making. Further modifications of the tests are required if
they are to be considered valid measures of match related fitness. More research is
necessary to improve the FIFA fitness tests based on the activity profiles of soccer
officials (Cerqueira et al., 2011).
2.3 INDIVIDUAL FACTORS
2.3.1 Opinion
The personal opinion of a referee in the face of making a difficult decision
encompasses subjective interpretations of the laws of the game. Many of the
decisions of referees may be highly subjective; including yellow cards after a foul is
called, because different referees might have different opinions based on the same
incident. Decisions are also correlated with subjective factors such as the team’s
rank, budget, and the size of the crowd in home games (Soares & Shamir, 2016).
Lane et al. (2006) quoted a referee stating “somebody goes into a challenge, that
could be a yellow card, you think to yourself this is the first minute of a game, do I
need this yellow card in the first minute, was it really that serious?” (p. 248).
Opinions incorporate guessed reactions, which may be guided by experience. As well
as interacting with experience, referees’ opinions may interact with social pressure,
through how they cope with the reactions of the crowd and the players.

13
According to Lane et al. (2006) opinion is the most subjective of the
individual factors that influence referees’ decisions, commenting that, “there is
always room for opinion and the subjectivity that this brings with it” (p. 248).
Opinion may be considered as a continuum, with common sense at one end, and
formal regulations at the other end. A referee’s opinion may fall between either of
these two extremes, or at any point between the two. Consequently, opinion is an
important subjective factor that may define individual differences between referees.
2.3.2 Concentration
Helsen and Bultynck (2004) determined that referees have to make about 200
to 250 decisions per match, with an average of about 40 foul play incidents awarded
per match. Such a high level of decision-making requires intense concentration as
well as rapid oculomotor activity (Sanabria et al., 1998). Physical and mental fatigue
and anxiety may become significant factors influencing referees’ decision making,
because feeling tired and anxious may have negative repercussions on cognitive
demands, including lack of concentration and reduced problem solving ability
(Helsen & Bultynck, 2004; Rontoyannis et al., 1998; Verheijen et al., 2002).
Accordingly, Mallo et al. (2012) reported that the proportion of incorrect referees’
decisions increased toward the end of soccer matches, suggesting that fatigue and
reduced concentration may be possible causal factors. In contrast, De Oliveira et al.
(2011) found that soccer referees made fewer mistakes toward the ends of matches,
and attributed this to a lower level of anxiety when the end of the match was near.
2.3.3 Control
The extent to which the referee’s control of the game has perceived to be
threatened can influence decision-making. Control is a form of self-composure,
which, if it breaks down, may sometimes lead a referee into making an incorrect
decision. As asserted by one referee interviewed by Lane et al. (2006, p. 248) “If the
referee isn’t in full control, what chance has anybody else got?” Fruchart and Carton
(2012) suggested that some referees might deliberately exert their control over
players in order to emphasize their skills in regulating situations of potential conflict.
For example, Lane et al. quotes one referee as stating, “If my control is threatened as
a referee, I will caution and send off” (p. 249).
14
2.3.4 Nationality
FIFA rules do not permit soccer officials to be members of the same
association as the two national soccer teams competing in an international match,
consequently bias or favouritism toward the official’s home nation should not
generally be an issue. Nevertheless, there may be differences in the styles of play and
decisions associated with the nationality of the referees and the players, known as the
between-country effect (Helsen & Bultynck 2004). Dawson and Dobson (2010)
analysed data from five seasons of European cup soccer matches and revealed that
nationality may have an important influence on the decision making of referees.
They provided evidence to indicate that officials from the larger football associations
(England, France, Germany, Italy and Spain) were less prone to favouritism or bias
compared to referees from smaller associations. Officials from Holland, Norway,
Russia, Scotland and Sweden tended to award fewer disciplinary points to the home
team. Belgian, Dutch, Portuguese, Russian and Swedish referees tended to issue
fewer disciplinary points to the away team. Greek and Romanian clubs playing at
home or away tended to incur more disciplinary sanctions from the referees, whilst
teams playing against Italian opposition tended to be issued with fewer sanctions.
These international differences, however, may not all be caused by referee bias,
because they may also be associated with the different styles of play of different
European national teams. Referees’ decision-making may therefore be influenced by
general perceptions of the style of play of specific countries. Consequently, Dawson
and Dobson (2010) concluded that when faced with a difficult decision, a referee
may be influenced by his national identity, the nationality of the team, his
perceptions of the team’s quality and reputation.
To date, no research has been conducted on the decision-making styles of the
elite soccer officials in the Middle East, specifically in Qatar. It was therefore
considered important in the current study to take into account the possible
differences in the styles of refereeing in Qatar, compared to other countries.

15
2.3.5 Mobility
The mobility of soccer officials is a crucial aspect of their roles. They must
track the ball and keep up with play at all times during a match, despite being, on
average, 10 to 15 years older than the players (Weston et al., 2010). The different
styles of mobility of referees across the pitch have been defined as (a) diagonal; (b)
zigzag or sinusoidal; and (c) linear, or straight, as illustrated in Figure 2.1 (Gordon,
2014). These styles of referee movement were approved by the International Football
Association Board for additions to the Laws of the Game, with effect from July 1,
2013, as described by Gordon (2014).
Figure 2.1. The different styles of referee movement during a match
Referees need to use different styles of movement in order to be in the
optimum position and at the right time to make correct decisions. The referee's
position is out in the field, moving from almost one end of the pitch to the other. To
that end, FIFA (1982) suggested that the diagonal system of movement ensured the
best view of play. Referees were advised to move diagonally across the field, from
corner to corner, usually following a path that puts the area of active play to their
right. Sometimes, however, referees also following a sinusoidal or linear path. The
two assistant referees take a position just outside the touchlines on one side of the
pitch, diagonally opposite from their counterpart. The assistant referees can move
only between the goal line and the midfield line. There are two areas at the lower left
and upper right corners of the pitch, where the referee and the assistant referees are
not as close to the touch lines as they might be, so they may not always be in a
position to see the actions of players when active play is inside the two penalty areas.

16
Having the mobility skills to take up an optimal position on the pitch may be
essential for the soccer officials to make the correct decisions in relation to their
position. For this reason, although soccer referees are generally much older than
most players, they often cover more ground than mid-fielders and they need to be
comfortable with repeated high-intensity sprints (Weston et al., 2004).
The total distance covered is one factor reflecting the mobility performance of
both players and officials (Mallo et al., 2009a). Several researchers have examined
the total distance covered by soccer officials during competitive matches. Match
analysis data have revealed that referees at a competitive match cover on average
9.438 km (Catterall et al., 1993). Helsen and Bultynck (2004) as well as Krustrup et
al. (2002) reported the total distances covered by the referee and assistant referee
were 10.227 ± 0.90 km and 6.76 ± 0.83 km respectively. Mallo et al. (2009a)
reported that, the total distance covered during matches during the FIFA U-17 World
Championship 2003 was 10,218 ± 643 m, with no difference between both halves.
Weston et al. (2004) reported a significantly greater distance covered by referees of
11.622 ± 0.739 km.
Weston et al. (2004) examined match analysis data collected from 19 fulltime
professional referees during a total of 254 matches in the 2004/2005 season in the
English Premier League, focusing on high speed running performance. In order to
follow the play, referees regularly undertook repeated short high-intensity bouts of
exercise. The mobility of the referees was found to be similar to that of the players,
in that the referees’ high-intensity running correlated with the players’ high-intensity
running.
Weston et al. (2011a) investigated the between-match variability in the
mobility of 59 referees officiating in the English Premier League and Championship
from 2003/2004 to 2007/2008. The between-match coefficients of variation (CV =
Mean/Standard Deviation) were very high for running distance (25.9%), recovery
time (32.7%), explosive sprints (34.3%), total number of sprints (54.0%), and
number of match fouls (28%). Smaller CVs were observed for total distance covered
(3.8%), top sprinting speed (10.9%), distance from the ball (4.2%) and distance from
fouls (4.3%). The findings indicated that research on referee mobility requires large
sample sizes to obtain precise data.

17
Match analysis has also revealed differences between the mobility of referees
in the first and second half. Krustrup and Bangsbo (2001) as well as Asami et al.
(1988) reported a second-half increment in the total distance covered by referees.
Catterall et al. (1993) as well as Castagna and D’Ottavio (2007) reported that the
total distance covered was less in the second half compared to the first half. In
contrast, Mascarenhas et al. (2009) in contrast reported that there was no difference
in total distance covered in the two halves.
Match analysis has revealed differences between referees and assistant referees
in their mobility. Krustrup et al. (2002) found that distance covered and high
intensity running was greater in referees than assistant referees. Other observations
(Helsen & Bultynck, 2004, Mallo et al., 2009a; Weston et al., 2011a) revealed that
the total distance covered by assistant referees was significantly lower than for
referees, and the movement patterns varied between referees and assistant referees.
Little is known about how the mobility of referees influences the quality of
their decision-making. Button et al. (2005) suggested that there was no evidence to
confirm that high levels of physical performance led to improvements in the
decision-making ability of soccer officials. Mallo et al. (2012) found that the risk of
making incorrect decisions among referees and assistant referees increased at the end
of the matches, suggesting that physical and mental fatigue may an important factor
associated with the quality of decision-making. Elsworthy et al. (2014) found no
significant correlations between the soccer officials’ distance covered and their
ability to make a correct or incorrect decision at the time of a free kick in Australian
football. They also found no significant effect of the movement velocity of the
referee at the time of the incident on the quality of the referee’s decision.
2.3.6 Personality
Although research has revealed that relationships exist between personality
traits and decision making processes in business and educational environments (e.g.,
Chamorro-Premuzic & Reichenbacher, 2008) little is known about how personality
traits affect decision making in the context of refereeing a soccer match. Austin
(2004) as cited by Sayfollahpour et al. (2013) noted that, personality characteristics
predispose individuals to perform various actions in specific situations, which could
therefore influence task performance. Lane et al. (2006) also suggested that
personality was a factor that may affect the quality of a referee’s decisions. The
18
decision to take a particular action after an incident may vary depending upon
whether the referee is aggressive and shouts a lot, or laid back and quiet. Personality
may impact on how referees react to stress and pressure. Referees with a nervous or
introvert disposition may react differently to incidents compared to those who are
confident and extrovert. Sayfollahpour et al. (2013) conducted a survey, using a
psychometric instrument to measure the personality traits of 61 Iranian soccer
referees in the Tehran Premiere League. The results revealed that the
conscientiousness and flexibility of the referees had significant positive correlations
with their judgment quality; however, there were no significant correlations between
judgement quality, neuroticism, extraversion, and agreeableness. Additionally, Lane
et al. (2006) suggested that the personal life of referees may have an unconscious
impact on their decision-making. For example, one referee at interview commented
“I might have had a row with the wife. There are a lot of things that can affect you,
which probably you’re not aware of” (p. 249).
Mental toughness is a personality trait defined as “the presence of some or the
entire collection of 25 experientially developed and inherent values, attitudes,
emotions, cognitions, behaviours that influence the way in which an individual
approaches, responds to, and appraises both negatively and positively construed
pressures, challenges, and adversities to consistently achieve his or her goals”
(Coulter et al., 2010, p. 75). There is extensive literature on the mental toughness of
athletes. Only one investigation has focused on the mental toughness of referees
(Slack et al., 2014). In this investigation, 15 English Premier League referees were
interviewed, and inductive and deductive content analysis was used to extract
emerging themes from the interview transcripts. The emerging themes revealed
patterns of behaviour and cognitive strategies that appeared to be unique to the
mental toughness of soccer referees. The behaviour patterns reflecting mental
toughness included acting as a barrier between players, making eye contact with
players, and looking calm and composed. The cognitive strategies included drawing
upon life experiences, being aware of the emotions of players, and tactical
awareness.

19
2.3.7 Perceptual cognitive performance
Several studies (e.g., Baláková et al., 2015; Casanova et al., 2009; Helsen & Starkes
1999; Roca et al., 2013; Vilar et al., 2013; Ward & Williams, 2003; Williams, 2000)
have focused on the relationship between the perceptual-cognitive skills of soccer
players and their performance during play. These studies provided inconclusive
results because the perceptual-cognitive skills of soccer players, including their
visual search behaviour, and their knowledge of situational probabilities, depend on a
large variety of individual and situational factors, including their competition level,
their positional status on the field, and their physiological and physiological profiles.
Consequently, perceptual-cognitive skills are very variable between different players.
When compared with their less-skilled counterparts, skilled players are better at
anticipating opponents' intentions based on perceived information, and typically
exhibit more effective visual search strategies. The cognitive theoretical approach
implies that the multidimensional performance characteristics of professional soccer
players develops through a complex diversity of interacting processes and events,
involving different rates of maturation, training, and learning, as well as differences
in their developmental environments (Elferink-Gemser, & Visscher, 2011).
The relatively few studies that have focused on the perceptual-cognitive skills
of soccer officials and the quality of their decisions have also produced variable
results, depending on positional status and individual factors. It is generally agreed
that referees must have excellent perceptual-cognitive skills in order to make the
correct decisions, however these skills vary between individuals. The perceptual-
cognitive skills of referees are significantly different from those of assistant referees.
(Catteeuw et al., 2009). Referees tend to outperform assistant referees in foul-play
assessments, whereas assistant referees tend to outperform referees in offside
decision-making. The perceptual-cognitive skills of referees may vary with respect to
their age, because memory capacity, speed of processing, and perceptual and
peripheral motor speed tend to decline between the ages of 30 to 45. Feeling tired
and anxious may have negative repercussions on cognitive-perceptual demands,
including lack of concentration and reduced problem solving ability (Helsen &
Bultynck, 2004; Rontoyannis et al., 1998; Verheijen et al., 2002).

20
2.3.8 Expertise
A combination of optimal individual factors discussed above results in
expertise. It stands to reason that the expertise of soccer officials should enhance the
quality of their decision making either directly (i.e., the greater their expertise, then
the more accurate should be their decisions) or indirectly (i.e., the better they are able
to read the game and track the ball, then the more accurate should be their decisions).
The level of experience of the referee should therefore be recorded and taken into
account when conducting a quantitative analysis of the quality of referees’ decisions.
Few studies, however, have investigated the relationship between the
experience of soccer official and their decision-making. Weston et al. (2010)
investigated the effects of age on the match performance of 22 professional soccer
referees (age range 31-48 years) officiating at 778 FA Premier League matches.
Despite covering less total distance, having a slower high intensity running speed,
and performing fewer sprints, the older more experienced referees (43 to 48 years)
were able to maintain an average distance from fouls that was comparable to that
recorded by the younger less experienced (31 to 36 years) referees. The reduced
physical match performances associated with increasing referee age did not appear to
impact upon the older referees' ball tracking and ability to keep up with the play. It
would appear that experience enabled older referees to become better attuned to the
movements of the players enabling them to use more efficient ball tracking
strategies.
Weston et al. (2011) investigated the between-match variability in the match
performances of 59 soccer referees' in the English Premier League. The variability in
match performance (including the number of match fouls) was found not to be
dependent on the age or the experience of the referees. Catteeuw et al. (2009)
examined the effect of the years of officiating and the hours of practice for a week on
decision-making both for referees and for assistants. Both factors were found to be
positively correlated with refereeing skills. Length of experience interacts with other
factors, for example, it may help to reduce inaccuracies in the face of difficult
situations. As highlighted by one of the participants interviewed by Lane et al. (2006)
“The more experience you got the better your decisions were” (p. 247).
An alternative method of investigating the effects of referee experience on the
quality of decision-making is to use a laboratory-based experiment. For example,

21
Gilis et al. (2008) reported that, when observing computer animations of simulated
offside situations, FIFA assistant referees were more accurate in recalling the
position of the attacker and the defender compared to the Belgian (National) assistant
referees, especially for the offside situations around the offside line. Furthermore, the
FIFA assistant referees with international experience were more accurate when
assessing simulated offside situations compared to assistant referees with only
national experience. The extent to which these findings were correlated with the
actual match performance of the referees was not, however, determined.
2.4 SITUATIONAL FACTORS
2.4.1 Crowd Factors
Crowd factors may influence referees’ decisions in an indirect manner. Nevill
et al. (2002) asked 40 qualified referees to view an edited videotaped game of soccer
in the English Premier League, which included 47 challenges. After each challenge,
the video was stopped, and the referees were asked to adjudicate whether the
challenge was a foul or not, and if a foul, to which team the decision should be
awarded. Half the referees watched the videotape with audible crowd noise and the
other half in silence. The referees who watched the game with audible crowd noise
gave significantly fewer decisions against the home team, implying that crowd
pressure may influence referee’s decision-making. This analysis may be criticized
because it was not carried out in an ecologically valid setting, during a live match.
Subsequently, Balmer et al. (2007) provided evidence to show that increased anxiety
associated with crowd noise during match play was associated with inconsistent
referee’s decisions. The interviews conducted by Lane et al. (2006) also confirmed
that crowd factors may influence referees’ decisions in an indirect manner. Although
referees do not consciously appear to make decisions based on crowd noise, it is
possible that sub-conscious factors are operating, exemplified by one referee stating
“I wouldn’t say, well I’m going to give this decision this way because that crowd
shouted at me or I’m going to stick with this one because they’re the home crowd. I
don’t think that consciously, I think that whatever happens, a lot of it is sub-
conscious, and we can all be affected sub-consciously can’t we?” (p. 245). The
evidence provided by Dawson and Dobson’s (2010) analysis of match data from five
seasons of European cup soccer concluded that the relative size of the crowd
mattered more than its absolute size. Both the home team and the away teams were

22
more likely to incur more disciplinary points if the stadiums were close to full
capacity, implying that the social pressure of the referee to favour the home team was
correlated with crowd density.
2.4.2 Player Reactions
According to Folkesson et al. (2002) the verbal reactions of players to their
decisions are ignored by most referees, possibly because, this kind of reaction has
become normal in soccer matches. Mellick et al. (2005) recommended that referees
should use certain communication strategies to alleviate the impact of player’s
aggressive verbal reactions. Lex et al. (2014) investigated the influence of a
potentially fouled player’s vocal reactions on the referee’s decisions. Experienced
soccer referees watched video clips of matches that were presented either without
sound or with sound where the player’s vocalisations were clearly audible. The
referees were asked to make judgements regarding fouls, direction of play and
personal penalties. The findings revealed that players’ vocalisations had no
significant impact on the quality of the referee’s decisions. However, once a referee
made a decision, the player’s vocalisations led to an increased number of personal
penalties (increase in yellow cards) for the foul-causing player. Consequently, the
vocalisations of a player after a foul may be a signal that influences the referee’s
subsequent decision-making.
2.4.3 Environmental Factors
The most important environmental factor influencing the quality of the
decision-making processes of referees appears to be the venue of the match. It has
been known for many years that referees tend to give more decisions in favour of the
home team. Anecdotal evidence and statistical examination of game records indicates
home teams appear to win more often than away teams. Home teams are awarded
more penalties and receive less bookings (Nevill et al., 1996; 1997; 2002; Balmer et
al., 2007) resulting in the home team advantage phenomenon. This phenomenon was
confirmed by the analysis of match data from five seasons of European cup soccer
conducted by Dawson and Dobson (2010) providing evidence to show that referees
tend to favour home teams when disciplining players. The strongest home teams
tended to incur significantly fewer disciplinary points.

23
Another environmental factor that could potentially influence referees’
decision-making is challenging climatic conditions, ranging from very cold to very
hot, depending on the venue of the match. This factor has only previously been
investigated in the laboratory. Lee et al. (2014) investigated whether exposure to hot
and cold environmental conditions affected the cognitive functioning of soccer
referees. They investigated the effects of very cold (-5°C) very hot (30°C) and
temperate (18°C) conditions on the vigilance and dual task capacity of referees
subjected to intermittent exercise protocols using treadmills in the laboratory. The
cognitive function of the referees was found not to vary significantly with respect to
differences in temperature. It is possible, however, that the prescribed exercise
protocols and ambient temperatures may not have created sufficient physiological
impact to alter cognitive functioning. Consequently, the results obtained in the
laboratory may not be directly translatable into soccer specific match conditions.
2.4.4 Positions of Officials
This section focuses on the positions of the referees, and not the assistant
referees. Although the relative positioning of the referee, relative to foul play
incidents during a soccer match is considered to be of significant technical
importance, this issue has received relatively limited attention from researchers.
Most studies on the spatial positioning of referees has been conducted to measure
their ball tracking ability, to keep up with the play, but not explicitly to determine if
referee positioning influences decision making (Elsworthy et al., 2014; Gilis et al.,
2008; Oudejans et al., 2000, 2005). Krustrup and Bangsbo (2001) suggested that
being too close to foul play incidents may compromise the ability of the soccer
officials to view and analyse the entire sequence of events, whereas being too far
away could raise the risk of incurring errors, as the incidents might not be seen with
clarity. Thus, the distance between the referee and the incident could affect the
quality of the decisions being made and the subsequent outcome of the match.
Krustrup et al. (2002) observed no significant differences in the distances of the
referee to foul play incidents in the middle zone of the pitch; however, there were
significant increases in the distances between the referee and incidents in the lateral
attacking zones. The attacking zones are crucial areas of the pitch where incidents
may occur that are not clearly observed because the referee is too far from the action.
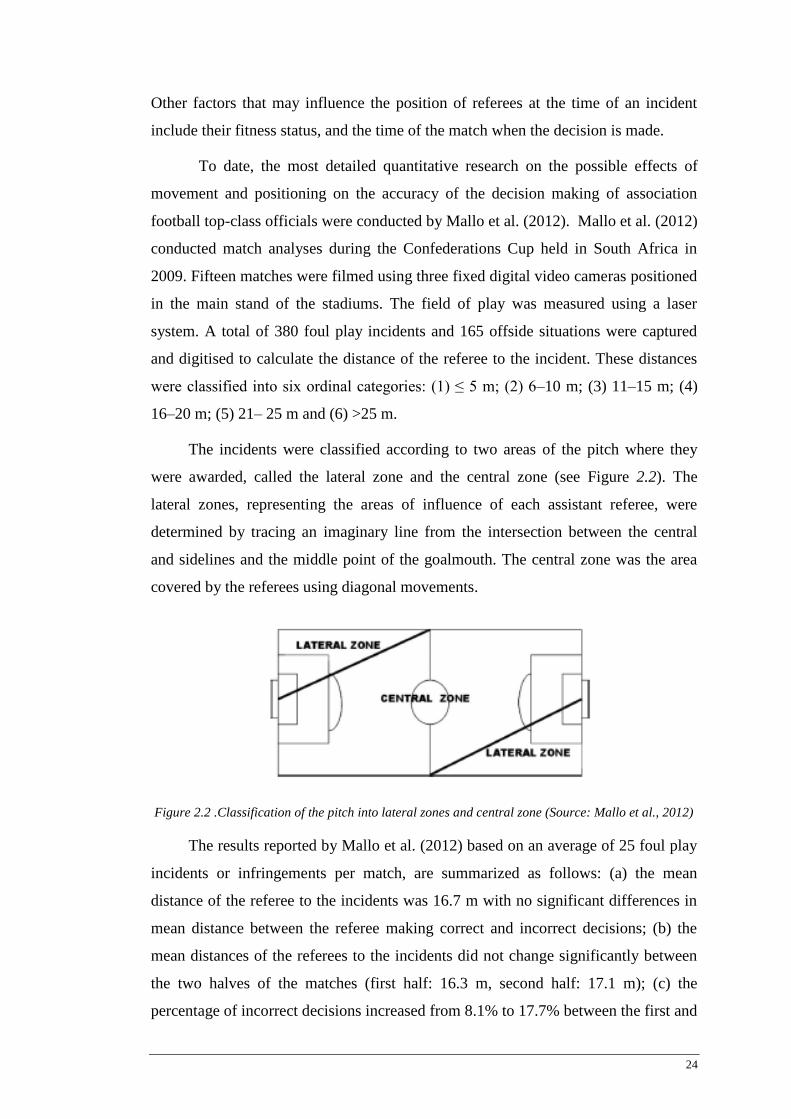
24
Other factors that may influence the position of referees at the time of an incident
include their fitness status, and the time of the match when the decision is made.
To date, the most detailed quantitative research on the possible effects of
movement and positioning on the accuracy of the decision making of association
football top-class officials were conducted by Mallo et al. (2012). Mallo et al. (2012)
conducted match analyses during the Confederations Cup held in South Africa in
2009. Fifteen matches were filmed using three fixed digital video cameras positioned
in the main stand of the stadiums. The field of play was measured using a laser
system. A total of 380 foul play incidents and 165 offside situations were captured
and digitised to calculate the distance of the referee to the incident. These distances
were classified into six ordinal categories: (1) ≤ 5 m; (2) 6–10 m; (3) 11–15 m; (4)
16–20 m; (5) 21– 25 m and (6) >25 m.
The incidents were classified according to two areas of the pitch where they
were awarded, called the lateral zone and the central zone (see Figure 2.2). The
lateral zones, representing the areas of influence of each assistant referee, were
determined by tracing an imaginary line from the intersection between the central
and sidelines and the middle point of the goalmouth. The central zone was the area
covered by the referees using diagonal movements.
Figure 2.2 .Classification of the pitch into lateral zones and central zone (Source: Mallo et al., 2012)
The results reported by Mallo et al. (2012) based on an average of 25 foul play
incidents or infringements per match, are summarized as follows: (a) the mean
distance of the referee to the incidents was 16.7 m with no significant differences in
mean distance between the referee making correct and incorrect decisions; (b) the
mean distances of the referees to the incidents did not change significantly between
the two halves of the matches (first half: 16.3 m, second half: 17.1 m); (c) the
percentage of incorrect decisions increased from 8.1% to 17.7% between the first and

25
second halves; (d) about three quarters of the incidents were awarded in the central
areas, and about one quarter in the lateral areas close to the assistant referees; (e) the
percentage of incorrect referee decisions (error rate) in the central area was 13.2%
and 17.2% in the lateral areas; (f) the error rate in the central areas increased from
9.3% to 17.0% from the first to the second half; (g) the lowest error rate in the central
are occurred when the referee detected foul plays from distances of between 11 and
15 m; and (h) the risk of referee errors increased when the referees were more distant
from the infringements.
Mallo et al. (2012) attempted to explain why the referee error rate was higher
in the lateral than in the central areas of the pitch. The presence of the assistant
referees close to the lateral areas did not appear to facilitate the decision making of
the referee. Mallo et al suggested that the lateral areas represent complex scenarios,
in which the referee is farther from the situation than the assistant referees, whilst the
assistant referees are facing the second-last defenders to identify offside positions.
It is evident that the quality of the decision making of the referee may be
related to the distance between the active play and the referee’s position, providing
the rationale to conduct further research involving statistical models to predict the
strength of this relationship.
2.4.5 Viewing Angle
Viewing angles may be associated with the quality of referee decision making.
The viewing angle, as defined by Mallo et al. (2012) is the angle of view from the
play calculated from the position of the assistant referee to the ball and the attacking
or defending player closest to the attacking goal. The angle of view was categorised
into: (i) 0–15o; (ii) 16–30
o; (iii) 31–45
o; (iv) 46–60
o; (v) 61–75
o and (vi) > 75
o. Mallo
et al. (2012) found that about 13% error of the offside decisions of assistant referees
were incorrect; however, the risk of making incorrect decisions was reduced when
the assistant referees viewed the offside situations from a viewing angle of between
46◦ to 60◦. The frequency of possible offside situations was not uniformly distributed
in relation to the viewing angle. 60.3% of the incidents were judged with angles of
view between 0o and 30
o. The greatest percentage of incorrect offside decisions was
recorded with angles of view wider than 75o. There were no significant differences in
mean viewing angles between correct (28.8o) and incorrect (24.5
o) decisions.

26
According to Oudejans et al. (2005) the distance to the offside line and the
angle of view is a key factor to help an assistant referee make a decision. Oudejans et
al. (2005) examined the relationship between the position of assistant referees and
the quality of their offside decisions. They identified the potential impact of
situations in which the assistant referee had to judge whether a player was offside. It
determined: (i) where the assistant referees were positioned relative to the second last
defender, (ii) what the distance and speed of their locomotion was at those moments,
and (iii) whether the offside decisions of the assistant referees were correct or not.
The assistant referees flagged 21 times, while 14 of these flaggings were correct, on
seven of these occasions the assistant referees flagged when the player was actually
onside, and five occasions the assistant referees did not flag when the player was
actually offside. In the 14 error situations the assistant referee, the receiving attacker
and the second last defender were positioned in such a way that the assistant referee
could have easily misperceived the actual relative player positions on the basis of the
optical angle (i.e., between the second last defender and the receiving attacker). This
angle only periodically specifies who is closer to the defender's goal line (attacker or
defender) when the assistant referee is positioned on the offside line. Therefore,
when the assistant referee is not on the offside line, this angle no longer correctly
specifies whether or not the attacker is in an offside position. In most cases, being
positioned offline, and consequently observing relevant players and the offside line
at an oblique angle, provided a plausible explanation for the type of errors made in
judging offside. Finally, these observations established that in the majority of cases,
assistant referees were not positioned on the offside line when judging offside.
2.5 THEORETICAL FRAMEWORK
A credible theoretical framework guides effective action, including a well-
defined approach to research and its applications (Gay & Weaver, 2011; Greenwald,
2012). The methods used in the current study were not exclusively underpinned by a
fundamental theoretical framework, but its perspective was broadly associated with
the ecological dynamics theory. This theory has emerged in the last decade in an
attempt to explain the behaviours that vary across space and time between the
participants in sport/performance environments, focusing on the principles that guide
the perceptions, actions, and interactions of the participants (Araújo, et al., 2006;
2012; Davids et al., 2005; 2010; 2013; 2014, 2015; Travassos et al., 2010). The
27
theory conceptualizes a sport/performance environment in terms of multiple non-
linear interacting components. These components include the participants (i.e., the
athletes and officials) who perceive facets of information in their environment,
exchange this information with each other, and intentionally adapt their actions in
time and space to achieve goal directed actions. Although the current research was
largely empirical, based on the statistical analysis of quantitative data, some of the
analyses were consistent with the components of ecological dynamics theory. It is
therefore justified to provide a background summary of the key concepts of the
ecological dynamics theory, focusing on those concepts that are relevant to
refereeing. The history of science has been punctuated by many conceptual paradigm
shifts, highlighting that theories are often undermined and discarded or modified
when new information becomes available (Kuhn, 2012). Consequently, this review
not only outlines the ecological dynamics theory, but also criticizes the theory, and
explains how more applications of ecological dynamics are needed in the context of
officiating in soccer.
Theories may be explanatory, prescriptive, or predictive (Gay & Weaver,
2011). The ecological dynamics theory is mainly explanatory, because it provides a
conceptual explanation, based on performance analysis, to increase understanding of
the perceptions and actions of the participants across space and time in
sports/performance environments. The current conception of the ecological
dynamics theory is based on an integration of two conceptual dimensions specifically
(a) ecological psychology, which focuses on perceptions, and (b) dynamic systems
theory, which focus on actions (Davids et al., 2015). This review begins by defining
the two dimensions in general terms, and subsequently discusses some essential
conceptual components of these dimensions, focusing on evidence regarding soccer
players and officials, specifically (a) perceived information; (b) intentional
adaptation of movement; (c) constraints and (d) affordances.
2.5.1 Ecological Psychology
Ecological psychology posits that an athlete continuously interacts with
his/her sport/performance environment. An athlete continuously perceives critical
information from the environment (e.g., the positions of the ball and other players) in
order to regulate a specific goal-directed action (e.g., to intercept the ball, to keep
possession of the ball, or to pass the ball). The athlete intentionally adapts his or her

28
movement (e.g., by tracking the ball and the positions of other players) in order to
optimize the quality of the perceived information. Continuous intentional adaptation
of movement also results in a specific goal-directed action. Each goal-directed action
creates new information, which can be perceived to initiate another intentional
movement and/or another goal-directed action in a cyclical pattern (Davids et al.,
2015).
2.5.2 Dynamic Systems
Dynamic systems theory posits that a system comprises multiple scales of
analysis, which change over space and time. The components of this theory, as it
applies to an individual operating in a sport/performance environment, are consistent
with the ecological psychology dimension, because they propose that an individual
continuously reorganizes and readapts his/her intentional movements and
perceptions, under the influence of constraints and affordances, in order to achieve
goal-directed actions (Davids et al., 2015).
Extending the ecological psychology dimension, the dynamic systems theory
is concerned with more complex scales of analysis, including the processes that
underlie the coordination of multiple participants in a team. For example, from a
team perspective, the physical properties of the performance environment, the
dynamic interactions between the individuals in the team, as well as multiple
variables associated with each individual (e.g., physical ability, psychological
condition, and perceived information) all interact to constrain intentional adaptation
of movement and goal-directed actions (Davids et al., 2015).
The concept of constraints is an essential component of the theory because it
provides an understanding of how goal-directed behavior occurs (Araújo, et al.,
2006; 2012; Button et al., 2005; Chow, 2013; Davids et al., 2012, 2013, 2015; Dicks
et al., 2010; Renshaw et al., 2010; Travassos et al., 2012). The intentional adaptation
of movements, the perception of information, and goal-directed actions are
constrained by various factors, including the individual attributes of the participant,
the extrinsic properties of the environment, and situational factors that are specific to
the objectives of the sport, as described in Sections 2.2, 2.3, and 2.4.
The concept of affordances also influences the relationships between
intentional adaptation of movement, the perception of information, and goal-directed
29
action. Unlike a constraint, an affordance is not a physical property of either the
individual or the environment, but refers to environmental stimuli, or key
opportunities for action, that afford the opportunity for the organism to perform an
action that is physically possible (Jones, 2010; Chemero, 2011).
Relatively limited empirical evidence is available in the literature regarding
the applications of ecological dynamics theory to the actions of soccer officials. The
evidence to support the dimensions of the ecological dynamics theory as it applies
mainly to soccer officials is subsequently reviewed under the following headings: (a)
perceived information and intentional adaptation of movement; (b) constraints; (c)
affordances and interpersonal interactions; and (d) applications.
2.5.3 Perceived Information and Intentional Adaptation of Movement
The expertise of soccer officials to make correct informed decisions
ultimately depends upon their ability to perceive and react to many sources of
environmental information, including their position, relative to the position of the
ball and other players, their proximity to the play, as well a clear view of the
incidents that require the making of decisions. Soccer officials should ideally move
toward positions that achieve the best angle of view to perceive the most useful
information about the play referees achieve effective perception of continually
changing information by ball tracking, or keeping up with the play, through
intentional adaptive movements (Krustrup & Bangsbo, 2001). Perceived information
and intentional adaptation of movement are therefore inextricably related to each
other in the ecological dynamics theory.
The ball tracking of referees in a soccer match may be measured using
multiple sources of data (e.g., the coordinates of the official’s position on the pitch,
the distance between the official and ball, the total distance covered by the official in
a match, and the correlation between the coordinates of the official and the ball).
Krustrup and Bangsbo (2001) asserted that ball tracking is one of the most important
properties of soccer officials. Incorrect decision-making may result from officials not
clearly observing incidents because they are unable to perceive the necessary
information to interpret the actions of the players.
Mallo et al. (2012) found that the lowest percentage of errors by soccer
referees occurred in the centre of the pitch, at 11 to 15 m from the play. Angles of

30
view between 46o and 60
o favoured correct decisions. Mallo et al. (2012) suggested
that information perceived when the official is too close to an incident may
compromise the ability of the official to view and analyse the entire sequence of
events. Conversely, being too far away from the incident could raise the risk of an
incorrect decision, because critical information relating to the incident might not be
perceived with clarity. There is, however, limited empirical data reported in the
literature to support these suggestions. Mallo et al. (2012) also suggested that referee
position is not necessarily a unique factor associated with decision-making. Other
constraints (e.g., the speed and position of players, the score, and crowd, pressure)
may confound the effects of referee positioning.
De Oliveira et al. (2011) evaluated the quality of the decision making of elite
Brazilian referees. A total of 321 foul calls were analysed. No statistically significant
correlations could, however, be identified between the referee’s distances from the
fouls and the accuracies of the decisions evaluated by the reviewers. The highest
percentage of correct decisions was found at distances ranging from 20.1 to 25.0 m
from the foul, indicating that referees should not be too close to the play. If referees
have wider peripheral vision, then this may improve the quality of their decision-
making.
Elsworthy et al. (2014) conducted observational research to determine if (a)
positioning was a constraint on the quality of the decision-making of Australian
football officials; and (b) if the physical demands associated with Australian football
were a constraint that impacted on the quality of the decision-making of the referees.
The decisions of 20 elite-level Australian football field referees were assessed, and
three Australian Football League coaching staff assessed the fouls in 20 matches on
video. Only a proportion (458/884 = 51.8%) of decisions could be assessed due to
the inability to calculate the position of the ball and/or referee. The relative speed and
position of the referee at the time of the infringement were calculated at 5 s, 30 s, 1
min, and 5 min prior to each decision. Out of 458 assessed decisions 61 (13%) were
revealed to be errors. Most correct decisions were made between 11 to 15 m from the
play. No significant differences in distance from play or speed of the referee were
found between correct and incorrect decisions; and (b) the distance of the referee
from play when a free kick was awarded did not affect the accuracy of the referee’s

31
decision. Only 458/884 (51.8%) of decisions were assessed due to the inability to
calculate the position of the ball and/or referee.
2.5.4 Constraints
In the context of ecological dynamics, three categories of constraints have
been identified, termed: (a) organismic constraints; (b) environmental constraints;
and (c) task constraints (Araújo et al., 2006; 2007; 2012). Organismic constraints are
the intrinsic factors associated directly with the participants (e.g., physical factors
such as the height, weight, strength, fitness, visual acuity, perceptual-motor
capability, psychological temperament, and experience of a soccer official).
Environmental constraints are the extrinsic factors associated with the performance
environment (e.g., the weather, humidity, light and temperature, and the physical and
spatial properties of the surface upon which the officials move) as well as the socio-
cultural factors associated with the game (e.g., the behaviours and expectations of the
managers, the officials, and the crowd, and the status of the match). Task constraints
are situational factors that are specific to the objectives of the game. Task constraints
change from moment to moment, associated with intentional adaptive movements
and goal-directed actions (e.g., adhering to the rules of the game, maintaining
playing positions, intercepting the ball, defending, attacking, and scoring goals).
Several primary studies, already cited in Sections 2.2, 2.3, and 2.4 have
described the organismic constraints (individual factors) as well as the environmental
and situational factors that may be considered to shape the behaviour and decision
making of soccer officials. Little research has, however, applied the concept of
constraints to the decision making of soccer officials, in the context of the ecological
dynamics theory.
To date, the most intensive quantitative observations on the effect of
positioning as a constraint that may influence the accuracy of the decision making of
top-class soccer officials was conducted by Mallo et al. (2012). The lowest number
of referee decision errors occurred in the central area of pitch, when the referee
observed the incidents from a critical range of 11 to 15 m. Mallo et al. (2012)
suggested that the critical angle of view of assistant referees may be a factor that
constrains their ability to judge certain incidents, particularly offside situations;
however, it was not determined if the viewing angle between the referee, the assistant
referee, and the ball influenced the quality of the referee’s decision. It is possible that
32
a sub-optimal viewing angle is a key constraint when referees make incorrect
decisions; however, more research is needed to evaluate the importance of the effect
of the viewing angle on the quality of a referee’s decisions. Mallo et al. (2012)
concluded that several other situational factors (e.g., the speed of the players, the
status of the match, and the crowd pressure) might also constrain referee positioning.
Controversially, the memory of officials may or may not act in association
with task constraints. Lames and McGarry (2007) suggest that knowledge of past and
present situations interferes with every decision that is made in tactical sports. At one
extreme memory may act as an almost total constraint (because specific knowledge
of a similar previous situation entirely shapes the official’s decision). At the other
extreme, memory may be irrelevant to decision making (e.g., if the situation is
unexpected and the decision is novel). According to Schweizer et al. (2011),
intuition, linked to memory, may also guide the decisions of soccer referees. Intuition
is defined as a largely unconscious, automatic, and effortless process, rooted in
knowledge acquired and developed in long-term memory through associative and
connective learning. Schweizer suggests that it is possible that referees use intuitive
processing to make very quick decisions in foul situations. Alternative suggestions,
that conflict with those of Lames and McGarry’s and Schweizer’s, regarding the role
of memory, are reviewed below, in terms of the concept of affordances.
2.5.5 Affordances
The concept of affordances is derived originally from the work of James
Gibson in the 1950’s to explain how learning takes place through perceptions of, and
interactions with, the environment. Gibson’s affordance theory posited that
individuals perceive the world not only in terms of spatial relationships between
objects but also in terms of objective possibilities for action, termed affordances
(Greeno, 1994). Affordance theory suggests that perception drives action and that it
is unproductive to separate perceptions from the environment. Affordances appear to
act as clues in the environment that indicate possibilities for action, and may be
perceived in a direct, immediate way with limited sensory processing. Although
affordances act as possible interactions for an individual to participate in, there are
also constraints that may limit wider possibilities for action. Consequently,
constraints and affordances collectively constitute an ecology of participation.
33
In the context of the ecological physiology and dynamic systems theories, in
sports/performance environments “Affordances are opportunities for action. They
describe the environment in terms of behaviours that are possible at a given moment
under a given set of conditions. Affordances capture the tight coupling between
perception and action, and allow for the prospective and moment-to-moment control
of activity that is characteristic of fluent, fast-paced behaviour on the playing field”
(Fajen et al. 2008, p. 79). The concept of affordances helps to explain how
interpersonal interactions help to coordinate the behaviours of participants interacting
in a sport/performance environment. Affordances in a team game may be associated
with each team player’s capacity to perceive how the various possibilities that
constrain his or her own movements and actions are complemented, or perhaps not
complemented, by the possibilities that constrain the movements and actions of other
players in the same or the opposing team (Davids et al., 2015). For example, the
perception of a gap closing or opening between the defenders and an attacking player
in a soccer match might afford different choices of action for the attacker, to make a
long pass, a short pass, kick to space, or run with the ball (Craig & Watson, 2011).
Attunement to affordances is a concept originally developed by educational
theorists, to explain how student learning develops in interactive classrooms by
students becoming better attuned to the ecology of constraints and affordances. This
concept suggests that a student learns by extending and enhancing what information
is available in the current situation to what information might be available in future
situations (Watson, 2003). Past experiences, derived from repeated exposure to
information and events, including the repetition of skills, increases the ability of an
individual to recognize affordances. There appears, however, to be a general lack of
understanding about what is meant by attunement to performances in a
sports/performance environment, and this concept is not accepted by all ecological
dynamics theorists (McMorris, 2014).
Some theorists argue that attunement to affordances (rather than intuition
linked to memory, as proposed by Schweizer et al. 2011) may guide the acquisition
and development of expertise in sports. Attunement to affordances is not a form of
memory, because unlike memory, it does not depend on the recall of information,
and it is not linked to the interconnection of neurons in the brain (McMorris, 2014).
Attunement to affordances seems to involve the coupling of perception with action,

34
permitting an attuned participant to process familiar experiences more quickly than
unfamiliar experiences. Although perception and action are not neurobiologically
connected, this coupling may enhance the ability of the participant to choose goals,
and achieving goals is dependent on the participants’ ability to attune to affordances.
The development of expertise in sports/performance environments, may therefore be
intrinsically linked to the ability of the participants to attune to affordances.
To date, the concept of attunement to affordances has not previously been
applied to the decision making of soccer referees. Consequently, the following
suggestions may be considered as speculative, because they are not all endorsed by
factual evidence. Affordances could be important because they may explain how the
possible choices that referees have available when they make a decision regarding an
incident on the field of play may be related to how they attune themselves to the
dynamic situational characteristics of their environment, constrained by their level of
experience, and their current physical and psychological status. Soccer referees’
affordances do not only stem from perceiving information about how objects (i.e.,
the ball, the pitch, and the players) behave in physical space when they interact with
each other (Mallo et al., 2012). Referees’ affordances may also emanate from a
unique personal space, constructed in their minds, through perceptions of the
interaction between (a) the information they receive from the environment (i.e.,
based on their position on the pitch, relative to the position of the ball, and the
players) and (b) their previous experiences of participation in interactive systems
(e.g., by becoming better attuned to an ecology of constraints and affordances).
Referees may become attuned to affordances by varying their decisions according to
their interpretation of situation specific events. For example, referees may are more
likely to award a dubious penalty to the same team if no decision was given to that
team in an earlier similar situation in the same match (Mason & Lovell, 2000;
Plessner & Betsch, 2001). The variability in referees’ decisions indicates why
decision-making abilities might evolve through the patterns and possibilities of
affordances that they have learnt through their past experiences, derived from
repeated exposure to similar infringements of the rules of the game.
Furthermore, it may be speculated that the concept of affordances could be
important in relation to the coordination between referees and assistant referees. In
this context, Helsen and Bultynck (2004) reported that about 64% of all decisions in

35
soccer matches are based on coordination between the referees and the assistant
referees. The dynamic systems theory emphasizes that it is critical to observe the
coordination between the participants in space and time during the emergence of
different patterns of play (Passos et al., 2008; 2011). Mallo et al. (2012) also
commented that teamwork between officials might be a factor that influences the risk
of referees making incorrect decisions. Teamwork between officials particularly
needs to be improved in the lateral areas of the field, to reduce the higher risk of
making incorrect decisions than in the mid-field areas. Mallo et al. (2012) reported
that referee errors were significantly higher in the lateral areas of the pitch, which are
the areas of influence of the assistant referees, relative to the central areas. The
development of several different possible interpersonal interactions between referees
and assistant referees may be a type of attunement to affordances that empowers
referees to afford the best choice of decision in the event of an infringement of the
rules, and thereby help referees to reduce the risk of making incorrect decisions.
2.5.6 Four Cornerstones Model
It is difficult to integrate the information presented above, into a prescriptive
model, which could be applied to evaluate the performance of soccer referees.
Mascarenhas et al. (2009, 2012) did so by developing a referee performance model,
entitled "The Four Cornerstones Model of Refereeing." In the context of the
ecological dynamics model, the Four Cornerstones model includes organismic
constraints (e.g., physical fitness, personality, and management skills); task
constraints (e.g., knowledge and application of the rules) and affordances (e.g.,
contextual judgment). Organismic and task constraints are considered to represent
the science of officiating. They require a necessary minimum standard, which can be
measured objectively, and all referees must be able to attain this standard.
Contextual judgement and management skills, however, represent the art of
officiating, and cannot be evaluated so easily. They afford the referee an opportunity
to make a variety of different decisions, based on a variety of personal opinions and
past experiences. Contextual judgement affords opportunities for variable
interpretations of the rules, and empowers referees to make decisions that are
appropriate to specific game scenarios, involving a broad repertoire of management
skills, which are especially important to handle conflicts and hostile situations on the
pitch.

36
2.6 CRITIQUE
A critique of the research reviewed above is presented, focusing on (a) the
flaws associated with the inferential statistical analysis of match performance data;
and (b) the limitations of the ecological dynamics theory.
2.6.1 Critique of empirical studies
In view of the limited evidence available in the literature, there is a need for
more research to analyse the different types of mobility patterns used by soccer
officials during a match and to determine the extent to which their movements
influence the quality of their decision-making. In previous studies, flawed
quantitative methods have been applied to describe the quantitative relationships
between the positions of the officials and the quality of their decision making (e.g.,
De Oliveira et al., 2011; Elsworthy et al., 2014; Krustrup & Bangsbo, 2001; Mallo et
al., 2012) as well as other statistics based on an analysis of match performance data
(e.g., Asami et al. 1988; Catterall et al., 1993; Castagna et al., 2007; Helsen &
Bultynck, 2004; Krustrup & Bangsbo , 2001; Krustrup et al., 2002; Mallo et al.
2009b; Mascarenhas et al., 2009; Oudejans et al., 2005; Weston et al., 2004; 2011a;
2011b). These methods were flawed because they used data that were not collected
by independent random sampling, which is the fundamental assumption underlying
inferential statistical analysis (Creswell, 2014). The data were not independent
because measurements collected at one time are dependent on the measurements
collected at a previous time. The measurements were auto-correlated or serially
correlated over time. The sampling was not random because a time series of
measurements collected at fixed intervals of time are not selected by chance. The
averaging of non-random data collected over fixed intervals of time is termed
temporal pseudo-replication (Hurlbert, 1984). Pseudo-replication may invalidate
statistical inferences, because the data are treated as if they were collected by
independent random sampling, whereas, in fact, they were collected using dependent
non-random sampling. The statistical significance of inferential test statistics based
on pseudo-replicated measurements averaged over time may be exaggerated.
Temporal pseudo-replication compromises the results of inferential statistics because
the Type I error rate can be inflated by as much as 100% (Nicolich & Weinstein,
1981). Nevertheless, statistics based on pseudo-replicated data are widely published,

37
and the bias associated with pseudo-replication is not very widely acknowledged
(Freeberg & Lucas, 2009).
Another limitation of quantitative studies based on match performance data is
that, in the face of making difficult decisions, the personal opinions of the referees,
and not necessarily objective measurable factors, are paramount. Opinions
encompass subjective interpretations of the laws of the game, incorporating
guesswork, human error, and unconscious reactions, which may be guided by
personality factors, and cannot easily be predicted by theory. The referee’s opinion
may interact with social pressure, through how the referee copes subjectively with
the reactions of the crowd, the players, and the game scenario (Lane et al., 2006;
Slack et al., 2014). The decision to take a particular action after an incident may vary
depending upon whether the referee is aggressive and shouts a lot, or laid back and
quiet (Sayfollahpour et al., 2013). Some of the decisions of referees, including
yellow cards after a foul is called are highly inconsistent, because different referees
may make different decisions based on their perceptions of the same incident. The
quality of decisions may also be correlated with situational factors such as the team’s
rank and the size and noise of the crowd (Soares & Shamir, 2016).
When considering the quality of the decision making of referees, there is
always room for qualitative factors, and the subjectivity that this brings with it,
requiring the use of qualitative data analysis to understand the behaviours of referees
(Lane et al., 2006; Slack et al., 2014). Consequently, no empirical or conceptual
model (including the ecological dynamics theory) based on quantitative data can ever
explain 100% of the variance in the quality of referee decision making. An
unmeasurable proportion of this variance is associated with subjective opinions,
which Mascarenhas et al. (2009) refer to as the art rather than the science of decision
making. When evaluating the quality of the decision making of referees it is not only
the subjectivity of the referees that can be questioned, but also the subjectivity of the
experts who rated their decisions (Mallo et al., 2012). Consequently, quantitative
studies that attempt to relate situational dynamic factors (e.g., the mobility,
positioning, and experience of the referees) to the quality of referee decision making
cannot not explain all of the variance in this relationship, because a considerable
proportion of this variance is due to unmeasured qualitative factors.

38
With respect to the need to include other factors in the statistical analysis of
match performance data, it must be highlighted that inferential statistics are
misleading if the results are compromised by threats to internal validity, defined as
the extent to which an inferences concerning the relationships between two or more
variables are, in fact, warranted (Creswell, 2014). Threats to internal validity may
occur when the relationships between two or more variables are confounded by
extraneous variables that were not included or controlled in the statistical analysis.
When the results of inferential statistical tests are interpreted, to determine if one or
more independent variables have statistically significant effects on a dependent
variable, then it is essential to consider whether this interpretation is exclusive,
because many other variables that were not included or controlled in the statistical
analysis may also have a significant effect on the dependent variable. Most of the
quantitative research described in the literature review reported statistically
significant results (e.g., p < .05), based on the analysis of a small number of
variables. However, these conclusions were flawed. The researchers generated biased
conclusions, because they excluded the possible effects of an infinite number of other
extraneous variables (Lindsay, 1995). The misconceptions arising from making
conclusions based on inferential statistical analysis of a restricted number of
variables promoted Ioannidis (2005) to argue that most published research findings
are false. Furthermore, threats to internal validity caused by misinterpretation of
inferential statistics, have led several scholars to suggest that inferential statistics,
based on the interpretation of p-values, should be banned, abandoned, or reduced in
importance (e.g., Halsey et al., 2015; Hubbard & Lindsay, 2008; Kline, 2004; Nuzzo,
2014; Zilak & McCloskey, 2008).
2.6.2 Critique of theory
The ecological dynamics theory helps to improve understanding of how the
development and acquisition of the expertise of professional athletes in
sport/performance environments may be explained in terms of a complex
intertwining of events and processes, some of which depend upon an immediate
reaction to environmental stimuli (e.g., the position of the ball) and some of which do
not (e.g., the possibility, physical ability, and psychological desire of a soccer player
to intercept the ball). Because the acquisition and development of expertise is a
function a complex and dynamic mixture of environmental and individual constraints
39
and affordances, there may be no universal or optimal pattern of intentional
movements to which all athletes can aspire. Each athlete may have to apply his or her
own unique combination of perceptions, intentions, constraints, and affordances in
order to achieve a specific goal-oriented action (Davids et al., 2015).
Although the ecological dynamics theory has practical applications, related to
the development of expertise and the assessment of the performance of participants
in sports environments (e.g., Araújo et al., 2012; Couceiro et al., 2016; Davids et al.,
2016) this theory has not been fully developed and applied : (a) to provide a formal
set of basic guiding principles that define the ideal behaviours of participants in
sport/performance environments, for example, by recommending exactly how
athletes can best achieve their goal directed actions; or (b) to construct empirical
models that predict the relationships between the actions of athletes and their
environment (e.g., using structural equation modeling); or (c) to predict interactions
between the actions of athletes and their environment, using mathematical simulation
models (e.g., by numerical integration of multiple sets of non-linear differential
equations). It is possible, however, that a comprehensive set of equations to sustain
the ecological dynamics theory cannot be validated, because quantitative data cannot
explain all of the variance in the perceptions and behaviours of people (Merriam,
2014). An unmeasurable proportion of this variance is due to subjective opinions,
which cannot be accurately measured. Qualitative research has revealed that the
personal opinions of referees in the face of making difficult decisions often
encompass subjective interpretations of the laws of the game, in the context of the
game scenario, that cannot easily be predicted by theory (Lane et al., 2006;
Sayfollahpour et al., 2013; Soares, & Shamir, 2016). Therefore, it may not be
possible to validate quantitative models to sustain the ecological dynamics theory
comprehensively using objective statistical criteria, including construct validity,
convergent validity, discriminant validity, criterion validity, internal consistency
reliability, and test-retest reliability (Creswell, 2014). More qualitative research
approaches may be required to support the subjective components of the ecological
dynamics theory as it applies to referee decision-making. This could be
accomplished by asking referees a series of open-ended, non-leading questions, and
conducting a content analysis of the interview transcripts, to extract emergent themes

40
that explain when, where, how, and why they choose to make certain decisions in
certain game scenarios.
2.7 CONCLUSION
The main function of soccer officials is to regulate the interaction of soccer
players by applying game laws and making decisions. Applying the laws of the game
involves constant perception of information and the ability to make correct,
consistent, and impartial decisions. The decision-making accuracy of soccer officials
is currently of critical importance. It is, however, difficult to quantify the accuracy of
decision-making, because many subjective factors are involved (Lane et al. 2006;
Slack et al., 2014; Sayfollahpour et al., 2013; Soares, & Shamir, 2016). Relatively
little research has focused on analysing the effects of the positioning of the soccer
officials on the accuracy of decision making (De Oliveira et al., 2011; Mallo et al.,
2012). According to ecological dynamics, the critical variables that are needed to be
considered are the viewing angle and the distances between the participants, the ball,
and the goal. The defender's angle to the goal and the attacker is an important source
of information for the attackers and defenders to regulate their behaviours during
competitive performance (Vilar et al., 2013).
This review highlighted that ecological dynamics is developing as an
exploratory theoretical framework for improving the analysis of data on the
competitive performance behaviours of athletes, particularly in team sports. This
review highlighted that empirical information regarding the behaviours and attributes
of soccer officials with respect to the ecological dynamics of soccer matches is
limited. The ecological dynamics framework requires an explanation of the
interactions between the relative positions of the referee, the ball, and the incidents
for which decisions are required. Predictive statistical models based on empirical
evidence underpinned by the ecological dynamics theory need to be constructed.
This gap in the literature provides the direction and rationale to develop the
ecological dynamics perspective in the current research by constructing statistical
models, based on empirical evidence. The purpose of the models is to determine how
the positional interactions between the referee, the ball, and various constraints
predict the quality of the referee’s decisions.
41
The ecological psychology dimension of the ecological dynamics theory may
be supported if the intentional adaptive movements of soccer referees (e.g., their
position on the field, associated with ball tracking) which is based on their perceived
information (e.g., their distance from the ball) predicts the referees’ goal-directed
actions (e.g., the decisions that they make to implement the rules of the game).
Furthermore, these actions may be shaped by organismic constraints (e.g., the
personal attributes of the referees, such as their experience) as well as task
constraints (e.g., dynamic situational factors, including the viewing angles between
the referee and the ball). The ecological dynamics theory therefore provides a
conceptual perspective which was applied in practice to devise the methods used in
the current study, using match analysis data to address the research questions
introduced in the next chapter.

42
Chapter 3: Research Methods
This chapter describes the design adopted by the researcher to achieve the aims
and objectives stated in Chapter 1. Section 3.1 outlines the research design. Section
3.2 defines the participants. Section 3.3 describes the research instruments. Section
3.4 outlines the procedures used to collect the data. Section 3.5 describes how the
data are analysed; finally, Section 3.6 discusses the ethical considerations and
limitations.
3.1 RESEARCH DESIGN
A correlational research design was implemented; using kinematic match
analysis data, to explore the statistical relationships between multiple variables
extracted from data applying to matches taking place in the Qatar Stars League
(QSL) in the 2011/2012 season. Based on information extracted from the literature
review, the following research questions were designed to guide this study. The
overall research question was: What quantitative factors predict the quality of a
referee’s decision in a soccer match? The overall research question was partitioned
into five sub-questions, each of which was underpinned by specified components of
the ecological dynamics theory, as follows:
RQ1: To what extent does the relative position of the ball and the referee on
the pitch (ball tracking) predict the quality of the referee’s decision?
Ball tracking is an intentional adaptation of movement of the referee, resulting
from perceived information, regarding the position of the ball, which may be
constrained by intrinsic personal attributes (e.g., the referee’s expertise and physical
fitness); the extrinsic properties of the environment (e.g., the quality of the surface of
the pitch, the weather conditions); as well as situational factors (e.g., the speed of the
players, how close the referee is to the assistant referees, and the status of the match).
The quality of the referees’ decision is a goal direction action, that may be
constrained by intrinsic personal attributes (e.g., the level of experience of the
referee) and subject to affordances or interactions associated with the referee’s
possible relationships with the players, other officials on the pitch, and the crowd.
43
RQ2: To what extent does the position of the foul on the pitch predict the
quality of the referee’s decision?
The position of the foul on the pitch is information perceived by the referee,
which may be constrained by environmental factors (e.g., if the foul is close to the
assistant referees, close to the technical area, penalty area, or in midfield, as well as
situational factors (e.g., the status of the match). The quality of the referees’ decision
is a goal direction action, subject to the constraints and affordances outlined in RQ1.
RQ3: To what extent does the distance of the referee from the foul predict the
quality of the referee’s decision?
The distance of the referee from the foul is an intentional adaptation of
movement of the referee, resulting from perceived information, regarding the
position of the foul, which may be constrained by intrinsic personal attributes (e.g.,
the referee’s expertise and physical fitness); the extrinsic properties of the
environment (e.g., the quality of the surface of the pitch, the weather conditions); as
well as situational factors (e.g., how close the referee is to the assistant referees). The
quality of the referees’ decision is a goal direction action, subject to the constraints
and affordances outlined in RQ1.
RQ4: To what extent does the viewing angle predict the quality of the referee’s
decision?
The viewing angle is information perceived by the referee, which may be
constrained by environmental factors (e.g., how close the referee is to the assistant
referees) as well as situational factors (e.g., whether the foul is close to the officials,
the technical area, the offside line, or the penalty area). The quality of the referees’
decision is a goal direction action, subject to the constraints and affordances outlined
in RQ1.
RQ5: To what extent do the attributes of the referee predict the quality of the
referee’s decision?
The attributes of the referee (e.g., expertise, experience, and physical fitness) is
specified above as an intrinsic constraint. The quality of the referees’ decision is a
goal direction action, subject to the constraints and affordances outlined in RQ1
44
3.2 PARTICIPANTS
Data on the locations and movements of the referee and two assistant referees
relative to the ball and fouls were obtained from the QSL for 132 matches. All the
matches were played at night. The QSL is the top professional soccer league in Qatar
with 14 teams. The QSL also supplied summary information on the match officials
for each game. Six international referees and four national referees were evaluated.
Ten is the total number of soccer referees in Qatar. All international referees were
licensed by FIFA and had no less than one year of experience at an international
level. All national referees had no less than five year of experience at the national
level. They were appointed to officiate in leagues or competitions organized by Qatar
Football Federation, such as QSL. Following brief explanations as to the nature of
the investigation, written consent was obtained from the Referees Committee in the
Qatar Football Association and from all the referees involved in the tournament.
3.3 INSTRUMENTS
Match analysis data were obtained from QSL in the proprietary data format of
the Prozone® system Version 10 (Prozone Sports Ltd, Leeds, UK). This is a leading
optical tracking system comprising a network of eight colour video cameras capable
of tracking the players, ball and match officials. Each camera’s parameters (position,
orientation, zoom and field of vision) were determined and fixed when installed
(Vicon surveyor 23xcameras dome/SVFT-W23). The eight cameras were positioned
in order to produce a whole vision of the pitch. Furthermore every area of the pitch
was covered by at least two cameras for accuracy; occlusion, resolution and
resilience.
The cameras were positioned on the roof of the stadiums with one camera
being situated in each of the stadium’s four corners. The other four cameras were
equally positioned along the side of the stadium. All the cameras were positioned to
overlap to ensure that every movement on the pitch was captured. (See Figure 3.1)

45
Figure 3.1. Schematic diagram of Prozone® analysis system
The advantage of the Prozone system is its ability to track every player and
official participating in a soccer match and quantify their motion patterns. The
positional data of each player and official, is recorded every tenth of a second. The
system provides sports scientists with a tool to describe and analyse the movement
patterns of players and officials in soccer matches, with minimal time required to
collect the necessary measurements. Furthermore, since the system does not require
special equipment (i.e. transmitters) or clothing (i.e. colour-coded shirts) to be worn,
it can be used to perform measurements during official matches of elite teams. The
disadvantages of the system are the high costs because (a) the multiple cameras are
not portable, and are limited to the stadium where the cameras are fixed, (b) a
computerised network with a dedicated operator to run the data collection and
analysis procedures is necessary (Hughes & Franks, 2015). Furthermore, video-based
coding may sometimes underestimate the total distance covered by the players or
referees (Randers et al., 2010).
The Prozone Video-Pro® software, which permitted replay and analysis of
each game, was used to collect the kinematic data. A time-stamp for all fouls
occurring in each match, the period leading up to the foul was then replayed. A
schematic representation of the pitch and the location of the ball and match officials
was presented. The data were then processed in order to quantify the kinematics
movement patterns, specifically the positions of the officials, the positions of the

46
ball, and the positions of the fouls, as outlined in Table 3.1. Information about the
qualifications of the officials at each match was also available from the Video-Pro
display.
The accuracy and reliability of the data collected using the Prozone system
was evaluated by Di Salvo et al. (2006). Six participants were asked to perform a
series of timed runs at different speeds (slow jog, jog, run, high-speed run, and
sprinting) in different parts of the Old Trafford and Reebok Stadiums. The
statistically significant correlation, reliability, and agreement coefficients between
the actual speeds of the participants, and their measured speeds, demonstrated that
Prozone was a valid system for analysing the movement patterns of players and
officials on a soccer pitch. Subsequently, the Prozone system has been used in
several studies to analyse the activity profiles of players and referees in English
Premier League soccer matches (Di Salvo et al., 2009; Gregson et al., 2009; Weston
et al., 2011).
3.4 DATA COLLECTION
3.4.1 Digitization of Prozone Data
In order to convert coordinates of match officials and the ball from the
proprietary format to X, Y coordinate pairs in metres with a known origin, a series of
processes had to be undertaken. These steps were the conversion of Prozone Data to
.avi files, the conversion of .avi files to .jpg files, and the machine vision tracking of
match officials and ball. Each is described in more detail below.
3.4.2 Conversion of Prozone Data to Video files
The Prozone format did not allow access to coordinate data, but allowed a
replay of each half as a schematic, in which the players, match officials and the ball
were represented on a rectangle. An open source program was used to record each
half as a video (.avi format) file. For efficiency, replay was at above normal speed.
3.4.3 Conversion of Video files to Individual Image Files
Each video file was converted to a series of individual image files (.jpg format)
using the open source (FFmpeg) video file handling module on the QUT High
Performance Computing (HPC) Lyra computer. This resulted in over 7,000 images
for each half. The effective sampling interval was .275s.

47
A machine vision-tracking program was written in Matlab (MathWorks,
Matick, Massachussets, USA) with assistance from HPC staff to process all the
images for each half of each match. This program was run on the HPC’s Lyra
computer. Constants were entered into the program for the pitch dimensions so that
calibrated coordinates could be produced. The process required the initial frames for
each match to be reviewed to exclude approximately 8 to 15 initial images, which
were obscured by a shape superimposed by the Prozone software. A parameter file
was generated for each half of each match. A mouse-driven cursor was then used to
mark the location of the corners of the pitch, and the initial locations of the referee,
the two assistant referees, and the ball. This initialisation allowed the tracking
algorithm to identify and follow each object through > 7000 images for each half.
The output of the analysis program was a .csv file for each half of each match,
containing the image (sample) number, and the X, Y coordinates of the referee, the
assistant referees, and the ball, with the centre of the pitch as the origin Post-
processing included interpolating occasional values where the referee obscured the
ball, which otherwise gave missing values, using a macro in Microsoft Excel 2014
(Microsoft Inc, Redmond, Washington USA). The conceptual and operational
definitions of all the variables collected in this investigation are defined in Table 3.1.
Table 3-1
Definitions of Variables Extracted from the Kinematic Data
Variable Conceptual Definition Variable
Name
Operational Definition
Quality of
Referee’s
Decision
Rating scale based on
FIFA standards for rating
the decisions of referees.
Decision
Quality
Rating scale from 0 = complete
disagreement to 4 = complete
agreement. The Basic scale measures
the quality of the referee’s decision
and the Severity scale measures its
accuracy.
Referee
Attributes
Class and nationality of
referee
FIFA Class 1 to 3
Class 1 = National; 2 = International
Country 1 = Qatari; 2 = Not Qatari
Ball Position Proportion of time (%) ball
is in left 1/3 of pitch, right
1/3 of pitch, and actual
penalty area
BL 1/3% Proportion of time (%) ball is in left
1/3 of pitch
BM 1/3% Proportion of time (%) ball is in
middle 1/3 of pitch
BR 1/3% Proportion of time (%) ball is in right
1/3 of pitch
BL PA% Proportion of time (%) ball is in left
penalty area
BR PA% Proportion of time (%) ball is in right
penalty area
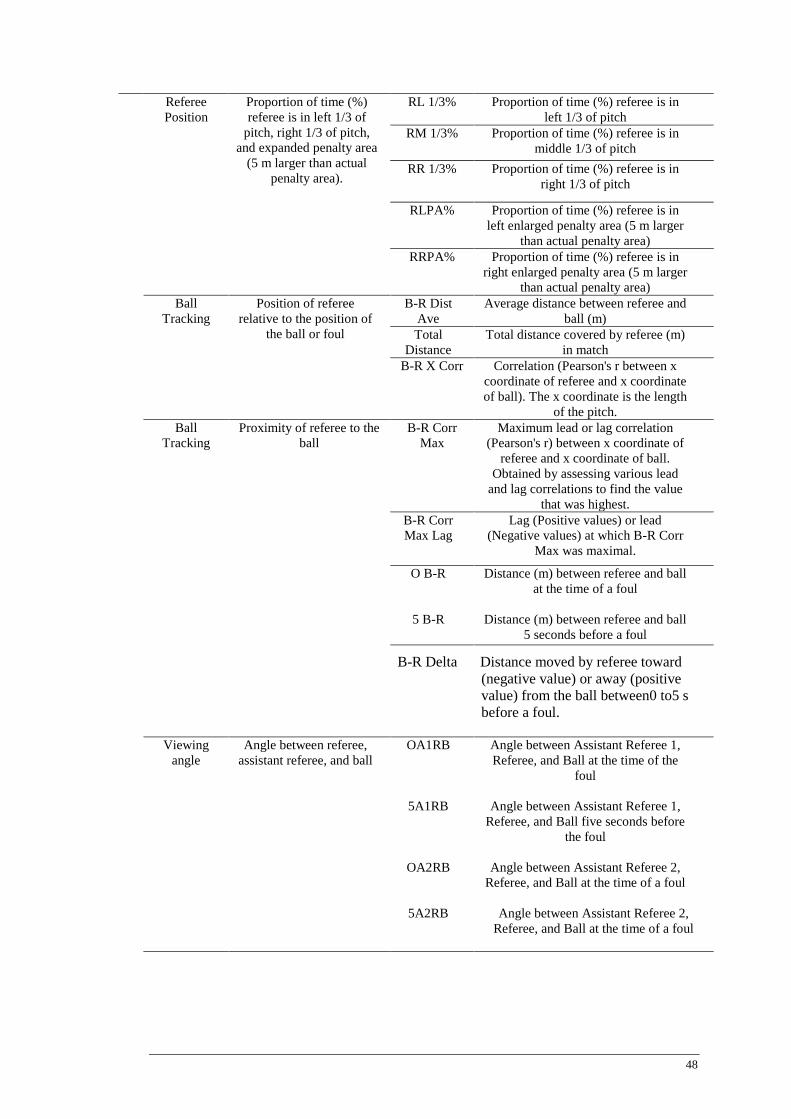
48
Referee
Position
Proportion of time (%)
referee is in left 1/3 of
pitch, right 1/3 of pitch,
and expanded penalty area
(5 m larger than actual
penalty area).
RL 1/3% Proportion of time (%) referee is in
left 1/3 of pitch
RM 1/3% Proportion of time (%) referee is in
middle 1/3 of pitch
RR 1/3% Proportion of time (%) referee is in
right 1/3 of pitch
RLPA% Proportion of time (%) referee is in
left enlarged penalty area (5 m larger
than actual penalty area)
RRPA% Proportion of time (%) referee is in
right enlarged penalty area (5 m larger
than actual penalty area)
Ball
Tracking
Position of referee
relative to the position of
the ball or foul
B-R Dist
Ave
Average distance between referee and
ball (m)
Total
Distance
Total distance covered by referee (m)
in match
B-R X Corr Correlation (Pearson's r between x
coordinate of referee and x coordinate
of ball). The x coordinate is the length
of the pitch.
Ball
Tracking
Proximity of referee to the
ball
B-R Corr
Max
Maximum lead or lag correlation
(Pearson's r) between x coordinate of
referee and x coordinate of ball.
Obtained by assessing various lead
and lag correlations to find the value
that was highest.
B-R Corr
Max Lag
Lag (Positive values) or lead
(Negative values) at which B-R Corr
Max was maximal.
O B-R
5 B-R
Distance (m) between referee and ball
at the time of a foul
Distance (m) between referee and ball
5 seconds before a foul
B-R Delta Distance moved by referee toward
(negative value) or away (positive
value) from the ball between0 to5 s
before a foul.
Viewing
angle
Angle between referee,
assistant referee, and ball
OA1RB
5A1RB
OA2RB
5A2RB
Angle between Assistant Referee 1,
Referee, and Ball at the time of the
foul
Angle between Assistant Referee 1,
Referee, and Ball five seconds before
the foul
Angle between Assistant Referee 2,
Referee, and Ball at the time of a foul
Angle between Assistant Referee 2,
Referee, and Ball at the time of a foul

49
3.4.4 Quality of Referee’s Decision
One qualified expert evaluated the Prozone videos individually, based on FIFA
rating standards for the quality of referees’ decisions, ranging from 0 = complete
disagreement, to 4 = complete agreement. The ratings of only one expert were
provided to the researcher. Due to the discrepancies that may exist between multiple
raters, it was necessary for the researcher (who is a FIFA qualified referee) to
validate the experts’ ratings. The raw data to compare the experts’ and the
researcher’s ratings are presented in Table 3.2.
The data in Table 3.2 were analysed to calculate inter-rater agreement, defined
as the degree of homogeneity or consensus among two or more raters or observers of
a specified event or item. If the inter-rater agreement was low then the ratings and/or
the raters could be defective (McHugh, 2012). Several inter-rater reliability statistics
have been designed to compute inter-rater reliability. Cohen's kappa statistic (for two
raters) and Fleiss' kappa statistic (for any fixed number of raters) is commonly used
when the ratings are expressed in terms of nominal categories, with no logical order,
whilst the weighted kappa statistic is appropriate if the ratings are expressed in
ordinal categories (Viera & Garret, 2005).
Table 3-2
Ratings of Referee’s Decisions for 58 incidents (E = Expert; R = Researcher)
E R E R E R E R E R
0 0 1 0 2 0 3 0 4 0
0 0 1 0 2 0 3 2 4 2
0 0 1 0 2 1 3 4 4 2
0 0 1 0 2 2 3 4 4 2
0 0 1 0 2 4 3 4 4 2
0 0 1 0 2 4 3 4 4 2
0 0 1 0 2 4 3 4 4 4
0 0 1 4 2 4 3 4 4 4
0 0 1 4 2 4 3 4 4 4
0 4 1 4 3 4 4 4
0 4 1 4 3 4 4 4
4 4
4 4
4 4
4 4
4 4
50
The usefulness of kappa to assess the strength of inter-rater reliability is
controversial because the magnitude of kappa is influenced by many factors, which
may be unrelated to the level of agreement between the raters (Sim & Wright, 2005).
The magnitude of kappa is axiomatically higher if there is a large number of raters
and few categories. An additional problem is that most statistical packages including
SPSS (the software used in this research) incorrectly computes the value of kappa if
any row or column of the cross-tabulation between the raters the ratings contains
zero values (Kim & Lemeshow, 2001). For these reasons, although kappa was
calculated to determine the inter-rater agreement between the researcher and the
expert, the results were also supported by the calculation of the Intraclass Correlation
Coefficient (ICC). The formula used to calculate the ICC in SPSS assumed that (a)
the ratings of the referees’ decisions could be considered as quantitative measures,
measured at the interval level; however because categorical (ordinal) measures were
used, then the values of the weighted kappa statistic and ICC should theoretically be
the same statistic (Fleiss & Cohen, 1973); (b) all of the raters could be considered as
representative of a larger population of similar raters; (c) the ICC was calculated
using an average of the multiple observers’ ratings across one or more events or
items; and (d) the ratings should ideally be consistent across time. Several models are
available in SPSS to compute the ICC. In this analysis, a two way random effects
model was used to calculate the ICC, (where rater effects were assumed to be
random, and the measured effects were assumed to be fixed). The ICC was
interpreted following McGraw and Wong (1996) as excellent' (≥ .81); good (.61 -
.80); moderate (.41 - .60); and poor: (≤ .40).
3.4.5 Positions of Officials
Selected distance and angle data were determined at both the time of the foul
and five seconds before. Distances were displayed and recorded to the nearest meter.
This was manually obtained by placing a cursor on the ball and linking it to the
match officials. This inspection of each foul allowed the recording of the variables
with 0 or 5 prefixes to designate the time of the foul (0) and the data for five (5)
seconds earlier.
3.4.6 Position of Ball
The position of the ball at the time of each foul was located by partitioning the
pitch into nine X, Y zones. The zones consisted of three sectors 40 m in length (each
51
end and the midfield), and three sectors across the pitch (far, middle and near), 24 m
wide. The combination of three sectors by pitch length and three sectors by pitch
width gave nine zones, each with coordinates defined by X and Y.
3.4.7 Viewing angles
The Excel spread sheet was set up with input cells and a series of output cells
with trigonometric formulae to calculate the angle between Assistant Referee 1, the
Referee, and the ball at the time of the foul (0A1RB) and five seconds before the foul
(5A1RB) and the angle between Assistant Referee 2, the Referee, and the ball at the
time of the foul (0A2RB) and five seconds before the foul (5A2RB).
3.4.8 Referee Attributes
Information about the attributes of the officials at each match was provided by
the QSL or was available from the Video-Pro display. All of this information,
including the date of international qualification, was provided by the Referee
Committee of the Qatar Football Federation. This information included the name of
referee, referee class, referee country, referee experience level, referee and assistant
referee game count, name of assistant referee 1, name of assistant referee 2, home
team, and away team. The referee and two assistant referees were classified into
three categories; expert (active Qatar's referees from FIFA International list), less
expert (national category of Qatar's referee) and international (active non-Qatari
referees from FIFA international list). Three different criteria were used to classify
the experience levels of the referees. The main classification scheme was FIFA
Class. This referred to the official status of each referee as being qualified by FIFA
to referee at the national or at the international level. Referees who were only
qualified as national referees during the 2011/2012 season were designated level 1.
Referees who became internationally qualified during the 2011/12 season were
designated level 2. Finally, referees who were already internationally qualified at the
start of the 2011/12 season were designated Level 3. All of the overseas referees
were, by definition, internationally qualified, and were also classified as Level 3.
Two subsidiary classification schemes were also used. The first subsidiary
classification was the total number of matches in the last season for each referee to
classify the experience level of the referees. This classification was called Total
Matches Class referring to the number of matches refereed by each referee in the last
52
season 2010/11 whether at the national or at the international level. All referees who
officiated at 12 to 22 matches in total during the 2011/2012 season were designated
level 3. Referees who officiated at 6 to 11 matches in total during the 2011/2012
season were designated level 2. Referees who officiated at 5 matches in total during
the 2011/12 season were designated Level 1.
The second subsidiary classification was the total years since being a referee
until the season 2011/12, to classify the experience level of the referee. This
classification scheme was called Total Years Class referring to the total years since
being qualified by the Referee Committee of the Qatar Football Federation, including
years qualified as a national referee and qualified as an international referee.
Referees who were officiated 12 to 22 years in total including the 2011/2012 season
were designated level 3. Referees who were officiated 7 to 10 years in total including
the 2011/2012 season were designated level 2. Finally, referees who were officiated
5 to 6 years in total including the 2011/12 season were designated Level.1
3.5 ANALYSIS
The data analysis was conducted using SPSS 20.0, Minitab 17.2, and
SmartPLS 2.0.
3.5.1 Descriptive Statistics
Descriptive statistics, including frequency distributions for categorical
variables, and mean, and standard deviation, minimum, maximum, and 95%
confidence intervals (CI) for continuous interval level variables, Normality was
tested using the Kolmogorov-Smirnov test. The graphical analysis of data, including
the construction of histograms, scatter diagrams, contour maps, and bar charts was
conducted using Minitab (because in the opinion of the researcher, the construction
and editing of Minitab high-resolution graphics are superior to SPSS).
3.5.2 Inferential Statistics
Chi Square tests were used to test for associations between the frequencies of
the positions of the fouls on the pitch in the nine X, Y zones and the frequencies of
the Basic and Severity rating scores for the quality of the referee’s decisions.
Z tests for the comparison of two proportions was used to determine if the
frequencies of the fouls were significantly different in different zones of the pitch,

53
specifically Zone 8 (close to the technical area) and Zone 2 (the opposite side of the
pitch to the technical area). The Z test was conducted separately for both halves, in
order to control for the switching of ends at half time (i.e. the consistent feature was
the proximity to the technical area, and not team differences. Pearson’s r correlation
coefficients were used to measure the strengths of the linear relationships between
continuous variables, specifically the positions of the referee and the ball in different
areas of the pitch.
3.5.3 Multivariate Statistics
Hierarchical agglomerative cluster analysis was used to classify the referees
according to the similarities and differences between their positioning on the pitch,
using Ward’s linkage method and squared Euclidean as the distance measure.
Partial Least Squares Structural Equation Modelling (PLS-SEM) was chosen
by the researcher to explore the relationships between the variables listed in Table
3.1. The purpose of PLS-SEM is to predict complex relationships between a large
number of variables, assuming that the explained variance in a set of empirical data
can be maximized (Hair et al, 2014). PLS-SEM was chosen for this study because it
offers many advantages over older parametric methods such as multiple regression
and covariance-based SEM. PLS-SEM is a modern non-parametric method
developed in the last ten years, which has become popular due its ease of use and
limited assumptions regarding the measurement and distributional characteristics of
the data (Wong, 2013). Unlike classical parametric statistics, developed nearly a
century ago, PLS-SEM involves no theoretical assumptions about samples,
populations, sampling error, or scales of measurement. PLS-SEM generally achieves
high levels of statistical power irrespective of the sample size (Hair et al., 2014).
Because no strong assumptions are made regarding the quality of the data, PLS-SEM
is especially useful when classical statistical assumptions are not tenable (Esposito
Vinzi et al., 2010). For example, the expert ratings for the quality of the referees’
decisions were measured using a coarse ordinal scale (digits ranging from 0 to 4)
which prevented the analysis of these ratings as a dependent variable using
parametric statistics such as multiple linear regression. For these reasons PLS-SEM
has been hailed as “indeed a silver bullet” for the construction of predictive models
based on theoretical constructs, using non-normally distributed empirical data,
measured at the interval, ordinal, or nominal level (Hair et al., 2012, p. 139).

54
PLS-SEM requires understanding of different concepts to classical parametric
statistics. PLS-SEM does not operate with independent and dependent variables but
with latent variables. A latent variable is a complex concept or construct that cannot
be measured empirically with a single measurement. A latent variable can only be
inferred by combining several correlated measurements (usually at least three)
together into one construct using composite factor analysis. PLS-SEM is not
supported by generalized statistical packages such as SPSS, Minitab or STATA.
SmartPLS software, available from www.smartpls.de, was used because it is a
popular package for conducting PLS-SEM (Wong, 2013).
SmartPLS operates with a graphic-user interface (GUI) to construct path
diagrams, which define potentially causal relationships between the latent variables
according to the researcher’s hypotheses. Figure 3.2 presents a simple path diagram,
drawn using SmartPLS, underpinned by ecological dynamics theory, to predict the
referee position (intentional adaptation of movement) from the ball position
(perceived information). The path diagram includes clusters of labelled yellow
rectangular symbols to represent the empirical measurements chosen to
operationalize the latent variables. In PLS-SEM these empirical measurements are
called indicators (Hair et al., 2014). The operational definitions of all the indicators
used in the path diagrams are provided in Table 3.1. The indicators were combined
by factor analysis, to infer the latent variables, represented by the blue oval symbols.
Figure 3.2. Path diagram drawn using SmartPLS
A latent variable is a construct that cannot be measured empirically with a
single measurement. A latent variable can only be inferred by compositing several
measurements together using factor analysis (Hair et al., 2014). For example, Ball
Position in Figure 3.2 is a latent variable, consisting of a linear combination of BL
1/3% = Proportion of time (%) ball is in left 1/3 of pitch; BM 1/3% = Proportion of

55
time (%) ball is in middle 1/3 of pitch; BR 1/3%= Proportion of time (%) ball is in
right 1/3 of pitch; BL PA% = Proportion of time (%) ball is in left penalty area, BR
PA% = Proportion of time (%) ball is in right penalty area. Referee Position is a
latent variable, consisting of a linear combination of RL 1/3% = proportion of time
(%) referee is in left 1/3 of pitch; RM 1/3% = proportion of time (%) referee is in
middle 1/3 of pitch; RR 1/3% = proportion of time (%) referee is in right 1/3 of pitch;
RL PA%= proportion of time (%) referee is in left enlarged penalty area (5 m larger than
actual penalty area); RR PA% = proportion of time (%) referee is in right enlarged
penalty area (5 m larger than actual penalty area).
The arrows between the indicators and the latent variables represent the factor
loadings. The indicators were formative, meaning that they were not scores (such as
might be collected in a questionnaire) that reflected the multiple effects of a
construct. The formative indicators were measurements that collectively identified
the latent variable as a construct, but did not reflect its multiple effects. The
formative indictors were symbolized by arrows pointing into a latent variable in
contrast to reflective indicators with arrows pointing into a latent variable (Roy et al.,
2012).
A unidirectional arrow between a pair of latent variables represented a
hypothetical causal relationship, measured using a PLS regression weight, or β
coefficients. The β coefficient indicated the strength and direction of the correlation
between the latent variables. The β coefficients were equivalent to the partial
regression coefficients in a multiple linear regression model. SmartPLS computed the
mean and standard error (SE) of each β coefficient by bootstrapping, using 5000 sub-
samples of the data. A t-test was then performed to determine if the β coefficient was
significantly different from zero at the conventional .05 level (where t = β/SE).
SmartPLS also computed the R2
values (i.e., measuring the effect sizes, or the
proportions of the variance explained) which are the primary criteria for the
assessment of the quality of a PLS model (Hair et al., 2014). The R2 value reflected
the fit of the data to the model. R2 ≤ 4% was assumed to be negligible, 5% to 24%
was small, 25% to 63% was moderate, and ≥ 64% was large (Esposito Vinzi et al.,
2010).
PLS-SEM path diagrams were constructed to test the following nine
hypotheses, proposing relationships between pairs of latent variables. The latent

56
variables included the intentional adaptive movement of the referee, the perceived
information, the goal-directed action of the referee, and the constraints, as posited by
the ecological psychology dimension of ecological dynamics theory. All the latent
variables were operationalized using the indicators defined in Table 3.1
H1: The ball position (perceived information) predicts the referee position
(intentional adaptation of movement).
H2: The referee attributes (constraint predicts the ball position (perceived
information)
H3: The referee attributes (constraint) predict the referee position (intentional
adaptation of movement).
H4: The referee attributes (constraint) predict ball tracking (intentional
adaptation of movement)
H5: The ball position (perceived information) predicts the quality of the
referee’s decision (goal-directed action)
H6: The referee position (intentional adaptation of movement) predicts the
quality of the referee’s decision (goal-directed action).
H7: The viewing angle between the referee, the assistant referee, and the ball
(constraint) predicts the quality of the referee’s decision (goal-directed
action).
H8: Ball tracking, meaning the correlation between the X, Y coordinates of the
ball and the referee and the distance of the referee from the ball (intentional
adaptation of movement) predicts the quality of the referee’s decision (goal-
directed action).
H9: The attributes of the referee (constraint) predict the quality of the referee’s
decision (goal-directed action).
All the hypotheses were worded in a positive direction to test aspects of the
ecological dynamics theory. All the hypotheses are logically possible, and could
potentially be supported by empirical evidence, except H2, because it is improbable
that the referee could influence the position of the ball. H2 was included in the
analysis as simple method to determine whether the PLS model provided false
positives (i.e., whether it identified spurious or unexpected significant relationships).

57
3.6 ETHICS
Ethical permission was obtained from the QUT Human Research and Ethics
Committee (Approval number 1300000659). In addition, consent for participation
was obtained from the Referees Committee in the Qatar Football Association. All the
collected data were treated with the utmost confidentiality, with the data being
reported upon in an aggregate way so that the identity of the individual participants
was not revealed. The prospective participants were advised that they were free to
withdraw at any time, without prejudice or consequences of any kind. No names
were recorded. The participants were not personally identified in any publication or
report. To ensure additional security and confidentiality, the research materials were
stored in the home of the researcher. The computer data and password-protected,
while backup copies were kept on CDs in locked filing cabinets. As required by the
Queensland University of Technology, the coded information were, and will be, kept
under strict security, at all times, by the researcher, being stored for the required
period of five years, and then destroyed.
3.7 STRUCTURE OF RESULTS
The results are presented systematically in three chapters. Chapter 4 focuses on
the spatial characteristics of soccer matches, based on the relative positions of the
ball and the referee. Chapter 5 focuses on the spatial characteristics of the fouls and
the referee positioning. Chapter 6 focuses on the factors associated with the quality
of the decision making of referees.

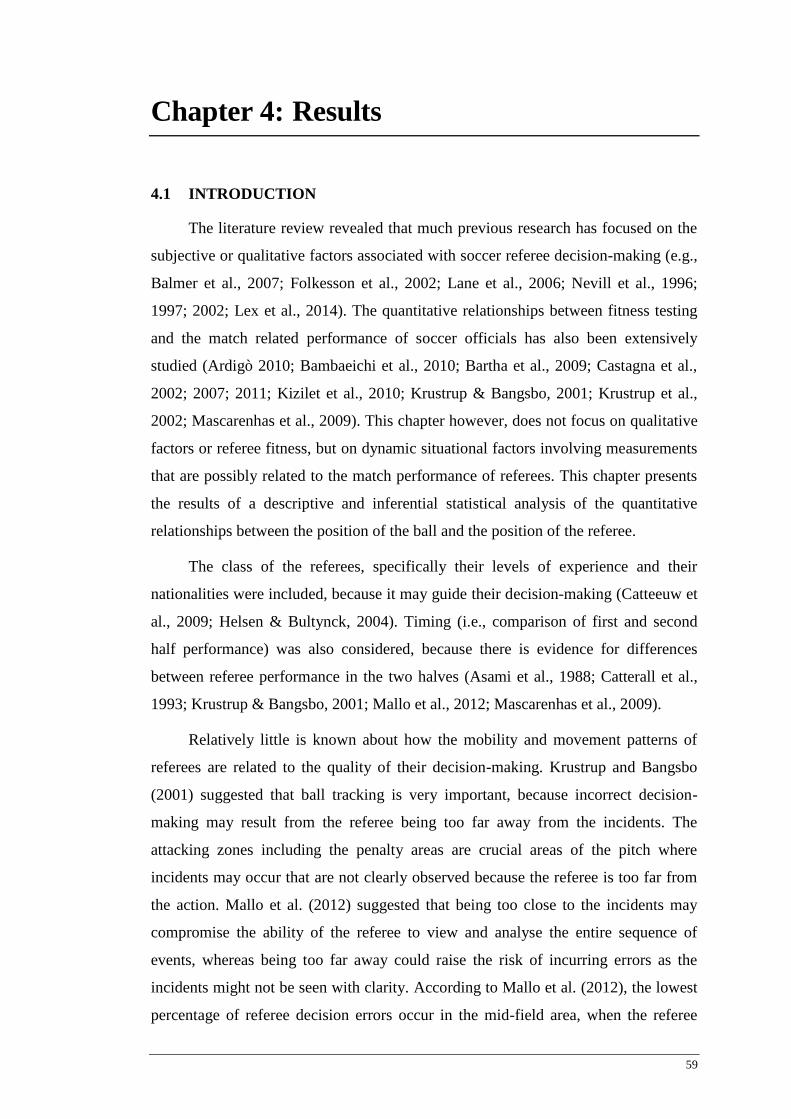
59
Chapter 4: Results
4.1 INTRODUCTION
The literature review revealed that much previous research has focused on the
subjective or qualitative factors associated with soccer referee decision-making (e.g.,
Balmer et al., 2007; Folkesson et al., 2002; Lane et al., 2006; Nevill et al., 1996;
1997; 2002; Lex et al., 2014). The quantitative relationships between fitness testing
and the match related performance of soccer officials has also been extensively
studied (Ardigò 2010; Bambaeichi et al., 2010; Bartha et al., 2009; Castagna et al.,
2002; 2007; 2011; Kizilet et al., 2010; Krustrup & Bangsbo, 2001; Krustrup et al.,
2002; Mascarenhas et al., 2009). This chapter however, does not focus on qualitative
factors or referee fitness, but on dynamic situational factors involving measurements
that are possibly related to the match performance of referees. This chapter presents
the results of a descriptive and inferential statistical analysis of the quantitative
relationships between the position of the ball and the position of the referee.
The class of the referees, specifically their levels of experience and their
nationalities were included, because it may guide their decision-making (Catteeuw et
al., 2009; Helsen & Bultynck, 2004). Timing (i.e., comparison of first and second
half performance) was also considered, because there is evidence for differences
between referee performance in the two halves (Asami et al., 1988; Catterall et al.,
1993; Krustrup & Bangsbo, 2001; Mallo et al., 2012; Mascarenhas et al., 2009).
Relatively little is known about how the mobility and movement patterns of
referees are related to the quality of their decision-making. Krustrup and Bangsbo
(2001) suggested that ball tracking is very important, because incorrect decision-
making may result from the referee being too far away from the incidents. The
attacking zones including the penalty areas are crucial areas of the pitch where
incidents may occur that are not clearly observed because the referee is too far from
the action. Mallo et al. (2012) suggested that being too close to the incidents may
compromise the ability of the referee to view and analyse the entire sequence of
events, whereas being too far away could raise the risk of incurring errors as the
incidents might not be seen with clarity. According to Mallo et al. (2012), the lowest
percentage of referee decision errors occur in the mid-field area, when the referee

60
observes the incidents from a critical range of 11 to 15 m, suggesting that there is no
optimum distance, but a critical range of distances over which referee decision
making is most accurate.
The ecological psychology dimension of the ecological dynamics theory
predicts that (a) the decision making of the referee (a goal-directed action) depends
upon the quantitative relationships between the position of an incident on the ball
(the perceived information) and the position of the referee (i.e., the intentional
adaptation of movement associated with ball tracking); and (b) these behaviours are
constrained by various factors. The ecological dynamics theory provided a
perspective to conduct the statistical analysis presented in this chapter, specifically to
(a) explore the descriptive statistics summarizing the positions of the referee and the
ball, and (b) describe the relationships between ball position, the referee position,
ball tracking, and the referee attributes. The following hypotheses were tested:
H1: The ball position (perceived information) predicts the referee position
(intentional adaptation of movement)
H2: The referee attributes (constraint) predict the ball position (perceived
information)
H3: The referee attributes (constraint) predict the referee position (intentional
adaptation of movement)
H4: The referee attributes (constraint) predict ball tracking (intentional
adaptation of movement).
4.2 VARIABLES
The database containing the information for the statistical analysis included the
Referee Attributes, Ball Position, Referee Position, and Ball Tracking in the first and
second halves of 104 matches officiated by 25 referees in the Qatar Stars League in
the 2011/2012 season. Although the database contained information for 132 matches,
the data for the first and second halves of 28 matches were incomplete due to missing
values and probable transcription errors (e.g., impossibly low measures of the
distance between the referee and the ball). The variables extracted from the database
are defined in Table 3.1.

61
4.3 REFEREE ATTRIBUTES
Table 4.1 outlines the attributes of 25 referees. The 25 referees are coded
alphabetically and not identified individually, for ethical reasons. The number of
matches officiated by each referee ranged from 1 to 11. Over three quarters (n = 19,
76.0%) of the referees were classified as FIFA Level 3 (i.e., already internationally
qualified at the start of the 2011/12 season). The majority (n = 22, 88.0%) were
International class. The nationality of over half of the referees (n = 15, 60.0%) was
Not Qatari.
Table 4-1
Attributes of 25 Referees
Referee ID Code Number of
Matches
FIFA
Class Referee Class Nationality
A 11 3 International Qatari
B 10 3 International Qatari
C 12 3 International Qatari
D 11 3 International Qatari
E 15 2 International Qatari
F 8 2 International Qatari
G 8 1 International Qatari
H 7 1 National Qatari
I 6 1 National Qatari
J 1 1 National Qatari
K 1 3 International Not Qatari
L 1 3 International Not Qatari
M 1 3 International Not Qatari
N 1 3 International Not Qatari
O 1 3 International Not Qatari
P 1 3 International Not Qatari
Q 1 3 International Not Qatari
R 1 3 International Not Qatari
S 1 3 International Not Qatari
T 1 3 International Not Qatari
U 1 3 International Not Qatari
V 1 3 International Not Qatari
W 1 3 International Not Qatari
X 1 3 International Not Qatari
Y 1 3 International Not Qatari
Table 4.2 presents a cross-tabulation of the frequency distribution of the
Referee Attributes. The most frequent group (n = 15, 60.0%) was International class,
Not Qatari, and FIFA Level 3. The next most frequent group (n = 7, 28.0%) was
International class, Qatari, including FIFA Level 3 (n = 4); Level 2 (n = 2); and
Level 1 (n = 1). The least frequent group was National class, Qatari (n = 3) in FIFA
Level 1 (i.e., only qualified as national referees during the 2011/2012 season).

62
Table 4-2
Referee Classes and Nationality
Class Nationality FIFA Level Total Percent
1 2 3
National Qatari 3 0 0 3 12.0%
International Not Qatari 0 0 15 15 60.0%
Qatari 1 2 4 7 28.0%
4.4 POSITION OF BALL
The descriptive statistics for Ball Position, including Kolmogorov-Smirnov
tests for normality are presented in Table 4.3 using the indicator variables defined in
Table 3.1, specifically BL 1/3% = Proportion of time (%) ball is in left 1/3 of pitch;
BM 1/3% = Proportion of time (%) ball is in middle 1/3 of pitch; BR 1/3%=
Proportion of time (%) ball is in right 1/3 of pitch; BL PA% = Proportion of time (%)
ball is in left penalty area, BR PA% = Proportion of time (%) ball is in right penalty
area.
All of the measures were normally distributed, with the exception of BL PA%
in the first half. In both the first and second halves, on average (a) the ball was in the
left third of the pitch for about one quarter of the time (Mean = 24.93% and 26.12%
respectively); (b) the ball was in the right third of the pitch for about one quarter of
the time (Mean = 26.50% and 26.31% respectively): (c) the ball was in the middle
third of the pitch for just less than half of the time (Mean = 48.58% and 47.57%
respectively); (d) the ball was in the left third for about one tenth of the time (5.08%
and 5.77% respectively); (e) the ball was in the right penalty area for about one tenth
of the time (5.69% and 5.72% respectively).
Table 4-3
Ball Position in First and Second Halves
First Half
Indicator Mean SD Minimum Maximum Normality (p)
BL 1/3% 24.93 4.91 13.30 36.60 .938
BM 1/3% 48.58 3.88 39.60 57.30 .758
BR 1/3% 26.50 5.37 17.40 43.60 .402
BLPA% 5.08 1.78 2.00 12.00 .038*
BRPA% 5.69 1.89 2.30 11.10 .149

63
Second Half
Indicator Mean SD Minimum Maximum Normality (p)
BL 1/3% 26.12 5.44 15.90 37.60 .334
BM 1/3% 47.57 4.03 38.90 57.80 .863
BR 1/3% 26.31 5.66 14.90 41.70 .531
BLPA% 5.77 2.15 1.80 12.40 .356
BRPA% 5.72 2.21 1.90 12.60 .286
Note: * Deviation from normality (p < .05)
The matrix of scatter plots in Figure 4.1 display the correlations with linear
trend lines between the proportions of the time that ball spent in the left, right, and
middle thirds of the pitch and the left and right penalty areas across the two halves of
the 104 matches.
403020 403020 1284 128460
50
4040
30
20
40
30
20
12
8
4
BL 1/3% BR 1/3% BL PA% BR PA%
BM
1/3
%B
L 1
/3
%B
R 1
/3
%B
L P
A%
Figure 4.1. Relationships between ball positions in left, right, and middle of pitch
The more time the ball was in the middle of the pitch the less time it was in the
right and left thirds and in the penalty area. The more time the ball was in the left
third of the pitch, the less time it was in the right third and right penalty area. The
more time the ball was in the right third of the pitch, the less time it was in the left
third and left penalty area. Consequently, ball position was identified as a construct,
consisting of a linear combination of four inter-correlated variables. A construct or
latent variable is a component of a structural equation model that cannot be measured
empirically with a single measurement. It can only be inferred by compositing
several correlated measurements together into a single dimension using factor
analysis (Hair et al., 2014). For example, ball position was operationalized in PLS-

64
SEM as a latent variable, consisting of a linear combination of BL 1/3%, BM 1/3%,
BR 1/3%, BLPA% and BRPA%.
4.5 POSITION OF REFEREE
The descriptive statistics for Referee Position, including Kolmogorov-Smirnov
tests for normality are presented in Table 4.4. using the variables defined in Table
3.1, specifically RL 1/3% = Proportion of time (%) referee is in left 1/3 of pitch; RM
1/3% = Proportion of time (%) referee is in middle 1/3 of pitch; RR 1/3% =
Proportion of time (%) referee is in right 1/3 of pitch; RLPA% = Proportion of time
(%) referee is in left enlarged penalty area (5 m larger than actual penalty area);
RRPA% = Proportion of time (%) referee is in right enlarged penalty area (5 m larger
than actual penalty area).
Table 4-4
Referee Position in First and Second Halves
First Half
Indicator Mean SD Minimum Maximum Normality (p)
RL 1/3% 20.27 6.45 9.00 36.00 .252
RM 1/3% 57.57 5.83 42.60 74.10 .708
RR 1/3% 22.15 6.40 11.00 38.10 .324
RLPA% 6.69 4.46 0.00 23.40 .349
RRPA% 7.70 4.91 0.10 22.10 .092
Second Half
Indicator Mean SD Minimum Maximum Normality (p)
RL 1/3% 22.82 7.45 8.30 41.80 .754
RM 1/3% 54.56 6.50 39.00 71.30 .243
RR 1/3% 22.61 8.09 4.20 49.60 .143
RLPA% 8.86 5.77 0.00 32.50 .085
RRPA% 9.22 7.09 0.00 38.50 .045*
Note: * Deviation from normality (p < .05)
In both the first and second halves, on average (a) the referee was in the left
third of the pitch for about one fifth of the time (Mean = 20.27% and 22.82%
respectively); (b) the referee was in the right third of the pitch for about one fifth of
the time (Mean = 22.15% and 22.61% respectively); (c) the referee was in the middle
third of the pitch for most of the time (Mean = 57.57% and 54.56% respectively); (d)
the referee was in the left penalty area for less than one tenth of the time (6.69% and
8.86% respectively); (e) the referee was in the right penalty area for less than one

65
tenth of the time (7.70% and 7.09% respectively). The positions of the referee are
not in the actual penalty area but in the expanded penalty zone (defined in Table 3.1
as 5 m larger than the actual penalty zone). Consequently, the proportion of time the
referee spent in the expanded zone cannot be compared directly with the proportion
of time that the ball was in the actual penalty area. Comparison of the mean values,
however, indicated that the referee spent a higher proportion of time in the expanded
penalty zones (Mean = 6.69% to 9.22%) than the ball did in the left and right penalty
areas (Mean = 5.08% to 5.77%).The minimum and maximum values of RL1/3%
(8.30% and 41.80%); RM1/3 % (39.00% and 74.10%) and RR1/3% (4.20% and
49.60%) indicated that some referees moved much further up and down the pitch
than others.
The matrix of scatter plots in Figure 4.2 display the negative correlations with
linear trend lines between the proportions of the time that the referees spent in the
left, right, and middle portions of the pitch and the expanded penalty areas across the
two halves of the 104 matches.
453015 40200 30150 4020075
60
45
40
20
0
40
20
030
15
0
RL 1/3% RR 1/3% RL PA% RR PA%
RM
1/3
%R
L 1
/3
%R
R 1
/3
%R
L P
A%
Figure 4.2. Relationships between referee positions in left, middle, and right of pitch
The more time the referees spent in the middle of the pitch the less time they
spent in the right and left thirds and the penalty areas. The more time they spent in
the right third and right penalty area, the less time they spent in the left third. The
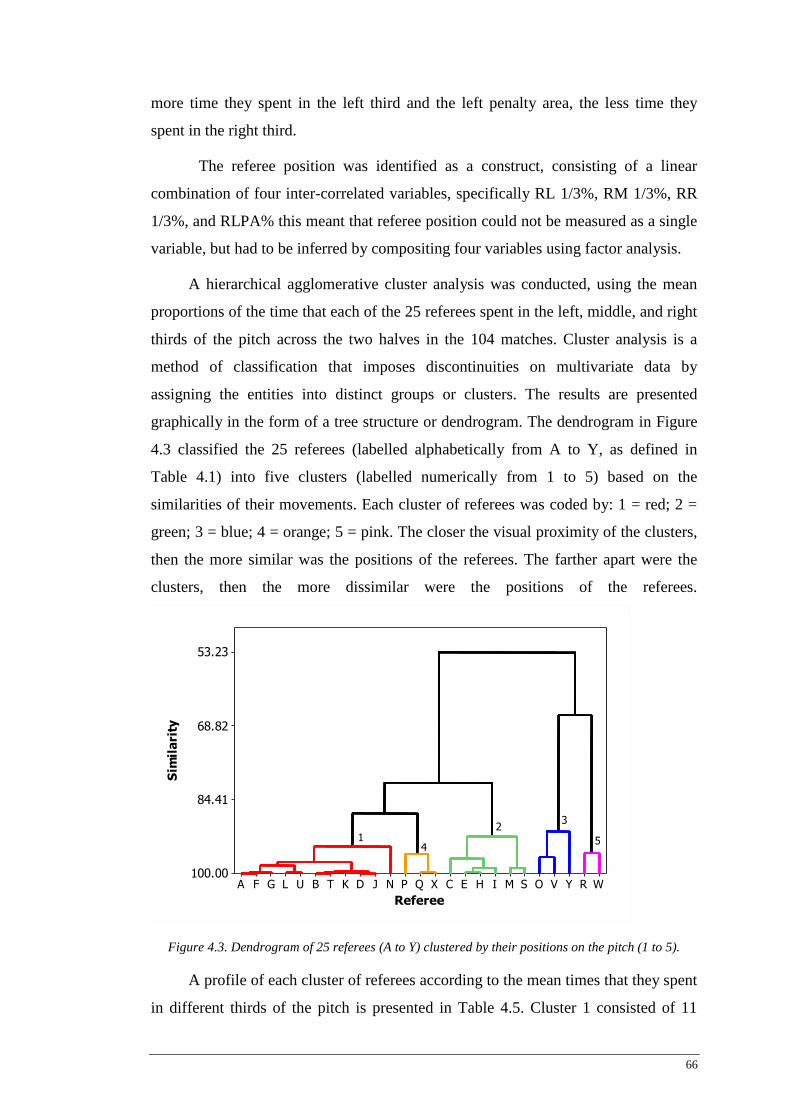
66
more time they spent in the left third and the left penalty area, the less time they
spent in the right third.
The referee position was identified as a construct, consisting of a linear
combination of four inter-correlated variables, specifically RL 1/3%, RM 1/3%, RR
1/3%, and RLPA% this meant that referee position could not be measured as a single
variable, but had to be inferred by compositing four variables using factor analysis.
A hierarchical agglomerative cluster analysis was conducted, using the mean
proportions of the time that each of the 25 referees spent in the left, middle, and right
thirds of the pitch across the two halves in the 104 matches. Cluster analysis is a
method of classification that imposes discontinuities on multivariate data by
assigning the entities into distinct groups or clusters. The results are presented
graphically in the form of a tree structure or dendrogram. The dendrogram in Figure
4.3 classified the 25 referees (labelled alphabetically from A to Y, as defined in
Table 4.1) into five clusters (labelled numerically from 1 to 5) based on the
similarities of their movements. Each cluster of referees was coded by: 1 = red; 2 =
green; 3 = blue; 4 = orange; 5 = pink. The closer the visual proximity of the clusters,
then the more similar was the positions of the referees. The farther apart were the
clusters, then the more dissimilar were the positions of the referees.
WRYVOSMIHECXQPNJDKTBULGFA
53.23
68.82
84.41
100.00
Referee
Sim
ila
rity
14
2
5
3
Figure 4.3. Dendrogram of 25 referees (A to Y) clustered by their positions on the pitch (1 to 5).
A profile of each cluster of referees according to the mean times that they spent
in different thirds of the pitch is presented in Table 4.5. Cluster 1 consisted of 11

67
referees who spent over half of their time in the middle third of the pitch (54.9%) and
similar proportions of time in the left third (22.47%) and the right third (21.35%).
Cluster 2 consisted of six referees who spent over 60% of their time in the middle
third of the pitch (60.52%) with more time in the right third (21.35%) than in the left
third (18.14%). Cluster 3 consisted of three referees who spent less than half of their
time in the middle of the pitch (45.17%) and a similar proportion of time in the left
third (26.02%) and the right third (28.82%). Cluster 4 consisted of three referees who
also spent over half of their time in the middle of the pitch (51.23%) but with more
time in the left third (27.98%) than in the right third (20.73%). Cluster 5 consisted of
two referees who also spent less than half of their time in the middle of the pitch
(45.27%)but with more time in the right third (36.92%) than in the left third
(17.77%).
Table 4-5
Profile of 25 Referees by their Positioning on the Pitch
Cluster RL 1/3% Mean RM 1/3% Mean RR 1/3% Mean
1 22.47 54.59 22.92
2 18.14 60.52 21.35
3 26.02 45.17 28.82
4 27.98 51.23 20.73
5 17.77 45.27 36.92
4.6 BALL TRACKING
All the indicator variables used to measure the ball tracking of the referee (i.e.,
the correlations between the position of the ball and the referee) were defined in
Table 3.1, specifically B-R X Corr = the correlation coefficient (Pearson’s r) between
the x coordinate of the referee and the x coordinate of ball, where the x coordinate is
the length of the pitch; B-R Corr Max = the maximum lead or lag correlation
(Pearson's r) between the x coordinate of the referee and the x coordinate of ball
(obtained by assessing various lead and lag correlations to find the value that was
highest); B-R Corr Max Lag = the lag (positive values) or lead (negative values) at
which B-R Corr Max was maximal.
The descriptive statistics for Ball Tracking, including Kolmogorov-Smirnov
tests for normality are presented in Table 4.6. The ball tracking variables were
normally distributed, with the exception of B-R Corr Max Lag. In both the first and
second halves, on average (a) the distance between the referee and the ball was > 20

68
m (Mean = 21.58 m and 20.98 m respectively), with a range of 18.6 to 23.7 m; (b)
the mean total distance covered by the referee was just over 6000 m, with a range of
5074 to 5386 m; (c) the correlation (Pearson’s r) between the x coordinate of referee
and the x coordinate of ball was strong (Mean = .79 and .82 respectively); (d) the
maximum lead or lag correlation between the x coordinate of the referee and the x
coordinate of the ball was similarly strong (Mean = .795 and .820 respectively); (d)
the Lag (Positive values) or Lead (Negative values) at which B-R Corr was maximal
were smaller in the first half (Mean = 0.99) than in the second half (Mean = 1.53).
Table 4-6
Ball Tracking in First and Second Halves
First Half
Indicator Mean SD Minimum Maximum Normality
(p)
Total Distance 6007.4 425.2 5074.3 7356.2 .623
B-R Dist Ave 21.58 1.17 18.60 23.80 .713
B-R X Corr 0.79 0.04 0.67 0.88 .871
B-R Corr Max 0.79 0.04 0.67 0.88 .903
B-R Corr Max Lag 0.99 1.11 -2.00 4.00 .001*
Second Half
Indicator Mean SD Minimum Maximum Normality
(p)
Total Distance 6036.9 518.8 5113.0 7385.9 .803
B-R Dist Ave 20.98 1.68 18.60 23.70 .024*
B-R X Corr 0.82 0.04 0.72 0.90 .935
B-R Corr Max 0.82 0.4 0.73 0.91 .973
B-R Corr Max Lag 1.53 1.15 -1.00 5.00 .003*
Note: * Deviation from normality (p < .05)
The average lag correlation was close to 1, which corresponds to one sample or
.275 seconds. In other words, the typical referee responded to a change in the ball’s
position up or down the pitch, on average, after about .275 of a second. However,
the minimum lag value (-1.00) and the maximum lead value (5.00) of B-R Corr Max
Lag indicated that some referees appeared to anticipate the ball movement (i.e., to
lead) while others had longer lags, implying that they responded later to the ball
position changes. Individual differences between the referees are reflected in Table
4.8 by comparing the mean values of B-R Corr Max Lag of the 27 referees across the
104 matches.

69
Table 4.7 shows that four referees (I, L, Q, S) on average had zero lag values,
but the majority (15) had lead values between 0.50 and 1.65. Five referees (K, M, T,
E, and N) were the worst at anticipating the ball movement, with maximal average
lag values ≥ 2.0, corresponding to about 0.5 seconds.
Table 4-7
Comparison of B-R Corr Max Lag in 25 Referees
Referee ID Code Mean B-R Corr Max Lag
I 0.00
L 0.00
Q 0.00
S 0.00
V 0.50
X 0.50
A 0.59
G 0.69
C 0.79
P 1.00
W 1.00
Y 1.00
D 1.14
F 1.38
H 1.50
J 1.50
O 1.50
U 1.50
B 1.65
K 2.00
M 2.00
T 2.00
E 2.17
N 2.50
The matrix of scatter plots in Figure 4.4 displays the correlations with linear
trend lines between B-R Dist Ave, B-R X Corr, B-R Corr Max, and B-R Corr Max
Lag. The greater the average distance the referees were away from the ball, then the
smaller were the correlations between the x coordinates, and the smaller the
maximum lead or lag correlation between the x coordinates. All of correlations
between the x coordinates of the ball and referee were positively related to each
other. Consequently, ball tracking was identified as a construct. Ball tracking was a

70
composite variable, which could be operationalized by factor analysis, consisting of a
linear combination of four inter-correlated variables, specifically B-R X Corr, B-R
Corr Max, B-R Corr Max Lag, and B-R Dist Ave.
0.90.80.7 0.90.80.7 5.02.50.024
21
18
0.9
0.8
0.7
0.9
0.8
0.7
B-R X Corr B-R Corr Max B-R Corr Max Lag
B-R
Dis
t A
ve
B-R
X C
orr
B-R
Co
rr M
ax
Figure 4.4. Relationships between B-R Dist Ave, B-R X Corr, B-R Corr Max, and B-R Corr
Max Lag
4.7 TESTING OF HYPOTHESES
Figure 4.5 is a copy of the path diagram output by SmartPLS using the
aggregated data for the first and second halves in 104 matches to provide evidence at
the 0.05 level of significance to support H1: The Ball Position predicts the Referee
Position. The path diagram includes yellow rectangular symbols to represent the
empirical measurements known as indicators, which were linearly combined by
factor analysis to operationalize the two latent variables, named Ball Position and
Referee Position. The operational definitions of the indicators are provided in Table
3.1. The arrows between the indicators and the latent variables represented the factor
loadings. The arrow between the two latent variables represented a hypothetical
causal relationship. The number next to the arrow was the β coefficient, which
measured the strength and direction of the correlation between the two latent
variables. The number inside the Referee Position symbol was the R2 value,
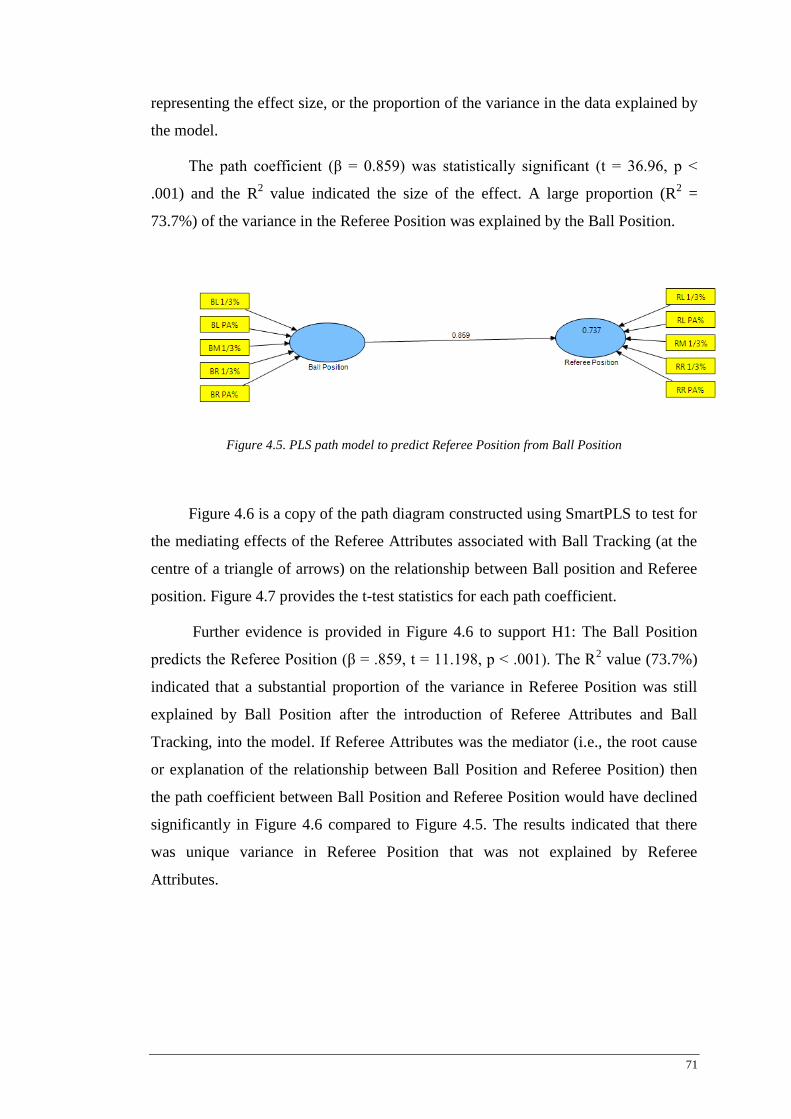
71
representing the effect size, or the proportion of the variance in the data explained by
the model.
The path coefficient (β = 0.859) was statistically significant (t = 36.96, p <
.001) and the R2 value indicated the size of the effect. A large proportion (R
2 =
73.7%) of the variance in the Referee Position was explained by the Ball Position.
Figure 4.5. PLS path model to predict Referee Position from Ball Position
Figure 4.6 is a copy of the path diagram constructed using SmartPLS to test for
the mediating effects of the Referee Attributes associated with Ball Tracking (at the
centre of a triangle of arrows) on the relationship between Ball position and Referee
position. Figure 4.7 provides the t-test statistics for each path coefficient.
Further evidence is provided in Figure 4.6 to support H1: The Ball Position
predicts the Referee Position (β = .859, t = 11.198, p < .001). The R2 value (73.7%)
indicated that a substantial proportion of the variance in Referee Position was still
explained by Ball Position after the introduction of Referee Attributes and Ball
Tracking, into the model. If Referee Attributes was the mediator (i.e., the root cause
or explanation of the relationship between Ball Position and Referee Position) then
the path coefficient between Ball Position and Referee Position would have declined
significantly in Figure 4.6 compared to Figure 4.5. The results indicated that there
was unique variance in Referee Position that was not explained by Referee
Attributes.
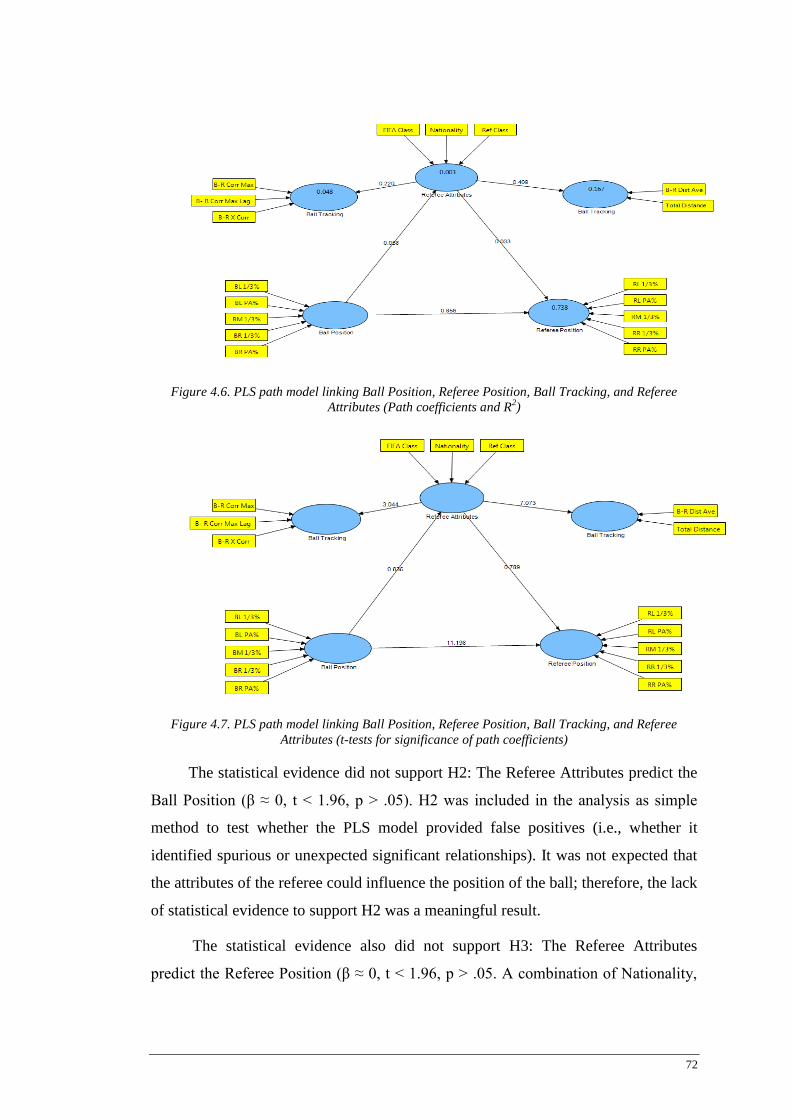
72
Figure 4.6. PLS path model linking Ball Position, Referee Position, Ball Tracking, and Referee
Attributes (Path coefficients and R2)
Figure 4.7. PLS path model linking Ball Position, Referee Position, Ball Tracking, and Referee
Attributes (t-tests for significance of path coefficients)
The statistical evidence did not support H2: The Referee Attributes predict the
Ball Position (β ≈ 0, t < 1.96, p > .05). H2 was included in the analysis as simple
method to test whether the PLS model provided false positives (i.e., whether it
identified spurious or unexpected significant relationships). It was not expected that
the attributes of the referee could influence the position of the ball; therefore, the lack
of statistical evidence to support H2 was a meaningful result.
The statistical evidence also did not support H3: The Referee Attributes
predict the Referee Position (β ≈ 0, t < 1.96, p > .05. A combination of Nationality,

73
Referee Class, and FIFA Class did not appear to be significantly related to Ball
Position or Referee Position.
The statistical evidence supported H4: The Referee Attributes predict Ball
Tracking. Referee Attributes was a significant predictor (β = .409, t = 7,073, p <.001)
of B-R Dist Ave (the average distance between the referee and the ball). Referee
Attributes was also a significant predictor (β = .220, t = 3.044, p =.002) of B-R Corr,
B-R Corr Max Lag, and B-R X Corr (referring to the correlations between the x
coordinates of the referee and x coordinates of the ball on the pitch). The ability of
the referee to track the ball, in terms of distance from the ball, and coordinating his
position with the position of the ball, appeared to be related to a combination of
Nationality, Referee Class, and FIFA Class.


75
Chapter 5: Spatial Characteristics of Fouls
and Referee Positioning at Time
of Fouls
5.1 INTRODUCTION
This chapter presents an analysis of the spatial characteristics of 3464 fouls and
the referee positioning and viewing angles at times of the fouls. It was essential to
describe the distances of the referees from the fouls, the distances moved by the
referee toward or away from the fouls, and the viewing angles, because these
variables guide the ability of the referees to view and analyse the entire sequence of
events before making a correct decision (Krustrup & Bangsbo, 2001; Mallo et al.,
2012; Oudejans, 2005). The frequencies of fouls in the first halves of the matches
(1739, 50.2%) were equivalent to the frequencies of fouls in the second halves (1725,
49.8%). Therefore, the kinematic data for the two halves were combined. A
distinction between the first and second half was not necessary.
Section 5.2 of this chapter describes the positions of the ball at the time of
each foul. Section 5.3 describes the distances of the referees from each foul. Section
5.4 describes the viewing angles and Section 5.5 considers the effects of the referee
attributes.
5.2 POSITION OF EACH FOUL
The position of the ball at the time of each foul was located by partitioning the
pitch into nine X, Y zones as illustrated in Figure 5.1. The nine zones consisted of
three sectors 40 m in length each end and the midfield, and three sectors across the
pitch (far, middle and near), 24 m wide. The combination of three sectors by pitch
length and three sectors by pitch width gave nine zones, each with coordinates
defined by X and Y.
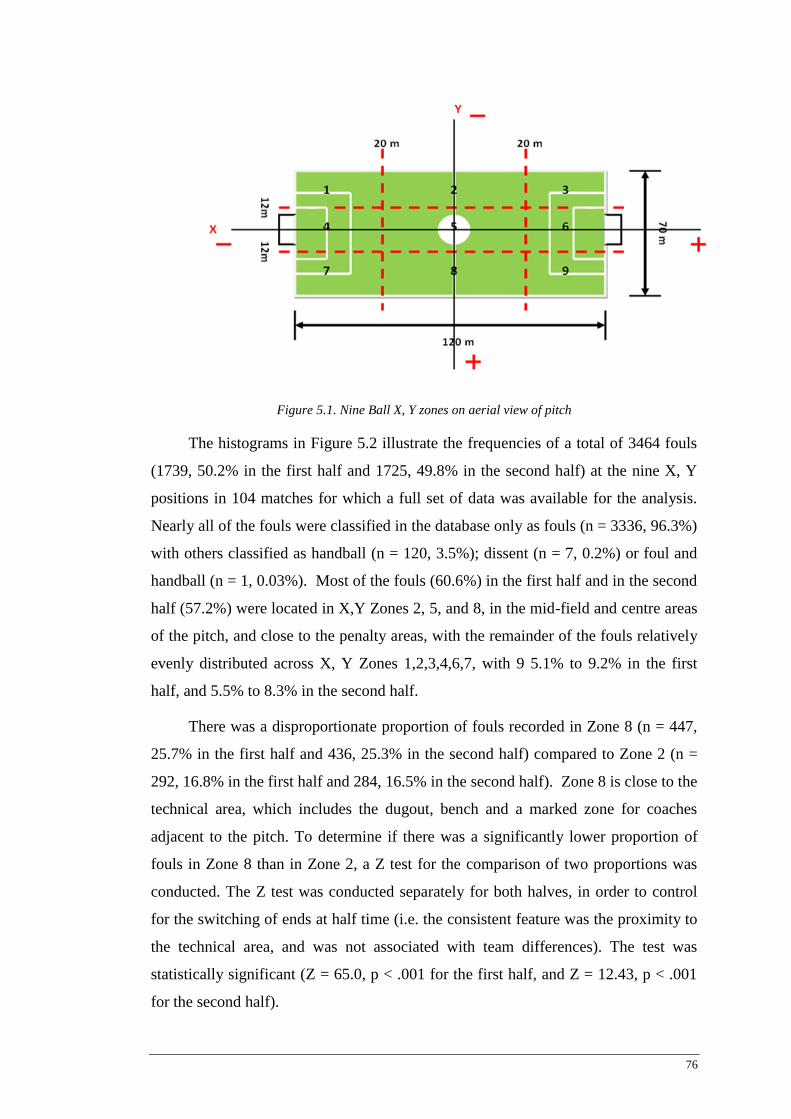
76
Figure 5.1. Nine Ball X, Y zones on aerial view of pitch
The histograms in Figure 5.2 illustrate the frequencies of a total of 3464 fouls
(1739, 50.2% in the first half and 1725, 49.8% in the second half) at the nine X, Y
positions in 104 matches for which a full set of data was available for the analysis.
Nearly all of the fouls were classified in the database only as fouls (n = 3336, 96.3%)
with others classified as handball (n = 120, 3.5%); dissent (n = 7, 0.2%) or foul and
handball (n = 1, 0.03%). Most of the fouls (60.6%) in the first half and in the second
half (57.2%) were located in X,Y Zones 2, 5, and 8, in the mid-field and centre areas
of the pitch, and close to the penalty areas, with the remainder of the fouls relatively
evenly distributed across X, Y Zones 1,2,3,4,6,7, with 9 5.1% to 9.2% in the first
half, and 5.5% to 8.3% in the second half.
There was a disproportionate proportion of fouls recorded in Zone 8 (n = 447,
25.7% in the first half and 436, 25.3% in the second half) compared to Zone 2 (n =
292, 16.8% in the first half and 284, 16.5% in the second half). Zone 8 is close to the
technical area, which includes the dugout, bench and a marked zone for coaches
adjacent to the pitch. To determine if there was a significantly lower proportion of
fouls in Zone 8 than in Zone 2, a Z test for the comparison of two proportions was
conducted. The Z test was conducted separately for both halves, in order to control
for the switching of ends at half time (i.e. the consistent feature was the proximity to
the technical area, and was not associated with team differences). The test was
statistically significant (Z = 65.0, p < .001 for the first half, and Z = 12.43, p < .001
for the second half).

77
987654321
30
25
20
15
10
5
0
Ball X,Y Zone (First Half) at Time of Foul
Pe
rce
nt
9.2
25.7
6.07.4
18.1
5.45.1
16.8
6.2
987654321
30
25
20
15
10
5
0
Ball X,Y Zone (Second Half) at Time of Foul
Pe
rce
nt
8.3
25.3
8.38.1
15.4
6.85.5
16.5
5.7
Figure 5.2. Frequencies of fouls in X, Y zones in first and second halves
Figure 5.2 shows that the majority of the fouls were recorded in Zones 2, 5, and
8, in the central one-third of the pitch. There are at least two possible reasons to
explain this distribution. The first reason is that the highest frequencies of fouls in the
central one-third of the pitch was probably associated with the greater proportion of
play in the central one-third of the pitch, as reflected by the relative positions of the
ball. The data in Table 5.1 confirms that the highest frequency of fouls (n = 2041,
58.92%) were called in the middle 1/3 of the pitch. The proportion of play was also
highest in the middle 1/3 of the pitch (57.8% on average). The second reason for the
highest number of fouls called in the middle area of the pitch is that the referee also
spends most time there. The data in Table 5.1 confirms that the referee spent most

78
time in the centre of the pitch (56.06% on average) where most of the fouls were
committed. A Chi-square (observed vs. expected frequencies) test could not be
conducted to determine the statistical significance of the associations between the
relative positions of the ball, referee, and fouls because the data were provided to the
researcher in the form of percentages and not frequencies.
Table 5-1
Relationship between Position of Ball, Position of Referee, and Frequency of Fouls
Area of Pitch Average
Position of
Ball
Average Position
of Referee Frequency of Fouls (N = 3464)
Zone Frequency %
Left 1/3 25.2% 21.54% 1 207
4 211
7 248
Total 666 19.23%
Middle 1/3 57.8% 56.06% 2 578
5 581
8 882
Total 2041 58.92%
Right 1/3 14.9% 22.38% 3 184
6 269
9 304
Total 757 21.86%
5.3 DISTANCE OF REFEREE FROM EACH FOUL
The number of fouls per match recorded ranged from 19 to 52 with an average
of 33 fouls per match. The average distances between the referees between 0 and 5
seconds before the fouls were classified into categories, using 5 m class intervals,
following Mallo et al. (2012). The histogram in Figure 5.3 illustrates the
approximately normal (bell-shaped) frequency distribution of the distances of the
referees from the fouls. Almost half (48.7%) of the fouls were located between 10 to
20 m from the referee, indicated by the most frequent distances of the referees from
the fouls (26.2% between 10 to 15 m and 22.5% between 15 to 20 m.). Only 20.7%
of the fouls were located less than 10 m from the referee, whilst 30.7% were located
between 20 and 50 m from the referee. Table 5.2 presents the descriptive statistics
for the distances of the referee from the fouls (mean, standard deviation, maximum,
minimum, 95% CI) in each of the 104 matches. The average distance of the referee
from each foul between 0 and 5 s before the foul was 16.63 m, and covered a very
wide range, from 0.00 to 47.40 m (95% CI = 16.37, 16.88). The mean distance of the

79
referee from the foul at 5 s before each foul was 22.0 m, with a wide range of 3.00 to
60.0 m (95% CI = 21.64, 22.36). The mean distance of the referee from the ball at
the time of each foul was 17.50 m, with a very wide range of 2.00 to 48.00 m (95%
CI = 17.25, 17.76). The mean distance moved by the referee toward (-) or away (+)
from each foul between 0 and 5 s before the foul was - 4.49 m, also with a very wide
range of -49.00 to 41.00 m (95% CI = -4.49, -4.10).
Figure 5.3. Frequency distribution of referees’ distances from fouls
Table 5-2
Descriptive Statistics for Referees’ Distances from Fouls
Variables Mean SD Min Max 95% CI
Distance of referee from foul at 5 s before the
foul (m)
22.00 10.66 3.00 60.00 21.64, 22.36
Distance of referee from ball between 0 – 5s
before the foul (m)
16.63 7.68 0.00 47.40 16.37, 16.88
Average distance of referee from foul at time
of foul
17.50 7.63 2.00 48.00 17.25, 17.76
Distance moved by referee toward (-) or away
(+) from the ball between 0 to 5 s before the foul
-4.49 11.74 -49.00 41.00 -4.49, -4.10
The scatter plot fitted with a linear trend line in Figure 5.4 illustrates that the
mean distance of the referee from the fouls in each match was positively correlated
with the B-R Distance Ave (i.e., the average distance of the referee from the ball). A
significant correlation was indicated by Pearson’s r = .237, p = .016).
50454035302520151050
30
25
20
15
10
5
0
Referee Distance From Foul (m)
Pe
rce
nt
0.10.21.5
4.3
8.8
15.8
22.5
26.2
17.6
3.1

80
Figure 5.4. Correlation between mean distance of referee from foul and ball
Figure 5.5 shows the pattern of distribution of the mean distances ± 95% CI of
the referees from the fouls between 0 to 5 s before the fouls in the nine x, y zones.
When the fouls were located in the top right corner of the pitch (Zone 1) or the
bottom right corner of the pitch (Zone 9) corresponding to the areas monitored by the
assistant referees, the referees’ distances from the fouls were the highest (mean =
25.97 m , 95% CI =25.07, 26.87 and mean = 24.95 m, 95% CI = 24.14, 25.76
respectively). When the fouls were in the left or right sides in the middle of the pitch
(Zones 2 and 8) the referees’ distances from the fouls were lower (mean = 17.77,
95% CI =17.17, 18.37 and mean = 15.89 m, 95% CI = 15.43, 16.35 respectively)
than in Zones 1, 2, 8, and 9. When the fouls were in other parts of the pitch (Zones 3,
4, 6, and 7) the distances of the referees from the fouls were lower than in the corners
(mean = 13.34, 95% CI =12.45, 14.22 in Zone 3 to mean = 15.15 m, 95% CI = 13.48,
15.10 in Zone 7).The mean distance of the referees from the fouls was lowest (12.1
m, 95% CI = 11.67, 12.53) in the central mid-field area of the pitch in Zone 5.
Consequently, the pattern in the distribution of the distances of the referees from the
fouls vs. the nine X, Y zones was a U shape. During the five seconds before the fouls
were called, the referees appeared to cover most ground towards the ball if it was in
the midfield. In the corners, the referees appeared to move away from the ball during
that time, mainly because the assistant referees officiated at the corners.
24232221201918
21
20
19
18
17
16
15
14
13
B-R Distance Ave (m)
Me
an
Dis
tan
ce
of
Re
fere
e f
rom
Fo
ul
(m)

81
987654321
28
26
24
22
20
18
16
14
12
10
Ball X,Y Zone
Re
fere
e D
ista
nce
Fro
m F
ou
l (m
)
24.9
15.9
14.315.1
12.1
15.1
13.3
17.8
25.9
Figure 5.5. Mean distances (± 95% CI) of referees from fouls in nine X, Y Zones
Figure 5.6 displays a contour plot (bird’s eye or aerial view, equivalent to the
zone plot in Figure 5.1) showing the average distances of the referees from the fouls
five seconds before the fouls vs the X and Y coordinates of the ball measured from
the centre line. Figure 5.7 shows the corresponding contour plot of the distances of
the referees from the fouls at the exact time of the fouls. The different shades of
green and blue represent the same distance from the foul. The distances of the
referees from the fouls were highest at 20 m to > 45 m in the green regions in the top
left corner of the pitch (i.e., Zone 1 in Figure 5.1) and the bottom right corner of the
pitch (i.e., Zone 9 in Figure 5.1).These two corners of the pitch corresponded
approximately to what Mallo et al. (2012) called the lateral zones or the areas of
influence of the assistant referees, where the referee does necessarily have to go (see
Figure 2.2).

82
Figure 5.6. Contour plot of referees’ distances 5 s before foul vs. X, Y coordinates
Figure 5.7. Contour plot of referees’ distances at time of foul vs. X, Y coordinates
The darker blue areas in Figure 5.6 indicated that the referees’ distances 5 s
before the fouls were generally < 10 m around the mid-field area (Zone 5). The paler
blue areas in the other corners without assistant referees (Zone 3 and 7) and the other
attacking or defending areas (Zone 2, 4, 6, 7 and 8) indicated that most of the time,
Pitch Location X
Pit
ch
Lo
ca
tio
n Y
50250-25-50
30
20
10
0
-10
-20
-30
> – –
– – – – – – – <
40 4545
00 55 1 0
1 0 1 51 5 2020 2525 3030 35
35 40
Foul (m)From
DistanceReferee
Pitch Location X
Pit
ch
Lo
ca
tio
n Y
50250-25-50
30
20
10
0
-10
-20
-30 >
– – – – – – – –
<
45
5
5 1 01 0 1 51 5 2020 2525 3030 3535 4040 45
(m)DistanceReferee
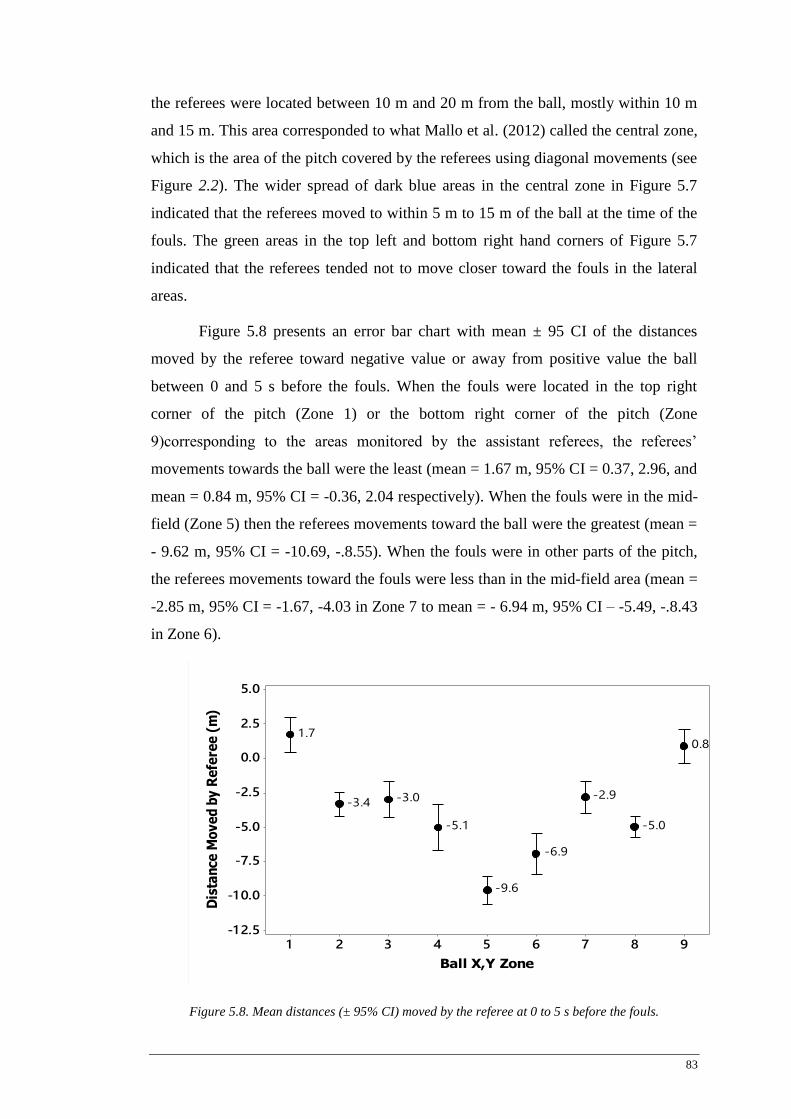
83
the referees were located between 10 m and 20 m from the ball, mostly within 10 m
and 15 m. This area corresponded to what Mallo et al. (2012) called the central zone,
which is the area of the pitch covered by the referees using diagonal movements (see
Figure 2.2). The wider spread of dark blue areas in the central zone in Figure 5.7
indicated that the referees moved to within 5 m to 15 m of the ball at the time of the
fouls. The green areas in the top left and bottom right hand corners of Figure 5.7
indicated that the referees tended not to move closer toward the fouls in the lateral
areas.
Figure 5.8 presents an error bar chart with mean ± 95 CI of the distances
moved by the referee toward negative value or away from positive value the ball
between 0 and 5 s before the fouls. When the fouls were located in the top right
corner of the pitch (Zone 1) or the bottom right corner of the pitch (Zone
9)corresponding to the areas monitored by the assistant referees, the referees’
movements towards the ball were the least (mean = 1.67 m, 95% CI = 0.37, 2.96, and
mean = 0.84 m, 95% CI = -0.36, 2.04 respectively). When the fouls were in the mid-
field (Zone 5) then the referees movements toward the ball were the greatest (mean =
- 9.62 m, 95% CI = -10.69, -.8.55). When the fouls were in other parts of the pitch,
the referees movements toward the fouls were less than in the mid-field area (mean =
-2.85 m, 95% CI = -1.67, -4.03 in Zone 7 to mean = - 6.94 m, 95% CI – -5.49, -.8.43
in Zone 6).
Figure 5.8. Mean distances (± 95% CI) moved by the referee at 0 to 5 s before the fouls.
987654321
5.0
2.5
0.0
-2.5
-5.0
-7.5
-10.0
-12.5
Ball X,Y Zone
Dis
tan
ce M
ov
ed
by
Re
fere
e (
m)
0.8
-5.0
-2.9
-6.9
-9.6
-5.1
-3.0-3.4
1.7

84
Figure 5.9 presents a contour plot of the same data depicted in Figure 5.8
displaying the referees’ movement 0 to 5 s before the fouls vs. the X, Y coordinates
of the pitch. In the five seconds before calling a foul, the blue areas in the contour
plot representing negative values indicated that the referees tended to move closer to
the ball much more in the centre of the pitch than they did further away from the
centre. The green areas of the contour plot representing the positive values indicated
that the referees tended to move further away from the ball if the fouls were closer to
the corners. Consequently, although the referees’ movements were generally to get
closer to the ball immediately before a foul, this was dependent upon where on the
pitch the foul occurred.
Figure 5.9. Contour plot of referees’ movement at 0 to 5 s before the foul vs. X, Y
coordinates of pitch
5.4 VIEWING ANGLES
The viewing angles to the fouls were defined by 0A1RB and 5A1RB the angle
between Assistant Referee 1, the Referee, and the ball, and by 0A2RB and 5A2RB
the angle between Assistant Referee 2, the Referee, and the ball. The viewing angles
ranged from approximately zero to approximately 180 degrees, and were not
normally distributed, so that parametric descriptive statistics (e.g., mean and standard
Pitch Location X
Pit
ch
Lo
ca
tio
n Y
50250-25-50
30
20
10
0
-10
-20
-30
> –
– – – – – – – <
40
-40-40 -30-30 -20-20 -1 0-1 0 0
0 1 01 0 2020 30
30 40
(m)Referee
Moved byDistance

85
deviation) were not justified. The angles had bimodal distributions, as illustrated by
the frequency distribution histograms in Figure 5.10.
Figure 5.10. Frequency distributions of viewing angles
Figure 5.11 displays the contour plots of the viewing angles to the fouls vs. the
X, Y coordinates of the pitch. The different shades of green and blue reflect regions
with the same viewing angles. The pale green areas reflected that angles 5A1RB
between Assistant Referee 1, the Referee, and the ball 5 s before the fouls were the
greatest (95o
and 135o) in the top left corner of the pitch Zones 1, 2, and 4. The
darker green areas reflected that angles 0A1RB between Assistant Referee 1, the
Referee, and the ball the time of the fouls were higher (135o
to 155o) and became
progressively higher toward the corner Zone 1. The blue areas reflect that 5 s before
the fouls, angles 5A1RB were lowest (< 95o) in the bottom right corner of the pitch
(Zones 6, 8, and 9) and became progressively lower (< 35o) the closer to the corner
(Zone 9) at the times of the fouls.
1 751 501 251 007550250
4.8
3.6
2.4
1 .2
0.01 751 501 251 007550250
4
3
2
1
0
1 751 501 251 007550250
6.0
4.5
3.0
1 .5
0.01 751 501 251 007550250
4.8
3.6
2.4
1 .2
0.0
0A1 RB AngleP
erc
en
t5A1 RB Angle
0A2RB Angle 5A2RB Angle


87
Figure 5.11.Contour plots of viewing angles vs. X, Y coordinates of pitch
Pitch Location X
Pitc
h Lo
cati
on Y
50250-25-50
30
20
10
0
-10
-20
-30
> – – – – – – –
– <
1 75
1 51 5 35
35 5555 7575 9595 1 1 5
1 1 5 1 351 35 1 551 55 1 75
Angle5A1 RB
Pitch Location X
Pitc
h Lo
cati
on Y
50250-25-50
30
20
10
0
-10
-20
-30
> – – – – – – –
– <
1 75
1 51 5 35
35 5555 7575 9595 1 1 5
1 1 5 1 351 35 1 551 55 1 75
Angle5A2RB
Pitch Location X
Pitc
h Lo
cati
on Y
50250-25-50
30
20
10
0
-10
-20
-30
> – – – – – – –
– <
1 75
1 51 5 35
35 5555 7575 9595 1 1 5
1 1 5 1 351 35 1 551 55 1 75
Angle0A2RB


89
The Angle 5A2RB between Assistant Referee 2, the Referee, and the ball five
seconds before the fouls tended to be smaller than the Angle 0A2RB at the time of
the fouls, reflected by decrease in the size and intensity of the blue regions in the left
top corner of the pitch Zones 1, 2, and 4. Angles 0A2RB and 5A2RB progressively
increased to larger angles (95o to 155
o) indicated by the blue regions toward the
bottom right corner of the pitch (Zones 6, 8, and 9). Comparison of the contour maps
at 5 seconds before the fouls and at the times of the fouls indicate that the viewing
angles for Assistant Referee 1 tended to increase, reflected by a higher proportion of
green regions; whereas the viewing angles for Assistant Referee 2 tended to
decrease, reflected by a higher proportion of blue regions.
5.5 REFEREE ATTRIBUTES AND POSITIONING
Figure 5.12 displays the mean distances ± 95% CI of the referees from the
fouls vs. two attributes of the referees
FIFAClass
Nationality
321
QNQQNQQNQ
18.5
18.0
17.5
17.0
16.5
16.0
15.5
15.0
Re
fere
e D
ista
nce
Fro
m F
ou
l (m
)
Figure 5.12. Mean distances of referees from fouls (± 95% CI) vs referee attributes (FIFA
Class 1, 2, or 3; NQ = Not Qatari, Q = Qatari)
The lack of overlaps between the 95% CI indicated that FIFA Class 1 referees
who only qualified as national referees during the 2011/2012 season tended to be
significantly further away from the fouls than the Class 2 referees who became
internationally qualified during the 2011/12 season, as well as the Class 3 referees
90
who were already internationally qualified at the start of the 2011/12 season. The
experienced Class 3 Qatari referees, were on average, 2.1 m closer to the fouls than
the less experienced Class 1 Qatari referees. Consequently, referee expertise
appeared to be a factor that could be potentially associated with their closeness to the
fouls, and hence may have influenced the quality of their decision-making.

91
Chapter 6: Decision Making of Referees
6.1 INTRODUCTION
The purpose of Chapter 6 is to focus more directly on the overall research
question guiding this research, specifically: What factors predict the quality of a
referee’s decision in a soccer match? The overall research question was addressed by
testing the following hypotheses, underpinned by the ecological dynamics theory:
H5: The ball position (perceived information) predicts the quality of the
referee’s decision (goal-directed action)
H6: The referee position (intentional adaptation of movement) predicts the
quality of the referee’s decision (goal-directed action).
H7: The viewing angle between the referee, the assistant referee, and the ball
(constraint) predicts the quality of the referee’s decision (goal-directed
action)
H8: Ball tracking, meaning the correlation between the X,Y coordinates of the
ball and the referee and the distance of the referee from the ball (intentional
adaptation of movement) predicts the quality of the referee’s decision (goal-
directed action).
H9: The attributes of the referee (constraint) predict the quality of the referee’s
decision (goal-directed action).
After a descriptive analysis of the available data on the rating of the accuracy
or quality of the referee’s decisions, the results of a PLS path analysis are presented,
to test the above six hypotheses.
6.2 QUALITY OF REFEREES’ DECISIONS
6.2.1 Inter-rater Agreement
The rating scale used by the experts provided two measures of referee decision
measuring quality and accuracy for the 3464 fouls, termed Basic and Severity. Each
measure used a 5-point ordinal score, ranging from 0 to 4 where 4 = strongly agree
with referee’s decision and 0 = strongly disagree with referee’s decision. The

92
researcher agreed with 20/58, 34.5% of the ratings of the experts. The magnitude of
the inter-rater reliability of the 5-point scale used to measure the quality of the
referees’ decisions for the Basic rating between the expert raters and the researcher
was moderate, indicated by weighted kappa = .510 (95% CI = .329, .691) and the
Intra class Correlation Coefficient, ICC = .512 (95% CI = . 294, .679).
The frequency distributions of the quality ratings for the referees’ decisions
did not vary significantly between the first half and the second half for both the Basic
scores (χ2
= 3.54, p = .471) and the Severity scores (χ2
= 7.42, p = .115).
Consequently, the experts' ratings were combined for the two halves of each match,
and no distinction was made between the two halves.
6.2.2 Frequency Distribution of Decision Scores
The histograms in Figure 6.1 illustrate the frequency distributions of the
experts’ decision scores, averaged per match across 104 matches Basic Ave and
Severity Ave. The score distributions were very skewed, with conspicuous modes at
4.0 corresponding to strong levels of agreement with the referees’ decisions. The
mean decision scores ranged from 2.5 to 4.0. 75.0% of the Basic scores were 4.0 and
over 52.4% of the Severity scores were 4.0. Because of the highly skewed
distribution, parametric statistics were not justified to summarize the scores. An
attempt was made to normalize the distributions by transformation in order to
conduct parametric statistics, however, it was not found possible to normalize the
very highly skewed data using reciprocals, exponents, or Box-Cox transformations.
4.03.93.83.73.63.53.43.33.23.13.02.92.82.72.62.5
80
70
60
50
40
30
20
10
0
Quality of Referee's Decision (Basic Ave)
Pe
rce
nt
75.0
7.78.24.8
1.90.5 0.50.5 1.0

93
Figure 6.1. Frequency distributions of Basic and Severity Decision Scores
6.3 FACTORS ASSOCIATED WITH DECISION QUALITY
6.3.1 Position on the Pitch
Table 6.1 presents the Kruskal-Wallis (K-W) Chi-Square statistics to determine
if there were significant differences between the positions of the fouls on the pitch in
the nine X, Y zones and the median Basic scores and Severity scores awarded for the
quality of the referees’ decisions in the nine X, Y zones. No significant differences
were found, indicated by p > .05 for the K-W tests. The quality of the referees’
decisions was not associated with the positions of the fouls on the pitch.
Table 6-1
Relationship between Positions of Foul and Referee Decision Making
Zone Median
Basic
Score
K-W
Chi-
Square
p Median
Severity
Score
K-W
Chi-
Square
p
1 3.97 8.26 .408 3.93 4.60 .799
2 3.99 3.93
3 3.98 3.95
4 3.97 3.92
5 3.98 3.95
6 3.96 3.88
7 3.98 3.88
8 3.98 3.95
9 3.97 3.96
4.03.93.83.73.63.53.43.33.23.13.02.92.82.72.62.5
60
50
40
30
20
10
0
Quality of Referee's Decision (Severity Ave)
Pe
rce
nt
52.4
8.7
13.910.6
6.73.4
1.01.41.0 0.5 0.5

94
6.3.2 Referees’ Distances from Fouls
Figure 6.2 displays the means ± 95% CI of the average distances of the referees
from the fouls between 0 to 5 s before the fouls vs. the Basic and Severity Scores
awarded for each foul.
Figure 6.2. Mean distances of referees from fouls (± 95% CI) vs. Basic and Severity Scores
When there was no agreement between the referees and the raters, indicated by
Basic and Severity scores of zero implying that the referee’s decisions were probably
completely wrong when the mean distances of the referees from the fouls were 19.4
m (95% CI = 16.7, 22.0) and 16.8 m (95% CI = 15.3, 18.3) respectively. When there
was very strong agreement, indicated by Basic and Severity scores of 4, meaning that
the referees’ decisions were probably completely correct, the mean distances of the
referees from the fouls were 17.5 m (95% CI =17.2, 17.7) and 17.6 m (95% CI =
17.3, 17.8) respectively. The overlapping 95% CI implied that there was probably
43210
30
25
20
15
10
5
0
-5
Basic
Re
fere
e D
ista
nce
fro
m F
ou
l (m
)
17.516.5
20.9
12.4
19.4
43210
25
20
15
10
5
Severity
Re
fere
e D
ista
nce
fro
m F
ou
l (m
)
17.6
16.115.5
16.116.8

95
little or no difference between the mean distances of the referees across the range of
decision scores.
Figure 6.3 displays the means ± 95% CI of the average distances of referees'
from 581 fouls in the mid-field area Zone 5 vs. the Basic and Severity Scores
awarded for each foul.
Figure 6.3. Mean distances of referees from fouls (± 95% CI) in Zone 5 vs. Basic and
Severity Scores
The referees tended to be closer to the fouls in Zone 5 than elsewhere on the
pitch. When the referees decisions were rated as completely incorrect, indicated by
Basic and Severity scores of zero, the mean distances of the referees from the fouls
in Zone 5 were 15.4 m (95% CI = 11.5, 19.3) and 13.1 m (95% CI = 9.9, 16.2)
respectively. When the referees’ decisions were rated as completely correct,
4320
35
30
25
20
15
10
Basic
Re
fere
e D
ista
nce
(m
) fr
om
Fo
ul
in Z
on
e 5
12.911.6
20.0
15.4
43210
75
50
25
0
-25
-50
Severity
Re
fere
e D
ista
nce
(m
) fr
om
Fo
ul
in Z
on
e 5
12.99.514.413.313.1

96
indicated by Basic and Severity scores 4, of the mean distances of the referees from
the fouls in Zone 5 were 12.9 m (95% CI =12.5, 13.4). The overlapping 95% CI
implied that there was probably little or no difference between the mean distances of
the referees across the range of decision scores.
Figure 6.4 displays the means ± 95% CI of the average distances of referees'
from 207 fouls in the top left hand corner of the pitch Zone 1 vs. the Basic and
Severity Scores awarded for each foul.
Figure 6.4. Mean distances of referees from fouls (± 95% CI) in Zone 1 vs. Basic and
Severity Scores
4320
40
35
30
25
20
Basic
Re
fere
e D
ista
nce
fro
m F
ou
l in
Zo
ne
1 (
m)
26.8
18.0
26.0
29.4
4320
40
35
30
25
20
Basic
Re
fere
e D
ista
nce
fro
m F
ou
l in
Zo
ne
1 (
m)
26.8
18.0
26.0
29.4

97
The referees tended to be significantly further away from the fouls in Zone 1
than elsewhere on the pitch. When the referees decisions were rated as completely
incorrect, indicated by Basic and Severity scores of zero, the mean distances of the
referees from the fouls in Zone 1 covered a much wide range than in Zone 5,
specifically 29.4 m (95% CI = 18.2, 40.6) and 26.6 m (95% CI = 19.8, 33.4)
respectively. When the referees’ decisions were rated as completely correct,
indicated by Basic and Severity scores 4, of the mean distances of the referees from
the fouls in Zone 1 did not cover such a wide range, specifically 26.8 m (95% CI =
25.9, 27.7) and 26.9 m (95% CI = 26.0, 27.8) respectively. The overlapping 95% CI
implied that there was probably little or no difference between the mean distances of
the referees across the range of decision scores.
Table 6.2 presents the descriptive statistics for the distances of the referees
from the fouls when the referees decisions were rated as completely correct (i.e. the
experts’ score = 4) stratified by the nine X, Y zones of the pitch. In Zone 5 correct
decisions were made when the referees were closest to the foul (mean = 12.07 m,
range = 1.60 to 3.90 m, 95% CI = 11.64, 12.50). In Zones 1 and 9 the referees made
correct decisions at much larger distances from the foul. In Zone 1 these distances
were: mean = 25.97, range = 7.70 to 42.00, 95% CI = 26.06, 26.87. In Zone 9 these
distances were similar (mean = 24.97, range = 7.70 to 47.40, 95% CI = 24.11, 25.73).
In the other zones of the pitch, the referees made correct decisions at distances from
the fouls that were in between the two extremes of Zones 5 and Zones 1 and 9.
Table 6-2
Descriptive Statistics for Distances From Fouls When Referee Decisions Were Correct
Zone n Mean SD Minimum Maximum 95% CI
1 200 25.97 6.50 7.70 42.00 25.06 26.87
2 570 17.75 7.28 2.40 43.30 17.16 18.35
3 180 13.31 6.10 0.00 32.20 12.42 14.20
4 205 15.06 6.09 4.20 33.50 14.22 15.89
5 568 12.07 5.26 1.60 30.90 11.64 12.50
6 259 15.22 5.77 3.20 31.90 14.52 15.92
7 242 14.31 6.42 2.70 38.30 13.50 15.11
8 867 15.91 6.94 1.10 41.90 15.44 16.37
9 295 24.92 7.12 7.40 47.40 24.11 25.73

98
Table 6.3 presents the descriptive statistics for the distances the referees moved
toward (-) or away from (+) the fouls when the referees decisions were rated as
completely correct (i.e. the experts Score = 4) stratified by the nine X, Y zones of the
pitch. In Zone 5 the central mid-field area correct decisions were made when the
referees run the longest distance toward the foul (mean = -9.79 m, range = -46.00 to
27.00 m, 95% CI = -10.87, -8.71). In Zones 1 and 9, corresponding approximately, to
what Mallo et al. (2012) called the lateral zones or the areas of influence of the
assistant referees the referees made correct decisions whilst moving away from the
foul. In Zone 1 these distances were mean = 1.57 m, range = -21.00 to 27.00, 95% CI
= 0.28, 2.85. In Zone 9 the distances were similar (mean = 0.76, range = -32.00 to
41.00, 95% CI = -0.45, 1.97). In the other zones of the pitch, the referees made
correct decisions when moving towards the fouls at distances that were in between
the extremes of Zone 1 and Zones 9.
Table 6-3
Descriptive Statistics for Referees’ Movements Before Fouls When Decisions Were Correct
Zone n Mean SD Minimum Maximum 95% CI
1 200 1.57 9.30 -21.00 27.00 0.28 2.85
2 570 -3.43 10.88 -43.00 34.00 -4.33 -2.54
3 180 -3.07 9.08 -45.00 21.00 -4.39 -1.74
4 205 -5.11 12.32 -44.00 27.00 -6.80 -3.43
5 568 -9.79 13.08 -46.00 27.00 -10.87 -8.71
6 259 -6.77 12.29 -38.00 18.00 -8.26 -5.27
7 242 -2.88 9.42 -41.00 21.00 -4.07 -1.69
8 867 -5.06 11.31 -49.00 24.00 -5.81 -4.31
9 295 0.76 10.57 -32.00 41.00 -0.45 1.97
6.3.3 Viewing angles
Figure 6.5 illustrates the relationships between the Basic and Severity scores
for all fouls and the viewing angle to each foul. Fouls at all possible viewing angles
from (0° to 180°) degrees received decision scores of 0 to 4, indicating both
disagreement and agreement with the referee, irrespective of the viewing angle.
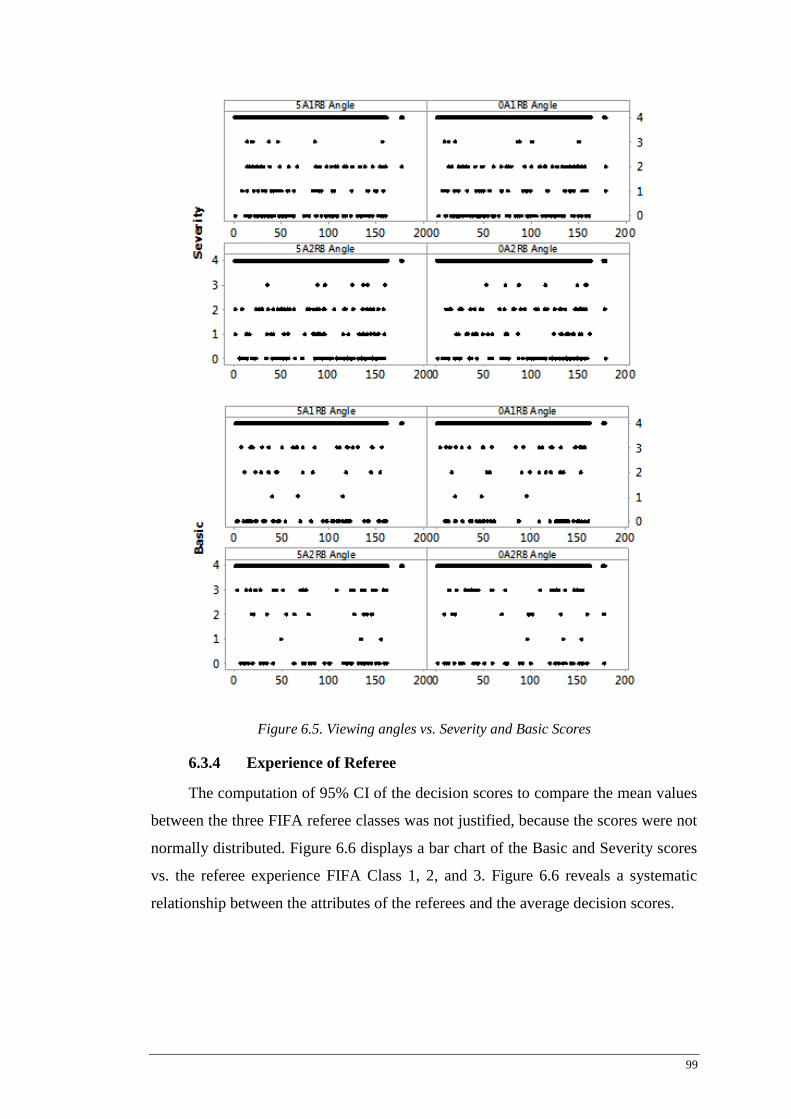
99
Figure 6.5. Viewing angles vs. Severity and Basic Scores
6.3.4 Experience of Referee
The computation of 95% CI of the decision scores to compare the mean values
between the three FIFA referee classes was not justified, because the scores were not
normally distributed. Figure 6.6 displays a bar chart of the Basic and Severity scores
vs. the referee experience FIFA Class 1, 2, and 3. Figure 6.6 reveals a systematic
relationship between the attributes of the referees and the average decision scores.

100
Figure 6.6. Quality of Referee’s Decision Scores vs. Referee Experience
FIFA Class 1 referees who only qualified as national referees during the
2011/2012 season tended to have the lowest average scores, followed by the Class 2
referees who became internationally qualified during the 2011/12 season and the
highest average decision scores were awarded to Class 3 referees who were already
internationally qualified at the start of the 2011/12 season.
6.4 TESTING OF HYPOTHESES
Figures 6.7 and 6.8 are copies of the path diagrams constructed using
SmartPLS to predict Decision Quality (i.e., the accuracy of the referee’s decisions,
based on the average scores for each of the 104 matches, across the first and second
halves (indicated by Basic Ave and Severity Ave). The R2 value in Figure 6.7
indicated that 25.9% of the variance in the Decision Quality was explained by this
model. Figure 6.8 provides the values of the t-test statistics, to indicate the
significance of the path coefficients t < 1.96 indicates significance at p < .05.
Ball Position was a significant predictor of Referee Position (β = .857, t =
23.633, p <.001) providing further evidence to support H1 as previously reported in
Chapter 4. Referee Position was a significant predictor of Viewing angle 1 (i.e., the
average viewing angles between Assistant Referee 1, the Referee, and the ball)
FIFAClass
SEVERITYBASIC
321321
4.00
3.95
3.90
3.85
3.80
3.75
3.70
Qu
ali
ty o
f R
efe
ree
's D
ecis
ion
3.96
3.91
3.863.88
3.83
3.79
(Avera
ge S
core
)

101
indicated by OA1RB Ave and 5A1RB (β = .185, t = 2.649, p =.008). Referee
Position was also a significant predictor of Viewing angle 2 (i.e., the average
viewing angles between Assistant Referee 2, the Referee, and the ball) indicated by
OA1RB Ave and 5A1RB (β = .234, t = 2.876, p =.004). However, the Ball Position,
Referee Position and the Viewing angles were not significant predictors of Decision
Quality (β ≈ 0; t < 1.96, p > .05). Consequently, the statistical evidence was not
consistent with H5: The position of the ball on the pitch predicts the quality of the
referee’s decision, or with H6: The position of the referee on the pitch predicts the
quality of the referee’s decision, or with H7. The viewing angle between the referee,
the assistant referee, and the ball predicts the quality of the referee’s decision.
Statistical evidence was provided to support H8: Ball tracking (i.e., the
correlation between the X, Y coordinates of the ball and the referee, and the distance
of the referee from the ball) predicts the quality of the referee’s decision and H9: The
attributes of the referee predict the quality of the referee’s decision. The strongest
significant predictor of Decision Quality (β = .501, t = 2.416, p = .016) was the
Distance of the Referee from the Ball, indicated by the average distance of the
referee from the ball (B-R Dist Ave) and the average distance of the referee from the
foul (Foul Dist Ave). Ball Tracking, indicated by BRCorr Max and BRXCorr, was
the second most strong predictor of Decision Quality (β = 0.278, t = 2.262, p =.024).

102
Figure 6.7. PLS path model of relationships between Ball Position, Referee Position, Viewing angles, Distance of Referee from Ball, Referee Ball Tracking, and Referee
Attributes (path coefficients and R2)

103
Figure 6.8. PLS path model of relationships between Ball Position, Referee Position, Viewing angles, Distance of Referee from Ball, Referee Ball Tracking, and Referee
Attributes) (t-tests for significance of path coefficients)


105
Referee Attributes FIFA Class and Ref Class were entered into the model as a
mediating variable at the centre of a triangle of arrows between Distance from Ball,
Ball Tracking, and Decision Quality. Referee Attributes was the weakest predictor of
Decision Quality (β = .202) but nevertheless statistically significant (t = 2.790, p =
.005) Referee Attributes were, however, not significantly related to Ball Tracking
including Distance from Ball (β ≈ 0, t > 1.96, p > .05).

106
Chapter 7: Discussion
7.1 INTRODUCTION
Much previous research has focused on the subjective or qualitative factors
associated with soccer referee decision-making (e.g., Balmer et al., 2007; Folkesson
et al., 2002; Lane et al., 2006; Nevill et al., 1997; 2002; Lex et al., 2014). The
quantitative relationships between fitness testing and the match related performance
of soccer officials has also been extensively studied (e.g., Casajus & Castagna, 2007;
Krustrup & Bangsbo, 2001; Krustrup et al., 2009; Mallo et al., 2007; Weston et al.,
2004). Limited research has been conducted on the quantitative dynamic situational
factors that may predict the quality of referee’s decisions in soccer matches (Mallo et
al., 2012) providing the direction and rationale for the current investigation.
The over-arching research question was: What quantitative factors predict the
quality of a referee’s decision in a soccer match? The results were based on a
statistical analysis of secondary archival data concerning 3464 potential fouls
committed in 104 matches officiated by 25 referees taking place in the Qatar Stars
League (QSL) in the 2011/2012 season. Kinematic match analysis data were
obtained from QSL in the proprietary format of the Prozone® system Version 10
(Prozone Sports Ltd, Leeds, UK), a leading optical tracking system widely used in
professional football. The quality of the referee’s decisions was evaluated by one
expert FIFA rater using a numerical scale from 0 to 4 (where 4 is strong agreement
with the referee’s decision and 0 is strong disagreement). About one quarter of the
Basic decision scores of the expert rater was less than 4 and almost half of the
Severity decision scores were less than 4. In comparison, Mallo et al. (2012)
determined that about 14% of the decisions of referees were incorrect when judging
foul play incidents. The high proportion of referee decisions rated as incorrect
reflected the increasingly negative and critical attitudes of critics toward soccer
officials, resulting in low confidence in their decision-making abilities (Boyko et al.,
2007; Dawson et al., 2007; Garicano et al., 2005; Lovell et al., 2014). Only a
moderate level of inter-rater agreement was found between the experts ratings and
the researcher’s ratings (weighted kappa = .510; 95% CI = .329, .691; Intra class
Correlation Coefficient, ICC = .512; 95% CI = .294, .679). Most previous studies

107
have similarly reported moderate inter-rater agreement between experts 47% to 79%
when evaluating the decisions of soccer referees (Andersen et al., 2004; Fuller et al.,
2004; Gilis et al., 2008; Mascarenhas et al., 2009).
The researcher used a structural equation modelling approach (PLS-SEM) to
test hypotheses concerning the performance of soccer referees underpinned by the
ecological dynamics theory. The hypotheses were tested using kinematic soccer
match data collected under actual match conditions focusing on the natural
interactions between the referees and their performance environment. In order to
support ecological dynamics theory, it was important that the performance of the
referees was not altered in such a way that the behaviour of the referees was artificial
or unnatural (Araújo et al., 2007). Furthermore, the statistical evidence provided by
the PLS-SEM models had sufficient ecological validity to support the ecological
psychology dimension of the theory. Ecological validity meant that the researcher
was able to provide evidence of the strength of the empirically derived relationships
between the latent variables, in terms of a substantial effect size, or the proportion of
the variance explained (Vicente, 2003).
The main part of this discussion chapter focuses on answering the stated
research questions, in the context of the literature. The answers to these research
questions are followed by a consideration of the implications of the research with
reference to theory (i.e., ecological dynamics) and practice (i.e., the movements and
positioning of officials on the pitch in relation to their decision-making).
Recommendations are made to enhance practice in order to improve the quality of
referee decision making. Finally, the limitations of the current research and
recommendations for future research are discussed.
7.2 RESEARCH QUESTIONS
7.2.1 RQ1: To what extent does the relative position of the ball and the
referee on the pitch predict the quality of the referee’s decision?
If referees are unable to track the position of the ball, then they risk incurring
decisional errors because foul play incidents might not be seen with clarity
(Klrustrup & Bangsbo, 2001). Consequently, the positions of the ball on the pitch
should predict the positions of the referee and ultimately be related to quality of the
referees’ decisions. The ball position was identified as a construct, consisting of a

108
linear combination of inter-correlated positions in the left, right, and middle of the
pitch and the penalty areas. On average, the ball was in the middle third of the pitch
for about half of the time, in the left third of the pitch for about one quarter of the
time, in the right third of the pitch for about one quarter of the time, in the left
expanded penalty area for about one tenth of the time, and in the right expanded
penalty area for about one tenth of the time. The referees spent a higher proportion of
their time in the expanded penalty zones than the ball did in the left and right penalty
areas. The minimum and maximum proportions of their time that the referees spent
in the left third (8.30% and 41.80%); middle (39.00% and 74.10%) and right third
(4.20% and 49.60%) of the pitch indicated that some referees moved much further up
and down the pitch than others to track the ball. A cluster analysis indicated that 80%
of the referees spent over half of their time in the middle third of the pitch, with
variable proportions of time in the left and right thirds, corresponding to the
movement and positioning of the ball.
The data analysis revealed the high strength of the ball tracking ability of the
majority of the referees in the QSL. On average, the lead correlation between the ball
position and the referee position was close to 1, corresponding to a change in the
ball’s position up or down the pitch after about .275 of a second; however, some
referees appeared to anticipate the ball movement better than others. The majority
had lead values between 0.50 and 1.65. Five referees were the better a anticipating
the ball movement, with maximal average lead values ≥ 2.0, corresponding to about
0.5 seconds. The PLS path model in Figure 4.5 was consistent with the hypothesis
that the ball position predicted the referee position. The strong statistically significant
path coefficient between the ball positions and the referee positions (β = 0.859, p <
.001) and R2
= 73.7% indicated that most of the variance in the referee positions on
the pitch was explained by the ball positions. A very strong correlation between the
ball positions and the referee positions would be expected; otherwise, the referees
would not be tracking the ball properly (Krustrup & Bangsbo, 2001).
No statistical evidence was provided to support the hypothesis that there was
an association between the position of the ball on the pitch (i.e., the X, Y coordinates
of the ball partitioning the pitch into nine zones) and the quality of the referee’s
decisions. Furthermore, the path coefficient in the PLS path model in Figure 6.7
between Ball Position and Decision Quality (β = .013) was not significantly different

109
from zero. The ratings of the expert regarding the referees’ decisions did not appear
to depend on the position of the ball on the pitch. No statistical evidence was
provided to support the hypothesis that the position of the ball on the pitch predicts
the quality of the referee’s decision.
In the context of the ecological dynamics theory, ball tracking was identified as
an intentional adaptation of movement of the referee, resulting from perceived
information, regarding the position of the ball. The quality of the referees’ decision
as a goal directed action did not appear to be constrained by situational factors
associated with the position of the ball on the pitch. The ball position, however,
strongly predicted the referee position. The ecological validity of this prediction was
reflected by the large effect size. This strong relationship supported the ecological
psychology dimension of the theory by demonstrating that the intentional adaptation
of movement by the referee was a function of the information perceived by the
referee regarding the position of the ball. Soccer referees may thereby couple their
movements to perceived information sources, equivalent to the way in which soccer
players intercept a passing ball (Travassos, 2012). The effect size, however, indicated
that 26.3% of the variance in the referee position was unexplained, suggesting that
more factors other than ball position also influenced the referee position.
Mallo et al. (2012) concluded that several situational factors (e.g., the speed of
the players, the status of the match, and the crowd pressure) might constrain the
effects of referee positioning, providing support for the constraints component of the
ecological dynamics theory. It was not, however, possible to include these variables
in the match analysis, because the situational constraints were not measured.
7.2.2 RQ2: To what extent does the position of the foul on the pitch
predict the quality of the referee’s decision?
The frequencies distribution of a total of 3464 fouls in 104 matches was
analysed. The number of fouls per match ranged from 19 to 52 with an average of 33
fouls per match. Fouls were called in all nine zones. Over half of the fouls were
located in zones 2, 5, and 8, in the attacking areas close to the centre of the pitch and
close to the middle of the penalty areas. The remainder of the fouls relatively evenly
distributed across the sides and corners of the pitch. No significant associations were
found between the frequencies of the positions of the fouls on the pitch in the nine
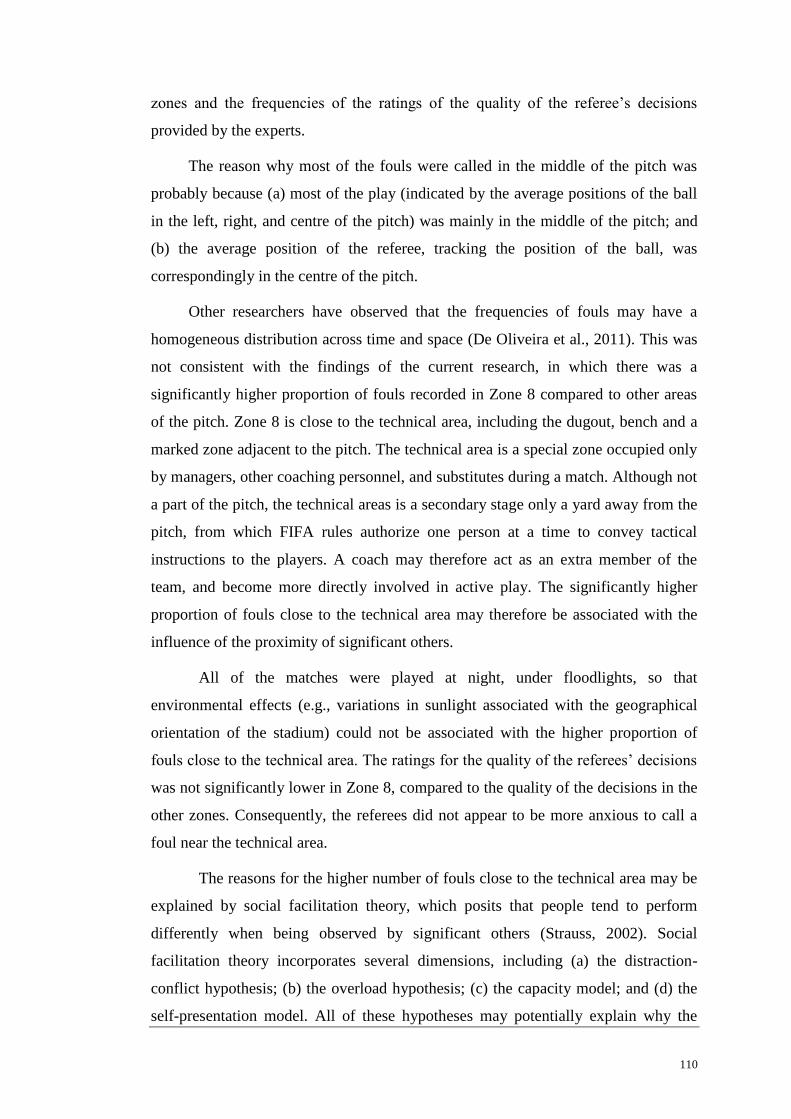
110
zones and the frequencies of the ratings of the quality of the referee’s decisions
provided by the experts.
The reason why most of the fouls were called in the middle of the pitch was
probably because (a) most of the play (indicated by the average positions of the ball
in the left, right, and centre of the pitch) was mainly in the middle of the pitch; and
(b) the average position of the referee, tracking the position of the ball, was
correspondingly in the centre of the pitch.
Other researchers have observed that the frequencies of fouls may have a
homogeneous distribution across time and space (De Oliveira et al., 2011). This was
not consistent with the findings of the current research, in which there was a
significantly higher proportion of fouls recorded in Zone 8 compared to other areas
of the pitch. Zone 8 is close to the technical area, including the dugout, bench and a
marked zone adjacent to the pitch. The technical area is a special zone occupied only
by managers, other coaching personnel, and substitutes during a match. Although not
a part of the pitch, the technical areas is a secondary stage only a yard away from the
pitch, from which FIFA rules authorize one person at a time to convey tactical
instructions to the players. A coach may therefore act as an extra member of the
team, and become more directly involved in active play. The significantly higher
proportion of fouls close to the technical area may therefore be associated with the
influence of the proximity of significant others.
All of the matches were played at night, under floodlights, so that
environmental effects (e.g., variations in sunlight associated with the geographical
orientation of the stadium) could not be associated with the higher proportion of
fouls close to the technical area. The ratings for the quality of the referees’ decisions
was not significantly lower in Zone 8, compared to the quality of the decisions in the
other zones. Consequently, the referees did not appear to be more anxious to call a
foul near the technical area.
The reasons for the higher number of fouls close to the technical area may be
explained by social facilitation theory, which posits that people tend to perform
differently when being observed by significant others (Strauss, 2002). Social
facilitation theory incorporates several dimensions, including (a) the distraction-
conflict hypothesis; (b) the overload hypothesis; (c) the capacity model; and (d) the
self-presentation model. All of these hypotheses may potentially explain why the
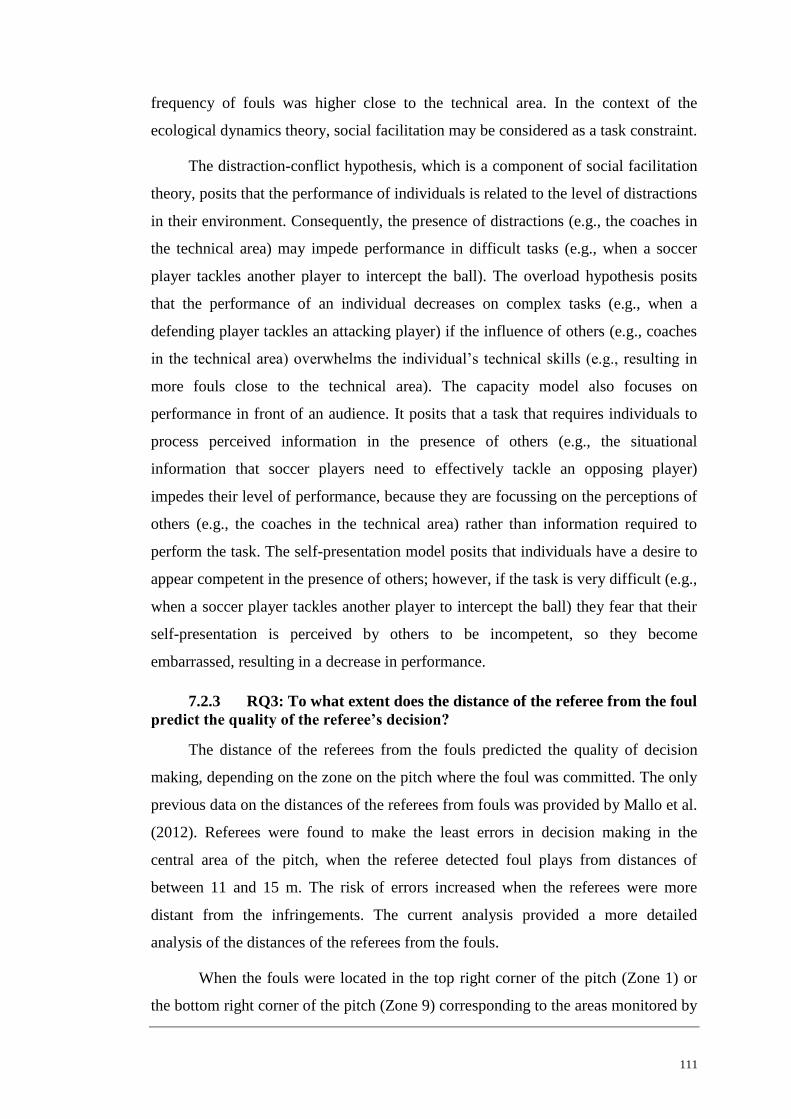
111
frequency of fouls was higher close to the technical area. In the context of the
ecological dynamics theory, social facilitation may be considered as a task constraint.
The distraction-conflict hypothesis, which is a component of social facilitation
theory, posits that the performance of individuals is related to the level of distractions
in their environment. Consequently, the presence of distractions (e.g., the coaches in
the technical area) may impede performance in difficult tasks (e.g., when a soccer
player tackles another player to intercept the ball). The overload hypothesis posits
that the performance of an individual decreases on complex tasks (e.g., when a
defending player tackles an attacking player) if the influence of others (e.g., coaches
in the technical area) overwhelms the individual’s technical skills (e.g., resulting in
more fouls close to the technical area). The capacity model also focuses on
performance in front of an audience. It posits that a task that requires individuals to
process perceived information in the presence of others (e.g., the situational
information that soccer players need to effectively tackle an opposing player)
impedes their level of performance, because they are focussing on the perceptions of
others (e.g., the coaches in the technical area) rather than information required to
perform the task. The self-presentation model posits that individuals have a desire to
appear competent in the presence of others; however, if the task is very difficult (e.g.,
when a soccer player tackles another player to intercept the ball) they fear that their
self-presentation is perceived by others to be incompetent, so they become
embarrassed, resulting in a decrease in performance.
7.2.3 RQ3: To what extent does the distance of the referee from the foul
predict the quality of the referee’s decision?
The distance of the referees from the fouls predicted the quality of decision
making, depending on the zone on the pitch where the foul was committed. The only
previous data on the distances of the referees from fouls was provided by Mallo et al.
(2012). Referees were found to make the least errors in decision making in the
central area of the pitch, when the referee detected foul plays from distances of
between 11 and 15 m. The risk of errors increased when the referees were more
distant from the infringements. The current analysis provided a more detailed
analysis of the distances of the referees from the fouls.
When the fouls were located in the top right corner of the pitch (Zone 1) or
the bottom right corner of the pitch (Zone 9) corresponding to the areas monitored by

112
the assistant referees, the referees’ distances from the fouls were the highest. When
the fouls were in other parts of the pitch, the distances of the referees from the fouls
were lower than in the corners. In both the first and second halves, on average, the
distance between the referee and the ball was > 20 m (mean = 21.58 m and 20.98 m
respectively, with a range of 18.6 to 23.7 m). The average distance of the referee
from each foul between 0 and 5 s before the foul was 16.63 m, and covered a very
wide range, from 0.00 to 47.40 m. The mean distance of the referee from the foul at 5
s before each foul was 22.0 m, with a very wide range of 3.00 to 60.0. The mean
distance of the referee from the ball at the time of each foul was 17.50 m, with a very
wide range of 2.00 to 48.00 m. The mean distance moved by the referee toward (-) or
away (+) from each foul between 0 and 5 s before the foul was - 4.49 m, with a very
wide range of -49.00 to 41.00 m.
In the central mid-field area (Zone 5) correct decisions were made when the
referees were closest to the foul (mean = 12.07 m, range = 1.60 to 3.90 m, 95% CI =
11.64, 12.50). In Zones 1 and 9 corresponding approximately to what Mallo et al.
(2012) called the lateral zones or the areas of influence of the assistant referees the
referees made correct decisions at much larger distances from the foul. In Zone 1
these distances were mean = 25.97, range = 7.70 to 42.00, 95% CI = 26.06, 26.87).
In Zone 9 these distances were similar (mean =24.97, range = 7.70 to 47.40, 95% CI
= 24.11, 25.73). In the other zones of the pitch, the referees made correct decisions at
distances from the fouls that were in between the two extremes of Zones 5 and Zones
1 and 9.
In Zone 5 the central mid-field area correct decisions were made when the
referees ran the longest distance toward the foul (Mean = -9.79 m, range = -46.00to
27.00 m, 95% CI = -10.87, -8.71). In Zones 1 and 9 the areas of influence of the
assistant referees the referees made correct decisions whilst moving away from the
foul. In Zone 1 these distances were Mean = 1.57 m, range = -21.00 to 27.00, 95%
CI = 0.28, 2.85. In Zone 9 the distances were similar (Mean = 0.76, range = -32.00 to
41.00, 95% CI = -0.45, 1.97). In the other zones of the pitch, the referees made
correct decisions when moving towards the fouls at distances that were in between
the extremes of Zone 1 and Zones 1 and 9.
These data stimulate two questions: (a) why, during the five seconds before
the fouls were called, did the referees tend to cover most ground towards the ball if it

113
was in the midfield? and (b) why, if the ball was in the corners, did the referees tend
to move away from the ball during that time? When the ball was in the midfield, is it
possible that the play had just moved quickly from one of the ends, and therefore the
referees had to move a long distance just to keep up with the play. Alternatively, if
the referees were already positioned in the midfield, they had to move toward the ball
to obtain a better view. When the ball was in the corners, it is possible that the
referees moved away from the ball, to get out of the way of the play. Alternatively,
the referees may have moved away from the corner because they were anticipating
that the play was soon going to move out of the corner.
Based on the above data it can be concluded that (a) there were no optimum
range of distances from the fouls across the whole pitch when the correct decisions
were made, because the distances of the referees from the fouls varied according to
the area on the pitch where the fouls were committed; and (b) there were no optimum
distances moved by the referees before the fouls when the correct decisions were
made, because the distances moved toward or away from the fouls depended upon
where the foul was committed.
PLS path analysis, however, provided evidence that was consistent with the
hypotheses, underpinned by the ecological dynamics theory, that ball tracking (i.e.,
the correlation between the X, Y coordinates of the ball and the referee, and the
distance of the referee from the foul) predicted the quality of the referee’s decision.
The strongest significant predictor of the correctness of the referee’s decision was the
distance of the referee from the foul (β = .501) indicated by a combination of the
average distance of the referee from the ball, and the average distance of the referee
from the foul. The correlations between the X, Y, coordinates of the ball and referee
was the second most strong predictor of the quality of the referee’s decisions (β =
.278).
A contradiction is apparent, because the PLS path analysis (which suggested
that ball tracking predicted the quality of the referee’s decision) provided
contradictory results to the univariate descriptive analysis (which suggested that
there were no optimum distances moved by the referees before the fouls when the
correct decisions were made). This contradiction needs to be explained. In order to
compute the path coefficient between ball tracking and the quality of the referee’s
decision, the PLS path analysis took multiple interacting variables into account (i.e.,

114
the ball position, the referee position, the distance of the referee from the ball, the
correlations between the referee position and the ball position, the viewing angles,
and the referee attributes). In contrast, the descriptive analysis only took one variable
into account as a predictor of the quality of the referees’ decisions (i.e., the distance
of the referee from the foul) without any interactions with other variables.
To help explain this contraction, the PLS path model was simplified, using
only the distance of the referee from the foul to predict the decision quality, as shown
in Figure 7.1. In this simplified model, the path coefficient (β = .170) was not
statistically significant, and the effect size (R2 = 2.9%) was negligible. The
implications are that, to determine the extent to which the distance of the referee
from the foul predicts the quality of the referee’s decision, it necessary to conduct a
multivariate analysis, taking multiple variables into account, reflecting the
complexity of reality, rather than a univariate analysis, taking into account only the
distance of the referee from the foul, reflecting a very simplified abstraction of
reality. Mallo et al. (2012) similarly suggested that multiple factors that constrain
referee positioning need to be considered in order to understand the relationship
between the ball tracking and decision making of soccer referees.
Figure 7.1. PLS path model of relationship between distance of referee from foul and decision quality
of referee (path coefficient and R2).
7.2.4 RQ4: To what extent does the viewing angle predict the quality of
the referee’s decision?
According to Mallo et al. (2012) the risk of making incorrect decisions was
reduced when the assistant referees viewed offside situations from a viewing angle
(between the assistant referee, the passing attacker, and the second last defender) of
between 46o and 60
o. The results of the current study did not confirm that conclusion.
Contour mapping in this study reflected progressive gradients in the viewing angles
to the fouls across the centre and mid-field areas of the pitch, and close to the penalty
areas, where most of the fouls were committed. The angles between Assistant
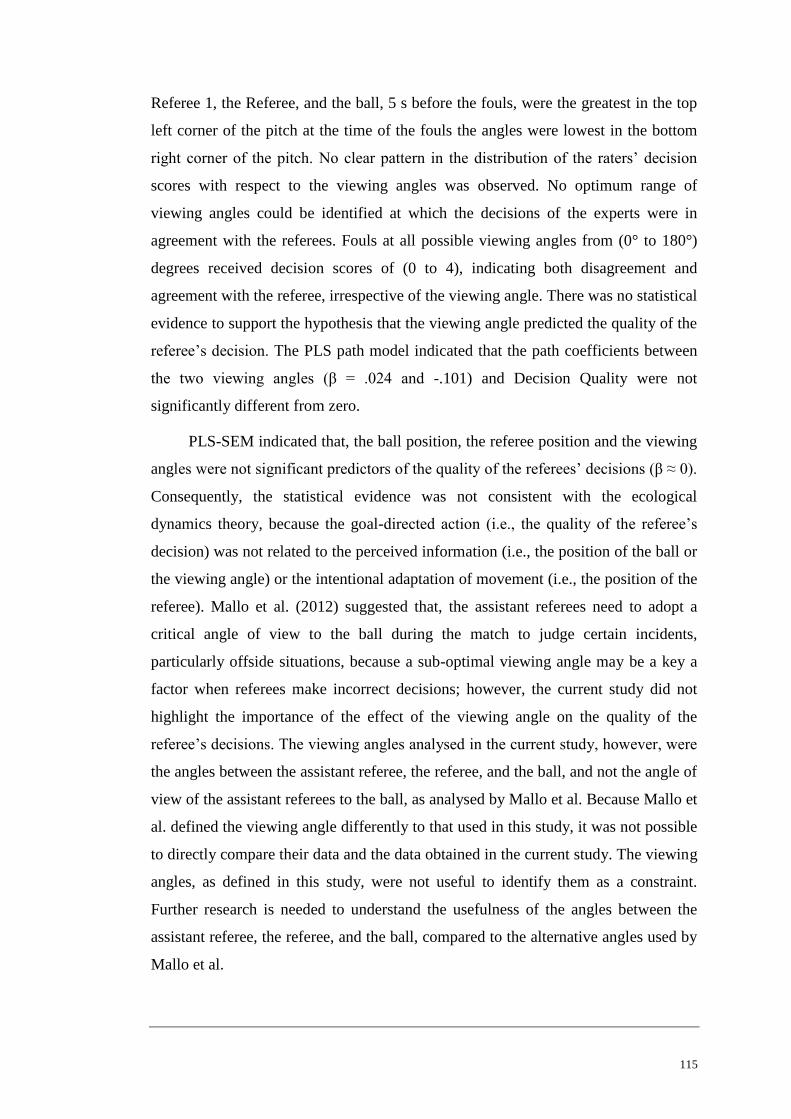
115
Referee 1, the Referee, and the ball, 5 s before the fouls, were the greatest in the top
left corner of the pitch at the time of the fouls the angles were lowest in the bottom
right corner of the pitch. No clear pattern in the distribution of the raters’ decision
scores with respect to the viewing angles was observed. No optimum range of
viewing angles could be identified at which the decisions of the experts were in
agreement with the referees. Fouls at all possible viewing angles from (0° to 180°)
degrees received decision scores of (0 to 4), indicating both disagreement and
agreement with the referee, irrespective of the viewing angle. There was no statistical
evidence to support the hypothesis that the viewing angle predicted the quality of the
referee’s decision. The PLS path model indicated that the path coefficients between
the two viewing angles (β = .024 and -.101) and Decision Quality were not
significantly different from zero.
PLS-SEM indicated that, the ball position, the referee position and the viewing
angles were not significant predictors of the quality of the referees’ decisions (β ≈ 0).
Consequently, the statistical evidence was not consistent with the ecological
dynamics theory, because the goal-directed action (i.e., the quality of the referee’s
decision) was not related to the perceived information (i.e., the position of the ball or
the viewing angle) or the intentional adaptation of movement (i.e., the position of the
referee). Mallo et al. (2012) suggested that, the assistant referees need to adopt a
critical angle of view to the ball during the match to judge certain incidents,
particularly offside situations, because a sub-optimal viewing angle may be a key a
factor when referees make incorrect decisions; however, the current study did not
highlight the importance of the effect of the viewing angle on the quality of the
referee’s decisions. The viewing angles analysed in the current study, however, were
the angles between the assistant referee, the referee, and the ball, and not the angle of
view of the assistant referees to the ball, as analysed by Mallo et al. Because Mallo et
al. defined the viewing angle differently to that used in this study, it was not possible
to directly compare their data and the data obtained in the current study. The viewing
angles, as defined in this study, were not useful to identify them as a constraint.
Further research is needed to understand the usefulness of the angles between the
assistant referee, the referee, and the ball, compared to the alternative angles used by
Mallo et al.
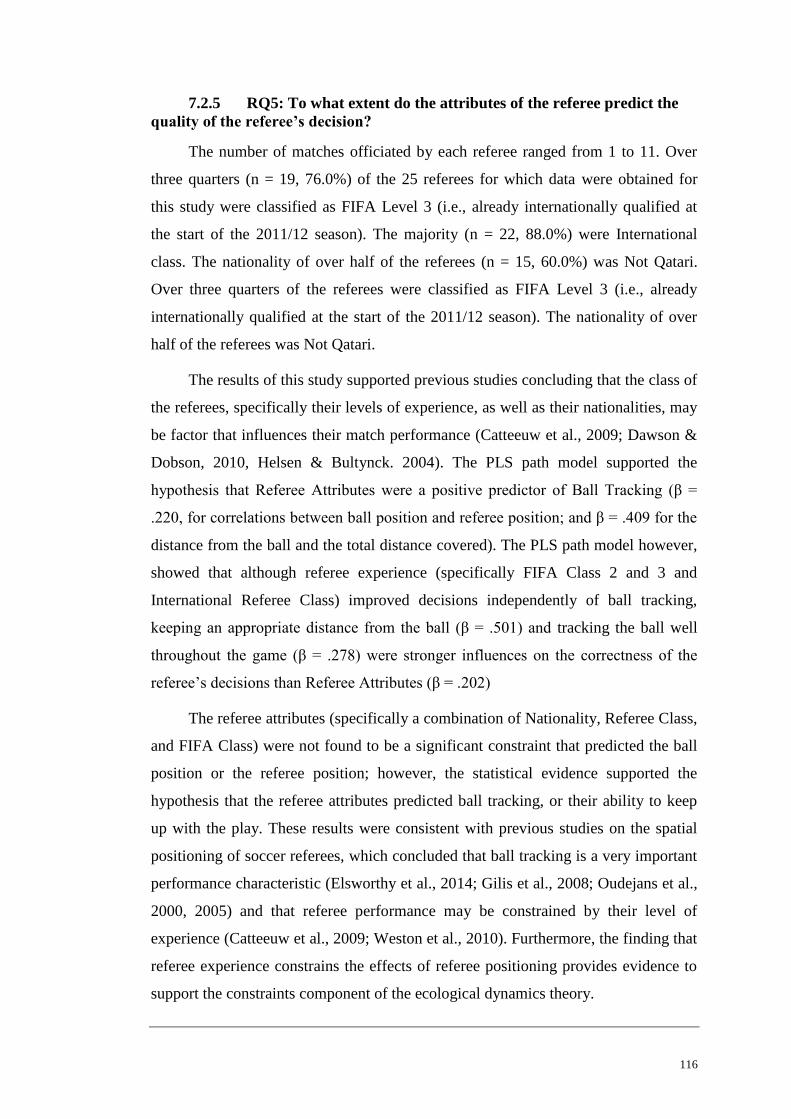
116
7.2.5 RQ5: To what extent do the attributes of the referee predict the
quality of the referee’s decision?
The number of matches officiated by each referee ranged from 1 to 11. Over
three quarters (n = 19, 76.0%) of the 25 referees for which data were obtained for
this study were classified as FIFA Level 3 (i.e., already internationally qualified at
the start of the 2011/12 season). The majority (n = 22, 88.0%) were International
class. The nationality of over half of the referees (n = 15, 60.0%) was Not Qatari.
Over three quarters of the referees were classified as FIFA Level 3 (i.e., already
internationally qualified at the start of the 2011/12 season). The nationality of over
half of the referees was Not Qatari.
The results of this study supported previous studies concluding that the class of
the referees, specifically their levels of experience, as well as their nationalities, may
be factor that influences their match performance (Catteeuw et al., 2009; Dawson &
Dobson, 2010, Helsen & Bultynck. 2004). The PLS path model supported the
hypothesis that Referee Attributes were a positive predictor of Ball Tracking (β =
.220, for correlations between ball position and referee position; and β = .409 for the
distance from the ball and the total distance covered). The PLS path model however,
showed that although referee experience (specifically FIFA Class 2 and 3 and
International Referee Class) improved decisions independently of ball tracking,
keeping an appropriate distance from the ball (β = .501) and tracking the ball well
throughout the game (β = .278) were stronger influences on the correctness of the
referee’s decisions than Referee Attributes (β = .202)
The referee attributes (specifically a combination of Nationality, Referee Class,
and FIFA Class) were not found to be a significant constraint that predicted the ball
position or the referee position; however, the statistical evidence supported the
hypothesis that the referee attributes predicted ball tracking, or their ability to keep
up with the play. These results were consistent with previous studies on the spatial
positioning of soccer referees, which concluded that ball tracking is a very important
performance characteristic (Elsworthy et al., 2014; Gilis et al., 2008; Oudejans et al.,
2000, 2005) and that referee performance may be constrained by their level of
experience (Catteeuw et al., 2009; Weston et al., 2010). Furthermore, the finding that
referee experience constrains the effects of referee positioning provides evidence to
support the constraints component of the ecological dynamics theory.
117
PLS-SEM indicated that most of the variance in the goal-directed action (R2 =
25.9%) reflecting ecological validity was constrained by the referee attributes (β =
.202); the distance of the referee from the ball (β = .501) and ball tracking (β = .278).
These results are consistent with the view that experience, based on knowledge of
past and present situations, is associated with all decisions that are made in tactical
sports (Lames & McGarry, 2007). The results of this study were not consistent,
however, with those of Elsworthy et al. (2014) who found that the distance of the
referee from play when a free kick was awarded did not affect the accuracy of the
referee’s decision.
The results of this study supported the cognitive theoretical approach which
implies that the expertise of professional athletes is a multifunctional process that
develops through a diversity of interacting processes and events, involving different
rates of maturation, training, and learning, as well as differences in their
developmental environments (Casanova et al., 2009; Elferink-Gemser & Visscher,
2011).
The results of this study support the ecologically dynamics theory by showing
the decision making of referees involves affordances. These include (a) an ability of
the referee to attune to changes in the performance environment (meaning the choice
of various possibilities for action, resulting in effective ball tracking and decision
making); as well as (b) the physical abilities and psychological status of the referee
(reflected by their experience) as well as (c) the situational characteristics of the
performance environment. Based on the results of this study, however, the ecological
dynamics framework needs to be expanded to explain how referees can improve their
expertise, by intentionally adapting their movements in time and space towards and
away from the play, to guide their decision-making.
7.3 CO-ORDINATION
The ecological dynamics theory helps to enhance understanding of the
performance of athletes by explaining the coordination between the game
participants in space and time during the emergence of different patterns of play
(Davids et al., 2015). For example, Bourbousson (2011) explored convergence (i.e.,
the coming together over time of the individual understanding of players in a team
game). Helsen and Bultynck (2004) reported that about 64% of all decisions in

118
soccer matches are based on inter-personal coordination between the referees and the
assistant referees. Limited information was provided in the current study, however,
to analyse the inter-personal coordination between soccer officials, primarily because
most of the interactions that occurred between the officials across time could not be
included in the analysis due to lack of data. The analysis of the performance of the
referees was based mainly on mean values, or latent variables operationalized by
compositing values collected over time and/or space. Mean values or composited
variables tend to mask the variability in the performance of individuals which takes
place over time and space (Dicks et al., 2010; Button et al., 2005).
The dynamic systems theory emphasizes that it is critical to observe
interactions between the participants in space and time during the emergence of
different patterns of play (Passos et al., 2008; 2012); however, few observations that
took place over time relating to the coordination of soccer officials were analysed in
this study. Only one observation was made regarding the frequencies of referee
errors in Zones 1 and 9 corresponding approximately to what Mallo et al. (2012)
called the lateral zones or the areas of influence of the assistant referees. Mallo et al.
(2012) reported that referee errors were significantly higher in the lateral areas of the
pitch (the areas of influence of the assistant referees) relative to the central areas, and
recommended that it is crucial to improve the coordination between soccer officials
in order to reduce the risk of making incorrect decisions. In this study, however, the
frequencies of referee’s errors were not significantly higher in the lateral zones.
Consequently, little evidence could be provided from the analysis of referee errors to
support the coordination component of the dynamic systems theory.
The approach used in this study to analyse the match data was insufficient to
build on the results of previous work on interpersonal coordination dynamics in team
games. Previous match analysis has revealed differences between referees and
assistant referees in their mobility (Helsen & Bultynck, 2004; Krustrup et al., 2002;
Mallo et al., 2012; Weston et al., 2011a). There is, however, a gap in the literature
that needs to be filled on the importance of co-positioning (e.g., how the referee
decides to move in relation to the assistant referees) and how co-positioning is
underpinned by ecological dynamics. Although assistant referees are restricted in
movement, and have specific duties (i.e. watching for offside) they appear to have
less room for manoeuvre than the referee, and they do not appear to have so much

119
choice in their positioning. Nevertheless, assistant referees are afforded many co-
positioning opportunities, if only in one plane of movement, along the sideline,
which could be explained in the context of ecological dynamics. Another affordance
of the referee is whether or not he/she should trust the decisions of assistant referees,
not only depending on their positions along the sideline at the time of a foul, but also
upon their level of expertise.
7.4 RECOMMENDATIONS
There is little previous information in the literature to show how the mobility
and movement patterns of referees are related to the quality of their decision-making.
Consequently, the main conclusion of this study, that referee ball tracking and level
of experience are significant positive predictors of the quality of the referees’
decision making has significant practical implications. The results imply that referees
need to improve their understanding of the need for better ball tracking, through
more training and experience. This implication confirms several other reports in the
literature that referee performance may potentially be improved by more training and
experience (Ardigò 2010; Bambaeichi et al., 2010; Bartha et al., 2009; Castagna et
al., 2002; 2007; 2011; Kizilet et al., 2010; Krustrup & Bangsbo, 2001; Krustrup et
al., 2002; Mascarenhas et al., 2009).
The recommendation that the acquisition and development of expertise on the
soccer pitch requires an advanced level of training and experience is not, however,
consistent with the findings of Araújo et al. (2010) who conducted an exploratory
qualitative review underpinned by Bronfenbrenner’s bioecological model to explain
how physical factors (e.g., quantity and quality of practice, facilities, types of
surfaces and balls) influences the development of expertise in soccer players. This
review was based on the experiential knowledge of top-class Brazilian soccer
players, focusing on unconventional practice environments. The review revealed that
Brazilian soccer players achieved experiential knowledge with little formal coaching,
and no facilities, or other forms of support. These findings contrast with other
perspectives, based on the ecological dynamics theory, that assume the need for
deliberate training and development programmes to achieve top class soccer skills. It
is not known whether or not some Brazilian soccer officials, like Brazilian soccer
players, may also achieve expertise with little formal, training, facilities, or other

120
forms of support. Currently, all Brazilian soccer referees are required to undergo
technical training (De Oliveira et al., 2011).
The main conclusion of this study, that referee ball tracking and level of
experience are significant positive predictors of the quality of the referees’ decision
making may be applied in practice to highlight the need develop training
programmes to improve the decision-making abilities of soccer officials.
Consequently, training programmes could focus on the specific movement patterns
of soccer officials to check their distance from the ball and their X, Y coordinates
relative to the ball at all times during a match.
Soccer coaches could potentially assist in the acquisition and development of
the decision-making abilities of soccer officials through promoting the use of high-
pressurised training-ground procedures, involving role-play among officials and
players. For example, competition-specific scenarios could be simulated on the
training ground, involving the deliberate infringement of rules by the players, as
directed by the coach. A post-mortem analysis of the quality of the decision-making
of the officials could subsequently be conducted with the coaches providing feedback
to the officials, to help them improve and gain confidence in their decision- making
abilities. Furthermore, sports psychology consultants could be involved in this
procedure, because they have an important role to play in enhancing the acquisition
and development of skills of high performance athletes (Davids et al., 2016).
The researcher also recommends the more widespread use of technology to
improve the quality of the decision making of soccer officials. Technology may help
to minimize the subjective errors associated with the many constraints and
affordances related to incorrect referee decision making. For example, the Hawk-Eye
technology, used effectively by officials in the Rugby World Cup in 2015, is
generally trusted as an objective second opinion. Hawk-Eye records videos from
multiple high performance synchronised cameras to improve the decision-making of
a television match official in coordination with the officials working on the field of
play. The video is then triangulated and combined to create a three-dimensional
representation of the trajectory of the ball. Furthermore, this technology can also be
applied by medical staff to assist with the safety of players, by replaying incidents,
and identifying the reasons for injury (Duggal, 2014). Hawk-Eye is currently used by
Premier League clubs in the UK (Guardian, April 11, 2003) and the Bundesliga in
121
Germany (Observer, 4 December, 2014) to help the officials decide whether the ball
has crossed the goal-line, and in general, soccer players, officials, and fans have
generally welcome. It is evident that FIFA should take action to ensure that difficult
or controversial referee’s decisions are also reviewed with the help of technology.
7.5 LIMITATIONS
The current research was limited to an analysis of variables extracted from 104
matches officiated by 25 referees in the Qatar Stars League in the 2011/2012 season.
The analysis was not based on a random sample of matches drawn from the
population of all matches officiated by FIFA. It is possible that the styles of
refereeing in Qatar are different to other countries. Consequently, the generalization
of the results of this study to other football leagues may be questioned. Because the
sample was not necessarily representative of matches in all soccer leagues, at all
times, it is possible that the conclusions may only apply only to the Qatar Stars
League in the 2011/2012 season.
A limitation of the statistical analysis of kinematic data was the possibility of
bias caused by averaging the data collected over fixed intervals of time (e.g., the
position of the ball, the position of the referee, and ball tracking, including the
distance of the referee from the ball). The theoretical framework that underpins
inferential statistical analysis assumes that the data are collected by independent
random sampling (Lohr, 1999). Random sampling means that each set of data must
be chosen entirely by chance, and that every set of data must have exactly the same
probability of being chosen, at every stage in the sampling process. An independent
sample means that each measurement in the sample must not be related to, be
dependent on, be correlated with, or have any type of bearing on any other
measurement in the sample.
7.6 FUTURE RESEARCH
The 14 factors in Table 7.1 are potentially associated with the quality of a
soccer referee’s decision-making, based on information in the literature review (see
Chapter 2).

122
Table 7-1
Factors Associated with the Quality of a Soccer Referee’s Decision Making
Subjective/Qualitative Factors Objective/Quantitative Factors
1. Professionalism of Referee 9. Fitness Testing/Training of Referee
2. Opinion of Referee 10. Position of Ball
3. Concentration of Referee 11. Position of Referee
4. Control of Referee 12. Viewing angles
5. Personality of Referee 13. Ball Tracking
6. Crowd factors 14. Attributes of Referee
7. Player reactions
8. Home team advantage
To this list could be added the game characteristics and scenario (e.g., the
type of play of each team, the level of play of each team, the direction of play, the
numbers of players involved in a foul, the frequency of infringements). This is not an
exclusive list. The literature review explained that a large number of other factors,
many of which are subjective, and cannot easily be measured, associated with the
contextual judgements and personal opinions of the referee, may be associated with
the quality of referees’ decision-making.
Table 7-1 divides the 14 factors into (a) subjective/qualitative factors and (b)
objective/quantitative. This study focused on the analysis of only five
objective/quantitative factors including Position of Ball, Position of Referee,
Viewing angles, Ball Tracking, and Attributes of Referee. This study only attempted
to explain the quality of a soccer referee’s decision-making in terms a small
proportion of the maximum possible number of factors. Because all possible
variables and measures were not used in this study to predict the quality of referee
decision-making, the effect size of the PLS path model (i.e., the proportion of the
variance explained in the quality decision scores by the seven variables) was
relatively small at 25.9%. According to Esposite Vinzi et al., (2010) R2 ≤ 4% is
negligible, 5% to 24% is small, 25% to 63% is moderate, and ≥ 64% is large.
Consequently, R2 = 25.9% represents only a moderate effect size in the context of
PLS path models. Nevertheless, there were other variables that could have better
explained the variance in the referee decision quality. In order to improve the effect
size even further, future research should focus on adding other variables to the
model, as listed in Table 7.1. Some of these factors are, however, very difficult to
measure, because they depend upon the subjectivity of referees that cannot be

123
observed or measured directly on the pitch (Lane et al., 2006). If these subjective
issues could be reported by the referee at the end of each match, then they could
possibly be incorporated into the model. Other factors which develop during a match
(e.g., crowd factors, player reactions, and home team advantage) are potentially
easier to measure (Balmer et al., 2007; Jones et al., 2002; Van Quaquebeke &
Giessner, 2010; Lex et al., 2014; Nevill et al. 1996; Lovell et al. 2014).
Another recommendation for future research is that, because the conclusions
of this study apply only to the Qatar Stars League in the 2011/2012 season, more
studies needs to focus on different populations. Future research needs to look at more
than one season and also across different leagues to enhance the external validity of
the findings. Further research on the quality of referee decision making should also
be conducted with respect to different professional soccer leagues, such as those in
Europe (e.g., England, France, Germany., Italy, and Spain) in order to complement
and expand the findings of the current research.
Finally, the researcher suggests that PLS-SEM may have an important role to
play in future research on the performance analysis of soccer referees, because unlike
alternative modelling methods, PLS-SEM is able to operate with a large number of
latent variables, based on multiple indicators, and it has both an explanatory and a
predictive function (Hair et al., 2014). PLS-SEM is a non-parametric method that is
insensitive to the measurement and distributional characteristics of the multivariate
data that can be collected at soccer matches. The researcher proposes a path model in
Figure 7.2 to illustrate how PLS-SEM might be applied to predict the quality of
referee decision-making, incorporating the findings of this study, including
information from the literature view, underpinned by some of the perspectives of the
ecological dynamics theory.
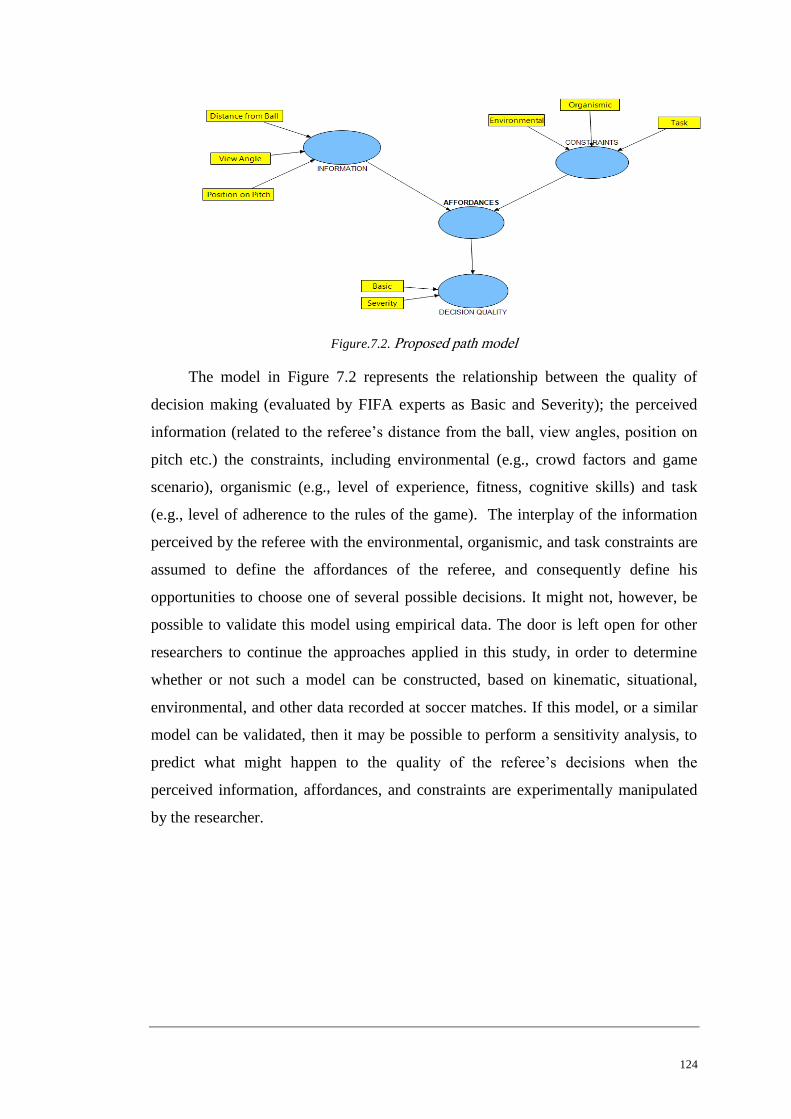
124
Figure.7.2. leppp rop deoporP
The model in Figure 7.2 represents the relationship between the quality of
decision making (evaluated by FIFA experts as Basic and Severity); the perceived
information (related to the referee’s distance from the ball, view angles, position on
pitch etc.) the constraints, including environmental (e.g., crowd factors and game
scenario), organismic (e.g., level of experience, fitness, cognitive skills) and task
(e.g., level of adherence to the rules of the game). The interplay of the information
perceived by the referee with the environmental, organismic, and task constraints are
assumed to define the affordances of the referee, and consequently define his
opportunities to choose one of several possible decisions. It might not, however, be
possible to validate this model using empirical data. The door is left open for other
researchers to continue the approaches applied in this study, in order to determine
whether or not such a model can be constructed, based on kinematic, situational,
environmental, and other data recorded at soccer matches. If this model, or a similar
model can be validated, then it may be possible to perform a sensitivity analysis, to
predict what might happen to the quality of the referee’s decisions when the
perceived information, affordances, and constraints are experimentally manipulated
by the researcher.

125
Bibliography
Afonso, J. A., Garganta, J., & Mesquita, I. (2012). Decision making in sports: the
role of attention, anticipation, and memory. Brazilian Journal of
Kinanthropometry and Human Performance. DOI:
http://dx.doi.org/10.5007/1980-0037.2012v14n5p592
Andersen, T. E., Engebretsen, L., & Bahr, R. (2004). Rule violations as a cause of
injuries in male Norwegian professional football: Are the referees doing their
job? American Journal of SportsMedicine, 32, 62–68.
Araújo D., Davids K., & Hristovski R. (2006). The ecological dynamics of decision
making in sport. Psychology of Sport and Exercise, 7, 653-676.
Araújo, D., Davids. B., & Passos, R. (2007). Ecological validity, representative
design, and correspondence between experimental task constraints and
behavioral setting: comment on Rogers, Kadar, and Costall (2005). Ecological
Psychology, 19, 69-78.
Araújo, D., Fonseca, C., Davids, K., Garganta, J., Volossovitch, R. G., & Krebs, R.
(2012). The role of ecological constraints on expertise development. Talent
Development & Excellence, 2, 165–179.
Ardigò, L.P. (2010). Low-cost match analysis of Italian sixth and seventh division
soccer refereeing. Journal of Strength and Condition Research, 2532-2538.
Asami, T., Togari, H., & Ohashi, J. (1988). Analysis of movement patterns of
referees during football matches. In: Science and Football (Eds. T. Reilly, A.
Lees, K. Davids, & W.J.Murphy). pp. 341-345. London: E. and F.N. Spon.
Austin, E. J. (2004). An investigation of the relationship between trait emotional
intelligence and emotional task performance. Personality and Individual
Differences, 36, 1855-1864.
Bambaeichi, E., Movahedi, A.R., & Abedini, M. (2010). The relationship between
cardiovascular risk factors and trait anxiety of Iranian referees and assistant
referees in Premier League Soccer. British Journal of Sports Medicine, 4, i22,
doi:10.1136/bjsm.2010.078725.71

126
Baláková,V., Boschek, P., & Skalíková, L. (2015). Selected cognitive abilities in
elite youth soccer players. Journal of Human Kinetics, 49, 267–276.
Balmer, N. J., Nevill, A. M., Lane, M., Ward, P., Williams, A. M., & Fairclough, S.
H. (2007). Influence of crowd noise on soccer refereeing consistency in soccer,
Journal of Sport Behaviour, 30, 130-145.
Bartha, C, Petridis, L, Hamar, P, Puhl, S, and Castagna, C. Fitness test results of
Hungarian and international-level soccer referees and assistants. Journal of
Strength and Condition Research 23, 121-126.
Bourbousson, J., Poizat, G., Saury, J., & Sève, C (2011). Temporal aspects of team
cognition: a case study on concerns sharing within basketball Journal of Applied
Sport Psychology, 24, 224-241.
Boyko, R. H., Boyko, A. R. & Boyko, M. G. (2007). Referee bias contributes to
home advantage in English Premiership football. Journal of Sports Sciences 25,
1185-1194.
Button, C., Smith, J., & Pepping, G. J. (2005). The influential role of task constraints
in acquiring football skills. In:. Reilly, T., Cabri, J. & Araújo, D. (eds.). Science
and Football London: Routledge, Taylor and Francis group.
Byers, T. (2016). Contemporary issues in sport management: a critical introduction.
Thousand Oaks, CA: Sage.
Casajus, J.A, & Castagna, C. (2007). Aerobic fitness and field test performance in elite
Spanish soccer referees of different ages. Journal of Science and Medicine in
Sport 10, 382-389.
Casanova, F., Oliveira, J., Williams, M., & Julio, G. (2009). Expertise and
perceptual-cognitive performance in soccer: A review Revista Portuesa de
Ciencas do Desporto. Retrieved from:
http://www.oalib.com/paper/1061747#.WBbf3M__pdI
Castagna, C. F. M., Abt, G., & D’Ottavio, S. (2007). Physiological aspects of soccer
refereeing performance and training. Sports Medicine, 37, 625-646. Journal of
Strength & Conditioning Research, 16, 165-172.
127
Castagna, C., Impellizzeri, F. M., Rampinini, E., D’Ottavio, S., & Manzi, V. (2008).
The Yo–Yo intermittent recovery test in basketball players. Journal of Science
and Medicine in Sport, 11, 202-208.
Castagna, C., Impellizzeri, F. M., Bizzini, M., Weston, M. & Manzi, V. (2011).
Applicability of a change of direction ability field test in soccer assistant
referees. The Journal of Strength & Conditioning Research, 25, 860-869.
Catteeuw, P., Helsen, W., Gilis, B., &Wagemans, J. (2009). Decision-making skills,
role specificity, and deliberate practice in association football refereeing.
Journal of Sports Sciences, 27, 1125-1136.
Catteeuw, P., Gilis, B., Wagemans, J., & Helsens, W. (2010). Offside decision
making of assistant referees in the English Premier League: Impact of physical
and perceptual cognitive factors on match performance. Journal of Sport
Sciences, 28, 471-481.
Catterall, C., Reilly, T., Atkinson, G. & Coldwells, A. (1993). Analysis of the work
rates and heart rates of association football referees. British Journal of Sports
Medicine 27, 193-201.
Cerqueira, M.S., da Silva, A.I., & Marins, J.C.B. (2011). Analysis of the FIFA’s
model of physical evaluation applied to the soccer referees. Brasiliera Medicina
de Esporte ,17, 421-426.
Chamorro-Premuzic, T. & Reichenbacher, L. (2008). Effects of personality and
threat of evaluation on divergent and convergent thinking. Journal of Research
in Personality, 42, 1095-1101.
Chemero, A. (2011) Radical embodied cognitive science. Chapter 7. Affordances.
Cambridge, MA: MIT Press.
Chow, J.Y. (2013). Nonlinear learning underpinning pedagogy: evidence, challenges,
and implications. Quest, 65, 469–484.
Couceiro, M. S., Dias, G., Araújo, D., & Davids, K. (2016). The ARCANE
Project: How an ecological dynamics framework can enhance performance
assessment and prediction in football. Sports Medicine.
doi:10.1007/s40279-016-0549-2

128
Coulter, T. J., Mallett, C. J., & Gucciardi, D. F. (2010). Understanding mental
toughness in Australian soccer: Perceptions of players, parents, and coaches.
Journal of Sports Sciences, 28, 699-716.
Craig, C., & Watson, G. ( 2011). An affordance based approach to decision making
in sport: discussing a novel methodological framework. Revista de Psicología
del Deporte, 20, 689-708.
Creswell, J. W.(2014). Research design: qualitative, quantitative, and mixed methods
(4th ed.). Thousand Oaks, CA: Sage.
Davids, K. (2008). Designing representative task constraints for studying visual
anticipation in fast ball sports: What we can learn from past and contemporary
insights in neurobiology and psychology. Internal Journal of Sport Psychology,
39, 166-177.
Davids, K., Araújo, D., Hristoviski, R., Passos, P., & Chow, J. Y. (2012). Ecological
dynamics and motor learning in sport. In: N.J. Williams & A.M. Williams (Eds.)
Skill acquisition in sport. Research Practice (2nd
ed). pp. 112-130. London:
Routledge.
Davids, K., Araújo, D., & Shuttleworth, R. (2005). Applications of Dynamical
Systems Theory to Football. Science and Football V. Routledge.
Davids, K., Araújo, D., Seifert, L., & Orth, D. (2015). Expert performance in sport.
An ecological dynamics perspective. In: J. Baker & D. Farrow (Eds.) Routledge
Handbook of Sport Expertise. New York, NY: Routledge.
Davids, K., Araújo, D., Vilar, L., Renshaw, I., & Pinder, R. (2013). An ecological
dynamics approach to skill acquisition: implications for development of talent in
sport. Talent Development and Excellence, 5, 21-34.
Davids, K. & Bennett, S. (2008). Designing representative task constraints for
studying visual anticipation in fast ball sports: what we can learn from past and
contemporary insights in neurobiology and psychology. International Journal of
Sport Psychology, 39, 166-177.

129
Davids, K., Renshaw, I., Pinder, R., Greenwood, D., & Baris, S. (2016). The role of
psychology in enhancing skill acquisition in high performance programmes. In:
Cotterill, S., Westion, N., & Breslin, G. (Eds.) Sport and Exercise Psychology:
Practitioner Case Studies. Chapter 14. pp. 241-260. Chichester, UK: John Wiley
& Son.
Dawson, P. & Dobson, S. (2010). The influence of social pressure and nationality on
individual decisions: Evidence from the behaviour of referees. Journal of
Economic Psychology, 31, 181-191.
Dawson, P., Dobson, S., Goddard, J. & Wilson, J. (2007). Are football referees really
biased and inconsistent? Evidence from the English Premier League. Journal of
the Royal Statistical Society, Series A, 170, 231-250.
De Oliveira, M. C., Orbetelli, R., & De Barros Neto, T. L. (2011). Call accuracy and
distance from the play: A study with Brazilian soccer referees. International
Journal of Exercise Science, 41, 30-38.
Dicks, M., Button, C., & Davids, K. W. (2010). Examination of gaze behaviors under
in situ and video simulation task constraints reveals differences in information
pickup for perception and action. Attention, Perception, & Psychophysics, 72,
706-720.
Di Salvo, V., Collins, A., McNeill, B., & Cardinale, M. (2006). Validation of
Prozone ®: A new video-based performance analysis system. International
Journal of Performance Analysis in Sport, 6, 108-119.
Di Salvo, V., Gregson, W., Atkinson, G., Tordoff, P., & Drust, B.(2009). Analysis of
high intensity activity in Premier League soccer. International Journal of Sports
Medicine, 30, 205-212.
Duarte, R., Araújo, D., Gazimba1, V., Fernandes. O., Folgado H., Marmeleira, J., &
Davids, K. (2010). The ecological dynamics of 1v1 sub-phases in association
football. The Open Sports Sciences Journal, 3, 16-18.
Dugall, M. (2014). Hawk-Eye technology. Journal of Global Research, Computer
Science, and Technology, Vol-I, Issue-II, July 2014. Available at:
http://oaji.net/articles/2014/1407-1415422826.pdf
130
Dunning, E. (1999). The development of soccer as a world game. Sport matters:
Sociological studies of sport, violence and civilisation. London: Routledge.
Elferink-Gemser, M. T., & Visscher. C. (2011). Who are the superstars of
tomorrow? In: Talent identification and development in Sport, International
Perspectives (Eds. Baker, J. Cobley S. & Schorer, J). New York, NY:
Routledge.
Elsworthy, N., Burke, D., & Dascombe, B. J. (2014). Factors relating to the decision-
making performance of Australian football officials. International Journal of
Performance Analysis in Sport, 14, 401-410.
Esposito Vinzi, V., Trinchera, L., & Amato, S. (2010). Handbook of partial least
squares. Springer Handbooks of Computational Statistics. Berlin Heidelberg:
Springer-Verlag.
Fajen, R. J., Riley, M. A., & Turvey, M. T. (2008). Information, affordances, and
control of action in sport. International Journal of Sports Psychology, 40, 79-
107.
FIFA (1982). FIFA Handbook: 1981-1982. Zurich, Switzerland, Fédération
Internationale de Football Association.
FIFA (2012). FIFA Handbook: 2011-2012. Zurich, Switzerland, Fédération
Internationale de Football Association.
Fleiss, J. L., & Cohen, J. (1973). The equivalence of weighted kappa and the
intraclass coefficient as measures of reliability. Educational and Psychological
Measurement, 33, 613-619.
Folkesson, P., Nyberg, C., Archer, T., & Norlander, T. (2002). Soccer referees’
experience of threat and aggression: effects of age, experience, and life
orientation of outcome of coping strategy. Aggressive Behavior, 28, 317-327.
Freeberg, T. M., & Lucas, J. R., (2009). Pseudoreplication is (still) a problem.
Journal of Comparative Psychology, 123, 450-451.

131
Friman, M., Nyberg, C., & Norlander, T. (2004). Threats and aggression directed at
soccer referees: An empirical phenomenological psychological study. The
Qualitative Report, 9(4), 652-672.
Fruchart, E., & Carton, A. (2012). How do amateur soccer referees destabilize a
match? Psicologica, 33, 435-449.
Fuller, C. W., Junge, A., & Dvorak, J. (2004). An assessment of football referees’
decisions in incidents leading to player injuries. American Journal of Sports
Medicine, 32, 17–22.
Gay, B.V, & Weaver, S. (2011). Theory building and paradigms: A primer on the
nuances of theory construction. American International Journal of
Contemporary Research, 1, 34-42.
Garicano, L., I. Palacios-Huerta, & Prendergast, C. (2005). Favoritism under social
pressure. Review of Economics and Statistics 87, 208-216.
Gibson, J. J. (1977). The Theory of Affordances. In: Perceiving, acting, and
knowing: toward an ecological physiology (Ed. R. Shaw & J. Bransford).
Hillsdale, NJ: Lawrence Erlbaum.
Gilis, B., Helsen,W., Catteeuw, P., & Wagemans, J. (2008). Offside decisions by
expert assistant referees in association football: Perception and recall of spatial
positions in complex dynamic events. Journal of Experimental Psychology:
Applied, 14, 21–35.
Gordon, J. (2014). What is optimal positioning of the referee, assistant referees and
the newly-created additional assistant referees? Retrieved from:
https://www.quora.com/What-is-optimal-positioning-of-the-Referee-Assistant-
Referees-and-the-newly-created-Additional-Assistant-Referees
Greeno, J. (1994). Gibson’s affordances. Psychological Review 101, 336-342.
Greenwald, A. G. (2012). There is nothing so theoretical as a good method.
Perspectives on Psychological Science, 7, 99–108.
132
Gregson, W., Drust, B., Atkinson, G., & Di Salvo, V. (2009). Match-to-match
variability of high-speed activities in premier league soccer. International
Journal of Sports Medicine, 31, 237-242.
Guardian (11 April, 2013). Premier League clubs choose Hawk-Eye to provide new
goal-line technology. Available at:
http://www.theguardian.com/football/2013/apr/11/premier-league-hawkeye-
goalline-technology
Hair, J., Anderson, R. E., Babin, B. J., Tatman, R. L., & Black, W. C. (2010).
Multivariatedata analysis. Upper Saddle River, NJ: Prentice Hall.
Hair, J. F., Hult, G. T. M., Ringle, C. M., & Sarstedt, M. (2014). A primer on partial
least squares structural equation modeling (PLS-SEM). Thousand Oaks, CA:
Sage.
Hair, J. F., Ringle, C. M., & Sarstedt, M. (2012). PLS-SEM: Indeed a silver bullet.
Journal of Marketing Theory and Practice, 19, 139-151.
Halsey, L. G., Curran-Everett, D., Vowler, S. L., & Drummon G. B. (2015). The
fickle p value generates irreproducible results. Nature Methods, 12, 179-185.
Harley, R., Tozer K. & Doust J. (2002). An analysis of movement patterns and
physiological strain in relation to optimal positioning of association football
referees, London, UK, Routledge.
Headrick, J., Davids, K., Renshaw, I., Araújo, D., Passos, P., & Fernandes, O.
(2011). Proximity to goal as a constraint on patterns of behaviour in attacker-
defender dyads in team games. Journal of Sports Sciences, 2011, iFirst article,
1-7, DOI:10.1080/02640414.2011.640706
Helsen, W., & Bultynck, J. B. (2004). Physical and perceptual cognitive demands of
top-class refereeing in association football. Journal of Sports Sciences, 22, 179-
189.

133
Helsen, W., Gilis, B., & Weston, M. (2006). Errors in judging “offside” in football:
Test of the optical error versus the perceptual flash-lag hypothesis. Journal of
Sport Sciences, 24, 521-528.
Helsen, W.F., & Starkes J, L. (1999). A multidimensional approach to skilled
perception and performance in sport. Applied Cognitive Psychology, 13, 1–27.
Hooper, B. (2015). Referee pulls a gun during dispute at soccer game in Brazil.
Retrieved from: http://www.upi.com/Odd_News/2015/09/30/Referee-pulls-a-
gun-during-dispute-at-soccer-game-in-Brazil/9261443627110/
Hubbard, R., & Lindsay, R. M. (2008). Why p values are not a useful measure of
evidence in statistical significance testing. Theory & Psychology, 18, 69-88.
Hughes, M., & Franks, I. (2015). Essentials of performance analysis in sport.
Abingdon,UK:Routledge.
Hurlbert S. H. (1984). Pseudo-replication and the design of ecological field
experiments. Ecological Monographs, 54, 187-211.
Ioannidis J. P. A. (2005). Why most published research findings are false. PLoS
Med, 2(8). Retrieved from http://www.plosmedicine.org/article/
info%3Adoi%2F10.1371%2Fjournal.pmed.0020124
Jones, K. S. (2010). What is an affordance? Ecological Psychology 15,107-114.
Published online: 08 Jun 2010. DOI: 10.1207/S15326969ECO1502_1
Jones, M. V., Paull, G. V., & Erskine, J. (2002). The impact of team’s aggressive
reputation on the decisions of association football referees. Journal of Sport
Sciences, 20, 991-1000.
Kim, S., & Lemeshow, S. (2001). Difficulties of using kappa statistics in
epidemiologic studies. The 129th
Annual Meeting of APHAOctober 24, 2001.
Abstract#26701.Retrievedfrom:http://apha.confex.com/apha/129am/techprogra
m/paper_26701.htm
Kizilet, A. (2011). Using distance physical education in elite class soccer referee
training: A case study. Turkish Online Journal of Educational Technology, 10,
328-339.
134
Kline (2004). Beyond significance testing: reforming data analysis methods in
behavioral research. Washington DC: American Psychological Association.
Kotrlik, J. W., & Williams, H. A. (2003). The incorporation of effect size in
information technology, learning, and performance research. Information
Technology, Learning, and Performance Research Journal, 21, 1-7.
Krustrup, P. & Bangsbo, J. (2001). Physiological demands of top-class soccer
refereeing in relation to physical capacity: effect of intense intermittent exercise
training. Journal of Sports Sciences, 19, 881-891.
Krustrup, P., Mohr, M., & Bangsbo, J. (2002). Activity profile and physiological
demands of top-class soccer assistant refereeing in relation to training status.
Journal of Sports Sciences, 20, 861-871.
Kuhn, T.S. (2012). The structure of scientific revolutions. 50th
Anniversary Edition.
Chicago: University of Chicago.
Lames, M., & McGarry, T. (2007). On the search for reliable performance indicators
in game sports. International Journal of Performance Analysis in Sport, 7, 62-
79.
Lane, A. M., Neville, A. M., Ahmad, N. S., & Balmer, N. (2006). Soccer referee
decision making: “Shall I blow the whistle”. Journal of Sports Science and
Medicine, 5, 243-253.
Lee, T., Fitch, N., Castle, P., Watkins, S., Aldous, J., Sculthorpe, N., Midgely, A.,
Brewer, J., & Alexis, M. (2014). Exposure to hot and cold environmental
conditions does not affect the decision making ability of soccer referees
following an intermittent sprint protocol. Frontiers in Physiology, 5, 1-9.
Lex, H., Pizzera, A., Kurtes, M., & Schack, T. (2014). Influence of player’s
vocalizations on soccer referee decisions. European Journal of Sport Science
doi:10.1080/17461391.2014.962620.
Lindsay, R. M. (1995). Reconsidering the status of tests of significance: an
alternative criterion of adequacy. Accounting, Organizations, and Society, 20,
35-53.

135
Lohr, S. L. (1999). Sampling: design and analysis. Pacific Grove, CA: Duxbury.
Lovell, G. P., Newell, R., & Parker, J. K. (2014). Referees’ decision making
behavior and the sport home advantage phenomenon. Research in Psychology
and Behavioral Sciences, 2, 1-5.
Mallo, J., Frutos, P. G., Juarez, D., & Navarro E., (2012). Effect of positioning on the
accuracy of decision making of association football top-class referees and
assistant referees during competitive matches. Journal of Sports Sciences, 30,
1437-1445.
Mallo, J., Navarro, E.,Garcia-Aranda, J. M., Gilis, B., & Helsen, W. (2007). Activity
profile of top-class association football referees in relation to performance in
selected physical tests. Journal of Sports Sciences, 25, 805-813.
Mallo, J., Navarro, E., Garcia-Aranda, J. M., & Helsen, W. (2009a). Activity profile
of top-class association football referees in relation to fitness-test performance
and match standard. Journal of Sports Sciences, 27, 9-17.
Mallo, J., Navarro, E., García-Aranda, J. M., & Helsen W. (2009b). Physical
demands of top-class soccer assistant refereeing during high-standard matches.
International Journal of Sports Medicine 30, 331-336.
Maruenda, F. (2004) Can the human eye detect an offside position during a football
match? British Medical Journal 329, 1470-1472.
Mascarenhas, D. R. D., Button, C., O’Hara, C., & Dicks, M. (2009). Physical
performance and decision making in association football referees: A naturalistic
study. Open Sports Sciences, 2, 1-9.
Mascarenhas, D. R. D., & Smith, N. C. (2012). Developing the performance brain:
Decision making under pressure. In: D. Collins, H. Richards, & C. Button,
Performance Psychology — Developing a Peak Performance Culture. Elsevier,
pp. 245-267.

136
Mason, C., & Lovell, G. (2000). Attitudes, expectations and demands of English
Premier League Soccer Association referees, Journal of Football Studies, 3, 88-
102.
McGraw, K.O., & Wong, S.P. (1996). Forming inferences about some intraclass
correlation coefficients. Psychological Methods, 1, 30-46.
McHugh, M. L. (2012). Interrater reliability: the kappa statistic. Biochemical
Medica, 22, 276-282.
McMorris, T. (2014). Acquisition and performance of sports skills (2nd
ed). Oxford,
UK: Wiley Blackwell.
Mellick, M. C., Fleming, S., Bull, P., & Laugharne, E. J. (2005). Identifying best
practice for referee decision communication in association and rugby union
football. Football Studies, 8, 42-57.
Merriam, S. (2014). Qualitative research: A guide to design and implementation. San
Francisco, CA: Jossey-Bass.
Moreno, B. (2015). Referees involved in corruption. Retrieved
from:http://sites.duke.edu/wcwp/tournament-guides/world-cup-2014/world-cup-
referees/world-cup-referee-blunders/referee-conspiracies/#moreno
Murray, S. (2014). World Cup: 25 stunning moments … No9: Diego Maradona's
Hand of God. The Guardian, 8 April 2014.
Nevill, A., Balmer, N. & Williams, M. (1999). Crowd influence on decisions in
association football. The Lancet, 353, 1416.
Nevill, A. M., Balmer, N. J. & Williams, A. M. (2002). The influence of crowd noise
and experience upon refereeing decisions in football. Psychology of Sport and
Exercise,3, 261-272.
Nevill, A. M. & Holder, R. L. (1999). Home advantage in sport. An overview of
studies on the advantage of playing at home. Sports Medicine, 28, 221-236.

137
Nevill, A. M., Holder, R. L., Bardsley, A., Calvert. H. & Jones, S. (1997).
Identifying home advantage in international tennis and golf tournaments.
Journal of Sports Sciences, 15, 437-443.
Nevill, A. M., Newell S. & Gale, S. (1996). Factors associated with home advantage
in English and Scottish Soccer. Journal of Sports Science, 14, 181-186.
Nicolich, M. J., & Weinstein, C. S. (1981). The use of time series and t-tests with
serially correlated data. Journal of Experimental Education, 50, 25-29.
Nuzzo, R. (2014). Scientific method: statistical errors. P values, the 'gold standard' of
statistical validity, are not as reliable as many scientists assume. Nature, 506,
150-152.
Observer (4 December, 2014). Bundesliga approves Hawk-Eye goal-line technology
for new seaso. Availab at: http://www.carlyleobserver.com/sports/bundesliga-
approves-hawk-eye-goal-line-technology-for-new-season-
1.1650074#sthash.ZgDcHTp1.dpuf
Orth, D., Davids, K., Araújo, D ., Renshaw, I., & Passos, P. (2014). Effects of a
defender on run-up velocity and ball speed when crossing a football. European
Journal of Sport Science, 14, 316-323.
Oswald, M. E., & Stefan, G. (2004). Confirmation bias. In R.F., Pohl. (Ed.).
Cognitive illusions: a handbook on fallacies and biases in thinking, judgement
and memory (pp. 79-96). Hove, UK: Psychology Press.
Oudejans, R. R. D., Verheijen, R., Bakker, F. C., Gerrits, J. C., Steinbruckner, M., &
Beek, P. J. (2000). Errors in judging ‘offside’ in football. Nature, 404, 33.
Oudejans, R. R. D., Bakker, F. C., Verheijen, R., Gerrits, J. C., Steinbruckner, M., &
Beek, P. J. (2005). How position and motion of expert assistant referees in
soccer relate to the quality of their offside judgements during actual match play.
International Journal of Sport Psychology, 36, 3–21.
Page, K., & Page, L. (2010). Alone against the crowd: individual differences in
referee’s ability to cope under pressure. Journal of Economic Psychology, 31,
192-199.

138
Passos, P., Davids, K., Araújo, D., Paz, N., Minguéns, J., & Mendes, J. (2011).
Networks as a novel tool for studying team ball sports as complex social
systems. Journal of Science and Medicine in Sport, 14, 170-176.
Passos, P., Milho, J., Fonseca, S., Borges, J., Araújo, D., & Davids, K. (2008).
Interpersonal distance regulates functional grouping tendencies of agents in
team sports. Journal of Motor Behavior, 43, 155-163.
Plessner, H., & Betsch, T. (2001). Sequential effects in important referee decisions:
The case of penalties in soccer. Journal of Sport & Exercise Psychology, 23,
254–259.
Randers, M. B., Mujika, I., Hewitt, A., Santisteban, J., Bischoff, R., Solano, R.,
Zubillaga, A., Peltola, E., Krustrup, P., & Mohr, M. (2010). Application of four
different football match analysis systems: A comparative study. Journal of
Sports Sciences, 28, 171-82.
Renshaw, I., Chow, J. Y., Davids, K.W. & Hammond, J. (2010) A constraints-led
perspective to understanding skill acquisition and game play: A basis for
integration of motor learning theory and physical education praxis? Physical
Education & Sport Pedagogy, 15, 117-137.
Roca, A., Ford, P.R., McRobert, A.P., & Williams, A.M. (2013) Perceptual-cognitive
skills and their interaction as a function of task constraints in soccer. Journal of
Sports Exercise Psychology, 35, 144–155.
Rontoyannis G. P., Stalikas, A., Sarro, G., & Vlastaris A. (1998) Medical,
morphological and functional aspects of Greek football referees. Journal of
Sports Medicine and Physical Fitness, 38, 208-214.
Roy, S., Tarafdar, M., Ragu-Nathan, T. S, & Marsillac, E. (2012). The effect of
misspecification of reflective and formative constructs in operations and
manufacturing management research. Electronic Journal of Business Research
Methods, 10, 34-52.
Sanabria, J., Cenjor, C., Márquez, F., Gutierrez, R., Martinez, D. & Prados-Garcia, J.
L. (1998). Oculomotor movements and football’s law 11. The Lancet, 351, 268.

139
Sayfollahpour, P., Ganjoee, F. A., & Nikbahsh, R. (2013). The relationship between
personality and performance of football referees. International Journal of
Academic Research in Business and Social Sciences, 3, 1-6.
Schweizer, G., Plessner, H., Kahlert, D., & Brand, R. (2011). A video-based training
method for improving soccer referees’ intuitive decision making skills. Journal
of Applied Sport Psychology, 23, 429-442.
Sim, J., & Wright, C. C. (2005). The kappa statistic in reliability studies: use,
interpretation, and sample size requirements. Physical Therapy, 85, 257-276.
Slack, L., Butt, J., Maynard, I. & Olusuga, P. (2014).Understanding mental
toughness in elite football officiating : perceptions of English Premier League
referees. Sport and Exercise Psychology Review, 10 , 4-24.
Soares, J. T., & Shamir, L. (2016). Quantitative analysis of penalty kicks and yellow
card referee decisions in soccer. American Journal of Sports Science, 4, 84-89
Strauss, B. (2002). Social facilitation in motor tasks: a review of research and theory.
Psychology of Sport and Exercise 3, 237–256.
Thomas, J. R., Salazaer, W., & Landers, D. M. (1991). What is missing in p < .05?
Effect size. Research Quarterly for Exercise and Sport 62, 344-348.
Travassos, D., Araújo, D., Correia, V., & Esteves, P. (2010). Eco-dynamics approach
to the study of team sports performance. The Open Sports Sciences Journal, 3,
56-57.
Travassos, D., Davids, K., Vilar, L., Esteves, P., & Vanda, C. (2012) Informational
constraints shape emergent functional behaviours during performance of
interceptive actions in team sports Psychology of Sport and Exercise, 13, 216-
223.
Vacha-Haase, T. (2001). Statistical significance should not be considered as one of
life's guarantees. Effect sizes are needed. Educational and Psychological
Measurement, 61, 219-224.

140
Van Quaquebeke, N., & Giessner, S.R. (2010). How embodied cognitions affect
judgments: Height-related attribution bias in football foul calls. Journal of Sport
& Exercise Psychology, 32, 3– 22.
Van Lier, L. (2004). Relations. e-Study Guide for: Handbook of Psychology,
Volume 6: Developmental Psychology: Psychology, Human development. New
York: Springer.
Verheijen, R., Oudejans. R., Beek P. J., & Bakker, F. C. (2002). Factors affecting
decision-making of soccer referees.In Science and football IV: Proceedings of
the 4th
World Congress of Science and Football. W. Spink, T. Reilly, & A.
Murphy (ed.) London, UK: Routledge,
Vicente, K. (2003). Beyond the lens model and direct perception: Toward a broader
ecological psychology. Ecological Psychology, 15, 241–267.
Viera, A. J., & Garrett, J. M. (2005). Understanding inter-observer agreement: the
kappa statistic. Family Medicine, 37, 360-363.
Vilar, V., Araújo, D., Davids, K., & Bar-Yam, Y. (2013) Science of winning soccer:
Emergent pattern-forming dynamics in association football. Journal of Systems
Science and Complexity, 26, 73–84.
Wagenmakers, E. J. (2007). A practical solution to the pervasive problems of p-
values. Psychonomic Bulletin & Review, 14, 779-804.
Ward, P., & Williams, A.M. (2003). Perceptual and cognitive skill development in
soccer: the multidimensional nature of expert performance. Journal Of Sport &
Exercise Psychology, 25, 93-111.
Watson, A. (2003). Affordances, constraints, and attunements in mathematical
activity. In: J. Williams (Ed.). Proceedings of the British Society for Research
into Learning Mathematics 23, 103-108.
Weston, M., Castagna, C., Impelizzeri, F. M., Rampinini, E., & Breivik, S. (2010).
Ageing and physical match performances in English Premiere League soccer
referees. Journal of Science and Sports Medicine, 13, 96-100.

141
Weston, M., Drust, B., Atkinson, G., & Gregson, W. (2011a). Variability of soccer
referees match performances. International Journal of Sports Medicine, 32, 190-
194.
Weston, M., Drust, B., & Gregson, W. (2011b). Intensities of exercise during match-
play in FA Premier League referees. Journal of Sports Sciences, 29, 527-532.
Weston, M., Helsen, W., MacMahon, C., & Kirkendall, D. (2004). The impact of
specific high-intensity training sessions on football referees’ fitness levels.
American Journal of Sports Medicine 32, 54-60.
Williams, A.M. (2000). Perceptual skill in soccer: Implications for talent
identification and development. Journal of Sports Sciences, 18, 737-740.
Wong, K. (2013). Partial least squares structural equation modeling (PLS-SEM)
techniques using SmartPLS. Marketing Bulletin, 24, 1-32.
Young, J. (2007). Statistical errors in medical research - a chronic disease. Swiss
Medical Weekly, 137, 41-43.
Zilak, S. T., & McCloskey, D. N. (2008) The cult of statistical significance: how the
standard error costs us jobs, justice, and lives. Michigan: University of
Michigan.
Related Documents