Journal of Environmental Management 88 (2008) 53–61 The mountain-lowland debate: Deforestation and sediment transport in the upper Ganga catchment R.J. Wasson a, , N. Juyal b , M. Jaiswal b , M. McCulloch d , M.M. Sarin b , V Jain e , P. Srivastava c , A.K. Singhvi b a Charles Darwin University, Darwin, NT 0909, Australia b Physical Research Laboratory, Ahmedabad 380 000, India c Wadia Institute of Himalayan Geology, Dehra Dun 248001, India d Research School of Earth Sciences, Australian National University, ACT 0200, Australia e School of Earth Sciences, Macquarie University, Sydney, NSW 2109 Australia Received 12 April 2006; received in revised form 19 January 2007; accepted 26 January 2007 Available online 1 June 2007 Abstract The Himalaya-Gangetic Plain region is the iconic example of the debate about the impact on lowlands of upland land-use change. Some of the scientific aspects of this debate are revisited by using new techniques to examine the role of deforestation in erosion and river sediment transport. The approach is whole-of-catchment, combining a history of deforestation with a history of sediment sources from well before deforestation. It is shown that deforestation had some effect on one very large erosional event in 1970, in the Alaknanda subcatchment of the Upper Ganga catchment, but that both deforestation and its effects on erosion and sediment transport are far from uniform in the Himalaya. Large magnitude erosional events occur for purely natural reasons. The impact on the Gangetic Plain of erosion caused by natural events and land cover change remains uncertain. r 2007 Published by Elsevier Ltd. Keywords: Erosion; Sedimentation; Deforestation; Himalaya 1. Introduction In a short paper, following other claims (see Ives and Messerli, 1989, for discussion), Eckholm (1975) posited an environmental crisis in the Himalaya. Among other claims, deforestation of the mountains was blamed for increasing flooding of the Gangetic Plain in India and Bangladesh. Detailed criticism of the postulated crisis, which became known as the theory of Himalayan degradation (THED), followed (e.g. Ives and Messerli, 1989; Ives, 2004). THED became embedded in public policy in Nepal, India and China, so that the early highly speculative papers had a disproportionately large impact (Blaikie and Muldavin, 2004). THED has also become an iconic example of an environmental myth. Thompson et al. (2006) argued that the scale of scientific uncertainty was so large that nothing sensible could be gleaned for public policy from existing research. They argued further, in a post-modern flourish, that nothing of value could ever be known about the complex of interacting natural and human forces in the Himalaya. Stott and Sullivan (2000) saw the work of Thompson et al. (2006) as an example of a crucial aspect of political ecology, namely the re-framing of ‘accepted environmental narratives, particularly those directed via international environment and development discourses to resource users in the South’. This quote makes evident the political underpinnings of grand environmental narratives, at least in the view of these and other political ecologists. The need to make these underpinnings clear makes the research landscape very complex. Stott and Sullivan (2000) saw creative research to deal with this complexity as transcending the divide between natural and social sciences; engaging with a range of methods; using complementary sources of data to build ARTICLE IN PRESS www.elsevier.com/locate/jenvman 0301-4797/$ - see front matter r 2007 Published by Elsevier Ltd. doi:10.1016/j.jenvman.2007.01.046 Corresponding author. Tel.: +61 2 8946 6868. E-mail address: [email protected] (R.J. Wasson).

Welcome message from author
This document is posted to help you gain knowledge. Please leave a comment to let me know what you think about it! Share it to your friends and learn new things together.
Transcript
ARTICLE IN PRESS
0301-4797/$ - se
doi:10.1016/j.je
�CorrespondE-mail addr
Journal of Environmental Management 88 (2008) 53–61
www.elsevier.com/locate/jenvman
The mountain-lowland debate: Deforestation and sedimenttransport in the upper Ganga catchment
R.J. Wassona,�, N. Juyalb, M. Jaiswalb, M. McCullochd, M.M. Sarinb,V Jaine, P. Srivastavac, A.K. Singhvib
aCharles Darwin University, Darwin, NT 0909, AustraliabPhysical Research Laboratory, Ahmedabad 380 000, India
cWadia Institute of Himalayan Geology, Dehra Dun 248001, IndiadResearch School of Earth Sciences, Australian National University, ACT 0200, Australia
eSchool of Earth Sciences, Macquarie University, Sydney, NSW 2109 Australia
Received 12 April 2006; received in revised form 19 January 2007; accepted 26 January 2007
Available online 1 June 2007
Abstract
The Himalaya-Gangetic Plain region is the iconic example of the debate about the impact on lowlands of upland land-use change.
Some of the scientific aspects of this debate are revisited by using new techniques to examine the role of deforestation in erosion and river
sediment transport. The approach is whole-of-catchment, combining a history of deforestation with a history of sediment sources from
well before deforestation. It is shown that deforestation had some effect on one very large erosional event in 1970, in the Alaknanda
subcatchment of the Upper Ganga catchment, but that both deforestation and its effects on erosion and sediment transport are far from
uniform in the Himalaya. Large magnitude erosional events occur for purely natural reasons. The impact on the Gangetic Plain of
erosion caused by natural events and land cover change remains uncertain.
r 2007 Published by Elsevier Ltd.
Keywords: Erosion; Sedimentation; Deforestation; Himalaya
1. Introduction
In a short paper, following other claims (see Ives andMesserli, 1989, for discussion), Eckholm (1975) posited anenvironmental crisis in the Himalaya. Among other claims,deforestation of the mountains was blamed for increasingflooding of the Gangetic Plain in India and Bangladesh.Detailed criticism of the postulated crisis, which becameknown as the theory of Himalayan degradation (THED),followed (e.g. Ives and Messerli, 1989; Ives, 2004). THEDbecame embedded in public policy in Nepal, India andChina, so that the early highly speculative papers had adisproportionately large impact (Blaikie and Muldavin,2004).
THED has also become an iconic example of anenvironmental myth. Thompson et al. (2006) argued that
e front matter r 2007 Published by Elsevier Ltd.
nvman.2007.01.046
ing author. Tel.: +612 8946 6868.
ess: [email protected] (R.J. Wasson).
the scale of scientific uncertainty was so large that nothingsensible could be gleaned for public policy from existingresearch. They argued further, in a post-modern flourish,that nothing of value could ever be known about thecomplex of interacting natural and human forces in theHimalaya. Stott and Sullivan (2000) saw the work ofThompson et al. (2006) as an example of a crucial aspect ofpolitical ecology, namely the re-framing of ‘acceptedenvironmental narratives, particularly those directed viainternational environment and development discourses toresource users in the South’.This quote makes evident the political underpinnings of
grand environmental narratives, at least in the view of theseand other political ecologists. The need to make theseunderpinnings clear makes the research landscape verycomplex. Stott and Sullivan (2000) saw creative research todeal with this complexity as transcending the dividebetween natural and social sciences; engaging with a rangeof methods; using complementary sources of data to build
ARTICLE IN PRESSR.J. Wasson et al. / Journal of Environmental Management 88 (2008) 53–6154
a rich picture of land-use and environmental ideas,including local narratives; using theoretical frameworksto constrain environmental narratives; understanding thecultural basis of the separation of people and nature;understanding that temporal and spatial scales of observa-tion influence findings; and recognising the importance ofhistory and contingency in the construction of narrativesand in the way that environments and technology aremanaged.
The analysis by Stott and Sullivan (2000) pays insuffi-cient attention to the application of new and evolvingtechniques from the natural sciences. We contend thatmuch of the scientific input to THED was weak, largelybecause it failed to take adequate account of temporal andspatial scale. This view was earlier expressed by Ives andMesserli (1989).
In this paper, we examine one part of what becameknown as THED. We use techniques that were notavailable to scientists whose work was included in THED.We include many aspects of the research agenda of Stottand Sullivan, including temporal and spatial scale, historyand contingency, complementary data sources, theoreticalframeworks, and local narratives. However, THED in ourview is not a hypothesis worthy of further debate. It is ill-posed and, in many important ways, impossible to test.Even though what follows was considered part of THED,we do not intend by our study to re-enliven the entirehypothesis. However, our study fits into the ongoingupland–lowland debate, a topic considered next.
2. The debate and the present study
Debate about the impact on the Gangetic Plain of landcover and land-use changes in the Himalayan mountainshas produced two positions (Ives and Messerli, 1989; Ives,2004; Hofer and Messerli, 2006): (i) deforestation increases
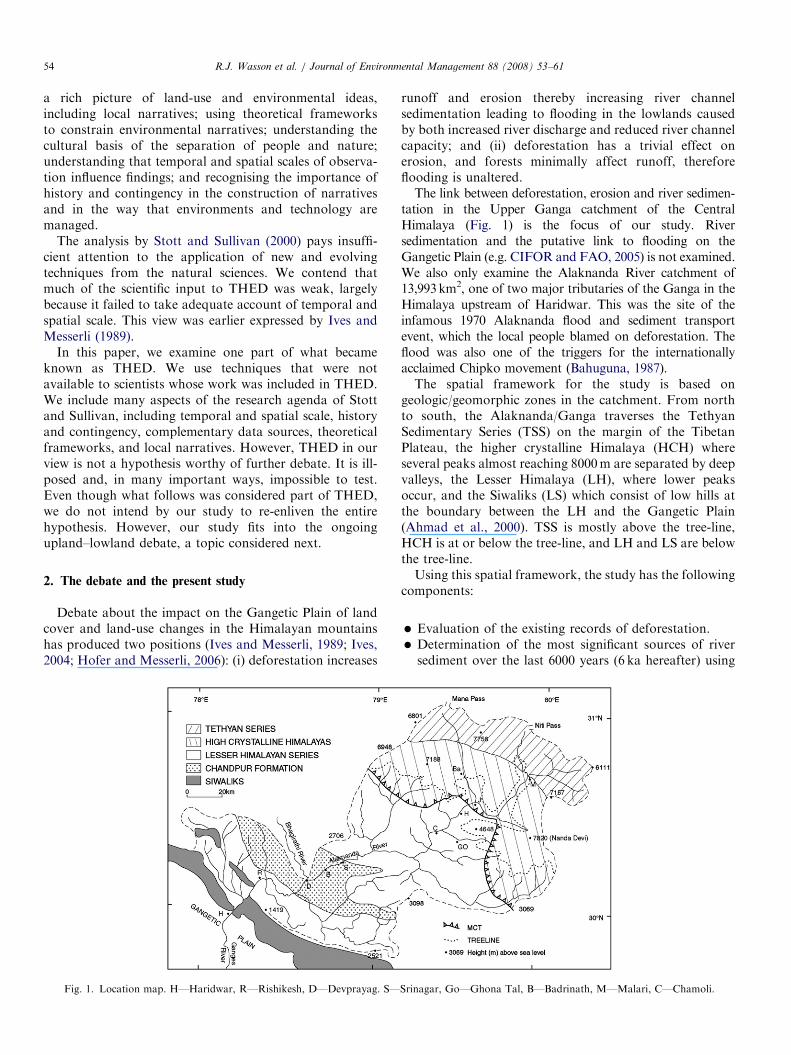
Fig. 1. Location map. H—Haridwar, R—Rishikesh, D—Devprayag. S—
runoff and erosion thereby increasing river channelsedimentation leading to flooding in the lowlands causedby both increased river discharge and reduced river channelcapacity; and (ii) deforestation has a trivial effect onerosion, and forests minimally affect runoff, thereforeflooding is unaltered.The link between deforestation, erosion and river sedimen-
tation in the Upper Ganga catchment of the CentralHimalaya (Fig. 1) is the focus of our study. Riversedimentation and the putative link to flooding on theGangetic Plain (e.g. CIFOR and FAO, 2005) is not examined.We also only examine the Alaknanda River catchment of13,993km2, one of two major tributaries of the Ganga in theHimalaya upstream of Haridwar. This was the site of theinfamous 1970 Alaknanda flood and sediment transportevent, which the local people blamed on deforestation. Theflood was also one of the triggers for the internationallyacclaimed Chipko movement (Bahuguna, 1987).The spatial framework for the study is based on
geologic/geomorphic zones in the catchment. From northto south, the Alaknanda/Ganga traverses the TethyanSedimentary Series (TSS) on the margin of the TibetanPlateau, the higher crystalline Himalaya (HCH) whereseveral peaks almost reaching 8000m are separated by deepvalleys, the Lesser Himalaya (LH), where lower peaksoccur, and the Siwaliks (LS) which consist of low hills atthe boundary between the LH and the Gangetic Plain(Ahmad et al., 2000). TSS is mostly above the tree-line,HCH is at or below the tree-line, and LH and LS are belowthe tree-line.Using this spatial framework, the study has the following
components:
�
Srin
Evaluation of the existing records of deforestation.
� Determination of the most significant sources of riversediment over the last 6000 years (6 ka hereafter) using
agar, Go—Ghona Tal, B—Badrinath, M—Malari, C—Chamoli.
ARTICLE IN PRESSR.J. Wasson et al. / Journal of Environmental Management 88 (2008) 53–61 55
geochemical tracers and optically stimulated lumines-cence (OSL) dating.
� Estimation of the volume of the 1970 deposit in astorage zone by comparison with earlier deposits fromdifferent sources.
� Examination of the links between deforestation anderosion sources through time.
� Exploration of the vulnerability to erosion of the mainsource of the 1970 deposit.
3. Deforestation
The first written record of the forests of this catchment isfrom 1624 AD, suggesting vast forest cover in the LH andLS (Wessles, 1924). By the 1920s ‘immense tracts’ of foreststill existed in the LH (Dudgeon and Kenoyer, 1925), butthe descriptions also suggest less forest than in 1624. Whilethe qualitative trend of deforestation is clear (Negi et al.,1997), quantification using the same definitions andmethods for exactly the same areas is difficult. In 1922,about 25% of British Garhwal was forested (Singh et al.,1984), and in 2001 about 45% of the original area of forestof the state of Uttaranchal (which includes the formerBritish Garhwal) was forested (Forest Survey of India,2001). Official records of the District of Chamoli (mostlyHCH and some LH) indicate 57% forest cover in 1970 and32% in 2001 (Zurick and Karan, 1999). The District ofGarhwal (all LH) had 84% forest cover in 1970 and 59% in2001(Zurick and Karan, 1999; Forest Survey of India,2001). Importantly, in 1990 the cropped area was 8% inChamoli District and 28% in Garhwal District (Zurick andKaran, 1999). These values were 9% and 32% in 1970,respectively, showing that agriculture was not the cause ofdeforestation.
Between 1803 and 1815 AD, large numbers of trees werecut during Gorkha rule in the Central Himalaya, but it wasmainly during the nineteenth century that Deodar and Chir
pines were commercially exploited (Tucker, 1982). Roadconstruction in the catchment after 1962 facilitatedcommercial logging (Tucker, 1982) that reduced forestcover in Chamoli and Garhwal Districts (Zurick andKaran, 1999). Thus, accelerated forest loss occurred from1803 onwards, particularly since 1962. For discussion ofthe politics and further explanation of land cover change,see, for example, Rangan (1995) and Saberwal (1999).
The accuracy of the quantitative forest cover data isdebateable. Definitions of forest, classification of satelliteimages, protocols for estimating forest cover from aerialphotos are all open to question. Fortunately, these issues arenot highly important in this study, as accurate data do existfor the area of particular importance, as will be shown.
4. Sources of sediment
Being places of high relief, glaciation and landslides,HCH and TSS are likely major sources of sediments in theAlaknanda River. TSS and HCH are mostly above the tree
line and if they do supply most sediment then deforestationcan be discounted as a factor in rates of erosion in thecatchment. To test this proposition, the proportion of riversediment derived from HCH and TSS was estimated.The geologic/geomorphic zones have different values of
the rare earth tracer hNd(0) (Ahmad et al., 2000; McCullochand Wasserburg, 1978; Robinson et al., 2001). hNd(0) tracervalues are the result of a physical mixture of grains fromdifferent sources. No chemical partitioning or chemicalfractionation occurs. Previously measured values of hNd(0)in modern river samples (Vance et al., 2003) were combinedwith the data for the present study, determined by methodsreported previously (Wasson et al., 2002).The geologic/geomorphic zones now need a little more
elaboration. Within the LH is an area of HCH rocksknown as the Chandpur Formation (Ahmad et al., 2000).The LH upstream of this Formation is called here InnerLesser Himalaya (ILH), the Chandpur Formation isOLH(C), and the LH downstream of the Formation isOLH (K), where K refers to the Krol Formation.The input to modern river sediments from each geologic/
geomorphic source zone (TSS, HCH, LH, LS) wascalculated as follows. A linear two-end-member mixingmodel was used when either only two end members (TSS andHCH) exist or can be reasonably assumed (ILH and HCHbecause the TSS signal completely disappears in the HCHzone). Further downstream where for example a sample is amixture of HCH, ILH and OLH (C), the ratio HCH/ILHimmediately upstream of OLH (C) was taken as one endmember and the hNd(0) value for OLH (C) was theother end member. This procedure assumes that the ratioHCH/ILH in the sediments that are receiving input fromOLH (C) is maintained, but the percentages of HCH andILH in the sample are reduced by the amount of OLH (C)input. The assumption of a constant ratio is plausiblebecause the wide range of lithologies in each sample indicatesthat the bulk density of the sediments does not vary along theriver and so differential transport of sediment of the sameparticle size from different sources does not occur.The data show that sediment derived from TSS is rapidly
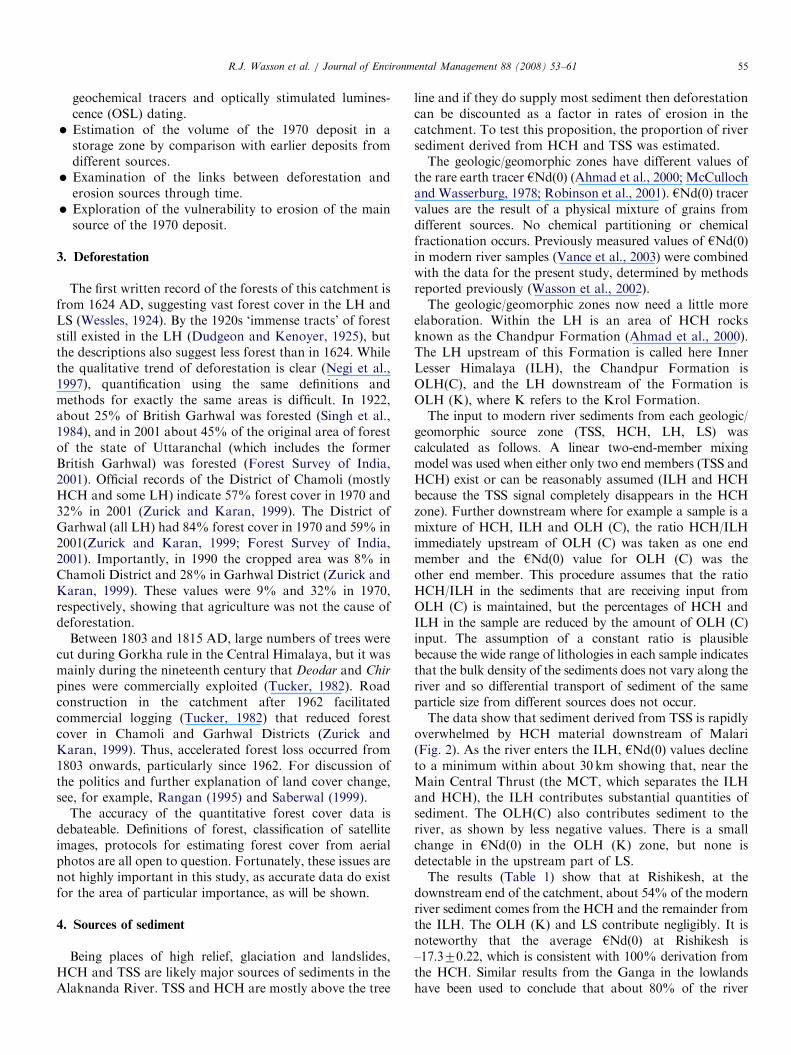
overwhelmed by HCH material downstream of Malari(Fig. 2). As the river enters the ILH, hNd(0) values declineto a minimum within about 30 km showing that, near theMain Central Thrust (the MCT, which separates the ILHand HCH), the ILH contributes substantial quantities ofsediment. The OLH(C) also contributes sediment to theriver, as shown by less negative values. There is a smallchange in hNd(0) in the OLH (K) zone, but none isdetectable in the upstream part of LS.The results (Table 1) show that at Rishikesh, at the
downstream end of the catchment, about 54% of the modernriver sediment comes from the HCH and the remainder fromthe ILH. The OLH (K) and LS contribute negligibly. It isnoteworthy that the average hNd(0) at Rishikesh is–17.370.22, which is consistent with 100% derivation fromthe HCH. Similar results from the Ganga in the lowlandshave been used to conclude that about 80% of the river
ARTICLE IN PRESS
Table 1
hNd(0) results and source estimates from Malari to Rishikesh
Location Distance from
Malari (km)
hNd (O) Percentage from
TSS HCH ILH OLH (C) OLH (K) LS
Malari 7 �12.7+ 100
13 �16.0+ 9 91
Joshimath 50 �15.5+ 100
Helang 55 �16.1+ 100
57 �16.3+ 100
Birehi 75 �19.2 63 37
Rudraprayag 136 �20.1+ 52 48
136 �19.8+ 56 44
Srinagar 156 �19.2 63 36 1
Bagwan 176 �18.2+ 60 34 6
Devprayag 195 18.771.0*+ 59 33 8
Lower
Alaknanda
212 �17.7+ 54 30 16 ND ND
220 �17.6+ 54 30 16 ND ND
Rishikesh 255 �17.5 54 30 16 ND ND
255 �17.0 54 30 16 ND ND
*x71s; n ¼ 5. Uncertainties for single hNd (O) values are o1.5%. +Data from Vance et al. (2003). ND—not detectable.
Fig. 2. hNd(0) variation along the Alaknanda River through the geologic/geomorphic zones. The mean hNd(0) value for each zone is shown. M—Malari,
J—Joshimath, B—Birehi Ganga/Alaknanda junction, R—Rudraprayag, S—Srinagar, Ba—Bagwan, D—Devprayag, R—Rishikesh, H—Haridwar.
R.J. Wasson et al. / Journal of Environmental Management 88 (2008) 53–6156
sediment is derived from the HCH (France-Lanord et al.,2000). The pattern of variation of hNd(0) along theAlaknanda (Fig. 2, Table 1), however, does not supportsuch an interpretation.
The discussion of sediment sources has thus far focussedon spatial sources. The alarmist paper by Eckholm (1975)stressed loss of topsoil, presumably by sheet and rillerosion. This loss was seen as a disaster for both theagricultural society of the mountains and the plains peoplewho had to endure flooding supposedly caused in part byriver channel shallowing as a result of topsoil deposition.
The topsoil tracer 210Pb (excess) (Wasson et al., 1987) insamples from the Ganga River at Rishikesh and the BirehiGanga was measured to obtain at least a qualitative
indication of the amount of topsoil in the rivers. Lowactivities of 3176mBq/g at Rishikesh and 4777mBq/g inthe Birehi Ganga suggest that, while some topsoil reachesthe main rivers, it is minimal compared to the erosionalprocesses that move subsoil; namely, landsliding, gullying,and channel erosion. Quantification of the topsoil compo-nent of river sediments in this catchment must awaitfurther work.
5. History of erosion and sediment sources
hNd(0) of modern sediment may represent only a fewyears of transport from its source(s). Erosion rates based on10Be and 26Al provide an average value over 200–1000 years,
ARTICLE IN PRESS
Table 2
OSL dates and source estimates for alluvial deposits at Srinagar
Age of deposit Sediment type HCH (%) ILH (%)
Modern River channel 64 36
1970 AD Overbank 45 55
230760 a Flood couplets 67 33
400740 a Overbank 86 14
8007100 a Laterally accreted fluvial sand 52 48
27007700 a 86 14
63007800 a Braid bar 78 22
R.J. Wasson et al. / Journal of Environmental Management 88 (2008) 53–61 57
as follows: TSS 1.270.1mm/a; HCH 2.770.3mm/a; andLH 0.870.3mm/a (Vance et al., 2003). Modern suspendedsediment loads for the Alaknanda below Helang (at theMCT) were derived by regressing measured loads (datatabulated by Kale and Gupta, 2001) on catchment area ateach station, and then loads from each source terrain werecalculated using the regression equation. The ratio of loadsfrom the HCH and LH is 2.1 for the long term and 1.8 forthe modern suspended load. The ratios are 1.5 and 1.1 for theILH and OLH, respectively. Even though the loads forthe long-term are higher than the modern rates, becausebedload is included in the former, the change of ratiosbetween the long term and today suggests that the LH andOLH are now a more significant source.
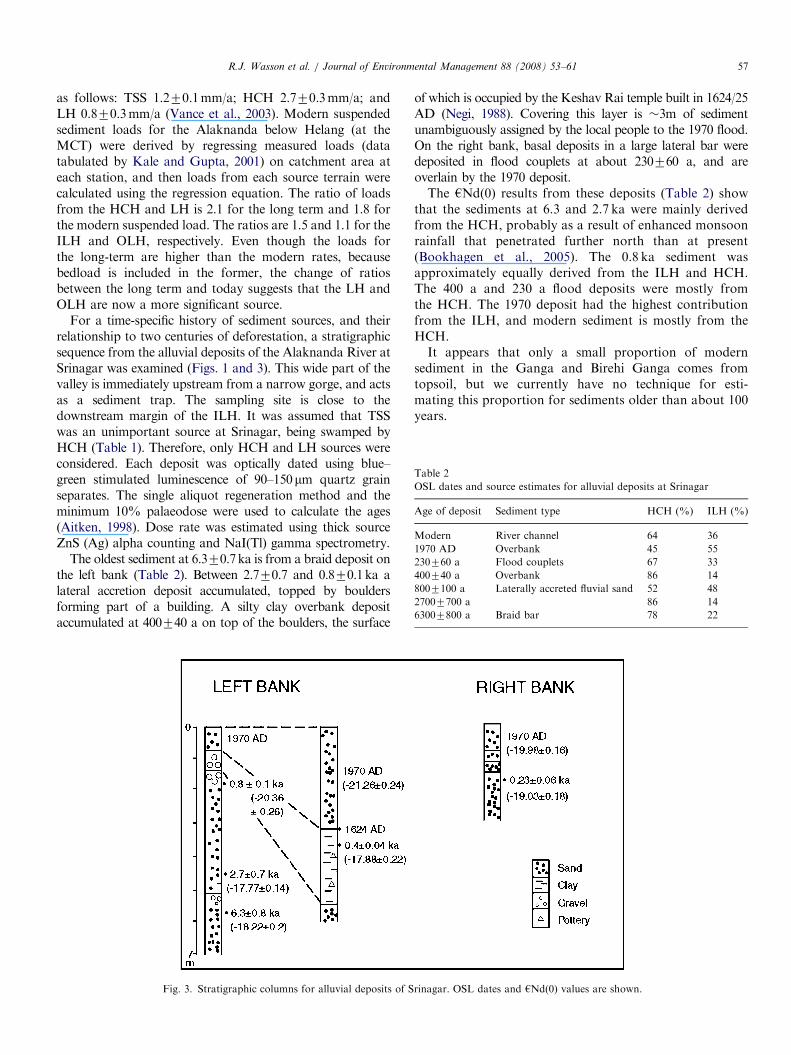
For a time-specific history of sediment sources, and theirrelationship to two centuries of deforestation, a stratigraphicsequence from the alluvial deposits of the Alaknanda River atSrinagar was examined (Figs. 1 and 3). This wide part of thevalley is immediately upstream from a narrow gorge, and actsas a sediment trap. The sampling site is close to thedownstream margin of the ILH. It was assumed that TSSwas an unimportant source at Srinagar, being swamped byHCH (Table 1). Therefore, only HCH and LH sources wereconsidered. Each deposit was optically dated using blue–green stimulated luminescence of 90–150mm quartz grainseparates. The single aliquot regeneration method and theminimum 10% palaeodose were used to calculate the ages(Aitken, 1998). Dose rate was estimated using thick sourceZnS (Ag) alpha counting and NaI(Tl) gamma spectrometry.
The oldest sediment at 6.370.7ka is from a braid deposit onthe left bank (Table 2). Between 2.770.7 and 0.870.1ka alateral accretion deposit accumulated, topped by bouldersforming part of a building. A silty clay overbank depositaccumulated at 400740 a on top of the boulders, the surface
Fig. 3. Stratigraphic columns for alluvial deposits of S
of which is occupied by the Keshav Rai temple built in 1624/25AD (Negi, 1988). Covering this layer is �3m of sedimentunambiguously assigned by the local people to the 1970 flood.On the right bank, basal deposits in a large lateral bar weredeposited in flood couplets at about 230760 a, and areoverlain by the 1970 deposit.The hNd(0) results from these deposits (Table 2) show
that the sediments at 6.3 and 2.7 ka were mainly derivedfrom the HCH, probably as a result of enhanced monsoonrainfall that penetrated further north than at present(Bookhagen et al., 2005). The 0.8 ka sediment wasapproximately equally derived from the ILH and HCH.The 400 a and 230 a flood deposits were mostly fromthe HCH. The 1970 deposit had the highest contributionfrom the ILH, and modern sediment is mostly from theHCH.It appears that only a small proportion of modern
sediment in the Ganga and Birehi Ganga comes fromtopsoil, but we currently have no technique for esti-mating this proportion for sediments older than about 100years.
rinagar. OSL dates and hNd(0) values are shown.
ARTICLE IN PRESSR.J. Wasson et al. / Journal of Environmental Management 88 (2008) 53–6158
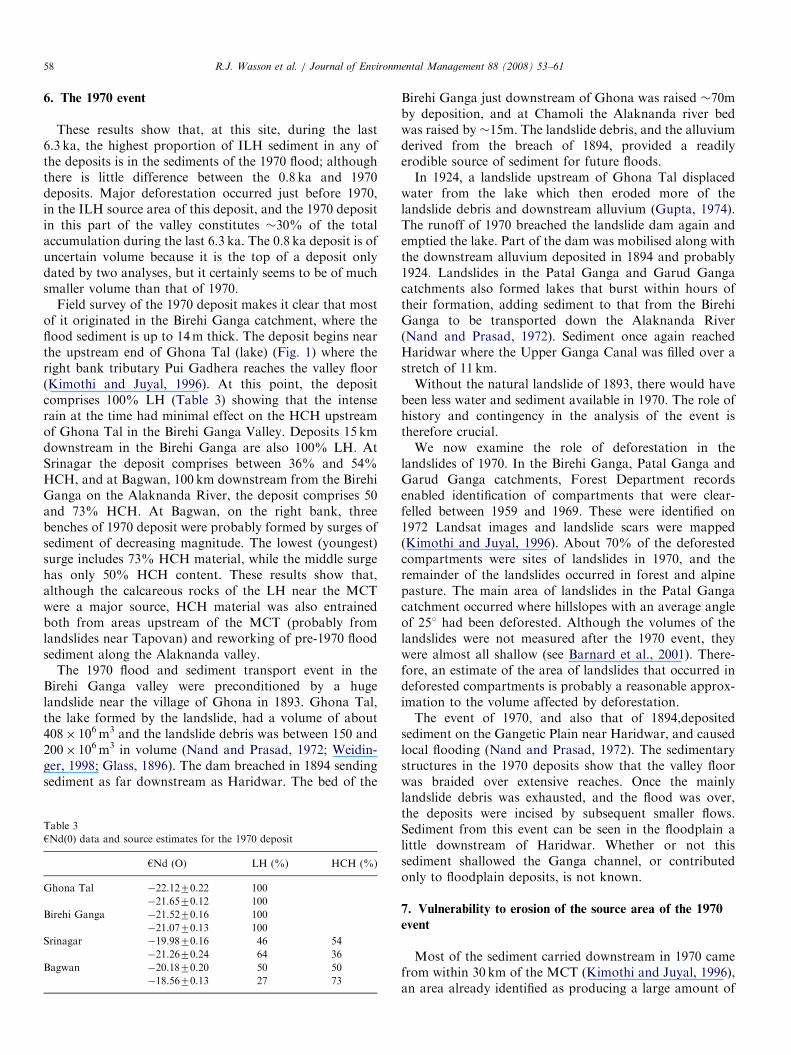
6. The 1970 event
These results show that, at this site, during the last6.3 ka, the highest proportion of ILH sediment in any ofthe deposits is in the sediments of the 1970 flood; althoughthere is little difference between the 0.8 ka and 1970deposits. Major deforestation occurred just before 1970,in the ILH source area of this deposit, and the 1970 depositin this part of the valley constitutes �30% of the totalaccumulation during the last 6.3 ka. The 0.8 ka deposit is ofuncertain volume because it is the top of a deposit onlydated by two analyses, but it certainly seems to be of muchsmaller volume than that of 1970.
Field survey of the 1970 deposit makes it clear that mostof it originated in the Birehi Ganga catchment, where theflood sediment is up to 14m thick. The deposit begins nearthe upstream end of Ghona Tal (lake) (Fig. 1) where theright bank tributary Pui Gadhera reaches the valley floor(Kimothi and Juyal, 1996). At this point, the depositcomprises 100% LH (Table 3) showing that the intenserain at the time had minimal effect on the HCH upstreamof Ghona Tal in the Birehi Ganga Valley. Deposits 15 kmdownstream in the Birehi Ganga are also 100% LH. AtSrinagar the deposit comprises between 36% and 54%HCH, and at Bagwan, 100 km downstream from the BirehiGanga on the Alaknanda River, the deposit comprises 50and 73% HCH. At Bagwan, on the right bank, threebenches of 1970 deposit were probably formed by surges ofsediment of decreasing magnitude. The lowest (youngest)surge includes 73% HCH material, while the middle surgehas only 50% HCH content. These results show that,although the calcareous rocks of the LH near the MCTwere a major source, HCH material was also entrainedboth from areas upstream of the MCT (probably fromlandslides near Tapovan) and reworking of pre-1970 floodsediment along the Alaknanda valley.
The 1970 flood and sediment transport event in theBirehi Ganga valley were preconditioned by a hugelandslide near the village of Ghona in 1893. Ghona Tal,the lake formed by the landslide, had a volume of about408� 106m3 and the landslide debris was between 150 and200� 106m3 in volume (Nand and Prasad, 1972; Weidin-ger, 1998; Glass, 1896). The dam breached in 1894 sendingsediment as far downstream as Haridwar. The bed of the
Table 3
hNd(0) data and source estimates for the 1970 deposit
hNd (O) LH (%) HCH (%)
Ghona Tal �22.1270.22 100
�21.6570.12 100
Birehi Ganga �21.5270.16 100
�21.0770.13 100
Srinagar �19.9870.16 46 54
�21.2670.24 64 36
Bagwan �20.1870.20 50 50
�18.5670.13 27 73
Birehi Ganga just downstream of Ghona was raised �70mby deposition, and at Chamoli the Alaknanda river bedwas raised by�15m. The landslide debris, and the alluviumderived from the breach of 1894, provided a readilyerodible source of sediment for future floods.In 1924, a landslide upstream of Ghona Tal displaced
water from the lake which then eroded more of thelandslide debris and downstream alluvium (Gupta, 1974).The runoff of 1970 breached the landslide dam again andemptied the lake. Part of the dam was mobilised along withthe downstream alluvium deposited in 1894 and probably1924. Landslides in the Patal Ganga and Garud Gangacatchments also formed lakes that burst within hours oftheir formation, adding sediment to that from the BirehiGanga to be transported down the Alaknanda River(Nand and Prasad, 1972). Sediment once again reachedHaridwar where the Upper Ganga Canal was filled over astretch of 11 km.Without the natural landslide of 1893, there would have
been less water and sediment available in 1970. The role ofhistory and contingency in the analysis of the event istherefore crucial.We now examine the role of deforestation in the
landslides of 1970. In the Birehi Ganga, Patal Ganga andGarud Ganga catchments, Forest Department recordsenabled identification of compartments that were clear-felled between 1959 and 1969. These were identified on1972 Landsat images and landslide scars were mapped(Kimothi and Juyal, 1996). About 70% of the deforestedcompartments were sites of landslides in 1970, and theremainder of the landslides occurred in forest and alpinepasture. The main area of landslides in the Patal Gangacatchment occurred where hillslopes with an average angleof 251 had been deforested. Although the volumes of thelandslides were not measured after the 1970 event, theywere almost all shallow (see Barnard et al., 2001). There-fore, an estimate of the area of landslides that occurred indeforested compartments is probably a reasonable approx-imation to the volume affected by deforestation.The event of 1970, and also that of 1894,deposited
sediment on the Gangetic Plain near Haridwar, and causedlocal flooding (Nand and Prasad, 1972). The sedimentarystructures in the 1970 deposits show that the valley floorwas braided over extensive reaches. Once the mainlylandslide debris was exhausted, and the flood was over,the deposits were incised by subsequent smaller flows.Sediment from this event can be seen in the floodplain alittle downstream of Haridwar. Whether or not thissediment shallowed the Ganga channel, or contributedonly to floodplain deposits, is not known.
7. Vulnerability to erosion of the source area of the 1970
event
Most of the sediment carried downstream in 1970 camefrom within 30 km of the MCT (Kimothi and Juyal, 1996),an area already identified as producing a large amount of

ARTICLE IN PRESS
Fig. 4. Longitudinal profiles of the Alaknanda between Devprayag and
Mana Pass, and of the Dhauli Ganga between Vishnuprayag and Niti
Pass. Also shown is the envelope of greatest altitude (dashed line) and the
geologic/geomorphic zones. D—Devprayag, S—Srinagar, C—Chamoli,
H—Helang, V—Vishnuprayag, Mal—Malari, B—Badrinath. M—Mana,
MP—Mana Pass, NP—Niti Pass, TT—Tons Thrust, MT—Munsiari
Thrust, VT—Vaikrita Thrust, STDS—South Tibetan Detachment system.
R.J. Wasson et al. / Journal of Environmental Management 88 (2008) 53–61 59
the modern river sediment (Fig. 2). This area is particularlysensitive to disturbance. Fig. 4 shows a longitudinal profileof the Alaknanda River based on both a 1:150,000 map bythe Schweizerischen Stiftung fur Alpine Forschungen(2002) and Pal (1986). Upstream of Vishnuprayag, long-itudinal profiles of both the Alaknanda and Dhauli Gangaare provided along with the envelope of maximumelevations. The longitudinal profiles are steep above theMCT zone, which in this region is defined by the Munsiariand Vaikrita Thrusts. Also of note is the convexity of theDhauli Ganga between Malari (at the southern TibetanDetachment System, that separates the TSS from theHCH) and Vishnuprayag. A less prominent convexity isalso evident in the Alaknanda longitudinal profile.
The convexity is explained as the result of uplift (possiblyby extrusion) of the HCH at a rate faster than fluvialdowncutting (Beaumont et al., 2001). In this zone of fastestuplift in the Central Himalaya (Jackson and Bilham, 1994),modelling and estimates of rates of erosion given by fissiontrack cooling ages in rocks of the HCH (Sorkhabi et al.,1996) indicate an erosion rate of �2mm/year averagedover the past 2.4 million years. This implies that fluvialincision is o2mm/year in the convex zone. Erosion is alsofocussed in this part of the Himalaya (the SouthernHimalayan Front, SHF) by high orographic rainfall(Hodges et al., 2004), and stream power is at a maximum,particularly in the Alaknanda Valley (Finlayson et al.,2002).
High stream gradients and stream power imply bothrapid steam incision and rapid evacuation of sediments,and creation of steep hillslopes, adjacent to rivers, that
erode quickly. Mean hillslope angle, mean relief anderosion rate are all highly correlated in the Himalaya(Montgomery and Brandon, 2002; Gabet et al., 2004). Thegreatest relief in the Alaknanda Valley is 5.5–6.0 kmbetween Helang and Chamoli (Fig. 4) where averagehillslope angles adjacent to the river are about 301. Furtherdownstream average hillslope angles range between 201and 131, where maximum relief falls to between 1500 and2000m (Pal, 1986).
8. Discussion
Deforestation increased during the last 200 years and,particularly since 1962 in the LH. Sediment currently beingtransported by the Ganga River at the mountain front isderived in approximately equal amounts from the HCHand LH. It is therefore clear that the high relief HCH doesnot dominate modern sediment sources. Also, nearly 70%of the LH sediment comes from within 30 km of the MCT.A small but as yet unquantified proportion of modern riversediments is derived by erosion of topsoil.In the last 6.3 ka, the largest contribution from the LH to
sediment deposited at Srinagar occurred in 1970, and thisdeposit constitutes �30% of the total sediment depositedin this section of the valley during the past 6.3 ka. Almostthe same proportion of LH material occurred in the 0.8 kadeposit, well before deforestation. The cause of this erosionof the LH was natural, related to rainfall and/or anearthquake. Most of the sediment transported during the1970 Alaknanda Flood came from the same area as themodern sediment, that is, the SHF both a little upstream ofthe MCT and within 30 km downstream of the MCT. TheSHF is the area of highest total and mean relief, steepesthill slopes, fractured and sheared rocks, fastest uplift, andhigh rainfall. Hill slope gradients are maintained at or nearthe threshold for shallow landsliding (and sometimes deeplandsliding) by rapid fluvial downcutting. During theprolonged and at times intense rainfall of 1970, about70% of the landslides occurred on deforested hillslopes,adding substantially to deposition downstream. Some ofthe sediment also came from the breach of Ghona Tal.The role of land cover in landslide location and
magnitude identified in the Alaknanda Valley is consistentwith some quantitative studies elsewhere in the Himalaya(Starkel and Basu, 2000; Valdiya and Bartarya, 1989). Bycontrast, erosion and sediment transport that dramaticallyreduced the capacity of a reservoir and thereby Nepal’smain source of hydro-electricity in the Kulekhani catch-ment was caused by landslides that occurred in grasslandand forest areas (Dhital et al., 1993). Also, Gardner (2002)showed that in the Kullu District of Himachal Pradesh,little deforestation has occurred but landslides and debrisflows are a common occurrence. Road construction has,however, caused landslides.Deforestation does have an effect, but it occurs in
concert with undercutting of slopes by road construction,zones of sheared rock, and saturating rainfall that can
ARTICLE IN PRESSR.J. Wasson et al. / Journal of Environmental Management 88 (2008) 53–6160
trigger landslides even in well-forested land on steep slopesand that precondition the landscape to produce even moresediment transport during later periods.
The central Himalaya is a very complex landscape, proneto very high rates of erosion and sediment transport oftenproduced under extreme conditions. The role of land-use,particularly deforestation, in this landscape is difficult todiscern. Only the 1970 event can be partly explained bydeforestation, with a significant role played by pre-existing(or contingent) events; namely, the creation and breach ofGhona Tal.
The extreme vulnerability of the SHF indicates thaterosion here will always be high whatever the land-use. Butunder some circumstances deforestation will cause increasederosion. It follows that reforestation will help to moderatethe effects of some extreme rainfall events, but cannot beexpected to stop erosion and destructive sediment transport.The effects on local people of reforestation of course needcareful consideration (Sinha, 2001).
The impact of human-induced erosion in the Himalayaon channel sedimentation in the Gangetic Plain has notbeen investigated in our study. Construction of histories ofboth channel and floodplain sedimentation will be neces-sary, and estimates made of the travel times of sediment inthe main rivers (cf. Schreier and Wymann von Dach, 1996)so that correlations between land cover changes anderosion in the mountains with sedimentation on the plainsare meaningful.
Finally, if current ideas about paying upland land usersfor environmental services provided to lowlanders (Wun-der, 2005) are put into practice, the role of land cover willneed to be quantified. Otherwise, payments will be stalledin uncertainty, argument and possibly litigation.
9. Conclusion
Identifying the role of human agency in the erosion andsediment transport system of the Himalaya is difficult.Nonetheless, by using geochemical sediment source tracersand a historical approach set within a whole-of-catchmentframework, it has been possible to show that deforestationhad some impact on at last one very large erosion andsediment transport event. The temporal and spatialframework adopted is different from that previously used,and historical contingency has been explicitly analysed. Wehave drawn upon many data sources including localnarratives. By a careful step-by-step approach, theupland–lowland debate in the Himalaya-Gangetic Plaincan be sensibly re-examined, and public policy appro-priately informed.
Acknowledgements
We thank Bruno Messerli for stimulating debate, thepeople of Garhwal for many kindnesses, Jo Pinter forassistance with the manuscript, and Jack Ives for a reviewof the paper.
References
Ahmad, T., Harris, N., Bickle, M., Chapman, H., Bunbury, J., Prince, C.,
2000. Isotopic constraints on the structural relationships between the
Lesser Himalaya series and the High Himalayan Crystalline Series,
Garhwal Himalaya. Geological Society of America Bulletin 112, 467–477.
Aitken, M.J., 1998. An Introduction to Optical Dating. Oxford University
Press, Oxford, 280pp.
Bahuguna, S., 1987. The Chipko: a people’s movement. In: Raha, M.K.
(Ed.), The Himalayan Heritage. Gian, New Delhi, pp. 238–248.
Barnard, P.L., Owen, L.A., Sharma, M.C., Finkel, R.C., 2001. Natural
and human-induced landsliding in the Garhwal Himalaya of northern
India. Geomorphology 40, 21–35.
Beaumont, C., Jamieson, R.A., Nguyen, M.H., Lee, B., 2001. Himalayan
tectonics explained by estrusion of low-viscosity crustal channel
coupled to focused surface denudation. Nature 414, 738–742.
Blaikie, P.M., Muldavin, J.S.S., 2004. Upstream, Downstream, China,
India: The politics of environment in the Himalayan Region. Annals of
the Association of American Geographers 94, 520–548.
Bookhagen, B., Thiede, R.C., Strecker, M.R., 2005. Late Quaternary
intensified monsoon phases control landscape evolution in the north-
west Himalaya. Geology 33, 149–152.
CIFOR and FAO, 2005. Forests and Floods. Drowning in fiction or
thriving on facts? CIFOR.
Dhital, M.R., Khanal, N., Thapa, K.B., 1993. The role of extreme weather
events, mass movements, and land-use changes in increasing natural
hazards. Workshop Proceedings: Causes of the Recent Damage
Incurred in South-Central Nepal, July 19–21. ICIMOD, 123pp.
Dudgeon, Kenoyer, L.A., 1925. The ecology of Tehri Garhwal: a
contribution to the ecology of the western Himalaya. The Journal of
Indian Botanical Society 4, 232–284.
Eckholm, E.P., 1975. The deterioration of mountain environments.
Science 189, 764–770.
Finlayson, D.P., Montgomery, D.R., Hallet, B., 2002. Spatial coincidence
of rapid inferred erosion with young metamorphic massifs in the
Himalayas. Geology 30, 219–222.
Forest Survey of India, 2001. The State of Forest Report. Ministry of
Environment and Forest, Government of India, New Delhi.
France-Lanord, C.L., Derry, A., Michard, A., 2000. Himalayan tectonics.
Geological Society of Special Publication 74, 603.
Gabet, E.J., Pratt-Sitaula, B.A., Burbank, D.W., 2004. Climatic controls
on hillslope angle and relief in the Himalayas. Geology 32, 629–632.
Gardner, J.S., 2002. Natural hazard risk in the Kullu District, Himachal
Pradesh, India. The Geographical Review 92, 282–306.
Glass, J.H., 1896. The great landslip at Gohna, in Garhwal, and the
measures adopted to prevent serious loss of life. Journal of the Society
of Arts 27, 431–446.
Gupta, A.C., 1974. Lakes of sorrow. Indian Engineer Journal C1 55, 6–11.
Hodges, K.V., Wobus, C., Ruhl, K., Schlidgen, T., Whipple, K., 2004.
Quaternary deformation, river steepening, and heavy precipitation at
the front of the Higher Himalayan ranges. Earth and Planetary Science
Letters 220, 379–389.
Hofer, T., Messerli, B., 2006. Floods in Bangladesh, History, Dynamics
and Rethinking the Role of the Himalayas. United Nations University
Press, Tokyo, 468pp.
Ives, J.D., 2004. Himalayan Perceptions. Routledge, London, 271pp.
Ives, J.D., Messerli, B., 1989. The Himalayan Dilemma. Routledge,
London, 295pp.
Jackson, M., Bilham, R., 1994. Constraints on Himalayan deformation
inferred from vertical velocity fields in Nepal and Tibet. Journal of
Geophysical Research 99, 13897–13912.
Kale, V.S., Gupta, A., 2001. Introduction to Geormorphology. Orient
Longman, Hyderabad, 274pp.
Kimothi, M.M., Juyal, N., 1996. Environmental impact assessment of a
few selected watersheds of the Chamoli district (Central Himalaya)
using remotely sensed data. International Journal of Remote Sensing
17, 1391–1405.
ARTICLE IN PRESSR.J. Wasson et al. / Journal of Environmental Management 88 (2008) 53–61 61
McCulloch, M.T., Wasserburg, G.J., 1978. Sm–Nd and Rb–Sr chronology
of continental crust formation. Science 200, 1003–1011.
Montgomery, D.R., Brandon, M.T., 2002. Topographic controls in
erosion rates in tectonically active mountain ranges. Earth and
Planetary Science Letters 201, 481–489.
Nand, C., Prasad, C., 1972. Alaknanda Tragedy. A Geomorphological
Appraisal. The National Geographical Journal of India 18, 205–212.
Negi, S., 1988. Madhye Himalaya ke Rajnetik Awana Sanskrit Itihas
(Middle Himalaya Political and Cultural History). Wani Prakasha,
New Delhi.
Negi, A.K., Bhatt, B.P., Todaria, N.P., Saklani, A., 1997. The effects of
colonialism on forests and the local people in the Garhwal Himalaya,
India. Mountain Research and Development 17, 159–168.
Pal, S.K., 1986. Geomorphology of River Terraces along Alaknanda
Valley, Garhwal Himalaya. B.R. Publishing Group, Delhi, 158pp.
Rangan, H., 1995. Contested boundaries: State policies, forest classifica-
tions, and deforestation in the Garhwal Himalayas. Antipode 27L,
343–362.
Robinson, D.M., DeCelles, P.G., Patchett, P.J., Garzione, C.N., 2001.
The kinematic evolution of the Nepalese Himalaya interpreted from
Nd isotopes. Earth and Planetary Science Letters 192, 507–521.
Saberwal, V., 1999. Pastoral Politics. Oxford University Press, Delhi,
246pp.
Schreier, H., Wymann von Dach, S., 1996. Understanding Himalayan
processes: shedding light on the Dilemma. In: Hurni, H., Kienholz, H.,
Wanner, H., Wiesmann, V. (Eds.), Umwelt Mensch Gebirge.
Festschrift for Bruno Messerli. Jahrbuch der Geographischen
Gessellschaft Bern, Bd. 59/1994–1996. Berne, Switzerland, pp. 75–83.
Singh, J.S., Pandey, U., Tiwari, A.K., 1984. Man and forests: a Central
Himalayan Case Study. Ambio 13, 80–87.
Sinha, B., 2001. Timber ban and its effect on the Himalayan rural women
and rural energy. Boiling Point 47, 30–32.
Sorkhabi, R., Stump, E., Foland, K.A., Jain, A.K., 1996. Fission-track
and 40Ar/39Ar evidence for episodic denudation of the Gangotri
granites in the Garhwal Higher Himalaya, India, Tectonophysics 260,
187–199.
Starkel, L., Basu, S. (Eds.), 2000. Rains, Landslides and Floods in the
Darjiling Himalaya. Indian National Science Academy, New Delhi,
168pp.
Stott, P., Sullivan, S., 2000. Introduction. In: Stott, P., Sullivan, S. (Eds.),
Political Ecology. Science, Myth and Power. Arnold, London,
pp. 1–11.
Thompson, M., Warburton, M., Hatley, T., 2006. Uncertainty on a
Himalayan Scale. 2nd ed. Himal, Kathmandu.
Tucker, R.P., 1982. The forests of the western Himalayas: the legacy of
British Colonial Administration. Journal of Forest History 26,
112–124.
Valdiya, K.S., Bartarya, S.K., 1989. Problem of mass-movements in a part
of Kumaun Himalaya. Current Science 58, 486–491.
Vance, P., Bickle, M., Ivy-Ochs, S., Kubik, P.W., 2003. Erosion and
exhumation in the Himalaya from cosmogenic isotope inventories of
river sediments. Earth and Planetary Science Letters 206, 273–288.
Wasson, R.J., Caitcheon, G., Murray, A.S., McCulloch, M., Quade, J.,
2002. Sourcing sediment using multiple tracers in the catchment of
Lake Argyle, Northwestern Australia. Journal of Environmental
Management 29, 634–636.
Wasson, R.J., Clark, R.L., Nanninga, P.M., Waters, J., 1987. Pb-210 as a
chronometer and tracer, Burrinjuck Reservoir, Australia. Earth
Surface Processes and Landforms 12, 399–414.
Weidinger, J.T., 1998. Case history and hazard analysis of two lake-
damming landslides in the Himalayas. Journal Asian Earth Sciences
16, 323–331.
Wessles, C., 1924. Early Jesuit Travellers in Central Asia 1603–1721.
Martinus Nijhoff, The Hague.
Wunder. S., 2005. Payments for environmental services: some nuts and
bolts. CIFOR Occasional Paper No. 42.
Zurick, D., Karan, P.P., 1999. Himalaya. The Johns Hopkins University
Press, Baltimore, MD, 355pp.
Related Documents