1 THE MOST FREQUENTLY DISENROLLING SENIORS WISELY FRUGAL NATURALISTS HEALTHCARE DRIVEN TRADITIONALISTS Health Related Behavioral Profiles FHP Market Research September, 1996 Note: As of 2012, PATH = Patterns of Adapting to Health, Generics = Wisely Frugal, Ready Users = Healthcare Driven

The Most Frequently Disenrolling Seniors
Aug 14, 2015
Welcome message from author
This document is posted to help you gain knowledge. Please leave a comment to let me know what you think about it! Share it to your friends and learn new things together.
Transcript

1
THE MOST FREQUENTLY
DISENROLLING SENIORS
WISELY FRUGAL
NATURALISTS
HEALTHCARE DRIVEN
TRADITIONALISTS
Health Related Behavioral Profiles
FHP Market Research
September, 1996
Note: As of 2012, PATH = Patterns of Adapting to Health, Generics =
Wisely Frugal, Ready Users = Healthcare Driven

2
EXECUTIVE SUMMARY
Seniors can be grouped into nine distinct health care attitude and behavior
profiles. All nine profile types are represented among FHP senior plan
members.
Seniors with three distinct health care attitude and behavior profiles
(Independently Healthy, Generics, and Naturalists) account for over 40
percent of FHP Senior Plan members in Southern California in their first
year of membership.
Four groups: Generics, Naturalists, Ready Users, and Traditionalists show
higher rates of disenrollment than expected.
Disenrollment among Ready Users is expected to result in $2.07 million in
loss of premium revenue per 10,000 members per month; disenrollment
among the same number of Loyalists is expected to result in only $1.55
million in loss per month.
The health care attitudes and behaviors of as few as 10,000 members
account for a $6 million variance in annual premium loss due to varying
disenrollment risk.

3
Contents
Introduction ........................................................................................... 3
Cost Implications of Varying Disenrollment Rates .......................... 5
Profiles of Frequently Disenrolling Members .................................. 8
PATH Profile Summaries .................................................................. 9
Generics ............................................................................................. 9
Naturalists .......................................................................................... 10
Ready Users ....................................................................................... 10
Health Plan Selection Factors and Satisfaction ................................. 10
Mapping of Health Plan Selection Factors and PATH Groups ........ 10
Health Plan Selection and Satisfaction ............................................... 12
Generics ............................................................................................. 12
Naturalists .......................................................................................... 14
Ready Users ....................................................................................... 15
Prescription Drug Behaviors ............................................................... 16
Generics ............................................................................................. 17
Ready Users ....................................................................................... 18
Naturalists .......................................................................................... 19

4
INTRODUCTION
In a recent telephone survey of 1,322 disenrolled seniors, it was found that seniors with
the health care attitude and behavior profiles of Generics, Naturalists, Ready Users, and
Traditionalists (see PATH profiling below) account for just over half of those Southern
California senior disenrollees from FHP who left for voluntary reasons, as shown in Chart
1 below.
CHART 1
PATH Groups Among
Senior DisenrolleesMar-May, 1996, N=1322
Generic
19%
Naturalist
14%
Ready User
14%
Traditionalist
8%
Family
Centered
8%
Loyalist
6%
Independently
Healthy
11%
Avoider
4%
Unassigned
12%
Clinic Cynic
4%
Comparison of the distribution shown in Chart 1 with a profiling of the current senior
membership in Southern California in their first year* (September, 1995 to August 1996)
as shown in Chart 2 identifies four groups as having higher disenrollment rates than
expected as shown in Chart 3.
______________________________________ *Based on a mail survey of Southern California FHP senior members in their first year of
enrollment (N=49,000).

5
CHART 2
PATH Group Distribution Among FHP Senior Members
(N=13,800)
Clinic Cynic
7% Avoider
4%
Generic
16%
Traditionalist
7%
Family Centered
8%Loyalist
10%
Ready User
10%
Independently
Healthy
14%
Naturalist
12%
Unassigned
12%
Seniors with three distinct health care attitude and behavior profiles
(Independently Healthy, Generics, and Naturalists) account for over 40
percent of FHP Senior Plan members in Southern California in their first
year.

6
CHART 3
% Point Variances in Disenrollment Across PATH
Groups (Seniors, 1996)
-6.0% -4.0% -2.0% 0.0% 2.0% 4.0% 6.0%
Clinic Cynic
Avoider
Generic
Traditionalist
Family Centered
Loyalist
Ready User
Independently Healthy
Naturalist
Unassigned
Four groups: Generics, Naturalists, Ready Users, and Traditionalists
show higher rates of disenrollment than expected.
Cost Implications of Varying Disenrollment Rates
Higher or lower rates of voluntary disenrollment across specific groups impact revenue.
The level of the impact can be seen by applying the identified rates of disenrollment to a
specific number of members. Currently, among senior FHP members in Southern
California, those in their first year of enrollment (about 49,000) represent 25 percent of
the total senior Southern California membership (see Chart 4). FHP Senior Plan
members in Southern California in their first year of enrollment also account for 51
percent (see Chart 4) of Southern California senior member disenrollment. This
percentage was derived from analysis of senior disenrollment based on months of
enrollment as reported by HCFA.
7
CHART 4
Cummulative % Members and Disenrollees
by Months of Membership
0%
5%
10%
15%
20%
25%
30%
35%
40%
45%
50%
55%
60%
65%
70%
75%
80%
85%
90%
95%
100%
0 8
16
24
32
40
48
56
64
72
80
88
96
10
4
11
2
12
0
12
8
13
7
14
8
Months of Membership
Cu
mm
ula
tiv
e %
Members
Disenrollees
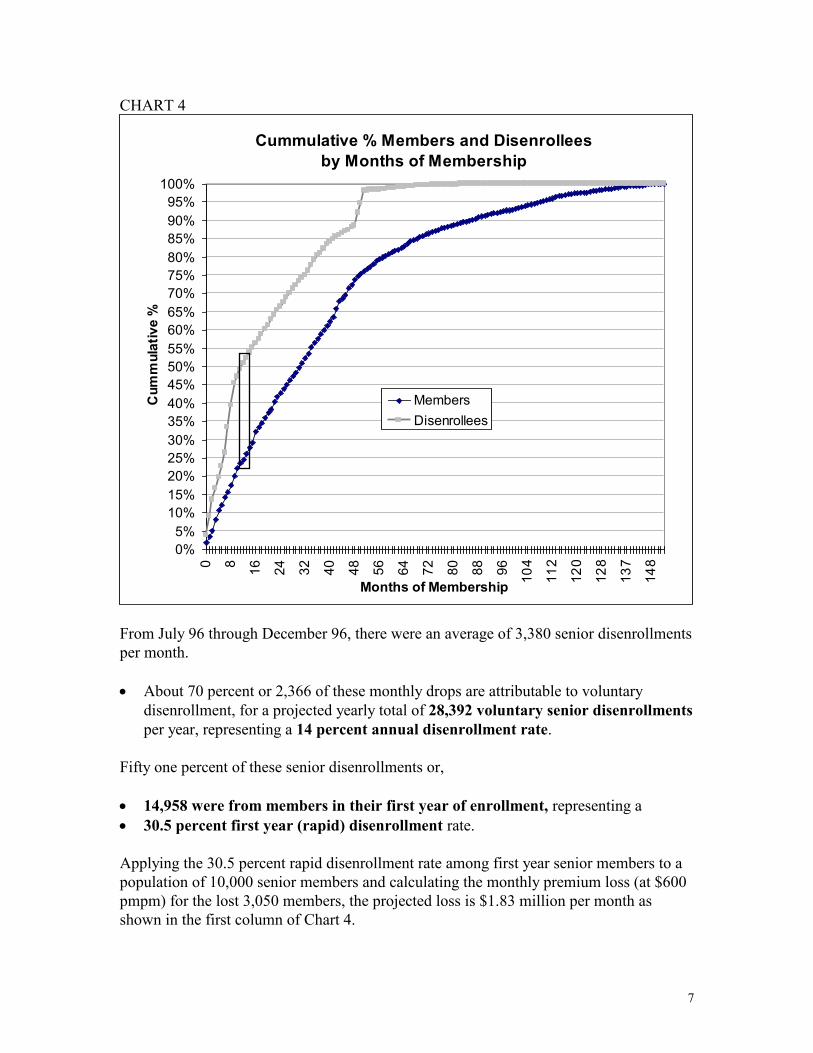
From July 96 through December 96, there were an average of 3,380 senior disenrollments
per month.
About 70 percent or 2,366 of these monthly drops are attributable to voluntary
disenrollment, for a projected yearly total of 28,392 voluntary senior disenrollments
per year, representing a 14 percent annual disenrollment rate.
Fifty one percent of these senior disenrollments or,
14,958 were from members in their first year of enrollment, representing a
30.5 percent first year (rapid) disenrollment rate.
Applying the 30.5 percent rapid disenrollment rate among first year senior members to a
population of 10,000 senior members and calculating the monthly premium loss (at $600
pmpm) for the lost 3,050 members, the projected loss is $1.83 million per month as
shown in the first column of Chart 4.

8
CHART 4
Estimated Monthly Disenrollment $ Loss Among
1st Year Enrollees by PATH Group
Per 10,000 (Seniors, 1996)
$1,830,000
$2,076,000 $2,046,000
$1,548,000
$1,656,000
$1,140,000
$1,340,000
$1,540,000
$1,740,000
$1,940,000
$2,140,000
$2,340,000
10000
General New
Enrollees
10000
Ready Users
10000
Generic
10000
Loyalist
10000
Clinic Cynic
Member Types
(@$600 PMPM)
Disenrollment among Ready Users is expected to result in $2.07 million in
loss of premium revenue per 10,000 per month; disenrollment among the
same number of Loyalists is expected to result in only $1.55 million in
loss per month.
However, based on differences in the first year disenrollment rates by PATH group,
which vary between 35 percent (for Ready Users) and 26 percent (for Loyalists), the
potential amount of monthly premium loss is dramatically different per 10,000 of each
type (Chart 4). As shown in the chart below (Chart 5), on an annual basis the Ready User
loss is $2.9 million more than expected, while for Loyalist the gain is $3.3 million over
the general membership.

9
CHART 5
Estimated Annual Disenrollment Loss/Gain
Variance Among 1st Year Members
by PATH Groups Per 10000, (Seniors, 1996)
$0
($2,952,000)
$3,384,000
$2,088,000
($2,592,000)($3,500,000)
($2,500,000)
($1,500,000)
($500,000)
$500,000
$1,500,000
$2,500,000
$3,500,000
$4,500,000
General
New
Enrollees
Ready
Users
Generic Loyalist Clinic
Cynic
Group Type
Do
lla
r V
ari
an
ce
Est. Yearly Loss/Gain
The health care attitudes and behaviors of as few as 10,000 members
account for a $6 million variance in annual premium loss due to
disenrollment.
Profiles of Frequently Disenrolling Seniors
Generics, Naturalists, Ready Users, and Traditionalists are four groups out of a possible
nine that make up the Profiles of Attitudes Toward Healthcare (PATH) segmentation
system. Each group is defined by a profile that contains information across eleven
dimensions of health care thinking and behavior as shown in Table 1.

10
Table 1: Frequently Disenrolling PATH Groups
Attitudes and Behaviors Generics Naturalists Ready Users Traditionalists
Involvement in family health low moderate low low
Trust in medical professionals mod high low high indifferent
Willing to experiment high high high mod low
Propensity to avoid healthcare high high low mod high
Information seeking high high high low
Receptivity to advertising high moderate high mod low
Involvement in decision-making mod high high high high
Health proactive low high high low
Price concern high moderate low low
Quality concern moderate high high high
Health emphasis and involvement low high high low
Traits shared by three of the four groups that could feed into disenrollment are:
* willingness to experiment,
* information seeking, and
* receptivity to advertising.
All these traits make these adults prime targets for competitive advertising or competitive
sales efforts. These seniors are more likely to pay attention to an advertisement, make a
call as a result of what they’ve seen, or favorably respond to a sales call. Their high
penchant for seeking health care information indicates higher levels of education and
knowledge of healthcare treatments and options.
PATH Profile Summaries for the Top Three Disenrolling Groups Generics
Generics are more likely to be swayed by price and cost issues. Quality is not the only
driver. The Generic adult puts little effort into practicing proactive health behaviors for
themselves or their family members, whether it be working to stay in physical shape or
practicing good nutrition. They will also put off seeking medical care until an ailment or
injury is very bad. Again, the reason for avoidance is generally cost related. Generics
are receptive to and seek out health care information--again, often driven by the need for
the best economic option. Their attentiveness to and basic trust in health care advertising
allows them to satisfy their information needs through this medium. Their trust in

11
medical professionals is moderately high and, along with their cost concern, this may feed
their willingness to experiment with different treatment options or alternatives.
Naturalists
Naturalist adults are less likely to be swayed by price and cost issues, but still consider
them. Quality is, however, a more compelling driver. The Naturalist adult puts a greater
effort into practicing proactive health behaviors for themselves. Because the Naturalist
adult has high distrust of most medical care providers, they will also put off seeking
“regular” medical care until it is the last resort. The Naturalist prefers experimenting
with different treatment options or non-medical alternatives. The Naturalist is attentive
to most health care advertising, but evaluates it with a skeptical eye. Their high level of
health care information seeking is generally biased towards supporting their trust in
alternative healing therapies and distrust of regular medicine.
Ready Users
Ready User adults are very unlikely to be swayed by price and cost issues like the
Naturalists. Quality is their number one concern. Unlike the Naturalist, Ready User
adults have greater trust and confidence in medical care providers. As a result, Ready
Users, as their name implies, will seek medical care at the first sign of trouble. Like the
Naturalist, the Ready User adult puts a greater effort into practicing proactive health
behaviors for themselves, and is willing to experiment with different treatment options or
non-medical alternatives. However, Ready User adults will generally consider non-
medical alternatives as supplements to regular medical care, rather than replacements for
it. The Ready User is attentive to most health care advertising, and fairly receptive to
messages from medical care providers or insurers. Their high level of health care
information seeking is generally unbiased towards alternative healing therapies or regular
medicine.
HEALTH PLAN SELECTION FACTORS AND SATISFACTION
Note: The analysis of each adult group are derived from data available in the
Sachs/Scarborough 1995 HealthPlus survey for Los Angeles. The results are based on
5,680 interviews. The selection of both HMO and non-HMO plans are evaluated.
Mapping of Health Plan Selection Factors and PATH Groups
Information relating PATH groups to reasons for selecting a health plan, whether
indeminty, PPO, or HMO, were translated into a two dimensional “positioning” map, as
shown in Chart 1. In this map:
PATH groups located close together evaluate health plan selection criteria the same
way, and
PATH group proximity to selection factors indicates the level of importance placed
on them. Greater proximity indicates greater importance, lesser proximity indicates
lesser importance.

12
Chart 1: Mapping PATH Groups and Health Plan Selection
MAPPING OF PATH GROUPS
IN RELATION TO HEALTH PLAN CHOICE FACTORS
better coverage
dissatis. w ith old plan
other reason
no choice of planselected plan
plan reputation/doctor
location/doctor reputation
customer service
hospital reputation
hospital location
old plan too expensive
NATURALISTS
INDEP. HEALTHY
LOYALISTS
READY USERS
TRADITIONALISTSFAMILY CENTERED
AVOIDERS
GENERICSCLINIC CYNICS
experience w ith plan
range of services
ease of paperw ork
my cost for premium
use spouse's plan
doctor in plan
clear benefit
IDEAL (AVERAGE) POINT
low deductible
Sachs/Scarborough 1995 HealthPlus, Los Angeles
Adults segmented by PATH group show differing levels of
importance for the reasons used to select their health plan
13
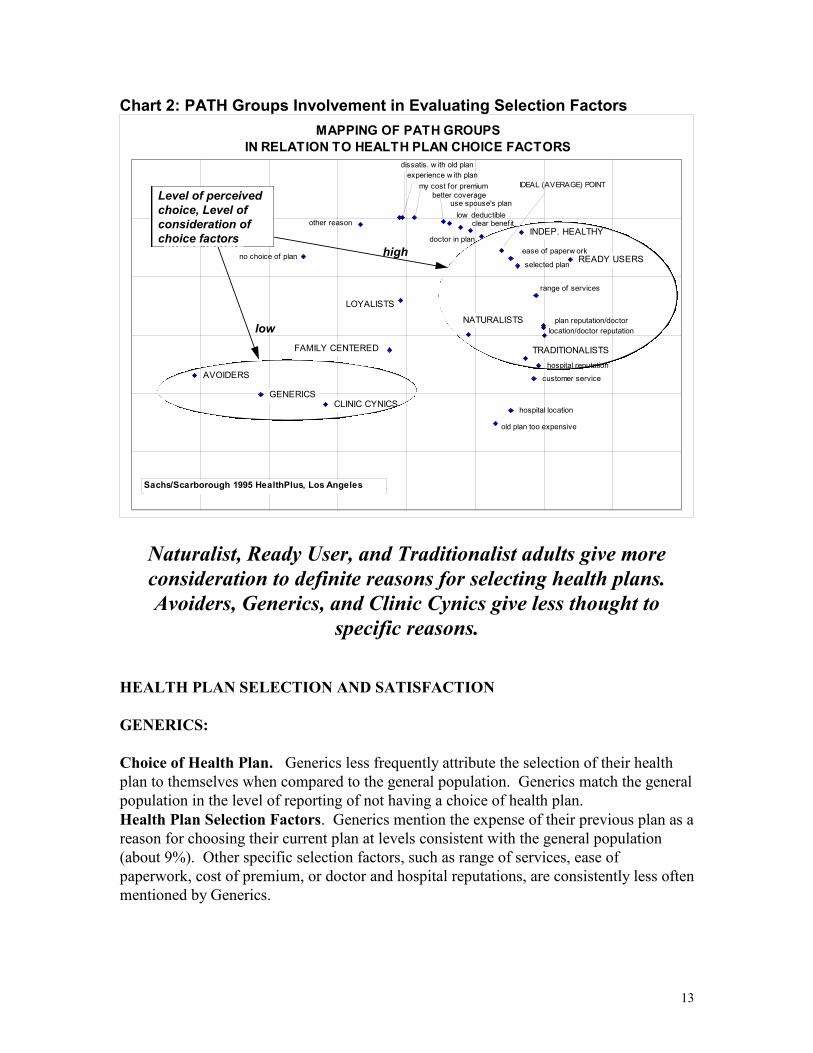
Chart 2: PATH Groups Involvement in Evaluating Selection Factors
MAPPING OF PATH GROUPS
IN RELATION TO HEALTH PLAN CHOICE FACTORS
better coverage
dissatis. w ith old plan
other reason
no choice of planselected plan
plan reputation/doctor
location/doctor reputation
customer service
hospital reputation
hospital location
old plan too expensive
NATURALISTS
INDEP. HEALTHY
LOYALISTS
READY USERS
TRADITIONALISTSFAMILY CENTERED
AVOIDERS
GENERICSCLINIC CYNICS
experience w ith plan
range of services
ease of paperw ork
my cost for premium
use spouse's plan
doctor in plan
clear benefit
IDEAL (AVERAGE) POINT
low deductible
Sachs/Scarborough 1995 HealthPlus, Los Angeles
Level of perceived
choice, Level of
consideration of
choice factors
Level of perceived
choice, Level of
consideration of
choice factors
low
high
Naturalist, Ready User, and Traditionalist adults give more
consideration to definite reasons for selecting health plans.
Avoiders, Generics, and Clinic Cynics give less thought to
specific reasons.
HEALTH PLAN SELECTION AND SATISFACTION
GENERICS:
Choice of Health Plan. Generics less frequently attribute the selection of their health
plan to themselves when compared to the general population. Generics match the general
population in the level of reporting of not having a choice of health plan.
Health Plan Selection Factors. Generics mention the expense of their previous plan as a
reason for choosing their current plan at levels consistent with the general population
(about 9%). Other specific selection factors, such as range of services, ease of
paperwork, cost of premium, or doctor and hospital reputations, are consistently less often
mentioned by Generics.
14
Satisfaction With Health Plan. Fewer Generics report high satisfaction with their
current health plan when compared with the general population. Generics are
consistently less likely to report high satisfaction with
waiting times for physician appointments when sick or well
physician’s office waiting times when sick or well
emergency care
the prompt and courteous processing of claims
range of services
referrals to specialists
quick test results processing
quality of customer service
overall quality of care
hospitals in the plan
explanation of benefits
their ability to changes MD in the plan, and
hospital and MD office locations
These trends result in Generics being less likely to recommend their current health plan to
friends or relatives, or to indicate that they intend to renew the coverage.
Complaint Behavior. Generics are more likely to complain to their employer, insurance
company, or someone unrelated to them, rather than to family and friends, their physician,
or state or federal agencies.

15
NATURALISTS:
Choice of Health Plan. Just over half of Naturalists attribute the selection of their
health plan to themselves, which is consistent with the general population. While just
about a quarter of the general population report not having a choice of health plan, this is
less true for Naturalists who report having no choice of plan at rates 25 percent lower
than the average.
Health Plan Selection Factors. Doctor locations, low deductibles, and hospital
locations are mentioned as important factors among Naturalists at rates consistent with
the general population. Selection factors that standout for Naturalists include:
range of services
ease of paperwork
experience with the plan
their own cost of premium
the reputations of the doctors and hospitals in the health plan
the expense of their previous plan
the fact that it is their spouse’s coverage
Fewer Naturalists report selecting their current plan because of its superior coverage or
because of dissatisfaction with the old plan.
Satisfaction With Health Plan. Fewer Naturalists report high satisfaction with their
current health plan when compared with the general population. Naturalists are
consistently less likely to report high satisfaction with
waiting times for physician appointments when sick or well
physician’s office waiting times when sick or well
emergency care
the prompt and courteous processing of claims
range of services
referrals to specialists
quick test results processing
quality of customer service
overall quality of care
hospitals in the plan
explanation of benefits
their ability to changes MD in the plan, and
hospital and MD office locations
These trends result in Naturalists being less likely to recommend their current health plan
to friends or relatives, or to indicate that they intend to renew the coverage.
Complaint Behavior. Naturalists are more likely to complain to family and friends than
to their physician, and almost three times more likely to complain to state or federal
agencies.

16
READY USERS:
Choice of Health Plan. Sixty-eight percent (68%) of Ready Users attribute the selection
of their health plan to themselves, which is 32 percent higher than the general population.
Ready Users report having no choice of health plans at rates 13 percent lower than the
average.
Health Plan Selection Factors. Doctor locations are mentioned as important among
Ready Users at rates 39 percent higher than the general population. Other selection
factors that standout for Ready Users include:
range of services
that their current physician is in the plan
ease of paperwork
experience with the plan
the reputations of the doctors and hospitals in the health plan
the health plan’s reputation
getting better coverage and benefits
dissatisfaction with their old plan
clear benefit description
Satisfaction With Health Plan. More Ready Users report high satisfaction with their
current health plan when compared with the general population. Ready Users are
consistently more likely to report high satisfaction with
waiting times for physician appointments when sick or well
physician’s office waiting times when sick or well
emergency care
the prompt and courteous processing of claims
range of services
referrals to specialists
quick test results processing
quality of customer service
overall quality of care
hospitals in the plan
choice of pharmacies
explanation of benefits
their ability to changes MD in the plan, and
hospital and MD office locations
These trends result in Ready Users being more likely to recommend their current health
plan to friends or relatives, or to indicate that they intend to renew the coverage.
Complaint Behavior. Ready Users are more likely to not complain at all, whether to
family and friends, their physician, or state or federal agencies.

17
PRESCRIPTION DRUG BEHAVIORS
Prescription drug behaviors described in this section cover the following areas:
New or renewal of prescriptions in the past 12 months and compliance
Number of medications taken weekly
How the first prescription was filled
Whether physician or pharmacist discussed side effects, dosage, and use of generic
medications
Respondents preference for brand name vs generic medications
Level of choice in choosing brand name vs generic medications
Medication switching.
The quantitative index scores describing prescription drug behaviors are shown in Table
2.

18
Table 2: Prescription Drug Behaviors Across PATH Groups
Ready Independently
Behaviors Generics User Naturalist
New Prescription or Renewal in last 12 mos 98 123 100
Taken Prescription as Directed 99 126 100
# Prescr Drugs Used per week-None 106 72 81
# Prescr Drugs Used per week-One 96 88 81
# Prescr Drugs Used per week-Two 110 94 142
# Prescr Drugs Used per week- Three 75 265 124
MD or Pharm Discussed: Side Effects 98 102 96
MD or Pharm Discussed: Recommended Dosage 100 111 91
MD or Pharm Discussed: Brand vs Generic 95 87 105
Brand vs Generic: Bought Generic 103 89 106
Brand vs Generic: Brought Brand Name 96 148 90
Brand vs Generic:Don't know which bought 104 77 74
Brand vs Generic: Don't know difference 101 26 94
Know if Presc is Brand/Generic 128 78 75
Pref Brand Name Over Generic 114 84 94
Cost is Prim Reasn Use 82 133 99
Brand vs Generic: Pharm Gave Choice 104 86 114
Brand vs Generic: No Choice, MD wrote 105 151 95
Brand vs Generic: No Choice, Insurance req. 96 107 85
Brand vs Generic:Not sure if have choice 98 74 86
Switched Brands for Same Drug 108 176 126
Switched Brands: MD initiated 108 214 94
Switched Brands: Pharmacist initiated 69 173 163
Copyright 1996 Scarborough Research Corporation
Los Angeles HealthPlus 1995
Explanation of Table 2 Scores:
Population average = 100
Higher rates of behavior > 100
Lower rates of behavior < 100
Example: Generics have a score of 114 for “prefer brand name over generic”
medications, which means that Generics prefer brand name over generic medications at
a rate 14 percent higher than the general population. Conversly, the Generic score for
using three drugs per week (# prescri drugs Used per week- Three) is 75, which means
that the number of Generics taking three different medications per week is 25 percent
lower than the number in the general population.

19
Prescription Drug Behaviors
Generics
Highlights
Less frequent use of multiple medications
Slight preference for brand name drugs over generic drugs
Other trends follow population averages
On a yearly basis, Generics start new or renew prescriptions at rates consistent with the
general population. In terms of the number of presciptions taken weekly, Generics vear
away from the crowd by taking three medications weekly at rates 25 percent lower than
expected. Generics’ report engaging in discussions with their physicians about
medication dosage, side effects, and the use of generic drugs at rates consistent with the
general population. Generics are no more likely to buy name brand over generic
medications, to know which one they bought, or to really understand the difference as
compared to the general population. However, Generics report more often preferring
name brand over generic drugs. Generics are consistent with the general population in
reporting that their pharmacist, physician, or health plan dictated the choice of brand
name vs. generic medication they received. Generics less often report that the pharmacist
was responsible for switching their brand of medication.
Ready Users
Highlights
More frequent renewal or obtaining of new prescriptions
Higher compliance in taking medications as prescribed
Greater likelihood of taking multiple medications
More frequent discussions with physician about dosage
Less frequent tolerance of generic drugs in substitution for brand name drugs
Greater acceptance of physician directives
On a yearly basis, Ready Users start new or renew prescriptions at higher rates than the
general population. Ready Users are also more compliant in terms of taking drugs as
prescribed. In terms of the number of presciptions taken weekly, Ready Users have the
highest number of members taking three medications per week; the rate, in fact, is 265
percent higher than the general population. More Ready Users report engaging in
discussions with their physicians about medication dosage, while fewer Ready Users
report having discussions with their physicians about the use of generic vs brand name
drugs. Ready Users are more likely to buy brand name over generic drugs, and more
Ready Users report knowing the difference between the two. Ready Users more
frequently report that the choice of brand name vs. generic drugs is dictated by the
physician or the Ready User’s health plan. Ready Users also more frequently understand
that their current situation does not give them the option. If a medication is switched,
Ready Users attribute the switch to action by their physician at a rate 214 percent higher

20
thant he general population. Ready Users also more frequently attribute the switching of
medications to themselves, or their pharmacist.
Naturalists
Highlights
More frequent taking of multiple medications
Less frequent discussions with physician about dosage
More frequent buying of generic vs brand name drugs and more knowledge of
difference
More frequent tolerance of generic drugs in substitution for brand name drugs
More frequent reporting of pharmacist offered choice, and less frequent mention of
physician or health plan restrictions in choosing medications.
Less reliance on physician directives in changing or switching medications; more
reliance on self or pharmacist to initiate switch.
Naturalists start new or renew prescriptions at rates consistent with the general
population. Naturalists are also equally compliant in terms of taking drugs as prescribed.
In terms of the number of presciptions taken weekly, Naturalists have more members
taking two drugs weekly, followed by three drugs weekly. Fewer Naturalists report
engaging in discussions with their physicians about medication side effects or dosage,
while more Naturalists tend to report having discussions with their physicians about the
use of generic vs brand name drugs. Naturalists are more likely to buy generic over brand
name drugs, and more Naturalists report knowing the difference between the two.
Naturalists less frequently report that the choice of brand name vs. generic drugs is
dictated by the physician or the health plan. Naturalists also less frequently report that
their current situation does not give them the option. If a medication is switched,
Naturalists more frequently attribute the switch to action by themselves or their
pharmacist, and less frequently to physicians.
Related Documents