The mortality cost of undertriage of major trauma in Ontario by Barbara Haas, MD A thesis submitted in conformity with the requirements for the degree of Doctor of Philosophy Graduate Department of the Institute of Medical Science University of Toronto © Copyright by Barbara Haas 2012

Welcome message from author
This document is posted to help you gain knowledge. Please leave a comment to let me know what you think about it! Share it to your friends and learn new things together.
Transcript
The mortality cost of undertriage of major trauma in Ontario
by
Barbara Haas, MD
A thesis submitted in conformity with the requirements for the degree of Doctor of Philosophy
Graduate Department of the Institute of Medical Science University of Toronto
© Copyright by Barbara Haas 2012
ii
The mortality cost of undertriage of major trauma in Ontario
Barbara Haas
Doctor of Philosophy
The Institute of Medical Science
University of Toronto
2012
Abstract
Introduction: Multiple studies suggest that severely injured patients treated at trauma centers
have a lower mortality compared to patients treated at non-trauma centers. In many trauma
systems, a significant proportion of patients continue to be transported from the scene to a non-
trauma center (undertriaged); only a fraction of these patients are subsequently transferred to
trauma center care. Although previous analyses have attempted to examine the mortality
associated with transfer and with undertriage, these studies were not population-based, and
therefore potentially underestimated the mortality cost of undertriage at the system level.
Methods: In this dissertation, we developed an algorithm to convert ICD-10 diagnosis codes to
Injury Severity Score. This algorithm allowed us to utilize population-based data to examine the
outcomes of all severely injured patients surviving to reach an emergency department in Ontario.
We examined whether, among severely injured patients, transfer from a non-trauma center to a
trauma center is associated with increased mortality compared to direct transport from the scene.
iii
In addition, we used an instrumental variable analysis to produce a population-based estimate of
the mortality cost of undertriage in a subset of patients injured in motor vehicle collisions.
Results: Patients requiring transfer to trauma center care have significantly higher mortality at 30
days than patients transported directly from the scene of injury (Odds ratio 1.24; 95% CI, 1.10-
1.40). Among patients involved in motor vehicle collisions, only 45% were transported directly
to a trauma center. In this subset of patients, those triaged directly to a trauma center had
significantly lower mortality at 24 hours (Odds ratio 0.58, 95% CI 0.41-0.84) and 48 hours (Odds
ratio 0.68, 95% CI 0.48-0.96) compared to undertriaged patients. There was a trend towards
decreased mortality among patients triaged to a trauma center at 7 days and 30 days.
Conclusions: Undertriage and transfer after major trauma are associated with substantial
increase in mortality compared to direct transport to a trauma center. These data suggest a need
to design strategies to improve access to trauma center care in Ontario.

iv
Acknowledgments
A work of this breadth could not have been completed without the guidance and expertise of the
members of my thesis committee, Dr. Gordon Rubenfeld and Dr. Therese Stukel. I would also
like to express my sincere gratitude to my supervisor and mentor, Dr. Avery Nathens, for his
critical comments, guidance, and enduring support. Dr. David Gomez deserves special thanks,
both for his insightful suggestions and technical help, as well as for his wonderful friendship
over the past four years. I would also like to acknowledge the work and support of Brandon
Zagorski at the Institute for Clinical Evaluative Sciences.
While I was completing this work, Dr. Lakhbir Sandhu has not only been a friend, but also
provided expert reviews for multiple iterations of all of my manuscripts and grants. My friends
Dr. Stuart Reynolds, Dr. Anna Shawyer, Dr. Sarah Schwartz, and Dr. Vanessa Palter also
deserve thanks for their support during my graduate studies. Finally, my family has supported me
throughout my medical training, and I would like to express my appreciation for their ongoing
encouragement.

v
Funding
This research was generously supported by the Division of General Surgery, Department of
Surgery at the University of Toronto, the Johnson & Johnson Medical Products/Surgeon Scientist
Program fellowship and by the Fellowship program of the Canadian Institutes of Health Research.
This work was also supported in part by funds from a Canada Research Chair Program and a
Canadian Institutes of Health Research Team Grant in Trauma System Development.
In addition, this study was supported by the Institute for Clinical Evaluative Sciences, which
is funded by an annual grant from the Ontario Ministry of Health and Long-Term Care. The opinions,
results and conclusions reported in this paper are those of the author and are independent from the
funding sources. No endorsement by the Canadian Institutes of Health Research, the Institute for
Clinical Evaluative Sciences or the Ontario Ministry of Health and Long-Term Care is intended or
should be inferred. The author has no other financial disclosures or any conflict of interest to declare.
vi
Table of Contents
Acknowledgments ..................................................................................................................... iv
Funding ...................................................................................................................................... v
Table of Contents ...................................................................................................................... vi
List of Abbreviations .................................................................................................................. x
List of Tables ........................................................................................................................... xii
List of Figures ......................................................................................................................... xiv
List of Appendices.................................................................................................................... xv
Chapter 1 Literature Review ....................................................................................................... 1
1.1 Traumatic injury: a global epidemic ................................................................................ 1
1.2 The burden of traumatic injury in Canada and in Ontario ................................................ 2
1.3 The public health approach to injury ............................................................................... 3
1.4 Organized systems of trauma care ................................................................................... 5
1.4.1 The history of organized systems of trauma care ................................................. 5
1.4.2 Trauma center accreditation guidelines ................................................................ 8
1.4.3 Pre-hospital triage guidelines ............................................................................. 13
1.4.4 Trauma system organization .............................................................................. 17
1.5 Evidence regarding the relationship between injury mortality and type of care
received ........................................................................................................................ 21
1.5.1 Evidence regarding the relationship between injury mortality and trauma
center care ......................................................................................................... 22
1.5.2 Evidence regarding the benefits of organized systems of trauma care ................ 26
1.5.3 Evidence regarding the relationship between injury mortality and trauma
system configuration ......................................................................................... 30
1.6 Inequities in access to trauma center care ...................................................................... 32
1.7 Trauma system configuration in Ontario ....................................................................... 34
vii
1.8 Limitations of Ontario’s trauma system......................................................................... 38
1.9 Tables for Chapter 1...................................................................................................... 40
1.10 Figures for Chapter 1 .................................................................................................... 42
Chapter 2 Research Aims and Hypothesis ................................................................................. 44
2.1. Rationale ...................................................................................................................... 44
2.2. Hypothesis .................................................................................................................... 45
2.3. Research Aims .............................................................................................................. 46
Chapter 3 General Methods ...................................................................................................... 47
3.1. Overview ...................................................................................................................... 47
3.2. Data sources ................................................................................................................. 47
3.2.1. Administrative databases ................................................................................... 47
3.2.2. Clinical registries .............................................................................................. 49
3.2.3. Data validation .................................................................................................. 50
3.3. Tables for Chapter 3...................................................................................................... 54
Chapter 4 Development and validation of an ICD-10 to Injury Severity Score crosswalk.......... 56
4.1. Summary ...................................................................................................................... 56
4.2. Introduction .................................................................................................................. 57
4.3. Methods ........................................................................................................................ 59
4.4. Results .......................................................................................................................... 62
4.5. Discussion .................................................................................................................... 65
4.6. Tables for Chapter 4...................................................................................................... 68
Chapter 5 Evaluation of the mortality associated with transfer to trauma center care ................. 73
5.1. Summary ...................................................................................................................... 73
5.2. Background .................................................................................................................. 74
5.3. Methods ........................................................................................................................ 76
viii
5.4. Results .......................................................................................................................... 81
5.5. Discussion .................................................................................................................... 83
5.6. Tables for Chapter 5...................................................................................................... 87
5.7. Figures for Chapter 5 .................................................................................................... 90
Chapter 6 A population-based analysis of the mortality associated with undertriage in Ontario . 93
6.1. Summary ...................................................................................................................... 93
6.2. Introduction .................................................................................................................. 94
6.3. Methods ........................................................................................................................ 95
6.4. Results .......................................................................................................................... 99
6.5. Discussion ...................................................................................................................101
6.6. Tables for Chapter 6.....................................................................................................106
6.7. Figures for Chapter 6 ...................................................................................................110
Chapter 7 General Discussion ..................................................................................................112
7.1. Conclusions .................................................................................................................112
7.2. Limitations ..................................................................................................................114
7.2.1. Limitations of available data .............................................................................114
7.2.2. Limitations of data analysis ..............................................................................117
7.2.3. Limitations of external generalizability.............................................................119
7.3. Implications .................................................................................................................120
Chapter 8 Future directions for research ..................................................................................122
8.1. Ongoing evaluation of undertriage in Ontario ..............................................................122
8.2. Evaluation of field trauma triage protocols in Ontario ..................................................123
8.3. Evaluation of the transfer process in Ontario’s trauma system ......................................123
8.4. Evaluation of long term outcomes among severely injured patients in Ontario .............125
References ...............................................................................................................................126

ix
Appendix A .............................................................................................................................144
Appendix B .............................................................................................................................145
x
List of Abbreviations
AAAM – Association for the Advancement of Automotive Medicine
AIS – Abbreviated Injury Scale
ACS COT – American College of Surgeons Committee on Trauma
CI – Confidence interval
CIHI – Canadian Institute for Health Information
DAD – Discharge Abstract Database
DALY - Disability-Adjusted Life Year
ICC – Intraclass Correlation Coefficient
ICES – Institute for Clinical Evaluative Sciences
ISS – Injury Severity Score
ICD – International Classification of Diseases
ICD-9 – Ninth Revision of the International Classification of Diseases
ICD-CM-9 – Clinical Modification of the Ninth Revision of the International Classification of
Diseases
ICD-10 – Tenth Revision of the International Classification of Diseases
IKN – ICES Key Number

xi
LTH – Lead Trauma Hospital
MOHLTC – Ministry of Health and Long-term Care
NACRS – National Ambulatory Care Reporting System
NSCOT – National Study on the Costs and Outcomes of Trauma
OR – Odds ratio
OTR DDS – Ontario Trauma Registry Death Data Set
OTR CDS – Ontario Trauma Registry, Comprehensive Data Set
REB – Research Ethics Board
RPDB – Registered Persons Database
TTL – Trauma Team Leader
WHO – World Health Organization
xii
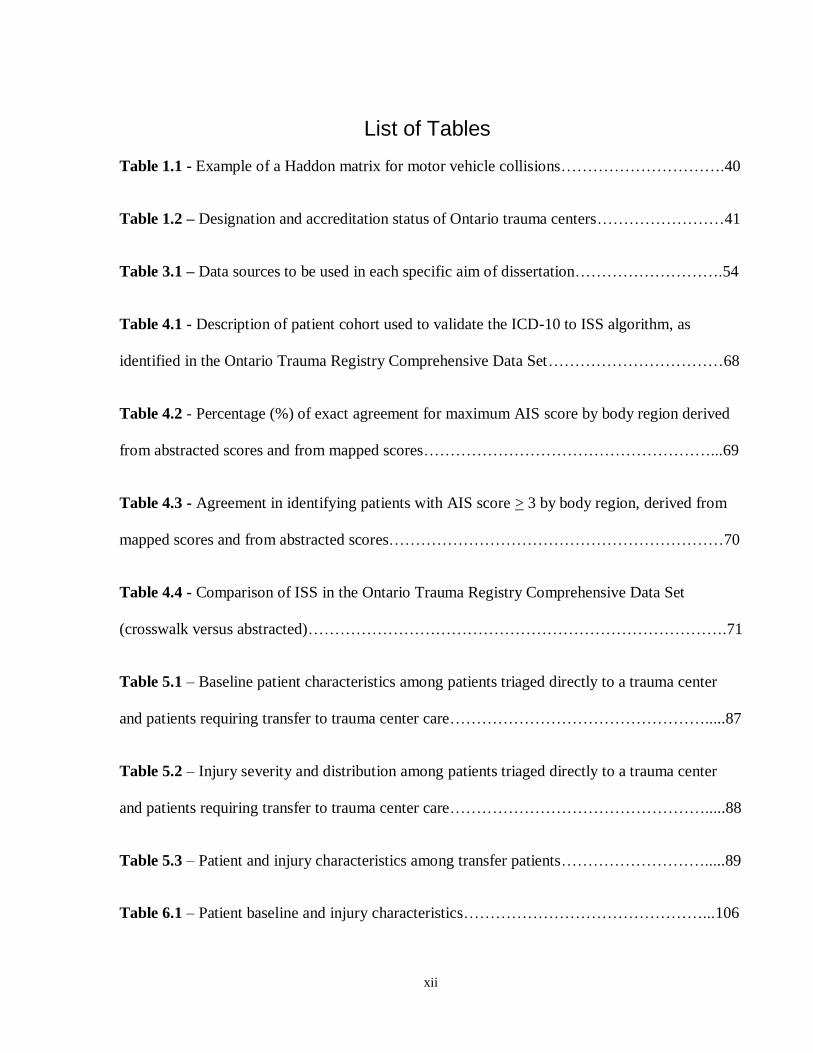
List of Tables
Table 1.1 - Example of a Haddon matrix for motor vehicle collisions………………………….40
Table 1.2 – Designation and accreditation status of Ontario trauma centers……………………41
Table 3.1 – Data sources to be used in each specific aim of dissertation……………………….54
Table 4.1 - Description of patient cohort used to validate the ICD-10 to ISS algorithm, as
identified in the Ontario Trauma Registry Comprehensive Data Set……………………………68
Table 4.2 - Percentage (%) of exact agreement for maximum AIS score by body region derived
from abstracted scores and from mapped scores………………………………………………...69
Table 4.3 - Agreement in identifying patients with AIS score > 3 by body region, derived from
mapped scores and from abstracted scores………………………………………………………70
Table 4.4 - Comparison of ISS in the Ontario Trauma Registry Comprehensive Data Set
(crosswalk versus abstracted)…………………………………………………………………….71
Table 5.1 – Baseline patient characteristics among patients triaged directly to a trauma center
and patients requiring transfer to trauma center care………………………………………….....87
Table 5.2 – Injury severity and distribution among patients triaged directly to a trauma center
and patients requiring transfer to trauma center care………………………………………….....88
Table 5.3 – Patient and injury characteristics among transfer patients……………………….....89
Table 6.1 – Patient baseline and injury characteristics………………………………………...106

xiii
Table 6.2 – Unadjusted mortality among severely injured motor vehicle collisions
occupants………………………………………………………………………………………..107
Table 6.3 – Patient characteristics across quartiles of county-level trauma center transport
rate………………………………………………………………………………………………108
xiv
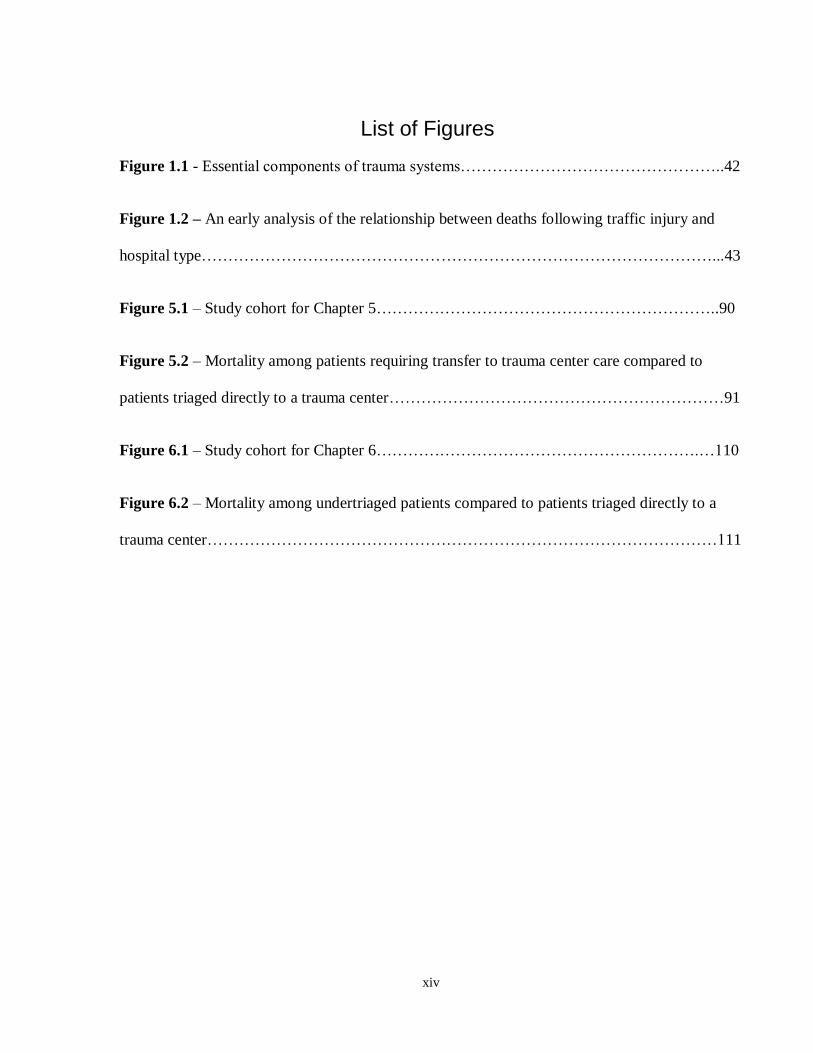
List of Figures
Figure 1.1 - Essential components of trauma systems…………………………………………..42
Figure 1.2 – An early analysis of the relationship between deaths following traffic injury and
hospital type……………………………………………………………………………………...43
Figure 5.1 – Study cohort for Chapter 5………………………………………………………..90
Figure 5.2 – Mortality among patients requiring transfer to trauma center care compared to
patients triaged directly to a trauma center………………………………………………………91
Figure 6.1 – Study cohort for Chapter 6…………………………………………………….…110
Figure 6.2 – Mortality among undertriaged patients compared to patients triaged directly to a
trauma center……………………………………………………………………………………111

xv
List of Appendices
Appendix A - Translation of Abbreviated Injury Scale body regions into Injury Severity Score
body regions…………………………………………………………………………………….144
Appendix B - External Cause of Injury Mortality Matrix for ICD-10…………………………145
1
Chapter 1 Literature Review
1.1 Traumatic injury: a global epidemic
Injury represents a major cause of death both in developed countries and in
underdeveloped countries, and the proportion of deaths attributable to injury worldwide is
increasing. In 2002, the World Health Organization (WHO) published a report on injury based
on data derived from the Global Burden of Disease 2000 database, the most comprehensive
source of data regarding global morbidity and mortality currently available1. This report
identified that injury was the leading cause of death and disability worldwide for all age groups
below the age 60. The leading causes of injury-related deaths identified in this report were road
traffic injuries (1,259,838 deaths in the year 2000) and self-inflicted injuries (814,778 deaths in
the year 2000). When disability and death were examined together, road traffic injuries were the
9th
leading cause of disability-adjusted life years (DALYs) lost, and accounted for 41,234,097
DALYs. In addition to a direct effect on the health of individuals, injury has a significant, global
economic impact. For example, road traffic injuries alone are estimated to result in global losses
of US$ 518 billion annually and to cost governments up to 5% of their gross national product2. It
is evident that injury control is an important global public health priority.
There have been important changes in the causes of injuries on a global level over the
past two decades. Specifically, compared to previous reports, the 2002 WHO report
demonstrated a significant decrease in the frequency of injuries due to war or large-scale
conflict. In 1994, war was the 13the most frequent cause of death among children aged 0 to 4,
and the 6th most frequent cause of death among individuals aged 5-44
3. In contrast, in 2000, war
was no longer among the fifteen most important causes of death among children aged less than 5.
2
Among individuals aged 5 to 14 and those aged 30 to 44, war as a cause of death also became
significantly less frequent1. In contrast, road traffic injuries have increased significantly.
Although, in 2004, road traffic injuries accounted for 2.4% of all deaths worldwide, it is
anticipated that this figure will rise to 3.6% by 2030, resulting in road traffic injuries becoming
the 5th leading cause of death worldwide
4. These changes in patterns and frequency of injuries
have important implications for public health policy and prevention strategies.
1.2 The burden of traumatic injury in Canada and in Ontario
As on a global level, the social costs of injury in Canada are enormous. Injury is the
leading cause of death in Canada for individuals aged between 1 and 44, and the fourth leading
cause of death overall5. Approximately 13,500 deaths occur due to injury in Canada every year;
there are 42 injury-related deaths per 100,000 Canadians annually6. In addition to deaths, in
2004, injury resulted in approximately 211,768 hospitalizations in Canada7. Overall, injury
resulted in 97.14 hospitalizations per 100,000 Canadians.
The economic cost of injury in Canada is also significant. Because of the relatively young
age of a large proportion of injured individuals, injury results in significant economic losses. The
annual cost of injury in Canada has been estimated at $19.8 billion6. This estimate includes both
direct costs (i.e. health care costs arising from injuries) and indirect costs (i.e. costs related to
reduced productivity from hospitalization, disability, and premature death). Approximately 46%
of injury-related costs are indirect in nature6.
In 2004, in Ontario, 4,643 patients died as a result of injury and 71,727 were
hospitalized6. Injuries account for approximately 6% of all hospitalizations
8. In addition, injuries
result in over one million emergency department visits in Ontario on an annual basis - one
3
quarter of all emergency department visits8. The direct costs of injury in Ontario in 2004 were
$3.7 billion, and the total costs were estimated at $6.8 billion6. Strategies which could reduce the
burden and costs of injuries in Canada and in Ontario are required.
1.3 The public health approach to injury
Given the enormous social and economic impact of injury, identifying interventions to
reduce the incidence and consequences of injury is imperative. The most common conceptual
framework used in injury control is the Haddon Matrix. Prior to the introduction of Haddon’s
approach, injuries were studied using a “descriptive” approach, which views them purely as
“accidents.” The Haddon Matrix, which was introduced by William Haddon in 1970, examines
injury through a public health perspective, and represents the key to understanding current efforts
in trauma health services research9.
Haddon noted that “widely believed folklore notwithstanding, all known injury
distributions are highly nonrandom in time, place, and person, just as one would expect from the
nonrandomness of their causes”10
. His framework divided injury events into three phases (pre-
event, event and post-event), which correspondingly offers the opportunity to identify strategies
for primary, secondary and tertiary prevention. In addition, at each phase, the causes of injury are
understood through a classic host-agent-environment framework, allowing further opportunities
to implement prevention or harm reduction strategies (Table 1.1). The agent of injury in
Haddon’s framework is the exchange of energy – the necessary agent for injury to occur10
. This
agent is carried by the vector or vehicle of injury, the specific means by which the injury occurs.
The vehicle or vector of injury may be a vehicle in the case of a collision, a tall building in the
case of a fall, or another individual in the case of inter-personal violence. Finally, the host of
injury is the victim of the injury itself.
4
Haddon’s approach suggests that efforts to reduce injuries may be effective at any of the
three phases of injury. Additionally, his approach suggests that, rather than changing the “host”
(i.e. patient behaviour), injury and its effects can be reduced by modifying the agent/vector or the
environment itself. As Haddon himself emphasized, “with injuries, as with various other
pathological conditions long since brought under control, this preference for emphasizing the
individual typically results in blame being placed on the victim. As a result, it is argued that
measures directed elsewhere and the idea that a responsibility exists to employ them deserve no
consideration.”10
The Haddon matrix, which emphasizes that important opportunities exist to
modify the risk of injury outside of the victim’s behavior, represents a fundamental departure
from this view. Installing airbags (modifying the vector), reducing speed limits (modifying the
environment) and other public health initiatives can therefore be understood to directly
correspond to Haddon’s approach.
In addition to shifting the model of injury from one focused on individual behavior
towards one based on an interaction of behavior and environment, the Haddon matrix is relevant
to the present discussion also due to its emphasis on tertiary prevention. While prevention of the
injury through primary or secondary prevention is preferable, mitigating the consequences of
injury once it has occurred is a key component of the Haddon approach: “Once appreciable
injury to man or to other living structure occurs, complete elimination of undesirable end results
is often impossible, though appreciable reduction is commonly achievable.”9 In the case of
injury, tertiary prevention can be achieved by ensuring the injured individual has adequate access
to appropriate care. Ideally, such care would reduce the morbidity or mortality associated with
the injury and, by extension, reduce the personal and economic costs of injury on the injured
individual and on society as a whole.
5
Tertiary prevention following injury is the focus of the present thesis. In this dissertation,
we will present evidence that strongly suggests that outcomes following severe injury are highly
modifiable with appropriate care. This dissertation will focus on the question of what constitutes
appropriate care following severe injury, as well as the effects of this care on outcomes following
severe injury.
1.4 Organized systems of trauma care
Post-injury care can be divided into three distinct phases: prehospital care, acute care, and
post-acute (rehabilitation) care. In most jurisdictions in North America, this post-injury care has
been integrated, at least to some degree, into a single organized system of care for the injured
patient: a trauma system. Although trauma systems vary significantly in structures and processes,
they share a common objective: rapidly identifying severely injured patients and ensuring that
they reach appropriate care.
1.4.1 The history of organized systems of trauma care
Modern civilian trauma systems are modeled on military trauma systems that evolved
during the first two thirds of the 20th century
11, 12. The principle of triage (sorting patients based
on perceived severity of injury) is clearly derived from military practice. In addition, during the
major conflicts of the 20th century, a number of innovations were introduced in the military
setting that proved critical to reducing military deaths. These innovations included rapid
evacuation, bypass of non-equipped facilities and regionalization of care; the translation of these
innovations into civilian practice resulted in the modern trauma system.
At the onset of World War II, care for injured soldiers was provided in large, fixed field
hospitals located at airfields and other locations convenient for evacuating soldiers out of the
6
combat zone13
. During the war, however, it became evident that the delays associated with
transporting soldiers to these field hospitals were causing unnecessary mortality. The military
shifted its approach to developing forward medical units, which were able to provide life-saving
care close to the frontlines13
. These changes in organization were highly successful, and led to
shorter evacuation times, earlier resuscitation and reduced mortality13
.
The principle of providing medical and surgical care in a rapid manner and close to the
conflict zone was further developed during the Korean War. During that conflict, frontline
medical units (known as mobile auxiliary surgical hospitals, or MASH) were supplemented with
helicopter evacuation11
. Furthermore, when it was observed that a significant number of deaths
were occurring at “battalion aide stations,” directly in conflict zones, staffing practices at these
stations were modified to ensure the presence of personnel capable of performing life-saving
interventions like tourniquets and chest tubes13
. The American military’s emphasis on early
management and rapid evacuation to definitive care further progressed during the Vietnam
conflict. For example, during the military conflict in Vietnam, human and physical resources
were distributed in such a way as to ensure that soldiers were constantly within 35 minutes of a
medical facility capable of providing definitive trauma care14
. The gradual innovations that
occurred in military medicine over the course of the 20th century were associated with significant
reductions in military mortality. Whereas field casualty rates remained relatively stable from
World War I to the Vietnam War, post-evacuation mortality rates fell from 8.5% to 3.6%13
.
Following the Korean and Vietnam wars, it became evident that standards of civilian
trauma care lagged far behind what was available to injured soldiers of the era15
. In 1966, the
National Academy of Sciences published a report titled “Accidental Death and Disability: The
Neglected Disease of Modern Society.” The report highlighted the magnitude of the civilian
7
trauma problem, and the preventable nature of many of these deaths. In addition, the report
examined the resources in place for the injured patient, which were extremely minimal. As one
of the report authors recalled, “[t]he only requirement for an ambulance in the 1950s was that the
vehicle permit the patient to lie down. There were then 12,000 ambulance services in the United
States, 50% of which were run by morticians. One could almost imagine a conflict of interest.”16
.
The report also highlighted the inadequacy of hospital care for the injured; patients were simply
transported to the closest hospital, where the emergency department might be closed or
inadequately staffed12, 16
.
The publication of the National Academy of Sciences report on injury, along with the
influx of medical personnel from theatres of war, led to “an avalanche of remedial action.”17
In
1966, the federal government enacted the Highway Safety Act, which gave the Department of
Transportation the authority to set standards for highway safety programs. Among these highway
safety programs was one that required states to set specific standards for ambulance programs17
.
By 1971, injury related initiatives were also introduced by a variety of other governmental and
non-governmental organizations, including the National Institutes of Health, the American
Medical Association, the National Academy of Sciences and the United States Public Health
Service17
. New initiatives were also accompanied by dedicated federal and state funding to
study, prevent and treat injury.
A large number of initiatives were also introduced by the American College of Surgeons
Committee on Trauma (ACS COT), an organization which has since become a guiding force in
trauma system organization throughout North America. Among the Committee’s activities were
the publication of “Standards for Emergency Ambulance Services” in 1967, as well as
“Guidelines for Design and Function of a Hospital Emergency Department” in 197017
. In 1976,
8
the Committee on Trauma published the report entitled “Optimal Resources for the Care of the
Seriously Injured,” in the American College of Surgeons Bulletin12
. The report clearly outlined
the resources required by centers dedicated to the care of injured patients, and described a
program of external verification for these centers. These dedicated centers have come to be
known as trauma centers.
1.4.2 Trauma center accreditation guidelines
Trauma centers are the central component of any trauma system. These hospitals have
been identified as having the specialized resources required to manage injured patients. Trauma
centers are identified through two separate processes: designation and
accreditation/verification18, 19
. Centers can be designated by regional, state or provincial health
authorities, as part of governmental plan for the management of injured patients in the
authority’s jurisdiction. In contrast, accreditation or verification can be conducted by either a
governmental or non-governmental agency. Unlike designation, the accreditation or verification
process involves visits to the institution by delegates, and an evaluation of the center’s resources
and programs based on strict criteria. Trauma centers can therefore be designated,
accredited/verified or both.
Existing trauma designation and accreditation schemes recognize that institutions have
different resource levels, and therefore differ in their capabilities with regards to managing
injured patients. Trauma centers are categorized into “levels” from I to V based on their
resources and capabilities. Broadly speaking, level I and level II centers are equipped to provide
definitive management to severely injured patients. Lower level (level III, IV and V) centers
provide preliminary care to severely injured patients, and definitive care to patients with less
severe injuries.
9
Since their inception in 1976, the trauma center classification guidelines used by the ACS
COT have provided the basic framework for trauma center designation in North America. They
are similar to those published by the Trauma Association of Canada (TAC) and are also the
guidelines most commonly used to classify trauma centers in the trauma systems research
literature.
In Canada, trauma center accreditation is performed by TAC. TAC developed its first
trauma center accreditation standards in 199320
. According to TAC, it is the responsibility of
individual health authorities to designate an appropriate number of trauma centers based on the
provincial population, and to organize the trauma system based on the provincial trauma plan19
.
TAC has been conducting external verification of designated trauma centers since 1995 and,
since 2007, has adopted the level I, II, III, IV and V classification scheme across Canada21
. At
the time of the publication of this dissertation, the TAC accreditation guidelines were undergoing
revision. However, the standard process for TAC accreditation during the time period of the data
described in this dissertation is available from previously published guidelines19
.
The ACS COT and TAC trauma center accreditation guidelines are closely related, and
share many similar elements. Highlights from the ACS COT and TAC accreditation guidelines
are presented below18,19
.
Level I centers
Level I centers are a regional resource capable of providing the highest level of care to
the severely injured patient. In addition, Level I centers hold a leadership role in the regional
trauma system, both clinically and academically. Level I centers must maintain a high annual
volume of trauma admissions; volume criteria differ somewhat across ACS COT and TAC
10
guidelines. According to ACS COT guidelines, the level I center must treat one of: 1,200 trauma
patients annually, 240 patients with severe injury or 35 patients with severe injury per trauma
surgeon. In contrast, TAC guidelines suggest that level I centers should treat at least 400 patients
with severe injury, and preferably 650 such patients, annually. Additionally, according to TAC
guidelines, level I centers should treat at least 1000 trauma patients annually.
Both in Canada and in the United States, Level I centers must maintain 24-hour
availability of the key personnel needed for the immediate resuscitation and management of the
severely injured patient. These personnel must include representatives from trauma surgery,
emergency medicine, orthopedic surgery, neurosurgery and anesthesia. A level I center must
have quaternary care services, such as a plastic surgery program and spinal injury management
capabilities. To complement these services, operating rooms and radiology resources must be
adequately staffed and immediately available. In addition, a level I center must maintain a
surgically directed trauma service and a trauma team, and participate in the education and
training of residents. Finally, the level I center must demonstrate regional leadership within the
trauma system by means of outreach and education programmes, trauma research and injury
prevention programmes. The level I center must also maintain a quality improvement
programme and contribute to the national trauma registry (National Trauma Data Bank or the
National Trauma Registry).
Level II centers
The ACS COT accreditation guidelines describe level II centers as functioning in two
distinct settings: 1) in urban areas, where the level II supplements the resources of the level I and
11
2) in less population dense areas, where the level II serves as the lead regional trauma center;
similar roles are described for level II centers in the TAC guidelines.
Like level I centers, level II centers are expected to provide definitive care to the most
severely injured patients; many of the guidelines for level I and level II centers are therefore
similar. However, unlike level I centers, level II centers do not have volume requirements,
although TAC guidelines stipulate that “[i]nstitutional caseload of Level II Centres should strive
to approximate those of Level I Centres”. In addition, level II centers are not required to maintain
specialized surgical services, such as microvascular surgery or spine surgery.
ACS COT and TAC guidelines differ subtly in regards to availability of certain human
and physical resources within the level II center. The ACS COT stipulates that level II centers
must have operating room resources available promptly after a patient’s arrival, but need not be
available immediately; in contrast, TAC guidelines require immediate availability of operating
rooms, even at level II centers. Similarly, according to ACS COT guidelines, radiology
technologists need not be in-house at level II centers; again, TAC guidelines require in-house
personnel in the radiology department. Resident training and a trauma research program are not
requirements for level II centers in either American or Canadian guidelines.
Level III centers
Level III centers are smaller regional centers that have the capability to provide initial
resuscitative care to severely injured patients. It is understood that these centers may need to
transfer the most severely injured patients to a level I or level II center, and they are therefore
required to have transfer agreements with nearby level I/II institutions. Continuous general
surgery coverage is considered the mainstay of the care offered by level III centers and, as at
12
level I and II centers, the general surgery-trained trauma surgeon is expected to provide care to
severely injured patients within 30 minutes of their arrival. However, other subspecialty
coverage may be limited at level III hospitals. For example, neurosurgery coverage is generally
limited or absent at level III centers, and orthopedic surgery services are typically highly variable
in their scope. As in level II centers, surgical staff must be involved in the provision of critical
care services, but 24-hour coverage by a physician in the intensive care unit is not required for
accreditation. As at centers of higher designation, injury prevention and local outreach
programmes are considered functions of the level III center, though to a lesser degree than
centers of a higher designation. For example, under the ACS COT guidelines, level III centers
are not required to have a designated injury prevention coordinator, do not have to provide
evidence of participation in regional or national prevention programmes, and their staff do not
have to participate in continued medical education programmes. Finally, level III centers are
expected to have an ongoing performance improvement programme and trauma registry.
Level IV centers and level V centers
Definitions of level IV/V centers differ markedly in the ACS COT and COT guidelines
American College of Surgeons Committee on Trauma guidelines
Level IV centers are hospitals located in rural areas that “supplement care within a larger
trauma system”18
. Although level IV centers are required to have 24-hour coverage by a
physician, subspecialty services (i.e. general surgery, other surgical specialties) may not be
available. Level V centers are not recognized by the ACS COT.
13
Trauma Association of Canada guidelines
TAC defines a level IV center as a hospital in an urban setting with a nearby major
trauma center. Level IV centers provide definitive care to less severely injured patients (largely
single system injuries), thereby decreasing the caseload of level I/II centers. Severely injured
patients are rapidly transferred to neighboring level I/II centers. In contrast, level V centers are
rural centers in areas with no immediate access to a major trauma center. Level V centers
provide initial resuscitation and stabilization prior to transferring patients to higher levels of care.
Level V centers may also admit a small number of patients with non-severe or non-complex
injuries.
Not all trauma systems have trauma centers at all five levels of designation. In fact,
individual trauma systems differ from each other significantly in terms of the number and types
of trauma centers they designate. As will be discussed in detail, these differences may have an
impact on the type of care patients receive, and on the outcomes these patients experience.
1.4.3 Pre-hospital triage guidelines
As outlined in the previous section, level I and level II trauma centers are equipped to
manage the most severely injured patient. However, trauma centers can only be effective within
a system that ensures severely injured patients are identified in the field and transported to the
appropriate facility. In addition, a system must be in place to ensure that patients with non-severe
injuries do not overwhelm the resources of level I and level II centers, and are managed at
centers with lower designation or at non-trauma centers. Finally, since 50% of deaths occur
within 1 hour of hospital presentation, the identification of severely injured patients in the
prehospital setting must occur in a rapid fashion22
. These three goals are accomplished through a
14
system of pre-hospital triage. As such, prehospital triage guidelines and bypass protocols have
become an essential element of the modern trauma system.
The 1976 version of the ACS COT report “Optimal Resources for the Care of the
Seriously Injured” did not specifically address preshopital triage. However, the ACS COT,
recognizing the importance of prehospital triage guidelines, soon developed a set of consensus
guidelines for the field triage of injured patients. The first version of these guidelines, known as
the Triage Decision Scheme, was published in the 1987 version of the “Optimal Resources for
the Care of the Seriously Injured” 23
. These guidelines have since undergone multiple revisions.
Most recently, in 2005, with support from the National Highway Traffic Safety
Administration, the United States Centers for Disease Control sponsored a revision of the
American College of Surgeons decision scheme by hosting a series of meetings of the National
Expert Panel on Field Triage. The Expert Panel reviewed currently available evidence regarding
the existing criteria for field triage, and made a number of recommendations based on this
evidence. These meetings resulted in the 2006 version of the ACS COT prehospital triage
decision scheme23
. The Decision Scheme continues to serve as the guide for field triage
protocols in the majority of emergency medical services across North America, and is the most
evidence-based approach to the field triage of severely injured patients.23
Although the ACS COT Decision Scheme often undergoes modification during regional
implementation, its fundamental structure is similar to that of prehospital triage guidelines used
in many jurisdictions. An understanding of the components of the Decision Scheme is therefore
useful to the understanding of the data that will be presented in this dissertation.
15
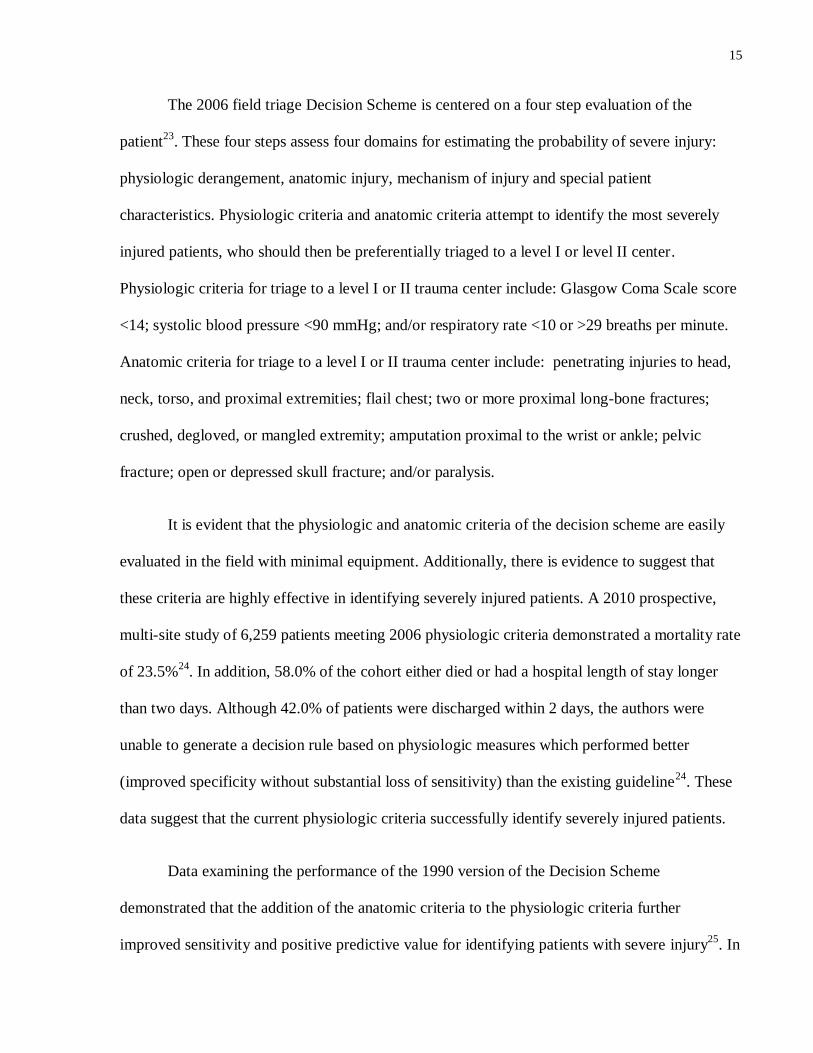
The 2006 field triage Decision Scheme is centered on a four step evaluation of the
patient23
. These four steps assess four domains for estimating the probability of severe injury:
physiologic derangement, anatomic injury, mechanism of injury and special patient
characteristics. Physiologic criteria and anatomic criteria attempt to identify the most severely
injured patients, who should then be preferentially triaged to a level I or level II center.
Physiologic criteria for triage to a level I or II trauma center include: Glasgow Coma Scale score
<14; systolic blood pressure <90 mmHg; and/or respiratory rate <10 or >29 breaths per minute.
Anatomic criteria for triage to a level I or II trauma center include: penetrating injuries to head,
neck, torso, and proximal extremities; flail chest; two or more proximal long-bone fractures;
crushed, degloved, or mangled extremity; amputation proximal to the wrist or ankle; pelvic
fracture; open or depressed skull fracture; and/or paralysis.
It is evident that the physiologic and anatomic criteria of the decision scheme are easily
evaluated in the field with minimal equipment. Additionally, there is evidence to suggest that
these criteria are highly effective in identifying severely injured patients. A 2010 prospective,
multi-site study of 6,259 patients meeting 2006 physiologic criteria demonstrated a mortality rate
of 23.5%24
. In addition, 58.0% of the cohort either died or had a hospital length of stay longer
than two days. Although 42.0% of patients were discharged within 2 days, the authors were
unable to generate a decision rule based on physiologic measures which performed better
(improved specificity without substantial loss of sensitivity) than the existing guideline24
. These
data suggest that the current physiologic criteria successfully identify severely injured patients.
Data examining the performance of the 1990 version of the Decision Scheme
demonstrated that the addition of the anatomic criteria to the physiologic criteria further
improved sensitivity and positive predictive value for identifying patients with severe injury25
. In
16
that study, physiologic criteria alone had a sensitivity of 70% and positive predictive value of
42% for severe injury; the addition of anatomic criteria increased the guidelines’ sensitivity to
80% (albeit at the cost of a decrease in their positive predictive value).
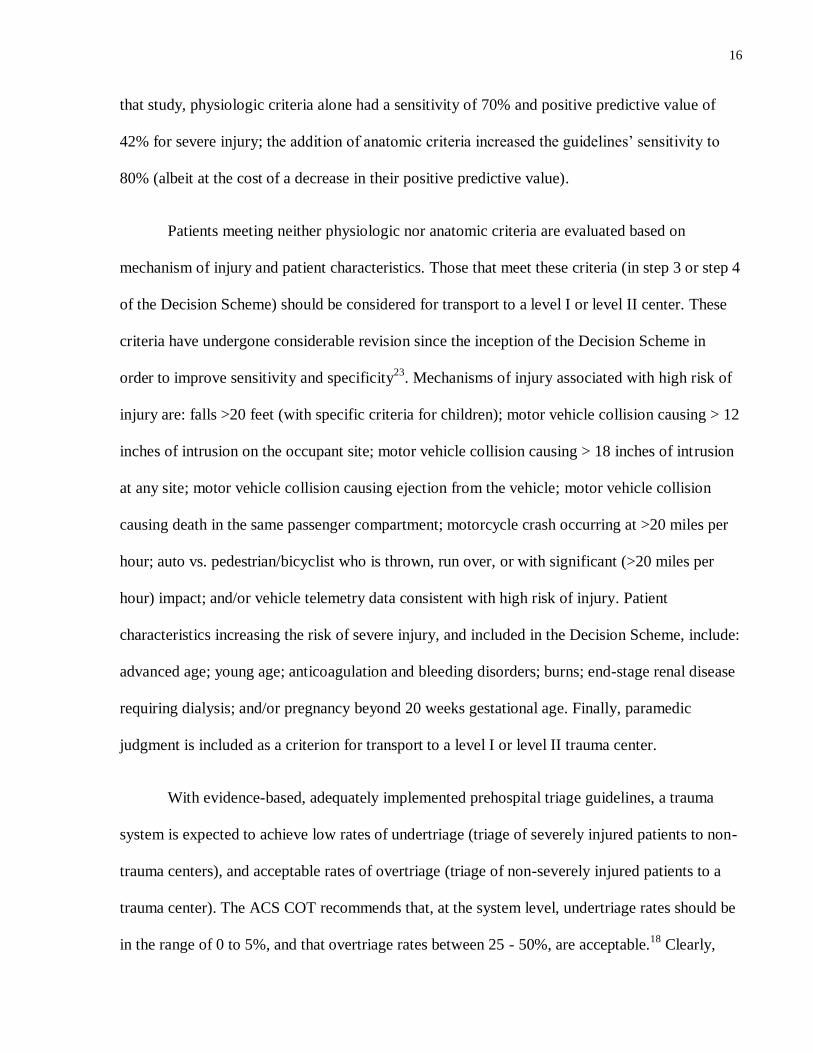
Patients meeting neither physiologic nor anatomic criteria are evaluated based on
mechanism of injury and patient characteristics. Those that meet these criteria (in step 3 or step 4
of the Decision Scheme) should be considered for transport to a level I or level II center. These
criteria have undergone considerable revision since the inception of the Decision Scheme in
order to improve sensitivity and specificity23
. Mechanisms of injury associated with high risk of
injury are: falls >20 feet (with specific criteria for children); motor vehicle collision causing > 12
inches of intrusion on the occupant site; motor vehicle collision causing > 18 inches of intrusion
at any site; motor vehicle collision causing ejection from the vehicle; motor vehicle collision
causing death in the same passenger compartment; motorcycle crash occurring at >20 miles per
hour; auto vs. pedestrian/bicyclist who is thrown, run over, or with significant (>20 miles per
hour) impact; and/or vehicle telemetry data consistent with high risk of injury. Patient
characteristics increasing the risk of severe injury, and included in the Decision Scheme, include:
advanced age; young age; anticoagulation and bleeding disorders; burns; end-stage renal disease
requiring dialysis; and/or pregnancy beyond 20 weeks gestational age. Finally, paramedic
judgment is included as a criterion for transport to a level I or level II trauma center.
With evidence-based, adequately implemented prehospital triage guidelines, a trauma
system is expected to achieve low rates of undertriage (triage of severely injured patients to non-
trauma centers), and acceptable rates of overtriage (triage of non-severely injured patients to a
trauma center). The ACS COT recommends that, at the system level, undertriage rates should be
in the range of 0 to 5%, and that overtriage rates between 25 - 50%, are acceptable.18
Clearly,
17
these suggested rates emphasize the paramount importance of ensuring that all severely injured
patients reach trauma center care, and acknowledge that high sensitivity of prehospital triage
criteria may lead to decreased specificity. Furthermore, these guidelines suggest that rates of
undertriage significantly above 5% represent an important opportunity for quality improvement
at the level of the trauma system.
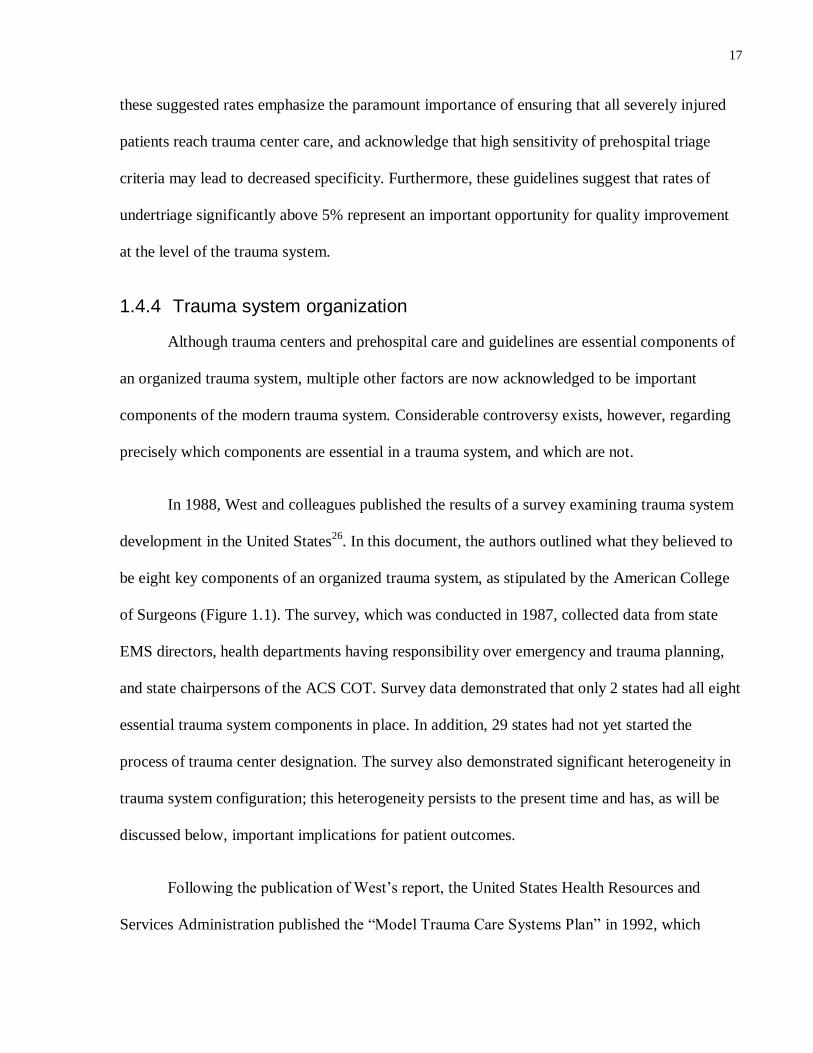
1.4.4 Trauma system organization
Although trauma centers and prehospital care and guidelines are essential components of
an organized trauma system, multiple other factors are now acknowledged to be important
components of the modern trauma system. Considerable controversy exists, however, regarding
precisely which components are essential in a trauma system, and which are not.
In 1988, West and colleagues published the results of a survey examining trauma system
development in the United States26
. In this document, the authors outlined what they believed to
be eight key components of an organized trauma system, as stipulated by the American College
of Surgeons (Figure 1.1). The survey, which was conducted in 1987, collected data from state
EMS directors, health departments having responsibility over emergency and trauma planning,
and state chairpersons of the ACS COT. Survey data demonstrated that only 2 states had all eight
essential trauma system components in place. In addition, 29 states had not yet started the
process of trauma center designation. The survey also demonstrated significant heterogeneity in
trauma system configuration; this heterogeneity persists to the present time and has, as will be
discussed below, important implications for patient outcomes.
Following the publication of West’s report, the United States Health Resources and
Services Administration published the “Model Trauma Care Systems Plan” in 1992, which
18
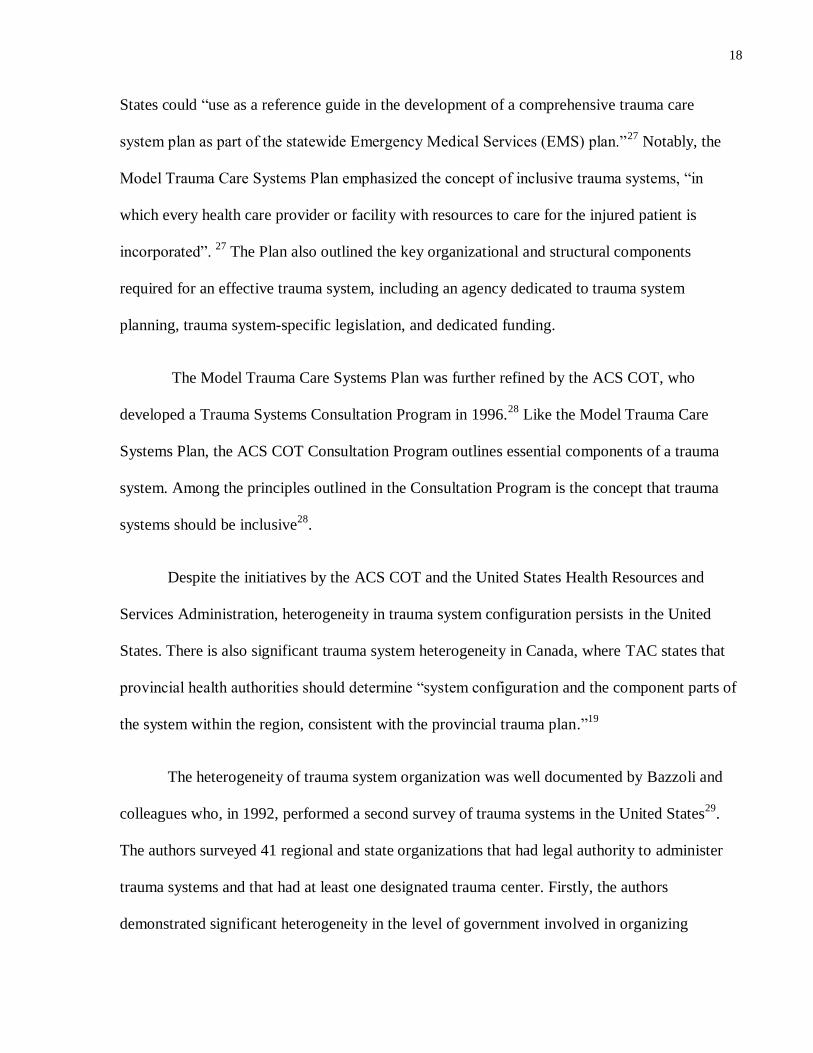
States could “use as a reference guide in the development of a comprehensive trauma care
system plan as part of the statewide Emergency Medical Services (EMS) plan.”27
Notably, the
Model Trauma Care Systems Plan emphasized the concept of inclusive trauma systems, “in
which every health care provider or facility with resources to care for the injured patient is
incorporated”. 27
The Plan also outlined the key organizational and structural components
required for an effective trauma system, including an agency dedicated to trauma system
planning, trauma system-specific legislation, and dedicated funding.
The Model Trauma Care Systems Plan was further refined by the ACS COT, who
developed a Trauma Systems Consultation Program in 1996.28
Like the Model Trauma Care
Systems Plan, the ACS COT Consultation Program outlines essential components of a trauma
system. Among the principles outlined in the Consultation Program is the concept that trauma
systems should be inclusive28
.
Despite the initiatives by the ACS COT and the United States Health Resources and
Services Administration, heterogeneity in trauma system configuration persists in the United
States. There is also significant trauma system heterogeneity in Canada, where TAC states that
provincial health authorities should determine “system configuration and the component parts of
the system within the region, consistent with the provincial trauma plan.”19
The heterogeneity of trauma system organization was well documented by Bazzoli and
colleagues who, in 1992, performed a second survey of trauma systems in the United States29
.
The authors surveyed 41 regional and state organizations that had legal authority to administer
trauma systems and that had at least one designated trauma center. Firstly, the authors
demonstrated significant heterogeneity in the level of government involved in organizing
19
individual trauma systems; trauma systems were organized at the county/ regional level or the
state level, through a combination of agencies at different levels of government and with the
occasional involvement of private agencies. In addition, Bazzoli and colleagues demonstrated
persistent variation in the implementation of the essential components of organized trauma
systems outlined by West et al. (Figure 1.1). In particular, few systems designated centers based
on need (i.e. any hospital meeting criteria could become a trauma center). Finally, although all
trauma systems had a formal method for designating trauma centers and all had standardized
prehospital triage protocols, the authors demonstrated that individual trauma systems differed
significantly from each other in terms of certain aspects of prehospital care (e.g. standardized
training program for EMS personnel, compliance assessment and involvement of medical
oversight), interfacility transfer (e.g. standardized interfacility transfer protocols and interfacility
transfer criteria) and ongoing system evaluation. The variations in system structure identified by
Bazzoli and colleagues suggest that the care provided to patients may vary significantly across
systems.
Variations in trauma system organization were also identified by the next inventory of
trauma center resources, which was published by Mackenzie and colleagues in 200330
. The
inventory was developed by the American Trauma Society’s Trauma Information Exchange
Program, with the objective of “establishing a national network of trauma centers to be used for
ongoing communication and collaboration among centers across state boundaries.” 30
In their
inventory, they identified that only 35 states and Washington D.C. had a formal trauma system at
the state level.
As in Bazzoli’s survey, Mackenzie’s inventory demonstrated that states continued to
differ significantly from each other in terms of the inclusivity of their trauma system. Whereas

20
24 states had not designated any level III, IV, or V trauma centers, six states had categorized all
or almost all acute care hospitals as trauma centers at some level. The other states with formal
trauma systems designated lower level centers to varying degrees. The authors concluded that
their data supported the need for significant improvements in access to trauma care in several
regions of the United States. The authors also advocated for the development of evidence-based
guidelines regarding the optimal number of level I and II trauma centers in a given population.
Finally, Mackenzie and colleagues concluded that more information regarding the role of lower
level centers within regional trauma systems was required.
Similar variations in trauma system structure described in Bazzoli and Mackenzie’s
reports exist in Canadian trauma systems. In a study sponsored by the Research Committee of
the Trauma Association of Canada, Hameed and colleagues reviewed access to trauma center
care across all Canadian provinces31
. Although their study focused primarily on trauma center
catchment areas, the authors did identify a number of variations in trauma system structure
across provinces. Firstly, while certain provincial trauma systems designate both level I/II
centers and lower level centers (British Columbia, Quebec), other provinces designate only a
small number of level I and level II centers, and do not integrate other hospitals into their trauma
system (Ontario). In addition, Hameed’s paper identified differences across trauma systems in
the availability of dedicated trauma program funding and in the presence of a trauma registry.
However, at the time of the writing of this dissertation, no study expressly focused on the
structures and processes of trauma systems across Canada has been conducted.
21
1.5 Evidence regarding the relationship between injury mortality and type of care received
Given the significant resources that have been invested in trauma centers and trauma
systems, evidence of their effectiveness is critical. Over the past five decades, considerable
evidence supporting a relationship between specialized injury care and reduced mortality has
been accrued. As trauma centers became established in the last quarter of the 20th century,
evidence linking trauma center care with improved patient outcomes has also accumulated. In
this section, we will review the evidence supporting specialized injury care and trauma center
care.
One of the earliest reviews of the care provided to injured patients is that published by
Zollinger in 195532
. Zollinger reviewed 9,050 emergency department visits that occurred at his
institution in 1953, with a particular focus on visits resulting from traffic injuries. Among the
724 visits for traffic injuries, one quarter resulted in admissions to hospital. Although Zollinger
did not directly examine the quality of care patients received, his report carefully documents
injury patterns and types of treatment received. As such, this report represents an early attempt to
categorize and evaluate the treatment of the injured patient.
In 1961, Van Wagoner published a review of 606 non-combat deaths among military
personnel33
. Van Wagoner reviewed patients’ injuries, and classified cases as having received
“adequate treatment”, “inadequate treatment” or “questionable” treatment. Van Wagoner
reported that only half of the patients included in his series received adequate treatment.
Although cases were reviewed by a single individual, and classification of treatment adequacy
was not based on rigorous criteria, Van Wagoner’s paper was one of the earliest to review the
22
quality of care administered to injured patients, and to identify potential opportunities for
improvement.
In 1972, a report on traffic injury-related deaths in Baltimore was the first to incorporate
hospital type into the authors’ analyses of preventable injuries34
. Among 33 deaths, the authors
reported “errors or inordinate delay in diagnosis” among 21 patients. Additionally, the authors
compared the distribution of all patients injured in traffic injuries (as well as DOAs) with the
distribution of traffic injury-related deaths across Baltimore’s 14 hospitals. They noted an
unusually low number of deaths from abdominal injuries at university-affiliated hospitals, and an
unusually high number of deaths from abdominal injuries at low volume hospitals (Figure 1.2).
Although the statistical analysis performed by the authors in 1972 would not meet reviewers’
standards at the time of the publication of this dissertation, the report by Gertner and colleagues
nevertheless represented an important step in evaluating the relationship between hospital type
and mortality following severe injury.
Between Wagoner’s study in 1961 and 1985, there were 26 additional articles published
which reviewed series of trauma deaths, and evaluated the preventability of these deaths35
. The
data used for these studies, methods of judging preventability and quality of these studies were
highly variable36
. However, the majority of these studies demonstrated that a high proportion of
trauma-related deaths could have been prevented with appropriate care. By the mid 1970’s, these
series began to explicitly examine the impact of trauma centers on patient outcomes.
1.5.1 Evidence regarding the relationship between injury mortality and trauma center care
One of the landmark papers examining the impact of trauma center care on patient
mortality was published in 1979 by West, Trunkey and Lim37
. West and colleagues examined
23
100 consecutive motor vehicle collision fatalities in two counties in California: San Francisco
County, where all patients were brought to a single trauma center, and Orange County, where
patients were brought to the closest receiving facility. Death certificates, coroners' reports, and
autopsy data were systematically reviewed in all cases, and a standard injury severity scoring
system used. Medical record data were only available in San Francisco County. The authors then
classified deaths as clearly preventable, potentially preventable, or not preventable, and achieved
consensus through discussion. Finally, deaths due to traumatic brain injury (TBI) were analyzed
separately from deaths due to other causes. The authors found that more than a third of non-TBI
deaths in Orange County were clearly preventable, and that the majority of patients who died a
preventable death died of hemorrhage amenable to surgical control. In San Francisco County,
only one non-TBI death was judged potentially preventable, and none was judged clearly
preventable. Among TBI-related deaths, the authors also identified a high rate of missed injury in
Orange County, but did not identify similar problems in San Francisco County. Clearly, the
paper by West and colleagues has significant limitations, including potentially biased
categorization of deaths as preventable and lack of access to medical records for Orange County
patients. Nevertheless, data published by West et al. suggested that regionalized trauma center
care might benefit patients. As the authors themselves noted, “Our data suggest that the San
Francisco County system, which includes a trauma center, works quite well, while the Orange
County system, which lacks a trauma center, does not.” 37
Hypothesizing that the presence of a trauma center would lead to decreased injury-related
mortality at the population level, Rutledge and colleagues examined county-level injury
hospitalization rates and mortality rates using a series of population-based databases in North
Carolina38
. They included county level geographic, patient and health system factors in their

24
analyses. Medical system factors that were examined included presence of a trauma center in the
county, type of emergency medical services, presence of 911 emergency access, number of
general surgeons, number of hospitals and mean time spent by ambulances at the scene of injury.
The only system factor that was significantly associated with the per-capita, in-hospital injury-
related mortality rate was the presence of a trauma center; the presence of a trauma center was
also associated with an overall reduction in injury-related mortality at the county level. Although
these findings added further support to the concept that trauma centers decrease injury-related
mortality, the analysis performed by Rutledge and colleagues was ecologic in nature (did not
examine patient level outcomes). As a result, they were unable to capture relevant patient-level
factors, such as age, mechanism of injury or injury severity, which affect injury mortality, might
have varied significantly across counties, and might have confounded the relationship between
injury mortality rates and the presence of a trauma center.
A follow-up study was conducted in Orange County after the implementation of a trauma
system in 198039
. As in the study by West, Trunkey and Lim, deaths due to motor vehicle
collisions were reviewed using autopsy data. Findings were compared to those from Orange
County prior to trauma system implementation, and to historical data from San Francisco
County. Whereas in the 1973 study by West et al., 79% of non-TBI deaths in Orange County
were preventable, after trauma system implementation, only 9% of deaths at Orange County
trauma centers were judged preventable. In contrast, 67% of deaths at Orange County non-
trauma centers were judged preventable. These data provided further support for the concept that
trauma center care, hand in hand with trauma system implementation, was associated with a
significant reduction in injury-related mortality.
25
In addition to the studies described, a number of other reviews of preventable deaths at
trauma centers and non-trauma centers have been published; these have largely demonstrated
lower preventable death rates at trauma centers compared to non-trauma centers, or in periods
with trauma systems compared to periods without trauma systems35, 36, 40, 41
. Although, given
their significant methodological limitations, panel studies would generally be considered weak
evidence, these data consistently point towards improved outcomes among severely injured
patients who receive trauma center care. In addition, in the 1980s and 1990s, several
retrospective cohort studies examining mortality rates at trauma centers and non-trauma centers
also identified reduced mortality at trauma centers42-45
. These retrospective studies had, however,
significant limitations: small sample size, highly selected patient mix (e.g. limited to patients
with femur fractures)42
, inadequate risk adjustment42-45
, and use of historical controls44, 45
.
The strongest evidence supporting the benefits of trauma center care comes from the
National Study on Costs and Outcomes of Trauma (NSCOT)46, 47
. NSCOT was conducted in 15
metropolitan regions in 14 states across the United States. Within each region, the authors
identified a representative sample of small, medium and large level 1 trauma centers and non-
trauma centers treating at least 25 patients with major trauma annually. Patients included in the
study were those patients aged 18 to 84 treated at a participating center for at least one moderate
to severe injury. Patients were identified through the review of discharge records and emergency
department logs. All deaths and a representative sample of patients discharged alive were
selected at each center, and a quota sampling strategy was used to ensure a balanced distribution
of young and elderly (age > 65) patients across trauma centers and non-trauma centers. Data
were collected through review of patients’ medical records, and patients were followed-up for up
to one year after discharge by means of medical record review and telephone interview.
26
Outcomes were weighted based on the composition of the study sample to a reference population
of over 15,000 patients.
The outcomes of NSCOT strongly support trauma center care for severely injured
patients. Compared to patients treated at a non-trauma center, patients treated at trauma centers
had a significantly lower relative risk of death at 30 days after injury (RR 0.76, 95% CI 0.58–
1.00) and at 1 year after injury (RR 0.75, 95% CI 0.60–0.95) 31
. The survival benefit observed at
trauma centers was, however, limited to younger patients (aged < 55) and those with more severe
injuries.
Although NSCOT offers strong evidence for the effectiveness of trauma center care, the
patients and hospitals represented in NSCOT may not necessarily provide an accurate estimate of
the benefit of trauma center care at the population or system level. Firstly, the non-trauma
centers included in NSCOT were, on average, larger and more resourced than the average
American or Canadian non-trauma center. On average, non-trauma centers included in NSCOT
had 207 acute care beds and 19 ICU beds; small rural non-trauma centers were not included in
the sample. In addition, many non-trauma centers included in NSCOT had trauma-specific
resources, such as a trauma director or a trauma team. These factors may have biased findings in
favour of non-trauma centers; it is possible the NSCOT underestimated the mortality-reduction
associated with trauma center care at the population level.
1.5.2 Evidence regarding the benefits of organized systems of trauma care
In addition to evaluating the specific relationship between trauma center care and patient
outcomes, numerous reports have examined the relationship between trauma system
implementation and mortality. Clearly, in some of the studies previously described, trauma
27
center designation and trauma system implementation occurred concurrently; therefore regions
or time periods with trauma centers also experienced improvements in trauma system structures
and processes36, 37, 39
. As a result, differences in patient outcome might have been due to trauma
center care, the presence of an organized trauma system, or both.
The state of the literature prior to the year 2000 regarding trauma system effectiveness is
best summarized by a systematic review performed in 1999 by Mann et al48
. Acknowledging that
trauma center designation is intimately related to trauma system implementation in the literature,
they reviewed data examining both trauma system effectiveness and trauma center effectiveness.
Overall, the authors concluded that published data was not of high quality. They identified three
main categories of evidence: panel studies, registry studies and population-based studies. As
previously described, panel studies evaluated preventable and non-preventable deaths prior to
trauma system implementation, after trauma system implementation or during both time periods.
These studies largely favoured trauma systems and trauma centers, but were generally highly
susceptible to bias. Mann and colleagues found that the majority included unblinded reviewers
from within the study area or center. Studies classified by Mann et al. as registry studies
examined outcomes in a single trauma center or trauma system against “expected” outcomes, as
derived from a historical data (usually the Major Trauma Outcomes Study)49
. Like the panel
studies, these data favoured trauma system or trauma center care. However, because “expected”
outcomes were derived from historical data, estimates of benefit did not account for general
improvements in medical care. Moreover, many studies utilized trauma registry data, which
captures only patients arriving at a trauma center50-53
. As a result, these data could not evaluate
the performance of a trauma system overall. The third category of evidence identified by Mann
et al. were population-based studies of trauma system effectiveness. These studies utilized

28
trauma registry data, prehospital data, discharge data, emergency department records or autopsy
data to evaluate the effect of trauma system implementation. Like the previous two categories of
studies, the studies identified by Mann et al. as “population-based” suffered from substantial
methodological limitations. Many studies did not appropriately risk adjust, studied a non-
representative sample of hospitals or compared contemporary data with historical data38, 54-57
.
Moreover, all identified population-based studies examined limited geographic regions, such as
several counties or a single state system. Finally, the findings of the population-based studies
identified by Mann and colleagues were highly inconsistent in regards to the benefit of trauma
system implementation.
The 1998 report by Mullins and colleagues, also identified in Mann’s review, provided
the strongest evidence of decreased mortality at the population level after trauma system
implementation58
. Mullins compared mortality in Washington state and Oregon during two time
periods. During the first time period, neither state had an organized trauma system, whereas
Oregon had implemented a trauma system during the second time period. Mullins and colleagues
hypothesized that mortality rates should preferentially decrease in Oregon if there was an
association between trauma system implementation and mortality rates. The authors found that,
although risk-adjusted in-hospital mortality did not differ across states when neither had a trauma
system, in-hospital mortality was significantly lower in Oregon compared to Washington after
Oregon implemented a trauma system.
A symposium of 92 clinicians, administrators and academics was held in 1998 to review
evidence regarding trauma system effectiveness accumulated in the review conducted by Mann
et al. As described, the pre-symposium literature review “produced no studies providing direct,
robust evidence regarding trauma system effectiveness.”59
Given this perceived lack of evidence,
29
symposium organizers used multiple surveys throughout the meeting to evaluate participants’
beliefs regarding trauma system effectiveness, the utility of various trauma system components
and the optimal organization of trauma systems. Based on the available evidence, symposium
participants concluded that trauma centers/systems have proven "effective" at reducing injury
mortality in urban areas and among the severely injured, but that they were only "somewhat
effective" when assessing rural regions. Participants also concluded that exclusive systems,
wherein patients are treated at a limited number of centers, were “highly desirable”. Finally,
panelists agreed that there was "weak" or "no" existing evidence that trauma centers/systems
benefit patients undergoing interhospital transfer patients; this finding is particularly relevant to
the work that will be presented in this thesis.
In 2000, Nathens and colleagues published two manuscripts examining the relationship
between trauma system implementation and injury-related mortality that overcame some of the
limitations associated with earlier literature on the subject60, 61
. In both studies, injury-related
mortality rates across all US states were analyzed in relation to the presence of a trauma system
in that state. At the time of data collection (1995), 22 states had a trauma system in place, and 18
were in the process of implementing one. States with trauma systems were found to have lower
mortality rates overall (Incidence rate ratio 0.91, 95% CI 0.89-0.92); in secondary analyses, this
mortality benefit was also observed among patients with unintentional injuries and injuries
caused by motor vehicle collisions61
. No mortality benefit was observed, however, among
patients with injuries caused by intentional injury.
In their second analysis, Nathens and colleagues further focused on rates of mortality
secondary to being an occupant in a motor vehicle collision60
. In this study, they examined the
relationship between time of trauma system implementation and mortality. Included in their
30
analyses as potential confounders were state-level factors that might modify driving behavior
and, therefore, motor vehicle collision-related mortality. These state-level factors included
legislation regarding speed limits and seat belt legislation. The authors identified that, between
1979 and 1995, motor vehicle collision mortality rates decreased by 22% in the United States.
States that implemented a trauma system had an 8% (95% CI, 5%-11%) greater reduction in
mortality rates than those states that did not. Finally, the authors demonstrated that trauma
system implementation had no effect on motor vehicle collision mortality in the first ten years of
system implementation. The findings of Nathens and colleagues in both of their analyses of
trauma system implementation provide strong evidence that trauma system implementation is
associated with reduced injury-related mortality. However, their data did not directly examine
the type of care patients received, nor the relationship between specific structures of care and
mortality. As will be presented below, many trauma systems face continued challenges in
ensuring patients within their jurisdictions reach appropriate trauma care. As such, the estimates
of Nathens et al. may actually be underestimates; mortality reduction may be larger in trauma
systems that more effectively ensure access to care. Furthermore, given that considerable
heterogeneity in trauma system organization has been documented, significant variations may
exist in the mortality reductions achieved by specific trauma system configurations.
1.5.3 Evidence regarding the relationship between injury mortality and trauma system configuration
As described earlier, Hameed, Mackenzie and Bazzoli identified differences across
trauma systems in terms of the number of hospitals participating in the trauma system, and their
designation. In general, these differences have led trauma systems to be broadly categorized as
inclusive and exclusive. An inclusive system refers to one in which a large proportion of
hospitals (or all hospitals) participate in the trauma system to the degree that their resources
31
allow. Such trauma systems generally designate a large number of trauma centers at a variety of
levels (I,II,III,IV,V). In contrast, exclusive systems are centered around a small number of
trauma centers with higher designation levels (I, II). Smaller hospitals do not participate in the
trauma system in a systematic fashion. As previously mentioned, inclusive systems are
advocated by United States Health Resources and Services Administration’s Model Trauma
Care Systems Plan and by the ACS COT Trauma Systems Consultation Program27, 28
. A
landmark paper published by Utter and colleagues provided important insight into how inclusive
trauma systems influence the processes of care offered to severely injured patients, as well as
patient mortality62
.
In their study, Utter and colleagues examined discharge data for severely injured adults
from 24 states62
. They categorized state trauma systems based on the proportion of all acute care
hospitals that were designated as trauma center at any level, and divided systems into tertiles of
“inclusivity”. Compared to exclusive system, the most inclusive systems were associated with
significantly decreased inpatient mortality following severe injury, adjusting for both patient and
system level factors (OR 0.77, 95% CI 0.60-0.99). However, there were no differences in the
proportion of severely injured patients treated at level I or level II centers across the tertiles of
inclusivity. These data suggest that the improved survival among severely injured patients
observed in inclusive systems is not the result of differences in triage patterns. Rather, the data
published by Utter and colleagues suggest that inclusive trauma systems may decrease patient
mortality by improving the care at smaller hospitals (which do not participate in the system in
exclusive systems) and by improving coordination of care throughout the system.
The study by Utter et al. has a number of important limitations. The study captures only
in-patient deaths; it is possible that a substantial number of deaths among severely injured
32
patients occur in the prehospital setting, in the emergency department or even following
discharge. In addition, the unadjusted rates of treatment at a regional (level I/II) center in Utter’s
study ranged from 65.7% in the most exclusive systems to 70.2% in the most inclusive systems.
It is possible that inclusive systems that do not achieve equally high rates of triage to a level I/II
center may not achieve equally good outcomes.
Following the publication of the report by Utter and colleagues, similar findings
regarding the mortality benefit of inclusive systems were reported by other groups63, 64
. However,
these later papers were limited in the regions studied63, 64
and relied on historical comparisons
within a single trauma system63
.
1.6 Inequities in access to trauma center care
Despite the evidence regarding the benefits of trauma center care, in many trauma systems,
access to trauma center care continues to be limited for many patients. Several groups have
attempted to examine the degree of undertriage (triage from the scene to a non-trauma center)
that exists at the regional and national level.
In their analysis of trauma center access in the United States, Nathens and colleagues used
hospital discharge records from 18 states to evaluate undertriage65
. Their data demonstrated that
more than a third of severely injured patients received definitive care at a non-trauma center.
This analysis, however, likely underestimates the degree of undertriage that existed in the states
studied. Firstly, because they used discharge records, the authors were unable to evaluate patients
who died in the emergency department prior to admission. Additionally, patients who were
undertriaged and subsequently transferred to a trauma center could not be captured, and were
potentially misclassified as having been transported to a trauma center from the scene. Finally,

33
Nathens and colleagues did not directly examine the relationship between undertriage and the
presence of a trauma center; it could be speculated that patients simply did not have a trauma
center within a reasonable distance from their location of injury.
It is evident that geographic barriers to trauma center care exist, particularly in rural
regions. In the United States, 15% of the population lives more than an hour from a designated
(level I-III) trauma center66
. In Canada, geographic information systems analyses have also been
used to examine geographic barriers to trauma center access. In the study by Hameed and
colleagues, 77.5% of Canadians lived within one hours of a trauma center (level I – III) by
ground travel. The proportion of individuals with potential access to a trauma center varied
considerably by province, however. Whereas up to 85% of Ontarians live within one hour of a
trauma center, only 40% of individuals living in Newfoundland and Labrador have similar
access31, 67
.
Although a predominant majority of individuals in the United States and Canada live
within one hour of a trauma center, it is clear that distance alone is not the only barrier faced by
patients in accessing trauma center care. A clear discrepancy exists between the proportion of
patients living within a reasonable transport distance of a trauma center and the proportion of
severely injured patients who receive care at such an institution.
Vassar and colleagues specifically sought to address whether care of severely injured
patients in non-trauma centers in their region (California) was due to physical barriers (excessive
distance) to a trauma center68
. Like Nathens et al., their analysis utilized discharge data; the
authors specifically focused on patients with severe injuries. Vassar et al. found that, between
1995 and 1997, only 56% of patients with injuries meeting criteria for trauma center care were
34
admitted at a trauma center. Moreover, although 81% of patients were located in a county with a
trauma center, only 68% of patients in such counties received care at a trauma center. Clearly,
the data published by Vassar and colleagues demonstrates that physical access to a trauma center
does not ensure adequate access to care. As in the analysis by Nathens, Vassar and colleagues
were unable to capture deaths in the emergency department, however; their data likely also
underestimate the extent of undertriage in their region. Moreover, Vassar and colleagues
considered level III centers equivalent to level I and level II centers, despite the significant
difference in resources and care offered at these centers. This assumption may have led to a
further overestimation of access to trauma center care in their region.
Hsia and colleagues reassessed access to trauma center care in California between 1999
and 2006; in their analysis, only level I or level II care was considered “trauma center care” for
severely injured patients. Overall, only 66% of patients received care at a trauma center. There
was a significant increase in trauma center utilization over time, however; by 2006, 71% of
patients with severe injuries were treated at a trauma center. As in Vassar’s analysis, residing in a
county with a trauma center increased the probability of trauma center care, but did not ensure
access. 82% of severely injured patients residing in a country with a trauma center received care
at such an institution, as compared to 31% of patients in a county without a trauma center.
1.7 Trauma system configuration in Ontario
Ontario is Canada’s most populous province. The Ontario trauma system serves a
population of 12 million living across an area of approximately 1 million square kilometers69
.
The majority of the population, however, live in urban areas; 88% of Ontario’s population lives
within either Census Metropolitan Areas (CMA) or Census Agglomerations (CA)70
. Eight-five
percent of the population resides within a one hour driving distance from a trauma center31
.

35
Acute care hospitals and trauma centers
In the early 1990s, the Ontario Ministry of Health and Long-Term Care (MOHLTC)
designated ten Lead Trauma Hospitals (LTH) to care for patients with severe traumatic injuries71
.
Today, in Ontario, there are two pediatric and nine adult LTH, which are integrated into the
Provincial Trauma Network; all are located in urban areas. Among the adult LTH, which are the
focus of this dissertation, eight are level I equivalent centers and one is a level II equivalent
center (Table 1.2)31
. Among these nine centers, seven are also accredited by TAC as level I
centers21
. All LTH have 24-hour Trauma Team Leader (TTL) coverage, have the clinical
resources outlined for level I/II centers by TAC accreditation guidelines and have full
neurosurgical coverage19, 31
. In addition, all have designated program funding, as well as a formal
trauma registry31
. Finally all Ontario LTH are accessible by rotary wing, and participate in a
rotary wing prehospital program31
. The MOHLTC provides each LTH with dedicated funding
for trauma program infrastructure (e.g. medical director, trauma coordinator, data analyst and
secretary) and for 24-hour coverage by a TTL71
. In addition, incremental funding is provided for
each additional major trauma case. Finally, the MOHLTC funds each institution to maintain a
trauma registry71
.
In addition to Ontario’s level I and level II trauma centers, there are over 150 additional
acute care hospitals in the province. These centers do not participate in the provincial trauma
system; in contrast to other provincial trauma systems, there are no level III, IV or V trauma
centers in Ontario31
. The care provided to injured patients at Ontario’s non-trauma centers is not
guided by provincial standards. Non-trauma centers are not required to have a trauma team or a
trauma transfer protocol, and emergency department personnel at non-trauma centers are not
36
required to have dedicated training in the preliminary care of the injured patient (Advanced
Trauma Life Support). As such, Ontario would be considered an exclusive trauma system62
.
Prehospital care
Land ambulance services in Ontario have been de-centralized, and administered at the
level of upper tier municipalities, since 200172, 73
. Costs of providing ambulance services are
shared equally between the municipalities and the provincial government. Although the
MOHLTC has established standards regarding qualifications of patient care providers, licensing
of ambulance services and other issues, there are no province-wide field trauma triage criteria.
Ontario has had a single air ambulance provider since 200574
. Originally known as the
Ontario Air Ambulance Services Co., the organization was renamed Ornge in 2006. Ornge
coordinates all fixed wing and rotary wing transports in the province. For injured patients, Ornge
provides both on-scene services and, when required, interfacility transfer services. In addition,
Ornge provides service by means of modified scene calls75
. Modified scene calls occur when
Ornge is dispatched to the scene of a severely injured patient, but local ambulance services have
initiated transport of the patient to a local hospital prior to the arrival of an Ornge aircraft. If,
upon arrival to the local hospital, it is apparent that the patient requires trauma center care, Ornge
is available to transfer the patient to a LTH. However, if resuscitative efforts are prolonged, or
involve radiological or other procedures, Ornge will only accept the patient for transfer after a
receiving institution is identified. In addition, if Ornge offers their services to the sending
physician at the site of a modified scene call, the sending physician can decline the offer of a
modified scene response.
37
Transfer and referral
Ontario has a central emergency referral service. Funded by the MOHLTC, CritiCall
provides a 24-hour emergency referral service throughout Ontario. By calling a central, toll-free
number, providers at any institution can request the transfer of a patient with needs that cannot
be met by the institution in which they are currently being cared for. CritiCall facilitates
physician to physician consultation regarding patient care and the need for transfer, helps
identify an institution capable of accepting the patient in transfer and aims to expedite the
transfer process. In the fiscal year of 2008-2009, CritiCall received 15,319 request for transfer,
and arranged for (or coordinated) transfer for 9,548 patients76
. The average time to a physician
response was 12 minutes. On average, trauma patients were accepted for transfer within 30
minutes of a request being made. The CritiCall system has, however, several limitations.
CritiCall only facilitates the identification of a receiving institution, but does not have the
mandate to require a specific provider or institution accept a patient. As a result, the transfer
process may be delayed while numerous transfer requests are made; on average, more than 10
calls are made to organize a single transfer, and 2 physicians contacted76
. In addition, CritiCall
does not directly organize the transportation resources required for transfer to be accomplished;
the mode of transport to be used is made individually by each sending provider. Attempts to
organize transportation resources can therefore potentially lead to significant delays.
Trauma system oversight
Oversight to Ontario’s trauma system is provided by the Provincial Trauma Network
(PTN). The PTN began in 1999 as an informal gathering of the medical directors and
coordinators from Ontario’s LTH71
, and was recognized by the MOHLTC in 2001 as an advisory
38
body to the Ministry. In addition to representatives from the LTH, the PTN currently includes
representatives from the Ontario Trauma Data Analysts Network, the Canadian Institute for
Health Information (CIHI), CritiCall and the Ontario Air Ambulance Program (Ornge)71
. The
PTN also receives funding from the MOHLTC.
1.8 Limitations of Ontario’s trauma system
In 2006, the MOHLTC established the Trauma Expert Panel, to “provide timely expert
advice on improving the access, quality, efficiency, safety and accountability of trauma services
in Ontario.”71
In their 2006 report, the Expert Panel concluded that “the way that Ontario
currently provides trauma care to adults and children needs to be improved to meet the
increasing demand for safe, high quality services.” 71
The Expert Panel made multiple
recommendations regarding changes to Ontario’s trauma system.
The Expert Panel noted that Ontario’s exclusive trauma system was not the optimal
configuration for Ontario’s needs; the urban location of all Ontario trauma centers could lead to
substantial challenges in access to care. The Expert Panel recommended the integration of
existing non-trauma centers into the existing trauma system, to the degree that each hospital’s
resources would allow71
. This integration would result in the classification of all Ontario acute
care hospitalizations according to the revised TAC Trauma System Accreditation Guidelines.
Prolonged transfer times were also identified as an ongoing impediment to high quality care.
Data available to the Expert Panel demonstrated that injured adults spent, on average, 5.4 hours
at a non-designated center prior to being transferred to a LTH. The Panel recommended that
target times for transfers be developed71
.
39
Limitations of Ontario’s trauma system are also evident from our previously published
data regarding access to trauma center care in the province. We have previously evaluated the
relationship between access to trauma center care and location of death following injury77
. In this
analysis, we utilized the Ontario Trauma Registry Death Data Set (OTR DDS) to identify all
trauma-related deaths in Ontario between 2002 and 2003. For each patient, location of death, as
derived from the OTR DDS, was analyzed in relation to the transport time to a trauma center
from the census subdivision in which the death occurred. Our data demonstrated that more than
half of injury-related deaths in Ontario occur in the prehospital setting; the proportion of deaths
occurring in the prehospital setting increased substantially (> 75%) in areas with limited access
to trauma center care. In addition, among patients who arrived alive to an emergency department,
those injured in a census subdivision more than an hour away from a trauma center were
substantially more likely to die in the emergency department, rather than after admission (OR
3.5, 95% CI 2.5 - 4.9). These data suggest that limited access to trauma center care exists in
Ontario. Moreover, the relationship between distance to a trauma center and death in the
emergency department (rather than in the operating room or intensive care unit) suggests that
lack of access to trauma center care is associated with significant delays in care and potentially
preventable deaths. However, this report did not provide a direct measure of triage to trauma
center care in Ontario, nor did it directly evaluate data regarding transfer practices or transfer
delays. Such data are currently not available in Ontario’s trauma system.
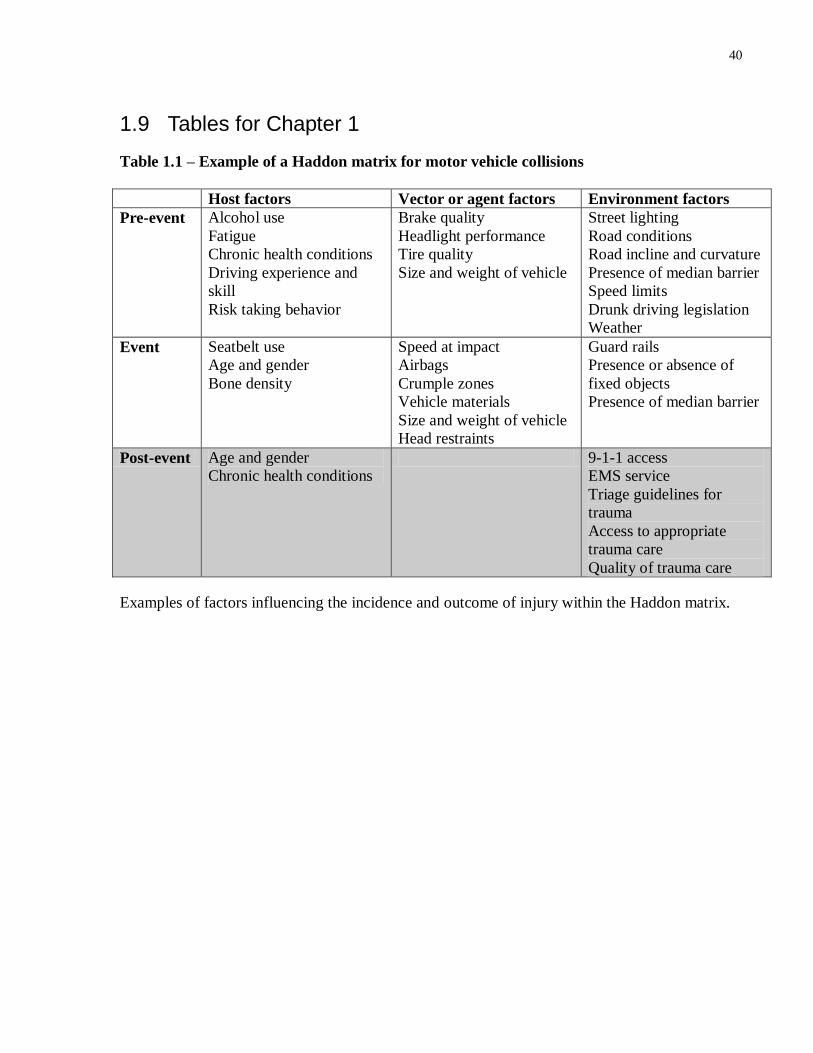
40
1.9 Tables for Chapter 1
Table 1.1 – Example of a Haddon matrix for motor vehicle collisions
Host factors Vector or agent factors Environment factors
Pre-event Alcohol use
Fatigue
Chronic health conditions
Driving experience and
skill
Risk taking behavior
Brake quality
Headlight performance
Tire quality
Size and weight of vehicle
Street lighting
Road conditions
Road incline and curvature
Presence of median barrier
Speed limits
Drunk driving legislation
Weather
Event Seatbelt use
Age and gender
Bone density
Speed at impact
Airbags
Crumple zones
Vehicle materials
Size and weight of vehicle
Head restraints
Guard rails
Presence or absence of
fixed objects
Presence of median barrier
Post-event Age and gender
Chronic health conditions
9-1-1 access
EMS service
Triage guidelines for
trauma
Access to appropriate
trauma care
Quality of trauma care
Examples of factors influencing the incidence and outcome of injury within the Haddon matrix.
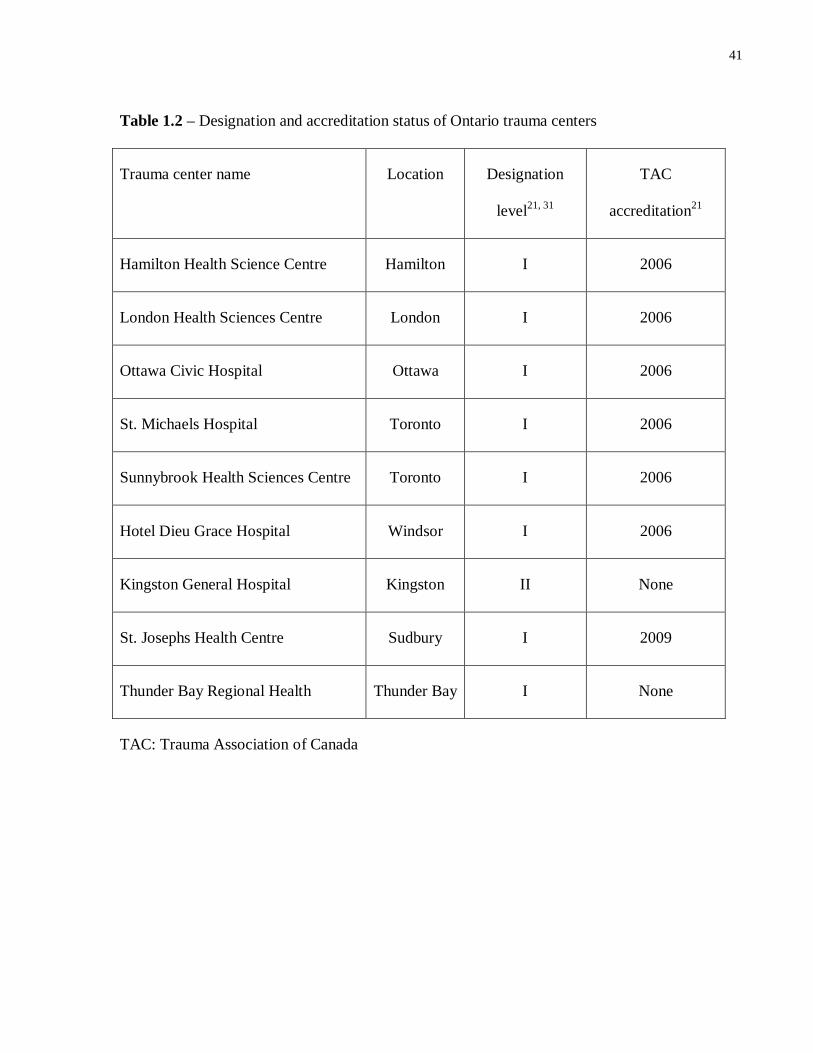
41
Table 1.2 – Designation and accreditation status of Ontario trauma centers
Trauma center name Location Designation
level21, 31
TAC
accreditation21
Hamilton Health Science Centre Hamilton I 2006
London Health Sciences Centre London I 2006
Ottawa Civic Hospital Ottawa I 2006
St. Michaels Hospital Toronto I 2006
Sunnybrook Health Sciences Centre Toronto I 2006
Hotel Dieu Grace Hospital Windsor I 2006
Kingston General Hospital Kingston II None
St. Josephs Health Centre Sudbury I 2009
Thunder Bay Regional Health Thunder Bay I None
TAC: Trauma Association of Canada

42
Essential components of trauma systems in the USA and Canada
Presence of a lead agency with legal authority to designate trauma centers
Use of a formal process for designation of trauma centers
Use of American College of Surgeons’ (or similar) standards for verification of trauma centers
Use of an out-of-area survey team for designation of trauma centers
Mechanism to limit the number of designated trauma centers in a community on the basis of
community need
Written triage criteria that form the basis for bypassing non-designated centers
Presence of continuous monitoring systems for quality assurance (e.g. trauma registry)
Statewide availability of trauma centers
1.10 Figures for Chapter 1
Figure 1.1 - Essential components of trauma systems
Adapted from Nathens AB, Brunet FP, Maier RV. Development of trauma systems and effect on
outcomes after injury. Lancet. 2004;363(9423):1794-1801.
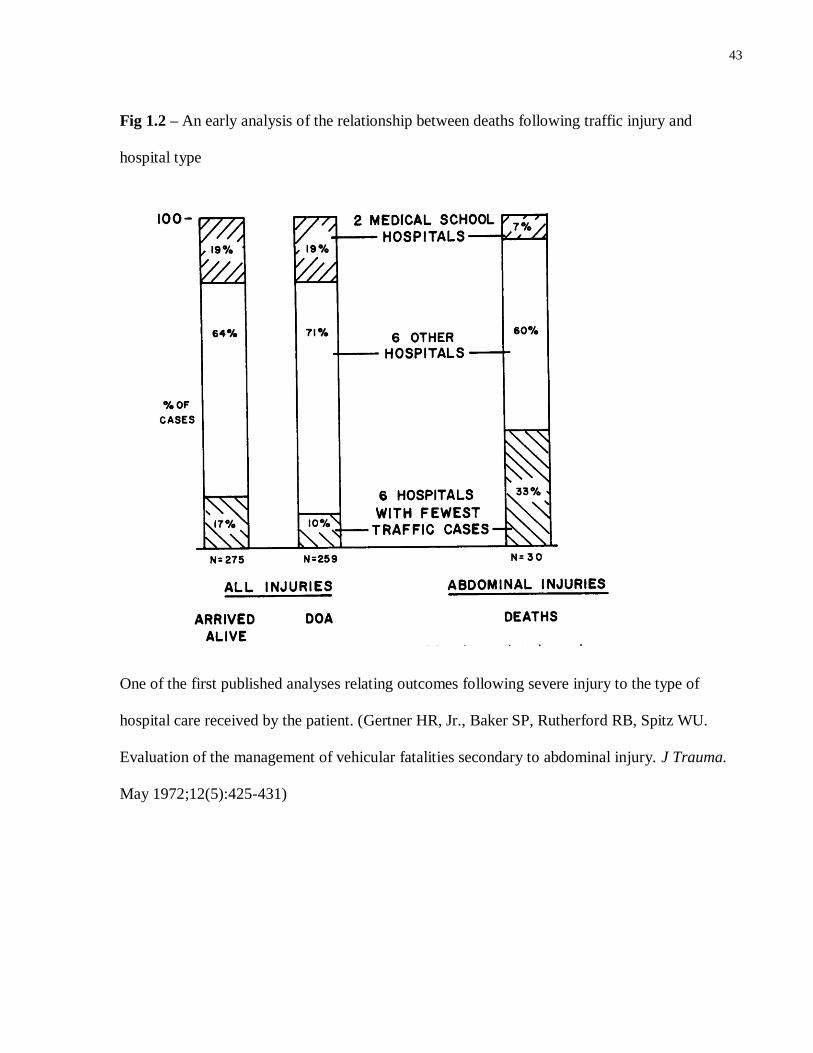
43
Fig 1.2 – An early analysis of the relationship between deaths following traffic injury and
hospital type
One of the first published analyses relating outcomes following severe injury to the type of
hospital care received by the patient. (Gertner HR, Jr., Baker SP, Rutherford RB, Spitz WU.
Evaluation of the management of vehicular fatalities secondary to abdominal injury. J Trauma.
May 1972;12(5):425-431)

44
Chapter 2 Research Aims and Hypothesis
2.1. Rationale
The data presented in Chapter 1 have demonstrated that injury is a major public health
concern, at the global level and in Ontario. The conceptual framework of the Haddon Matrix
suggests that tertiary prevention, in the form of acute care following injury, is an essential
component of injury control. Multiple lines of evidence support the concept that trauma centers
and trauma systems are essential to tertiary prevention following injury, and are associated with
a reduction in mortality. There is also substantial data demonstrating that, despite the benefits of
trauma center care, existing trauma systems do not provide adequate access to trauma centers. A
large proportion of severely injured patients are transported from the scene of injury to a non-
trauma center (undertriaged). Together, these data suggest that undertriage may be responsible
for a large number of preventable deaths across North America and in Ontario specifically.
Estimates regarding the mortality cost of undertriage, at the population level, would be of
substantial value to decision-makers and trauma system planners.
Despite abundance of evidence regarding the benefits of trauma center care in the
literature, available data have a number of limitations which preclude their use towards
accurately estimating the mortality associated with undertriage at the system or population level:
1) The best available estimates of the benefits of trauma center care compare outcomes at
trauma centers with resource-rich non-trauma centers. Population-based estimates of the
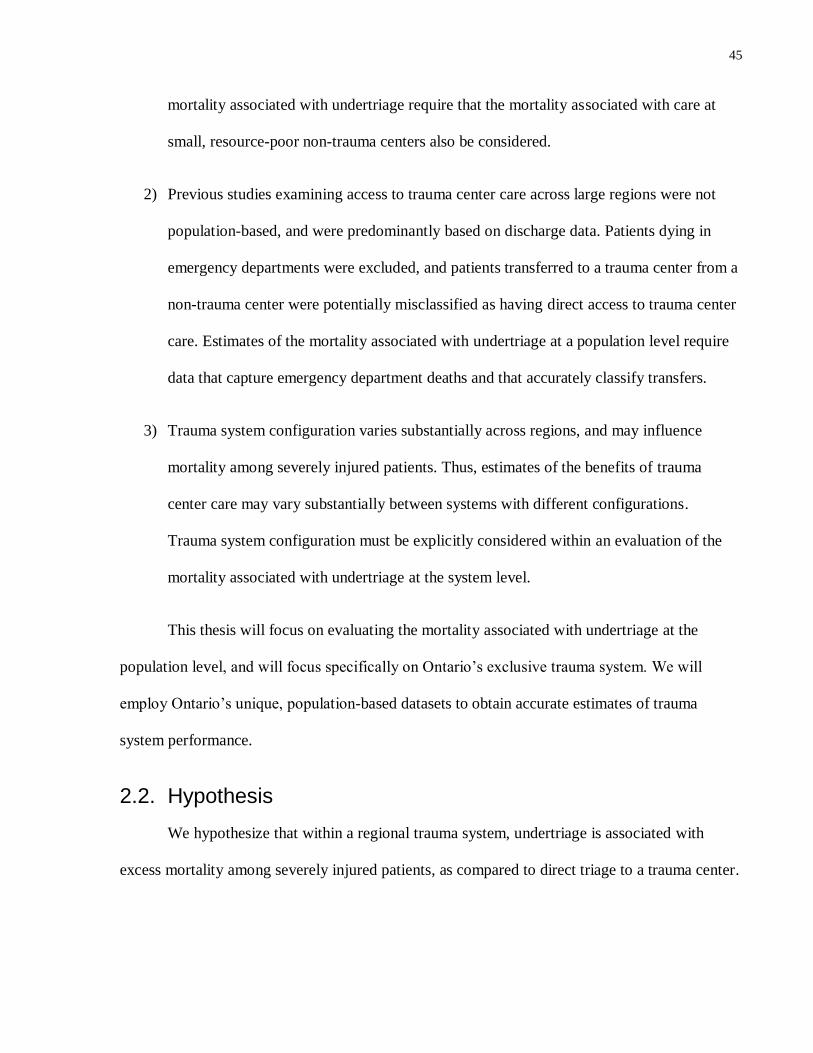
45
mortality associated with undertriage require that the mortality associated with care at
small, resource-poor non-trauma centers also be considered.
2) Previous studies examining access to trauma center care across large regions were not
population-based, and were predominantly based on discharge data. Patients dying in
emergency departments were excluded, and patients transferred to a trauma center from a
non-trauma center were potentially misclassified as having direct access to trauma center
care. Estimates of the mortality associated with undertriage at a population level require
data that capture emergency department deaths and that accurately classify transfers.
3) Trauma system configuration varies substantially across regions, and may influence
mortality among severely injured patients. Thus, estimates of the benefits of trauma
center care may vary substantially between systems with different configurations.
Trauma system configuration must be explicitly considered within an evaluation of the
mortality associated with undertriage at the system level.
This thesis will focus on evaluating the mortality associated with undertriage at the
population level, and will focus specifically on Ontario’s exclusive trauma system. We will
employ Ontario’s unique, population-based datasets to obtain accurate estimates of trauma
system performance.
2.2. Hypothesis
We hypothesize that within a regional trauma system, undertriage is associated with
excess mortality among severely injured patients, as compared to direct triage to a trauma center.
46
2.3. Research Aims
Given our overarching hypothesis, this thesis will be divided into the following specific aims:
Specific aim 1: To develop an algorithm to derive Injury Severity Score from International
Classification of Diseases, version 10, diagnoses.
Specific aim 2: To estimate the population-based mortality risk associated with transfer
following severe injury, as compared to direct transport to a trauma center.
Specific aim 3: To estimate the population-based mortality risk associated with
undertriage following severe injury.
47
Chapter 3 General Methods
3.1. Overview
The work described in this thesis was conducted at St Michael’s Hospital and at the Institute
for Clinical Evaluative Sciences (ICES) in Toronto, Ontario. Research Ethics Board (REB) approval
for this work was obtained either from St Michael’s Hospital in Toronto, Ontario, or from
Sunnybrook Health Sciences Centre, Toronto, Ontario, as appropriate. Work that was completed at
ICES was approved by the Privacy Officer and C.E.O. of ICES.
3.2. Data sources
3.2.1. Administrative databases
The administrative databases used in this dissertation (Table 3.1) are held at ICES, which
is a prescribed entity under Ontario’s Personal Health Information Protection Act, with special
obligations under this Act allowing the collection and use of health data for planning and
managing the provincial health care system78
. As a result, patients do not have to provide consent
for their personal health information to be included in ICES holdings. In order to maintain
patient privacy in the absence of a consent process, ICES must adhere to specific procedures.
These procedures include: anonymization of data, physical security measures, data encryption,
and regular audits78
. ICES’ privacy policy and procedures are internally implemented, monitored
and enforced by the ICES Privacy Officer, and externally reviewed by the Information and
Privacy Commissioner of Ontario78
. The ICES holdings used for the purposes of this dissertation
are described below.
48
Discharge Abstract Database
The Discharge Abstract Database (DAD) is a population-based, administrative database
that contains data for hospital discharges (inpatient acute, chronic and rehabilitation care), as
well as day surgeries in some Canadian provinces. The DAD is considered a “core” database by
CIHI, and DAD data are directly transferred into other CIHI datasets, including the Ontario
Trauma Registry (OTR)79
. The DAD contains demographic, administrative (e.g. institution
number, admission date, discharge date) and clinical information (e.g. diagnosis codes, discharge
disposition).
National Ambulatory Care Reporting System
The National Ambulatory Care Reporting System (NACRS) is a population-based,
administrative database that contains data for all hospital-based and community-based
ambulatory care, including day surgery, outpatient clinics and emergency departments. For the
purposes of this dissertation, data for emergency department visits were used. NACRS captures
demographic, clinical (e.g. diagnosis codes, discharge disposition) and administrative
information (e.g. triage time, discharge time).
Registered Persons Database
The Registered Persons Database (RPDB) contains demographic information on all
persons who are eligible and registered for the Ontario Health Insurance Plan80
. Information in
the RPDB includes name, gender, date of birth and vital status80
.
49
The RPDB used for this dissertation is held by ICES, where the dataset is modified and
enhanced with additional administrative data81
. This modified dataset is referred to as the ICES-
linked RPDB. Modifications include:
De-identification of all patient data
Linkage to other administrative datasets
Identifying the best known or most recent postal code and/or location of residence for each
person in the dataset, as of July 1st of each year. This is achieved through a hierarchical
algorithm which examines data from DAD, NACRS, the Continuing Care Reporting System
(CCRS), the Levels of Care Classification System (LOC) and the National Rehabilitation
System (NRS).
Enhancing information regarding vital status based on information available in other ICES
datasets. This is also achieved using data from DAD, NACRS, CCRS, LOC and NRS.
3.2.2. Clinical registries
Ontario Trauma Registry Comprehensive Data Set
The Ontario Trauma Registry Comprehensive Data Set (OTR CDS) contains information
about patients admitted with major trauma at the eleven LTH in Ontario82
. Major injury in the
OTR CDS is defined as an Injury Severity Score greater than 12. In addition, patients must have
an external cause of injury and meet one of the following criteria: admission to the participating
facility; treatment in the emergency department of the participating facility without admission; or
death in the emergency department of a participating facility82
. The OTR CDS provides highly
detailed information about injured patients, including patient characteristics, injury
50
characteristics (e.g. injury severity, mechanism of injury) and clinical information (e.g. vitals
signs, Glasgow Coma Scale score, procedures). However, because the OTR CDS captures only
patients treated at LTH, it cannot be used to evaluate the outcomes of patients with major injury
who are admitted at non-trauma centers. Given this limitation, the OTR CDS cannot be used to
evaluate trauma system performance as related to appropriate triage of severely injured patients.
3.2.3. Data validation
Discharge Abstract Database
In 2009, CIHI published the results of a study examining the quality of data submitted to
the DAD in 2005-2006. The study compared original medical record data to that recorded in the
DAD. During the study time period, 175 institutions in Ontario submitted a total of 1,138,401
patients abstracts to the DAD79
.
For the purposes of the re-abstraction study, 50 acute care facilities in Canada were
identified, based on a probability sample that was related to their geographic location and their
volume of abstracts containing an ambulatory care-sensitive condition, hip replacement surgery
or percutaneous coronary intervention. Facilities submitting fewer than 500 abstracts during the
study period and facilities submitting fewer than 150 abstracts containing an ambulatory care-
sensitive condition, hip replacement surgery or percutaneous coronary intervention were
excluded. Agreement rates were calculated for a variety of parameters; results were weighted to
reflect estimated rates for the entire DAD population.
The accuracy of diagnosis codes in the DAD is of particular interest; as will be described
in the methods sections of subsequent chapters, diagnosis codes were used to estimate the
severity of injury of patients studied in this dissertation. On re-abstraction, among all major
51
diagnoses eligible to be recorded in the DAD, 76% had been reported on the DAD abstract as a
significant diagnosis. In Ontario specifically, 75% of patient diagnoses had been recorded in the
DAD. Conversely, among diagnoses reported in the DAD, 75% were supported by information
in the patient chart; in Ontario, the rate of accuracy for DAD diagnoses was 73%.
National Ambulatory Care Reporting System
In 2008, CIHI published the results of a study examining the quality of emergency
department data submitted to the NACRS83
. The quality of this data was reviewed using data
from unplanned emergency department visits that occurred in Ontario during the 2004-2005
fiscal year. Facilities included in the study were identified using a two stage sampling strategy.
Institutions were the primary sampling unit, and emergency department visits within the
identified institutions were secondary sampling units. Institutions were stratified based on Local
Health Integration Network. Patients who left without being seen, patients who were dead on
arrival and patients who were transferred to the facility from another emergency department
were not sampled. All other patients were divided into four groups based on visit disposition:
Discharged/Left, Admitted, Transferred and Deaths.
Non-clinical demographic data elements used in the present dissertation were found to be
highly accurate. Accuracy for health care number, postal code, gender and birth date ranged from
99.7% +/- 0.2 to 100.0% +/- 0.1. In addition, data regarding transfers were examined. The
identification of a sending institution (Institution From) was accurate in 99.3% cases (+/- 0.5%).
Similarly, identification of a receiving institution (Institution To) was accurate in 97.7% of cases
(+/- 0.5%). However, these accuracy rates reflect the accuracy of these fields among all patients,
not only patients who underwent transfer; it is possible that in a significant proportion of cases,
52
re-abstraction resulted in agreement in these fields because no transfer occurred and the fields
were blank. In addition, only unscheduled visits were examined within the scope of this re-
abstraction study. Transfers to the emergency department from another emergency department,
however, are frequently coded as scheduled visits. As such, the accuracy of the fields Institution
From and Institution To is difficult to assess within the context of data used for this dissertation.
The fields Institution From and Institution To were not used in this dissertation.
The CIHI report also examined the accuracy for date and time information recorded in
NACRS. Date and time information is used in the present dissertation to calculate length of stay
in the emergency department, and time to death among patients who died in the emergency
department. Accuracy for triage and visits completed dates was very high, greater than 99%.
Discrepancies were identified in data pertaining to visit times, however. Overall, triage time was
found to be accurate to within 15 minutes in 89.2% of cases (+/- 3.8%), and visit completed time
was found to be accurate to within 15 minutes in 86.5% of cases (+/- 7.8%). The degree of
discrepancy in re-abstracted length of stay varied significantly based on patients’ visit
disposition, however. While overall agreement for length of stay (within 15 min) was 80%, it
was only 40.1% for admitted patients, 77.6% for transferred patients and 53.1% for patients that
died. These discrepancies in accuracy between patients discharged home and those patients not
discharged home likely reflect inadequate documentation among patients admitted, transferred or
dying in the emergency department. It should be noted, however, that inter-rater reliability
among re-abstractors for length of stay also varied significantly. Although, when data were re-
abstracted by 2 individuals, the mean difference in length of stay was 2 minutes, the difference
between the re-abstractors was, on average, 21 minutes for admitted patients, 5 minutes for
transferred patients and 20 minutes for patients who died.
53
Finally, the accuracy of diagnostic coding in NACRS is highly relevant to the present
project. On re-abstraction of ICD-10 codes, exact agreement was reported for the entire ICD-10-
CA code in 78.5% of diagnoses (+/- 2.3%) and in 88.8% of case (+/- 0.7%) when ICD-10-CA
three character classification category was considered. Among diagnoses in the range of ICD-10-
CA chapter XIX (Injury, poisoning and certain other consequences of external causes), exact
agreement for entire ICD-10-CA codes was recorded in 72.3% (+/- 5.3%) of diagnoses, and in
77.2% (+/- 0.6) of diagnoses when only ICD-10-CA three character classification category was
considered. When only chapter XIX of ICD-10-CA diagnosis was considered, agreement was
found for 98.9% (+/- 1.5%) of diagnoses in the injury range. These data suggest that accuracy for
identifying patients who have sustained any injury is extremely high, and accuracy for specific
injury diagnosis is also very high.
Registered Persons Database
A 2008 report compared death counts in the ICES-linked RPDB and in data from the
MOHLTC used for health planning purposes (that includes Ontario Registrar General Vital
Statistics death data and Statistics Canada death data)81
. Data for this report included the years
from 1993-2003. Death counts across datasets were highly comparable: in the years 2000-2003,
the percent difference in counts across datasets was less than 1%.
Ontario Trauma Registry – Comprehensive Dataset
No specific information regarding quality of data in OTR CDS is currently available.
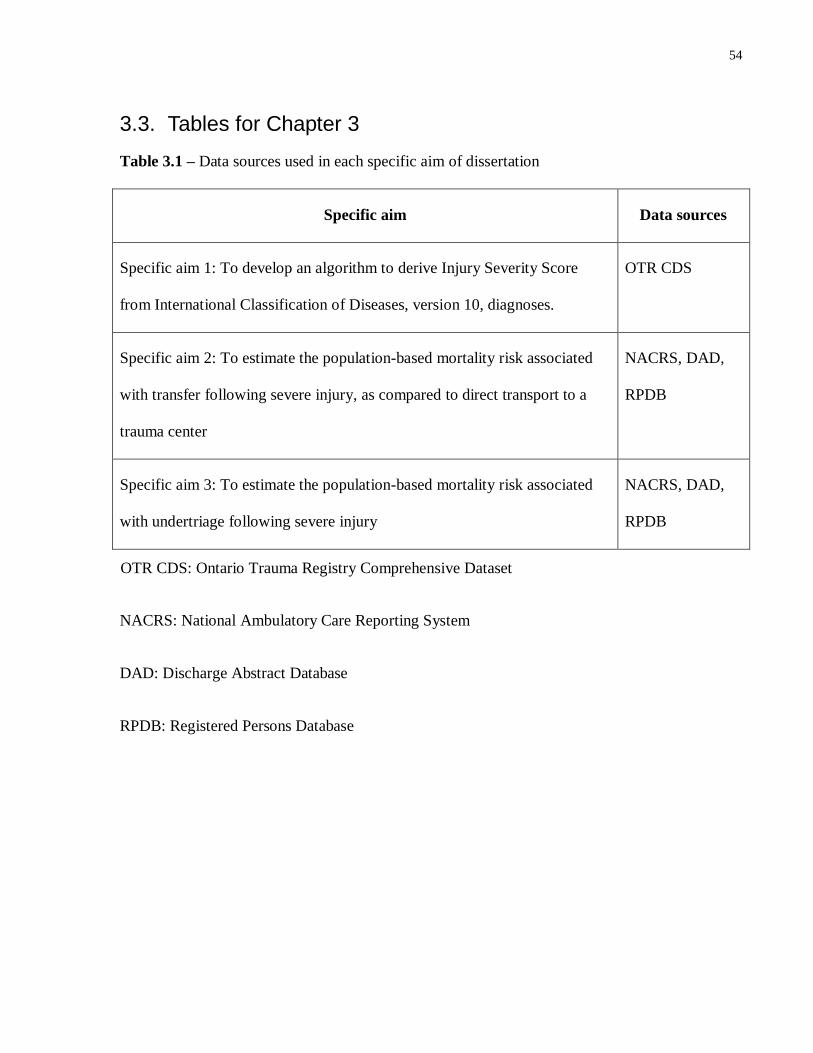
54
3.3. Tables for Chapter 3
Table 3.1 – Data sources used in each specific aim of dissertation
Specific aim Data sources
Specific aim 1: To develop an algorithm to derive Injury Severity Score
from International Classification of Diseases, version 10, diagnoses.
OTR CDS
Specific aim 2: To estimate the population-based mortality risk associated
with transfer following severe injury, as compared to direct transport to a
trauma center
NACRS, DAD,
RPDB
Specific aim 3: To estimate the population-based mortality risk associated
with undertriage following severe injury
NACRS, DAD,
RPDB
OTR CDS: Ontario Trauma Registry Comprehensive Dataset
NACRS: National Ambulatory Care Reporting System
DAD: Discharge Abstract Database
RPDB: Registered Persons Database
55
Portions of Chapter 4 have previously appeared in
Haas B, Xiong W, Brennan-Barnes M, Gomez D, Nathens AB. Overcoming barriers to
population-based injury research: Development and validation of an ICD-10 to Injury
Severity Score crosswalk. Can J Surg. 2012 Feb;55(1):21-6.
© Canadian Medical Association. The use of this material is by permission of the copyright
holder.
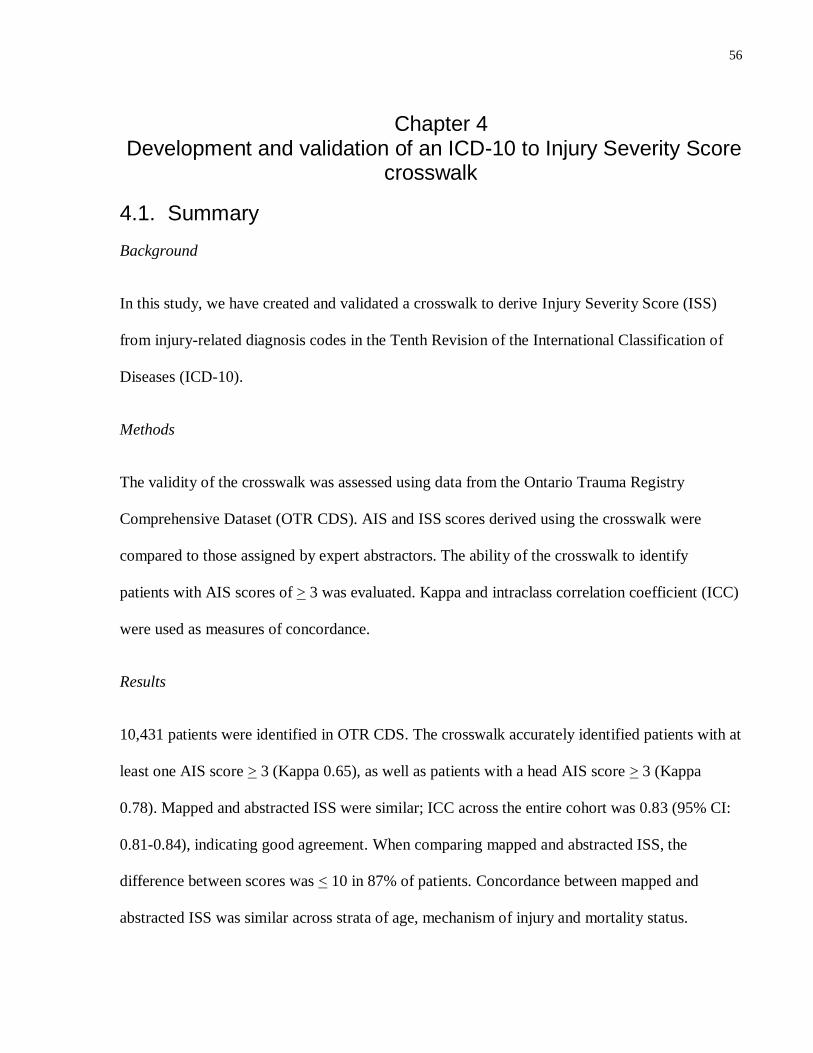
56
Chapter 4 Development and validation of an ICD-10 to Injury Severity Score
crosswalk
4.1. Summary
Background
In this study, we have created and validated a crosswalk to derive Injury Severity Score (ISS)
from injury-related diagnosis codes in the Tenth Revision of the International Classification of
Diseases (ICD-10).
Methods
The validity of the crosswalk was assessed using data from the Ontario Trauma Registry
Comprehensive Dataset (OTR CDS). AIS and ISS scores derived using the crosswalk were
compared to those assigned by expert abstractors. The ability of the crosswalk to identify
patients with AIS scores of > 3 was evaluated. Kappa and intraclass correlation coefficient (ICC)
were used as measures of concordance.
Results
10,431 patients were identified in OTR CDS. The crosswalk accurately identified patients with at
least one AIS score > 3 (Kappa 0.65), as well as patients with a head AIS score > 3 (Kappa
0.78). Mapped and abstracted ISS were similar; ICC across the entire cohort was 0.83 (95% CI:
0.81-0.84), indicating good agreement. When comparing mapped and abstracted ISS, the
difference between scores was < 10 in 87% of patients. Concordance between mapped and
abstracted ISS was similar across strata of age, mechanism of injury and mortality status.
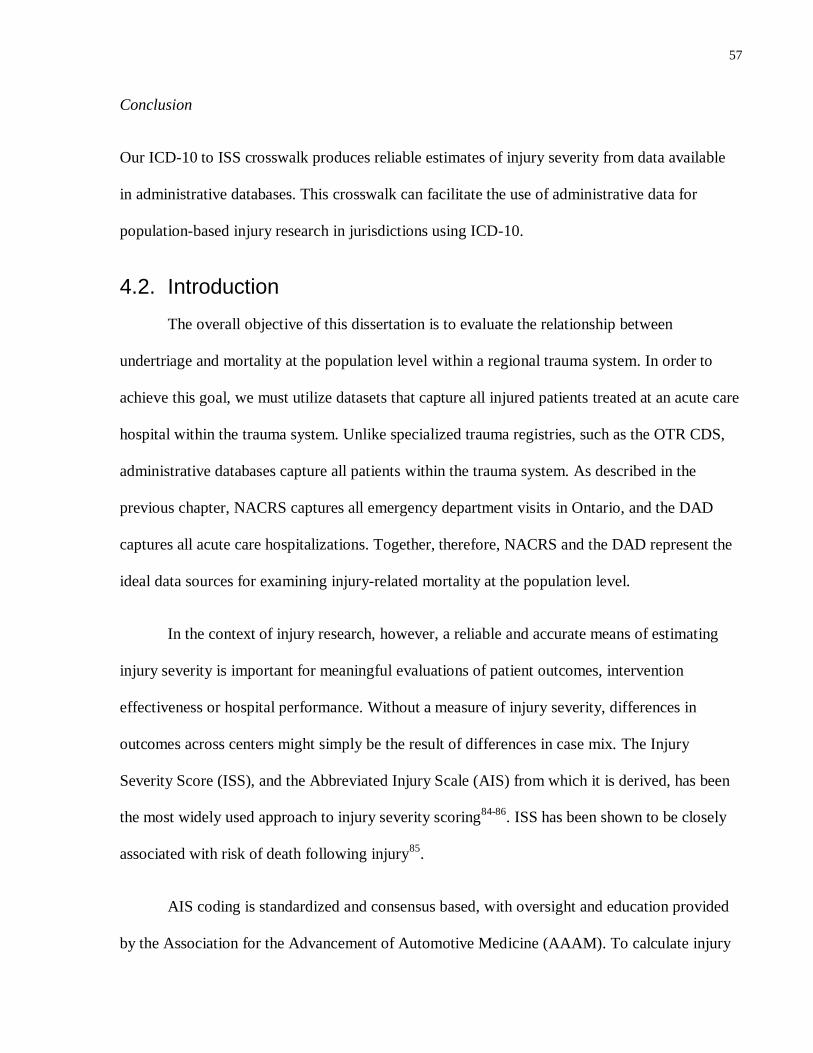
57
Conclusion
Our ICD-10 to ISS crosswalk produces reliable estimates of injury severity from data available
in administrative databases. This crosswalk can facilitate the use of administrative data for
population-based injury research in jurisdictions using ICD-10.
4.2. Introduction
The overall objective of this dissertation is to evaluate the relationship between
undertriage and mortality at the population level within a regional trauma system. In order to
achieve this goal, we must utilize datasets that capture all injured patients treated at an acute care
hospital within the trauma system. Unlike specialized trauma registries, such as the OTR CDS,
administrative databases capture all patients within the trauma system. As described in the
previous chapter, NACRS captures all emergency department visits in Ontario, and the DAD
captures all acute care hospitalizations. Together, therefore, NACRS and the DAD represent the
ideal data sources for examining injury-related mortality at the population level.
In the context of injury research, however, a reliable and accurate means of estimating
injury severity is important for meaningful evaluations of patient outcomes, intervention
effectiveness or hospital performance. Without a measure of injury severity, differences in
outcomes across centers might simply be the result of differences in case mix. The Injury
Severity Score (ISS), and the Abbreviated Injury Scale (AIS) from which it is derived, has been
the most widely used approach to injury severity scoring84-86
. ISS has been shown to be closely
associated with risk of death following injury85
.
AIS coding is standardized and consensus based, with oversight and education provided
by the Association for the Advancement of Automotive Medicine (AAAM). To calculate injury
58
severity, AIS scores are assigned to one of each of nine body regions on a 6 point ordinal scale
based on the anatomic severity of injury (Appendix A). Scores range from a severity of 1 (minor
injury) to a severity 6 (universally fatal – e.g. liver avulsion). AIS scores of 3 or greater are
considered to be severe injuries.
AIS scores form the basic building blocks for calculating ISS. Based on AIS scores, each
of six ISS body regions is assigned a score from 1 to 6 (Appendix A). The scores for the three
most severely injured body regions are squared and then summed to derive ISS. An ISS of
greater than 15 is considered severe injury.
AIS and ISS, while highly useful measures of injury severity, require the expertise of
experienced trauma registrars in order to be captured accurately. Thus, these scores are typically
only available in trauma centers, and are not available in administrative databases, such as the
DAD or NACRS. Rather than relying on injury-specific injury scores, administrative databases
generally use the International Classification of Diseases (ICD) system, published by the WHO,
to index hospital records. Unfortunately, although widely available, ICD diagnoses do not
provide a direct means of estimating injury severity. As a result, many administrative databases
have been of limited utility in the context of injury research.
Recognizing the utility of using administrative data sources for the purposes of injury-
related research, an automated algorithm to convert ICD diagnoses to AIS scores has previously
been developed for the Clinical Modification of the Ninth Revision of the ICD (ICD-CM-9).87
This crosswalk has been validated, and has been of demonstrable utility in a variety of settings
focusing on population-based analyses of trauma care.46, 88-90
59
In 1990, the development of the Tenth Revision of the ICD (ICD-10) was endorsed; this
modification substantially broadened the scope of the classification system.91
ICD-10 includes
expanded injury codes and greater specificity in code assignment.92
Versions of the ICD-10
system have been adopted in a number of jurisdictions, including Canada. Among the Canadian
databases that utilize the ICD-10 system are the DAD and NACRS. With the objective of
utilizing Canadian administrative databases to examine injury-related outcomes, the first specific
aim of this dissertation was the development and validation of an ICD-10 to ISS algorithm. Such
an algorithm would allow us to identify severely injured patients from administrative data, and to
accurately risk adjust injury severity.
4.3. Methods
The development of the ICD-10 to ISS crosswalk was comprised of two components:
crosswalk development and validation. The final crosswalk consists of an automated computer
algorithm.
Data sources
The validity of the crosswalk was tested using the OTR CDS, admission years 2002-
2004. The OTR CDS includes patients managed at a designated trauma center with moderate to
severe injuries (ISS > 12) in the province of Ontario, Canada. The OTR CDS includes AIS
scores and ISS scores calculated by expert abstractors by means of chart abstraction. The dataset
also includes ICD-10 injury diagnoses and external cause of injury codes for each patient.
60
Crosswalk development
In consultation with a member of the AAAM AIS faculty and a certified AIS Specialist,
each injury-related diagnosis code in the ICD-10 lexicon (codes ranging from S00 to T79.0) was
assigned to one of nine AIS body regions and one of six ISS body regions (Appendix A). Each
ICD-10 diagnosis was also assigned to an appropriate AIS severity code based on the 1998
update of the AIS system86
. ICD-10 diagnoses related to foreign bodies (T15-T19), burns and
corrosion injury (T20-T32), poisoning (T36-T65) and environmental exposure (T33-T35, T66-
78) were excluded; these injuries are typically not preferentially triaged to trauma centers, and
are beyond the scope of this dissertation. Complications of medical care and late effects of injury
(T80-T98) were also excluded. The Canadian Modification (ICD-10-CA)93
was used to define
AIS codes, since it is this version of the ICD-10 that is used in Canadian administrative
databases.
Each ICD-10 diagnosis was assigned the lowest or most conservative AIS score with
which it could be accurately associated. In cases where an ICD-10-CA diagnosis code described
injuries to more than one organ, each with a different AIS score, but within the same ISS body
region, the lowest AIS score was assigned. ICD-10 diagnoses that could not be assigned an
accurate AIS score were assigned an AIS score of 9. AIS scores of 9 are equivalent to “not
applicable” or “missing”, and are not included in ISS calculation. Specifically, an AIS score of 9
was assigned when an ICD-10-CA diagnosis code described injuries to multiple organs in
different ISS body regions, described injuries to an unidentified body region, or described
multiple injuries of more than one type to a body region (e.g. S09.7 – multiple injuries of head).
61
Crosswalk validation
Injury mechanism was assigned by means of external cause of injury code (E-code),
according to Center for Disease Control External Cause of Injury Mortality Matrix for ICD-1094,
95. Patients with a primary mechanism of injury of burn, poisoning, drowning, exposure,
suffocation, overexertion, hanging or submersion were excluded from the cohort. Patients with
missing E-codes were also excluded, as the mechanism of injury for these patients could not be
ascertained. Using the crosswalk, we derived AIS and ISS scores from the ICD-10 diagnoses
recorded in the OTR CDS.
Validity of the crosswalk was assessed in two ways. First we determined the extent of
agreement between the AIS scores in the OTR CDS (considered the gold standard) with those
derived from the crosswalk. In addition, we determined the agreement between the ISS scores
derived from the two methods. Concordance between maximum AIS (AISmax) by body region
obtained from the ICD-10 crosswalk and from registry data was measured as percentage of exact
agreement. Patient data were further stratified by age group (<15 years, > 15 years) and injury
mechanism (blunt, penetrating) to assess crosswalk performance across patient groups.
Concordance across mapped and abstracted scores in detecting severe injury (AIS > 3) by body
region was measured using exact agreement and the kappa coefficient.
The degree of concordance between mapped and abstracted ISS was analyzed using two
approaches. First, we compared the absolute difference between the two scores to estimate the
percentage of patients where the difference was < 10. This is a non-parametric approach to the
Bland-Altman method of measuring agreement, which is useful in cases where data are not
normally distributed96
. We also evaluated concordance using the intraclass correlation coefficient
62
(ICC). Ranging from 0 to 1.0, ICC accounts for two sources of variation in ISS scores: variations
in scores across different patients and variations due to a lack of concordance across methods
(crosswalk and abstraction).97
A high ICC suggests high concordance between methods. The
95% CI for ICC was computed using bootstrapping methodology.98
In the estimation of ICC, a
margin of error of +3 for ISS was allowed, given the known inter-rater reliability of chart
abstractors in assignment of an ISS score.99
As above, analyses were also stratified by age group
(<15 years, >15 years), injury mechanism (blunt, penetrating) and survival status (in-hospital
death, alive at discharge).
Statistical analysis
Descriptive statistics were calculated for demographic and injury data in the OTR CDS.
Means and standard deviations were calculated for continuous variables with a normal
distribution, and medians and interquartile ranges were calculated for continuous variables with a
non-normal distribution. Absolute and relative frequencies were measured for discrete variables.
In all statistical analysis, p<0.05 was considered significant. All data were analyzed using SAS
(version 9.1, Cary, NC).
4.4. Results
Crosswalk development
There are a total of 1,542 ICD-10 included diagnoses codes in the range S00 to T79.0.
Twenty-nine ICD-10 diagnosis codes (1.8%) could not be assigned an AIS body region. An
additional 196 ICD-10 diagnoses could not be assigned an AIS severity, and were assigned an
AIS severity score of 9. Of the ICD-10 diagnoses that could not be assigned an injury severity,
63
27% were in the region of the abdomen, and 26% were in the region of the lower extremities.
Overall, 85% of ICD-10 diagnoses were assigned an AIS body region and severity.
Validation of the ICD-10 to AIS crosswalk
There were 10,431 patients meeting inclusion criteria within OTR CDS over the years
2002-2004 (Table 4.1). The majority of patients were male (71.6%), with a mean age of 44
years. The most frequent mechanisms of injury were motor vehicle collisions (51.6%) and falls
(34.3%). Crude in-hospital mortality in this cohort was 10.8%. Overall, 20 patients had ICD-10
diagnoses which could not be translated into an ISS score.
Concordance of crosswalk and abstracted AIS scores
To provide a greater understanding of the strengths and weakness of the ICD-10 to AIS
crosswalk, we evaluated the concordance of AISmax across all body regions, as well as the ability
of the crosswalk to identify the presence or absence of a severe injury (AIS>3) in each body
region. The AISmax for each patient identified by crosswalk and from chart abstraction were in
exact agreement in 57% of patients (Table 4.2). This degree of agreement is similar to that
previously observed in studies of inter-rater reliability among AIS abstractors99
. The body
regions with the highest proportion of agreement for AISmax were the face (68%), neck (71%)
and upper extremities (72%). When comparing AISmax obtained from the crosswalk and by
abstraction, exact agreement was lowest for head injuries (52%), chest injuries (51%) and lower
extremity injuries (51%). When patients were stratified by age and mechanism of injury, overall
agreement between abstracted and crosswalk AISmax was lowest for patients with penetrating
injuries (48%).
64
Because, in the context of risk adjustment, AIS is most commonly used as a means of
identifying the presence or absence of severe injury in a particular body region, we examined the
ability of the crosswalk to identify severe injury (AIS > 3) in each body region (Table 4.3). The
crosswalk demonstrated highest concordance with mapped AIS in identifying patients with
severe head injuries (kappa 0.78, 95% CI 0.76-0.80). Conversely, the crosswalk performed least
well in identifying severe injuries to the face (kappa 0.14, 95% CI 0.10-0.17).
Concordance of crosswalk and abstracted ISS
Overall, mapped and abstracted ISS were similar (Table 4.4). The difference between ISS
scores obtained by crosswalk and abstracted scores was < 10 in 87% of patients. When patients
were stratified by age, mechanism of injury and discharge status, ISS scores obtained from the
crosswalk and from chart abstraction were similar within each stratum. The greatest variation in
the differences between mapped and abstracted ISS was observed among patients with
penetrating injuries, where the difference between the two scores was < 10 among 82% of
patients.
The concordance of ISS across methods was also evaluated using ICC. Across the entire
patient cohort, the ICC demonstrated excellent agreement between ISS obtained by mapping of
ICD-10 diagnoses and by chart abstraction (ICC 0.83, 95% CI 0.81 to 0.84). Although ISS
concordance across methods was excellent among patients with blunt injuries, patients aged 15
and older and patients discharged alive (Table 4.4), ICC ranged from 0.64 to 0.79 among
pediatric patients, patients with penetrating injuries and patients who died in-hospital. All ICCs
were consistent with substantial to excellent agreement, indicating that the crosswalk was
internally valid, and a reliable means of obtaining ISS scores from ICD-10 diagnosis codes.
65
4.5. Discussion
Introduced in 1971 and 1974 respectively, the AIS and ISS scoring systems have proven to
be an accurate and replicable means of estimating the degree of anatomic injury among trauma
patients85
. Although a number of alternative scoring systems aimed at improving on the
predictive performance of ISS have been proposed, including the ICD-based Injury Severity
Score (ICISS), the Anatomic Profile (AP) and the Trauma and Injury Severity Score (TRISS),
AIS and ISS remain the most widely used means of identifying severity of injury and of risk-
adjusting trauma-related outcomes for variations in injury severity. Despite the availability of
these injury scores in trauma registries and specialized trauma databases, AIS and ISS are not
typically available from administrative and other non-specialized datasets.
In this Chapter, we developed a novel ICD-10 to ISS conversion algorithm, which will allow
ISS to be derived from administrative datasets employing ICD-10. By examining the
concordance of AIS and ISS scores derived from ICD-10 mapping to scores provided by expert
abstractors in the OTR CDS, we have demonstrated that mapped scores are accurate compared to
those provided by chart abstraction.
Alternative methods of estimating injury severity from administrative data have been
proposed, with the ICISS system being the most prominent. The ICISS system relies on
estimates of the survival risk ratios associated with each ICD diagnosis100
. ICISS scores are
derived empirically from each dataset, and have been shown, in some studies, to be more
accurate than crosswalk-derived ISS101-103
. The accuracy of ICISS, however, may vary across
datasets, and may be inaccurate for rare diagnoses when derived from small datasets104
. Because
our ICD-10 to AIS crosswalk is based on consensus definitions rather than empirically-derived
data, crosswalk performance should be minimally dependent on data sources. Moreover,
66
previous work has shown that, when incorporated into a risk adjustment model that includes
other predictors of injury-related death, algorithm-derived ISS and ICISS produced risk-
adjustment models with similar performance105
.
More recently, an injury severity model (TMPM-ICD9) based on regression modeling of
mortality and ICD has been developed using data from NTDB and ICD-9 diagnosis codes106
.
This model has been shown to be more accurate than ICISS, and the methodology could
theoretically be replicated with ICD-10 diagnosis codes. However, once again, because this
method is dependent on the composition and size of the data source, model validity would vary
across datasets, with smaller data sources likely to produce less accurate models.
The ICD-10 to ISS crosswalk described in this study has a number of limitations. The ability
of the crosswalk to identify severe injury varied by body region. While the crosswalk reliably
identified severe injuries in the head, chest and abdomen region, agreement between the
crosswalk and abstracted scores was low in other body regions. These differences are likely
related to variations in the degree of granularity of ICD-10 diagnosis codes across body regions.
However, body regions where the crosswalk had lower performance were also body regions
where injuries were less common in the population. As a result, the impact of crosswalk error on
risk-adjustment of mortality in large datasets or population analyses is likely to be small.
Concordance between ISS scores calculated by expert abstractors and by the crosswalk was
also not perfect. This may be a reflection of the quality of ICD-10 diagnostic coding in the
database used. Nevertheless, the concordance between scores obtained by mapping and
abstractions was very similar, or better, than concordance observed between human abstractors.
In this study we demonstrated an ICC of 0.83, overall, for ISS obtained by algorithm and from

67
abstracted data. A previous study demonstrated an ICC of 0.83 for physician abstractors, and an
ICC of 0.66 for ISS scores obtained by medical record technicians and research assistants99
.
Data from trauma registries that provide ISS is only reliable if AIS and ISS scores are
assigned by trained abstractors who accurately capture all patient injuries. Similarly, the
accuracy of ISS scores derived from the crosswalk will be dependent on the quality of ICD-10
coding data available in the database to which it is being applied. While we have provided
evidence of the reliability of our data sources in Chapter 3, other researchers using the crosswalk
must ensure that ICD-10 scores are reliably coded in the database which will be used; the
crosswalk cannot accurately assign accurate ISS scores if ICD-10 codes are not entered
accurately. More broadly, if there are biases in the accuracy of ICD-10 code assignment across
institutions or across time periods, risk adjustment using crosswalk-derived ISS may not be
accurate.
In conclusion, in this Chapter, we have developed a crosswalk which reliably and accurately
maps ICD-10 diagnoses to ISS. We have demonstrated the validity of this instrument using
multiple approaches. This crosswalk will facilitate the use of administrative data to study injury
outcomes, not only for the purposes of this dissertation but for other injury-related studies that
utilize administrative data. This crosswalk will ensure that trauma-related health services
research captures the outcomes of patients currently not adequately characterized in specialized
trauma registries.
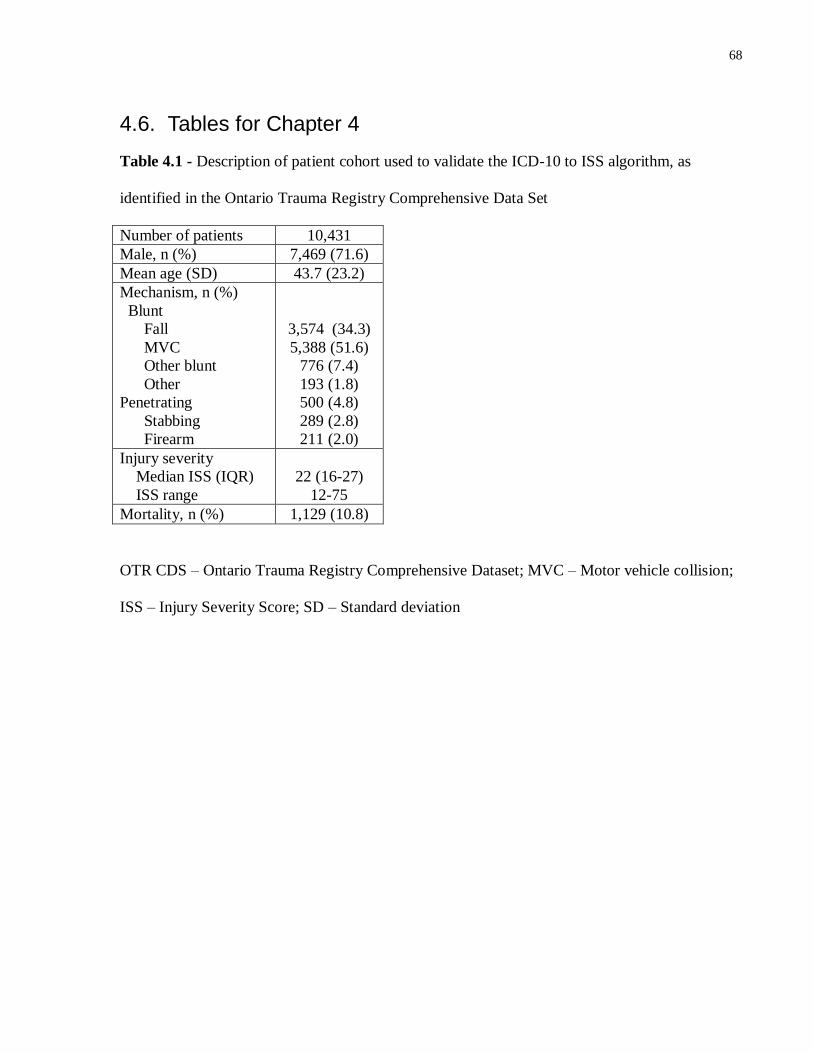
68
4.6. Tables for Chapter 4
Table 4.1 - Description of patient cohort used to validate the ICD-10 to ISS algorithm, as
identified in the Ontario Trauma Registry Comprehensive Data Set
Number of patients 10,431
Male, n (%) 7,469 (71.6)
Mean age (SD) 43.7 (23.2)
Mechanism, n (%)
Blunt
Fall
MVC
Other blunt
Other
Penetrating
Stabbing
Firearm
3,574 (34.3)
5,388 (51.6)
776 (7.4)
193 (1.8)
500 (4.8)
289 (2.8)
211 (2.0)
Injury severity
Median ISS (IQR)
ISS range
22 (16-27)
12-75
Mortality, n (%) 1,129 (10.8)
OTR CDS – Ontario Trauma Registry Comprehensive Dataset; MVC – Motor vehicle collision;
ISS – Injury Severity Score; SD – Standard deviation
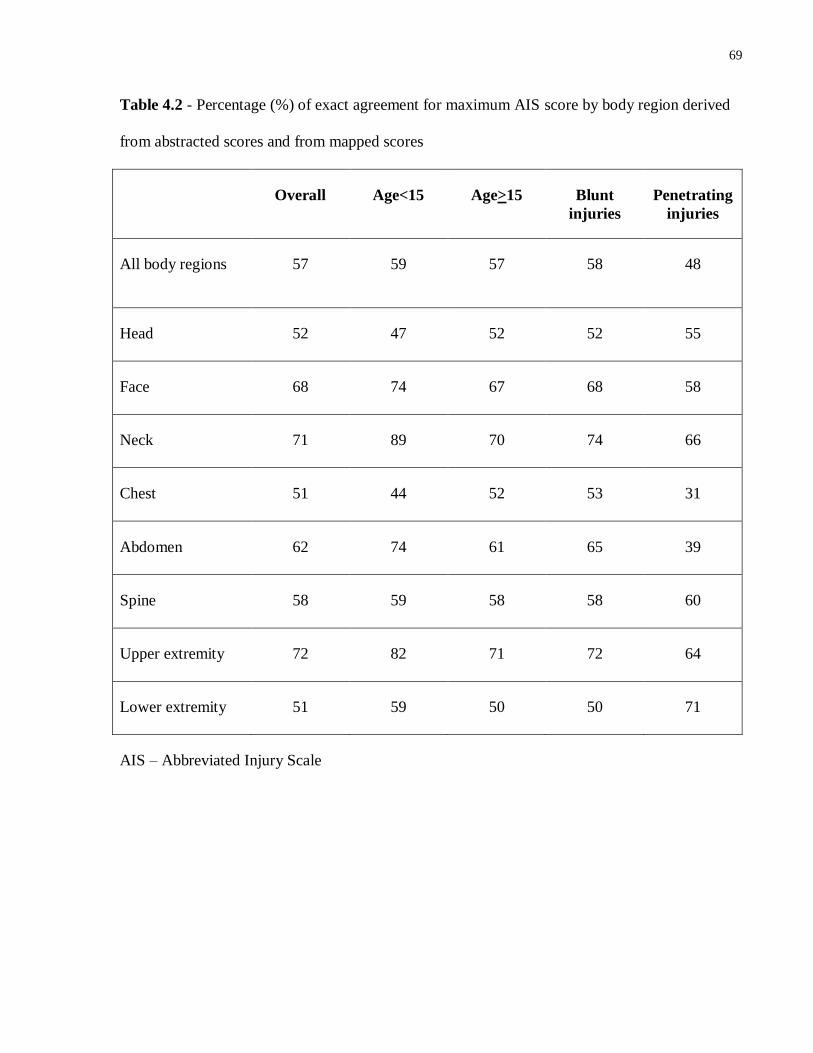
69
Table 4.2 - Percentage (%) of exact agreement for maximum AIS score by body region derived
from abstracted scores and from mapped scores
Overall Age<15 Age>15 Blunt
injuries
Penetrating
injuries
All body regions 57 59 57 58 48
Head 52 47 52 52 55
Face 68 74 67 68 58
Neck 71 89 70 74 66
Chest 51 44 52 53 31
Abdomen 62 74 61 65 39
Spine 58 59 58 58 60
Upper extremity 72 82 71 72 64
Lower extremity 51 59 50 50 71
AIS – Abbreviated Injury Scale
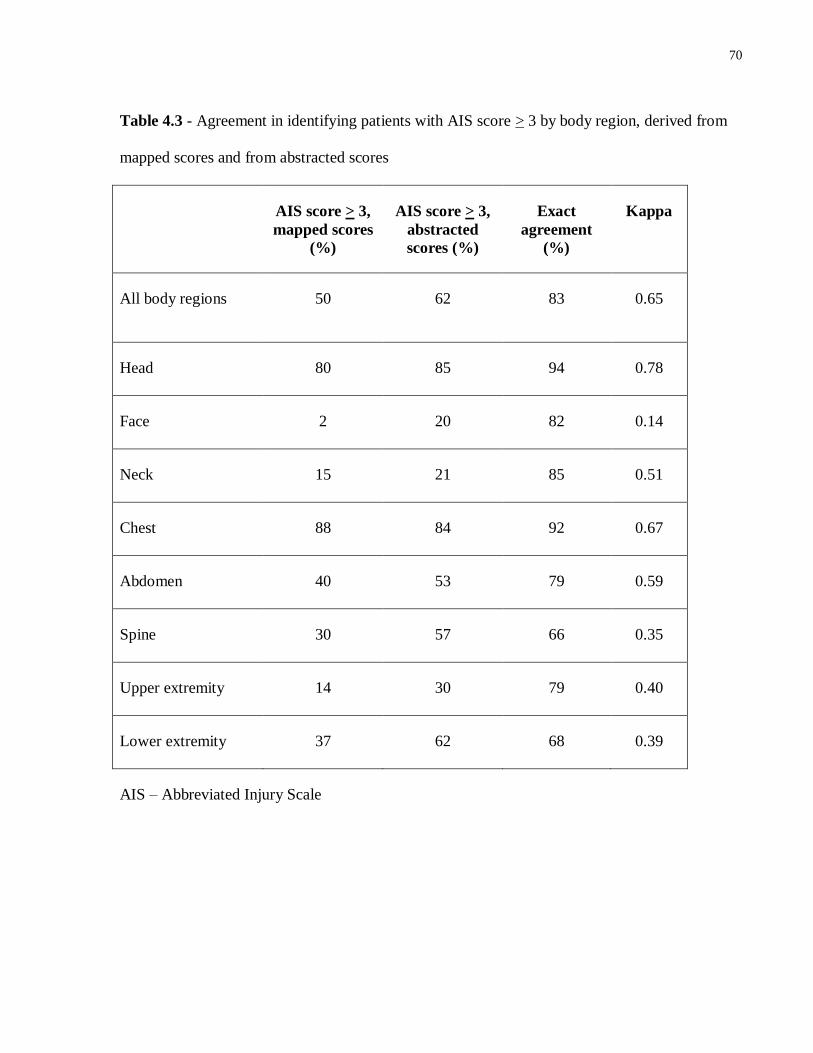
70
Table 4.3 - Agreement in identifying patients with AIS score > 3 by body region, derived from
mapped scores and from abstracted scores
AIS score > 3,
mapped scores
(%)
AIS score > 3,
abstracted
scores (%)
Exact
agreement
(%)
Kappa
All body regions 50 62 83 0.65
Head 80 85 94 0.78
Face 2 20 82 0.14
Neck 15 21 85 0.51
Chest 88 84 92 0.67
Abdomen 40 53 79 0.59
Spine 30 57 66 0.35
Upper extremity 14 30 79 0.40
Lower extremity 37 62 68 0.39
AIS – Abbreviated Injury Scale
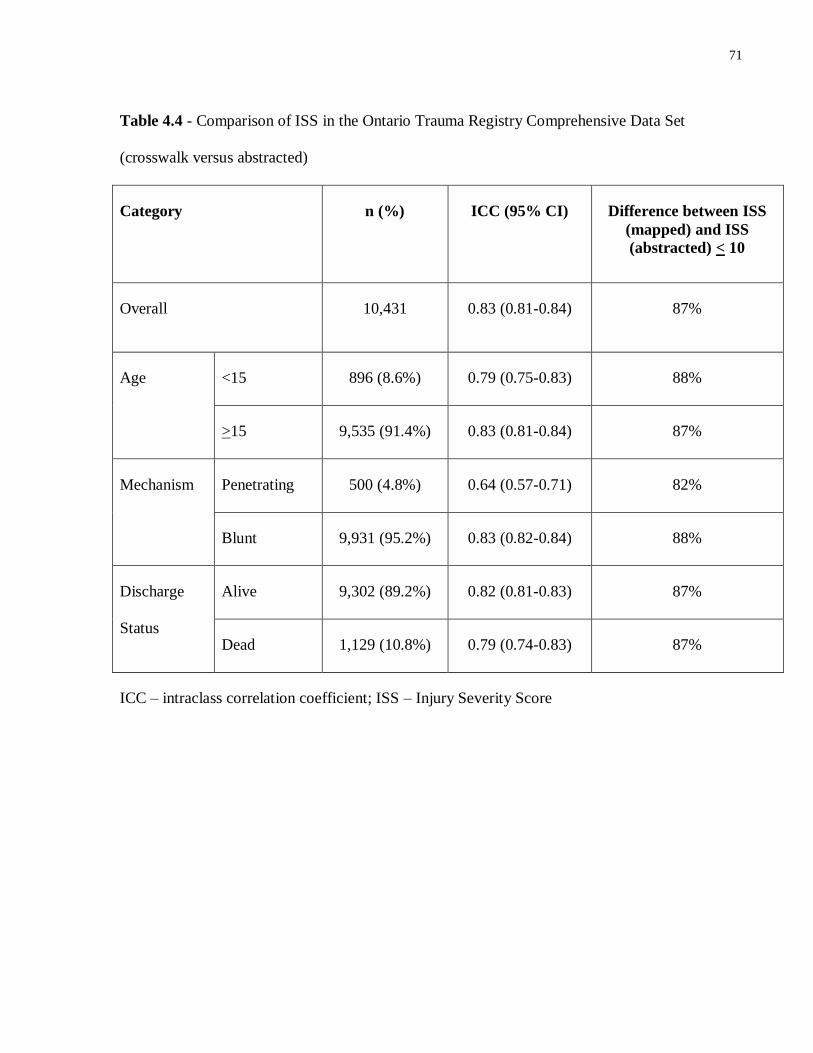
71
Table 4.4 - Comparison of ISS in the Ontario Trauma Registry Comprehensive Data Set
(crosswalk versus abstracted)
Category n (%) ICC (95% CI) Difference between ISS
(mapped) and ISS
(abstracted) < 10
Overall 10,431 0.83 (0.81-0.84) 87%
Age
<15 896 (8.6%) 0.79 (0.75-0.83) 88%
>15 9,535 (91.4%) 0.83 (0.81-0.84) 87%
Mechanism Penetrating 500 (4.8%) 0.64 (0.57-0.71) 82%
Blunt 9,931 (95.2%) 0.83 (0.82-0.84) 88%
Discharge
Status
Alive 9,302 (89.2%) 0.82 (0.81-0.83) 87%
Dead 1,129 (10.8%) 0.79 (0.74-0.83) 87%
ICC – intraclass correlation coefficient; ISS – Injury Severity Score

72
Portions of Chapter 5 have previously appeared in
Haas B, Gomez D, Zagorski B, Stukel TA, Rubenfeld GD, Nathens AB. Survival of the
fittest: The hidden cost of undertriage of major trauma. J Am Coll Surg. 2010 Dec;
211(6):804-11.
© Elsevier. The use of this material is by permission of the copyright holder.
73
Chapter 5 Evaluation of the mortality associated with transfer to trauma
center care
5.1. Summary
Background
Injured patients cared for in trauma centers have a lower risk of death than those cared for in
non-trauma centers. However, many patients are transported to a non-trauma center following
injury (undertriaged), and require transfer to trauma center care. Previous analyses of transfer
focused only on survivors to trauma center care, and were potentially subject to survivor bias.
Using a novel population-based design, we evaluated the true mortality cost of transfer.
Methods
We used a retrospective cohort design and included severely injured patients surviving to reach
an Emergency Department (ED) within the province of Ontario, Canada. Those patients who
were triaged to a non-trauma center as their first hospital exposure were the UNDERTRIAGE
cohort. UNDERTRIAGE cohort patients were either transferred to a trauma center (TRANSFER
cohort) or died before transfer could be accomplished (ED-DEATH cohort). Patients that were
transported directly from the scene of injury to a trauma center represented the DIRECT cohort.
Thirty day mortality in undertriaged patients was analyzed using two approaches: allowing for
survivor bias (TRANSFER vs. DIRECT) and without survivor bias (UNDERTRIAGE vs.
DIRECT).
Results
74
Among 11,398 patients, 66% were transported directly to a trauma center, and 30% were
transferred. 4% died prior to transfer (22% of all deaths). Reproducing approaches that ignore
survivor bias, mortality in the TRANSFER and DIRECT cohorts was equivalent. However,
unbiased assessment demonstrated that mortality was significantly higher in the
UNDERTRIAGE cohort than the DIRECT cohort (OR 1.24, 95% CI 1.10-1.40).
Conclusions
Undertriage and transfer following major trauma are associated with significant mortality. These
data suggest a need to design strategies to improve triage to trauma centers.
5.2. Background
As was discussed in Chapter 1, numerous studies have demonstrated that injured patients
cared for in designated trauma centers have a significantly lower risk of death than those cared
for in non-trauma centers36, 38, 47
. Given the impact of trauma center care on survival, severely
injured patients should be transported from the scene of injury directly to a trauma center, even if
this requires bypassing closer hospitals19
. Many severely injured patients, however, continue to
be transported from the site of injury to the emergency department of a non-trauma center.
In some cases, initial transport of severely injured patients to a non-trauma center
(undertriage) is inevitable; for example, distances to the nearest trauma center might preclude
direct transport for those injured in rural areas. In other instances, however, undertriage occurs
because a judgment is made in the prehospital setting that trauma center care would not be
beneficial or is not required. Once in the emergency department of a non-trauma center, these
undertriaged patients will either die in the emergency department, be admitted to hospital or
undergo interfacility transfer to a trauma center for definitive care.
75
More than a third of patients with severe injuries in the United States, and as many as
60% in certain regional trauma systems, are admitted to non-trauma centers65, 68, 107, 108
. However,
because there is strong evidence that admission at non-trauma centers is associated with excess
mortality, it is generally accepted that admission at such centers is not desirable19, 47
. In contrast,
transfer would appear to be an acceptable alternative for patients who are undertriaged.
Several large cohort studies have shown no increase in mortality or have demonstrated
lower mortality among transfer patients compared to patients transported directly to a designated
center109-114
. These data would suggest that undertriage is not harmful if definitive care is
eventually provided at a trauma center. However, previous studies examining the effect of
interfacility transfer on mortality among undertriaged patients have had significant
methodological limitations. Specifically, these studies have largely drawn their data from trauma
center registries109-111, 113, 114
. Because trauma center registries only collect data on patients
surviving to the trauma center, they are subject to survivor bias; deaths attributable to undertriage
that occur prior to arrival at the trauma center are not counted. This informative censoring might
underestimate the harm of undertriage. In this Chapter, we postulate that a correct (unbiased)
analysis of outcomes among patients requiring transfer, including those who die prior to arrival
at a trauma center, will demonstrate a significantly higher mortality compared to patients triaged
directly to a trauma center. If correct, these findings would argue for the need to improve access
to trauma center care in underserved areas, to implement policies to minimize undertriage in
areas where trauma centers are accessible, and to improve the care of patients for whom
undertriage is unavoidable.
76
5.3. Methods
Study design
We performed a retrospective cohort study of severely injured patients in Ontario, and
examined the relationship between undertriage, interfacility transfer and mortality using two
analytic approaches. First, we used a database that captured all deaths among injured patients
transported to hospital in our region to estimate the mortality associated with undertriage. We
then contrasted our findings with those that would be obtained through the more common trauma
registry perspective. This strategy allowed us to produce an unbiased estimate of the mortality
attributable to transfer, and to estimate the bias associated with previous trauma registry-based
analyses of undertriage and transfer.
Study subjects
NACRS, which records all emergency department visits in the region, was
deterministically linked to the DAD, which records all acute care hospitalizations. Records were
linked using a unique identification number (IKN) used at ICES. As such, both in-hospital and
emergency department deaths occurring prior to admission were captured. Within this dataset,
we identified adult subjects (age > 18) presenting to any emergency department (trauma center or
non-trauma center) with a severe injury between July 1, 2002 and December 31, 2007.
The presence of injury was identified by means of an injury-related ICD-10 diagnosis
code (range S-T14.9). Severe injury was defined as either an ISS > 15 or death within 24 hours
of presentation. This definition of severe injury assumes that early death is a result of injuries
that would have been assigned an ISS > 15 if the patient had survived long enough to have
77
undergone complete diagnostic assessment. AIS scores and ISS were obtained from ICD-10
codes by means of the ICD-10 to ISS crosswalk algorithm described in Chapter 4. ICD-10
diagnoses in the DAD were used to calculate ISS for all patients with an admission record. If no
admission record was identified (i.e. the patient died in the emergency department), ICD-10
diagnoses from the NACRS records were used to calculate ISS.
Patient demographics (age and sex) were captured from NACRS. Patient comorbidities
were identified using a two-year look back period in the DAD. An unweighted Charlson score
was calculated for each patient. The Charlson score identifies the following comorbidities:
myocardial infarct, congestive heart failure, peripheral vascular disease, cerebrovascular
disease, dementia, chronic pulmonary disease, connective tissue disease, peptic ulcer disease,
liver disease, diabetes, hemiplegia, moderate or severe renal disease, diabetes with end
organ damage, any malignant or non-malignant solid neoplasm, metastatic solid neoplasm,
leukemia, lymphoma and AIDS115
.
Injury mechanism was assigned by means of external cause of injury code (E-code), and
using the Center for Disease Control External Cause of Injury Mortality Matrix for ICD-10
(Appendix B)94, 95
. Patients with injuries due to burns and corrosion injury, poisoning or
environmental exposure, and patients with complications of medical care and late effects of
injury were excluded; these patients are not typically triaged to trauma centers, and are not
thought to benefit from trauma center care.
Patients who had a NACRS record with an injury diagnosis code within 3 months of the
index event were also excluded, in order to exclude patients presenting for complications of
78
earlier injuries. Finally, patients discharged home from the emergency department were
excluded, as these patients likely did not have severe injuries.
Patients who were dead on arrival (DOA) to the emergency department were also
excluded from the analysis, as their outcomes will not be influenced by the type of care received.
The definition of DOA was operationalized to include patients with an emergency department
discharge diagnosis of DOA in NACRS and patients who died within 30 minutes of emergency
department presentation. Time to death in the emergency department was calculated using the
difference between triage time and visit completed time in NACRS. Finally, because the ability
of pre-hospital personnel to perform a declaration of death varies across Ontario, patients with a
non-urgent triage acuity score (Canadian Triage Acuity Scale 4 or 5)116
and death in the
emergency department were also excluded, as these cases likely represent patients transported to
the emergency department for declaration of death.
Patients admitted to non-trauma centers were not included in analysis. In this chapter, we
wished to examine the relative mortality of direct transport versus transfer to a trauma center.
Since patients admitted to a non-trauma center are not eligible for care at a trauma center, their
outcomes are not relevant to this analysis. Outcomes among patients admitted to non-trauma
centers will be discussed in Chapter 6.
Patients were considered to be transferred if they had two hospital records within a 24
hour period, the first at a non-trauma center and the second at a trauma center. This 24 hour
period began with the triage time recorded in the first NACRS record for the patient. For all
patients, we identified patients who had a NACRS record at a second institution with a triage
time within 24 hours of the first, or a DAD record at a second institution with an admission time
79
within 24 hours of the first; such patients were considered transferred. Patients transferred from a
non-trauma center to another non-trauma center were excluded, as were patients who were
transferred more than once.
Institutions were classified as either trauma centers or non-trauma centers based on the
list of trauma centers presented in Chapter 1, Table 1.2. One additional institution that is not a
designated trauma center was included in the list of trauma centers. This non-trauma center has a
dedicated neurosurgical intensive care unit which acts as an adjunct to nearby trauma centers. It
was felt that identifying this institution as a trauma center would more accurately reflect practice
within the province.
Study groups
Among study subjects, we identified three groups of patients (Figure 5.1). The DIRECT
group consisted of patients who were transported directly from the scene to a trauma center. The
TRANSFER group was comprised of patients who were successfully transferred from a non-
trauma center to a trauma center. These two patient groups would generally be represented in
trauma center registries, and conventional analyses have simply compared outcomes in the
TRANSFER group to those in the DIRECT group. This study allowed us to identify a third
group of interest: patients triaged to a non-trauma center that died in the non-trauma center
emergency department prior to successful transfer or admission to the non-trauma center (ED-
DEATH group). We classified patients in the ED-DEATH group as potential transfers, as in
virtually all cases, there was likely an intent to transfer, with limited access to in-hospital
resources and to transportation assets contributing to death at the non-trauma center. We
80
considered the combined TRANSFER and ED-DEATH groups as the true cohort of undertriaged
patients who required interfacility transfer – the UNDERTRIAGE group.
Classification of ED-DEATH patients in the UNDERTRIAGE group was based on a
number of considerations. First, by excluding early deaths (<30 minutes), patients in the ED-
DEATH cohort had survival times of adequate length for transfer to be considered. This
assumption would also be confirmed by our sensitivity analysis (described below). In addition,
prolonged emergency department times in the absence of hospital admission among these
patients suggest that providers at non-trauma centers recognized that these severely injured
patients should be admitted elsewhere. Together, these characteristics strongly suggested that
patients dying prior to transfer were potential candidates for trauma center care, and thus
transfer.
Outcome analyses
The primary outcome for this study was 30 day mortality, identified using the RPDB. We
first reproduced previous trauma registry analyses, comparing outcomes in the TRANSFER
group to DIRECT group to derive estimates of the relative risk of death among undertriaged
patients ignoring survivor bias. We then evaluated the relative risk of death in the
UNDERTRIAGE group compared to the DIRECT group, mitigating the potential for survivor
bias.
It is plausible that in some circumstances, undertriage is a necessity due to geography or
other external factors (e.g. adverse weather conditions). However, as previously outlined, 85% of
Ontario’s population lives within a 1 hour catchment area of a trauma center31, 77
. We therefore
performed a sensitivity analysis which compared the UNDERTRIAGE group to the DIRECT
81
group, and limited the UNDERTRIAGE group to those surviving at least one hour in an
emergency department at a non-trauma center. In addition, time to death was recorded among all
patients dying in the emergency department to establish whether transfer would have been
feasible for patients in the ED-DEATH group for whom undertriage was truly inevitable.
Statistical analysis
As undertriage might depend on several patient characteristics that could confound the
relationship between undertriage, transfer and mortality, logistic regression models were used to
produce adjusted mortality estimates. Patient characteristics included in these models were age,
gender, comorbidity, mechanism of injury, ISS and severe injury (AIS > 3) in the head, chest and
abdomen region. Patients with missing values were included in the model, with the missing value
replaced with a missing indicator. Model calibration was estimated using the Hosmer-Lemeshow
statistic and discrimination using the c-statistic. In each model, the c-statistic exceeded 0.8,
suggesting excellent discrimination, and models demonstrated adequate calibration.
Means and standard deviations were calculated for continuous variables and absolute and
relative frequencies were measured for discrete variables. Continuous and categorical variables
were compared using the standardized difference. Standardized difference of less than 10%
represents negligible imbalance in the covariate across groups117, 118
. All data were analyzed
using SAS (9.1, Cary, NC).
5.4. Results
There were 11,398 severely injured patients who met inclusion criteria, 2,065 (18%) of
whom died within 30 days. 7,481 (66%) patients were transported directly to a trauma center
(DIRECT group), and 3,469 (30%) patients were successfully transferred to a trauma center from
82
non-trauma center (TRANSFER group). An additional 448 patients (4%) died prior to transfer
(ED-DEATH group). Patients in the ED-DEATH group constituted 11% of the UNDERTRIAGE
group but 51% of deaths among undertriaged patients and 22% of all deaths in the study. The
median time to death among patients at non-trauma center EDs was 2.7 hours (IQR 1.2-4.6). Of
the 448 patient dying prior to transfer, 93 (21 %) died within one hour of presentation.
There were significant differences in baseline characteristics of patients across study
groups (Table 5.1 and Table 5.2). Patients in the UNDERTRIAGE and DIRECT groups had a
similar distribution of demographic characteristics, but patients in the DIRECT group had more
penetrating injuries and lower ISS. Patients who died prior to successful transfer were more
likely to be female, older, and to have comorbidities, penetrating trauma and severe head injuries
(Table 5.3).
Conventional (trauma registry) analyses
We examined the mortality among patients who experienced undertriage and transfer, as
compared to mortality among patients triaged directly to a trauma center. This approach
replicated estimates that would be produced from trauma registry analyses (Figure 5.2). The
crude mortality in the TRANSFER group was 12% (n = 425), compared to 16% (n = 1,192) in
the DIRECT group (unadjusted OR 0.74, 95% CI 0.65-0.83). After adjustment the risk of death
was equivalent at 30 days (OR 0.91, 95% CI 0.80-1.04) in the TRANSFER group compared to
the DIRECT group. Thus, conventional analyses suggest direct transport to a trauma center
offers no benefit over transfer.
83
Population-based analyses
We repeated our estimates of mortality comparing the population-based group of
undertriaged patients (UNDERTRIAGE) to the DIRECT group (Figure 5.2). When patients who
died awaiting transfer were included in estimates of crude mortality, the calculated mortality rate
among undertriaged patients increased from 12% to 22% (n = 3,917). The unadjusted OR for
death in the UNDERTRIAGE group, compared to the DIRECT group, was 1.51 (95% CI 1.37-
1.67). After adjusting for potential confounders of injury-related mortality, the adjusted OR for
death in the UNDERTRIAGE group compared to the DIRECT group was 1.24 (95% CI 1.10-
1.40). Population-based analyses of patients requiring interfacility transfer to trauma center care
were therefore the reverse of estimates from conventional analyses of the same data, and suggest
that the true cost of undertriage at a population level is an excess mortality of almost 25%.
We repeated both conventional and population-based analyses limiting to patients
surviving at least one hour after emergency department presentation at a non-trauma center. This
time point was selected as, if patients could have survived at least one hour, they would have
likely survived to reach a trauma center if transported directly there from the field. Excluding
these patients did not materially change the results (Figure 5.2).
5.5. Discussion
Previous studies have suggested that patients reaching trauma center care by means of
interfacility transfer have mortality rates equivalent to, or lower than, patients transported
directly from the scene of injury109-114
. These data suggest that the process of interfacility
transfer to trauma center care carries no additional risk compared to direct trauma center
transport, and mitigates the potential risks associated with undertriage. However, virtually all
84
published evidence regarding the impact of undertriage among patients who receive interfacility
transfer has relied on data from trauma center registries109-111, 113, 114, 119
, which systematically
exclude patients dying prior to transfer.
In this Chapter, we compared mortality estimates for patients requiring transfer estimated
using two approaches: an approach that produced mortality estimates based on simulated trauma
center registry data, and an approach that produced mortality estimates derived from population-
based data. Our objectives were to produce accurate estimates of the mortality attributable to the
process of undertriage and transfer, and to evaluate the degree of bias associated with previous
estimates. We demonstrated that 11% of patients eligible for transfer died in the emergency
department of a non-trauma center waiting for transfer to occur. Emergency department deaths at
non-trauma centers accounted for half of all deaths among undertriaged patients – deaths that
have been systematically missed in studies using trauma center registry data. By including
outcomes among patients both awaiting and receiving transfer, we have shown that transfer
status (or intent to transfer) is associated with a mortality increase of approximately 25%. These
data suggest that the mortality costs of undertriage are significantly higher than previously
thought. Trauma center care by means of transfer is inferior to direct transport. Our data also
support the need to utilize population-based data when evaluating the mortality associated with
undertriage and with transfer at the system level.
Our findings are likely representative of triage and transfer patterns in other trauma
systems. The rate of undertriage in Ontario is within the range of others previously reported47, 65,
68, 107, 108. Transfer patients represented 32% of trauma center admissions in this analysis, which
is similar to transfer rates at level 1 trauma centers throughout North America110, 112, 120, 121
.
Additionally, the impact of deaths occurring in the prior to transfer among undertriaged patients
85
is not entirely unique to our study. For example, in a study of patients first treated at rural
hospitals across Oregon and Washington state, 18% of deaths occurred in the emergency
department of rural hospitals, prior to admission or transfer to a higher level of care122
. In another
study examining the benefits of transfer to a level 1 or 2 center, patients dying in the emergency
department prior to admission or transfer were excluded123
. However, these patients would have
represented 38% of all study deaths. Together, these data suggest that a high rate of emergency
department deaths among undertriaged patients is not unique to the region studied.
Some degree of undertriage will occur in any trauma system. Among these patients,
geographic distance and limitations of transportation resources preclude direct transport.
Although direct triage is preferable, transfer to higher levels of care confers a survival advantage
compared to admission at a non-trauma center in this population123
. However, in the present
analysis, the prolonged intervals between arrival at a non-trauma center and death in the ED
death group suggest that transfer patients in Ontario are experiencing considerable delays during
the transfer process. In other reports examining the transfer process, patients spent an average of
2.5 to 4 hours in the emergency department of a non-trauma center prior to transfer109, 110, 124-126
.
Given that approximately 20% of trauma deaths occur between the first and sixth hour after
injury, shortening emergency department lengths of stay might lead to improved survival in
those patients where undertriage is unavoidable22, 127
. However, due to the exclusive trauma
system currently in place in Ontario, no standardized transfer protocols are required at non-
trauma centers. The implementation of such protocols might substantially influence outcomes
among those patients requiring transfer to trauma center care.
This study has a number of potential limitations. Because administrative data does not
contain physiologic data or other direct indicators of injury severity (e.g. Glasgow Coma Scale
86
scores), important confounders of injury-related outcomes might have been omitted from our
regression models. However, given that all other indicators of injury severity were similar across
the DIRECT and UNDERTRIAGE groups, it is unlikely that residual confounding would
significantly affect our major finding. Our findings are also dependent on the quality of
administrative data in the DAD and in NACRS. While external validation studies have shown
that the databases used reliably identify patients with injuries, underreporting of ICD-10
diagnoses may have led to an underestimation of injury severity128, 129
. We attempted to
minimize this possibility by including all patients who died within 24 hours of presentation.
In conclusion, in this Chapter, we have used population-based data to generate accurate
estimates of the excess mortality attributable to undertriage and transfer to trauma center care.
We have demonstrated that at the population level, access to trauma center care by means of
transfer is associated with significantly higher mortality than direct transport. Significantly
reducing current levels of undertriage should be a priority. In addition, efforts must be made to
reduce transfer times and to expedite the transfer process among patients living in remote regions
where direct transport to a trauma center is impossible.
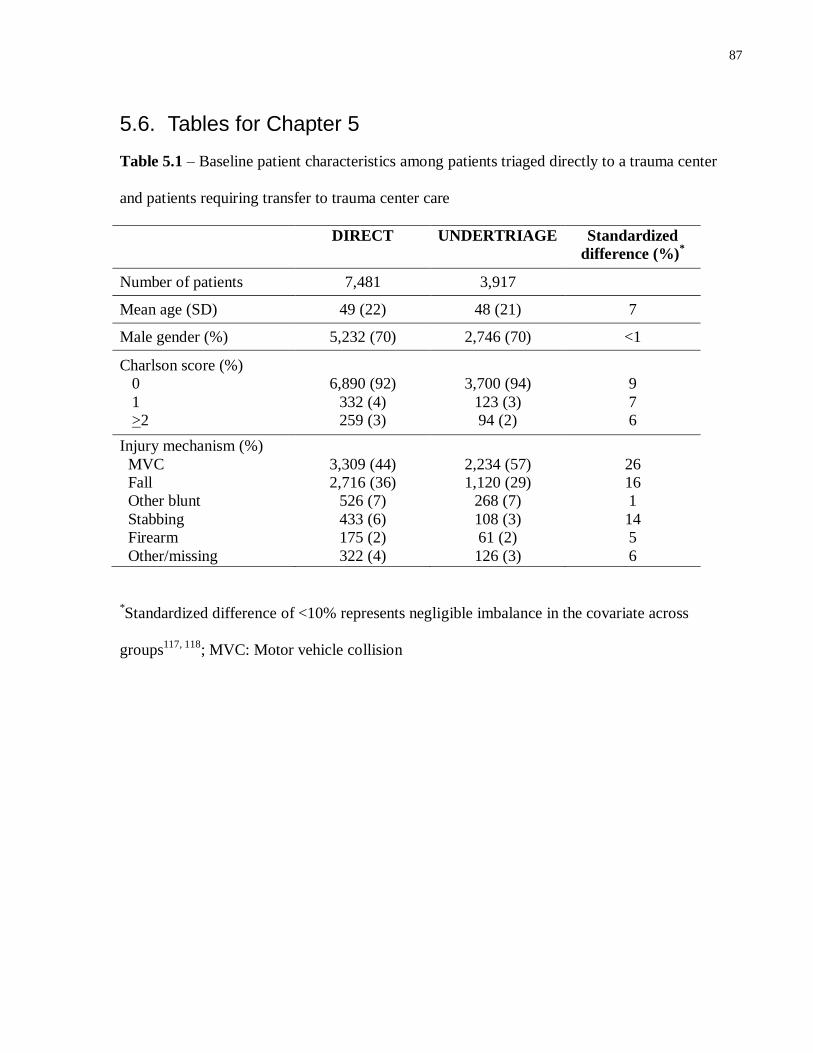
87
5.6. Tables for Chapter 5
Table 5.1 – Baseline patient characteristics among patients triaged directly to a trauma center
and patients requiring transfer to trauma center care
DIRECT UNDERTRIAGE Standardized
difference (%)*
Number of patients 7,481 3,917
Mean age (SD) 49 (22) 48 (21) 7
Male gender (%) 5,232 (70) 2,746 (70) <1
Charlson score (%)
0
1
>2
6,890 (92)
332 (4)
259 (3)
3,700 (94)
123 (3)
94 (2)
9
7
6
Injury mechanism (%)
MVC
Fall
Other blunt
Stabbing
Firearm
Other/missing
3,309 (44)
2,716 (36)
526 (7)
433 (6)
175 (2)
322 (4)
2,234 (57)
1,120 (29)
268 (7)
108 (3)
61 (2)
126 (3)
26
16
1
14
5
6
*Standardized difference of <10% represents negligible imbalance in the covariate across
groups117, 118
; MVC: Motor vehicle collision
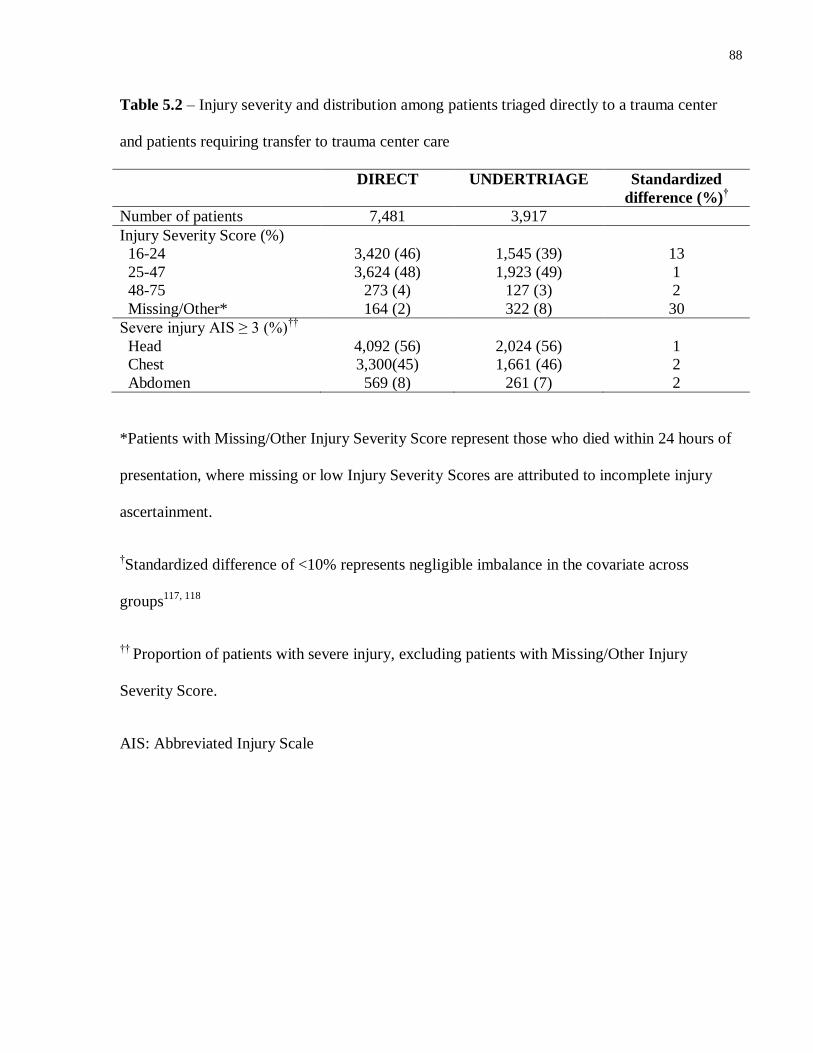
88
Table 5.2 – Injury severity and distribution among patients triaged directly to a trauma center
and patients requiring transfer to trauma center care
DIRECT UNDERTRIAGE Standardized
difference (%)†
Number of patients 7,481 3,917
Injury Severity Score (%)
16-24
25-47
48-75
Missing/Other*
3,420 (46)
3,624 (48)
273 (4)
164 (2)
1,545 (39)
1,923 (49)
127 (3)
322 (8)
13
1
2
30
Severe injury AIS ≥ 3 (%)††
Head
Chest
Abdomen
4,092 (56)
3,300(45)
569 (8)
2,024 (56)
1,661 (46)
261 (7)
1
2
2
*Patients with Missing/Other Injury Severity Score represent those who died within 24 hours of
presentation, where missing or low Injury Severity Scores are attributed to incomplete injury
ascertainment.
†Standardized difference of <10% represents negligible imbalance in the covariate across
groups117, 118
†† Proportion of patients with severe injury, excluding patients with Missing/Other Injury
Severity Score.
AIS: Abbreviated Injury Scale
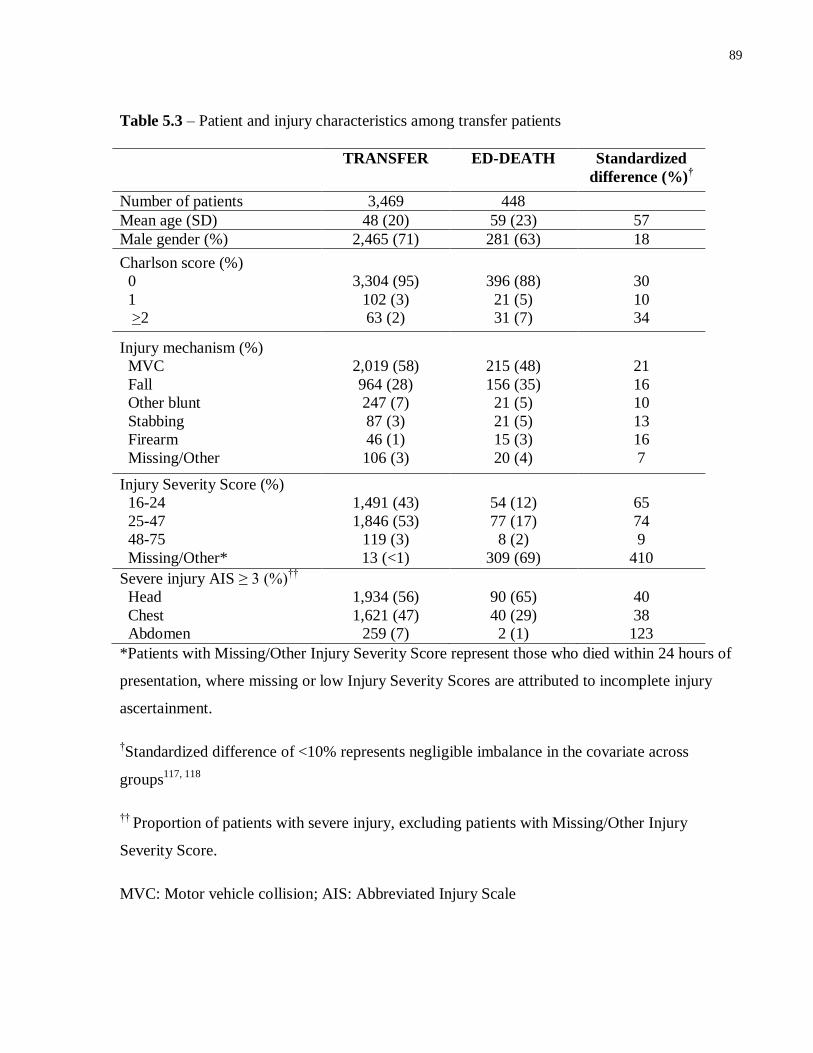
89
Table 5.3 – Patient and injury characteristics among transfer patients
TRANSFER ED-DEATH Standardized
difference (%)†
Number of patients 3,469 448
Mean age (SD) 48 (20) 59 (23) 57
Male gender (%) 2,465 (71) 281 (63) 18
Charlson score (%)
0
1
>2
3,304 (95)
102 (3)
63 (2)
396 (88)
21 (5)
31 (7)
30
10
34
Injury mechanism (%)
MVC
Fall
Other blunt
Stabbing
Firearm
Missing/Other
2,019 (58)
964 (28)
247 (7)
87 (3)
46 (1)
106 (3)
215 (48)
156 (35)
21 (5)
21 (5)
15 (3)
20 (4)
21
16
10
13
16
7
Injury Severity Score (%)
16-24
25-47
48-75
Missing/Other*
1,491 (43)
1,846 (53)
119 (3)
13 (<1)
54 (12)
77 (17)
8 (2)
309 (69)
65
74
9
410
Severe injury AIS ≥ 3 (%)††
Head
Chest
Abdomen
1,934 (56)
1,621 (47)
259 (7)
90 (65)
40 (29)
2 (1)
40
38
123
*Patients with Missing/Other Injury Severity Score represent those who died within 24 hours of
presentation, where missing or low Injury Severity Scores are attributed to incomplete injury
ascertainment.
†Standardized difference of <10% represents negligible imbalance in the covariate across
groups117, 118
†† Proportion of patients with severe injury, excluding patients with Missing/Other Injury
Severity Score.
MVC: Motor vehicle collision; AIS: Abbreviated Injury Scale
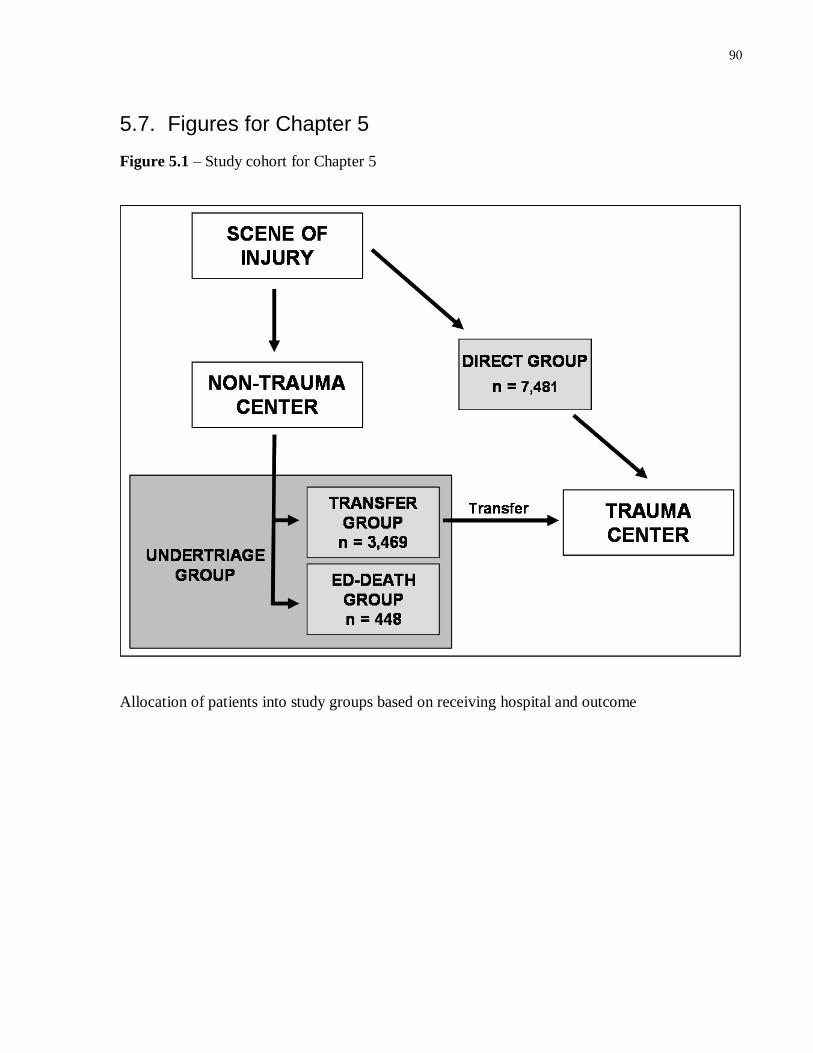
90
5.7. Figures for Chapter 5
Figure 5.1 – Study cohort for Chapter 5
Allocation of patients into study groups based on receiving hospital and outcome
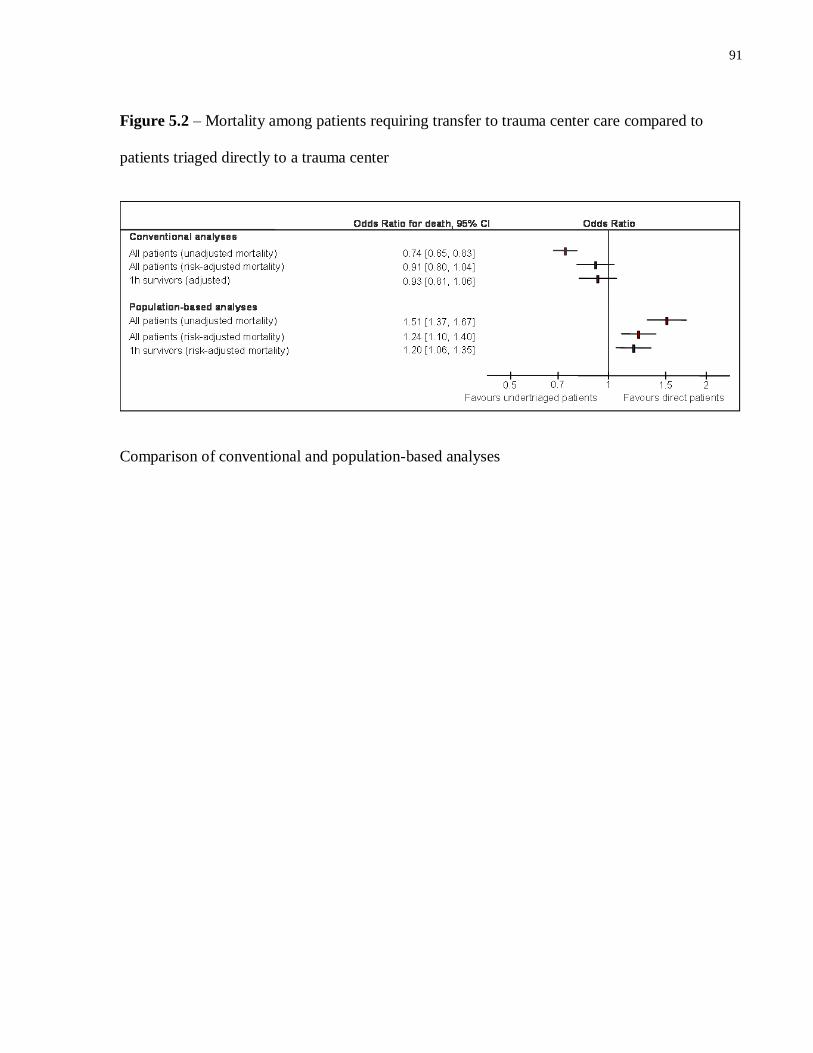
91
Figure 5.2 – Mortality among patients requiring transfer to trauma center care compared to
patients triaged directly to a trauma center
Comparison of conventional and population-based analyses
92
Portions of Chapter 6 have previously appeared in
Haas B, Stukel TA, Gomez D, Zagorski B, De Mestral C, Sharma SV, Rubenfeld GD,
Nathens AB. The mortality benefit of direct trauma center transport in a regional trauma
system: a population based analysis. J Trauma. 2012 June; 72(6):1510-1517.
© Wolters Kluwer Health. The use of this material is by permission of the copyright holder.
93
Chapter 6 A population-based analysis of the mortality associated with
undertriage in Ontario
6.1. Summary
Background
By ensuring timely access to trauma center care, well organized trauma systems have the
potential to significantly reduce injury-related mortality. However, undertriage continues to be a
significant problem in many regional trauma systems. Taking a novel, population-based
approach, we estimated the potential detrimental impact of undertriage to a non-trauma center
within a regional system.
Methods
We performed a population-based, retrospective cohort study of trauma center effectiveness in a
region with urban, suburban and rural areas. Data were derived from administrative databases
capturing all ED deaths and admissions in the region. Adult motor vehicle collision (MVC)
occupants presenting to any ED in the study region were included (2002-2010). Data were
limited to patients with severe injury. The exposure of interest was initial triage destination
(trauma center or non-trauma center), regardless of later transfer to a trauma center. Mortality
was compared across groups, using an instrumental variable analysis to adjust for confounding.
Results
Among 6,341 MVC occupants, 45% (n = 2,857) were triaged from the scene of injury to a
trauma center. Among patients transported from the scene to a non-trauma center, 57% (n =
2,003) were transferred to a trauma center within 24h of initial evaluation. Compared to patients
94
triaged to a non-trauma center, adjusted mortality was lower among patients triaged directly to a
trauma center, both at 24 hrs (OR 0.58, 95% CI 0.41-0.84) and at 48 hrs (OR 0.68, 95% CI 0.48-
0.96). A trend towards reduced mortality with trauma center triage was also observed at 7 days
and 30 days.
Conclusions
Our data are population-based evidence of the early benefits of direct triage to trauma center.
Although many surviving patients are later transferred to a trauma center, initial triage to a non-
trauma center is associated with at least a 30% increase in mortality in the first 48 hours
following injury.
6.2. Introduction
Access to trauma center care among severely injured patients is an essential measure of
trauma system performance19, 28
. One of the significant challenges in system design is
maintaining acceptably low rates of undertriage. A critical step in effecting change is an
understanding of the risk of adverse outcomes associated with undertriage. However, most prior
evaluations lead to biased estimates of undertriage rates as well as the mortality attributable to
undertriage. Either data are derived only from admission records (thus excluding deaths in the
emergency department), or patients accessing trauma center care after initial undertriage to a
non-designated center are analyzed with those who are appropriately triaged65, 68, 130
. In the
previous Chapter, we reported the limitations of the latter approach, which typically grossly
underestimates the mortality associated with transfer to a trauma center from a non-designated
center131
. Finally, rather than examining outcomes among all patients injured within a trauma
system, previous analyses have focused on populations at select institutions. What is currently
95
lacking is an accurate estimate of the benefits of triage to a trauma center at the system level. An
improved understanding of the magnitude and the impact of undertriage might be a very
effective catalyst for change. In this Chapter, we address the gap in estimating the mortality
benefits of triage to a trauma center. We employed a novel, population-based approach to capture
all injured patients in our region, regardless of the site of initial presentation, with the goal of
producing unbiased estimates of the mortality associated with triage of a severely injured patient
to a non-designated center.
6.3. Methods
We performed a population-based, retrospective cohort study of all severely injured motor
vehicle collision (MVC) occupants presenting to an emergency department (ED) in the province
of Ontario between July, 2002 and January, 2010. Our objective was to evaluate mortality among
patients triaged from the scene of injury to a trauma center, as compared to patients who were
triaged to a non-trauma center. We focused on patients injured as a result of MVC because these
patients represent a relatively homogeneous population, have severe, multi-system injuries that
challenge institutional resources, and are likely to benefit from trauma center care61
.
Data sources
As in Chapter 5, NACRS and the DAD were used to evaluate the trajectory of all injured
patients, from emergency department presentation to discharge. All deaths occurring within 30
days of injury were captured using the RPDB.
96
Study subjects
All patients aged 18 or over presenting to an ED with an injury-related diagnosis in
NACRS (ICD10 diagnosis code range S-T14.9) were captured93
. The study population was
limited to patients with severe injury who were MVC occupants. MVC occupants were identified
using the Centers for Disease Control External Cause of Injury Mortality Matrix for ICD-1094, 95
(Appendix B). As in Chapter 5, severe injury was defined as either an ISS >15 or death within 24
hours of presentation. ISS was obtained from ICD-10 codes in NACRS or DAD by means of the
ICD-10 to Abbreviated Injury Scale (AIS) crosswalk algorithm developed in Chapter 4.
Patients discharged home from the ED were excluded, as these patients were not likely to
have had severe injuries. In order to ensure the exclusion of patients presenting to the ED with
complications from previous injuries, we excluded all patients with an injury-related ED visit in
the 3 months prior to the index event. As we wished to examine the effect of trauma center care
on patient outcomes, we excluded patients who were dead on arrival and who died within 30
minutes of ED presentation, as outcomes of these patients were likely not modifiable.
Patients who were transferred from a non-trauma center to a trauma center were
identified. Patients who had records at two different institutions within 24 hours, where the first
was a non-trauma center and the second a trauma center, were considered transfers. Patients who
were transferred more than once within 24 hours were excluded (<5% of cohort).
Patient demographics (age and sex) were captured from NACRS. Patient comorbidities
were identified using a two-year look back period in the DAD. An unweighted Charlson score
was calculated for each patient115
.
97
Analytic approach
We evaluated the association between triage to a trauma center from the scene of injury
and mortality at 24 hours, 48 hours, 7 days and 30 days after injury. Transport of a patient from
the scene to a trauma center is not random, however; EMS personnel may be more likely to
transport more severely injured patients or patients in a specific demographic to a trauma center
than to a non-trauma center. Such systematic differences across patient groups might confound
the relationship between trauma center care and mortality.
An instrumental variable analysis was used to estimate the mortality benefit of triage to a
trauma center. The main assumption underlying an instrumental variable is that it is highly
correlated with the treatment (triage to a trauma center or non-trauma center), but that it is
otherwise unrelated to measured or unmeasured risk factors for death following injury. As such,
the instrumental variable is not directly or indirectly associated with patient outcome, except
through the treatment132, 133
. Instrumental variable analysis is frequently compared to the process
of randomization in a randomized controlled trial, where allocation to the treatment group is very
closely linked to the probability of treatment, but unrelated to outcome.
We defined a “county-level trauma center transport rate” to be used as the instrumental
variable, defined as the proportion of severely injured patients in a county that were transported
directly to a trauma center among all persons severely injured in that county. With this approach,
all patients within a county are assigned the same value for the instrument. Patients with severe
injury at the county level were defined as those patients presenting to the ED with an injury-
related diagnosis in NACRS (ICD10 diagnosis code range S-T14.9) and with severe injury. Note
the denominator excludes patients who died at the scene. The county-level trauma center
98
transport rate is a valid instrumental variable because patient-level factors related to the
probability of death following an MVC are likely comparable across regions with significantly
different rates of transport to a trauma center. The use of a regional rate of transport to trauma
center care is analogous to instruments previously used to evaluate the benefits of cardiac
catheterization following myocardial infarction134
.
Our analysis relies on the assumption that patients in counties with low and high trauma
center referral rates have similar severity of illness, mechanisms of injury, comorbidity, and
other factors that would determine outcome. Although it is possible to explore the relationship
between county-level trauma center transport rate and patient-level predictors of injury-related
mortality, the independence of the instrumental variable and of these factors cannot be proven
directly. However, we examined the association between the county-level trauma center
transport rate and known confounders of injury-related mortality.
Counties were ranked based on their county-level trauma center transport rate, and then
separated into quartiles with approximately equal numbers of patients. Using standardized
differences, patient and injury characteristics were compared across quartiles of counties with the
highest and with the lowest county-level trauma center transport rates. In addition to age, gender,
and comorbidities, we also evaluated the distribution of ISS and severe (AIS > 3) head, chest and
abdominal injuries across quartiles of county-level trauma center transport rate. We also assessed
the mean predicted probability of 30 day mortality across quartiles of the instrumental variable.
The predicted probability of 30 day mortality for each patient was estimated using a logistic
regression model that incorporated age, gender, comorbidities, ISS and severe (AIS > 3) head,
chest and abdominal injuries as covariates.
99
Statistical analyses
Continuous and categorical variables were compared using the standardized difference.
Standardized differences of less than 10% represents a negligible imbalance in the covariate
across groups117, 118
. The instrumental variable analysis was conducted using a full-information
maximum likelihood bivariate probit estimation. Separate models were used to estimate the
mortality benefit associated with direct transport to trauma center care at 24 hours, 48 hours, 7
days and 30 days. Patient age, gender and comorbidities (defined as a categorical variable based
on number of comorbidities) were incorporated into each model. The county-level trauma center
transport rate was entered into the model as a continuous variable. Odds ratios were estimated
from the parameter estimates produced in each model136
. Univariate analyses were conducted in
SAS (version 9.2, Cary, NC). Instrumental variable analysis was conducted in STATA (version
9, College Station, TX).
6.4. Results
There were 6,341 patients meeting inclusion criteria over the nine years of study. During
this interval, 45% (n = 2,857) of severely injured MVC occupants were transported from the
scene of injury to a trauma center (Fig 6.1). Of 3,484 patients transported from the scene of
injury to a non-trauma center, 57% (n = 2,003) were ultimately transferred to a trauma center
after their initial evaluation. Overall, 77% (4,860) of patients received trauma center care
following their MVC.
Patients initially triaged to trauma centers and non-trauma centers differed significantly
in baseline and injury characteristics (Table 6.1). Compared to patients transported to a non-
trauma center, patients triaged directly to a trauma center were younger and had a higher
recorded ISS. However, a significantly greater number of patients triaged to a non-trauma center
100
died early (within 24 hrs of presentation) and thus had a missing or low (< 15) ISS, as described
in Methods. The differential in rates of missing/low ISS in non-trauma centers and trauma
centers emphasizes the challenge of early identification of injuries in the non-trauma center, and
the potential for bias inherent in including ISS or AIS from trauma centers and non-trauma
centers in risk adjustment models.
The crude mortality in the cohort was 12% (n = 761). There was no significant difference
in crude mortality across trauma centers and non-trauma centers at 24 hours, 48 hours, 7 days or
30 days (Table 6.2). However, the ED mortality rate at non-trauma centers was twice that for
patients initially transported to a trauma center.
Patient characteristics
The instrumental variable ranged from as low as 6% to as high as 90%. Specifically, as few as
6% to as many as 90% of severely injured patients within a county were transported directly to a
trauma center. Rates of direct transport of severely injured MVC occupants ranged from as low
as 20% (n=320) to as high as 77% (n=1,157) across quartiles of the instrumental variable. When
the proportion of patients who received care at a trauma center at any time during their injury
episode (including transfers to a trauma center) was calculated, there continued to be a
significant difference in the probability of trauma center care across IV quartiles, with as few as
64% (n = 1,023) of patients in the lowest quartile receiving trauma center care, compared to 92%
(n = 1,380) of patients in the highest quartile. Predicted 30 day mortality did not differ
significantly across quartiles of county-level trauma center transport rate. There were no
significant differences in patient sex, age or comorbidity burden across quartiles of the
instrumental variable (Table 6.3). ISS was comparable across quartiles of county-level trauma
center transport rate, with the exception of an overrepresentation of patients with very severe
injuries (ISS > 47) among patients in counties with high county-level trauma center transport
101
rates. Rates of severe injury (AIS > 3) to the head and chest were similar across all quartiles; as
with ISS, patients in counties with the highest county-level trauma center transport rates were
more likely to have a severe injury to the abdomen. These findings suggest that patient and
injury characteristics are similar across counties with highly divergent county-level trauma
center transport rates and thus validate the instrumental variable.
Instrumental variable analysis
Our adjusted analysis using the instrumental variable approach demonstrated that direct
transport to a trauma center was associated with significantly lower mortality at 24 hours and 48
hours following injury (OR 0.58, 95%CI 0.41-0.84 at 24 hours; OR 0.68, 95%CI 0.48-0.96 at 48
hours). In addition, there was a persistent, albeit non-significant, lower mortality at later time
points (Figure 6.2).
6.5. Discussion
Trauma centers are the anchor of an organized trauma system and an essential component
of injury-related public health policy. Despite the compelling evidence favoring the treatment of
severely injured patients at designated trauma centers36, 38, 47
, a significant proportion of patients
continue to receive definitive management of their injuries at non-trauma centers. In prior
reports, over a third of severely injured patients receive definitive care at non-trauma centers65, 68,
130. These analyses likely underestimated the magnitude of undertriage rates that exist in
contemporary trauma systems. Data regarding emergency department deaths are generally
unavailable at the population level, and patients undergoing transfer after initial undertriage to a
non-trauma center have previously been classified as appropriately triaged in population-based
analyses65, 68, 130
. Given these limitations, accurate, population-based estimates of undertriage
102
rates and of the mortality cost of undertriage have been lacking. Such data are highly relevant for
the purposes of trauma system planning and quality improvement.
In this Chapter, we utilized population-based datasets to capture all severely injured
MVC occupants arriving alive to any acute care hospital in our region. Unlike previous analyses,
we were able to capture patients who died in the emergency department prior to admission. We
were also able to identify the first hospital at which the patient received care, allowing us to
accurately classify patients who were initially undertriaged but underwent transfer to trauma
center care. We demonstrated that more than half of severely injured MVC occupants
experienced undertriage, and were transported from the scene of injury to a non-trauma center.
Using an instrumental variable analysis, we identified a 30 to 40% lower mortality at 24 and 48
hours among patient triaged directly to a trauma center, compared to patients who were
undertriaged, with a lower, albeit non-significant, difference at 7 days and 30 days following
injury.
The use of an instrumental variable approach was based on a number of considerations.
Transport of a patient from the scene to a trauma center is not random; more severely injured
patients are more likely to be transported to a trauma center. As a result, both measured and
unmeasured confounders might bias the analysis of the relationship between trauma center care
and mortality. Administrative data may be particularly prone to unmeasured confounding for two
reasons. First, administrative data does not capture several common measures used in risk
adjustment of injury-related outcomes (e.g. systolic blood pressure, Glasgow Coma Scale
scores). In addition, the accuracy of injury scoring is likely to differ significantly across trauma
centers and non-trauma centers due to differences in diagnostic resources, particularly among
patients who die early in their hospital course. Commonly used means of statistical adjustment,
such as logistic regression or propensity score analyses, which adjust only for measured
103
confounders, are therefore inadequate133, 134
. Instrumental variable analysis is an alternative
approach that minimizes unmeasured confounding and thus overcomes some of the limitations
described above.
Instrumental variable analysis produces estimates of the treatment effect on the “marginal
population”134, 137
. In this study, this marginal population represents patients whose treatment
would change across counties, and excludes those who would always (or never) be directly
transported to a trauma center across all counties. As such, our analysis provides an estimate of
the reduction in mortality that would result if, due to policy changes, a county transitioned from
having a low rate of transport to a trauma center to a high rate of transport to a trauma center.
The precise size of the population that would benefit, and therefore the number of lives saved by
reducing undertriage in the region, cannot be directly estimated. However, we believe that a
large majority of patients who experienced undertriage in the present analysis fall into the
marginal population. The county-level trauma center transport rate ranged from as low as 6 (6%
of patients in the county were triaged directly to a trauma center) to 90 (90% of patients in the
county were triaged directly to a trauma center). This range suggests that there is a significant
proportion of patients eligible for, but not receiving, direct transport to a trauma center in the
study region.
Our data might be interpreted as suggesting that there is no benefit to trauma center care
beyond 48 hours. We do not feel our findings support such a conclusion. Trauma center
designation emphasizes the human and physical resources required to stabilize and treat the
severely injured patients in the period immediately following injury18, 19
. Less specific guidance
is provided regarding the resources required to care for patients who survive initial resuscitation
and care. As such, whereas early trauma center care is likely to be relatively homogeneous across
104
trauma centers, care provided after initial stabilization may be more heterogeneous. It is likely
that the non-significant outcomes at 7 and 30 days are a reflection of this heterogeneity.
Nevertheless, the improved survival observed at trauma centers at 24 and 48 hours suggest that
there is an opportunity to intervene in that time period.
Our study has several potential limitations. Firstly, we evaluated the similarity of patients
across quartiles of our instrumental variable using ISS and AIS, while acknowledging that these
scores might not be directly comparable across trauma centers and non-trauma centers due to
differences in injury ascertainment. Nevertheless, we felt that evaluating these metrics of injury
across quartiles of our county-level trauma center transport rate was important, both to
characterize our population and to evaluate the validity of our instrumental variable. An observed
imbalance in these measures of injury severity across quartiles, namely, more severe injuries in
quartiles with low county-level trauma center transport rates, would lead us to conclude that our
chosen instrument is not valid, and biased against non-trauma center care.
Although our analysis captures all patients who arrived alive to the emergency
department, our data do not capture patients dying prior to hospital arrival. Approximately half
of patients die in the prehospital setting77
; if more prehospital deaths occurred in areas with a
high county-level trauma center transport rate, trauma center care might not offer any benefit at
the system level. However, such a distribution of prehospital deaths is unlikely. Prehospital
deaths are significantly more likely in rural areas, where geographic barriers to trauma center
access exist77
. As such, a link between high county-level trauma center transport rate (lower
probability of undertriage) and high probability of prehospital death is unlikely.
In addition to the distribution of prehospital deaths, it is possible that our analyses might
be biased due to the choice of an invalid instrumental variable. Specifically, the accuracy of our
instrumental variable analysis is dependent on ensuring that the county-level trauma center
105
transport rate is not associated directly with any confounders of injury-related death. Due to the
use of administrative data, specific physiologic variables, such as blood pressure and Glasgow
Coma Scale score, were not available, and could not be compared directly across quartiles of
county-level trauma center transport rate. In addition, due to differences in diagnostic resources
and injury ascertainment across trauma centers and non-trauma centers, direct comparisons of
ISS and AIS across quartiles of county-level trauma center transport rate were potentially biased.
If patients in counties with low county-level trauma center transport rates were consistently more
severely injured, our findings might be significantly biased. An inverse relationship between
county-level trauma center transport rate and injury severity is unlikely, however.
In conclusion, fewer than half of patients sustaining severe injuries as occupants in motor
vehicle collisions in the province of Ontario are triaged from the scene of injury to a trauma
center. Additionally, only half of undertriaged patients are eventually transferred to trauma
center care. Using an instrumental variable analysis, we have demonstrated that, at the
population level, undertriage is associated with an up to 40% increase in mortality at 24 hours
and 48 hours. These data suggest that current rates of undertriage in Ontario result in a high rate
of preventable deaths among patients injured in motor vehicle collisions. Strategies to reduce
undertriage need to be implemented and evaluated.
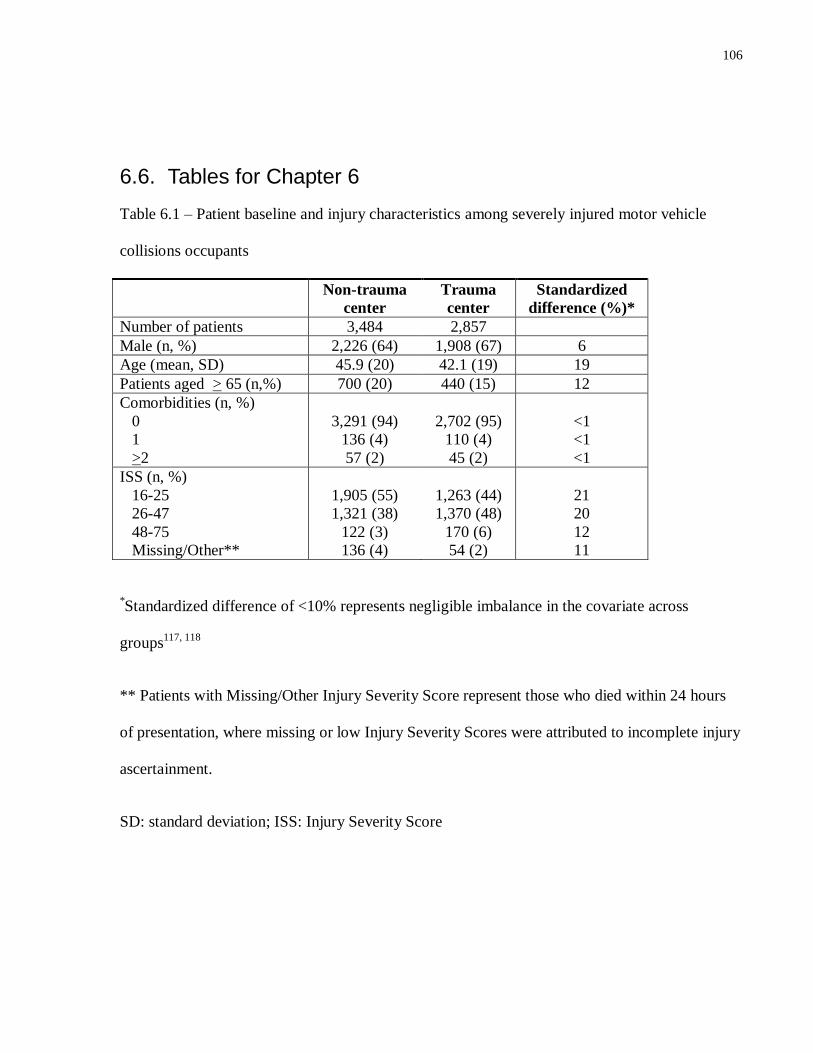
106
6.6. Tables for Chapter 6
Table 6.1 – Patient baseline and injury characteristics among severely injured motor vehicle
collisions occupants
Non-trauma
center
Trauma
center
Standardized
difference (%)*
Number of patients 3,484 2,857
Male (n, %) 2,226 (64) 1,908 (67) 6
Age (mean, SD) 45.9 (20) 42.1 (19) 19
Patients aged > 65 (n,%) 700 (20) 440 (15) 12
Comorbidities (n, %)
0
1
>2
3,291 (94)
136 (4)
57 (2)
2,702 (95)
110 (4)
45 (2)
<1
<1
<1
ISS (n, %)
16-25
26-47
48-75
Missing/Other**
1,905 (55)
1,321 (38)
122 (3)
136 (4)
1,263 (44)
1,370 (48)
170 (6)
54 (2)
21
20
12
11
*Standardized difference of <10% represents negligible imbalance in the covariate across
groups117, 118
** Patients with Missing/Other Injury Severity Score represent those who died within 24 hours
of presentation, where missing or low Injury Severity Scores were attributed to incomplete injury
ascertainment.
SD: standard deviation; ISS: Injury Severity Score
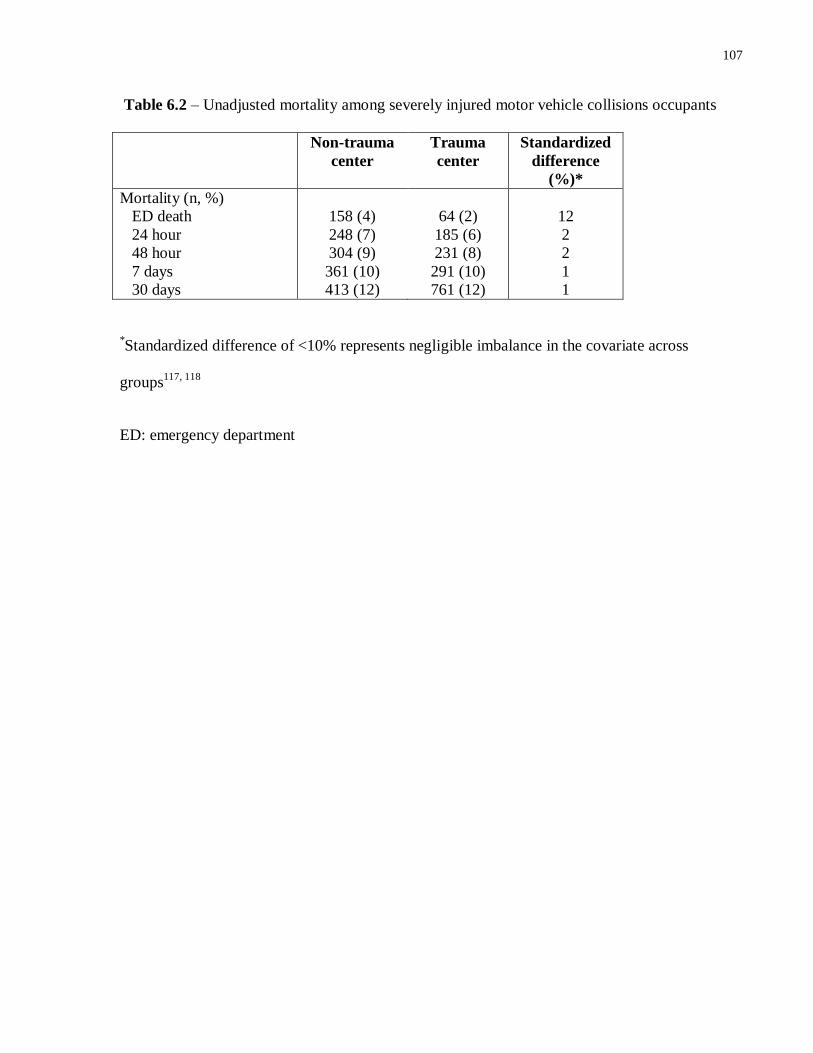
107
Table 6.2 – Unadjusted mortality among severely injured motor vehicle collisions occupants
Non-trauma
center
Trauma
center
Standardized
difference
(%)*
Mortality (n, %)
ED death
24 hour
48 hour
7 days
30 days
158 (4)
248 (7)
304 (9)
361 (10)
413 (12)
64 (2)
185 (6)
231 (8)
291 (10)
761 (12)
12
2
2
1
1
*Standardized difference of <10% represents negligible imbalance in the covariate across
groups117, 118
ED: emergency department
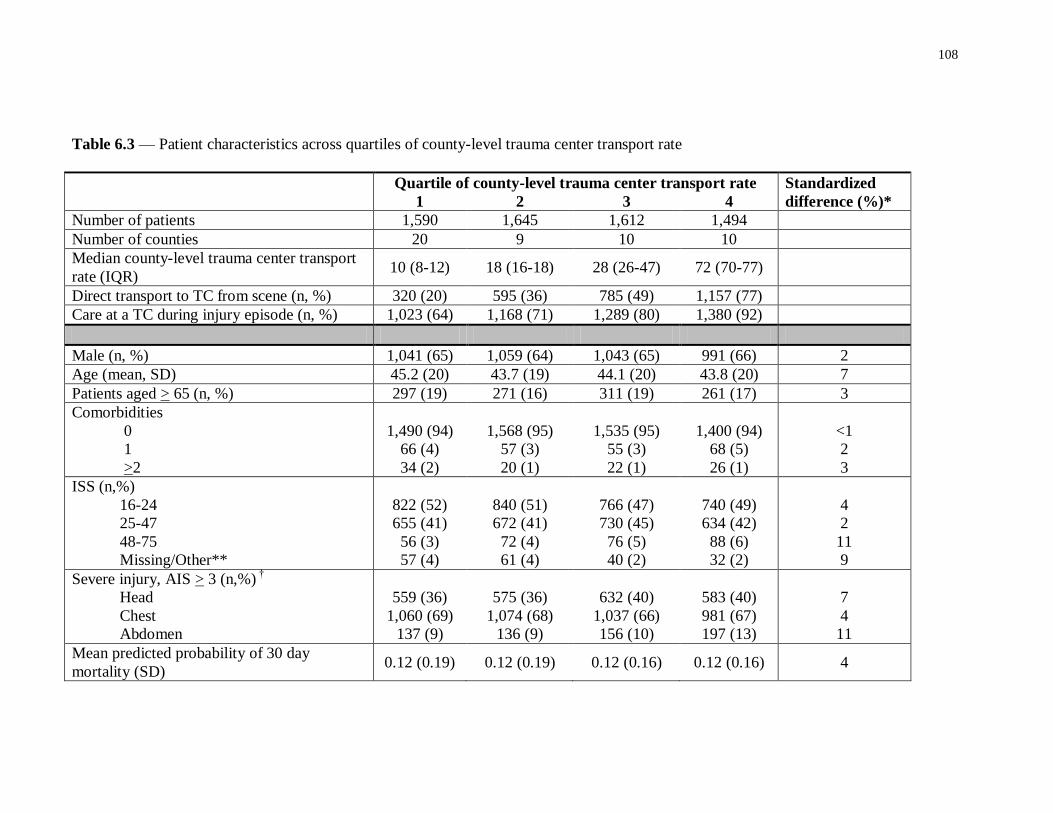
108
Table 6.3 –– Patient characteristics across quartiles of county-level trauma center transport rate
Quartile of county-level trauma center transport rate Standardized
difference (%)* 1 2 3 4
Number of patients 1,590 1,645 1,612 1,494
Number of counties 20 9 10 10
Median county-level trauma center transport
rate (IQR) 10 (8-12) 18 (16-18) 28 (26-47) 72 (70-77)
Direct transport to TC from scene (n, %) 320 (20) 595 (36) 785 (49) 1,157 (77)
Care at a TC during injury episode (n, %) 1,023 (64) 1,168 (71) 1,289 (80) 1,380 (92)
Male (n, %) 1,041 (65) 1,059 (64) 1,043 (65) 991 (66) 2
Age (mean, SD) 45.2 (20) 43.7 (19) 44.1 (20) 43.8 (20) 7
Patients aged > 65 (n, %) 297 (19) 271 (16) 311 (19) 261 (17) 3
Comorbidities
0
1
>2
1,490 (94)
66 (4)
34 (2)
1,568 (95)
57 (3)
20 (1)
1,535 (95)
55 (3)
22 (1)
1,400 (94)
68 (5)
26 (1)
<1
2
3
ISS (n,%)
16-24
25-47
48-75
Missing/Other**
822 (52)
655 (41)
56 (3)
57 (4)
840 (51)
672 (41)
72 (4)
61 (4)
766 (47)
730 (45)
76 (5)
40 (2)
740 (49)
634 (42)
88 (6)
32 (2)
4
2
11
9
Severe injury, AIS > 3 (n,%) †
Head
Chest
Abdomen
559 (36)
1,060 (69)
137 (9)
575 (36)
1,074 (68)
136 (9)
632 (40)
1,037 (66)
156 (10)
583 (40)
981 (67)
197 (13)
7
4
11
Mean predicted probability of 30 day
mortality (SD) 0.12 (0.19) 0.12 (0.19) 0.12 (0.16) 0.12 (0.16) 4
109
* Standardized difference of <10% represents negligible imbalance in the covariate across groups
117, 118
**Patients with Missing/Other Injury Severity Score represent those who died within 24 hours of presentation, where missing or low
Injury Severity Scores are attributed to incomplete injury ascertainment.
† Proportion of patients with severe injury, excluding patients with Missing/Other Injury Severity Score.
IQR:interquartile range; TC: trauma center; SD: standard deviation; AIS: Abbreviated Injury Scale
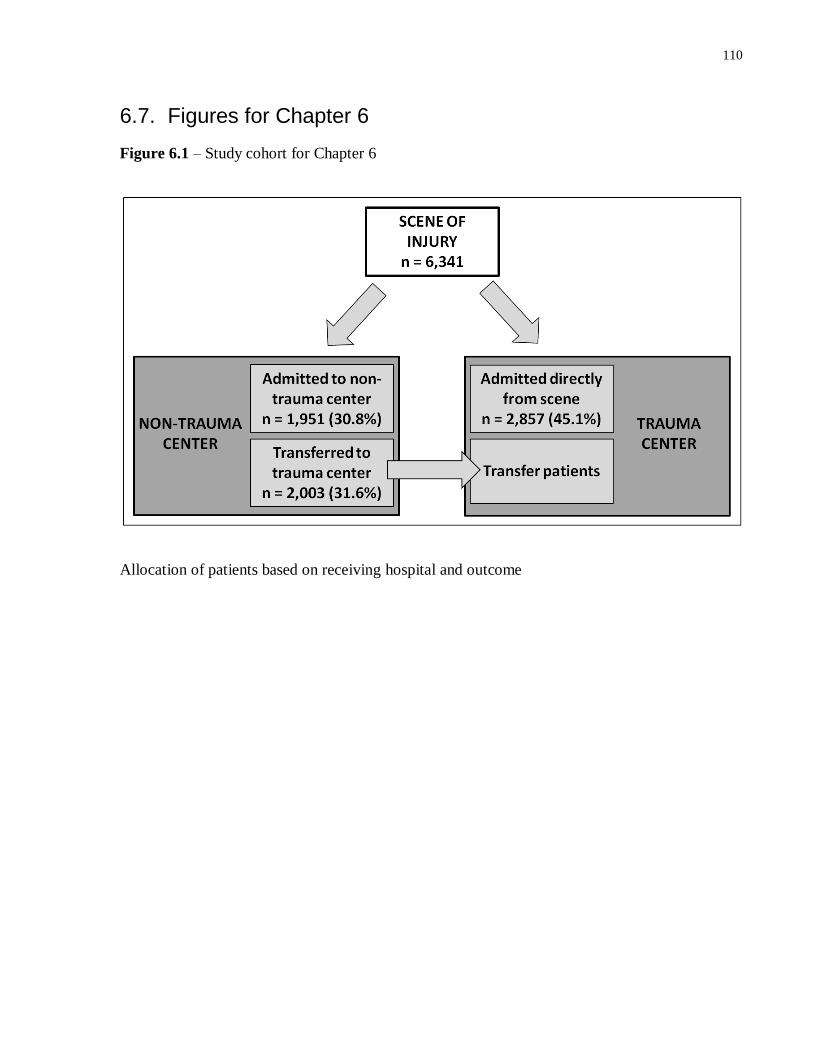
110
6.7. Figures for Chapter 6
Figure 6.1 – Study cohort for Chapter 6
Allocation of patients based on receiving hospital and outcome
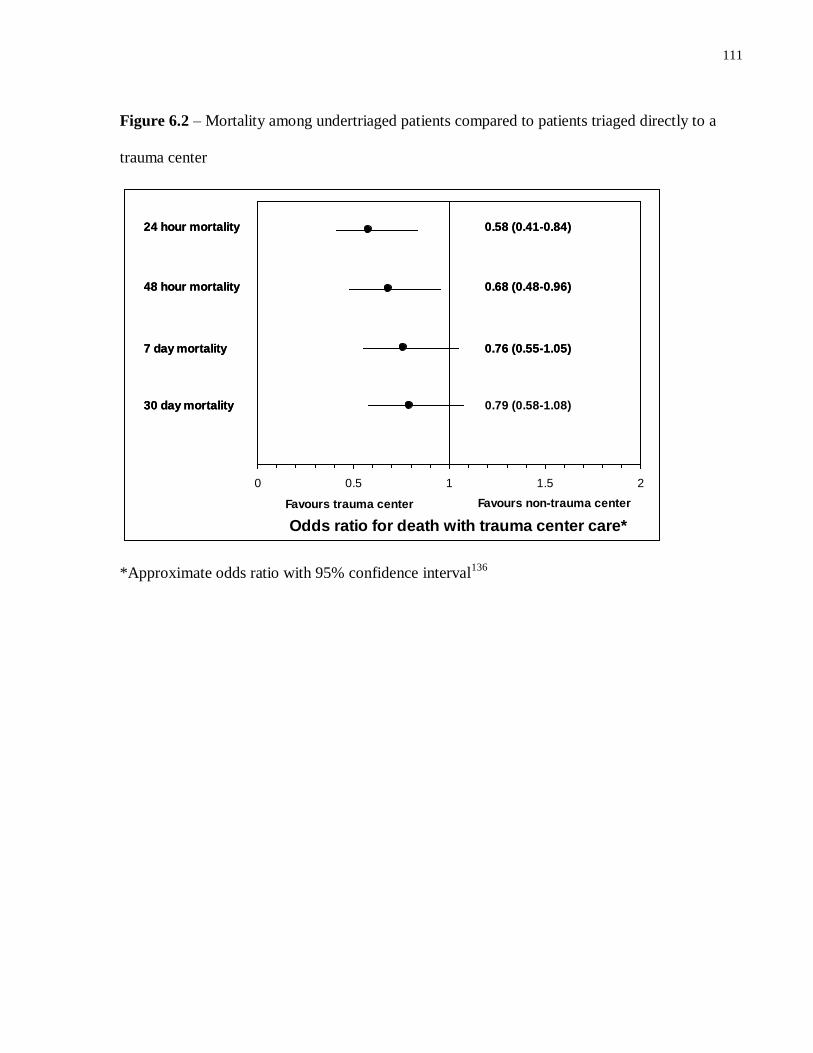
111
Figure 6.2 – Mortality among undertriaged patients compared to patients triaged directly to a
trauma center
0 0.5 1 1.5 2
Odds ratio for death with trauma center care*
24 hour mortality
30 day mortality
7 day mortality
48 hour mortality
0.58 (0.41-0.84)
0.79 (0.58-1.08)
0.76 (0.55-1.05)
0.68 (0.48-0.96)
24 hour mortality
30 day mortality
7 day mortality
48 hour mortality
0.58 (0.41-0.84)
Favours non-trauma center
0.76 (0.55-1.05)
0.68 (0.48-0.96)
Favours trauma center
*Approximate odds ratio with 95% confidence interval136
112
Chapter 7 General Discussion
7.1. Conclusions
Injury remains a leading of cause of death and disability, both in Canada and throughout
the world. Although primary prevention strategies are paramount to reducing the social and
economic burden cause by injuries, the type of care received following severe injury can
significantly modify outcomes. Previous work has demonstrated that trauma center care can
significantly increase the probability of survival following severe injury. This dissertation
explored the relationship between severe injury, direct triage to a trauma center and mortality at a
population level.
In Chapter 4, we described the development and validation of an algorithm which can be
used to derive ISS from ICD-10 codes. Using the data available in the OTR CDS, we have
demonstrated the ability of this algorithm to identify patients with severe injuries in specific
body regions, as well as to accurately estimate ISS. Specifically, when examining the crosswalk
algorithm’s ability to identify injuries with an AIS > 3, we demonstrated that the crosswalk had
good concordance with abstracted AIS scores, and performed particularly well in the head, chest
and abdomen regions. When comparing algorithm-derived ISS and abstractor-derived ISS, the
algorithm’s accuracy was comparable to that of human abstractors. The difference between ISS
scores obtained by crosswalk and abstracted scores was < 10 in 87% of patients. Beyond its use
in this dissertation, the ICD-10 to ISS crosswalk algorithm described in this work has other
important applications in trauma research. The algorithm can be used in a variety of other
population-based analyses to study outcomes among injured patients in Ontario, other provinces
or internationally.
113
In Chapter 5, we performed a study examining the mortality associated with transfer to
trauma center care following undertriage. Previous studies examining the mortality associated
with transfer were significantly limited by survivor bias. We used a population-based approach
to overcome the methodological limitations of previous data. In our analyses, we demonstrated
that 50% of deaths that occur among patients eligible for transfer occur in the emergency
departments of non-trauma centers, prior to transfer occurring. These deaths have previously not
been captured in analyses of outcomes among transferred patients. Our analyses suggest that
patients who are undertriaged and require transfer have a 25% higher mortality than patients
triaged directly to a trauma center. These findings contradict previous data, which would suggest
that transfer patients have outcomes equivalent those of patients triaged directly to a trauma
center. As such, our findings suggest that policies to reduce undertriage and to expedite transfers
are needed.
Finally, in Chapter 6, we used a population-based approach to evaluate the mortality cost
associated with undertriage at the level of a trauma system. We focused on all individuals
severely injured in a motor vehicle crash in Ontario between July 1, 2002 and January 31, 2010.
We demonstrated that fewer than half of these patients are triaged directly from the scene of
injury to a trauma center. Using an instrumental variable analysis, we demonstrated that
mortality was significantly lower among patients triaged directly to a trauma center at 24 hours
and 48 hours, as compared to patients triaged to a non-trauma center. This mortality benefit did
not persist at 7 days or 30 days, however.
114
7.2. Limitations
The work presented in this dissertation has a number of limitations.
7.2.1. Limitations of available data
Absence of information about prehospital deaths
Although data in this thesis are population-based, it is important to acknowledge that only
the population of patients arriving alive to an emergency department are captured. The
population of patients dying in the field or en route to the emergency department is excluded. It
is acknowledged that a significant proportion of injury-related deaths occur in the field, prior to
hospital arrival. As a result, this thesis does not provide a population-based estimate of all injury-
related deaths in the study region. The focus of this thesis, however, was to examine the
relationship between type of care received following hospital arrival and mortality; deaths
occurring at the scene of injury are beyond the scope of this work. In addition, population-based
analyses of injury-related field deaths in Ontario have previously been described77
.
Absence of information about prehospital care
The studies described in Chapter 5 and Chapters 6 focus on outcomes among severely
injured patients, and the relationship between undertriage and mortality. An important potential
modifier of outcomes that is not accounted for in these analyses is the type of prehospital care
received, and the length of time elapsed between injury and arrival at the emergency department.
Type of care received in the prehospital setting (Advanced Life Support compared to
Basic Life Support) has previously been linked to probability of in-hospital death138
. In addition,
prehospital intubation, prehospital fluid administration and other prehospital procedures have
115
been shown to modify outcomes among severely injured patients138-141
. In Chapter 5, significant
differences in prehospital care among patients triaged directly to a trauma center and to a non-
trauma center may have led to biased estimates of the relationship between transfer and
mortality. Similarly, in Chapter 6, systematic differences in prehospital care across strata of
county intensity score may have significantly impacted on the results. Such systematic
differences across regions are unlikely, however.
A recent multi-center study examined the effect of the implementation of Advanced Life
Support programs in 17 cities within Ontario142
. The authors demonstrated that only a minority
of patients received interventions in the prehospital setting, even when Advanced Life Support
was available: 6.8% of patients were intubated and 11.7% of patients received a fluid bolus in the
prehospital setting. More importantly, there was no difference in patient mortality when periods
prior to and following Advance Life Support program implementation were compared (OR for
death 1.2, 95% CI 0.9-1.7). As such, the type of prehospital care available does not appear to
affect outcomes among patients in Ontario.
Patients not captured by administrative data
Although NACRS and DAD capture virtually all patients treated in the emergency
department and acute care hospitals in the province of Ontario, there are select patient
populations that are not captured accurately in this dissertation. Patients included in studies
described in Chapter 5 and Chapters 6 were identified and tracked within NACRS and DAD by
means of a universal identifier which is derived from the patient’s health card number. As a
result, patients who are homeless, patients who are not Ontario residents and First Nations
116
patients may not be captured. Because these populations are relatively small, their exclusion is
unlikely to significantly influence study findings.
Institutions not captured by administrative data
In addition to select patient populations, NACRS and DAD cannot capture institutions
outside of the province of Ontario. It is possible that a small number of patients who were
initially triaged to a non-trauma center were subsequently transferred to an institution in another
province, or to an institution in the United States. We are unable to obtain data regarding these
patients.
Outcomes not captured by administrative data
Although the focus of this dissertation is mortality following severe injury, death is not
the only outcome of relevance to patients. Specifically, the severe disability experienced by
patients following injury contributes to a significant proportion of its personal and economic
costs. A reduction in injury-related disability associated with trauma center care would be highly
relevant both to patients and to policy makers. There is previous data to suggest that trauma
center care can, in fact, reduce the probability of disability. Specifically, Mackenzie and
colleagues have previously demonstrated that patients with severe lower extremity orthopedic
injuries treated at trauma centers have better functional outcomes compared to patients treated at
non-trauma centers143
. However, the authors of this study followed patients up to one year post-
discharge; disability cannot specifically be captured using administrative data currently
available.
117
Limited information on hospital-level attributes and process of care
Although we have identified differences in outcomes among patients triaged directly to a
trauma center compared to patients who are undertriaged, the data presented in this dissertation
provide little guidance regarding the processes of care leading to the observed differences in
outcomes. Specifically, although there is considerable information available regarding the
structures and processes of care relevant to injured patients at Ontario trauma centers, similar
information regarding non-trauma centers is extremely limited. Clearly, there is significant
variability in the resource availability at non-trauma centers; the non-trauma centers included in
this dissertation ranged from small rural acute care hospitals to highly-resourced, university-
affiliated, urban centers. Such a range in resource availability is likely to translate into significant
differences in processes of care across the spectrum of included non-trauma centers. However,
delineating precisely what resource are available at each center, and how these resources
translate into processes of care relevant to severely injured patients, is challenging with
administrative data alone.
7.2.2. Limitations of data analysis
The focus of the studies described in this dissertation is treatment at trauma centers and
non-trauma centers. As outlined in Chapters 5 and 6, patients triaged to trauma centers and non-
trauma centers differed significantly from each other, both in terms of patient characteristics and
injury characteristics. Given these differences in patient populations across the two types of
centers, risk-adjustment is necessary to produce meaningful estimates of the mortality associated
with undertriage.
118
In Chapter 5 of this dissertation, logistic regression was used for risk adjustment. It is
possible that patient or injury characteristics which could not be captured in our dataset might
have significantly influenced our findings (residual confounding). Specifically, we did not have
access to physiologic variables, such as systolic blood pressure or Glasgow Coma Scale score.
However, we believe that our analyses are valid for two reasons. First, measured characteristics
were very similar across groups of patients (those transported directly to a trauma center and
those transported to a non-trauma center). There is no reason to infer that unmeasured
characteristics would differ significantly. In addition, we feel that the variables that were
captured explain a significant amount of variation within the model, as evidence by the
discrimination and calibration of our model. Finally, we feel that one of the main findings of the
analysis in Chapter 5 is the observation that up to 50% of deaths among patients eligible for
transfer occur in the emergency departments of non-trauma centers. These patients have not
previously been captured in evaluations of trauma system performance, and the important impact
these patients have on overall calculations of undertriage does not rely on risk adjustment
methods.
In Chapter 6, we argue that the use of an instrumental variable analysis is necessary due
to the non-comparability of ISS and AIS across trauma centers and non-trauma centers. Thus,
our use of ISS and AIS scores for risk adjustment in Chapter 5 may seem invalid. However, there
are important differences in the patient populations in Chapter 5 compared to Chapter 6. In
Chapter 5, all included patients were either admitted to a trauma center at some point in their
care trajectory, or died in the emergency department of a non-trauma center. Patients admitted to
trauma centers would be expected to have equally good injury ascertainment, regardless of
whether they arrived directly or were transferred. Among patients that died in the emergency
119
department, the majority (69%) had a missing or invalid ISS, which was represented in the
logistic regression models with a missing indicator. Only 139 patients in the analysis (1.2%) had
an ISS derived from diagnoses at a non-trauma center. In this way, the confounding caused by
inaccurate injury ascertainment at non-trauma centers was likely to be minimal – virtually all
patients who had a valid ISS were assigned this ISS at a trauma center. In contrast, in Chapter 6,
patients admitted to non-trauma centers were included in the analysis. Among these patients,
3,348 had an ISS > 15; therefore, 53% of patient in the analysis had an ISS assigned at a non-
trauma center, where diagnostic modalities might be limited. As such, there was significant
opportunity for residual confounding if ISS were used for risk-adjustment. Concern regarding
residual confounding prompted us to select instrumental variable analysis as a means of risk
adjustment in Chapter 6.
7.2.3. Limitations of external generalizability
The mortality estimates produced in Chapter 5 and Chapter 6 of this thesis may not be
broadly generalizable to all trauma systems. Specifically, Ontario has an exclusive trauma
system: only level I and level II centers participate in the system, and there are no specific,
injury-related standards at non-trauma centers. Non-trauma centers are not required to have
transfer protocols, and staff at non-trauma centers are not required to have specialized training
regarding the management of injured patients. As described in Chapter 1, exclusive trauma
systems are associated with higher injury-related mortality than inclusive systems. The high rate
of mortality in non-trauma center emergency departments observed in Chapter 5, and the higher
mortality rates among undertriaged patients observed in Chapter 6, may both be related to
inadequate standards of care at non-trauma centers. It is possible that, in inclusive systems,
mortality at non-trauma centers would be significantly lower.
120
We noted that patients dying prior to transfer to trauma center care had prolonged times
in the emergency department prior to death (median 2.7 hours). The cause of these delays may be
multiple, including failure to recognize the need for transfer, failure to identify an institution
willing to accept the patient in transfer and lack of transportation assets. We hypothesize that
shorter emergency department length of stays and expedited transfer may have prevented death
in a subset of these patients. Given this hypothesis, it is possible that in trauma systems with
greater transportation resources or better developed transfer strategies, the mortality associated
with undertriage and transfer might be significantly lower than that observed in the analyses in
this dissertation.
7.3. Implications
The analyses presented in this dissertation have a number of methodological and policy
implications. Firstly, we have demonstrated the significant impact of capturing emergency
department deaths on analyses of injury-related mortality. While lack of data regarding these
patients is commonly cited as a limitation in many analyses in the trauma literature, our findings
convincingly demonstrate that this population is non-negligible. Our analyses of the impact of
transfer on mortality demonstrated that the inclusion of emergency department deaths in analyses
produced findings completely contradictory to previous studies on this subject. Non-population
based analyses in the past led to a significant underestimation of the harmful impact of the
transfer process. Future evaluations of trauma system performance (undertriage) and of injury-
related mortality at the system level must capture emergency department patients.
Our analyses have also identified that undertriage is a significant problem in Ontario’s
trauma system. Among severely injured motor vehicle occupants, only 45% were transported
directly to a trauma center. Additionally, among patients that were initially undertriaged, only
121
half were successfully transferred to a trauma center. Among motor vehicle occupants, 5% of
patients triaged to a non-trauma center died in the emergency department – 11% of all deaths at
non-trauma centers. Initial undertriage from the scene of injury was associated with significantly
increased mortality at 24 hours and 48 hours. Our data suggest that strategies are required to
ensure that patients reach appropriate care directly from the scene. Precisely delineating these
strategies will require further study; potential approaches to identifying these strategies are
described in the next Chapter. More broadly, our data suggest that adopting the Ontario Trauma
Expert Panel’s recommendation regarding trauma system organization could be beneficial.
Ontario’s exclusive trauma system is not an appropriate trauma system configuration for a
system that experiences the degree of undertriage we observed. An inclusive system, which
ensures standardized, high quality trauma care at all hospitals, regardless of resources, might
help mitigate the excess mortality cause by undertriage in the Ontario trauma system.

122
Chapter 8 Future directions for research
8.1. Ongoing evaluation of undertriage in Ontario
The findings of the studies described in this dissertation demonstrate that a significant
proportion of severely injured patients in the province of Ontario have inadequate access to
trauma center care. Although guidelines suggest that, in a well organized system of trauma care,
95% of severely injured patients should be transported directly to a trauma center, this
dissertation demonstrates that, in Ontario, fewer than half of patients with severe injuries due to
MVC have such access.
Although describing the existing gaps in access to trauma care is important,
longitudinally monitoring access to trauma care in the province is essential. The cohorts
described in this dissertation can be recreated with new data to monitor the state of trauma center
access in the province across time. Indeed, ongoing monitoring and quality assurance are
considered essential components of a well developed trauma system28
. There has previously been
no systematic review of the rates of undertriage in the province. The annual Ontario trauma
registry reports produced by CIHI are based on data from the OTR CDS, and therefore do not
capture undertriaged patients who are admitted to non-trauma centers for definitive
management82
. In contrast, the annual report of injury admissions produced by CIHI captures all
acute care admissions for injury, regardless of injury severity7; this data therefore does not
provide information regarding the trauma system performance. The methods and crosswalk
algorithm described in this dissertation provide the opportunity for future surveillance of
undertriage in Ontario, as well as other jurisdictions in Canada.
123
8.2. Evaluation of field trauma triage protocols in Ontario
Although, in some rural areas, direct transport to a trauma center is not possible due to
prohibitive distances, the vast majority of Ontarians live within an hour of a trauma center. It is
therefore likely that the high levels of undertriage observed in the analyses in Chapter 5 and 6
are, at least partly, attributable to inappropriate triage decisions in the prehospital setting. At the
moment, however, it is unclear whether undertriage in areas in close proximity to a trauma center
is attributable to inadequately sensitive prehospital triage protocols, non-adherence to such
protocols by EMS personnel, or a combination of both. As described in Chapter 1, prehospital
services in the province of Ontario are decentralized, and administered by higher level
municipalities. As a result, there is no province-wide standard for prehospital triage of the
severely injured. Given the high levels of undertriage described in the dissertation, it is
imperative to evaluate the prehospital triage protocols employed by individual EMS agencies,
and their implementation.
8.3. Evaluation of the transfer process in Ontario’s trauma system
As we have described in the previous Chapter, a significant proportion of patients who
are undertriaged are never transferred to trauma center care; those patients that are transferred
experience significant delays in definitive care. How patients are selected for transfer, or the
processes involved in executing such a transfer, are poorly understood within Ontario’s trauma
system. Expediting the transfer might lead to improved outcomes among patients who are
initially undertriaged.
124
In Chapter 5, we demonstrated that specific patient characteristics differentiated those
patients that were successfully transferred, and those patients that died in the emergency
department awaiting transfer. Specifically, elderly patients, females and patients with multiple
comorbidities were more likely to die in the emergency department of non-trauma centers. These
findings imply that selection of patients for transfer may not be based on physiology and injury
characteristics alone. Although quantitative analyses of transferred and non-transferred patients
are valuable, such data provide little insight into the decision-making that occurs at the level of
the providers who select patients for transfer. Given the complexity of such decisions, we feel
that qualitative analyses of the transfer process might provide valuable insight into providers’
knowledge and beliefs regarding transfer, the factors that influence their selection of patients for
transfer, as well as the barriers they face in executing a transfer.
The potential barriers faced by providers attempting to transfer a patient are multiple, and
may explain the prolonged times to death in non-trauma center emergency departments, as well
as the relatively low rate of transfer for patients undertriaged to non-trauma centers. Such
barriers may include barriers to diagnosis (e.g. inadequate training in the recognition of severe
injuries, inadequate access to diagnostic modalities), barriers to identifying a receiving center
(e.g. CritiCall’s lack of mandate in directing a center to accept a transfer), barriers to effecting
the transfer (e.g. insufficient transportation assets, insufficient personnel to transfer the patient)
or other barriers (e.g. refusal of patients’ families to transfer the patient). The factors must be
deconstructed in order to identify candidate interventions aimed at expediting the transfer
process.
125
8.4. Evaluation of long term outcomes among severely injured patients in Ontario
Although this dissertation focused on short term outcomes, long term outcomes among
severely injured patients who survive their initial hospitalization are of interest, both for
prognostication and for system planning purposes.
Ontario’s administrative datasets could be analyzed to examine long-term health care
utilization and health outcomes among survivors of severe injury. Of particular interest would be
an analysis focusing on differences in these outcomes among patients treated at trauma centers,
compared to those treated at non-trauma centers. In addition, these outcomes could be related to
other patient-level factors, including socioeconomic status and access to primary healthcare. The
identification of a relationship between patient characteristics and increased health care resource
utilization or increased risk of adverse outcomes could lead to the development of targeted
strategies aimed at these patient subgroups.
Finally, little is known about the psychosocial impact of severe injury in Ontario. Follow-
up studies of patients that focus on patient-centered outcomes, such as quality of life, return to
work and post-traumatic stress disorder could significantly decrease the impact of severe injury
in the province.
126
References
1. Peden M, McGee K, Krug E (Eds.). Injury:A Leading Cause of the Global Burden of
Disease, 2000. Geneva: World Health Organization; 2002.
2. G Jacobs, A Aeron-Thomas, A Astrop. Estimating global road fatalities: Transport
Research Laboratory; 2000.
3. Krug E (Ed.). Injury: A Leading Cause of the Global Burden of Disease. Geneva: World
Health Organization; 1999.
4. World Health Organization. Global status report on road safety: time for action. 2009;
www.who.int/violence_injury_prevention/road_safety_status/2009. Accessed May 15,2011.
5. Statistics Canada. Leading Causes of Deaths in Canada, 2007, CANSIM Tables.
http://www.statcan.gc.ca/pub/84-215-x/2010001/table-tableau/tbl003-eng.htm. Accessed May 5,
2011.
6. SMARTRISK. The Economic Burden of Injury in CanadaToronto, Ont: SMARTRISK;
2009.
7. Canadian Institute for Health Information. National Trauma Registry 2004 Report: Injury
Hospitalizations (includes 2001–2002 data)Ottawa, Ont: Canadian Institute for Health
Information; 2004.
8. Macpherson A, Schull M, Manuel D, Cernat G, Redelmeier D, Laupacis A. Injuries in
Ontario: ICES atlas. Toronto, Ont: Institute for Clinical Evaluative Sciences; 2005.
127
9. Haddon W, Jr. On the escape of tigers: an ecologic note. Am J Public Health Nations
Health. Dec 1970;60(12):2229-2234.
10. Haddon W, Jr. Advances in the epidemiology of injuries as a basis for public policy.
Public Health Rep. Sep-Oct 1980;95(5):411-421.
11. Mullins R. A historical perspective of trauma system development in the United States. J
Trauma. 1999;47(3):S8-S14.
12. Mackersie RC. History of trauma field triage development and the American College of
Surgeons criteria. Prehospital Emergency Care. 2006;10(3):287-294.
13. King B, Jatoi I. The mobile Army surgical hospital (MASH): a military and surgical
legacy. J Natl Med Assoc. May 2005;97(5):648-656.
14. Neel S. Army aeromedical evacuation procedures in Vietnam: implications for rural
America. JAMA. 1968;204(4):309-313.
15. Nathens AB, Brunet FP, Maier RV. Development of trauma systems and effect on
outcomes after injury. Lancet. 2004;363(9423):1794-1801.
16. Howard JM. Historical background to accidental death and disability: the neglected
disease of modern society. Prehosp Emerg Care. Oct-Dec 2000;4(4):285-289.
17. Gaston SR. "Accidental death and disability: the neglected disease of modern society". A
progress report. J Trauma. Mar 1971;11(3):195-206.
18. Committee on Trauma. Resources for Optimal Care of the Injured Patient. Chicago, Ill.:
American College of Surgeons; 2006.
128
19. Trauma Association of Canada. Trauma system accreditation guidelines.
http://www.traumacanada.org/accreditation_committee/Accreditation_Guidelines_Jun_07.pdf.
Accessed 2-14-2008.
20. Evans D. From trauma care to injury control: a people's history of the evolution of trauma
systems in Canada. C J Surg. 2007;50(5):364-369.
21. Trauma Association of Canada. TAC Accredited/Verified Hospitals.
http://www.traumacanada.org/Default.aspx?pageId=829755. Accessed March 28, 2011.
22. Demetriades D, Kimbrell B, Salim A, et al. Trauma deaths in a mature urban trauma
system: is "trimodal" distribution a valid concept? J Am Coll Surg. Sep 2005;201(3):343-348.
23. Sasser SM, Hunt RC, Sullivent EE, et al. Guidelines for field triage of injured patients.
Recommendations of the National Expert Panel on Field Triage. MMWR Recomm Rep. Jan 23
2009;58(RR-1):1-35.
24. Newgard CD, Rudser K, Hedges JR, et al. A critical assessment of the out-of-hospital
trauma triage guidelines for physiologic abnormality. J Trauma. Feb;68(2):452-462.
25. Norcross ED, Ford DW, Cooper ME, Zone-Smith L, Byrne TK, Yarbrough DR, 3rd.
Application of American College of Surgeons' field triage guidelines by pre-hospital personnel. J
Am Coll Surg. Dec 1995;181(6):539-544.
26. West JG, Williams MJ, Trunkey DD, Wolferth CC, Jr. Trauma systems. Current status--
future challenges. JAMA. Jun 24 1988;259(24):3597-3600.
129
27. Health Resources and Services Administration. Model trauma care system plan.
Rockville, MD: Health Resources and Services Administration; 1992.
28. AB Nathens (Ed.). Regional trauma systems: Optimal elements, integration, and
assessment, American College of Surgeons Committee on Trauma: Systems consultation guide.
Chicago, IL: American College of Surgeons; 2008.
29. Bazzoli GJ, Madura KJ, Cooper GF, MacKenzie EJ, Maier RV. Progress in the
development of trauma systems in the United States. Results of a national survey. JAMA. Feb 1
1995;273(5):395-401.
30. MacKenzie EJ, Hoyt DB, Sacra JC, et al. National inventory of hospital trauma centers.
JAMA. Mar 26 2003;289(12):1515-1522.
31. Hameed SM, Schuurman N, Razek T, et al. Access to trauma systems in Canada. J
Trauma. Dec;69(6):1350-1361; discussion 1361.
32. Zollinger RW. Traffic injuries; a surgical problem. AMA Arch Surg. May
1955;70(5):694-700.
33. Van Wagoner FH. A three year study of deaths following trauma. J Trauma. Jul
1961;1:401-408.
34. Gertner HR, Jr., Baker SP, Rutherford RB, Spitz WU. Evaluation of the management of
vehicular fatalities secondary to abdominal injury. J Trauma. May 1972;12(5):425-431.
35. Cales RH, Trunkey DD. Preventable trauma deaths. A review of trauma care systems
development. JAMA. Aug 23-30 1985;254(8):1059-1063.
130
36. MacKenzie EJ. Review of evidence regarding trauma system effectiveness resulting from
panel studies. J Trauma. Sep 1999;47(3 Suppl):S34-41.
37. West JG, Trunkey DD, Lim RC. Systems of trauma care. A study of two counties. Arch
Surg. Apr 1979;114(4):455-460.
38. Rutledge R, Fakhry SM, Meyer A, Sheldon GF, Baker CC. An analysis of the association
of trauma centers with per capita hospitalizations and death rates from injury. Ann Surg. Oct
1993;218(4):512-521; discussion 521-514.
39. West JG, Cales RH, Gazzaniga AB. Impact of regionalization. The Orange County
experience. Arch Surg. Jun 1983;118(6):740-744.
40. Cooper DJ, McDermott FT, Cordner SM, Tremayne AB. Quality assessment of the
management of road traffic fatalities at a level I trauma center compared with other hospitals in
Victoria, Australia. Consultative Committee on Road Traffic Fatalities in Victoria. J Trauma.
Oct 1998;45(4):772-779.
41. Wenneker WW, Murray DH, Jr., Ledwich T. Improved trauma care in a rural hospital
after establishing a level II trauma center. Am J Surg. Dec 1990;160(6):655-657; discussion 657-
658.
42. Smith JS, Jr., Martin LF, Young WW, Macioce DP. Do trauma centers improve outcome
over non-trauma centers: the evaluation of regional trauma care using discharge abstract data and
patient management categories. J Trauma. Dec 1990;30(12):1533-1538.
131
43. Clemmer TP, Orme JF, Jr., Thomas FO, Brooks KA. Outcome of critically injured
patients treated at Level I trauma centers versus full-service community hospitals. Crit Care
Med. Oct 1985;13(10):861-863.
44. Sampalis JS, Lavoie A, Boukas S, et al. Trauma center designation: initial impact on
trauma-related mortality. J Trauma. Aug 1995;39(2):232-237; discussion 237-239.
45. Demetriades D, Berne TV, Belzberg H, et al. The impact of a dedicated trauma program
on outcome in severely injured patients. Arch Surg. Feb 1995;130(2):216-220.
46. Mackenzie EJ, Rivara FP, Jurkovich GJ, et al. The National Study on Costs and
Outcomes of Trauma. J Trauma. Dec 2007;63(6 Suppl):S54-67; discussion S81-56.
47. MacKenzie EJ, Rivara FP, Jurkovich GJ, et al. A national evaluation of the effect of
trauma-center care on mortality. N Engl J Med. Jan 26 2006;354(4):366-378.
48. Mann NC, Mullins RJ, MacKenzie EJ, Jurkovich GJ, Mock CN. Systematic review of
published evidence regarding trauma system effectiveness. J Trauma. Sep 1999;47(3
Suppl):S25-33.
49. Champion HR, Copes WS, Sacco WJ, et al. The Major Trauma Outcome Study:
establishing national norms for trauma care. J Trauma. Nov 1990;30(11):1356-1365.
50. Shackford SR, Mackersie RC, Hoyt DB, et al. Impact of a trauma system on outcome of
severely injured patients. Arch Surg. May 1987;122(5):523-527.
51. Zulick LC, Dietz PA, Brooks K. Trauma experience of a rural hospital. Arch Surg. Nov
1991;126(11):1427-1430.
132
52. Champion HR, Sacco WJ, Copes WS. Improvement in outcome from trauma center care.
Arch Surg. Mar 1992;127(3):333-338; discussion 338.
53. Norwood S, Myers MB. Outcomes following injury in a predominantly rural-population-
based trauma center. Arch Surg. Aug 1994;129(8):800-805.
54. Ornato JP, Craren EJ, Nelson NM, Kimball KF. Impact of improved emergency medical
services and emergency trauma care on the reduction in mortality from trauma. J Trauma. Jul
1985;25(7):575-579.
55. Kane G, Wheeler NC, Cook S, et al. Impact of the Los Angeles County Trauma System
on the survival of seriously injured patients. J Trauma. May 1992;32(5):576-583.
56. Mullins RJ, Veum-Stone J, Helfand M, et al. Outcome of hospitalized injured patients
after institution of a trauma system in an urban area. JAMA. Jun 22-29 1994;271(24):1919-1924.
57. Mullins RJ, Veum-Stone J, Hedges JR, et al. Influence of a statewide trauma system on
location of hospitalization and outcome of injured patients. J Trauma. Apr 1996;40(4):536-545;
discussion 545-536.
58. Mullins RJ, Mann NC, Hedges JR, Worrall W, Jurkovich GJ. Preferential benefit of
implementation of a statewide trauma system in one of two adjacent states. J Trauma. Apr
1998;44(4):609-616; discussion 617.
59. Mann NC. Assessing the effectiveness and optimal structure of trauma systems: a
consensus among experts. J Trauma. Sep 1999;47(3 Suppl):S69-74.
133
60. Nathens AB, Jurkovich GJ, Cummings P, Rivara FP, Maier RV. The effect of organized
systems of trauma care on motor vehicle crash mortality. JAMA. Apr 19 2000;283(15):1990-
1994.
61. Nathens AB, Jurkovich GJ, Rivara FP, Maier RV. Effectiveness of state trauma systems
in reducing injury-related mortality: a national evaluation. J Trauma. Jan 2000;48(1):25-30;
discussion 30-21.
62. Utter GH, Maier RV, Rivara FP, Mock CN, Jurkovich GJ, Nathens AB. Inclusive trauma
systems: do they improve triage or outcomes of the severely injured? J Trauma. Mar
2006;60(3):529-535; discussion 535-537.
63. Tinkoff GH, O'Connor RE, Alexander EL, 3rd, Jones MS. The Delaware trauma system:
impact of Level III trauma centers. J Trauma. Jul 2007;63(1):121-126; discussion 126-127.
64. Arthur M, Newgard CD, Mullins RJ, et al. A population-based survival assessment of
categorizing level III and IV rural hospitals as trauma centers. J Rural Health. Spring
2009;25(2):182-188.
65. Nathens AB, Jurkovich GJ, MacKenzie EJ, Rivara FP. A resource-based assessment of
trauma care in the United States. J Trauma. Jan 2004;56(1):173-178; discussion 178.
66. Branas CC, MacKenzie EJ, Williams JC, et al. Access to trauma centers in the United
States. JAMA : the journal of the American Medical Association. Jun 1 2005;293(21):2626-2633.
67. Gomez D, Berube M, Xiong W, et al. Identifying targets for potential interventions to
reduce rural trauma deaths: a population-based analysis. J Trauma. Sep;69(3):633-639.
134
68. Vassar MJ, Holcroft JJ, Knudson MM, Kizer KW. Fractures in access to and assessment
of trauma systems. J Am Coll Surg. Nov 2003;197(5):717-725.
69. Statistics Canada. Population and dwelling counts, for Canada, provinces and territories,
2006 and 2001 censuses. http://www12.statcan.gc.ca/census-recensement/2006/dp-pd/hlt/97-
550/Index.cfm?TPL=P1C&Page=RETR&LANG=Eng&T=101. Accessed May 19, 2011.
70. Statistics Canada. Population and dwelling counts, for Canada, provinces and territories
by the Statistical Area Classification, 2006 and 2001 censuses.
http://www12.statcan.gc.ca/census-recensement/2006/dp-pd/hlt/97-
550/Index.cfm?TPL=P1C&Page=RETR&LANG=Eng&T=601&PR=35&S=0&O=D&RPP=25.
Accessed May 19, 2011.
71. Girotti MJ. Report of the Trauma Expert PanelToronto: Ministry of Health and Long
Term Care, Ontario; 2006.
72. Ontario Ministry of Health and Long-Term Care. Land Ambulance Transition Practical
Guide1999.
73. Ontario Ministry of Health and Long-Term Care. Emergency Health Services: Land and
Air Ambulance. http://www.health.gov.on.ca/english/providers/program/ambul/ehs_mn.html.
Accessed May 15, 2011.
74. Ornge. http://www.ornge.ca/AboutOrnge/Pages/History.aspx. Accessed May 3, 2011.
75. Ornge. http://www.ornge.ca/hp/Pages/SceneandModifiedSceneResponse.aspx.
Accessed May 2, 2011.
135
76. CritiCall Ontario. Progress report 2007/08. Hamilton, Ont: CritiCall Ontario; 2008.
77. Gomez D, Berube M, Xiong W, et al. Identifying Targets for Potential Interventions to
Reduce Rural Trauma Deaths: A Population-Based Analysis. J Trauma. Dec 15 2009.
78. Institute for Clincial Evaluative Sciences. http://www.ices.on.ca/file/ACF209.pdf.
Accessed April 22, 2011.
79. Canadian Institute for Health Information. CIHI Data Quality Study of the DAD 2005–
2006 Discharge Abstract Database. Ottawa, Ont: CIHI; 2009.
80. Ontario Ministry of Health and Long-Term Care. Ontario Health Planning Data Guide.
Toronto, Ont: Ontario Ministry of Health and Long-Term Care; 2006.
81. Iron K, Zagorski B, K Sykora, Manuel D. Living and Dying in Ontario: An Opportunity
for Improved Health Information. ICES Investigative Report. Toronto, Ont: Institute for Clinical
Evaluative Sciences; 2008.
82. Canadian Institute for Health Information. Ontario Trauma Registry 2011 Report: Major
Injury in Ontario, 2009–2010 Data. Ottawa, Ont: Canadian Institute for Health Information;
2011.
83. Canadian Institute for Health Information. CIHI Data Quality Study of Ontario
Emergency Department Visits for Fiscal Year 2004–2005. Ottawa, Ont: Canadian Institute for
Health Information; 2008.
136
84. Baker SP, O'Neill B, Haddon W, Jr., Long WB. The injury severity score: a method for
describing patients with multiple injuries and evaluating emergency care. J Trauma. Mar
1974;14(3):187-196.
85. Linn S. The injury severity score--importance and uses. Ann Epidemiol. Nov
1995;5(6):440-446.
86. Committee on Injury Scaling. The Abbreviated Injury Scale: 1998 revision (AIS-98). Des
Plaines, Ill.: Association for the Advancement of Automotive Medicine;1998.
87. MacKenzie EJ, Steinwachs DM, Shankar B. Classifying trauma severity based on
hospital discharge diagnoses. Validation of an ICD-9CM to AIS-85 conversion table. Med Care.
Apr 1989;27(4):412-422.
88. Macias CA, Rosengart MR, Puyana JC, et al. The effects of trauma center care,
admission volume, and surgical volume on paralysis after traumatic spinal cord injury. Ann Surg.
Jan 2009;249(1):10-17.
89. Clark DE, DeLorenzo MA, Lucas FL, Cushing BM. Initial presentation of older injured
patients to high-volume hospitals is not associated with lower 30-day mortality in Medicare data.
Crit Care Med. Aug 2007;35(8):1829-1836.
90. Mango N, Garthe E. Statewide tracking of crash victims' medical system utilization and
outcomes. J Trauma. Feb 2007;62(2):436-460.
91. World Health Organization. ICD-10: International Statistical Classification of Diseases
and Related Health Problems: Tenth Revision, 2nd edition ed. Geneva: World Health
Organization; 2004.
137
92. HIPAA Administrative Simplification: Modification to Medical Data Code Set Standards
To Adopt ICD–10–CM and ICD–10–PCS; Proposed Rule73. Federal Register.
93. Canadian Institute for Health InformationInternational Statistical Classification of
Diseases and Related Health Problems: Tenth Revision, Canada (ICD-10-CA). Ottawa, Ont:
Canadian Institute for Health Information; 2006.
94. Fingerhut LA. External Cause of Injury Mortality Matrix for ICD-10. 2002;
http://www.cdc.gov/nchs/data/ice/icd10_transcode.pdf. Accessed June 2, 2009.
95. Fingerhut LA, Warner M. The ICD-10 injury mortality diagnosis matrix. Inj Prev. Feb
2006;12(1):24-29.
96. Bland J, Altman D. Measuring agreement in method comparison studies. Stat Methods
Med Res. 1999;8(2):135-160.
97. Bravo G, Potvin L. Estimating the reliability of continuous measures with Cronbach's
alpha or the intraclass correlation coefficient: toward the integration of two traditions. J Clin
Epidemiol. 1991;44(4-5):381-390.
98. Efron B, Tibshirani R. An Introduction to the Bootstrap. In: Chapman & Hall/CRC e, ed.
Monographs on Statistics and Applied Probability. Vol Boca Raton, Florida1993.
99. MacKenzie EJ, Shapiro S, Eastham JN. The Abbreviated Injury Scale and Injury Severity
Score. Levels of inter- and intrarater reliability. Med Care. Jun 1985;23(6):823-835.
100. Osler T, Rutledge R, Deis J, Bedrick E. ICISS: an international classification of disease-9
based injury severity score. J Trauma. Sep 1996;41(3):380-386; discussion 386-388.
138
101. Rutledge R, Osler T, Emery S, Kromhout-Schiro S. The end of the Injury Severity Score
(ISS) and the Trauma and Injury Severity Score (TRISS): ICISS, an International Classification
of Diseases, ninth revision-based prediction tool, outperforms both ISS and TRISS as predictors
of trauma patient survival, hospital charges, and hospital length of stay. J Trauma. Jan
1998;44(1):41-49.
102. Meredith JW, Evans G, Kilgo PD, et al. A comparison of the abilities of nine scoring
algorithms in predicting mortality. J Trauma. Oct 2002;53(4):621-628; discussion 628-629.
103. Sacco WJ, MacKenzie EJ, Champion HR, Davis EG, Buckman RF. Comparison of
alternative methods for assessing injury severity based on anatomic descriptors. J Trauma. Sep
1999;47(3):441-446; discussion 446-447.
104. Moore L, Lavoie A, Le Sage N, Bergeron E, Emond M, Abdous B. Consensus or data-
derived anatomic injury severity scoring? J Trauma. Feb 2008;64(2):420-426.
105. Stephenson SC, Langley JD, Civil ID. Comparing measures of injury severity for use
with large databases. J Trauma. Aug 2002;53(2):326-332.
106. Glance LG, Osler TM, Mukamel DB, Meredith W, Wagner J, Dick AW. TMPM-ICD9: a
trauma mortality prediction model based on ICD-9-CM codes. Ann Surg. Jun 2009;249(6):1032-
1039.
107. Durham R, Pracht E, Orban B, Lottenburg L, Tepas J, Flint L. Evaluation of a mature
trauma system. Ann Surg. Jun 2006;243(6):775-783; discussion 783-775.
108. MacKenzie EJ, Steinwachs DM, Ramzy AI. Evaluating performance of statewide
regionalized systems of trauma care. J Trauma. Jun 1990;30(6):681-688.
139
109. Nathens AB, Maier RV, Brundage SI, Jurkovich GJ, Grossman DC. The effect of
interfacility transfer on outcome in an urban trauma system. J Trauma. Sep 2003;55(3):444-449.
110. Rogers FB, Osler TM, Shackford SR, Cohen M, Camp L, Lesage M. Study of the
outcome of patients transferred to a level I hospital after stabilization at an outlying hospital in a
rural setting. J Trauma. Feb 1999;46(2):328-333.
111. Obremskey W, Henley MB. A comparison of transferred versus direct admission
orthopedic trauma patients. J Trauma. Mar 1994;36(3):373-376.
112. Rivara FP, Koepsell TD, Wang J, Nathens A, Jurkovich GA, Mackenzie EJ. Outcomes of
trauma patients after transfer to a level I trauma center. J Trauma. Jun 2008;64(6):1594-1599.
113. Young JS, Bassam D, Cephas GA, Brady WJ, Butler K, Pomphrey M. Interhospital
versus direct scene transfer of major trauma patients in a rural trauma system. Am Surg. Jan
1998;64(1):88-91; discussion 91-82.
114. Moen KG, Klepstad P, Skandsen T, Fredriksli OA, Vik A. Direct transport versus
interhospital transfer of patients with severe head injury in Norway. Eur J Emerg Med. Oct
2008;15(5):249-255.
115. Charlson ME, Pompei P, Ales KL, MacKenzie CR. A new method of classifying
prognostic comorbidity in longitudinal studies: development and validation. J Chronic Dis.
1987;40(5):373-383.
116. Bullard MJ, Unger B, Spence J, Grafstein E. Revisions to the Canadian Emergency
Department Triage and Acuity Scale (CTAS) adult guidelines. CJEM. Mar 2008;10(2):136-151.
140
117. D'Agostino RB, Jr. Propensity score methods for bias reduction in the comparison of a
treatment to a non-randomized control group. Stat Med. Oct 15 1998;17(19):2265-2281.
118. Austin PC. Using the standardized difference to compare the prevalence of a binary
variable between two groups in observational research. Communications in Statistics -
Simulation and Computation. 2009;38(6):1228-1234.
119. Soundappan SV, Holland AJ, Fahy F, Manglik P, Lam LT, Cass DT. Transfer of
pediatric trauma patients to a tertiary pediatric trauma centre: appropriateness and timeliness. J
Trauma. May 2007;62(5):1229-1233.
120. Nathens AB, Rivara FP, MacKenzie EJ, et al. The impact of an intensivist-model ICU on
trauma-related mortality. Ann Surg. Oct 2006;244(4):545-554.
121. Ball CG, Sutherland FR, Dixon E, et al. Surgical trauma referrals from rural level III
hospitals: should our community colleagues be doing more, or less? J Trauma. Jul
2009;67(1):180-184.
122. Mullins RJ, Hedges JR, Rowland DJ, et al. Survival of seriously injured patients first
treated in rural hospitals. J Trauma. Jun 2002;52(6):1019-1029.
123. Newgard CD, McConnell KJ, Hedges JR, Mullins RJ. The benefit of higher level of care
transfer of injured patients from nontertiary hospital emergency departments. J Trauma. Nov
2007;63(5):965-971.
124. Utter GH, Victorino GP, Wisner DH. Interhospital transfer occurs more slowly for
elderly acute trauma patients. J Emerg Med. Nov 2008;35(4):415-420.
141
125. Svenson J. Trauma systems and timing of patient transfer: are we improving? Am J
Emerg Med. May 2008;26(4):465-468.
126. Harrington DT, Connolly M, Biffl WL, Majercik SD, Cioffi WG. Transfer times to
definitive care facilities are too long: a consequence of an immature trauma system. Ann Surg.
Jun 2005;241(6):961-966; discussion 966-968.
127. Demetriades D, Murray J, Charalambides K, et al. Trauma fatalities: time and location of
hospital deaths. J Am Coll Surg. Jan 2004;198(1):20-26.
128. Canadian Institute for Health Information. CIHI Data Quality Study of the 2005–2006
Discharge Abstract Database. Ottawa, Ont: Canadian Institute for Health Information; 2009.
129. Canadian Institute for Health Information. CIHI Data Quality Study of Ontario
Emergency Department Visits for 2004-2005: Volume II of IV - Main Study Findings. Ottawa,
Ont: Canadian Institute for Health Information; 2008.
130. Hsia RY, Wang E, Torres H, Saynina O, Wise PH. Disparities in trauma center access
despite increasing utilization: data from California, 1999 to 2006. J Trauma. Jan;68(1):217-224.
131. Haas B, Gomez D, Zagorski B, Stukel TA, Rubenfeld GD, Nathens AB. Survival of the
fittest: the hidden cost of undertriage of major trauma. J Am Coll Surg. Dec;211(6):804-811.
132. Newhouse JP, McClellan M. Econometrics in outcomes research: the use of instrumental
variables. Annu Rev Public Health. 1998;19:17-34.
142
133. Landrum MB, Ayanian JZ. Causal effect of ambulatory specialty care on mortality
following myocardial infarction: a comparison of propensity score and instrumental variable
analyses. Health Services & Outcomes Research Methodology. 2001(221):221-245.
134. Stukel TA, Fisher ES, Wennberg DE, Alter DA, Gottlieb DJ, Vermeulen MJ. Analysis of
observational studies in the presence of treatment selection bias: effects of invasive cardiac
management on AMI survival using propensity score and instrumental variable methods. JAMA.
Jan 17 2007;297(3):278-285.
135. Landrum M, Ayanian J. Causal Effect of Ambulatory Specialty Care on Mortality
Following Myocardial Infarction: A Comparison of Propensity Score and Instrumental Variable
Analyses. Health Services and Outcomes Research Methodology. 2001;2:221-245.
136. Amemiya T. Qualitative Response Models: A Survey. Journal of Economic Literature.
1981;19(4):1483-1536.
137. Martens EP, Pestman WR, de Boer A, Belitser SV, Klungel OH. Instrumental variables:
application and limitations. Epidemiology. May 2006;17(3):260-267.
138. Haas B, Nathens AB. Pro/con debate: is the scoop and run approach the best approach to
trauma services organization? Crit Care. 2008;12(5):224.
139. Bickell WH, Wall MJ, Jr., Pepe PE, et al. Immediate versus delayed fluid resuscitation
for hypotensive patients with penetrating torso injuries. N Engl J Med. Oct 27
1994;331(17):1105-1109.
140. Davis DP, Peay J, Sise MJ, et al. The impact of prehospital endotracheal intubation on
outcome in moderate to severe traumatic brain injury. J Trauma. May 2005;58(5):933-939.

143
141. Roudsari BS, Nathens AB, Cameron P, et al. International comparison of prehospital
trauma care systems. Injury. Sep 2007;38(9):993-1000.
142. Stiell IG, Nesbitt LP, Pickett W, et al. The OPALS Major Trauma Study: impact of
advanced life-support on survival and morbidity. CMAJ. Apr 22 2008;178(9):1141-1152.
143. Mackenzie EJ, Rivara FP, Jurkovich GJ, et al. The impact of trauma-center care on
functional outcomes following major lower-limb trauma. J Bone Joint Surg Am. Jan
2008;90(1):101-109.
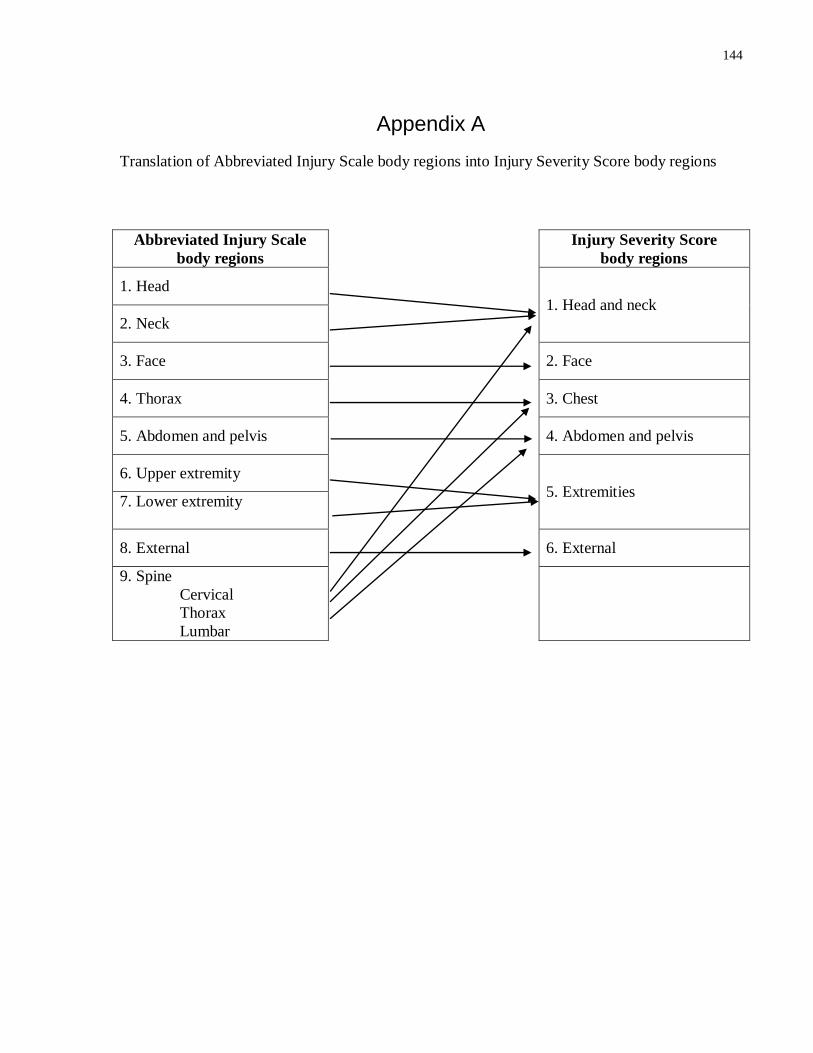
144
Appendix A
Translation of Abbreviated Injury Scale body regions into Injury Severity Score body regions
Abbreviated Injury Scale
body regions
Injury Severity Score
body regions
1. Head
1. Head and neck
2. Neck
3. Face
2. Face
4. Thorax
3. Chest
5. Abdomen and pelvis
4. Abdomen and pelvis
6. Upper extremity
5. Extremities 7. Lower extremity
8. External
6. External
9. Spine Cervical
Thorax
Lumbar
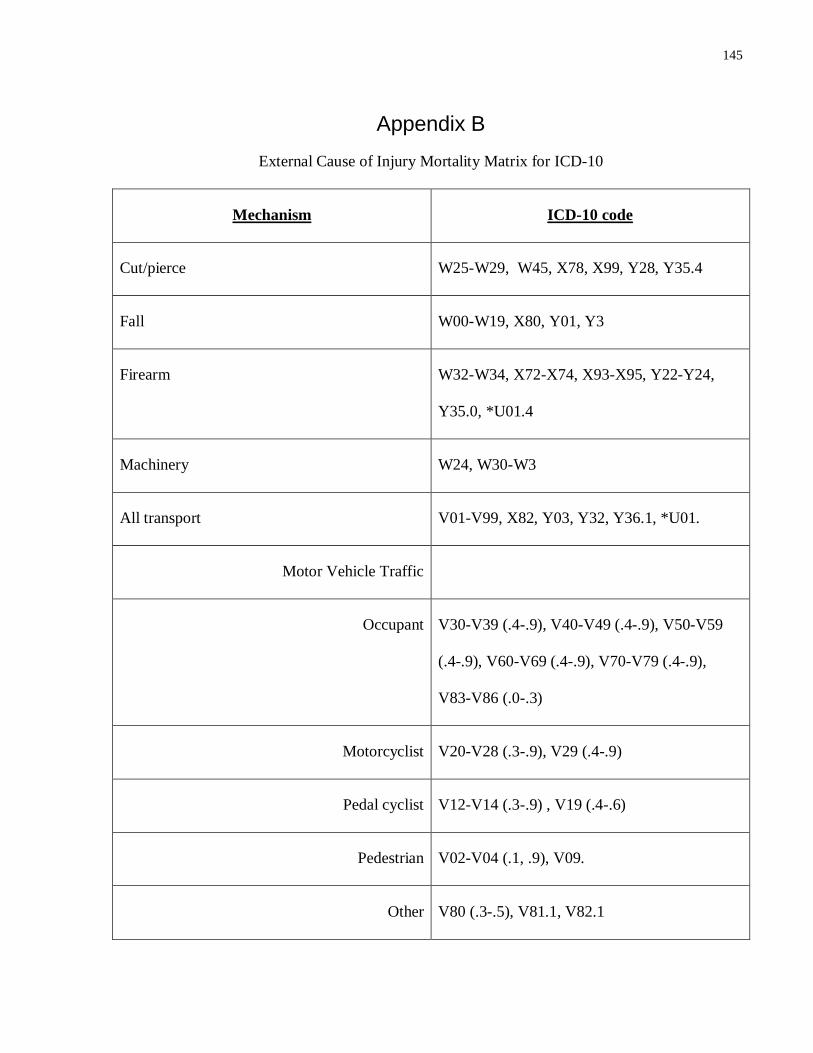
145
Appendix B
External Cause of Injury Mortality Matrix for ICD-10
Mechanism ICD-10 code
Cut/pierce W25-W29, W45, X78, X99, Y28, Y35.4
Fall W00-W19, X80, Y01, Y3
Firearm W32-W34, X72-X74, X93-X95, Y22-Y24,
Y35.0, *U01.4
Machinery W24, W30-W3
All transport V01-V99, X82, Y03, Y32, Y36.1, *U01.
Motor Vehicle Traffic
Occupant V30-V39 (.4-.9), V40-V49 (.4-.9), V50-V59
(.4-.9), V60-V69 (.4-.9), V70-V79 (.4-.9),
V83-V86 (.0-.3)
Motorcyclist V20-V28 (.3-.9), V29 (.4-.9)
Pedal cyclist V12-V14 (.3-.9) , V19 (.4-.6)
Pedestrian V02-V04 (.1, .9), V09.
Other V80 (.3-.5), V81.1, V82.1
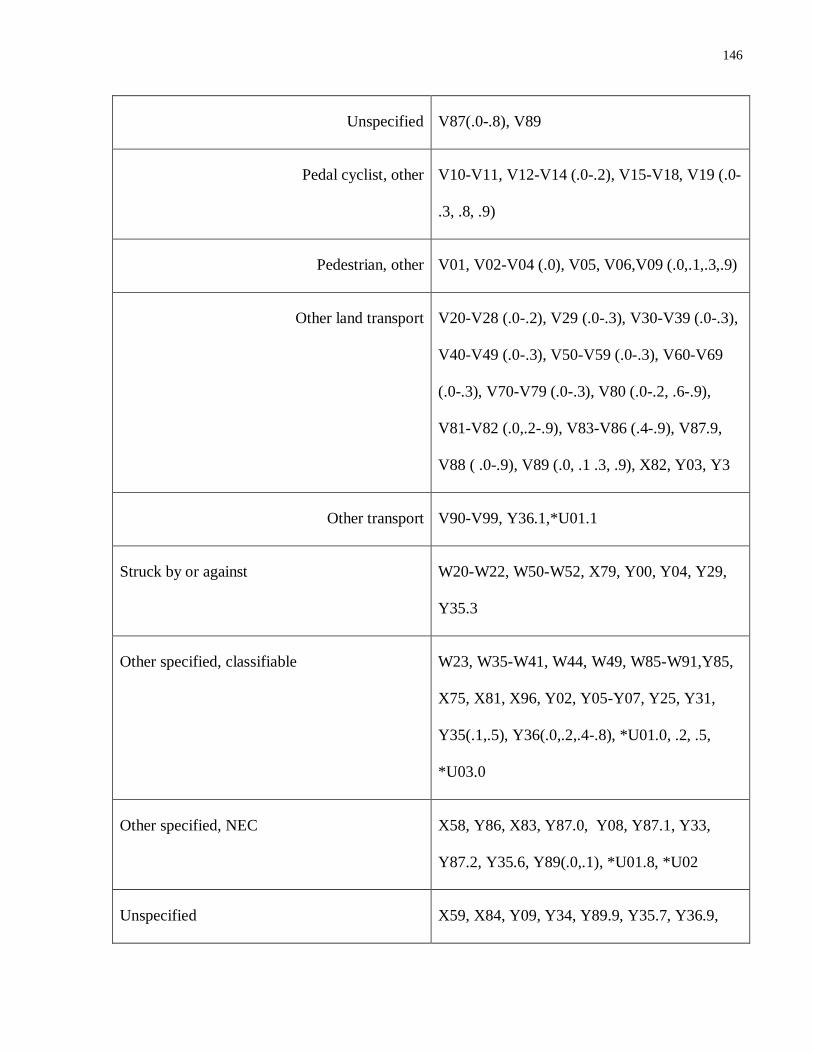
146
Unspecified V87(.0-.8), V89
Pedal cyclist, other V10-V11, V12-V14 (.0-.2), V15-V18, V19 (.0-
.3, .8, .9)
Pedestrian, other V01, V02-V04 (.0), V05, V06,V09 (.0,.1,.3,.9)
Other land transport V20-V28 (.0-.2), V29 (.0-.3), V30-V39 (.0-.3),
V40-V49 (.0-.3), V50-V59 (.0-.3), V60-V69
(.0-.3), V70-V79 (.0-.3), V80 (.0-.2, .6-.9),
V81-V82 (.0,.2-.9), V83-V86 (.4-.9), V87.9,
V88 ( .0-.9), V89 (.0, .1 .3, .9), X82, Y03, Y3
Other transport V90-V99, Y36.1,*U01.1
Struck by or against W20-W22, W50-W52, X79, Y00, Y04, Y29,
Y35.3
Other specified, classifiable W23, W35-W41, W44, W49, W85-W91,Y85,
X75, X81, X96, Y02, Y05-Y07, Y25, Y31,
Y35(.1,.5), Y36(.0,.2,.4-.8), *U01.0, .2, .5,
*U03.0
Other specified, NEC X58, Y86, X83, Y87.0, Y08, Y87.1, Y33,
Y87.2, Y35.6, Y89(.0,.1), *U01.8, *U02
Unspecified X59, X84, Y09, Y34, Y89.9, Y35.7, Y36.9,
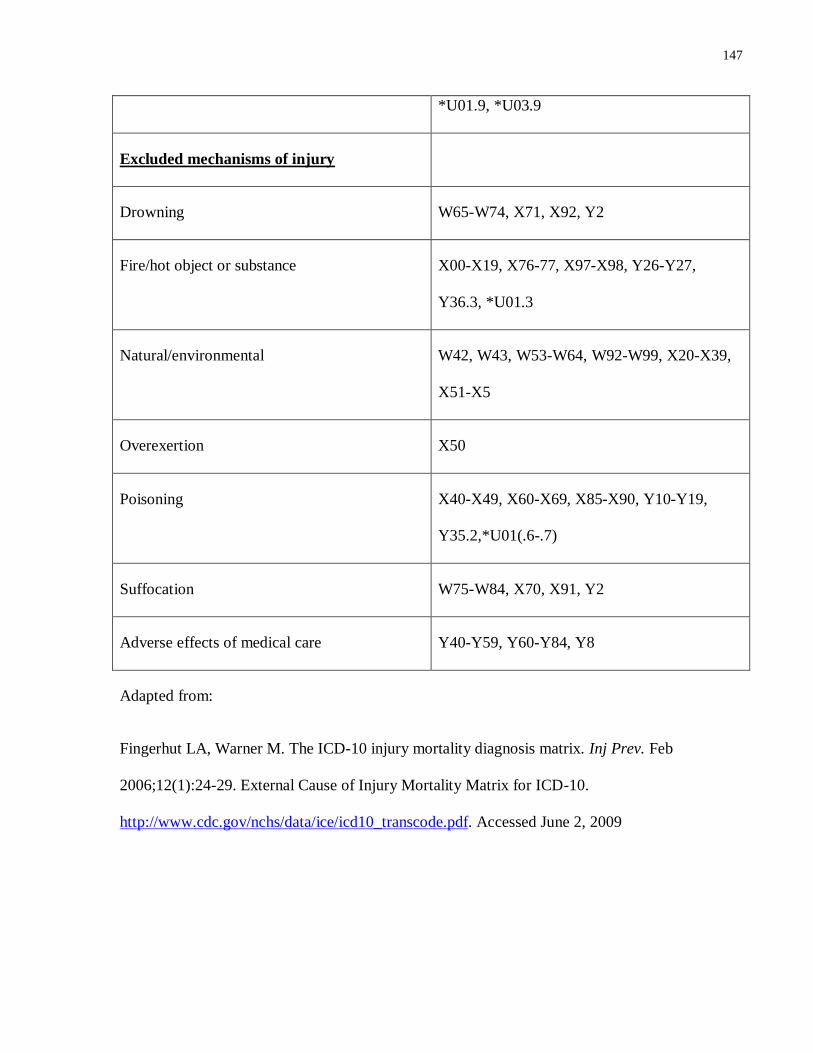
147
*U01.9, *U03.9
Excluded mechanisms of injury
Drowning W65-W74, X71, X92, Y2
Fire/hot object or substance X00-X19, X76-77, X97-X98, Y26-Y27,
Y36.3, *U01.3
Natural/environmental W42, W43, W53-W64, W92-W99, X20-X39,
X51-X5
Overexertion X50
Poisoning X40-X49, X60-X69, X85-X90, Y10-Y19,
Y35.2,*U01(.6-.7)
Suffocation W75-W84, X70, X91, Y2
Adverse effects of medical care Y40-Y59, Y60-Y84, Y8
Adapted from:
Fingerhut LA, Warner M. The ICD-10 injury mortality diagnosis matrix. Inj Prev. Feb
2006;12(1):24-29. External Cause of Injury Mortality Matrix for ICD-10.
http://www.cdc.gov/nchs/data/ice/icd10_transcode.pdf. Accessed June 2, 2009
Related Documents