The views expressed are those of the author(s) and do not necessarily represent those of the funder, ERSA or the author’s affiliated institution(s). ERSA shall not be liable to any person for inaccurate information or opinions contained herein. The monetary policy of the South African Reserve Bank: stance, communication and credibility Alberto Coco, Nicola Viegi ERSA working paper 788 July 2019

Welcome message from author
This document is posted to help you gain knowledge. Please leave a comment to let me know what you think about it! Share it to your friends and learn new things together.
Transcript

The views expressed are those of the author(s) and do not necessarily represent those of the funder, ERSA or the author’s affiliated institution(s). ERSA shall not be liable to any person for inaccurate information or opinions contained herein.
The monetary policy of the South African
Reserve Bank: stance, communication and
credibility
Alberto Coco, Nicola Viegi
ERSA working paper 788
July 2019

The monetary policy of the South African Reserve Bank: stance, communication and credibility*
Alberto Coco , Nicola Viegi †
* Acknowledgements: special thanks to Charl VanSchoor who provided truly exceptional research assistance, and to Montfort Mlachila, Chris Loewald, Konstatin Maklerov, Iikka Korhonen and seminar participants at the Bank of Italy and the South African Reserve Bank for their very useful comments and suggestions. All opinions expressed and errors made in this paper are of the authors only and not of the Institutions they belong to. Directorate of Economy and International Relations at the Banca d’Italia and, at the time of writing this paper, Financial Attaché of the Banca d’Italia at the Italian Embassy in Pretoria. † South African Reserve Bank Professor of Monetary Economics, University of Pretoria (UP).
July, 2019
Abstract
This paper analyses the evolution of the monetary policy stance, communication and credibility of the South African Reserve Bank (SARB) since 2000, when it adopted a flexible Inflation Targeting (IT) regime to facilitate the achievement of its price stability mandate. Empirical results indicate that the stance became accommodative after the global financial crisis of 2009, with a tendency of the implicit inflation target to increase, while after 2014 it turned tighter and the implicit target started declining. In addition, after the crisis the monetary policy has become less active, with a lower response of policy rates to output and inflation gaps, partially explained with the extension of the mandate to include financial stability. At the same time, applying Natural Language Processing techniques to the SARB monetary policy statements shows a move towards a more ‘forward-looking’ and balanced communication strategy, complementing to some extent the less frequent changes of monetary policy rates. Finally, the behavior of market interest rates and inflation expectations shows that monetary policy has been gradually better at anchoring expectations, especially in the last few years. The analysis helps to understand the interaction between policy, communication and credibility by showing a consistent picture across all different aspects of monetary policy making. JEL classification: C22, E42, E43, E52, E58 Keywords: Inflation Targeting, Taylor rule, Natural Language Processing, Inflation Expectations, South Africa.

2
1. Introduction
As stated in the 1996 Constitution of the Republic of South Africa, the primary object of the South
African Reserve Bank is to protect the value of the currency in the interest of sustainable and balanced economic
development and growth. To achieve its mandate, the SARB has adopted since 2000 a flexible
inflation targeting (IT) regime, which serves as a yardstick against which price stability is
measured. Specifically, the IT regime in South Africa aims at maintaining the consumer price
inflation in an annual range between 3% and 6%3. Recently, the SARB added a complementary
mandate to oversee and maintain financial stability, which underpins the achievement of price
stability and may influence to some extent the conduct of the monetary policy.
A body of literature argues that countries adopting an IT framework get on average lower
inflation and sacrifice ratio (the relative fall in output resulting from a reduction in inflation)4. In
South Africa, this also seems the case, given that different studies (Aron and Muellbauer, 2007;
Dincer and Eichengreen, 2014; more recently Kabundi and Mlachila, 2018 or Miyajima and
Yetman, 2018) have documented its relative success in anchoring inflation expectations close
to the target and in containing real and nominal volatility since it has adopted an IT regime.
On the other hand, an IT regime may also pose challenges and is sometimes considered
responsible for excessive exchange rate volatility and overall sluggish economic performances,
especially after the Global Financial Crisis (GFC). Firstly, IT may reduce monetary policy
flexibility in adjusting supply shocks (e.g., commodity price shocks) or fiscal unbalances.
Secondly, it can generate fear of floating because the pass-through from exchange rate to
inflation, if elevated, may threaten anti-inflation credibility (Calvo and Reinhart, 2002). Finally,
it may confront with financial stability issues, particularly for those emerging countries that
experience massive capital inflows fostered by expansionary monetary policies (QE) in
advanced economies. In such a case, monetary policy should complement to an effective
macro-prudential policy to preserve financial stability.
This paper studies the impact of IT regime in South Africa making three contributions. First,
we assess the monetary policy stance of the SARB since the adoption of IT and after the more
recent extension of the mandate to oversee financial stability. We estimate the SARB reaction
function through different Taylor rule specifications and across different periods. Given that
the SARB uses a target band in defining its inflation target, we estimate a time-varying implicit
inflation target to capture possible changes in policy interpretation. We also relax the
assumption of constant neutral real interest rate to capture the interaction between underlying
3 The inflation target mandate is formally set by the Government, but the Constitution provides to the Bank a considerable degree of autonomy in the execution of its duties. In terms of section 224 "the South African Reserve Bank, in pursuit of its primary object, must perform its functions independently and without fear, favour or prejudice, but there must be regular consultation between the Bank and the Cabinet member responsible for national financial matters." This implies instrument independence in monetary policy implementation. 4 See for example Corbo and Schimdt-Hebber (2001), Awazu Pereira and Agenor (2013).

3
structural changes and changes in policy stance. We finally introduce financial variables to
capture the possible effect of the widening of the mandate on the SARB reaction function.
Second, we study the SARB communication over the years by applying natural language
processing techniques on the monetary policy statements. By means of this analysis, we assess
if changes in the policy stance detected in the first section of the paper reflect in changes in
communication. In particular, we look at the various topics covered in MPC statements, at
their “sentiment”, and at how they correlate with the monetary policy decisions.
Third, we assess the credibility of the SARB monetary policy by analysing the degree at which
it anchors inflation expectations or stabilizes market reactions. In particular, we assume that a
lower sensitivity of inflation expectations or market interest rates to monetary policy decisions
signals a higher credibility and predictability of policy (Demertzis et al., 2012).
The empirical results identify three broad periods of SARB monetary policy under IT
framework. Immediately after its introduction in 2000, the SARB kept the policy rate high in
order to reduce inflation - which was largely above the target band - and signal its adherence to
the new regime. This reflects both in the policy stance and in the communication. After the
GFC, monetary policy clearly became accommodative, with a stronger weight given to output
objective and an increase of the implicit inflation target. This matched a change in the
communication, more focused on real growth. Since 2015, monetary policy has focused back
on its inflation objective through a more restrictive monetary policy stance, a clear declining
trend of the implicit inflation target, and a lower volatility of interest rates, in line with the new
financial stability objective. The less frequent variations in policy rates are somewhat offset by
a more active use of the communication, which has become more ‘forward-looking’ in content
and more neutral in tone. Finally, indicators of the market reaction to monetary policy
highlight that inflation expectations converged at the target band after 2009 with a further
reduction towards the centre of the band in most recent years. This suggests an improved
ability of the monetary policy to anchor inflation expectations in the difficult economic period
following the GFC, signalling a good level of credibility and reputation achieved by the SARB
during the IT period.
The paper structures as follows. We review the related literature in section 2. In section 3, after
briefly recalling the main features of the monetary policy framework of the SARB, we present
our econometric analysis on its monetary policy stance, including the estimates of time-varying
implicit inflation target and neutral real interest rate. Section 4 presents the analysis on the
monetary policy statements to assess the topics and the sentiment of the SARB
communication. Section 5 analyses the reaction to monetary policy decisions and inflation
changes to assess the SARB credibility. Section 6 briefly concludes.

4
2. Related literature
This paper contributes to three different strands of the literature relating to monetary policy in
South Africa. The first strand analyses the monetary policy reaction function of the SARB and
its policy stance. Aron and Muelbauer (2002) were the first ones to analyse South African
monetary policy using a Taylor rule setting, although they showed that the latter was not very
suitable for periods dominated by exchange rate management policies and financial repression.
The Taylor rule approach has become more popular after democratization, financial
liberalization and the adoption of the IT. The literature, though, concentrates on specific
aspects of the monetary policy framework. Ortiz and Sturzenegger (2007) use a DSGE model
to estimate the SARB policy rule, showing that the SARB anti-inflation stance was somewhat
moderated by a greater weight on output than what typically found in IT central banks. Klein
(2012) confirms this result, by investigating the dynamics of the implicit inflation target since
the adoption of IT. He finds that the implicit inflation target tended to drift towards the upper
level of the target band (6%), implying that the SARB had a high tolerance for inflation,
especially after the outbreak of the GFC. Ellyne and Veller (2011) find similar results by fitting
an extended Taylor rule to SARB monetary policy before and after the adoption of IT.
To evaluate the SARB policy stance, though, it is necessary to consider also the variability of
the underlying trends. Kuhn, Ruch and Steinbach (2019) estimate the Neutral Real Interest
Rate (NRIR) in South Africa using a small open economy variant of the Laubach-Williams
methodology. They find that the NRIR has fallen significantly after the GFC, but less than in
advanced economies, due to falling domestic savings and rising risk premium. This suggests
that monetary policy had to follow the global reduction on interest rates, while struggling
between the contractionary effect of exchange rate appreciation and the destabilizing effect of
depreciation on international capital flows. Fedderke and Mengisteab (2017), using a series of
filtering techniques, find a similar negative trend in potential output, which implies inflationary
pressure appearing at a relatively low level of GDP growth.
Our contribution to this strand of the literature is to evaluate the SARB monetary policy stance
by considering jointly the potential variability of targets, of underlying trends and of changes in
preferences. We also examine financial variables to capture the potential effect of the
expansion of the mandate. Finally, we focus exclusively on the IT period that is the most
suitable to be analysed with a Taylor Rule specification, with estimates updated to 2018, which
provides us with enough observations to identify changes in stance and policy preferences
before and after the GFC.
A second strand of the literature analyses the SARB communication policy. Reid and Du
Plessis (2010) studied the content of each SARB monetary policy statement. They found that
the statement provided information consistent with the present policy decision and forward

5
looking policy stance. Unfortunately, South African media reporting SARB policies statement
undermined the communication strategy of the Bank by giving news non-consistent with the
original communication (Reid and Du Plessis 2011). We add to this literature by analysing the
SARB monetary policy statements using natural language processing techniques, which allow
exploring further the changing nature of SARB communication. Moreover, we analyse
communication as a part of the wider monetary policy analysis, providing a consistent picture
of different aspects of monetary policy.
A final strand of the literature looks at the evolution of SARB credibility and its ability to
anchor expectations. Several papers have estimated the response of market or inflation
expectations to the monetary policy decisions. Kabundi et al. (2015), Kabundi and Mlachila
(2018), Miyajima and Yetman (2018) have documented an increase in SARB credibility by
showing a lower exchange rate pass-through or a lower dispersion among inflation forecasters.
We largely follow this literature by looking at different measures of anchorage of inflation
expectations that we link to our assessment and changes of communication, policy rule and
stance. In doing so, we hopefully develop a consistent picture of the monetary policy strategy.
3. An assessment of the monetary policy stance
Before starting our analysis, it is useful to recall the main features of the monetary policy
strategy of the SARB. Price stability ‘provides a favourable environment for growth and employment,
helping to protect the purchasing power and living standards of South Africans, especially the poor who have no
means of defending against continually rising prices’. In order to bring a greater degree of transparency
and ease the achievement of its mandate, the SARB adopted in 2000 an IT framework, after
consultation with the Government. The Monetary Policy Committee (MPC) decided to adopt
a flexible IT framework, aiming at keeping inflation within a target range of 3%-6% yearly.
Compared with a point target, the target range allows a higher degree of flexibility for
absorbing shocks outside the control of the authorities. It allows for interest rate smoothing
over the cycle, which may mitigate the output variability from the monetary policy response to
the shock and contribute to stable economic growth.
In 2010, after the outbreak of the GFC, the Minister of Finance Gordhan formally requested
to evaluate the introduction of the mandate of ensuring financial stability in addition to price
stability. The financial stability mandate was formally adopted by the SARB in 2015 according
to the Financial Sector Regulation Bill (FSRB), and it refers to a ‘financial system which is resilient to
systemic shocks, facilitates efficient financial intermediation and mitigates the macroeconomic costs of disruptions
in such a way that confidence in the system is maintained’. It may influence the conduct of monetary
policy because increases the weight of financial stability, for instance containing the risks
embedded in the volatility of interest or exchange rates in the preferences of the SARB.

6
We start our analysis investigating the monetary policy stance of the SARB since it has adopted
the IT regime in 2000. In this period of almost twenty years, South Africa has experienced
different economic phases and three different Governors at the central bank. Given that the
South African IT regime encompasses a band of 3%-6% instead of a point target, it is also
interesting to estimate the implicit inflation target, which can refer to the central value of the
band or elsewhere. Inflation expectations indicate that, even in the last decade of inflation well
contained within the band, economic agents stick more towards the upper bound of 6% rather
than its central value of 4.5%. This explains why recently the SARB communication insists on
the goal to drive expectations at the centre of the band (section 4).
In order to assess the monetary policy stance, we estimate a reaction function of the SARB
under a Taylor rule specification:
𝑖𝑡 = 𝑟*t + 𝜋e𝑡 + 𝛼𝜋(𝜋e
𝑡 – 𝜋*𝑡)+𝛼𝑦(yt – y*t )+𝛼𝑅(𝑅E𝑅𝑡−𝑅ER)
where 𝑖𝑡 is the policy rate measured with the interbank overnight rate Sabor, r*t is the estimated
real neutral interest rate, 𝜋e𝑡 is the inflation expectations rate, 𝜋*𝑡 is the official target rate, yt –
y*t is the output gap, 𝑅E𝑅𝑡−𝑅ER is the deviation of the real effective exchange rate from its
equilibrium value. Data are quarterly and detailed in the Appendix 1. Rearranging terms, the
equation above can be written as:
𝑖𝑡 = 𝑟*𝑡 + 𝜋*𝑡 + (1+𝛼𝜋) (𝜋e𝑡 – 𝜋*𝑡)+𝛼𝑦(yt – y*t )+𝛼𝑅(𝑅E𝑅𝑡−𝑅ER) (1)
where (1+𝛼𝜋) indicates the reaction of the SARB to deviations of expected inflation from the
target, 𝛼𝑦 the reaction to the output gap, and 𝛼𝑅 indicates the reaction to exchange rate
deviations. As said before, the SARB aims at smoothing the interest rate, in line with the
literature (Clarida et al., 1999) and the additional financial stability mandate. Adding two lags at
the Sabor rate5, equation 1 becomes:
𝑖𝑡 = 𝛼i1it-1 + 𝛼i2it-2 + (1-𝛼i1-𝛼i2)[r*𝑡 + 𝜋*𝑡 + (1+𝛼𝜋) (𝜋e𝑡 – 𝜋*𝑡)+𝛼𝑦(yt – y*t ) + 𝛼𝑅(𝑅E𝑅𝑡−𝑅ER)]
being 𝛼i1 and 𝛼i2 the autoregressive coefficients on Sabor rate. Our equation can be finally
written as:
𝑖𝑡 = 𝛼0+ 𝛼i1it-1 + 𝛼i2it-2 + (1-𝛼i1-𝛼i2)[(1+𝛼𝜋) (𝜋e𝑡 – 𝜋*𝑡)+𝛼𝑦(yt – y*t ) + 𝛼𝑅(𝑅E𝑅𝑡−𝑅ER)]+ut (2)
where 𝛼0 =(1-𝛼i1-𝛼i2)(r*+𝜋*) captures the neutral nominal interest rate, assumed to be
constant for the moment.
Table 1 reports the main results from the estimation of equation 2, with different specifications
and for different sub-samples.
5 The autoregressive analysis on the interest rate indicates at least two lags as significant.

7
Table 1. Estimation of the SARB reaction function
Sample Sub-samples With reer
Variable 2000-2018 2000-2009 2010-2018 2000-2014 2000-2018 2000-2009 2010-2018
constant
𝛼0
0.751
(0.000)
2.096
(0.001)
0.155
(0.681)
0.720
(0.003)
0.761
(0.000)
2.125
(0.002)
0.516
(0.110)
interest rate(-1)
𝛼i1
1.375
(0.000)
1.366
(0.000)
1.422
(0.000)
1.336
(0.000)
1.372
(0.000)
1.365
(0.000)
0.915
(0.000)
interest rate(-2)
𝛼i2
-0.506
(0.000)
-0.652
(0.000)
-0.497
(0.003)
-0.471
(0.000)
-0.502
(0.000)
-0.661
(0.000)
inflation expectations
(1-𝛼i1-𝛼i2)(1+𝛼𝜋)
0.150
(0.027)
0.278
(0.008)
0.136
(0.294)
0.167
(0.032)
0.133
(0.115)
0.331
(0.014)
-0.081
(0.482)
output gap
(1-𝛼i1-𝛼i2)𝛼y
0.187
(0.001)
0.082
(0.402)
-0.088
(0.523)
0.224
(0.002)
0.181
(0.003)
0.099
(0.335)
-0.065
(0.556)
reer gap
(1-𝛼i1-𝛼i2)𝛼R
-0.002
(0.716)
0.006
(0.512)
-0.026
(0.000)
R-squared 0.960 0.922 0.946 0.960 0.960 0.924 0.965
Akaike info criterion 1.357 1.837 -0.325 1.557 1.382 1.874 -0.758
reaction = 1+𝛼𝜋 1.151 0.973 1.828 1.246 1.025 1.118 -0.398
neutral rate = 𝛼0/(1-𝛼i1-𝛼i2) 5.743 7.327 2.071 5.364 5.875 7.170 3.121
Note: p-value in parentheses
The coefficients show the expected sign: the interest rate increases in response of an increase
of inflation expectations or output gap, and decreases for an increase (appreciation) of the real
exchange rate. For the whole sample 2000Q1-2018Q2 (first column), all coefficients are
significant and the reaction to deviations of inflation expectations is greater than one, implying
that the SARB follows the so-called Taylor principle.
When we look at the first sub-sample 2000Q1-2009Q4 (second column), under the Governor
Tito Mboweni, the coefficient on output gap does not result significant, while the reaction to
inflation gap is slightly below one, implying that it does not satisfy the Taylor principle. This
result is probably influenced by the structural break of the GFC in 2009 (detected by Chow
tests). In fact, if we regress from 2000Q1 up to 2008Q4, excluding the year 2009 in which
South Africa economy experienced a recession and the policy rate abruptly decreased, then the
reaction coefficient to inflation gap is much higher (0.50) and satisfies the Taylor principle
(1+𝛼𝜋=1.3), while the reaction to output gap remains not significant.
In the second sub-sample from 2010Q1 to 2018Q2 (third column), coefficients become mostly
insignificant, apart from the lagged interest rates. During this period the SARB monetary
policy has become less active: policy rate changes have been less frequent and smaller in size.
One possible motivation is to contain the volatility of interest rates in the monetary and
financial markets, in line with the new mandate of financial stability proposed in 2010 and
adopted in 2015. To test if the new financial stability mandate may have a role in this result, we

8
add some financial indicators as explanatory variables in the Taylor rule (Appendix 2 shows
some results). Adding the ratio of credit to GDP, which is a common indicator for financial
risks6, we notice that in the first sub-sample the coefficient has a negative sign, indicating an
inverse relationship with the policy rate that we interpret as reverse causality (typically a
decrease of policy rate raises credit and vice versa). On the contrary, the coefficient becomes
positive in the second subsample (2010-18): the policy rate now rises with credit to prevent an
economy overheating and reduce the risk of financial bubbles. Other indicators, such as
financial stress, capital inflows or debt ratios also show positive signs in the second subsample,
suggesting that concerns over financial stability may induce an increase in the policy rate, while
in the first sub-sample their coefficients are mostly negative or not significant.
The right-hand panel of table 1 (fifth to seventh columns) shows the results including the real
effective exchange rate gap7 among the explanatory variables in the Taylor rule. The exchange
rate has an important role in South Africa, due to the openness of the country to foreign
capitals and the possible pass-through to the inflation8. This might in principle induce the
central bank to react in the case of excessive and lasting depreciation (the so-called fear of
floating), even if it is important to recall that the SARB considers the exchange rate an
automatic stabilizer and lets it free to fluctuate without intervening in the currency market. The
coefficient on real effective exchange rate gap is significant in the second sub-sample only with
the expected negative sign: a rand depreciation may induce an increase of the interest rate. This
seems in line with what we just inferred about the additional mandate: in the last decade the
SARB has paid more attention to financial stability in the economy, given that fluctuations in
the exchange rate are strictly correlated to the inflow of foreign capitals and the level of official
reserves. Finally, the introduction of the real exchange rate lowers the significance of inflation,
probably due to co-linearity between the two variables.
The second sub-sample 2010-2018 refers to a period in which two different Governors
succeeded: Gill Marcus was in charge from 2010Q1 to 2014Q4, when was replaced by the
current Governor Lesetja Kganyago. Since each mandate includes a limited number of
quarterly observations, in order to disentangle between them we compare the coefficients
estimated for the whole sample 2000-2018 with those estimated for the sample 2000-2014
(fourth column), which excludes the mandate of Kganyago. From 2000 to 2014 both the
responses to inflation (0.17) and output gap (0.22) are higher compared to the whole sample
6 The SARB uses the credit/gdp gap for macro-prudential purposes to assess if banks need a countercyclical
capital buffer. 7 It is the difference between the real effective exchange rate and the real equilibrium exchange rate (REER). The latter is estimated by the SARB through a VECM model considering the key economic fundamentals, including an interest rate differential, a productivity measure, commodity prices, fiscal balance and capital flows (de Jager, 2012). 8 Although, Kabundi and Mlachila (2018) document a decrease of the pass-through in South Africa over the years, attributing it to the increased credibility of the central bank, among the others.

9
-2
-1
0
1
2
4
6
8
10
12
14
2000 2002 2004 2006 2008 2010 2012 2014 2016 2018
Residual Actual Fitted
(respectively 0.15 and 0.19). This might suggest a lower degree of activism of the SARB since
2015, after the financial stability goal has been added to its mandate. Another interesting
insight can be drawn by comparing the results from the sample 2000-2014 with those from the
sample 2000-2009, to assess if and what changed when Marcus replaced Mboweni after the
outbreak of the GFC. In the period including Marcus the response to inflation notably
decreases (from 0.28 to 0.17), while that to output notably increases (from 0.08 to 0.22). This
indicates a stance more oriented towards growth under the Governor Marcus compared to the
Governor Mboweni, certainly as a consequence of the GFC outbreak.
Figure 2. Observed and estimated Sabor rate
In order to assess the monetary policy stance by the SARB, we compare the estimated or fitted
SABOR rate with the effective or observed one (Figure 2). If the SARB sets the policy rate
lower than the level predicted by the reaction function, this suggests a more accommodative
stance, and vice versa. Immediately after the adoption of the IT (2000-2002) the actual rate is
above the fitted one, maybe to signal the new anti-inflationary regime in a period in which the
inflation was largely higher than the target band. From 2003 to 2008 the fitted rate matches
quite closely the observed rate. In 2009, when the GFC broke up, the observed policy rate
becomes lower than the level suggested by the model until 2014. As said before, the SARB
moved to an accommodative stance to counter recession. Since 2015, under Kganyago, the
observed interest rate moves above the fitted one, suggesting a tighter monetary policy. This
can be explained both with the new mandate of financial stability and with the upside risks on
inflation caused by the growing volatility of the rand, related to policy and political uncertainty
after 2015. Section 4 returns to these findings when we analyse the SARB communication
through the language used in the monetary policy statements.

10
When we look at the estimated reaction function in equation 2, we must take into account
various elements that may exert a role on the observations made so far. On the one hand, we
know that both the equilibrium real exchange rate and the potential output are unobserved, so
they could in principle be lower or higher that the estimated level and influence the policy rate
in one direction or another. However, the fact that the series estimated by the SARB and by
ourselves (through a HP filter for potential output and a long-run average for the real effective
exchange rate) display a similar pattern (see Appendix 1) provides us with an indication of
robustness and reliability. On the other hand, the constant term captures the neutral nominal
interest rate, composed of the real neutral interest rate r* and the inflation target π*. Even
these two terms are unobservable and in the reality they might change instead of being
constant as assumed, and their variations could impact the policy rate. For example, if the real
neutral rate drops, ceteris paribus the policy rate drops too (together with the constant term in
equation 2). On the contrary, if the implicit inflation target decreases, the constant decreases as
well but the policy rate tends to increase, because it enters the inflation gap with a negative
sign. Therefore, in the following two sub-sections we relax the two assumptions of a constant
real neutral rate and a constant inflation target.
3.1. A time-varying inflation target. We first assume that the inflation target can vary. As
said, this hypothesis is worthy to be analysed because the SARB adopts a target band instead
of a point target, implying that in principle the implicit target may oscillate between 3% and
6%9. If the implicit inflation target increases (decreases), it may explain a lower (higher) interest
rate and a more accommodative (tighter) stance.
In order to estimate the implicit inflation target, we apply a state space approach like in Klein
(2012), by adding a state equation for the time-varying implicit inflation target10:
𝑖𝑡 = 𝛼0+ 𝛼i1it-1 + 𝛼i2it-2 + (1-𝛼i1-𝛼i2)[(1+𝛼𝜋) (𝜋e𝑡 – 𝜋*𝑡)+𝛼𝑦(yt – y*t )]+ut (3)
implicit inflation target: 𝜋*𝑡=𝜋*𝑡−1+𝜐𝑡, Var(𝜐𝑡)=𝜆Var(𝑢𝑡)
The term 𝜐𝑡 is a zero-mean, serially uncorrelated Gaussian disturbance while the parameter λ is
the so-called “signal-to-noise” ratio, which determines the link between the policy rate’s
variance and the inflation target’s variance. Table 2 reports the results from the regression,
while Figure 3 shows the estimated implicit inflation target for different values of the “signal-
to-noise” ratio parameter, chosen consistently with those used by Klein to facilitate
comparison.
9 Only recently, since 2017, the SARB started communicating explicitly that it considers the inflation target at the centre of the target band (4.5%) to lower inflation expectations (section 5). 10 We consider the equation without the rel exchange rate. Including it, the results are qualitatively the same.

11
Table 2. Estimation of reaction function with time-varying inflation target (2000-2018)
λ=0.2 λ=0.1 λ=0.05 λ=0.025
coeff p-value coeff p-value coeff p-value coeff p-value
a(0) 3.19 1.00 2.82 1.00 2.12 1.00 1.00 1.00
a(i1) 1.04 0.00 1.09 0.00 1.17 0.00 1.34 0.00
a(i2) -0.45 0.00 -0.46 0.00 -0.48 0.00 -0.50 0.00
(1-ai1-ai2)(1+aπ) 0.55 0.00 0.52 0.00 0.44 0.00 0.21 0.00
(1-ai1-ai2)ay 0.32 0.00 0.30 0.00 0.27 0.00 0.20 0.00
Var(u) -2.19 0.00 -1.99 0.00 -1.78 0.00 -1.64 0.00
reaction=1+aπ 1.34 1.41
1.42
1.31
Figure 3. The estimated implicit inflation target
ƛ=0.2 ƛ=0.1
3
4
5
6
7
8
9
2000 2002 2004 2006 2008 2010 2012 2014 2016
TGT ± 2 RMSE
Filtered State TGT Estimate
2
3
4
5
6
7
8
9
2000 2002 2004 2006 2008 2010 2012 2014 2016
TGT ± 2 RMSE
Filtered State TGT Estimate
ƛ=0.05 ƛ=0.025
2
3
4
5
6
7
8
2000 2002 2004 2006 2008 2010 2012 2014 2016
TGT ± 2 RMSE
Filtered State TGT Estimate
-1
0
1
2
3
4
5
6
7
2000 2002 2004 2006 2008 2010 2012 2014 2016
TGT ± 2 RMSE
Filtered State TGT Estimate
Table 2 shows all coefficients to be significant, apart from the constant, and the reaction to
inflation deviations always satisfying the Taylor principle. Most important, all charts in Figure 3
show that the implicit inflation target was indeed not constant at the centre of the band, but it
exhibited an increasing trend up to 2013-2014 and then started decreasing. Depending on the
sensitivity of the variance (parameter λ) the variation is more or less pronounced, but the
direction is confirmed for different values of the parameter. Observations on the monetary
policy stance derived from the previous estimation are somewhat confirmed. After the
introduction of the IT regime, when the effective inflation was above the upper limit of the

12
target band, the implicit inflation target stayed in the upper part of the band, virtually
exceeding the upper limit after the outbreak of the GFC. Only in 2014, at the end of the
mandate of the Governor Marcus, it started declining towards the centre of the band. This
result appears consistent with previous findings: Gill Marcus seemed more tolerant about
inflation, while under Kganyago the SARB became more oriented to push back inflation inside
the band against a volatile and depreciating rand.
3.2. A time-varying neutral interest rate. We now focus on the neutral interest rate. First, we
can calculate the nominal neutral interest rate from the estimated coefficients in equation 2,
computing r*+π* as 𝛼0/(1-𝛼i1-𝛼i2). Table 1 shows it to have declined significantly from the
first sub-sample to the second one, but in the latter the constant term 𝛼0 is not significant. If
the official inflation target did not change, the drop in nominal rates would signal a decline in
the real interest rate. This seems consistent both with international evidence, which documents
that neutral rate has fallen in the post-crisis period in several countries (Trebeschi, 2015), and
with the estimate of the Neutral Real Interest Rate (NRIR) by the SARB (Appendix 1), which
decreased by around 3 average percentage points from the first to the second decade of 2000s.
The SARB determines the NRIR through a long-run Uncovered Interest Parity (UIP)
relationship with weighted interest rates of the US, euro area and Japan, by adding a country
risk premium (South Africa plus Emerging Markets Bond Index). Adding the NRIR estimated
by the SARB as a new explanatory variable, our Taylor rule assumes the following form:
𝑖𝑡 = 𝛼0+𝛼rrt+𝛼i1it-1+𝛼i2it-2+(1-𝛼i1-𝛼i2)[(1+𝛼𝜋)(𝜋e𝑡 – 𝜋*𝑡)+𝛼𝑦(yt–y*t)+𝛼𝑅(𝑅E𝑅𝑡−𝑅ER)]+ut (4)
Table 3 reports the results of the estimate of equation (4). Compared with the results of the
regression of equation (2), the NRIR improves the goodness of the fit (R-square increases and
Akaike criteria decreases) as well as the overall significance of both inflation expectations and
output gap coefficients. In the second sub-sample output gap is still not significant, while
inflation becomes significant at 90%. The real effective exchange rate gap (right-hand side of
the table) also results to be significant and with the expected sign, especially in the second sub-
sample, although at detriment of inflation and output gap. This is consistent with what we
inferred before about the role of the financial stability mandate after the crisis.
Comparing the actual and fitted series of the interest rates (Fig. 4), we notice that the higher
NRIR at the start of the sample raises the fitted series closer to the observed one. The tight
monetary policy stance from 2000 to 2002 is now explained by a higher NRIR, which pushed
up the policy rate. For the last decade the results of the previous section are even strengthened:
from 2010 to 2014 the actual rate is below the fitted one, suggesting an accommodative stance,
while from 2015 it moves well above, indicating a tighter stance.
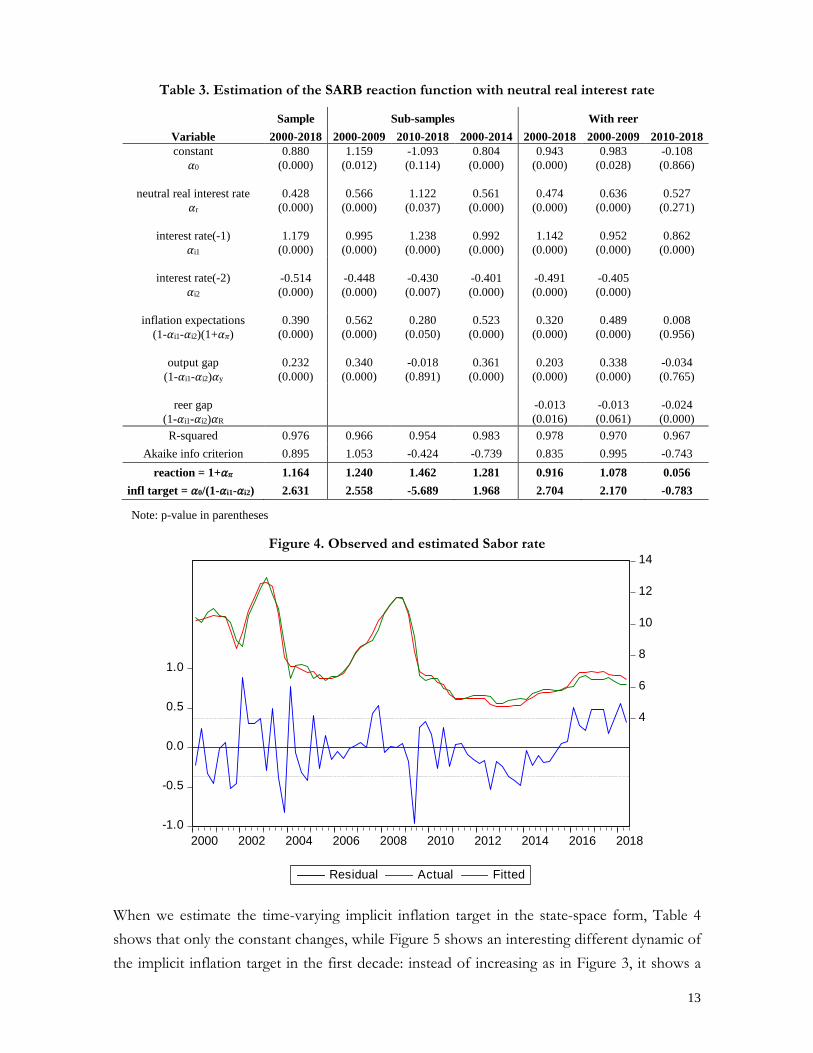
13
Table 3. Estimation of the SARB reaction function with neutral real interest rate
Sample Sub-samples With reer
Variable 2000-2018 2000-2009 2010-2018 2000-2014 2000-2018 2000-2009 2010-2018
constant
𝛼0
0.880
(0.000)
1.159
(0.012)
-1.093
(0.114)
0.804
(0.000)
0.943
(0.000)
0.983
(0.028)
-0.108
(0.866)
neutral real interest rate
𝛼r
0.428
(0.000)
0.566
(0.000)
1.122
(0.037)
0.561
(0.000)
0.474
(0.000)
0.636
(0.000)
0.527
(0.271)
interest rate(-1)
𝛼i1
1.179
(0.000)
0.995
(0.000)
1.238
(0.000)
0.992
(0.000)
1.142
(0.000)
0.952
(0.000)
0.862
(0.000)
interest rate(-2)
𝛼i2
-0.514
(0.000)
-0.448
(0.000)
-0.430
(0.007)
-0.401
(0.000)
-0.491
(0.000)
-0.405
(0.000)
inflation expectations
(1-𝛼i1-𝛼i2)(1+𝛼𝜋)
0.390
(0.000)
0.562
(0.000)
0.280
(0.050)
0.523
(0.000)
0.320
(0.000)
0.489
(0.000)
0.008
(0.956)
output gap
(1-𝛼i1-𝛼i2)𝛼y
0.232
(0.000)
0.340
(0.000)
-0.018
(0.891)
0.361
(0.000)
0.203
(0.000)
0.338
(0.000)
-0.034
(0.765)
reer gap
(1-𝛼i1-𝛼i2)𝛼R
-0.013
(0.016)
-0.013
(0.061)
-0.024
(0.000)
R-squared 0.976 0.966 0.954 0.983 0.978 0.970 0.967
Akaike info criterion 0.895 1.053 -0.424 -0.739 0.835 0.995 -0.743
reaction = 1+𝛼𝜋 1.164 1.240 1.462 1.281 0.916 1.078 0.056
infl target = 𝛼0/(1-𝛼i1-𝛼i2) 2.631 2.558 -5.689 1.968 2.704 2.170 -0.783
Note: p-value in parentheses
Figure 4. Observed and estimated Sabor rate
-1.0
-0.5
0.0
0.5
1.0
4
6
8
10
12
14
2000 2002 2004 2006 2008 2010 2012 2014 2016 2018
Residual Actual Fitted
When we estimate the time-varying implicit inflation target in the state-space form, Table 4
shows that only the constant changes, while Figure 5 shows an interesting different dynamic of
the implicit inflation target in the first decade: instead of increasing as in Figure 3, it shows a

14
slight declining path from 2002 to 2007, under the Governor Mboweni11. The reason is the
following: the observed drop in the policy rate (from 2003 to 2006) is now explained by the
decrease of the NRIR in the same period and not anymore by an increase of the implicit
inflation target, as it appeared in Figure 3 when the NRIR was assumed constant. In the last
decade, when the NRIR is more stable, the direction of the implicit inflation target is
confirmed: it increases from 2010 to 2014 under Marcus, and firmly decreases after 2014 under
Kganyago.
Table 4. Reaction function with neutral interest rate and time-varying inflation target (2000-18)
λ=0.2 λ=0.1 λ=0.05 λ=0.025
coeff p-value coeff p-value coeff p-value coeff p-value
a(0) 0.52 1.00 0.64 1.00 0.72 1.00 0.73 1.00
a(r) 0.65 0.00 0.59 0.00 0.54 0.00 0.49 0.00
a(i1) 1.00 0.00 1.04 0.00 1.08 0.00 1.12 0.00
a(i2) -0.42 0.00 -0.44 0.00 -0.46 0.00 -0.48 0.00
(1-ai1-ai2)(1+aπ) 0.53 0.00 0.50 0.00 0.47 0.00 0.43 0.00
(1-ai1-ai2)ay 0.31 0.00 0.30 0.00 0.28 0.00 0.27 0.00
Var(u) -2.45 0.00 -2.33 0.00 -2.24 0.00 -2.17 0.00
reaction=1+aπ 1.25
1.26
1.25
1.22
Figure 5. The estimated implicit inflation target
ƛ=0.2 ƛ=0.1
2.4
2.8
3.2
3.6
4.0
4.4
4.8
5.2
5.6
6.0
2000 2002 2004 2006 2008 2010 2012 2014 2016 2018
TGT ± 2 RMSE
Filtered State TGT Estimate
2.8
3.2
3.6
4.0
4.4
4.8
5.2
5.6
6.0
2000 2002 2004 2006 2008 2010 2012 2014 2016
TGT ± 2 RMSE
Filtered State TGT Estimate
ƛ=0.05 ƛ=0.025
3.2
3.6
4.0
4.4
4.8
5.2
5.6
6.0
2000 2002 2004 2006 2008 2010 2012 2014 2016 2018
TGT ± 2 RMSE
Filtered State TGT Estimate
3.0
3.5
4.0
4.5
5.0
5.5
6.0
2000 2002 2004 2006 2008 2010 2012 2014 2016
TGT ± 2 RMSE
Filtered State TGT Estimate
11 This may better justify the reputation of Tito Mboweni as a hawk during his mandate at the SARB.

15
Figure 6. The estimated implicit inflation target (initial level 6%)
ƛ=0.2 ƛ=0.1
3.6
4.0
4.4
4.8
5.2
5.6
6.0
6.4
6.8
7.2
2000 2002 2004 2006 2008 2010 2012 2014 2016
TGT ± 2 RMSE
Filtered State TGT Estimate
4.0
4.4
4.8
5.2
5.6
6.0
6.4
6.8
7.2
2000 2002 2004 2006 2008 2010 2012 2014 2016
TGT ± 2 RMSE
Filtered State TGT Estimate
ƛ=0.05 ƛ=0.025
4.5
5.0
5.5
6.0
6.5
7.0
7.5
2000 2002 2004 2006 2008 2010 2012 2014 2016
TGT ± 2 RMSE
Filtered State TGT Estimate
4.5
5.0
5.5
6.0
6.5
7.0
7.5
2000 2002 2004 2006 2008 2010 2012 2014 2016
TGT ± 2 RMSE
Filtered State TGT Estimate
The last observation regards the level of the implicit inflation target, which in Figure 5 appears
mostly in the bottom half of the band. If we set its initial level in 2000 not anymore at its
centre value (4.5%) but at the upper limit of the band (6%), things change. When the IT
regime was introduced in 2000, inflation was between 7% and 8%, therefore it is quite realistic
to set the implicit inflation target at 6% and not at 4.5% at that time. In such a case, Figure 6
shows an implicit inflation target constantly in the upper part of the band, which decreases
towards its median value only in the last few years, consistently with the recent SARB
communication, that we are going to analyse in the next section.
4. An assessment of the monetary policy communication
The previous section has investigated the stance of monetary policy, by distinguishing among
various periods and Governors. Another fundamental aspect in the IT framework is the
communication strategy. An effective communication is essential for any central bank to
anchor inflation expectations and facilitate the achievement of its mandate. This is particularly
true in South Africa, where rigidities in goods and labor markets make the wage setting
mechanism not flexible enough (Viegi, 2015). In such a context, an effective communication
succeeding to anchor agents’ expectations would avoid the second-round effects on inflation.

16
In this section we use a machine learning tool to evaluate the communication style and content
of the monetary policy statements by the SARB. Analysing available text data requires us to
look at new Natural Language Processing (NLP) techniques. In particular, we consider two
different NLP techniques: topic modelling and sentiment analysis. The former models
documents into topics, represented by words for each given topic. The latter assesses the
sentiment of a particular document by considering the proportionate and average sentiment of
the words in the given document.
4.1 Topic modelling. For topic modelling we use the Latent Dirichlet Allocation (LDA) like
in Blei et al. (2003). LDA is a statistical model that discovers the abstract topics that occur in a
set of documents. The intuition of Blei et al. (2003) is that words carry strong semantic
information, and documents discussing similar topics use similar sets of words. So each topic is
described by a certain set of words, and each document is described by a certain mixture of
topics. In essence, grouped words that consistently occur together within the corpus are
considered to form one topic, and each topic will have some distribution over the documents.
LDA works with probability distributions of words and documents over the topic space.
Appendix 3 provides an illustration of the model, which distributes the words over the
different latent topics (z distribution), and the topics over the documents (θ distribution). In
other words, we estimate the probability that a word describes a topic for all words, and the
probability that a document contains a particular topic for all topics.
Figure 7. Distribution of topics in the monetary policy statements

17
LDA identifies six relevant topics in the monetary policy statement by the SARB during the IT
period, according to a certain set of recurring words. Fig. 7 illustrates the distribution of each
topic in all the monetary policy statements over time: it is evident that some topics are more
recurrent than others in every period. In particular, we notice that topics 6 and 4 are prevalent
in the first decade of 2000s, under the Governor Mboweni. Topics 1 and 2 recur more from
2010 to 2014, after the GFC under the Governor Marcus. Finally, topics 5 and especially 3
recur more in the last period, after 2015 under the Governor Kganyago.
Figure 8. Recurring words for each topic.
topic 6 topic 4 topic 1
topic 2 topic 5 topic 3
Once seen the distribution of the topics across time, we look at their content, that is at the
words recurring in each topic. This allows us to assess if and how communication changed
over years. To this end, we regroup the topics in a chronological order, according to their
distribution as indicated in Figure 7, and show their content in Figure 8. In the first period
under the Governor Mboweni (topics 6 and 4 more frequent), the communication focuses on
price and inflation developments. The intuition is that the SARB makes an effort to establish
the language and the credibility of the new IT regime. After the outbreak of the GFC under
the Governor Marcus (topics 1 and 2 more frequent), the focus of the communication clearly
changes, with much more emphasis placed on the issues of global and local growth. This is
consistent with the increase of the implicit inflation target and with the accommodative stance
documented in the previous section. Finally, in the last period under the Governor Kganyago

18
(topics 5 and 3 more frequent), communication appears to change again: growth concerns are
replaced by a greater emphasis on expectations and inflation forecast, signalling a
communication more forward-looking in nature, in line with other central banks around the
world12. This appears once again consistent with the drop of the implicit inflation target and
with the tighter stance of the SARB we documented before in order to bring down inflation
expectations (as we document in next section 5).
4.2 Sentiment analysis. Sentiment analysis is the process of assigning positive or negative
values to words we consider of a positive or negative nature. For example, the word
"recovery" is usually considered to be positive, whereas "risk" is usually considered to be
negative. Either discrete or categorical values can be assigned to words, indicating their
sentiment, and there exist multiple ways of allocating sentiment. For the purpose of this
section, we look at two different techniques: i) sentiment lexicon by Liu (2018); ii) scoring by
Nielsen (2011). The first technique assigns the labels "positive" and "negative" to the words in
the statements, by using the manually label lexicon library created by Liu. We take the
proportion of positive and negative words in the corpus of each document (the entire text set,
all of the documents combined) and plot them to see how the proportional sentiment differ
across documents.
Figure 9. Sentiment of the MPC over time and different Governors (Liu sentiment lexicon)
Figure 9 shows the balance of sentiment in the monetary policy statements for the IT period.
The left-hand panel shows that the sentiment of the communication has become “negative”
12 In this regard, since 2017 the Monetary Policy Committee of the SARB has introduced in the statements the explicit indication of the implied path of future policy rates generated by the Quarterly Projection Model.

19
after the GFC, when more focus has been dedicated to growth and real uncertainty rather than
communicating the inflation objective, as seen before in the topic analysis. This also reflects
the increase in the implicit inflation targeting shown in the previous section. The negative bias
in the SARB communication during the mandate of the Governor Marcus is driven by the
uncertainty about the real effect of the GFC, which partly offsets the goal of achieving the
inflation objective. The communication becomes more “neutral” in the last period, when the
focus switches to inflation forecasts and long-term uncertainty, reflected in the forward-
looking nature of the communication and in the drop of implicit inflation target.
We get similar results by using the scoring method by Nielsen (2011). This technique assigns to
any word in a document a value between -2 and 2 according to sentiment label of words in the
AFINN lexicon. Each document gets a sentiment score, which is the average score of the
words in the documents. Figure 10 shows the worsening in sentiment around the global
financial crisis as well as the improvement in the last period.
Figure 10. Sentiment of the MPC over time and different Governors (AFINN Lexicon)
We finally investigate if there exists a linkage between the sentiment and the monetary policy
stance. Figure 11 reports the negative sentiment score on vertical axis and the policy rate levels
on horizontal axis. The kernel fit of the data shows that the negativity in the document
correlates with the distance away from the middle of the repo rate range: both low values
(below 7%) and high values (above 9%) of the policy rate correspond to periods of economic
stress for the country (too deflationary or inflationary environment). This appears somewhat
coherent with the IT framework and may justify to some extent the attitude for a less active
monetary policy and more stable policy rates.

20
Figure 11. Relation between sentiment and monetary policy
Overall, the NLP analysis on the monetary policy statements qualifies the findings of the
previous section: the accommodative stance by Governor Marcus and the increase in the
implicit inflation target during the crisis match with a communication placing more emphasis
on real growth concerns with a more negative sentiment. More recently, a tighter monetary
policy stance to lower the implicit inflation target matches with a more ‘forward-looking’
communication and a more neutral tone, aimed at driving inflation expectations
complementing somewhat the lower policy activism.
5. An assessment of the monetary policy credibility
Once examined the monetary policy stance and the communication strategy, we complete our
analysis focusing on the public perception about the monetary policy of the SARB, which
proxies its credibility. We first have a look at some descriptive statistics. Figure 12 illustrates
the distance between the realized inflation and the middle of the target band, giving an idea on
the ability of the SARB to achieve its goal, what contributes to build credibility. The red area
indicates periods when inflation was outside the band, while the green area indicates periods
when the target band was met. Two observations arise: first, inflation breached the band only
above the upper limit of 6% and never below the lower limit of 3%; second, after 2009
inflation target was met more than in the previous decade. Volatility of inflation and interest
rates may give an idea of economic and policy uncertainty. Figure 13 and 14 show respectively
the standard deviation of inflation (level and distance from the trend) and of interest rates
(policy and Sabor). Both statistics show a marked decrease after 2009, confirming that in the
last decade the economic variables under the control of the SARB have somewhat stabilised
compared with the decade before.

21
Figure 12. Gap between observed and middle of inflation target band (4,5%)
Figure 13. Volatility of inflation Figure 14. Volatility of interest rates
One of the criteria most utilised in the literature to assess the credibility of a central bank,
especially under an IT regime, is the extent at which it anchors expectations of the economic
agents. In this regard, the first measure we use is the reaction of market interest rates to the
monetary policy decisions. We regress the weekly changes in forward interest rates (9x12
months) on the changes in policy rates. If monetary policy is credible, its announcements
should surprise less the market, therefore forward rates should result less affected by monetary
policy decisions13 (Gurkanak et al., 2006; Trebeschi, 2015). We estimate the following
equation:
∆forwardt = 𝛼+𝛽∆it + ut (5)
where forwardt is 9x12-month forward rate agreements indicating market expectations of rate
on 3-month instruments in 9 months’ time, while it indicates the policy interest rate14. Table 5
reports the results for the whole period and the three subsamples for each Governor.
Monetary policy decisions are statistically significant in explaining the variations of forward
rates in the whole sample and in the two subsamples including the Governors Mboweni (2000-
13 We are aware of the fact that changes in market rates can be driven by many other variables (liquidity, term and risk premia, as well as macro-prudential policies). The use of high-frequency series (we use weekly series but we intend to repeat the exercise with daily ones) partially overcomes this issue. 14 If we consider the variations of the SABOR, results do not change.

22
09) and Marcus (2010-14), with a higher impact under the latter. On the contrary, under the
current mandate of Governor Kganyago (2015-18), monetary policy decisions do not
significantly affect forward rates, suggesting a higher anchorage of expectations. This happens
if we consider either all observations or only those ones in which the policy rate changed
(right-hand panel of Table 5). In this regard, we observe that during the first decade, under
Governor Mboweni, 30 changes of policy rates occurred, with an average variation in absolute
terms of 0.78 basis points. In the second decade, under Governors Marcus and Kganyago, only
12 changes occurred, equally distributed between the two Governors. The average size of each
variation decreased as well, with 0.46 under Marcus and only 0.29 under Kganyago, to confirm
the less degree of activism of monetary policy that we documented before.
Table 5. Forward rate responses to monetary policy decisions.
all weekly observations only weekly policy rate changes
period 2000-18 2000-09 2010-14 2015-18 2000-18 2000-09 2010-14 2015-18
c 0.00 0.00 0.00 0.00 0.00 -0.01 -0.21 0.08
(0.70) (0.59) (0.82) (0.72) (0.95) (0.91) (0.41) (0.62)
∆mp 0.18 0.15 0.85 -0.04 0.40 0.32 2.10 0.35
(0.00) (0.01) (0.00) (0.85) (0.00) (0.01) (0.02) (0.60)
R-sq 0.02 0.01 0.14 0.00 0.24 0.24 0.78 0.07
Akaike -0.22 0.13 -0.95 -0.77 1.67 1.55 1.87 1.02
Note: p-value in parentheses
A second measure useful to evaluate the credibility of the monetary policy is the estimate of
the responses of inflation expectations at various horizons h to the changes in actual inflation
over the same period (Cristadoro and Veronese, 2011). We estimate the following equation:
∆𝜋e.t+h+1𝑡+1 =𝛼+𝛽Δ𝜋𝑡+1+𝑢𝑡 (6)
in which ∆𝜋e,t+h+1 indicates the quarterly change in inflation expectations at yearly horizon h.
Table 6. Response of inflation expectations to inflation shock
horizon 1 year
2 years
5 years
period 2000-18 2000-09 2010-18 2000-18 2000-09 2010-18 2011-18
c 0.00 0.05 -0.05 0.00 0.05 -0.05 -0.01
(0.91) (0.56) (0.17) (0.93) (0.53) (0.14) (0.74)
∆π 0.32 0.37 0.12 0.14 0.17 0.01 0.04
(0.00) (0.00) (0.05) (0.00) (0.02) (0.88) (0.44)
R-sq 0.37 0.44 0.12 0.10 0.15 0.00 0.03
Akaike 1.09 1.53 -0.21 1.07 1.56 -0.22 -0.75
Note: p-value in parentheses
Results from the regressions, reported in Table 6, show that changes in current inflation
transmit to expectations over 1 and 2 years at a decreasing rate, while they do not transmit at 5
years horizon. Splitting the sample at 1 and 2 years horizons in two sub-samples before and

23
after the crisis (we do not have data for the first sub-sample at 5 years horizon), we notice that
the response is clearly stronger in the first sub-sample (2000-2009) than in second one (2010-
2018), where it becomes even not significant at 2 and 5 year horizons. This confirms that the
SARB succeeded in anchoring inflation expectations in the last decade.
A third measure we use to assess the credibility of the SARB is the dispersion of inflation
forecasts15. The lower the dispersion, the higher the credibility (Kabundi and Mlachila, 2018;
Miyajima and Yetman, 2018; Dovern et al., 2012). The SARB collects inflation expectations
from three different categories of forecasters: financial analysts, business representatives and
trade unions. Figure 15 reports the standard deviation of the forecasts by the different
categories at various forecasting horizons. After 2009 the dispersion clearly decreases at all
horizons showing a declining trend. This confirms the previous findings: the SARB better
anchored inflation expectations in the last decade16.
Figure 15. Standard deviation of inflation forecasters at different horizons
To get a further confirmation of the above evidence, we finally estimate inflation expectations
as a weighted average of lagged inflation and the inflation target (Stock and Watson, 2007):
𝜋e𝑡 =𝛼𝜋𝑡-1+(1- 𝛼)𝜋* + 𝑢𝑡 (7)
where ut is an iid error term with zero mean and constant variance. The first variable represents
a backward looking and the second one a forward-looking component. Like Kabundi and
Mlachila (2018), we use 2-years ahead inflation expectations, but the results are qualitatively the
same for the 1-year horizon. 15 Many reasons explain the dispersion of forecasts: Carroll (2003) models that information from mass media diffuses slowly through the economy, encountering people on a probabilistic basis. Mankiw et al. (2003) explain disagreement about expected inflation through a sticky-information model: agents only periodically update inflation expectations because information is costly to collect. 16 According to Miyajima and Yetman (2018), expectations by analysts are better anchored than those of businessmen and trade unions. The authors explain this result because the last two categories of economic agents are more involved in the wage and price formation process.

24
Table 8 shows that expectations are stickier to target than to lagged inflation, the more after
2009, when the significance of lagged inflation decreases from 99% to 95%. This is true if we
assign the inflation target both the levels of 6% and 4.5%.
Table 8. Determinants of inflation expectations
Tgt=6% until 2009 post 2009 Tgt=4.5% until 2009 post 2009
Lagged Inflation 0.21 0.08 Lagged Inflation 0.21 0.08
(0.00) (0.04) (0.00) (0.04)
Target 0.79 0.95 Target 1.06 1.27
(0.00) (0.00) (0.00) (0.00)
AR(1) 0.81 0.92 AR(1) 0.81 0.92
(0.00) (0.00) (0.00) (0.00)
R squared 0.83 0.71 R squared 0.83 0.71
Akaike 1.60 -0.96 Akaike 1.60 -0.96
Note: p-value in parentheses
6. Concluding remarks
The paper investigates the monetary policy of the South African Reserve Bank, considered one
of the institutional strengths of South Africa, both for its independence and its high-standing
reputation. The estimation of a Taylor-rule embedding specific cases, in particular time-varying
implicit inflation target and real neutral interest rate, indicates that the stance became
accommodative after the outbreak of the GFC in 2009, with a tendency of the implicit
inflation target to increase. In 2015, with the appointment of Governor Kganyago, the stance
turned tighter to bring down the implicit inflation target, which in fact started decreasing, and
the monetary policy became less active in terms of changes of the policy rate, in line with the
additional mandate for the SARB to be custodian of financial stability. A machine learning
analysis using Natural Language Processing techniques on the monetary policy statements
shows that the SARB communication complemented at some extent the decreasing activism of
monetary policy rates, by increasing its ‘forward-looking’ nature over years and gradually
improving the sentiment after the GFC. Too high or too low policy rates associate to greater
uncertainty and economic stress. Finally, the response of market interest rates and inflation
expectations show that the monetary policy became more credible over years, better anchoring
inflation expectations of different categories of forecasters, especially in the latest years.
Overall, the analysis justifies the high reputation of the SARB in keeping inflation under
control and in containing excessive fluctuations of financial variables. It might be interesting to
compare the three aspects of monetary policy here investigated – stance, communication and
credibility – with those of other central banks around the world, particularly in countries with
similar economic or financial features. This is left to future agenda.

25
References
Aron J., Muellbauer J. (2002). Estimating monetary policy rules for South Africa, Central
Banking, Analysis, and Economic Policies Book Series, 4, 427-476.
Aron J., Muellbauer J. (2007). Review of Monetary Policy in South Africa, Journal of African
Economies, 16, 5, 705–744.
Awazu Pereira L., Agénor P.R. (2013). Inflation Targeting and Financial Stability: A
Perspective from the Developing World, Central Bank Working Paper, 324.
Blei D., Ng A., Jordan M. (2003). Latent dirichlet allocation, Journal of machine Learning research,
3, 993-1022.
Calvo G., Reinhart C. (2002). Fear of floating, Quarterly Journal of Economics, 117, 2, 379-408.
Carroll D. (2003). Macroeconomic Expectations of Households and Professional Forecasters,
Quarterly Journal of Economics, 118, 1, 269-298.
Clarida R., Gali J., Gertler M. (1999). The Science of Monetary Policy: A New Keynesian
Perspective, Journal of Economic Literature, 37, 1661-1707.
Corbo V., Schmidt-Hebbel K. (2001). Inflation Targeting in Latin America, Working Paper
Central Bank of Chile, 105.
Cristadoro R., Veronese G. (2011). Monetary policy in India: is something amiss? Indian Growth
and Development Review, 4, 2, 166–192.
De Jager S. (2012). Modelling South Africa’s equilibrium real effective exchange rate: A VECM
approach, SARB Working Paper 12/02.
Demertzis M., Marcellino M., Viegi N. (2012). A credibility proxy: Tracking US monetary
developments, The BE Journal of Macroeconomics, 12, 1.
Dincer N., Eichengreen B. (2014). Central Bank Transparency and Independence: Updates
and New Measure, International Journal of Central Banking, 10, 1, 189–259.
Dovern J., Fritsche U., Slacalek J. (2012). Disagreement Among Forecasters in G7 Countries,
The Review of Economics and Statistics, 94, 4, 1081–96.
Ellyne M., Veller C. (2011). What is the SARB's inflation targeting policy, and is it appropriate?
MPRA Paper, 42134, http://mpra.ub.uni-muenchen.de/42134.
Fedderke J.W., Mengisteab D.K. (2017). Estimating South Africa's output gap and potential
growth rate, South African Journal of Economics, 85, 2, 161-177.
Gurkaynak R., Levin A., Marder A., Swanson E. (2006). Inflation Targeting and the Anchoring
of Inflation Expectations in the Western Hemisphere, Central Bank of Chile WP, 400.

26
Kabundi A., Schaling E., Some M. (2015). Monetary policy and heterogeneous inflation
expectations in South Africa, Economic Modelling, 45, 109-117.
Kabundi A., Mlachila M. (2018). The role of monetary policy credibility in explaining the
decline in exchange rate pass-through in South Africa, Economic Modelling, November.
Klein N. (2012). Estimating the Implicit Inflation Target of the South African Reserve Bank,
IMF Working Papers 77.
Kuhn L., Ruch F., Steinbach R. (2018). Reaching for the (r)-stars: estimating South Africa’s
neutral real interest rate, Working Paper.
Laubach T., Williams J. (2003). Measuring the Natural Rate of Interest, The Review of Economics
and Statistics, 85, 4, 1063-70.
Liu B., Wang S., Zhang L. (2018). Deep Learning for Sentiment Analysis: A Survey, Wiley
Interdisciplinary Reviews-Data Mining and Knowledge Discovery, 8, 4.
Mankiw G., Reis R., Wolfers J. (2003). Disagreement about Inflation Expectations, in NBER
Macroeconomics Annual 2003, 18, 209-270.
Miyajima K., Yetman J. (2018). Inflation Expectations Anchoring Across Different Types of
Agents: the Case of South Africa, IMF Working Papers 177.
Nielsen F. A. (2011). A new {ANEW}: evaluation of a word list for sentiment analysis in
microblogs, in Proceedings of the ESWC2011 Workshop on Making Sense of Microposts,
CEUR Workshop Proceedings
Ortiz A., Sturzenegger F. (2007). Estimating SARB's policy reaction rule, South African Journal of
Economics, 75, 4, 659-680.
Reid M., Du Plessis S. (2010). Loud and clear? Can we hear when the SARB speaks? South
African Journal of Economics, 78, 3, 269-286.
Reid M., Du Plessis S. (2011). Talking to the inattentive Public: How the media translates the
Reserve Bank’s communications, Department of Economics and the Bureau for Economic Research at
the University of Stellenbosch.
Stock J., Watson M. (2007). Why has U.S. Inflation Become Harder to Forecast? Journal of
Money Credit and Banking, 39, 3–33.
Trebeschi G. (2015). Inflation targeting in Brazil: did the central bank fall behind the curve?
Working Paper Banca d’Italia.
Viegi, N. (2015). Labour market and monetary policy in South Africa, South African Reserve
Bank Working Paper 15/01.

27
Appendix 1. Data and robustness checks
The quarterly data used in the regressions are the following:
- Interest rate: series of SABOR collected by the SARB
- Inflation expectations: series of 1 year ahead from BER survey collected by the SARB
- Output gap: series estimated by the SARB (probably through HP filter)
- Real effective exchange rate gap: series estimated by the SARB, as described in the text
- Neutral real interest rate: series estimated by the SARB, as described in the text
Fig. A1. Policy and Sabor rate Fig. A2. Inflation and 1y ahead expectations
Fig. A3. Output gap (SARB and hp filter) Fig. A4. Real effective exchange rate
Fig. A5. Neutral real interest rate
To test for the robustness of the results, we repeated the regression replacing the data above
with the following:
- Interest rate (Fig. A1): we used policy rates and results do not change qualitatively

28
- Inflation expectations (Fig. A2): we used effective inflation (according to the hypothesis
that effective inflation is the inflation expected the next period) and an inflation forecast
series estimated regressing the actual inflation on 2 own lags. Main results do not change
- Output gap (Fig. A3): we estimated ourselves a series by applying a HP filter to current
output to derive the potential one. Main results do not change
- Real effective exchange rate gap (Fig. A4): we used a past 20 years average for the
equilibrium real exchange rate. Main results do not change
- Neutral real interest rate (Fig. A5): we tried an alternative series estimated by Kuhn Ruch
and Steinbach (2018), based on potential growth and related factors a-la Laubach and
Williams (2003) plus US information in the foreign sector. Results change somehow: the
NRIR is not significant in the whole sample but only in the second sub-sample. We get an
implicit inflation target more similar to the case with constant neutral interest rate.
Appendix 2. Taylor rule estimation with financial variables
Fig. A6. Credit/gdp ratio and gap Fig. A7. Financial stress indicator
Fig. A8. Capital inflows (R million) Fig. A9. Government debt/GDP ratio
In order to assess the role of the new mandate of financial stability, we added the following
financial variables to the Taylor rule to see if and how the results changed:
- Credit/gdp ratio and gap (Fig. A6)
- Financial stress index for households (Fig. A7), given by a combination of house prices,
annualised GDP, inflation rate, average household interest rates, unemployment rate

29
- Stock of inwards foreign portfolio and direct investiment (in logs) and of net purchases of
shares and bonds by non-residents on the Johannesburg Stock Exchange (Fig. A8)
- Government debt/gdp and foreign debt/gdp ratios (Fig. A9)
Table 1A shows that in the second sub-sample after the GFC, opposite to the first one,
financial variables are mostly significant and with positive sign: an increase induces the SARB
to raise interest rates to prevent the risk of financial bubbles. Asset purchases by non-residents
become significant with a negative sign: the interpretation is that they appreciate the exchange
rate which in turn lowers the inflation risk and induces a decrease of interest rates.
Table 1A. Estimation of the SARB reaction function with financial variables
Variable 2000-08 2010-18 2000-08 2010-18 2000-08 2010-18 2000-08 2010-18
constant
6.35
(0.00)
-8.06
(0.00)
7.97
(0.00)
-7.95
(0.07)
9.08
(0.00)
-5.09
(0.07)
7.13
(0.00)
-3.30
(0.15)
interest rate(-1)
0.87
(0.00)
0.82
(0.00)
0.98
(0.00)
1.00
(0.00)
0.98
(0.00)
1.20
(0.00)
0.98
(0.00)
0.97
(0.00)
interest rate(-2)
-0.26
(0.02)
-0.09
(0.47)
-0.27
(0.05)
-0.15
(0.37)
-0.28
(0.01)
-0.70
(0.00)
-0.29
(0.01)
-0.13
(0.43)
inflation expectations
0.40
(0.00)
0.12
(0.27)
0.56
(0.00)
0.31
(0.04)
0.55
(0.00)
0.20
(0.19)
0.56
(0.00)
0.31
(0.04)
output gap
0.70
(0.00)
0.16
(0.15)
0.81
(0.00)
-0.07
(0.53)
0.58
(0.04)
0.04
(0.77)
0.76
(0.00)
-0.07
(0.53)
credit/gdp
-0.09
(0.00)
0.08
(0.01)
-0.11
(0.01)
0.03
(0.35)
-0.12
(0.00)
0.12
(0.03)
-0.09
(0.00)
0.04
(0.29)
fin stress index
0.17
(0.02)
0.36
(0.00)
capital inflows
0.01
(0.92)
0.42
(0.00)
non-resident purchases
0.45
(0.24)
-0.31
(0.03)
gov debt/gdp
0.01
(0.63)
0.02
(0.00)
R-squared 0.97 0.97 0.97 0.96 0.96 0.96 0.96 0.96
Akaike info criterion 0.86 -0.98 1.08 -0.42 1.09 -0.62 1.09 -0.62
Note: p-value in parentheses
Appendix 3. Latent Dirichlet Allocation
The basic parameters of the LDA model are the following:
α - prior distribution of topics over documents
β - prior distribution of words over topics
N - set of words in the corpus
M - set of documents in the corpus
θ - the estimated probability that a document is comprised of a certain topic (posterior
distribution of topics over documents)

30
z - the estimated probability that a word occurs, or describes, a topic (posterior distribution of
words over topics)
Fig. A10. Plate notation of LDA.
Note: Boxes are "plates" or domains, where the outer box represents the document domain, and the inner box represents the word domain, together they form the corpus.
Figure A10 shows the plate notation of LDA, which shows the different domains of the
model. The word domain contains the total number of words used in the corpus, and the
document domain contains the total number of documents from the corpus. Within each plate
is the related parameter describing the model. The parameters outside of the plates are called
the Dirichlet priors. α is the parameter representing the prior expectation of the topic per
document distribution, and β is the prior expectation of the words per topic distribution. θ is
the topic distribution per document M, and z denotes the word allocation to each topic.
The model parameters are calculated backward in three steps, starting from the documents
level to identify the topics that might describe the corpus. The model starts by randomly
assigning each word in each document to one of the K topics. Thereafter, for each document,
we first assume that all topic assignments except for the current one is correct. We then
calculate two proportions: topict = P(topict /documentd) is the proportion of words in document d
that are currently assigned to topic t and wordw = P(wordw / topict) is the probability of word w
occurring describing topic t in document d. After that, we multiply the two proportions and
assign w a new topic based on the calculated probability P(topict /documentd) * P(wordw / topict),
that is the probability that topic t generated word w in document d. Finally, we update the
words generated by the documents in the generative model, where we eventually reach a steady
state where the word assignments make sense.
In summary, there are two plates, or domains, that contain the words and the document
dimensions of the corpus. Within each plate is an allocation to the topic domain through
estimated parameters or the posterior distributions. These distributions are the explanatory
components that give us insight into the underlying semantic structure of the corpus. In our
analysis, we use the more conventional terms for the posterior distributions: the β distribution
is the word-topic distribution, and the γ distribution is the topic-document distribution.
Related Documents


